 Ann Bucklin1*
 Paola G. Batta-Lona1
 Jennifer M. Questel2
 Peter H. Wiebe3David E. Richardson4Nancy J. Copley3
 Todd D. O’Brien5
- 1Department of Marine Sciences, University of Connecticut, Groton, CT, United States
- 2College of Fisheries and Ocean Sciences, University of Alaska, Fairbanks, AK, United States
- 3Department of Biology, Woods Hole Oceanographic Institution, Woods Hole, MA, United States
- 4National Oceanic and Atmospheric Association (NOAA) Northeast Fisheries Science Center, Narragansett, RI, United States
- 5National Oceanic and Atmospheric Association (NOAA) Fisheries, Office of Science and Technology Science Center, Silver Spring, MD, United States
Marine zooplankton are rapid-responders and useful indicators of environmental variability and climate change impacts on pelagic ecosystems on time scales ranging from seasons to years to decades. The systematic complexity and taxonomic diversity of the zooplankton assemblage has presented significant challenges for routine morphological (microscopic) identification of species in samples collected during ecosystem monitoring and fisheries management surveys. Metabarcoding using the mitochondrial Cytochrome Oxidase I (COI) gene region has shown promise for detecting and identifying species of some – but not all – taxonomic groups in samples of marine zooplankton. This study examined species diversity of zooplankton on the Northwest Atlantic Continental Shelf using 27 samples collected in 2002-2012 from the Gulf of Maine, Georges Bank, and Mid-Atlantic Bight during Ecosystem Monitoring (EcoMon) Surveys by the NOAA NMFS Northeast Fisheries Science Center. COI metabarcodes were identified using the MetaZooGene Barcode Atlas and Database (https://metazoogene.org/MZGdb) specific to the North Atlantic Ocean. A total of 181 species across 23 taxonomic groups were detected, including a number of sibling and cryptic species that were not discriminated by morphological taxonomic analysis of EcoMon samples. In all, 67 species of 15 taxonomic groups had ≥ 50 COI sequences; 23 species had >1,000 COI sequences. Comparative analysis of molecular and morphological data showed significant correlations between COI sequence numbers and microscopic counts for 5 of 6 taxonomic groups and for 5 of 7 species with >1,000 COI sequences for which both types of data were available. Multivariate statistical analysis showed clustering of samples within each region based on both COI sequence numbers and EcoMon counts, although differences among the three regions were not statistically significant. The results demonstrate the power and potential of COI metabarcoding for identification of species of metazoan zooplankton in the context of ecosystem monitoring.
Introduction
Metabarcoding of Zooplankton Diversity
Patterns of species diversity of the many taxonomic groups of marine zooplankton are key characteristics of ocean ecosystems, determining their function, sustainability, and responses to environmental variation and anthropogenic impacts, including climate change (Sherman et al., 2002; Friedland et al., 2020). Pelagic ecosystems of the NW Atlantic Ocean have been monitored and studied over many decades, providing an invaluable time-series record of zooplankton diversity and abundance (Wiebe et al., 2012; O’Brien et al., 2013).
DNA metabarcoding of zooplankton samples has been used in association with ecosystem monitoring and management in recent years (Mohrbeck et al., 2015; Deagle et al., 2017; Djurhuus et al., 2018; Blanco-Bercial, 2020; Matthews et al., 2021). These efforts have used different molecular protocols and bioinformatics pipelines (Bucklin et al., 2021a). A subset of the studies have focused on discrimination and identification of species diversity across the zooplankton assemblage based on metabarcoding analysis using portions of the mitochondrial cytochrome oxidase I (COI) gene (reviewed by Bucklin et al., 2021b), which has been widely used to identify species of marine organisms (Bucklin et al., 2011).
The potential of COI metabarcoding has been examined from many perspectives, including accuracy of species-level resolution of biodiversity (Brown et al., 2015; Leray and Knowlton, 2017; Schroeder et al., 2021), availability of reference sequence databases resulting from DNA barcoding efforts (Andújar et al., 2018; Porter and Hajibabaei, 2018; Bucklin et al., 2021b; Singh et al., 2021), and prospects for quantitative analysis related to species abundance and/or biomass (Lamb et al., 2018; Matthews et al., 2021). Challenges and disadvantages of COI as a metabarcode include lack of universal primers and missing groups due to primer-mismatch (Deagle et al., 2014; Clarke et al., 2017; Hajibabaei et al., 2019). A number of studies have evaluated the results using COI metabarcodes based on parallel analysis using multiple metabarcode gene regions, including hypervariable regions of 18S rRNA (Djurhuus et al., 2018; Steffani et al., 2018; Giebner et al., 2020; Pitz et al., 2020; Brandão et al., 2021; Pappalardo et al., 2021; Questel et al., 2021; Zhao et al., 2021).
An important consideration for species identification based on COI metabarcoding is the availability of COI barcode sequences for identified specimens (Andújar et al., 2018; Porter and Hajibabaei, 2018; Steinke et al., 2021). The goal of taxonomically-complete COI reference databases for marine zooplankton, with search capacities for targeted taxonomic groups and geographic regions (Bucklin et al., 2021b), is a priority for an international collaborative effort sponsored by the Scientific Committee for Oceanic Research (SCOR), MetaZooGene (WG157; see https://metazoogene.org/).
There is broad interest and considerable enthusiasm for potential applications of metabarcoding for ecosystem assessment and fisheries management (Bourlat et al., 2013; Ji et al., 2013; Kelly et al., 2014; Kelly, 2016; Goodwin et al., 2017; Aylagas et al., 2018). A particular focus is the importance of rapid, accurate, and reliable species-level characterization of time-space variability of the taxonomically-complex pelagic assemblage (Andújar et al., 2018).
Monitoring the NW Atlantic Continental Shelf
Time-series monitoring of the NW Atlantic continental shelf was established by the Northeast Fisheries Science Center (NEFSC) of the National Marine Fisheries Service (NMFS) in 1977 and continues into the present (Cox and Wiebe, 1979; Hare and Kane, 2012). Surveys are scheduled to sample six times each year throughout four regions (Figure 1), with collection of environmental (hydrographic) data and samples at a stratified-random selection of standard station locations (see https://www.fisheries.noaa.gov/new-england-mid-atlantic/ecosystems/monitoring-ecosystem-northeast). Morphological microscopic examination of zooplankton samples from NEFSC surveys has allowed analysis and interpretation of temporal and spatial patterns of variability across the region (Kane, 2007; Kane, 2011; O’Brien et al., 2013). The time-series records have provided clear evidence that the region is experiencing rapid climate change (O’Brien et al., 2013; Friedland et al., 2020). Regime shifts (i.e., persistent changes in the structure and function of ecosystems) have been documented during the 1990s and 2000s in pelagic community structure (Pershing et al., 2005; Walsh et al., 2015; Morse et al., 2017), including zooplankton diversity (Head and Sameoto, 2007; Record et al., 2010; Johnson et al., 2011; Bi et al., 2014). NEFSC time-series records revealed a marked increase in zooplankton displacement volume on Georges Bank (GB) and the Gulf of Maine (GoM) in ~1990 (O’Brien et al., 2013; Figure 2). Another regime shift was evident in ~2000, when the earlier changes were partially reversed. In the Gulf of Maine (GoM), zooplankton diversity increased markedly during the early 1990s and decreased rapidly about 2000 (Record et al., 2010; Johnson et al., 2011).
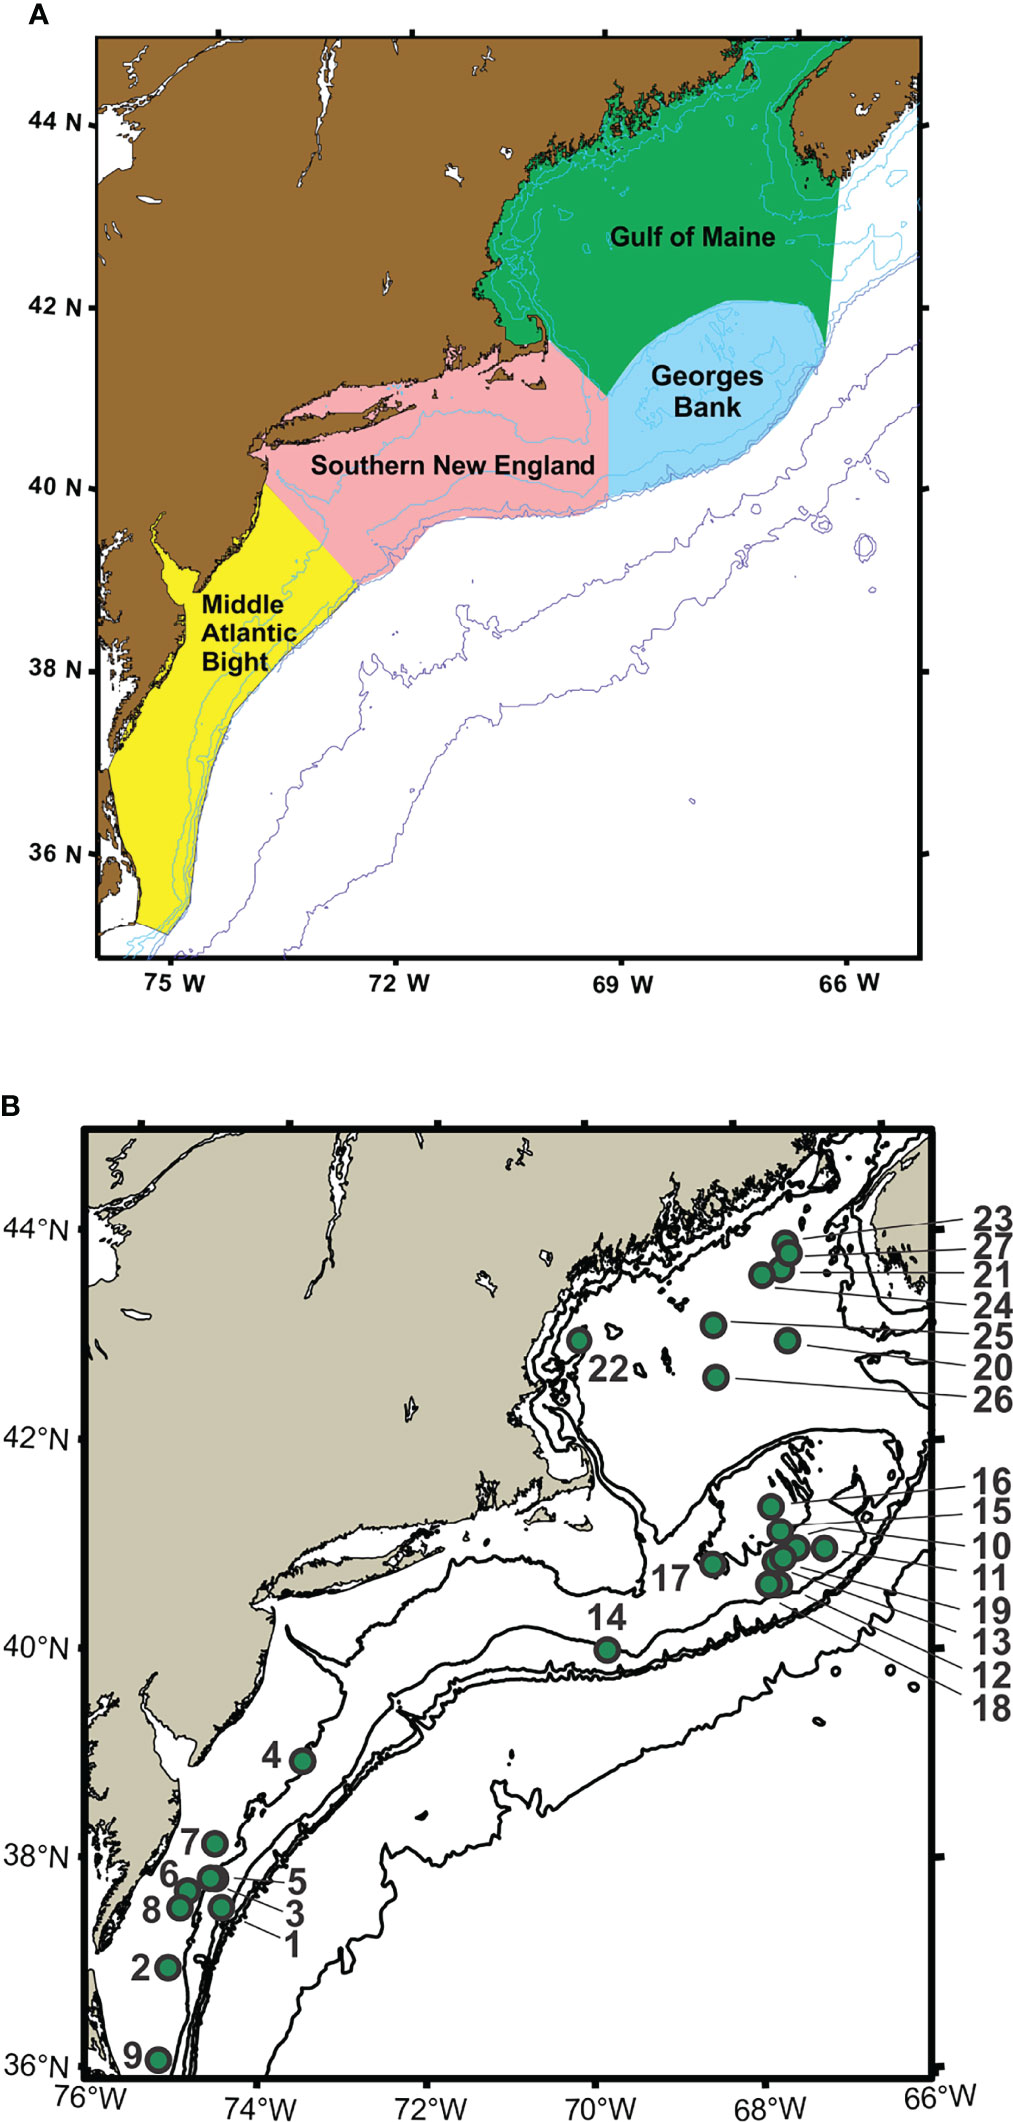
Figure 1 Maps showing regions (A) and sample collection locations (B) for Northeast Fisheries Science Center (NEFSC) Ecosystem Monitoring Surveys (EcoMon). Stations are identified by number (see Table 1). Modified from Bucklin et al. (2019).
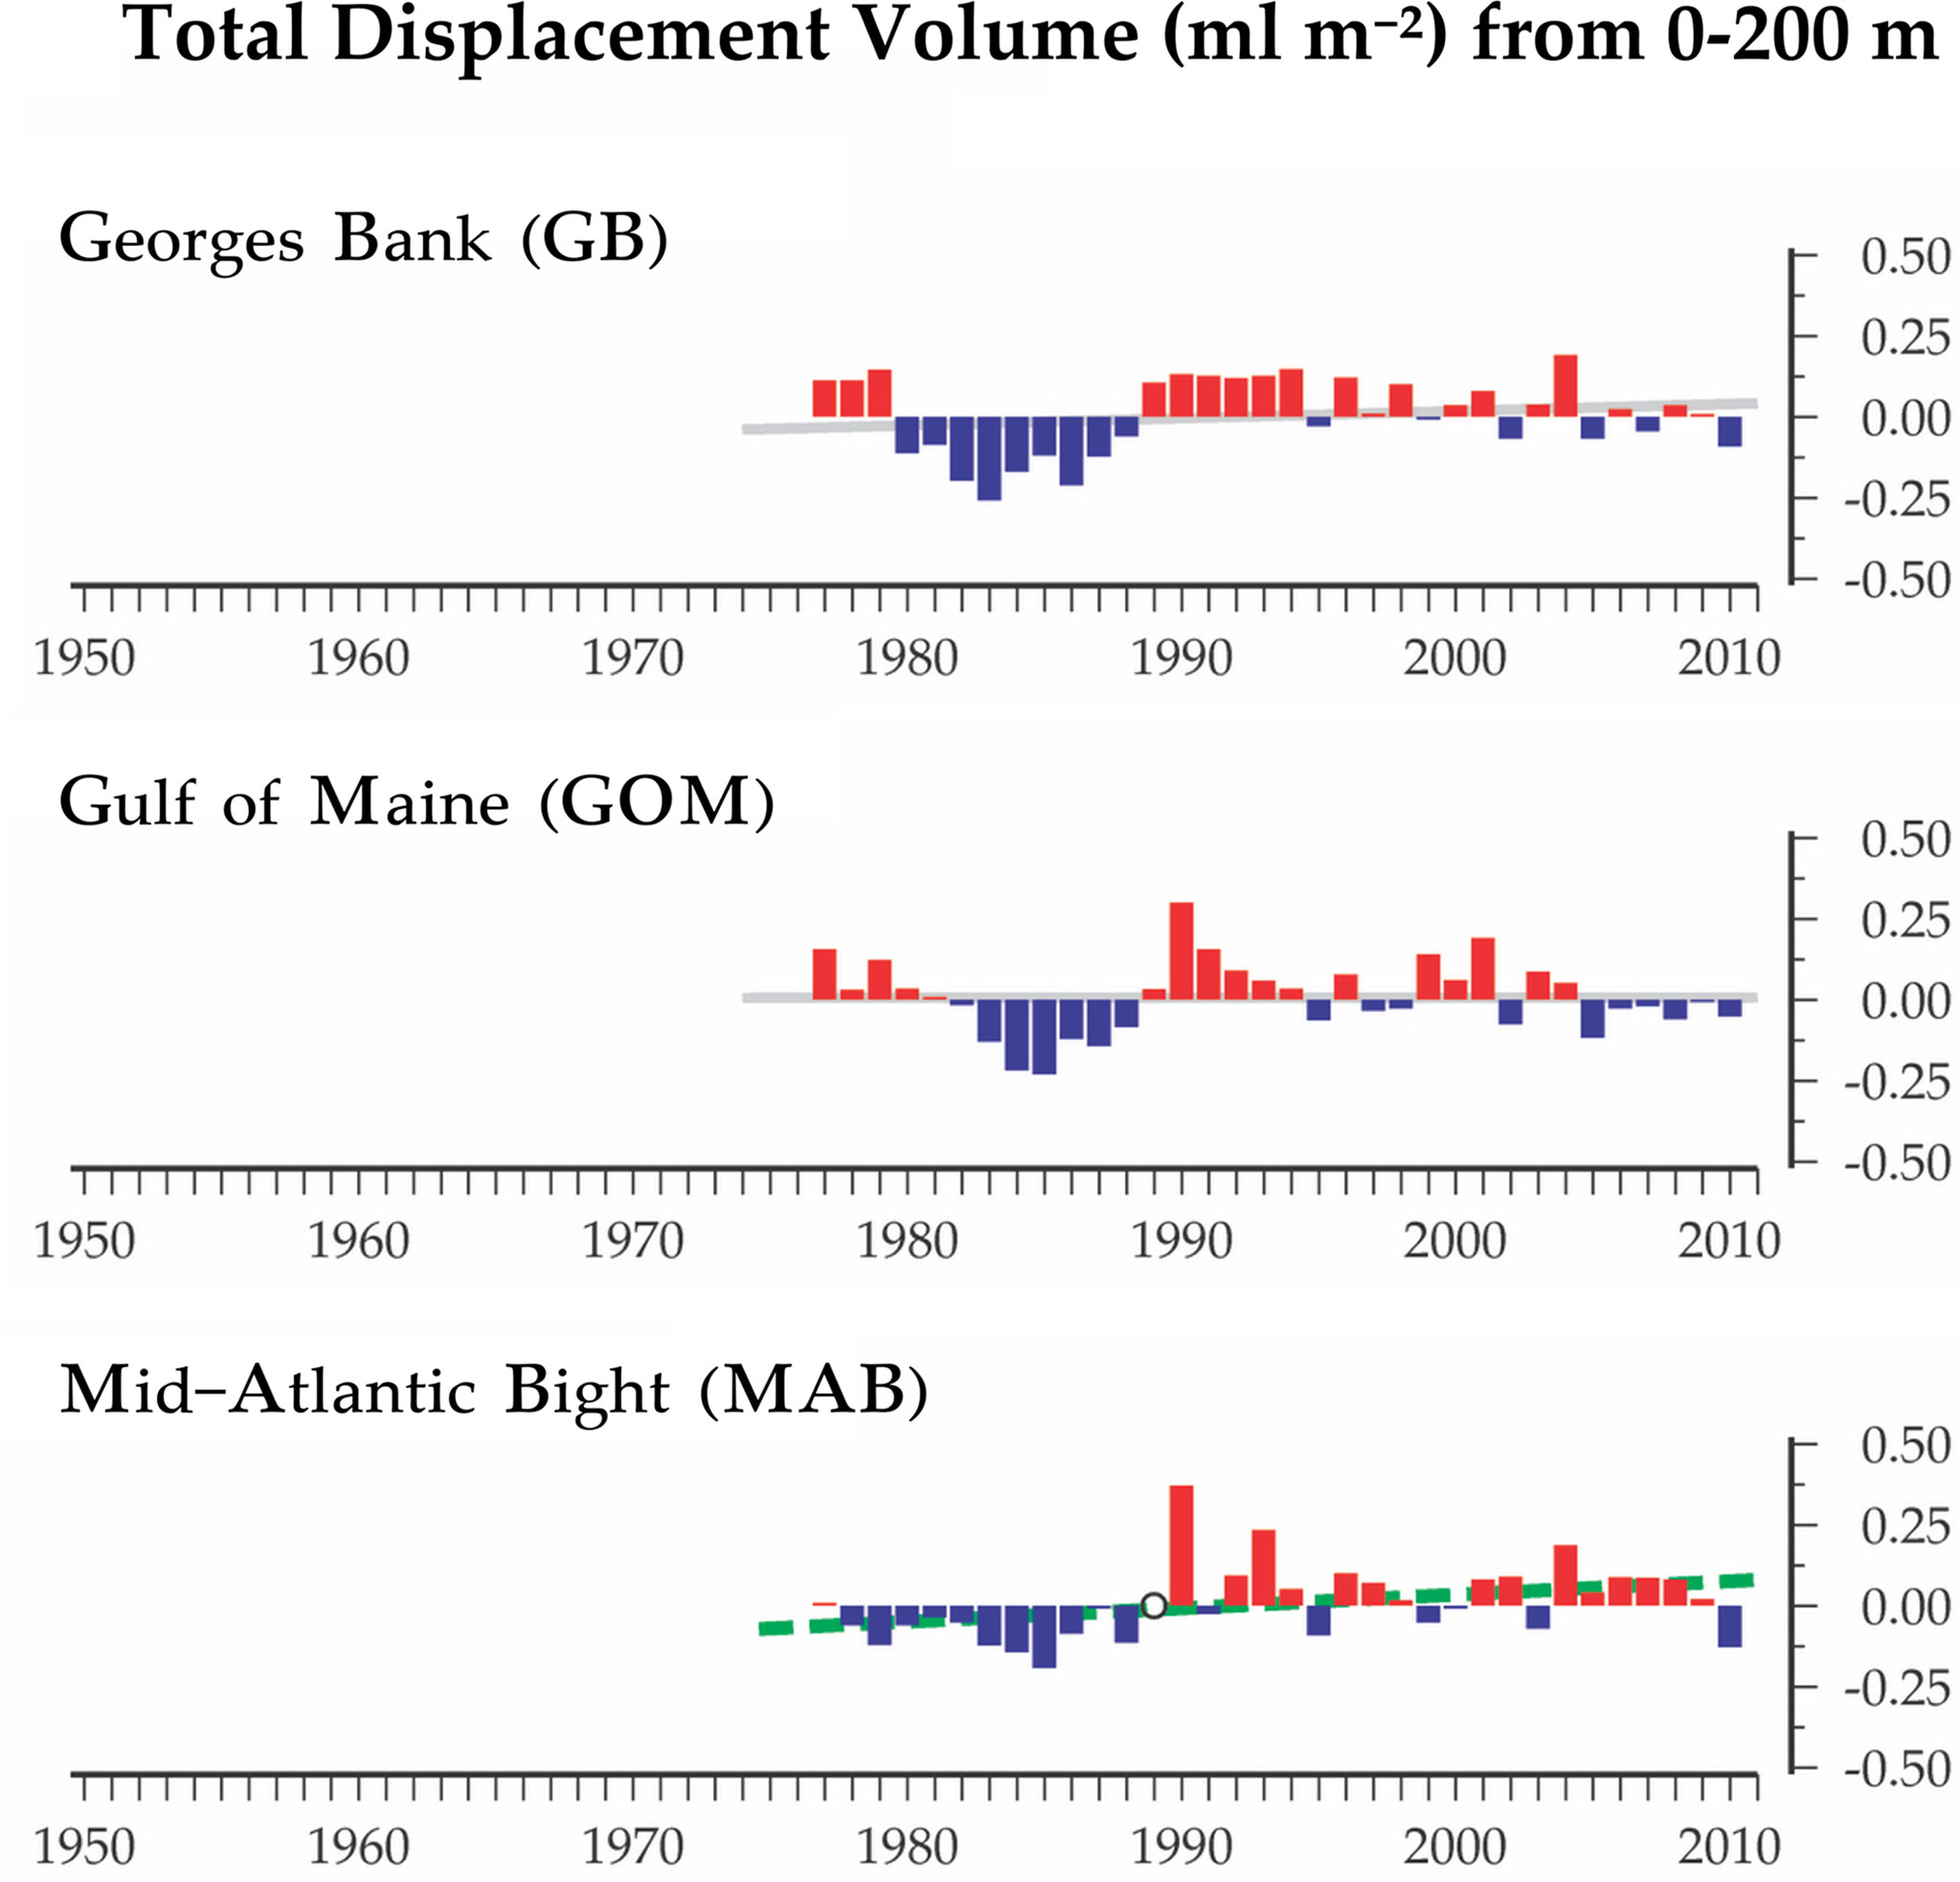
Figure 2 Time-series data for total displacement volume of zooplankton from EcoMon regions: Mid-Atlantic Bight (MAB), Georges Bank (GB), and Gulf of Maine (GoM). Graphs show anomalies based on average values from 1977 to 2010. Positive anomalies are red; negative anomalies are blue. The lines represent the linear regression of the annual anomalies versus year; colors of the lines indicate the statistical significance of the relationship: dashed green (p < 0.05); grey (non-significant). Figure modified from O’Brien et al. (2013).
Monitoring efforts in North Atlantic pelagic ecosystems (Wiebe et al., 2012; O’Brien et al., 2013) have provided an essential foundation for recognizing and understanding regime shifts (Borja, 2014; Conversi et al., 2015; Morse et al., 2017; Stern et al., 2018). Regular, standardized, and sustained analysis of zooplankton diversity and abundance based on morphological microscopic examination of zooplankton samples has also provided opportunities for evaluating the accuracy, reliability, and power of rapidly-developing approaches to molecular analysis of zooplankton biodiversity, including DNA metabarcoding (Bucklin et al., 2016; Bucklin et al., 2019).
Integrative Morphological – Molecular Analysis of Zooplankton Diversity
The EcoMon zooplankton database includes records from morphological (microscopic) taxonomic counts reported as numbers per 10m2 for zooplankton taxa, which are identified to species when possible (Kane, 2007; Kane, 2011). A total of 186 zooplankton species of 14 taxonomic groups of metazoan zooplankton have been detected in net samples collected during surveys of the NW Atlantic continental shelf since 1977; of these, 43 species of 9 taxonomic groups have been recorded at >1% frequency of occurrence among all samples (David Richardson, pers. comm.). An additional 237 taxa, including groups of congeneric species, genera, and higher taxonomic groups, are are listed in the EcoMon database, https://www.ncei.noaa.gov/archive/accession/0187513; accessed May 23, 2021 (NMFS/NEFSC, 2019).
Molecular analysis of EcoMon samples has been carried out since 2000, first in partnership with the international project, ZooGene (http://www.zoogene.org/), and from 2004 to 2010 with the Census of Marine Zooplankton (CMarZ; http://www.cmarz.org/), an ocean realm field project of the Census of Marine Life (CoML; Bucklin et al., 2010). The partnership, with collection and preservation of samples for molecular analysis, continues today in association with another international program, MetaZooGene (https://metazoogene.org/) Working Group 157 of the Scientific Committee for Oceanic Research (SCOR).
Bucklin et al. (2019) analyzed 27 EcoMon samples collected from 2002 – 2012 using DNA metabarcoding of the V9 hypervariable region of 18S rRNA, with sequences classified into 28 taxonomic groups of zooplankton. The conserved nature of the 18S rRNA gene allows detection of taxa across the spectrum of marine zooplankton, but does not accurately resolve or identify species (Blanco-Bercial, 2020; Govindarajan et al., 2021; Questel et al., 2021). Bucklin et al. (2019) reported significant positive correlations between V9 18S rRNA sequence numbers and microscopic counts for 7 taxonomic groups for which both types of data were available, with significant regressions for three groups: Calanoida, Gastropoda, and Chaetognatha. These results provided promising evidence that DNA metabarcoding using V9 18S rRNA can provide accurate classification and relative quantification for targeted zooplankton groups, which are important goals for applications for ecosystem monitoring (Lamb et al., 2018; Matthews et al., 2021).
Materials and Methods
Collection and Selection of Samples for Analysis
Zooplankton samples for this study were collected by the NOAA Northeast Fisheries Science Center (NEFSC) Oceans and Climate Branch during surveys by the Ecosystem Monitoring Program (EcoMon) of the NW Atlantic continental shelf (Kane, 2007; Kane, 2011; Hare and Kane, 2012; Bucklin et al., 2019). Surveys are designed to sample four regions of the shelf ecosystem (Figure 1). Samples for morphological taxonomic analysis were collected following a standard protocol (Richardson et al., 2010), with both day and night sampling using a 61-cm bongo net fitted with a 333-μm mesh net; oblique tows were a minimum of 5-min in duration and sampled from the surface to within 5 m of the seabed or to a maximum depth of 200 m. A mechanical flowmeter was fitted in the mouth of each net to record the volume sampled. Samples were preserved in 5% formalin and archived at the NEFSC.
Zooplankton samples for genetic analysis were collected during EcoMon survey cruises at 5 randomly-selected locations in each region. Sampling was done using a 20-cm bongo net with 165-μm mesh nets, which was attached to the same cable and deployed with the 61-cm bongo nets. Differences in the opening diameter and mesh size of the nets used for collection of samples for genetic analysis may have resulted in differences between the sets of samples, but the methods were unchanged across all years, regions, and stations, and the resulting time-series patterns of variability were evaluated with this caveat. Samples were preserved immediately in 95% undenatured ethanol, which was changed 24 hr after collection. Samples were transported to and archived at the University of Connecticut, with long-term storage in walk-in freezers (-20°C)
Morphological Taxonomic Analysis
Sample sorting and identification was done at the Morski Instytut Rybacki Plankton Sorting and Identification Center (Szczecin, Poland). Zooplankton samples were split to an aliquot containing approximately 500 specimens; individuals were sorted, counted, and identified to the lowest possible taxon (Kane, 2007; Kane, 2011). Data recorded include abundance measured by area (conc/10m2) and volume (conc/100m3) for selected taxononomic groups and species of zooplankton, including fish larvae. The morphological species count data were downloaded from: https://www.ncei.noaa.gov/archive/accession/0187513, accessed May 23, 2021 (NMFS/NEFSC, 2019).
Metabarcoding Analysis
A total of 27 samples was selected for metabarcoding analysis, including one sample collected in each of three regions, Georges Bank (GB), Gulf of Maine (GoM), and Mid-Atlantic Bight (MAB), during May/June of 2002 – 2012 (Figure 1; Table 1). The samples are the same ones analyzed by metabarcoding using the V9 hypervariable region of 18S rRNA by Bucklin et al. (2019). There were a number of sampling gaps due to cancelled cruises, bad weather, and other causes: no samples were analyzed for MAB in 2003 or GoM in 2006; no samples were analysed for 2008; and only a single GB sample was analysed for 2012; COI metabarcoding data are missing for DE1105-25; EcoMon count data are missing for DE0305-38 and DE1105-127 (Table 1). The collection site of one sample (AL0605-53 #13) is correctly shown on GB, although was listed within the EcoMon region of Southern New England (SNE).
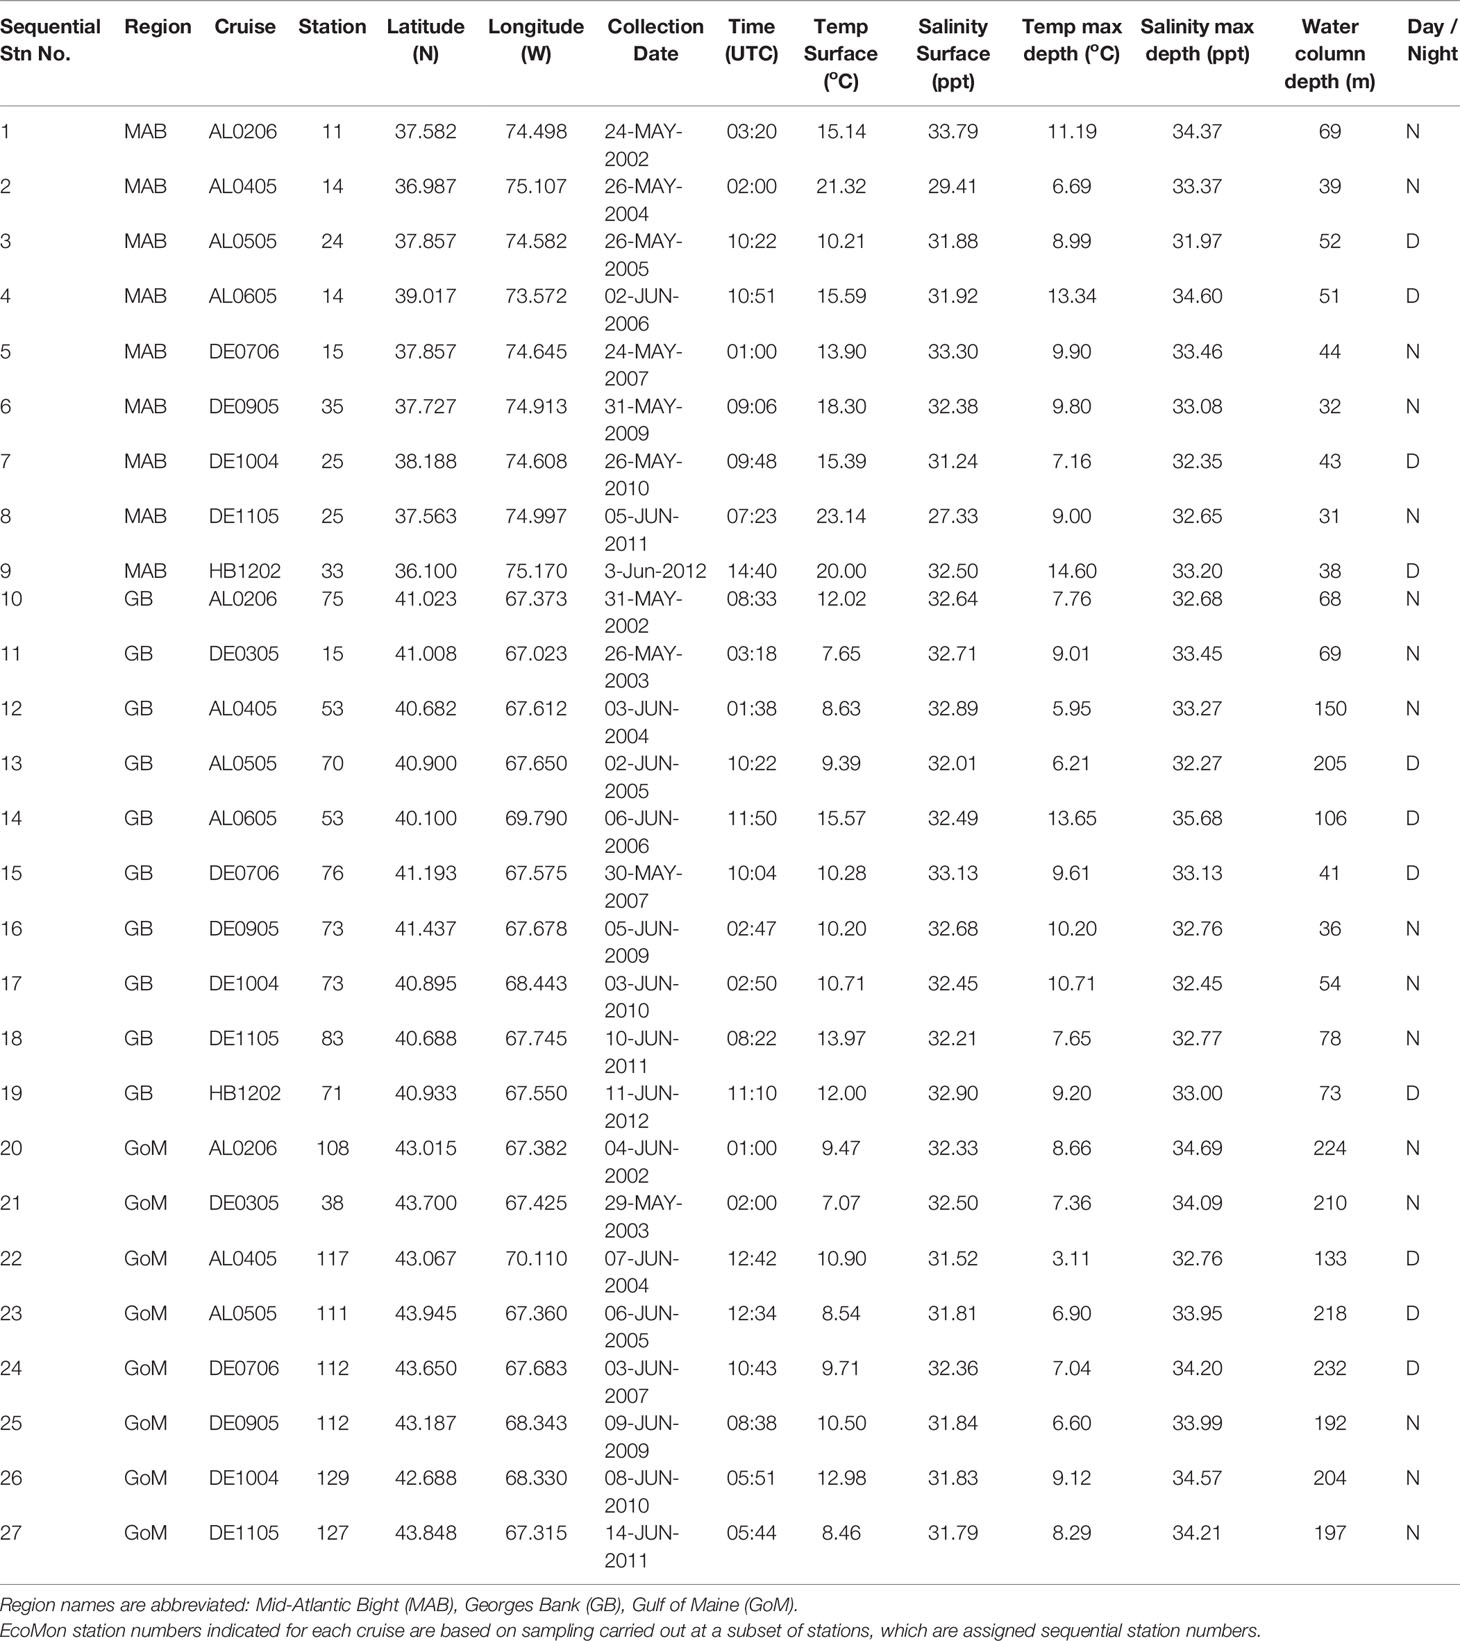
Table 1 Collection locations and dates for EcoMon Survey samples analyzed.
Extraction and Quantification of Genomic DNA
Samples were quantitatively sub-divided using a box splitter (Motoda, 1959) to reduce zooplankton volume to ~25 mL. The sample was then washed with distilled water; inserted into a 50 mL Falcon tube above 35 µm Nitex mesh, which served to suspend the material and dry the pellet; and centrifuged at 3500 g for 4 min. The pellet was moved to a new 50 mL Falcon tube, and SDS buffer (Tris-HCl, 10 mM; EDTA, pH 8.0, 100mM; NaCl, 200mM; SDS 1%) 3 mL or equal to pellet volume, whichever was smaller) was added. The sample was homogenized using a hand-held homogenizer (D1000, Thomas Scientific) with saw tooth blade for 4 min at level 5. Proteinase K (MP Biomedicals) was added (0.2 mg/mL of sample) and tubes were incubated overnight in a water bath at 55-56°C. After centrifugation (3500 g for 15 min), 400 uL of the supernatant was transferred to individual sterile 2 mL Eppendorf tubes for storage as necessary at -20 or -80°C. Total genomic DNA was extracted using the E.Z.N.A Mollusc DNA kit (Omega Bio-tek) following manufacturer instructions. All samples yielded DNA of sufficient quantify and quality for metabarcoding analysis. Total genomic DNA was quantified on a Thermo-Fisher NanoDrop 2000 and normalized to a final concentration of 5 ng/µl.
PCR Amplification, Library Preparation, and Sequencing
Purified DNA was used to amplify a 313 base-pair (bp) region of mitochondrial cytochrome oxidase I (COI) using the primers: mlCOIintF and jgHCO2198 (Geller et al., 2013; Leray et al., 2013). Forward and reverse primers were altered for multiplexed sequencing by adding 5’ adapters (Illumina, Inc., San Diego, CA). The PCR reaction used 20ng of DNA, with Platinum Taq reagents, 4µL buffer, 2.4µL MgCl, 0.8 µL dNTPs, 0.2µL HiFi Taq Polymerase, and 0.8µL of each primer (10µM), with the following protocol: one denaturation cycle at 94°C for 60 sec; 38 cycles of 94°C for 30 sec, 46°C for 30 sec, 72°C for 90 sec; a single extension cycle of 72°C for 5 min; and an infinite hold at 4°C. COI amplicons were checked for successful amplification by running in a 2% agarose gel with a 50 bp marker.
Library preparation entailed adding index primers in a second PCR amplification of the purified amplicons using a master mix composed of (per sample): 5.0 µl purified PCR product; 5 µl Nextera XT Index 1 Primer; 5 µl Nextera XT Index 2 Primer; 25 µl 2x KAPA HiFi HotStart ReadyMix; 10 µl PCR-grade water; for a total volume of 50 µl. The PCR protocol was: 95°C for 3 min; 8 cycles of: 95°C for 30 sec, 55°C for 30 sec, 72°C for 30 sec; and 1 cycle of 72°C for 5 min. The indexed PCR product was purified using AMPure XP beads, with a final elution volume of 25 µL. Successful library attachment was verified using an TapeStation 4200 D1000 High Sensitivity assay (Agilent Technologies). Libraries were quantified using a Qubit 3.0 fluorometer, normalized according to amplicon size, pooled, and denatured with 0.2 N NaOH. Bi-directional sequencing was carried out at the University of Connecticut Center for Genomic Innovation (CGI; https://cgi.uconn.edu/) using an Illumina MiSeq sequencer using the MiSeq Reagent Nano Kit Ver.2 (500 cycles; 1 million clusters) spiked with a minimum of 20% PhiX (Illumina, Inc.). All samples were analyzed in a single MiSeq run, including negative controls and replicate samples, to allow full intercomparison of samples (e.g., sequencing depth).
Sequence Quality Assessment and Bioinformatics
Demultiplexed reads for the COI region were processed using a custom script for the Mothur pipeline (Ver. 1.44.3; Schloss et al., 2009) and run on the Xanadu computing cluster of the UConn Computational Biology Core (CBC; https://bioinformatics.uconn.edu/). Contiguous sequences (contigs) were assembled from forward and reverse Illumina MiSeq reads and trimmed to the overlapping section. Sequences were trimmed to a uniform length by removing the beginning and terminal ends of sequences that extended beyond the targeted COI gene region. Sequences containing ambiguous bases, quality Phred scores < 30, and with lengths shorter than 150 bp were removed from analysis. Concerns that PCR error may contribute to errors in biodiversity assessment (Kelly et al., 2019) were addressed by using the UNOISE method (Edgar and Flyvbjerg, 2015) within Mothur (Ver. 1.44.3) to de-noise aligned sequences. Sequences were screened for chimeras using the VSEARCH command (Rognes et al., 2016); sequences with chimeras were removed from analysis.
Among the 27 samples used for COI metabarcoding, 12 were selected at random for sequencing in the same MiSeq run, using a second aliquot from the PCR product for the target COI metabarcode region. The results from these samples were treated as technical replicates and examined using the Wilcoxon rank sum test carried out in MatLab (Ver. 2020B), which indicated no statistical differences among the replicates. In all cases, data from only one of each pair technical replicates were used for definitive statistical analysis.
Taxonomic Assignment to Zooplankton Groups and Species
Taxonomic identification of COI metabarcode sequences was determined using a naïve Bayesian classifier algorithm in Mothur (Ver. 1.44.3). Taxonomic assignments for species-level identifications used bootstrap values ≥ 97% after 100 iterations. Before performing zooplankton community analyses, sequences with abundances < 2 (i.e., global singletons) across the entire dataset were removed. Taxonomic classification and species identification were based upon the MetaZooGene Barcode Atlas and Database (MZGdb; https://metazoogene.org/MZGdb), which includes publicly available COI barcode sequences downloaded from GenBank and BOLD (Bucklin et al., 2021b). The results reported in this study used the North Atlantic Atlas and Database (https://metazoogene.org/MZGdb-NATL), (which includes barcodes for all holo- or mesozooplankton species reported from the region. To ensure completeness of the regional database, DNA barcodes are included in the North Atlantic MZGdb, even if the specimen used for DNA sequencing was obtained from a different ocean region.
The MZGdb allows targeted searches by taxonomic groups and geographic regions of interest and provides the capacity to map and visualize the geographical distribution of species observations and collection locations of specimens used for DNA sequencing on global to regional scales. The MZGdb is a collaboratively-developed product of MetaZoogene (SCOR WG157; https://scor-int.org/group/157/) and the Coastal & Oceanic Plankton Ecology, Production, & Observation Database (COPEPOD, https://www.st.nmfs.noaa.gov/copepod/). The MZGdb builds upon a taxonomically-arranged database of zooplankton observations, biometric traits, photographs, and DNA barcode data in COPEPEDIA (https://copepedia.org/), which stores and compiles information at multiple taxonomic levels, including species and taxonomic groups.
Analysis of COI Sequence Numbers and EcoMon Counts
COI sequence numbers are reported for species of the same 17 taxonomic categories used to classify metabarcoding results for V9 18S rRNA by (Bucklin et al. 2019) (Supplementary Table S1). Morphological (microscopic) abundance counts per 10m2 were recorded for these same taxonomic groups (Supplementary Table S2). Results were further analyzed for six taxonomic groups (Calanoida, Cyclopoida, Eucarida, Chaetognatha, Hydrozoa, and Gastropoda) for which both metabarcoding results and microscopic taxonomic counts were available for most samples; groups with zeros or missing data for many of the samples were not included in the analyses. All data were transformed (Log10+1) prior to analysis.
Numbers of COI sequences and abundance counts from morphological taxonomic analysis reported in the EcoMon database were statistically compared for the six groups using functional regression analysis (Ricker, 1973). Multivariate statistical analyses of COI sequence numbers for the six zooplankton groups were carried out to examine patterns of variation between regions and years using MatLab (Ver. 2020B). One distance measure used was Bray-Curtis dissimilarity coefficient (Bray and Curtis, 1957; McCune et al., 2002), with results displayed by cluster diagrams. Differentiation among the 3 regions was evaluated by Non-Metric Multidimensional Scaling (NMDS) and by Nonparametric (Permutation-based) MANOVA using the FATHOM Toolbox for MatLab (Jones, 2017; https://www.usf.edu/marine-science/research/matlab-resources/index.aspx/). The Shannon (H) and Simpson (D) Diversity Indices (Pielou, 1977) were calculated using COI sequence numbers for the 6 taxonomic groups for each sample. Regression analysis of values for the two indices showed no difference in all cases and results are reported for the Shannon Index (H).
COI metabarcodes identified a total of 181 species across 23 taxonomic groups of metazoan zooplankton listed in the summary file (Wang et al., 2007) generated by Mothur (Ver. 1.44.3; Schloss et al., 2009). Many of these species showed very low sequence numbers including many zeros (Supplementary Table S3), which prevented statistical analysis. Multivariate statistical analysis was carried out for 23 species with total COI sequence numbers >1,000 across all samples (Table 2). All data were transformed (Log10+1) for analysis. Patterns of variation in COI sequence numbers for the 23 species were statistically evaluated between regions and years in MatLab (Ver. 2020B), using the same tests as for the group comparisons, including NMDS and Nonparametric (Permutation-based) MANOVA (Jones, 2017; https://www.usf.edu/marine-science/research/matlab-resources/index.aspx/), Bray-Curtis dissimilarity coefficient (Bray and Curtis, 1957; McCune et al., 2002), and Shannon Diversity Index (H; Pielou, 1977).
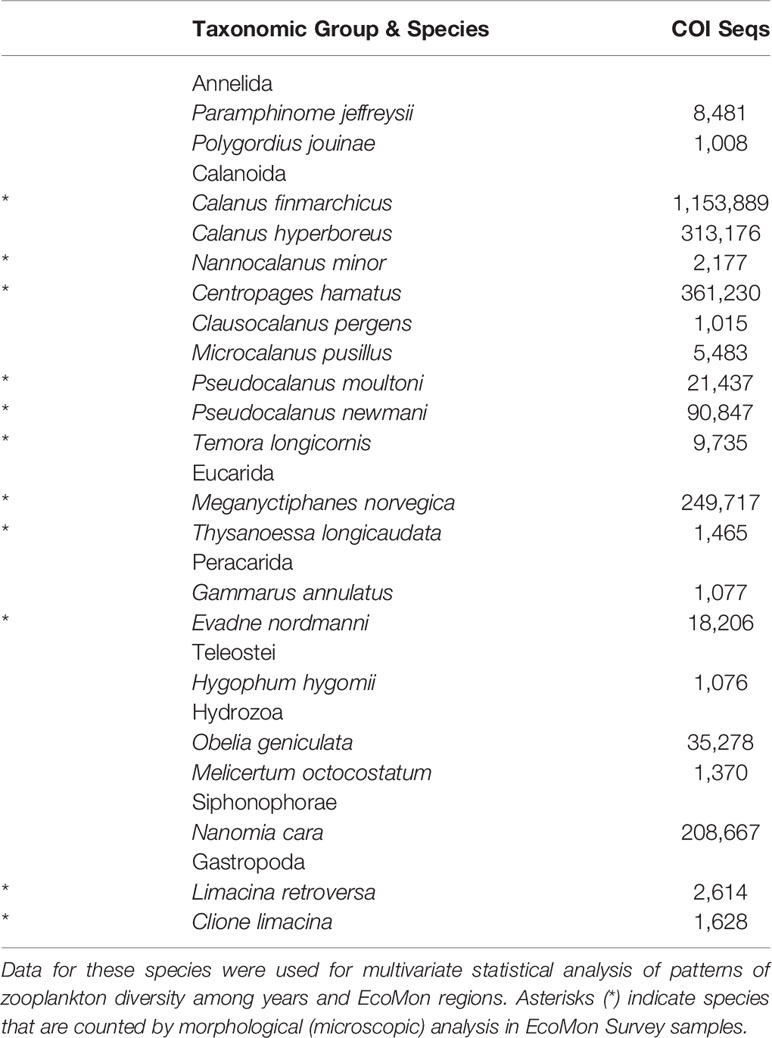
Table 2 Abundant species with >1000 COI sequences totaled across 27 samples from EcoMon Surveys 2002-2012.
Morphological counts are available in the EcoMon database for 7 of the 23 species with >1,000 COI sequences; the remaining 16 species were either grouped at a higher taxonomic level or were not listed among species to be identified (NMFS/NEFSC, 2019; https://www.ncei.noaa.gov/archive/accession/0187513). Numbers of COI sequences and miscroscopic counts were statistically compared for these species using functional regression analysis (Ricker, 1973).
Results
Comparative Molecular - Morphological Analysis of Zooplankton Groups
Metabarcoding using a portion of the COI barcode region was carried out for 27 samples collected from three EcoMon Survey regions (GB, GoM, MAB) during 2002-2012 (Table 1). The taxonomic groups selected were used in a previous metabarcoding study by Bucklin et al. (2019) that analyzed the V9 hypervariable region of 18S rRNA for the same EcoMon samples. Metabarcoding yielded a total of 4,992,468 COI sequences and 1,404,242 Amplified Sequence Variants (ASVs). Considering all samples together, numbers of COI sequences and ASVs for species with >50 sequences (Supplementary Tables S3, S4) were highly significantly correlated across all taxonomic groups (r = 0.978, p = 6.102 e-11). The definitive analysis used COI sequence numbers.
Statistical analysis focused on 6 taxonomic groups (Calanoida, Cyclopoida, Eucarida, Gastropoda, Hydrozoa, Chaetognatha) for which sufficient numbers of observations (non-zero) were available for both molecular (metabarcoding) and morphological (counts) data. These groups were the same ones analyzed for V9 18S rRNA metabarcodes by Bucklin et al. (2019) for these same samples; a seventh group (Peracarida) could not be analyzed due to many zero values for COI sequence numbers (Supplementary Table S1). Functional regression analysis (Ricker, 1973) of COI sequence numbers versus morphological counts was statistically significant for five of the six taxonomic groups; the exception was the Hydrozoa (Figure 3).
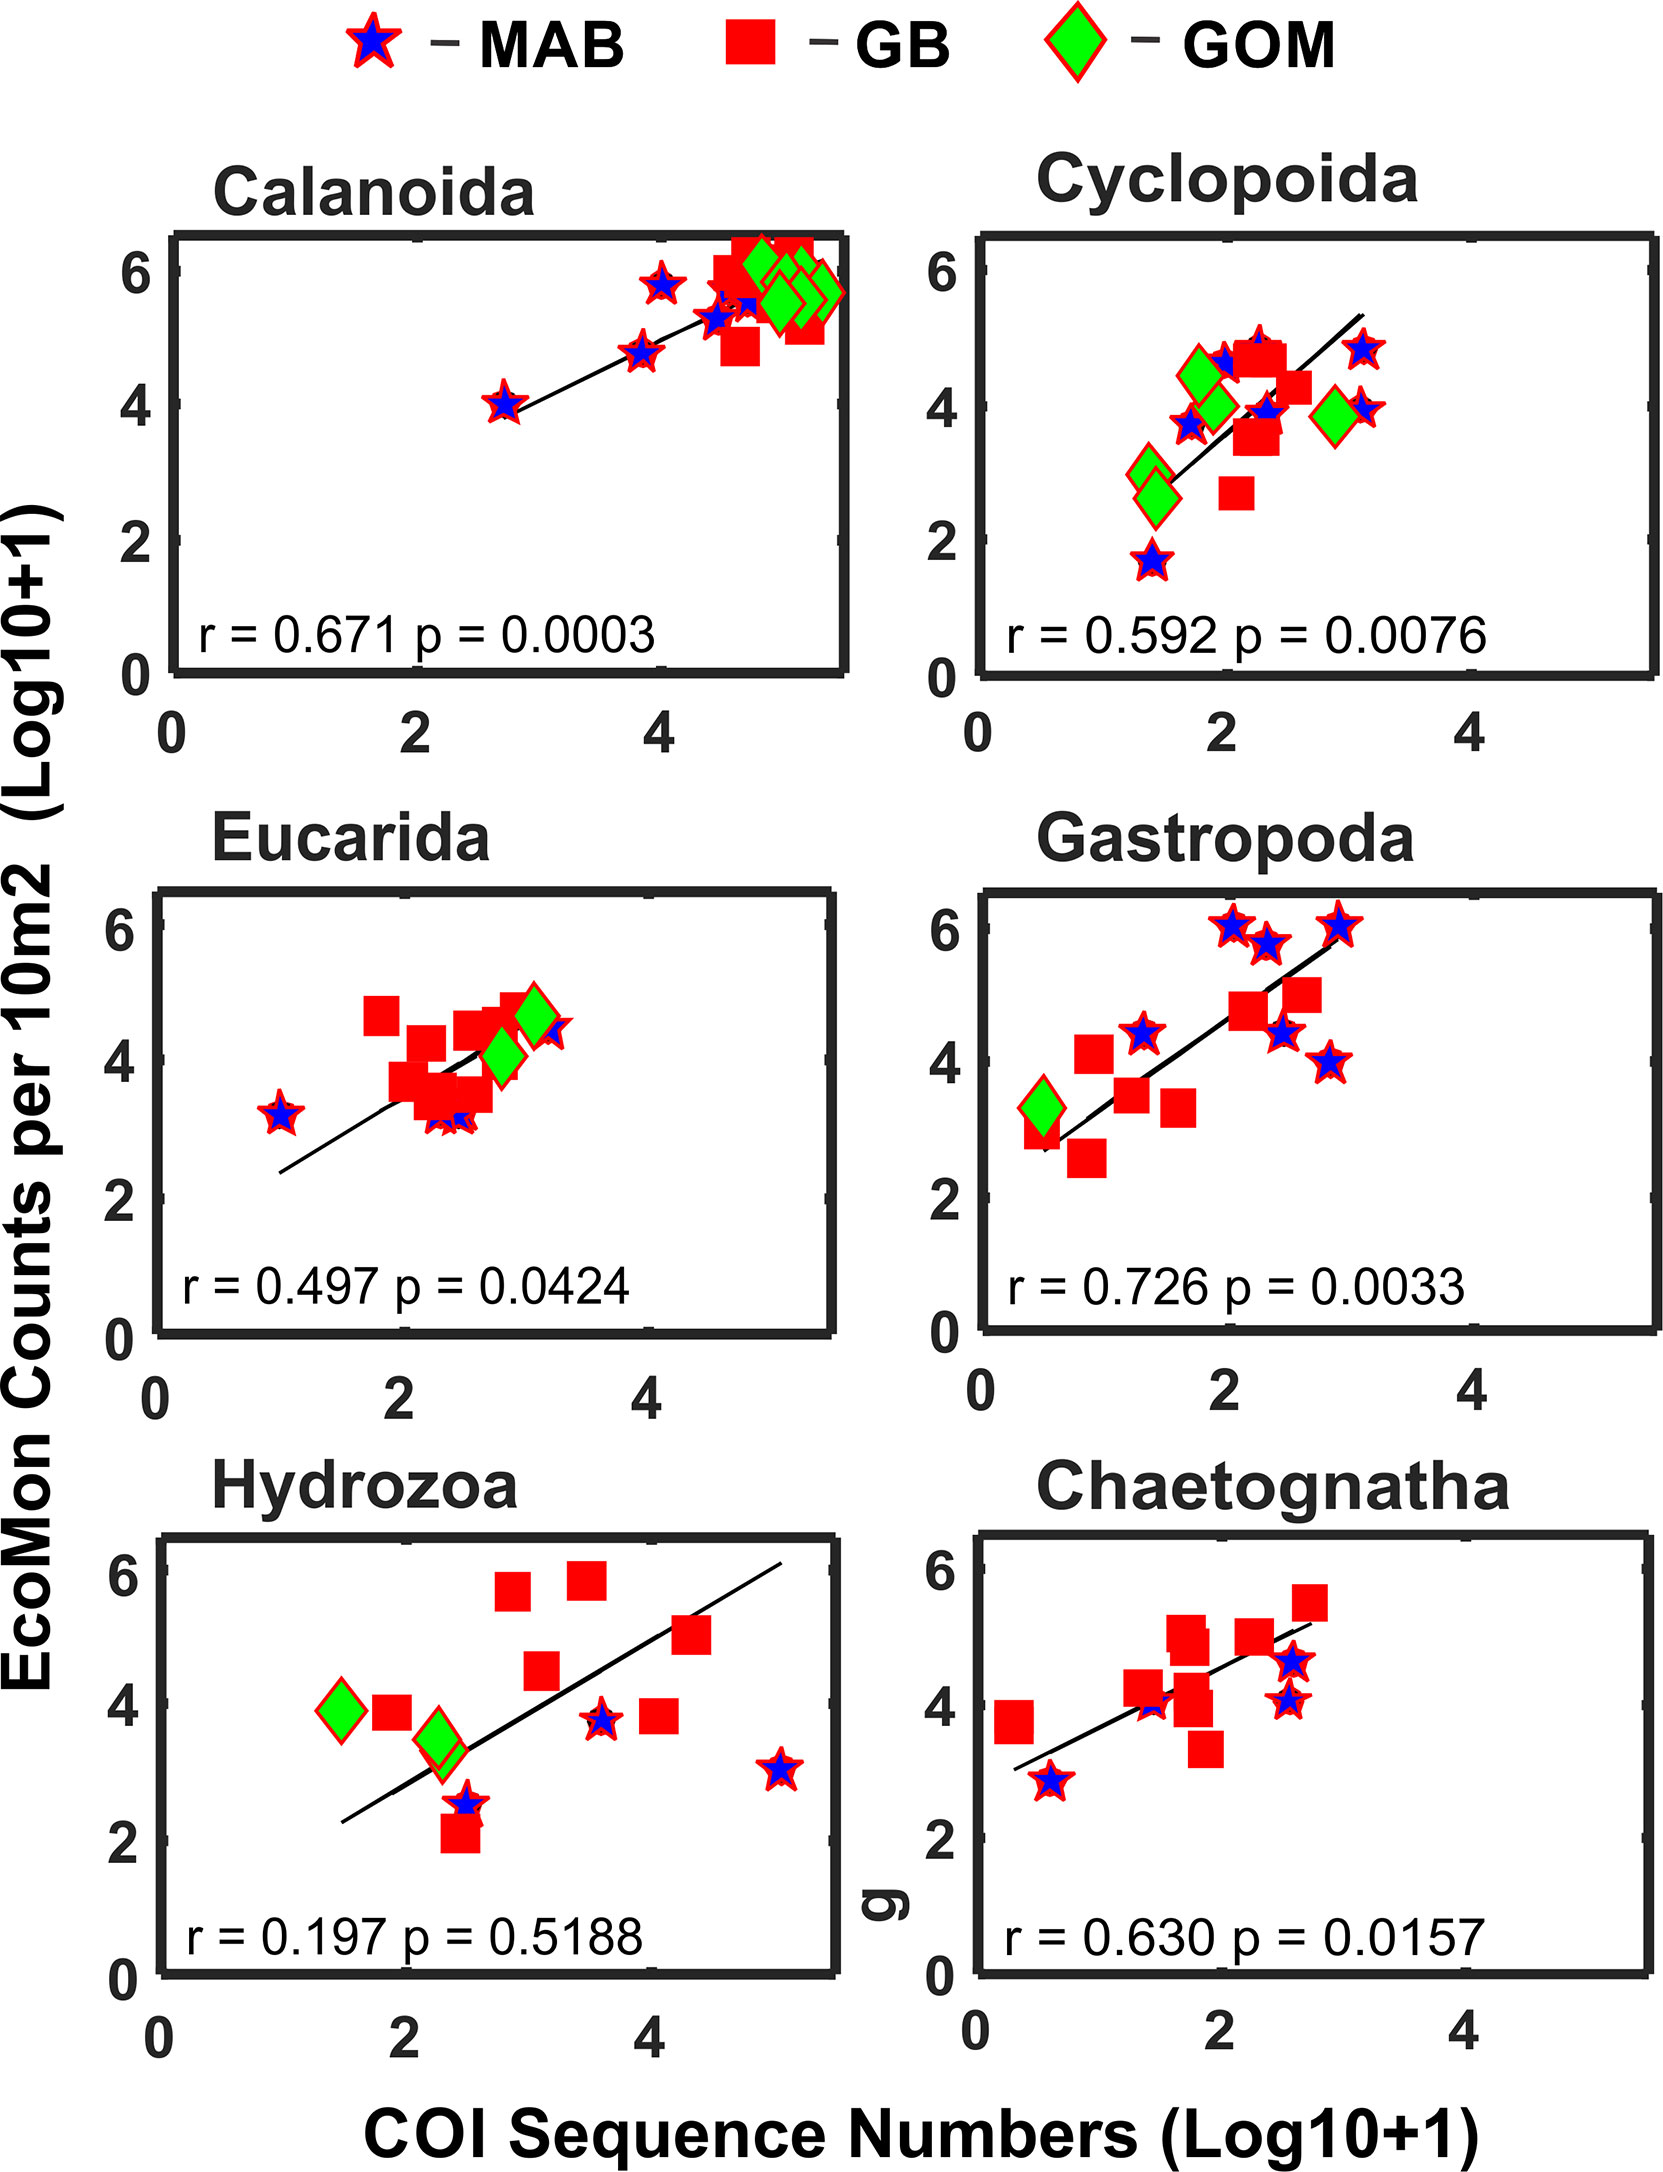
Figure 3 Functional regression analysis of COI sequence numbers versus morphological microscopic counts per 10m2 for selected taxonomic groups of zooplankton. Symbols indicate regions for sample collections: Mid-Atlantic Bight (MAB), Georges Bank (GB), Gulf of Maine (GoM). Numbers are Log10+1 conversions; regression equation coefficient (r) and statistical significance (p) are indicated for each group.
Interannual and regional patterns of diversity of the 6 taxonomic groups based on COI sequence numbers and morphological counts analyzed by NMDS (Jones, 2017) revealed similar patterns, with considerable overlap among the 3 EcoMon regions, but some evidence of distinctive samples in some regions and years for both molecular and morphological analysis (Figure 4). Based on Nonparametric (Permutation-based) MANOVA (Jones, 2017) analysis, the 6 groups showed different patterns of variation among regions and years (p < 0.001), but samples did not differ statistically significant among regions (p = 0.772). Cluster diagrams based on the Bray-Curtis dissimilarity coefficient (Bray and Curtis, 1957; McCune et al., 2002) based on both COI sequence numbers and morphological counts showed clear differentiation of MAB samples, with some overlap between GB and GoM (Figure 5). There are two groups of GB stations based on both COI sequence numbers and EcoMon counts (Figure 5), although the two GB clusters grouped together for EcoMon counts (Figure 5B), while GB #10-14 grouped with MAB and GB #15-19 grouped with GoM for COI sequence numbers (Figure 5A).
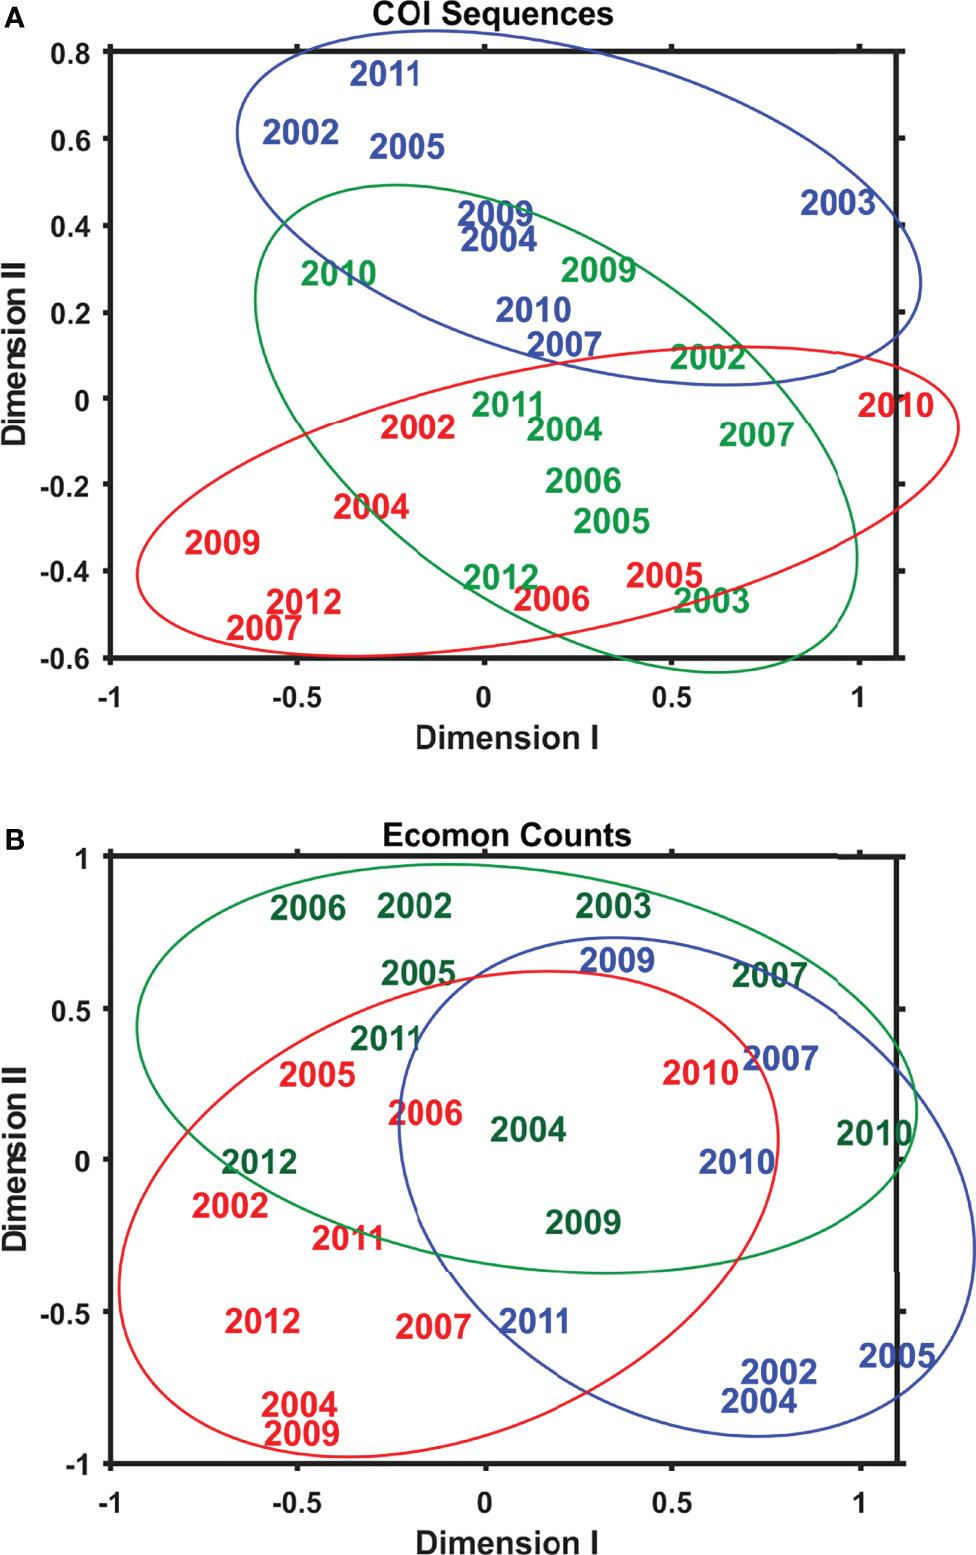
Figure 4 Two-dimensional Nonmetric Multidimensional Scaling (NMDS) analysis of regional variation based on (A) COI sequence numbers and (B) EcoMon morphological counts for 6 taxonomic groups: Calanoida, Cyclopoida, Eucarida, Gastropoda, Hydrozoa, Chaetognatha. The plot indicates the year of sample collection; colors indicate regions: MAB (red), GB (green), GoM (blue).
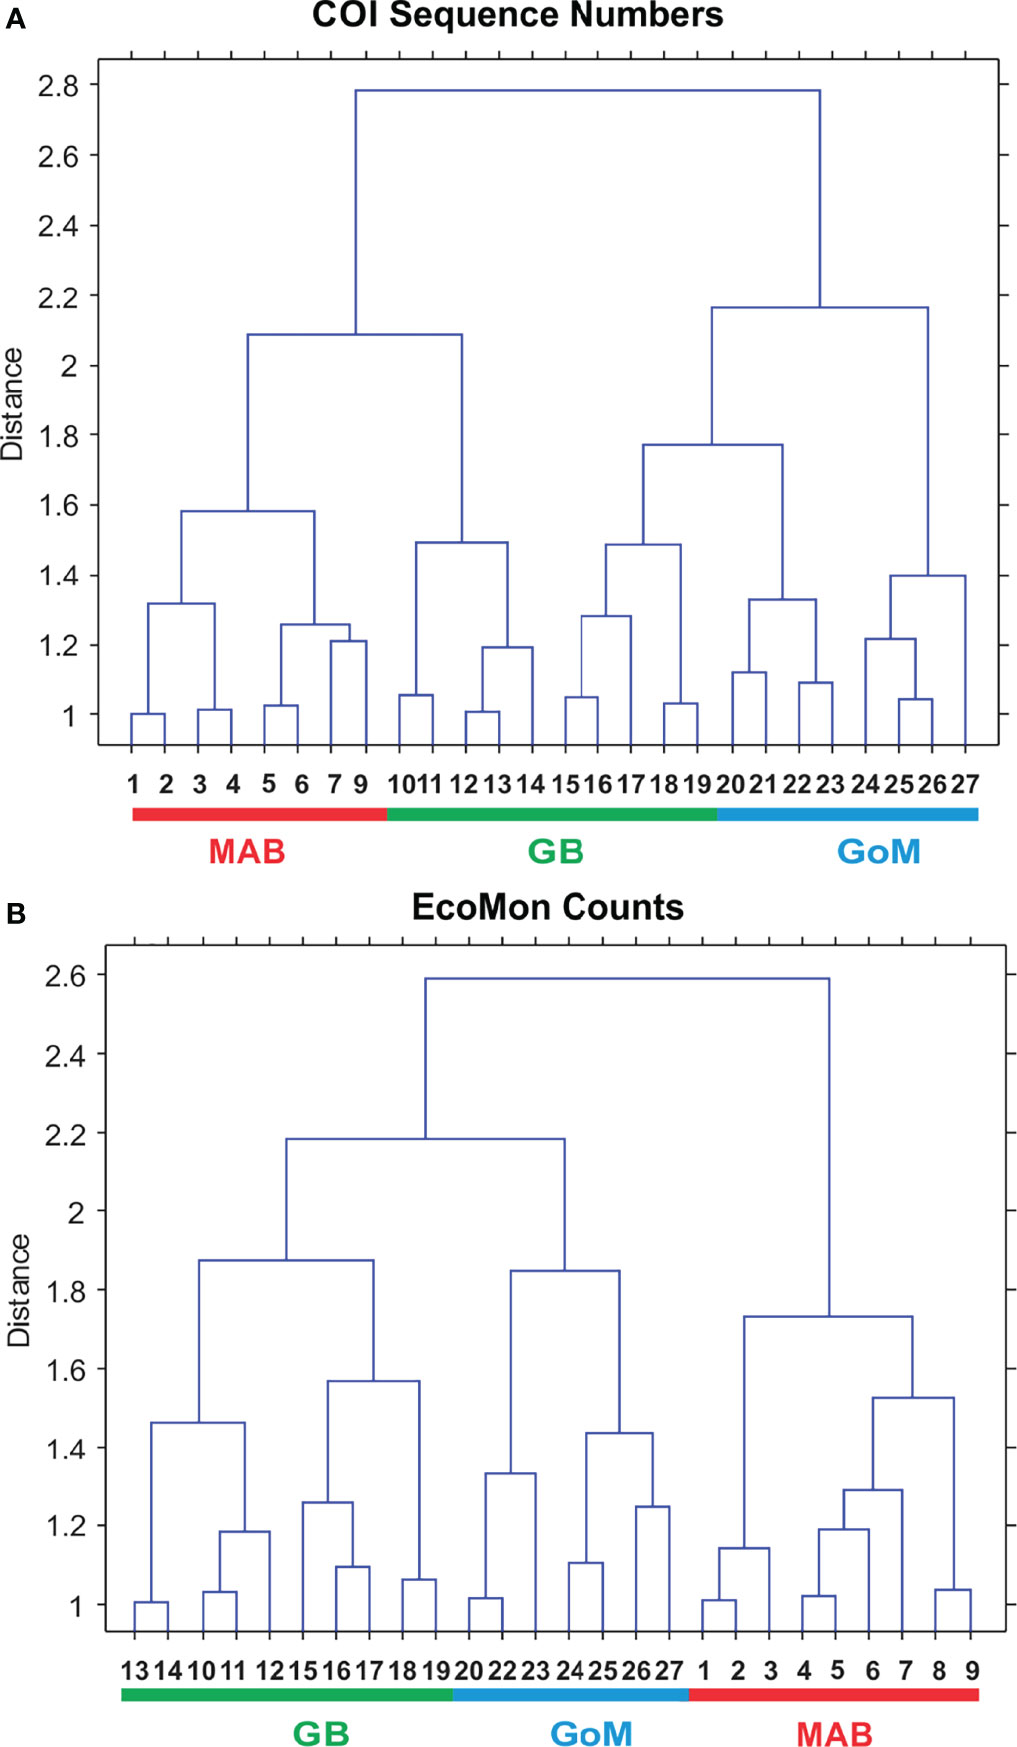
Figure 5 Bray Curtis similarity cluster diagram showing analysis of regional variation based on (A) COI sequence numbers and (B) EcoMon microscopic counts for 6 taxonomic groups. Numbers are EcoMon sample numbers; see Table 1 for collection information. The three regions are indicated as Mid-Atlantic Bight (MAB), Georges Bank (GB), and Gulf of Maine (GoM).
The Shannon Diversity Index (H; Pielou, 1977) showed lower levels for GoM during 2002-2005, based on both COI sequence numbers and morphological counts, with more variation among the 3 regions based on COI sequence numbers for 2007, 2009, 2010 and 2011 (Figure 6). The Simpson Index was also calculated from the same data, with results that were statistically nearly identical to the Shannon Index based on regression analysis (COI sequences: r = 0.965, p = 2.138 e-15; EcoMon counts: r = 0.982, p = 2.636 e-17).
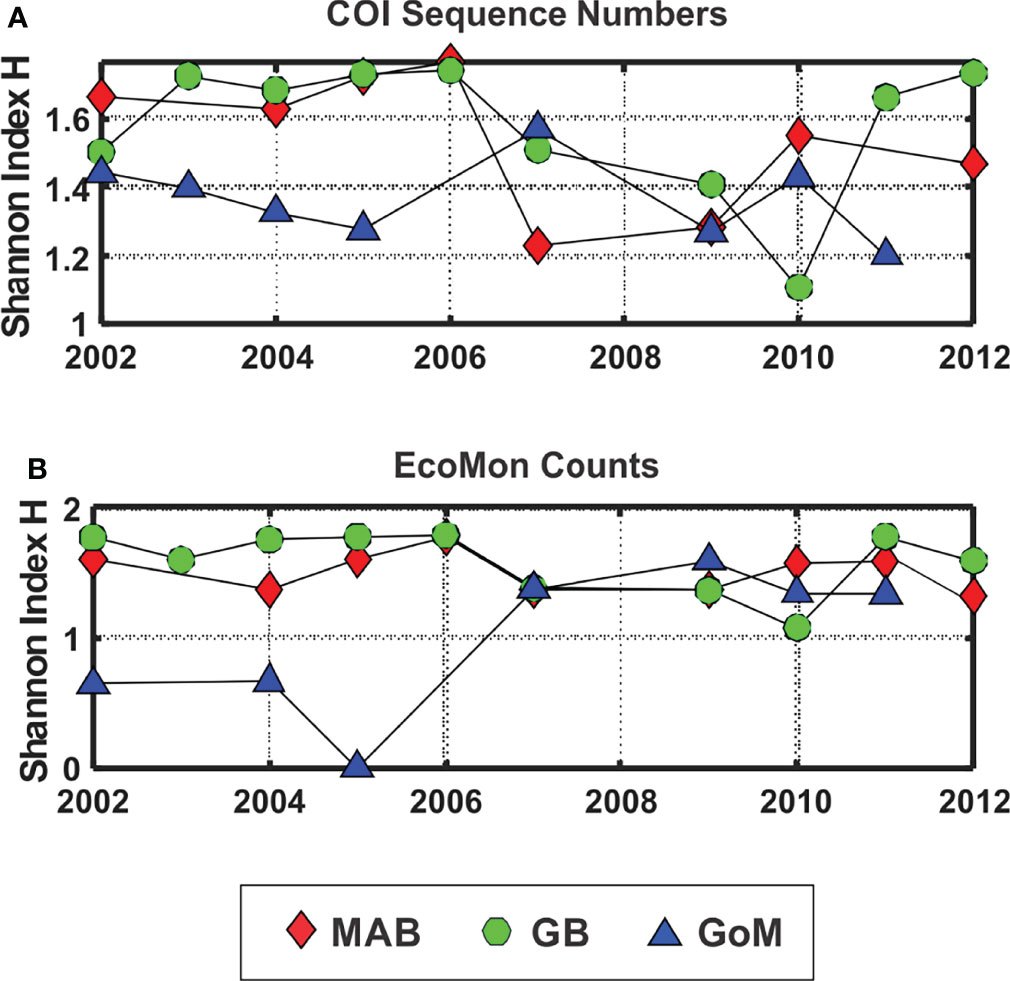
Figure 6 Shannon Diversity Index (H; Pielou, 1977) based on (A) COI sequence numbers and (B) EcoMon morphological counts for 6 taxonomic groups. Legend indicates symbols for the three regions: Mid-Atlantic Bight (MAB), Georges Bank (GB), Gulf of Maine (GoM).
COI Metabarcoding of Species Diversity
COI metabarcodes identified 181 species across 23 groups at varying taxonomic levels; 67 species of 15 groups had > 50 COI sequences; 23 species had >1,000 COI sequences (Supplementary Table S3). Classification and identification of species based on COI sequences used the North Atlantic regional MetaZooGene Atlas and Database (MZGdb), which includes 75,976 barcodes for 12,985 zooplankton species reported to occur in the region (https://metazoogene.org/mzgdb-natl, accessed March 13, 2022). Selection of species for the MZGdb is based upon the COPEPOD database (https://www.st.nmfs.noaa.gov/copepod/) and is designed to ensure an accurate, reliable, and taxonomically-complete reference sequence database with appropriate geographic coverage (Bucklin et al., 2021b).
Multivariate statistical analysis of metabarcoding results focused on 23 species with COI sequence numbers >1000 across all samples (Table 2). Two-dimensional NMDS results for the 23 species showed grouping of samples for each EcoMon region, with a distinct cluster of GoM samples and overlap between MAB and GB samples, with the notable exception of the 2010 MAB sample (Figure 7), which was dominated by the siphonophore, Nanomia cara (Supplementary Table S3). The 23 species showed some variation among regions and years (p = 0.038) based on Nonparametric (Permutation-based) MANOVA (Jones, 2017) analysis, but did not differ statistically significant among regions (p = 0.359). The Bray-Curtis similarity index cluster diagram based on COI sequence numbers for 23 species also showed clear regional patterns, except for the 2002 GB sample, which clustered with MAB (Figure 8).
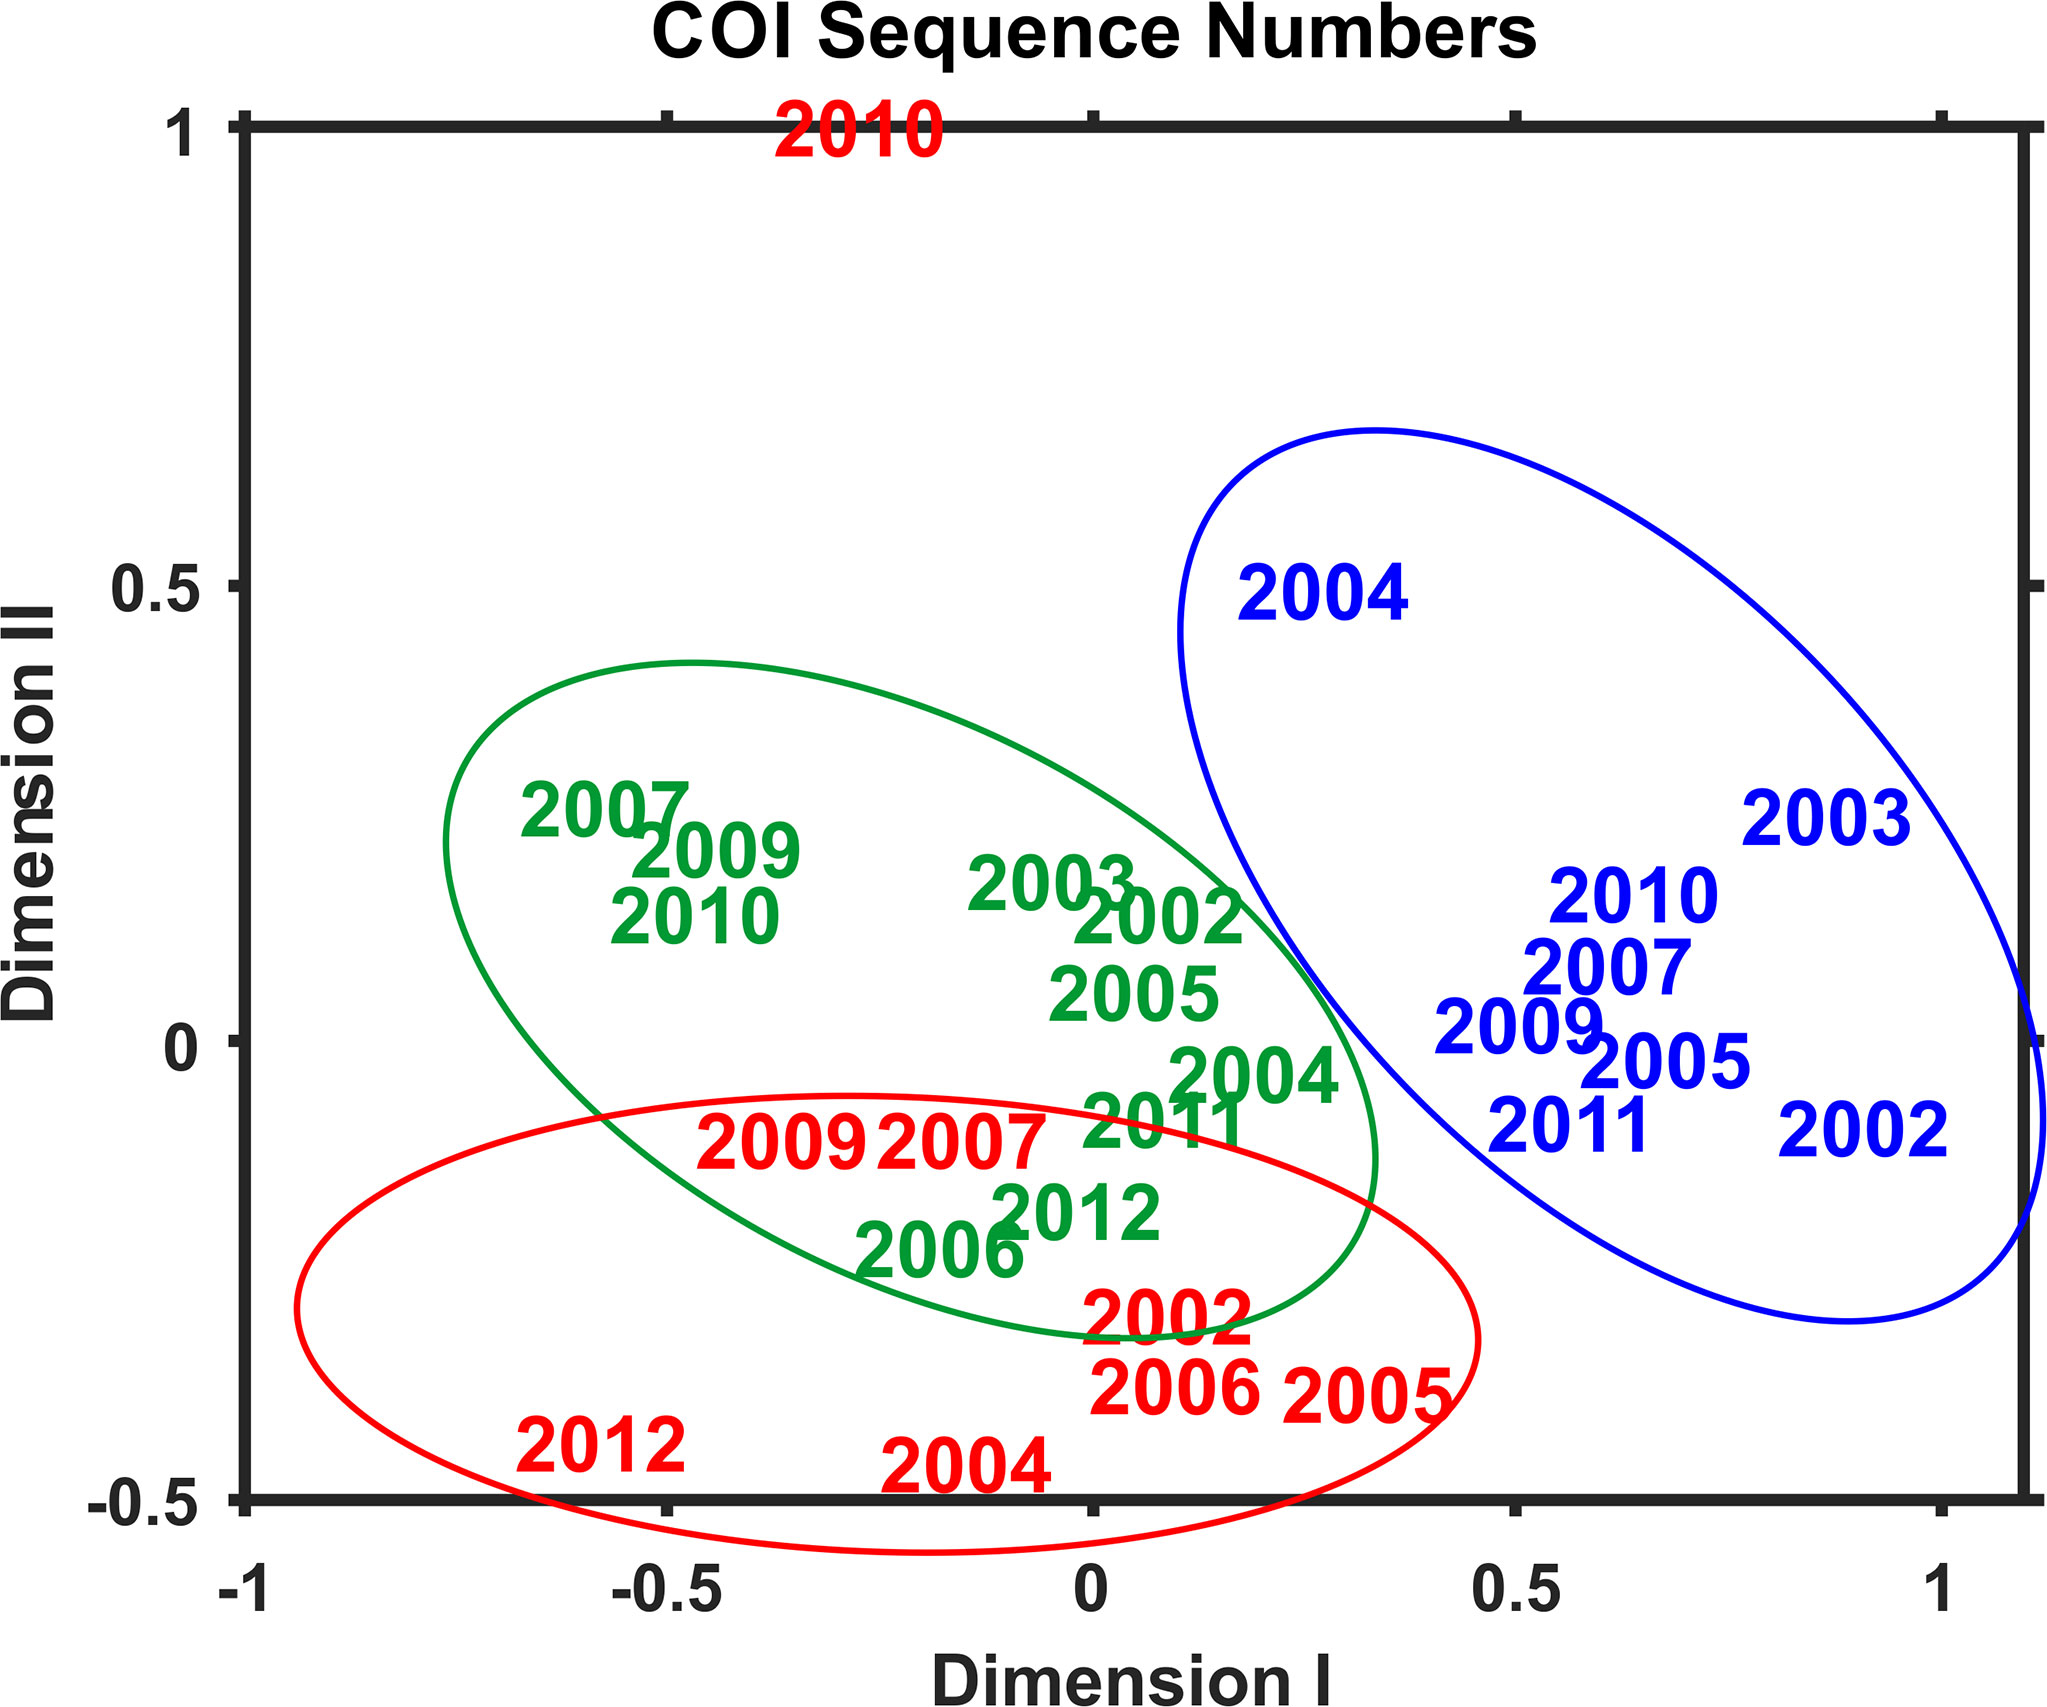
Figure 7 Two-dimensional Nonmetric Multidimensional Scaling (NMDS) analysis of regional variation based on COI sequence numbers for 23 species with total sequence numbers >1000. See Table 2 for list of species. The plot indicates the year of sample collection; colors indicate regions: MAB (red), GB (green), GoM (blue). Note that the MAB 2010 sample is not included within the circle defining the MAB region.
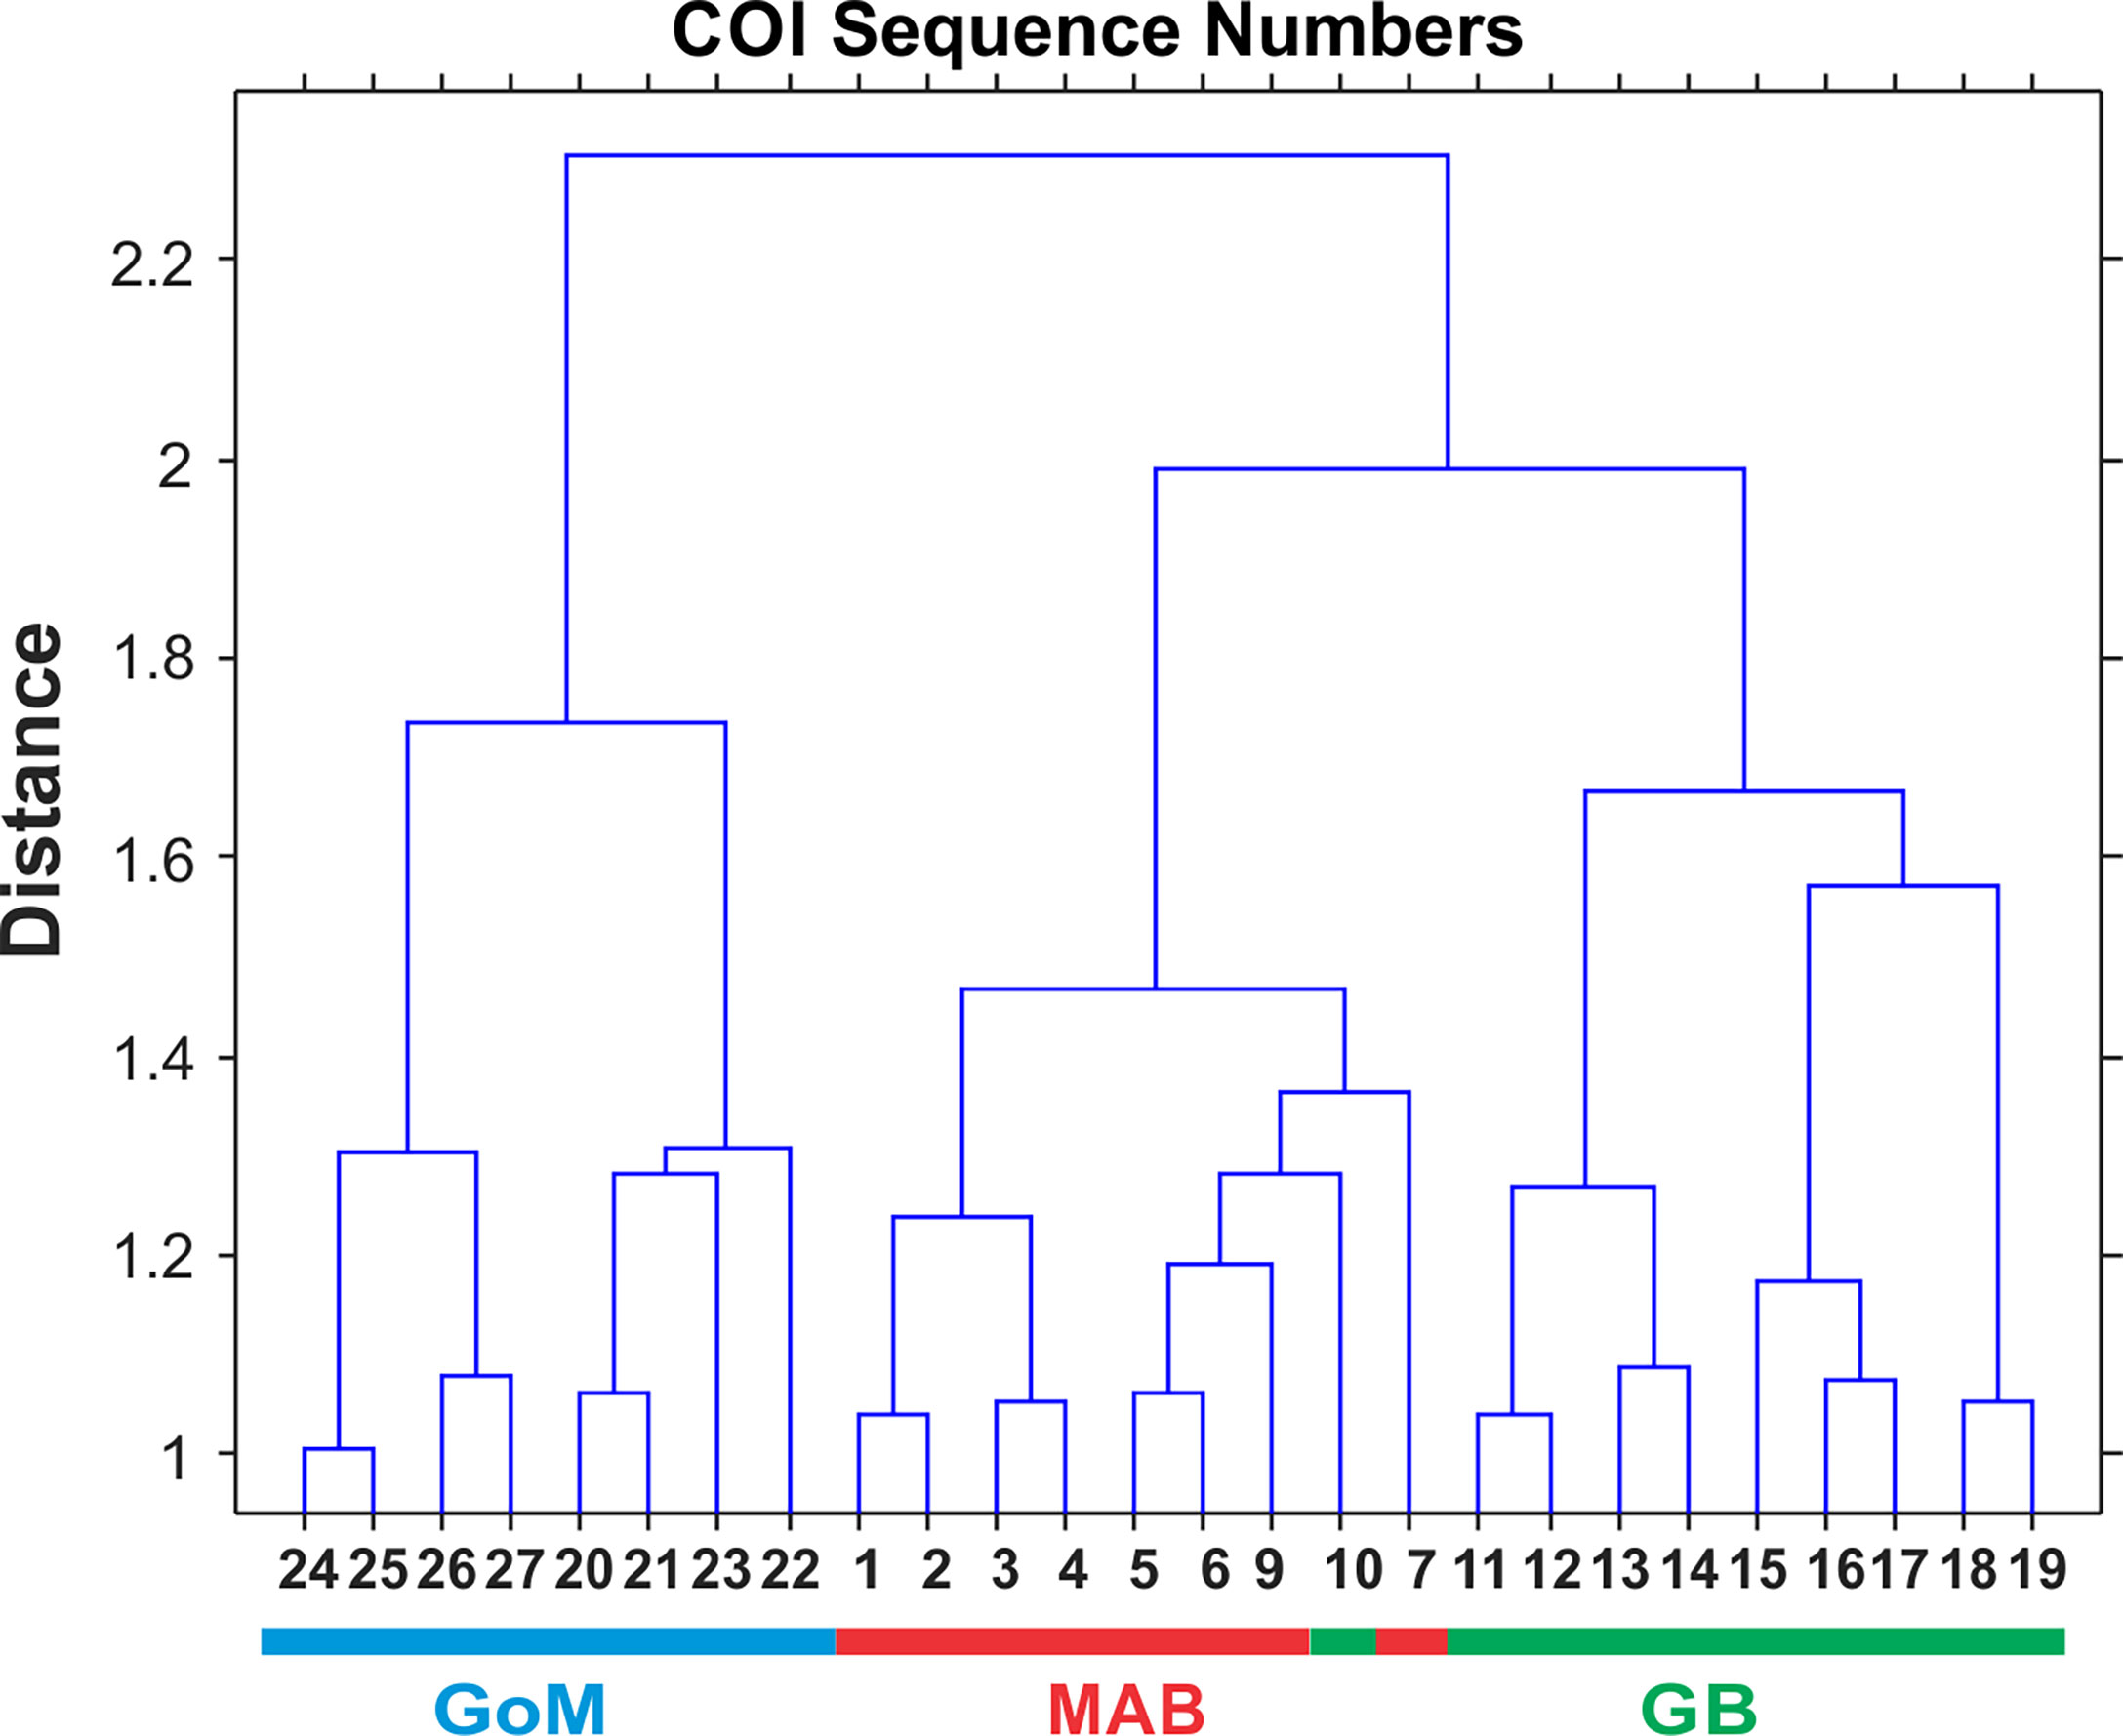
Figure 8 Bray-Curtis similarity index cluster diagram for zooplankton samples collected throughout EcoMon regions based COI sequence numbers for 23 identified species with totals >1000 COI sequence numbers (see Table 2). Regions are indicated as Mid-Atlantic Bight (MAB), Georges Bank (GB), Gulf of Maine (GoM).
The pattern of variation of the Shannon Diversity Index (H) based on COI sequence numbers for 23 species showed similar patterns of year-to-year variation in each of the 3 EcoMon regions, with marked differences between 2002-2005 versus 2007-2011 (Figure 9), similar to the interannual variation of H based on COI sequence numbers for the 6 groups (Figure 6).
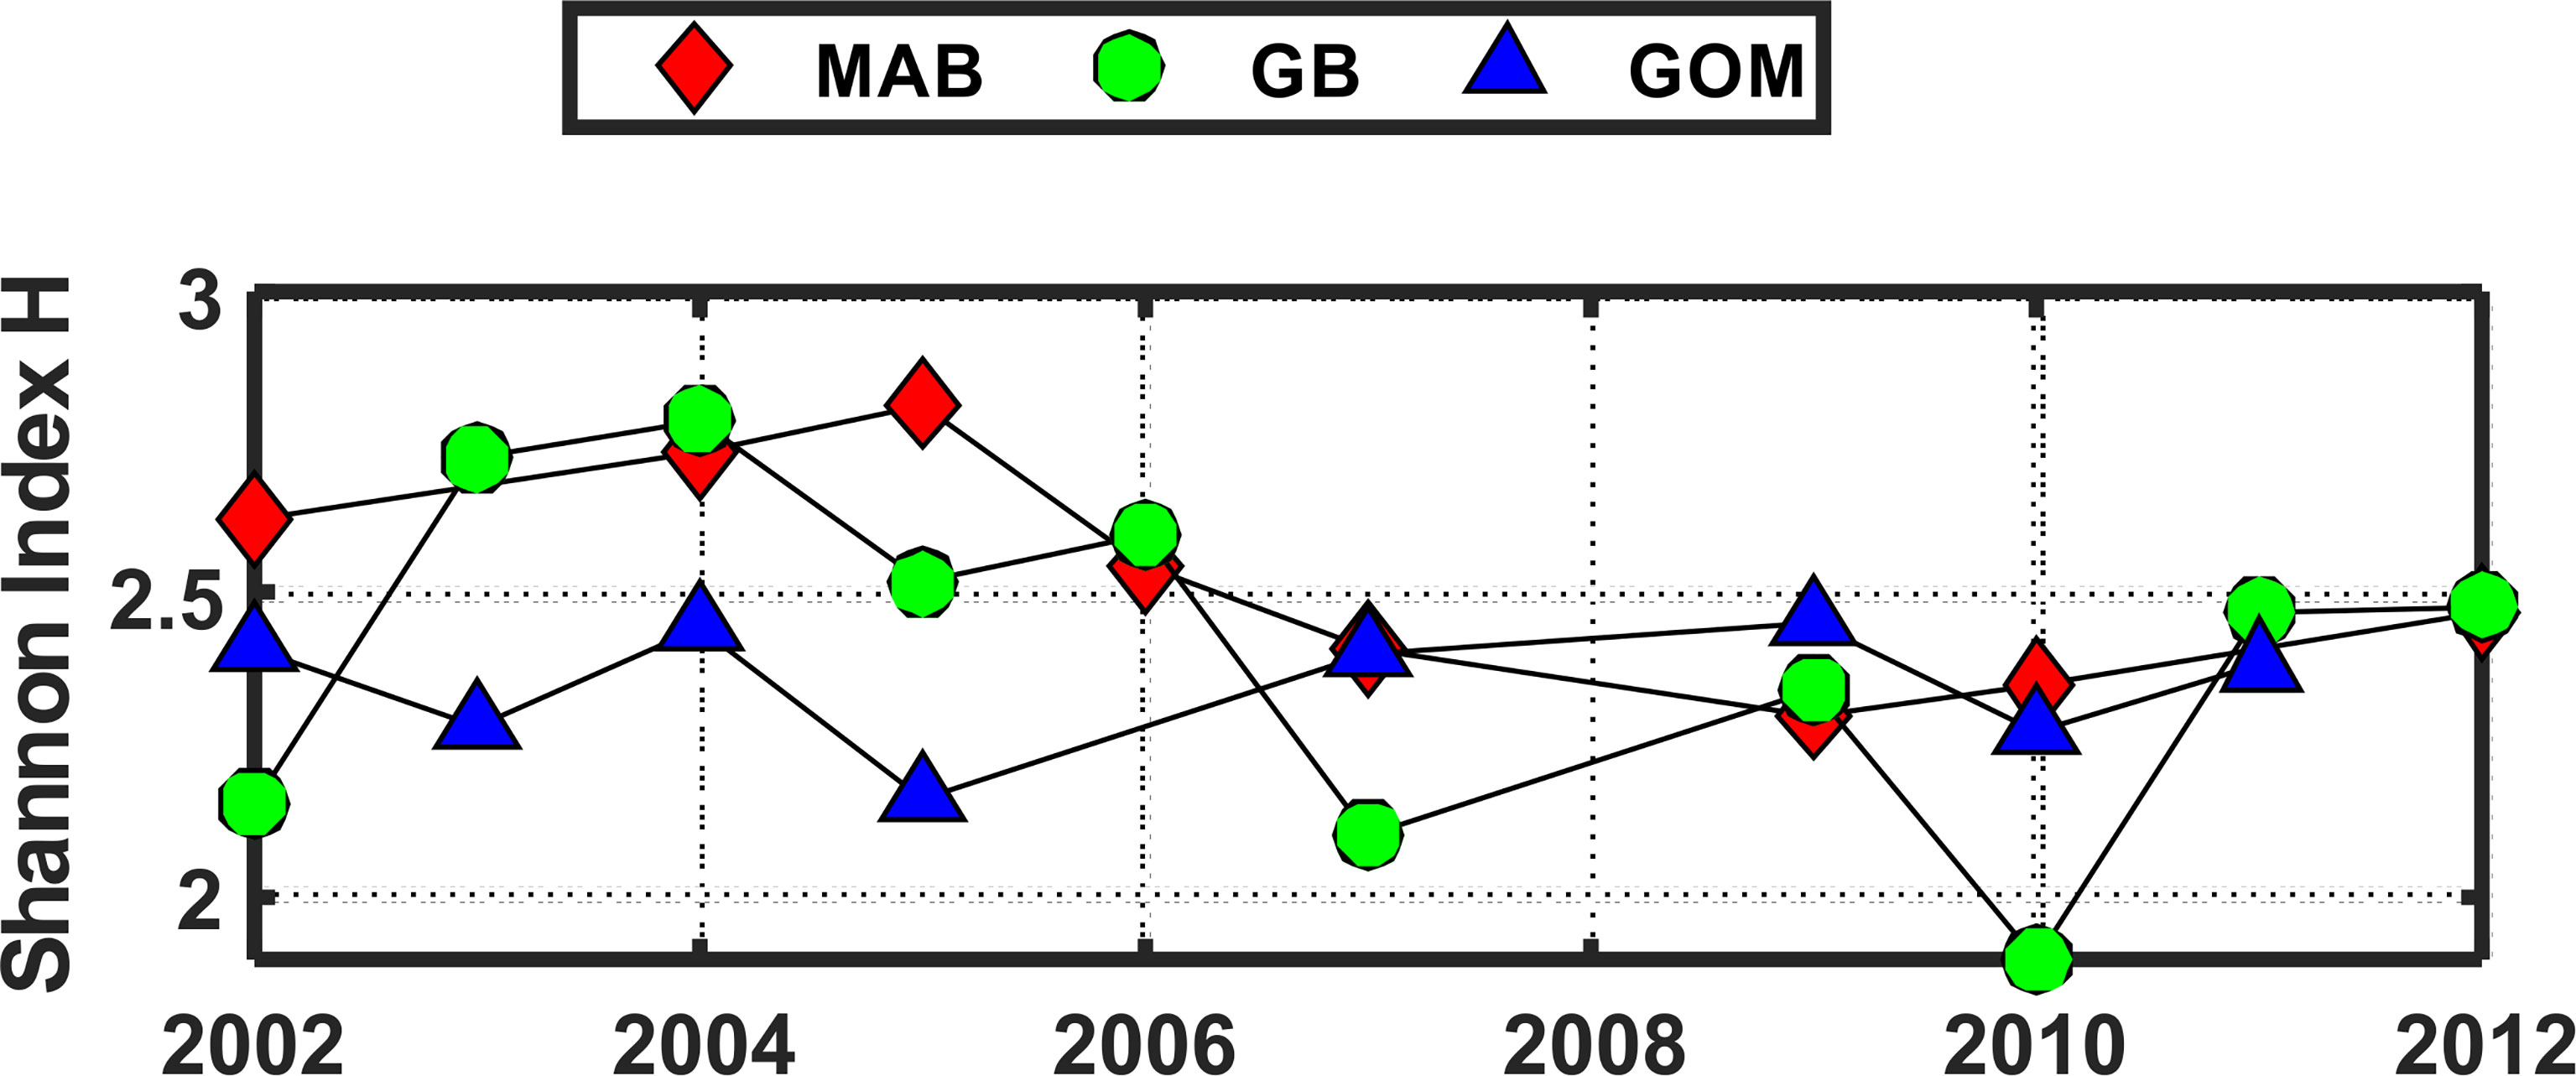
Figure 9 Shannon Diversity Index (H) for the three regions based on COI sequence numbers for 23 abundant species with total sequence numbers >1000. See Table 2 for list of species. Values of the Shannon Index (H) shown here were significantly correlated with Simpson Index values (r = 0.953, p = 6.657 e-14). Regions are: Mid-Atlantic Bight (MAB), Georges Bank (GB), Gulf of Maine (GoM).
Functional regression analysis of COI sequence numbers versus morphological counts from the EcoMon database were done for 7 species for which both types of data were available for most stations. Of these, 5 species showed significant regression relationships: Calanus finmarchicus, Centropages hamatus, C. typicus, Pseudocalanus spp., and Temora longicornis (Figure 10); regressions were not significant for two species (not shown): Acartia longiremis (r = 0.607, p = 0.277) and Nannocalanus minor (r = 0.439, p = 0.711). In all cases, the species showing significant regressions had higher numbers of COI sequences, higher counts, and had data of both types for more stations; the species with insignificant regressions had more missing observations and recorded zeroes.
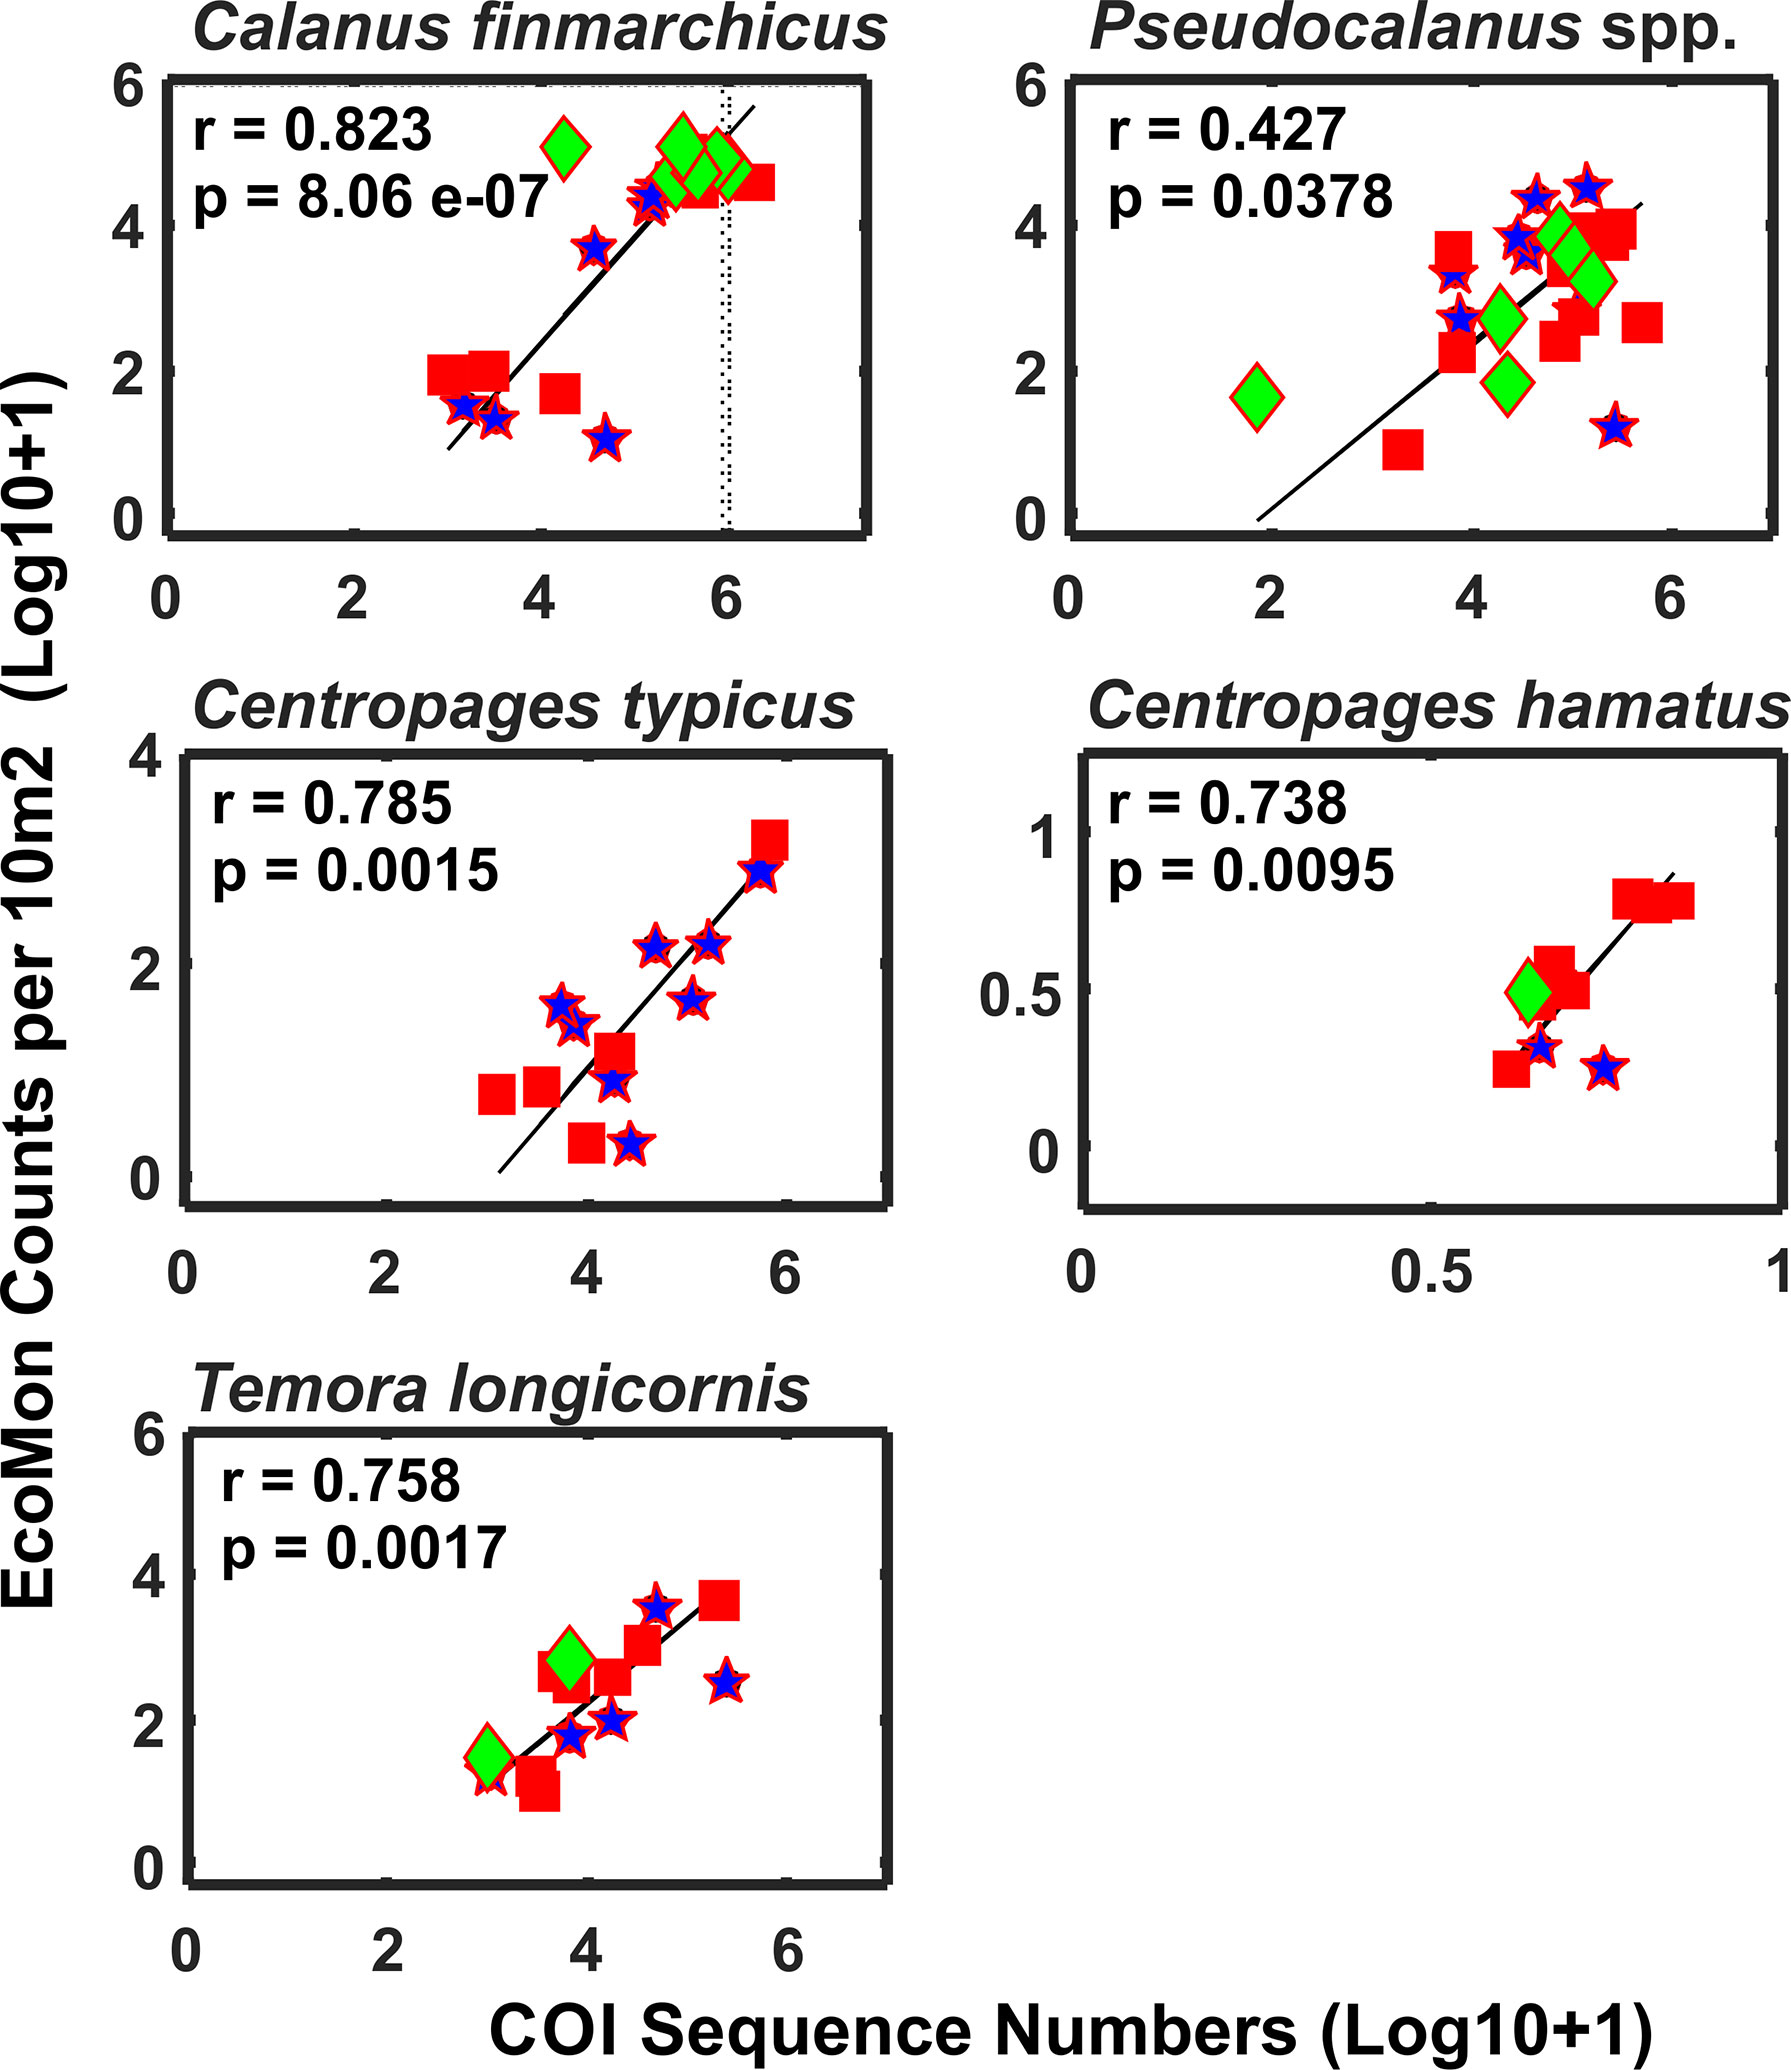
Figure 10 Functional regression analysis of COI sequence numbers and EcoMon microscopic counts per 10 m2 for abundant copepods that were detected by COI metabarcoding and also counted by EcoMon microscopic analysis (Supplementary Tables S1, S2). COI sequences for all Pseudocalanus species detected were added for comparison with Pseudocalanus spp. counts from the EcoMon database. Species were selected based on availability of molecular and morphological data for sufficient numbers of samples to allow regression analysis. Numbers are Log 10 + 1 conversions.
Discussion
The NW Atlantic Continental Shelf
The NW Atlantic continental shelf was designated as a Large Marine Ecosystem (LME) based on the importance of the region for commercial harvesting and the need for conservation measures (Sherman et al., 2002). Despite many challenges over recent decades, including rapid warming from climate change (Friedland et al., 2020), the region has remained an important and productive region for commercial harvesting of numerous species. The importance of the pelagic community, and the zooplankton assemblage in particular, in ecosystem function and services has been acknowledged and examined for many decades (Sherman and Duda, 1999; Walsh et al., 2015; Friedland et al., 2019). Marked differences have been observed among the regions of the NW Atlantic continental shelf ecosystem (Figure 1) in temporal patterns of variation in ecosystem dynamics, including zooplankton diversity and biomass (O’Brien et al., 2013; Figure 2).
The importance of biodiversity in the functioning of marine ecosystems is well established (Gamfeldt et al., 2015). A number of studies have examined the more specific question of the role of species diversity of zooplankton in sustaining ecosystem services, including commercial fisheries (Byron and Link, 2010; Bi et al., 2014; Morse et al., 2017). Analysis of the taxonomic composition, diversity, abundance, and biomass of the zooplankton assemblage can serve as an early indicator of climate impacts and regime shifts in the region (Johnson et al., 2011; Borja, 2014; Stern et al., 2018).
A number of previous studies have established the importance of identifying and discriminating zooplankton species, even closely-related and morphologically-cryptic species, to allow understanding of ecosystem function and prediction of impacts of environmental variation and climate change (Johnson et al., 2011; Hare and Kane, 2012; O’Brien et al., 2013), and also to guide fisheries assessment and management (Kelly, 2016; Goodwin et al., 2017; Aylagas et al., 2018). The increasing evidence that COI metabarcoding can provide accurate and reliable species-level identification across the zooplankton assemblage is especially relevant and important for these applications (Andújar et al., 2018).
Integrative Molecular (Metabarcoding) and Morphological (Microscopic) Analysis
This study reports the results of comparative molecular (COI metabarcode sequence numbers) and mophological (EcoMon database records for microscopic counts) analysis of six taxonomic groups of marine zooplankton for which both types of data are available (Supplementary Tables S1, S2). Five of the 6 groups showed significant correlations between COI sequence numbers and morphological counts: Calanoida, Cyclopoida, Eucarida, Gastropoda, and Chaetognatha, but not Hydrozoa (Figure 3). These results provide further evidence of accurate quantitative measurements for some – but not all – taxonomic groups of zooplankton in some – but likely not all – circumstances.
The Shannon Diversity Index (H) based on COI metabarcoding revealed interannual variation for each region, including changes between 2002-2005 and 2007-2011 in the GoM for H index values for 6 taxonomic groups (Figure 6) and 23 species (Figure 9). The changes in some cases were consistent with variation of H index values based on EcoMon morphological counts (Figure 6) and with time-series records of total zooplankton displacement volume in the GoM (O’Brien et al., 2013; Figure 2). This finding provides further support for the potential value of COI metabarcoding for revealing and analyzing time-series variation of the zooplankton assemblage and monitoring of ocean ecosystems.
Another positive result, in terms of potential applications of metabarcoding for monitoring of pelagic ecosystems, is the power of COI metabarcoding for detection of species across a number of diverse taxonomic groups of the marine zooplankton assemblage. In this study, a total of 181 species across 23 taxonomic groups were identified based on comparison with the MetaZooGene Database (https://metazoogene.org/MZGdb; Supplementary Table S3). These numbers are similar to the numbers of species in EcoMon Survey records, which list 186 zooplankton species across 14 taxonomic groups of metazoan zooplankton detected in NEFSC records since 1977 (NMFS/NEFSC, 2019). However, there is marked lack of overlap in the species detected: only 53 species were found in common between the lists for COI sequences and EcoMon counts. A total of 24 species were detected by both metabarcoding and morphology, considering only species with more frequent observations (including 67 species of 15 groups with > 50 COI sequences and 43 species of 9 groups with >1% frequency of occurrence in EcoMon Survey samples since 1977).
Additional analysis and intercomparison of results from metabarcoding and microscopic counts of the same samples are needed to evaluate and understand both the similarities in total numbers and limited overlap in species identified. One concern is the significant challenges of accurate identification of congeneric and closely-related species of zooplankton based on morphological characters. The discrimination and identification of morphologically cryptic species is a particular power of COI barcoding and metabarcoding (Bucklin et al., 2016; Leray and Knowlton, 2017). In this study, COI metabarcodes detected multiple species of several taxonomically-challenging copepod genera for which species are frequently over-looked or ignored – and rarely counted – in morphological taxonomic analysis, including EcoMon Survey data (NMFS/NEFSC, 2019). Four species of Calanus were detected: C. finmarchicus and C. hyperboreus predominated (Table 2); a few sequences were identified to C. helgolandicus in the 2012 GB sample and to C. glacialis in the 2002 GB and 2005 GoM samples. Seven species of Clausocalanus were detected: C. pergens was most abundant, but C. furcatus, C. jobei, C. lividus, C. mastigophorus, C. parapergens, and C. paululus were detected with small numbers of sequences in several stations; also noteworthy was the detection of four species of Pseudocalanus, including P. acuspes and P. minutus, as well as the cryptic species, P. moultoni and P. newmani (Supplementary Table S3). COI sequence totals across all four Pseudocalanus species were significantly correlated to morphological counts for Pseudocalanus spp. in EcoMon records (Figure 10). Congeneric, sibling, and cryptic species of these copepod genera can be difficult to discriminate morphologically (Hill et al., 2001; Bucklin et al., 2003; Bucklin and Frost, 2009; Crouch et al., 2020), yet species-specific patterns of distribution and abundance are important indicators of seasonal-to-decadal patterns of environmental variation, climate change, and regime shifts (Johnson et al., 2011; Greene et al., 2013; Conversi et al., 2015; Morse et al., 2017).
Further evidence of the usefulness of COI metabarcoding for monitoring of ocean ecosystems is the finding of significant correlations between COI sequence numbers and EcoMon microscopic counts for abundant species for which both types of data are available (Figure 10). The accuracy and reliability of metabarcoding for (semi)quantitative analysis, including abundance or biomass, of zooplankton has been evaluated in previous studies (Elbrecht and Leese, 2015; Thomas et al., 2016; Bucklin et al., 2019). A consistent finding has been that quantitative estimates are more accurate for highly abundant taxonomic groups or species (e.g., Matthews et al., 2021).
An acknowledged limitation of COI metabarcoding of zooplankton diversity is the uneven detection of species across the broad span of taxonomic groups in the pelagic assemblage (Deagle et al., 2014; Clarke et al., 2017; Hajibabaei et al., 2019). Various solutions have been proposed, including using multiple COI sub-regions, with specially-designed primers for target groups (Leray et al., 2013; Corell and Rodríguez-Ezpeleta, 2014; Elbrecht and Leese, 2017; Elbrecht et al., 2019) and integrative multi-region sequence analysis and bioinformatics (Antich et al., 2021; Creedy et al., 2021). Most importantly, classification and identification of species based on COI metabarcodes requires a taxonomically-complete and geographically-appropriate reference sequence database (Leray and Knowlton, 2017; Singh et al., 2021). Continued effort is needed to allow and ensure progress toward inclusion of COI barcode sequences for all zooplankton species, including sibling and cryptic species, recorded from regions throughout the global ocean (Bucklin et al., 2021b).
Comparative Assessment of Metabarcoding Using COI versus V9 18S rRNA
Marine zooplankton diversity and distribution have been examined using metabarcoding based on a number of different gene regions (Bucklin et al., 2016). A previous study (Bucklin et al., 2019) analyzed the V9 hypervariable region of 18S r RNA for the same set of samples from the NEFSC EcoMon Surveys, providing an opportunity to compare and contrast the results and conclusions based on the two marker gene regions. The 18S r RNA “tree of life” gene occurs in all living organisms on Earth; the gene sequence is both universal and highly conserved, ensuring detection across all major groups of metazoan zooplankton (Amaral-Zettler et al., 2009).
A total of 21 taxonomic groups of zooplankton, ranging from phylum to order, were detected and classified based on V9 metabarcoding of EcoMon samples (Bucklin et al., 2019; Supplementary Table S1). Statistical comparison of sequence numbers and abundance counts for these same groups revealed similar patterns of temporal (among years) and spatial (among regions) variation based on 27 samples collected during EcoMon Surveys from 2002-2012. Functional regression analysis for 7 taxonomic groups revealed positive correlations between V9 sequence numbers and abundance counts, with significant correlations (p < 0.05) for 3 groups: Calanoida, Chaetognatha, and Gastropoda. Comparison between the results from V9 and COI metabarcoding analysis of the same set of EcoMon samples demonstrates the power and accuracy of species-level identifications of marine zooplankton.
Conclusions
Zooplankton are key components of ocean ecosystems that provide early indicators of the impacts of seasonal-to-decadal patterns of environmental variation, including climate-driven regime shifts. Ecosystem monitoring and fisheries assessment programs provide invaluable time-series records of biodiversity of the zooplankton assemblage, based primarily on morphological taxonomic examination of plankton net samples. Analysis of these samples by DNA metabarcoding using a short region of the cytochrome oxidase I (COI) barcode gene allowed rapid and cost-effective characterization of biodiversity, including discrimination and identification of the 100s of species across numerous taxonomic groups that comprises the zooplankton assemblage. This study used COI metabarcoding of zooplankton diversity in samples collected from three regions (Mid-Atlantic Bight, Georges Bank, and Gulf of Maine) of the NW Atlantic continental shelf during 2002 – 2012 by the NOAA NMFS NEFSC Ecosystem Monitoring Program. Results show significant correlation between metabarcoding (COI sequence numbers) and morphological (microscopic counts) for abundant taxonomic groups and species, confirming the power of metabarcoding for (semi)quantitative measurements. COI metabarcoding also identified a number of sibling and cryptic species of copepods that were not discriminated in morphological counts. Limitations of the approach included failure to detect species within all taxonomic groups of zooplankton. Future development of COI metabarcoding for ecosystem monitoring of zooplankton diversity will require continued improvements in molecular protocols (e.g., COI primer design), completion of COI reference databases for species identification, and training of morphological taxonomic experts for marine zooplankton.
Data Availability Statement
The datasets presented in this study can be found in online repositories of the NCBI GenBank SRA and are publicly available: BioProject PRJNA803165, Accession Numbers SAMN25654816–SAMN25654853.
Author Contributions
Designed research, AB, PB-L, JQ, and PW. Performed research, PB-L, JQ, NC, and TO’B. Analyzed data, PB-L, JQ, PW, and DR. Wrote the paper, AB, DR, and PW. All authors agree to be accountable for the content of the work. All authors contributed to the article and approved the submitted version.
Funding
This publication resulted in part from support provided by the Scientific Committee on Oceanic Research (SCOR). Funds were also contributed by the U.S. National Science Foundation (Grant OCE-1840868) and by national SCOR committees.
Conflict of Interest
The authors declare that the research was conducted in the absence of any commercial or financial relationships that could be construed as a potential conflict of interest.
Publisher’s Note
All claims expressed in this article are solely those of the authors and do not necessarily represent those of their affiliated organizations, or those of the publisher, the editors and the reviewers. Any product that may be evaluated in this article, or claim that may be made by its manufacturer, is not guaranteed or endorsed by the publisher.
Acknowledgments
This study examined samples and data provided by the NOAA Northeast Fisheries Science Center, which oversees the Ecosystem Monitoring (EcoMon) Program of NW Atlantic continental shelf. We gratefully acknowledge the efforts of NEFSC managers, staff, and shipboard scientists and crew, with our special appreciation to Jon Hare and Jerry Prezioso (NOAA NEFSC, Narragansett, RI, USA). We thank Leocadio Blanco-Bercial (Bermuda Institute for Ocean Science, Bermuda) for providing advice and comments on the manuscript. Expert technical and bioinformatics advice and assistance was provided by professional staff at the Institute for Systems Genomics, University of Connecticut (Storrs, CT, USA), including Bo Reese and Lu Li at the UConn Center for Genome Innovation (CGI) and Vijender Singh and Jill L. Wegrzyn at the UConn Computational Biology Core (CBC).
This publication is a contribution from the Scientific Committee on Oceanic Research (SCOR) Working Group 157, MetaZooGene: Toward a new global view of marine zooplankton biodiversity based on DNA metabarcoding and reference DNA sequence databases (https://metazoogene.org/ and https://scor-int.org/group/157/). The authors acknowledge contributions from the Working Group on Integrated Morphological and Molecular Taxonomy (WGIMT) and the Working Group for Zooplankton Ecology (WGZE) of the International Council for the Exploration of the Sea (ICES).
Supplementary Material
The Supplementary Material for this article can be found online at: https://www.frontiersin.org/articles/10.3389/fmars.2022.867893/full#supplementary-material
Supplementary Table 1 | COI sequence numbers for EcoMon samples for 17 taxonomic groups of marine zooplankton.
Supplementary Table 2 | EcoMon morphological (microscopic) counts for 17 taxonomic groups of marine zooplankton for samples collected at the same stations for which samples were analyzed by metabarcoding.
Supplementary Table 3 | COI sequence numbers for species detected in any sample analyzed by metabarcoding (see for collection information). Species are listed by taxonomic group; samples are organized by region. Asterisks (*) indicate species that were detected by morphological (microscopic) analysis of the same set of EcoMon Survey samples (except DE0305-38 and DE1105-127, for which counts are not available).
Supplementary Table 4 | COI Amplicon Sequence Variants (ASVs) for species detected by COI metabarcoding for which >50 sequences were observed for the samples analyzed. Species are listed by taxonomic group; samples are organized by region. Asterisks (*) indicate species that were detected by morphological (microscopic) analysis of the same set of EcoMon Survey samples (except DE0305-38 and DE1105-127, for which counts are not available).
References
Amaral-Zettler L. A., McCliment P., Ducklow H. W., Huss S. M. (2009). A Method for Studying Protistan Diversity Using Massively Parallel Sequencing of V9 Hypervariable Regions of Small-Subunit Ribosomal RNA Genes PLoS One 4, e6372. doi: 10.1371/journal.pone.0006372
Andujar C., Arribas P., Yu D. W., Vogler A. P., Emerson B. C. (2018). Why the COI Barcode Should be the Community DNA Metabarcode for the Metazoa? Molec. Ecol. 27, 3968–3975. doi: 10.1111/mec.14844
Antich A., Palacin C., Wangensteen O. S., Turon X. (2021). To Denoise or to Cluster, That is Not the Question: Optimizing Pipelines for COI Metabarcoding and Metaphylogeography. BMC Bioinf. 22, 177. doi: 10.1186/s12859-021-04115-6
Aylagas E., Borja Á., Muxika I., Rodríguez-Ezpeleta N. (2018). Adapting Metabarcoding-Based Benthic Biomonitoring Into Routine Marine Ecological Status Assessment Networks. Ecol. Indic. 95, 194–202. doi: 10.1016/j.ecolind.2018.07.044
Bi H., Ji R., Liu H., Jo Y. H., Hare J. A. (2014). Decadal Changes in Zooplankton of the Northeast U.S. Continental Shelf. PloS One 9, e87720. doi: 10.1371/journal.pone.0087720
Blanco-Bercial L. (2020). Metabarcoding Analyses and Seasonality of the Zooplankton Community at BATS. Front. Mar. Sci. 7. doi: 10.3389/fmars.2020.00173
Borja A. (2014). Grand Challenges in Marine Ecosystems Ecology. Front. Mar. Sci. 1, 1. doi: 10.3389/fmars.2014.00001
Bourlat S. J., Borja A., Gilbert J., Taylor M. I., Davies N., Weisberg S. B., et al. (2013). Genomics in Marine Monitoring: New Opportunities for Assessing Marine Health Status. Mar. Pollution Bull. 74, 19–31. doi: 10.1016/j.marpolbul.2013.05.042
Brandão M. C., Comtet T., Pouline P., Cailliau C., Blanchet-Aurigny A., Sourisseau M., et al. (2021). Oceanographic Structure and Temporal Variations Contribute to High Heterogeneity in Mesozooplankton Over Small Spatial Scales. ICES J. Mar. Sci. 78, 3288–3302. doi: 10.1093/icesjms/fsab127
Bray J. R., Curtis J. T. (1957). An Ordination of Upland Forest Communities of Southern Wisconsin. Ecol. Monogr. 27, 325–349. doi: 10.2307/1942268
Brown E. A., Chain F. J. J., Crease T. J., MacIsaac H. J., Cristescu M. E. (2015). Divergence Thresholds and Divergent Biodiversity Estimates: Can Metabarcoding Reliably Describe Zooplankton Communities? Ecol. Evol. 5, 2234–2251. doi: 10.1002/ece3.1485
Bucklin A., Frost B. W. (2009). Morphological and Molecular Phylogenetic Analysis of Evolutionary Lineages Within Clausocalanus (Crustacea, Copepoda, Calanoida). J. Crustacean Biol. 29, 111–120. doi: 10.1651/07-2879.1
Bucklin A., Frost B. W., Bradford Grieve J., Allen L. D., Copley N. J. (2003). Molecular Systematic Assessment of Thirty-Four Calanoid Copepod Species of the Calanidae and Clausocalanidae Using DNA Sequences of mtCOI and Nuclear 18S rRNA. Mar. Biol. 142, 333–343. doi: 10.1007/s00227-002-0943-1
Bucklin A., Lindeque P. K., Rodriguez-Ezpeleta N., Albaina A., Lehtiniemi M. (2016). Metabarcoding of Marine Zooplankton: Progress, Prospects and Pitfalls. J. Plankton Res. 38, 393–400. doi: 10.1093/plankt/fbw023
Bucklin A., Nishida S., Schnack-Schiel S., Wiebe P. H., Lindsay D., Machida R. J., et al. (2010). “A Census of Zooplankton of the Global Ocean,” in Marine Life: Diversity, Distribution, and Abundance. Ed. McIntyre A. (Oxford, UK: Wiley-Blackwell), 247–265.
Bucklin A., Peijnenburg K. T. C. A., Kosobokova K. N., Machida R. J. (2021a). New Insights Into Biodiversity, Biogeography, Ecology, and Evolution of Marine Zooplankton Based on Molecular Approaches. ICES J. Mar. Sci. 78, 3281–3287. doi: 10.1093/icesjms/fsab198
Bucklin A., Peijnenburg K. T. C. A., Kosobokova K. N., O’Brien T. D., Blanco-Bercial L., Cornils A., et al. (2021b). Toward a Global Reference Database of COI Barcodes for Marine Zooplankton. Mar. Biol. 168, 78. doi: 10.1007/s00227-021-03887-y
Bucklin A., Steinke D., Blanco-Bercial L. (2011). DNA Barcoding of Marine Metazoa. Ann. Rev. Mar. Sci. 3, 471–508. doi: 10.1146/annurev-marine-120308-080950
Bucklin A., Yeh H. D., Questel J. M., Richardson D. E., Reese B., Copley N. J., et al. (2019). Time-Series Metabarcoding Analysis of Zooplankton Diversity of the NW Atlantic Continental Shelf. ICES J. Mar. Sci. 76, 1162–1176. doi: 10.1093/icesjms/fsz021
Byron C. J., Link J. S. (2010). Stability in the Feeding Ecology of Four Demersal Fish Predators in the US Northeast Shelf Large Marine Ecosystem. Mar. Ecol. Progr. Ser. 406, 239–250. doi: 10.3354/meps08570
Clarke L. J., Beard J. M., Swadling K. M., Deagle B. E. (2017). Effect of Marker Choice and Thermal Cycling Protocol on Zooplankton DNA Metabarcoding Studies. Ecol. Evol. 7, 873–883. doi: 10.1002/ece3.2667
Conversi A., Dakos V., Gardmark A., Ling S., Folke C., Mumby P. J., et al. (2015). A Holistic View of Marine Regime Shifts. Phil. Trans. R. Soc B. 370, 20130279. doi: 10.1098/rstb.2013.0279
Corell J., Rodríguez-Ezpeleta N. (2014). Tuning of Protocols and Marker Selection to Evaluate the Diversity of Zooplankton Using Metabarcoding. Rev. Invest. Mar. AZTI-Tec. 21, 19–39.
Cox J., Wiebe P. H. (1979). Origins of Oceanic Plankton in the Middle Atlantic Bight. Est. Coast. Mar. Sci. 9, 509–527. doi: 10.1016/0302-3524(79)90076-8
Creedy T., Andujar C., Meramveliotakis E., Noguerales V., Overcast I., Papadopoulou A., et al. (2021). Coming of Age for COI Metabarcoding of Whole Organism Community DNA: Towards Bioinformatic Harmonisation. Authorea. Molec. Ecol. Res. 22, 847–861. doi: 10.22541/au.162141276.61766048/v2
Crouch K. E., Blanco-Bercial L., Richardson D. E., Copley N. J., Wiebe P. H., Bucklin A. (2020). Species-Specific Patterns of Distribution and Abundance of the Cryptic Copepods Pseudocalanus Moultoni and P. Newmani on Georges Bank (NW Atlantic Ocean) During Spring 1995–2012. Cont. Shelf Res. 208, 104242. doi: 10.1016/j.csr.2020.104242
Deagle B. E., Clarke L. J., Kitchener J. A., Polanowski A. M., Davidson A. T. (2017). Genetic Monitoring of Open Ocean Biodiversity: An Evaluation of DNA Metabarcoding for Processing Continuous Plankton Recorder Samples. Molec. Ecol. Res. 2017, 1–16. doi: 10.1111/1755-0998.12740
Deagle B. E., Jarman S. N., Coissac E., Pompanon F., Taberlet P. (2014). DNA Metabarcoding and the Cytochrome C Oxidase Subunit I Marker: Not a Perfect Match. Biol. Lett. 10, 20140562. doi: 10.1098/rsbl.2014.0562
Djurhuus A., Pitz K., Sawaya N. A., Rojas-Márquez J., Michaud B., Montes E., et al. (2018). Evaluation of Marine Zooplankton Community Structure Through Environmental DNA Metabarcoding. Limnol. Oceanogr. Meth. 16, 209–221. doi: 10.1002/lom3.10237
Edgar R. C., Flyvbjerg H. (2015). Error Filtering, Pair Assembly and Error Correction for Next-Generation Sequencing Reads. Bioinf 31, 3476–3482. doi: 10.1093/bioinformatics/btv401
Elbrecht V., Braukmann T. W. A., Ivanova N. V., Prosser S. W. J., Hajibabaei M., Wright M., et al. (2019). Validation of COI Metabarcoding Primers for Terrestrial Arthropods. PeerJ 7, e7745. doi: 10.7717/peerj.7745
Elbrecht V., Leese F. (2015). Can DNA-Based Ecosystem Assessments Quantify Species Abundance? Testing Primer Bias and Biomass—Sequence Relationships With an Innovative Metabarcoding Protocol. PloS One 10, e0130324. doi: 10.1371/journal.pone.0130324
Elbrecht V., Leese F. (2017). Validation and Development of Freshwater Invertebrate Metabarcoding COI Primers for Environmental Impact Assessment. Front. Envi. Sci. 5, 11. doi: 10.7287/peerj.preprints.2044v4
Friedland K. D., McManus M. C., Morse R. E., Link J. S. (2019). Event Scale and Persistent Drivers of Fish and Macroinvertebrate Distributions on the Northeast US Shelf. ICES J. Mar. Sci. 76, 1316–1334. doi: 10.1093/icesjms/fsy167
Friedland K. D., Morse R. E., Shackell N., Tam J. C., Morano J. L., Moisan J. R., et al. (2020). Changing Physical Conditions and Lower and Upper Trophic Level Responses on the US Northeast Shelf. Front. Mar. Sci. 7. doi: 10.3389/fmars.2020.567445
Gamfeldt L., Lefcheck J. S., Byrnes J. E. K., Cardinale B. J., Duffy E., Griffin J. N. (2015). Marine Biodiversity and Ecosystem Functioning: What’s Known and What’s Next? Oikos 124, 252–265. doi: 10.1111/oik.01549
Geller J. B., Meyer C. P., Parker M., Hawk H. (2013). Redesign of PCR Primers for Mitochondrial Cytochrome C. Oxidase Subunit I for Marine Invertebrates and Application in All-Taxa Biotic Surveys. Molec. Ecol. Res. 13, 851–861. doi: 10.1111/1755-0998.12138
Giebner H., Langen K., Bourlat S. J., Kukowka S., Mayer C., Astrin J. J., et al. (2020). Comparing Diversity Levels in Environmental Samples: DNA Sequence Capture and Metabarcoding Approaches Using 18S and COI Genes. Molec. Ecol. Res. 20, 1333–1345. doi: 10.1111/1755-0998.13201
Goodwin K. D., Thompson L. R., Duarte B., Kahlke T., Thompson A. R., Marques J. C., et al. (2017). DNA Sequencing as a Tool to Monitor Marine Ecological Status. Front. Mar. Sci. 4, 107. doi: 10.3389/fmars.2017.00107
Govindarajan A. F., Francolini R. D., Jech J. M., Lavery A. C., Llopiz J. K., Wiebe P. H., et al. (2021). Exploring the Use of Environmental DNA (eDNA) to Detect Animal Taxa in the Mesopelagic Zone. Front. Ecol. Evol. 9. doi: 10.3389/fevo.2021.574877
Greene C. H., Meyer-Gutbrod E., Monger B. C., McGarry L. P., Pershing A. J., Belkin I. M., et al. (2013). Remote Climate Forcing of Decadal-Scale Regime Shifts in Northwest Atlantic Shelf Ecosystems. Limnol. Oceanogr. 53, 803–816. doi: 10.4319/lo.2013.58.3.0803
Hajibabaei M., Porter T. M., Wright M., Rudar J. (2019). COI Metabarcoding Primer Choice Affects Richness and Recovery of Indicator Taxa in Freshwater Systems. PloS One 14, e0220953. doi: 10.1371/journal.pone.0220953
Hare J. A., Kane J. (2012). “Zooplankton of the Gulf of Maine—A Changing Perspective,” in Advancing an Ecosystem Approach in the Gulf of Maine. Eds. Stephenson R., Annala J., Runge J., Hall-Arber M., 115–137. American Fisheries Society, Bethesda, MD, USA.
Head E. J. H., Sameoto D. D. (2007). Inter-Decadal Variability in Zooplankton and Phytoplankton Abundance on the Newfoundland and Scotian Shelves. Deep-Sea Res. II 54, 2686–2701. doi: 10.1016/j.dsr2.2007.08.003
Hill R. S., Allen L. D., Bucklin A. (2001). Multiplexed Species-Specific PCR Protocol to Discriminate Four N. Atlantic Calanus Species, With a mtCOI Gene Tree for Ten Calanus Species. Mar. Biol. 139, 279–287. doi: 10.1007/s002270100548
Ji Y., Ashton L., Pedley S. M., Edwards D. P., Tang Y., Nakamura, et al. (2013). Reliable, Verifiable and Efficient Monitoring of Biodiversity via Metabarcoding. Ecol. Lett. 16, 1245–1257. doi: 10.1111/ele.12162
Johnson C. L., Runge J. A., Curtis K. A., Durbin E. G., Hare J. A., Incze L. S., et al. (2011). Biodiversity and Ecosystem Function in the Gulf of Maine: Pattern and Role of Zooplankton and Pelagic Nekton. PloS One 6, e16491. doi: 10.1371/journal.pone.0016491
Jones D. L. (2017). Fathom Toolbox for MATLAB: Software for Multivariate Ecological and Oceanographic Data Analysis (St. Petersburg, FL, USA: College of Marine Science, University of South Florida). Available at: https://www.usf.edu/marine-science/research/matlab-resources/index.aspx/.
Kane J. (2007). Zooplankton Abundance Trends on Georges Ban-2004. ICES J. Mar. Sci. 64, 909–919. doi: 10.1093/icesjms/fsm066
Kane J. (2011). Inter-Decadal Variability of Zooplankton Abundance in the Middle Atlantic Bight. J. NW Atl. Fish. Sci. 43, 81–92. doi: 10.2960/J.v43.m674
Kelly R. P. (2016). Making Environmental DNA Count. Molec. Ecol. Res. 16, 10–12. doi: 10.1111/1755-0998.12455
Kelly T. B., Davison P. C., Goericke R., Landry M. R., Ohman M. D., Stukel M. R. (2019). The Importance of Mesozooplankton Diel Vertical Migration for Sustaining a Mesopelagic Food Web. Front. Mar. Sci. 6, 1–18. doi: 10.3389/fmars.2019.00508
Kelly R. P., Port J. A., Yamahara K. M., Martone R. G., Lowell N., Thomsen P. F., et al. (2014). Harnessing DNA to Improve Environmental Management. Science 344, 1455–1456. doi: 10.1126/science.1251156
Lamb P. D., Hunter E., Pinnegar J. K., Creer S., Davies R. G., Taylor M. I. (2018). How Quantitative is Metabarcoding: A Meta-Analytical Approach. Molec. Ecol. 28, 420–430. doi: 10.1111/mec.14920
Leray M., Knowlton N. (2017). Random Sampling Causes the Low Reproducibility of Rare Eukaryotic OTUs in Illumina COI Metabarcoding. PeerJ 5, e3006. doi: 10.7717/peerj.3006
Leray M., Yang J. Y., Meyer C. P., Mills S. C., Agudelo N., Ranwez V., et al. (2013). A New Versatile Primer Set Targeting a Short Fragment of the Mitochondrial COI Region for Metabarcoding Metazoan Diversity: Application for Characterizing Coral Reef Fish Gut Contents. Front. Zool. 10, 1. doi: 10.1186/1742-9994-10-34
Matthews S. A., Goetze E., Ohman M. D. (2021). Recommendations for Interpreting Zooplankton Metabarcoding and Integrating Molecular Methods With Morphological Analyses. ICES J. Mar. Sci. 78, 3387–3396. doi: 10.1093/icesjms/fsab107
McCune G., Grace J. B., Urban D. L. (2002). Analysis of Ecological Communities (Oregon: Gleneden Beach: MjM Sofware Design).
Mohrbeck I., Raupach M. J., Martínez Arbizu P., Knebelsberger T., Laakmann S. (2015). High Throughput Sequencing - The Key to Rapid Biodiversity Assessment of Marine Metazoa? PloS One 10, e0140342. doi: 10.1371/journal.pone.0140342
Morse R. E., Friedland K. D., Tommasi D., Stock C., Nye J. (2017). Distinct Zooplankton Regime Shift Patterns Across Ecoregions of the U.S. Northeast Continental Shelf Large Marine Ecosystem. J. Mar. Syst. 165, 77–91. doi: 10.1016/j.jmarsys.2016.09.011
Northeast Fisheries Science Center, NMFS/NEFSC (2019) Zooplankton and Ichthyoplankton Abundance and Distribution in the North Atlantic Collected by the Ecosystem Monitoring (EcoMon) Project From 1977-02-13 to 2017-11-16 (NCEI Accession 0187513). Available at: https://www.ncei.noaa.gov/archive/accession/0187513 (Accessed May 17, 2021).
O’Brien T. D., Wiebe P. H., Falkenhaug T. (2013). “ICES Zooplankton Status Report 2010/2011,” in ICES Coop. Res. Reports, International Council for the Exploration of the Sea. Copenhagen, Denmark vol. 318, 1–208.
Pappalardo P., Collins A. G., Pagenkopp Lohan K. M., Hanson K. M., Truskey S. B., Jaeckle W., et al. (2021). The Role of Taxonomic Expertise in Interpretation of Metabarcoding Studies. ICES J. Mar. Sci. 78, 3397–3410. doi: 10.1093/icesjms/fsab082
Pershing A. J., Greene C. H., Jossi J. W., O'Brien L., Brodziak J. K. T., Bailey B. A. (2005). Interdecadal Variability in the Gulf of Maine Zooplankton Community, With Potential Impacts on Fish Recruitment. ICES J. Mar. Sci. 62, 1511–1523. doi: 10.1016/j.icesjms.2005.04.025
Pitz K. J., Guo J., Johnson S. B., Campbell T. L., Zhang H., Vrijenhoek R. C., et al. (2020). Zooplankton Biogeographic Boundaries in the California Current System as Determined From Metabarcoding. PloS One 15, e0235159. doi: 10.1371/journal.pone.0235159
Porter T. M., Hajibabaei M. (2018). Over 2.5 Million COI Sequences in GenBank and Growing. PloS One 13 (9), e0200177. doi: 10.1371/journal.pone.0200177
Questel J. M., Hopcroft R. R., DeHart H. M., Kosobokova K., Smoot C., Bucklin A. (2021). Metabarcoding Analysis of Zooplankton Biodiversity of the Pacific-Arctic Chukchi Borderlands Region. Mar. Biodiv. 51, 4. doi: 10.1007/s12526-020-01136-x
Record N. R., Pershing A. J., Jossi J. W. (2010). Biodiversity as a Dynamic Variable in the Gulf of Maine Continuous Plankton Recorder Transect. J. Plankton Res. 32, 1675–1684. doi: 10.1093/plankt/fbq050
Richardson D. E., Hare J. A., Overholtz W. J., Johnson D. L. (2010). Development of Long-Term Larval Indices for Atlantic Herring (Clupea Harengus) on the Northeast US Continental Shelf. ICES J. Mar. Sci. 67, 617–627. doi: 10.1093/icesjms/fsp276
Ricker W. E. (1973). Linear Regressions in Fishery Research. J. Fish. Res. Bd. Canada 30, 409–434. doi: 10.1139/f73-072
Rognes T., Flouri T., Nichols B., Quince C., Mahé F. (2016). VSEARCH: A Versatile Open Source Tool for Metagenomics. PeerJ 4, e2584. doi: 10.7717/peerj.2584
Schloss P. D., Westcott S. L., Ryabin T., Hall J. R., Hartmann M., Hollister E. B., et al. (2009). Introducing Mothur: Open-Source, Platform-Independent, Community-Supported Software for Describing and Comparing Microbial Communities. Appl. Envi. Microbiol. 75, 7537–7541. doi: 10.1128/AEM.01541-09
Schroeder A., Pallavicini A., Edomi P., Pansera M., Camatti E. (2021). Suitability of a Dual COI Marker for Marine Zooplankton DNA Metabarcoding. Mar. Envi. Res. 170, 105444. doi: 10.1016/j.marenvres.2021.105444
Sherman K., Duda A. M. (1999). Large Marine Ecosystems: An Emerging Paradigm for Fishery Sustainability. Fisheries 24, 15–26. doi: 10.1577/1548-8446(1999)024<0015:LME>2.0.CO;2
Sherman K., Kane J., Murawski S., Overholtz W., Solow A. (2002). “The U.S. Northeast Shelf Large Marine Ecosystem: Zooplankton Trends in Fish Biomass Recovery,” in Large Marine Ecosystems. Eds. Sherman K., Skjoldal H. R. (Elsevier Publishers, Cambridge, MAssachusetts, USA), 195–215.
Singh S. P., Groeneveld J. C., Huggett J., Naidoo D., Cedras R., Willows-Munro S. (2021). Metabarcoding of Marine Zooplankton in South Africa, African J. Mar. Sci. 43 (2), 147–159. doi: 10.2989/1814232X.2021.1919759
Stefanni S., Stanković D., Borme D., de Olazabal A., Juretić A., Pallavicini A., et al. (2018). Multi-Marker Metabarcoding Approach to Study Mesozooplankton at Basin Scale. Sci. Rep. 8, 12085. doi: 10.1038/s41598-018-30157-7
Steinke D., deWaard S. L., Sones J. E., Ivanova N. V., Prosser S. W. J., Perez K., et al. (2021). Message in a Bottle – Metabarcoding Enables Biodiversity Comparisons Across Ecoregions. bioRxiv 5, e59201. doi: 10.1101/2021.07.05.451165
Stern R., Kraberg A., Bresnan E., Kooistra W. H. C. F., Lovejoy C., Montresor M., et al. (2018). Molecular Analyses of Protists in Long-Term Observation Programmes - Current Status and Future Perspectives. J. Plankton Res. 40, 519–536. doi: 10.1093/plankt/fby035
Thomas A. C., Deagle B. E., Eveson J. P., Harsch C. H., Trites A. W. (2016). Quantitative DNA Metabarcoding: Improved Estimates of Species Proportional Biomass Using Correction Factors Derived From Control Material. Molec. Ecol. Res. 16, 714–726. doi: 10.1111/1755-0998.12490
Walsh H. J., Richardson D. E., Marancik K. E., Hare J. A. (2015). Long-Term Changes in the Distributions of Larval and Adult Fish in the Northeast U.S. Shelf Ecosystem. PloS One 10, e0137382. doi: 10.1371/journal.pone.0137382
Wang Q., Garrity G. M., Tiedje J. M., Cole J. R. (2007). Naive Bayesian Classifier for Rapid Assignment of rRNA Sequences Into the New Bacterial Taxonomy. Appl. Environ. Microbiol. 73, 5261–5267. doi: 10.1128/AEM.00062-07
Wiebe P. H., Rudels B., Cadrin S. X., Drinkwater K. F., Lavin A. (2012). Introduction to Variability of the North Atlantic and its Marine Ecosystem–2009; Proceedings of an ICES/NAFO Symposium Held in Santander, Spain (10–12 May 2011). ICES J. Mar. Sci. 69, 697–702. doi: 10.1093/icesjms/fss090
Keywords: zooplankton, metabarcoding, cytochrome oxidase I, species diversity, ecosystem monitoring, Northwest Atlantic continental shelf
Citation: Bucklin A, Batta-Lona PG, Questel JM, Wiebe PH, Richardson DE, Copley NJ and O’Brien TD (2022) COI Metabarcoding of Zooplankton Species Diversity for Time-Series Monitoring of the NW Atlantic Continental Shelf. Front. Mar. Sci. 9:867893. doi: 10.3389/fmars.2022.867893
Received: 01 February 2022; Accepted: 25 March 2022;
Published: 22 April 2022.
Edited by:
Xosé Anxelu G. Morán, Spanish Institute of Oceanography, SpainReviewed by:
John Kenneth Pearman, Cawthron Institute, New ZealandMie Hylstofte Sichlau Winding, Greenland Climate Research Centre, Greenland
Copyright © 2022 Bucklin, Batta-Lona, Questel, Wiebe, Richardson, Copley and O’Brien. This is an open-access article distributed under the terms of the Creative Commons Attribution License (CC BY). The use, distribution or reproduction in other forums is permitted, provided the original author(s) and the copyright owner(s) are credited and that the original publication in this journal is cited, in accordance with accepted academic practice. No use, distribution or reproduction is permitted which does not comply with these terms.
*Correspondence: Ann Bucklin, ann.bucklin@uconn.edu