 Zheng Luo
 Yang Yu
 Qian Zhang
 Zhenning Bao1,2
 Jianhai Xiang
 Fuhua Li
- 1CAS and Shandong Province Key Laboratory of Experimental Marine Biology, Institute of Oceanology, Chinese Academy of Sciences, Qingdao, China
- 2University of Chinese Academy of Sciences, Beijing, China
- 3Laboratory for Marine Biology and Biotechnology, Qingdao National Laboratory for Marine Science and Technology, Qingdao, China
- 4Center for Ocean Mega-Science, Chinese Academy of Sciences, Qingdao, China
- 5The Innovation of Seed Design, Chinese Academy of Sciences, Wuhan, China
As an euryhaline commercial species, the Pacific white shrimp Litopenaeus vannamei can be cultured under a wide range of salinities. However, different families showed various tolerance to high salinity. In order to elucidate the underlying mechanisms, a comparative transcriptome approach was used to find the differences between tolerant families and susceptible families at the transcriptional level. There were 98 and 58 differentially expressed genes (DEGs) between tolerant and susceptible families under normal and high-salinity conditions, respectively. The DEGs upregulated in tolerant families were mostly enriched in the biological process of response to a stimulus. Nine crustacyanin (CRCN)-encoding genes in this Gene Ontology (GO) term showed significantly higher expression levels in the tolerant families than those in susceptible families, suggesting that crustacyanins might play important roles in shrimp tolerance to high salinity. After high-salinity treatment, a total of 233 and 109 DEGs were identified from tolerant and susceptible families, respectively. Serine-type endopeptidase activity, serine-type peptidase activity, and serine hydrolase activity were the top three GO terms in the tolerant families after high-salinity treatment. Further analysis illustrated that these three GO terms were also the top three enriched GO terms for the DEGs specifically upregulated in the tolerant families after high-salinity stress. Meanwhile, four genes annotated in serine proteases families in these three GO terms were upregulated in the tolerant families but not changed in the susceptible families after high-salinity stress. These results indicated that serine proteases should play key roles in shrimp tolerance to high salinity. This study provides important information for understanding the mechanism of shrimp tolerance to high-salinity stress and would be useful for further molecular breeding of shrimp varieties with high-salinity tolerance.
Introduction
The Pacific white shrimp Litopenaeus vannamei is one of the most widely cultured and profitable penaeid shrimp species in the world. Due to its fast growth under high density, high resistance to disease, and ability to live under a wide range of salinity (0–40 ppt), its production increased rapidly, which accounts for more than 80% of the output for penaeid shrimp aquaculture in China (Chang et al., 2020). It is now cultured both in inland freshwater areas and in high-salinity coastal areas. However, the survival and growth rates under extremely high-salinity seawater are generally lower than those cultured around optimal salinity seawater (20–25 ppt) (Li et al., 2018; Shen et al., 2020).
Compared with the normal 35 ppt salinity in the ocean, there are many high-salinity seawater bodies in the world. These areas are poorly exploited for aquaculture since no suitable farming species are available. Recently, a good example of taking advantage of high-salinity water for shrimp aquaculture was established in Shandong Province of China. This new practice makes use of the big water surface of solar salt production to culture Pacific white shrimp, which improves the utilization of high-salinity water areas. The salinity of these water bodies ranges from 45 to 60 ppt. Under such high salinity, the shrimp grow slowly, and the survival rate is very low (Chong-Robles et al., 2014). Breeding shrimp varieties with tolerance to high salinity is an optimal way to improve shrimp production in these areas. Based on the fact that different families of shrimp present various abilities to adapt to high-salinity stress, breeding shrimp varieties tolerant to high salinity is an optimal way to improve the utilization of high-salinity water. Understanding the molecular basis of shrimp tolerance to high salinity is regarded as a key step to accelerate the breeding of new shrimp varieties and provides guidance for elucidating the adaptation mechanism of aquatic animals to high-salinity stress.
With the development of high-throughput sequencing (HTS) techniques and decoding of the L. vannamei genome (Zhang et al., 2019), transcriptome sequencing has become an effective approach to discover genes related to economic traits (Yang et al., 2020; Santos et al., 2021). Several transcriptomes were conducted to analyze the genes’ response to salinity change in L. vannamei. The genes related to signal transduction, metabolism, and oxidative pathways were activated after acute low salinity stress (Xu et al., 2015; Gao et al., 2016; Li et al., 2017). It was also reported that long-term high-salinity stress could lead to differential expression of genes related to osmoregulation, ion transport, antioxidation, immune defense, bacterial lysis, and nutrient metabolism in adult L. vannamei (Li et al., 2020; Shen et al., 2020). Since previous studies are mainly focused on the response of shrimp to low or high-salinity stress, the molecular mechanism of shrimp tolerance to high salinity is not well understood yet.
In the present study, comparative transcriptome analysis was performed between tolerant and susceptible shrimp families under normal and high-salinity conditions to elucidate the mechanism of how shrimp tolerate high-salinity stress. This study not only provides important information for understanding the molecular basis of shrimp tolerance to high salinity but also gives guidance for molecular breeding of shrimp varieties tolerant to high salinity.
Materials and Methods
Selection of Tolerant and Susceptible Families
Juveniles from 140 shrimp families were evaluated for their tolerance to high-salinity stress. Briefly, a total of 100 juveniles from each family were raised in separate tanks with seawater at a salinity of 25 ppt. In order to reduce the tank effect during the experiment, all the families were cultured in the same room, and the culturing seawater in each tank was the same. Moreover, the increase of the salinity in each tank was checked every 6 h per day. The salinity of seawater in each tank was raised from 25 to 55 ppt gradually over 3 days by adding seawater with a salinity of 100 ppt. Briefly, the seawater salinity was adjusted 4 times at 6-h intervals each day, and around 2.5 ppt was raised each time. Dead shrimp were collected every 4 h. The final survival rates of these 140 families after high-salinity treatment were calculated and presented in Supplementary Figure 1. Based on the survival rate of each family during high-salinity stress, two families (fam1 and fam2) were chosen as tolerant families (designated as tFam1 and tFam2, respectively), and another two families (fam103 and fam139) were selected as susceptible families (designated as sFam1 and sFam2, respectively). More information about these four families is shown in Table 1. In order to exclude the effects of shrimp size, two paired comparison groups (Groups I and II) were chosen for further experiments and sampling. Group I included tFam1 and sFam1, and Group II included tFam2 and sFam2. Shrimp in each group had similar body lengths but different tolerance.
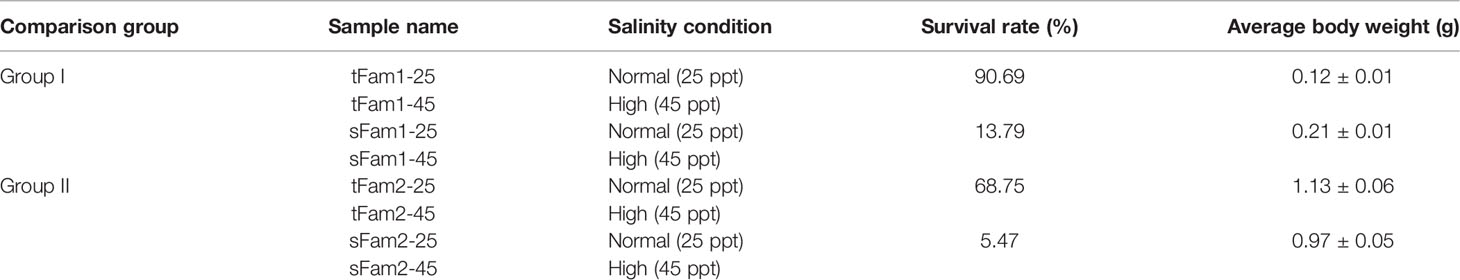
Table 1 Information of four families used for transcriptome sequencing.
Sampling for Transcriptome Sequencing
Another 60 healthy juveniles from above four selected families cultured under normal salinity of 25 ppt were collected and put into four separate tanks. They were kept in seawater with a salinity of 25 ppt at a temperature of 26°C ± 1°C for 12 h before further high-salinity treatment. The cephalothoraces of nine individuals were collected from each family as normal salinity samples. The entire cephalothoraces of three individuals were put together as one sample, and three samples were taken for each family and preserved in liquid nitrogen for further RNA extraction. The samples of tolerant families (tFam1 and tFam2) were named tFam1-25 and tFam2-25, and the samples of susceptible families (sFam1 and sFam2) were named sFam1-25 and sFam2-25. After the above samples were collected, seawater with a salinity of 100 ppt was added into each tank gradually to raise the salinity of seawater to 45 ppt during the next 48 h. The procedure to raise the salinity of seawater was the same as described in Section 2.1. When the salinity of seawater reached 45 ppt, shrimp were collected from each family. The sampling method was the same as described above. The samples were designated as tFam1–45, tFam2–45, sFam1–45, and sFam2–45 and preserved in liquid nitrogen for further use.
RNA Extraction and cDNA Synthesis
Total RNA was extracted using RNAiso reagent (Takara, Maebashi, Japan) following the manufacturer’s protocol. The quality and integrity of RNA were evaluated by electrophoresis on 1% agarose gel. RNA content was quantified by NanoDrop 2000 spectrophotometer (Thermo Fisher Scientific, Waltham, MA, USA). The cDNA was synthesized by PrimeScript™ RT reagent Kit with gDNA Eraser kit (Takara, Japan) following the manufacturer’s protocol.
RNA Sequencing and Data Preprocessing
The mRNA was enriched from the total RNA using Oligo (dT) beads and Ribo-ZeroTM Magnetic Kit (Epicentre, Madison, WI, USA); then the enriched mRNA was fragmented into short fragments, which were reverse transcribed into cDNA. After purification with QiaQuick PCR extraction kit (Qiagen, Venlo, The Netherlands), end reparation, and poly(A) tailing, the cDNA fragments were ligated to Illumina sequencing adapters. The ligation products at suitable sizes were sequenced using Illumina HiSeq2500 by Gene Denovo Biotechnology Co. (Guangzhou, China). The raw reads from the sequencing platform were filtered by fastp (Chen et al., 2018) with the following parameters: Q quality score ≤ 20, reads with undetermined nucleotides larger than 10%, and reads containing adapters. The rRNA-mapped reads were removed, and the remaining reads were mapped to the genome sequence of L. vannamei (http://www.shrimpbase.net/lva.download.html) using Bowtie 2 (Langmead and Salzberg, 2012) and TopHat2.2.4 (Kim et al., 2015). The mapped reads were assembled with StringTie v1.3.1, and the gene expression levels were calculated using the FPKM (Fragments Per Kilobase of transcript per Million mapped reads) method (Pertea et al., 2015; Pertea et al., 2016).
Identification of Differentially Expressed Genes
Differential expression analyses of unigenes were carried out using DESeq2 (Love et al., 2014) software. The differentially expressed genes (DEGs) were selected by the false discovery rate (FDR) <0.05 and the expression fold change (FC) >2 (log2|FC| > 1). Firstly, the transcriptional differences between tolerant and susceptible families were focused on; therefore, the DEGs in comparison groups (Group I and II) under both normal and high salinity were identified. Secondly, the response of shrimp to salinity change at the transcriptional level was analyzed, and the DEGs for each family were analyzed when they were cultured under normal or high-salinity seawater. In order to reduce the false positives, the DEGs with similar expression patterns in two comparison groups or similar tolerance families were selected for further analysis.
Functional Enrichment Analysis of Differentially Expressed Genes
All selected DEGs were used for Gene Ontology (GO) functional analysis and Kyoto Encyclopedia of Genes and Genomes (KEGG) pathway enrichment analysis. Briefly, DEGs were mapped to GO terms in the GO database (http://geneontology.org) and pathways in the KEGG database (http://www.genome.jp/kegg/). Then, significantly enriched GO terms and KEGG pathways were recognized by a hypergeometric test-taking FDR ≤ 0.05 as a threshold.
Quantitative Real-Time PCR Validation
The samples used for qPCR detection were the same as those used for transcriptome sequencing. Four DEGs were quantified with qPCR to validate the transcriptome analysis result. The Primer3plus (http://primer3plus.com/cgi-bin/dev/primer3plus.cgi) was used for the design of gene-specific primers based on their sequences. Primers used for qPCR detection are shown in Supplementary Table 1, and 18S rRNA was used as the reference gene. The qPCR was conducted as follows: denaturation at 94°C for 2 min, 40 cycles of 94°C for 30 s and annealing at temperature 58°C for 20 s, and a final extension of 30 s at 72°C. The melting curve was used to check the specificity of primers, and the relative expression level was calculated with the 2−ΔΔCt method (Livak and Schmittgen, 2001). The two-way ANOVA (factor: salinity and family) was utilized to determine the statistically significant differences between different factors, and a one-way ANOVA was used to reveal the significant differences among different samples. These statistical analyses were performed in R.
Results
Summary of RNA Sequencing Data
A total of 24 RNA-seq libraries were constructed for two tolerant families and two susceptible families cultured under two salinity conditions. All transcriptome sequencing data were uploaded to National Center for Biotechnology Information (NCBI) with the accession number PRJNA799461. The sequencing information was summarized in Supplementary Table 2. After filtering, 99.68%–99.85% of raw reads were taken as clean reads, and 85.82%–89.70% of the clean reads were mapped to the reference genome of L. vannamei (Zhang et al., 2019). A total of 31,753 unigenes were annotated, and each library contained 60.74%–78.57% of total genes.
Differentially Expressed Genes Between Tolerant and Susceptible Families Cultured Under Normal Salinity
A total of 963 DEGs were identified in Group I between tFam1-25 and sFam1-25, while 1,242 DEGs were identified in Group II between tFam2-25 and sFam2-25. In order to reduce the false-positive results caused by the family itself, the DEGs with similar expression patterns within two comparison groups were chosen for further analysis. A total of 98 DEGs presented similar expression profiles in these two groups. Among them, 58 DEGs were upregulated and 40 DEGs were downregulated in two tolerant families (Figure 1A). GO enrichment analysis on these DEGs showed that they were enriched in metabolic process, single-organism process, cellular process and response to a stimulus for the biological process, membrane and membrane part for cellular component, and binding and catalytic activity for molecular function (Figure 1B). Further analysis of the GO terms for the biological process showed that DEGs enriched in response to stimulus were upregulated in tolerant families (Figure 1C). Nine genes encoding crustacyanins were found among these DEGs. In contrast, there were no significant enriched GO terms for DEGs, which were highly expressed in susceptible families (Figure 1D).
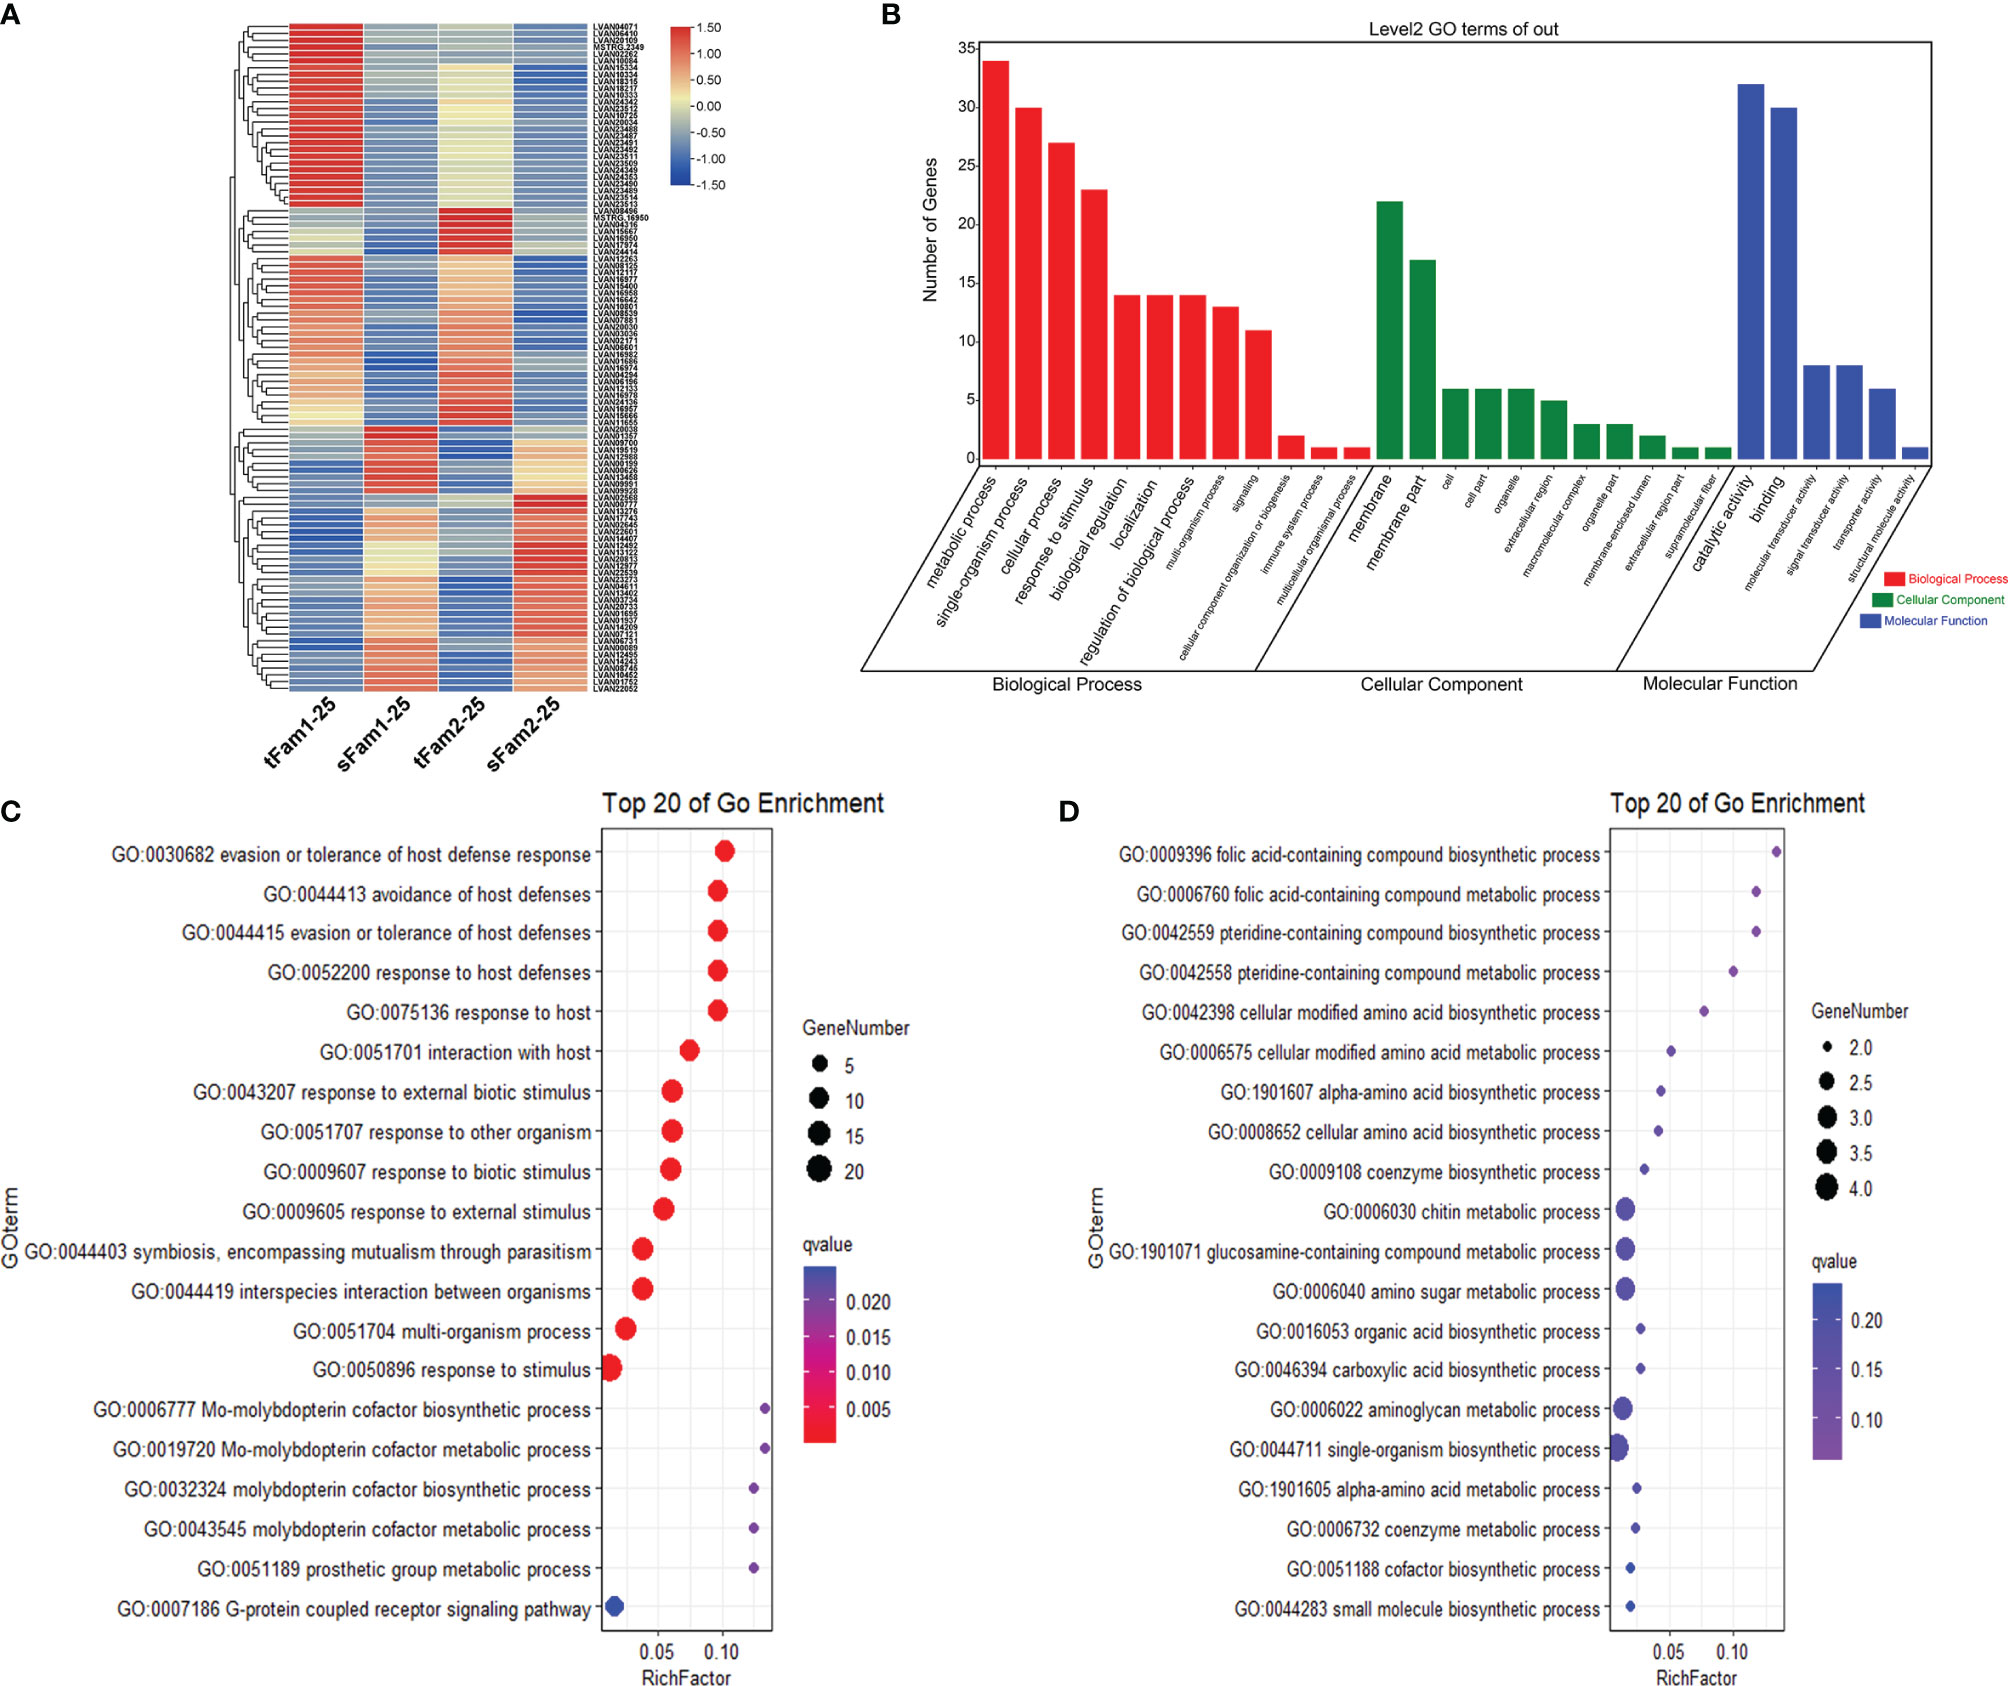
Figure 1 DEGs between high-salinity tolerant families and susceptible families under normal salinity condition in Litopenaeus vannamei. (A) Gene expression heatmap of DEGs. (B) GO enrichment analysis of DEGs. (C) Top 20 GO terms enriched in the categories of biological process for DEGs upregulated in tolerant families, the point color shows different Q values as indicated on the right, and red color represents the significantly enriched GO term (Q < 0.05). (D) Top 20 GO terms enriched in the categories of Biological process for DEGs upregulated in susceptible families; the point color shows different Q values as indicated on the right. DEGs, differentially expressed genes; GO, Gene Ontology.
Differentially Expressed Genes Between Tolerant and Susceptible Families After High-Salinity Treatment
A total of 865 DEGs were identified in the comparison group tFam1-45 and sFam1-45 and 1,660 DEGs in the other comparison group tFam2 and sFam2-45. In order to reduce the false positive caused by the family itself, 56 DEGs with the same expression pattern in the two comparison groups were chosen for further analysis. Among these DEGs, 30 DEGs showed higher expression levels in tolerant families, and 26 DEGs presented higher expressions in susceptible families (Figure 2A). Further analysis of these DEGs showed that metabolic process, cellular process, single-organism process, and response to stimulus were the top four enriched GO terms in the category of the biological process. Binding and catalytic activity were the top two enriched GO terms in the category of molecular functions, which were very similar to those under normal salinity (Figure 2B). Statistical analysis showed that genes highly expressed in tolerant families were enriched significantly (Q value <0.05) in terms of response to a stimulus for the biological process. Two genes encoding crustacyanins were found in the enriched response to the stimulus GO term. As for the DEGs upregulated in susceptible families, no significant enrichment term was found (Figures 2C, D).
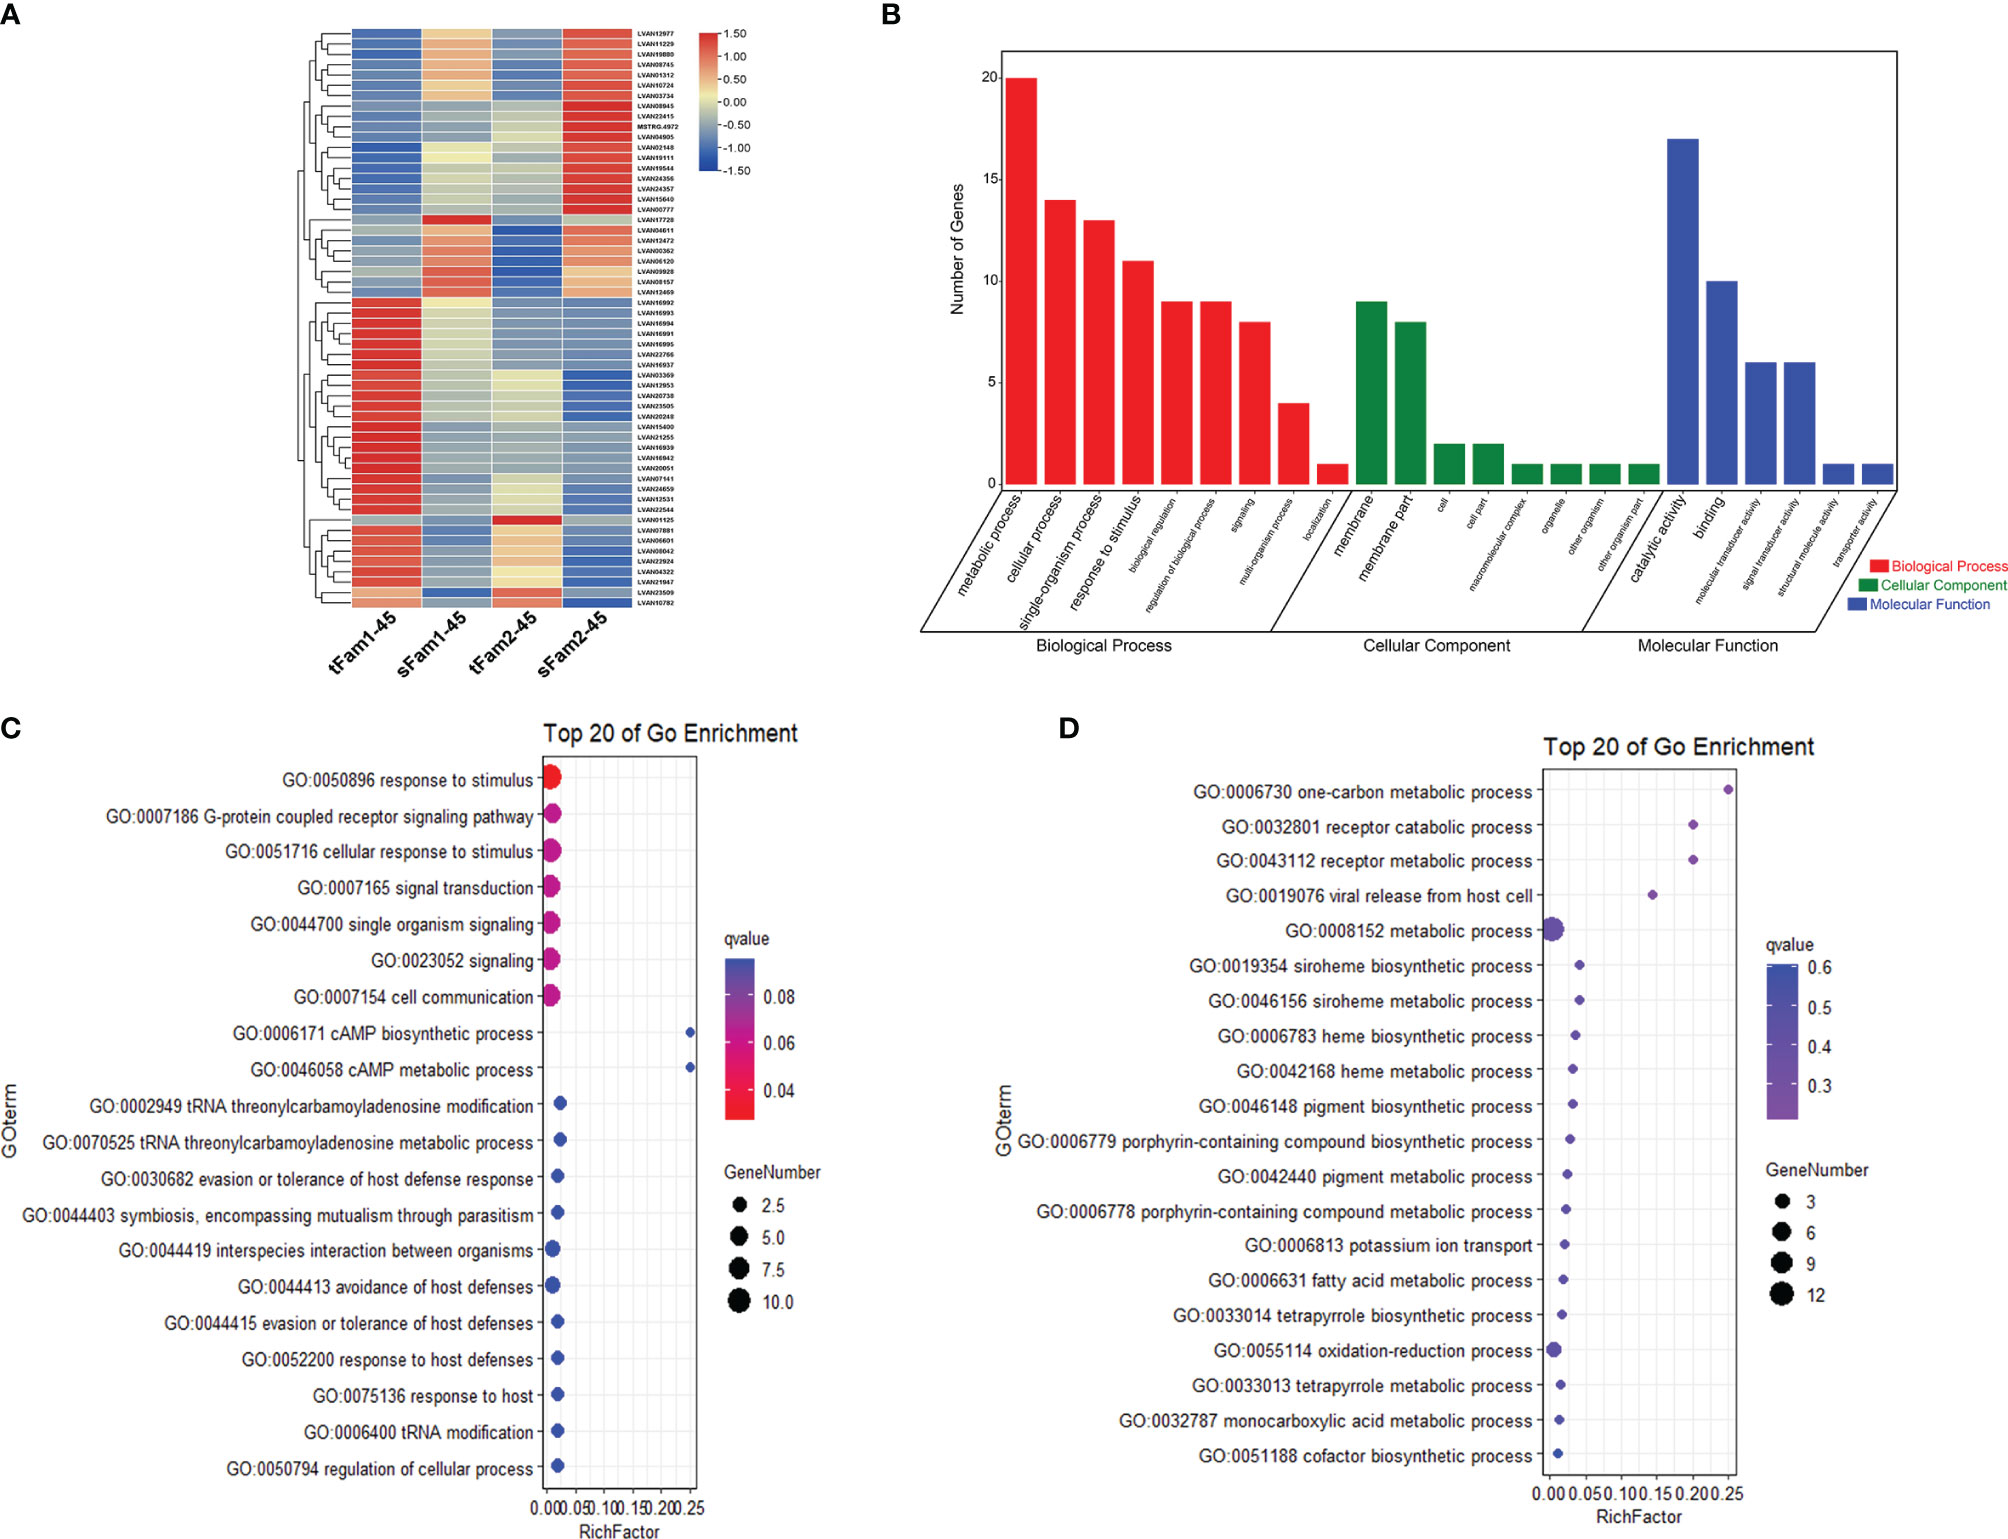
Figure 2 DEGs between high-salinity tolerant families and susceptible families under high-salinity conditions in Litopenaeus vannamei. (A) Gene expression heatmap of DEGs. (B) GO enrichment analysis of DEGs. (C) Top 20 GO terms enriched in the categories of biological process for DEGs upregulated in tolerant families, the point color shows different Q values as indicated on the right, and red color represents the significant enriched GO term (Q < 0.05). (D) Top 20 GO terms enriched in the categories of biological process for DEGs upregulated in susceptible families; the point color shows different Q values as indicated on the right. DEGs, differentially expressed genes; GO, Gene Ontology.
Common Differentially Expressed Genes Between Tolerant and Susceptible Families Under Both Normal and High-Salinity Conditions
Further analysis of the DEGs between tolerant and susceptible families under both normal and high salinities showed that four DEGs had higher expression levels in tolerant families, and six DEGs presented higher expression levels in susceptible families (Table 2). Four highly expressed genes in tolerant families were crustacyanin subunit C, 26S protease regulatory subunit 6A-B, actin, and toll-like receptor. Among the six DEGs highly expressed in susceptible families, four genes had annotations, including trypsin-1-like, compound eye opsin BCRH2-like, triose-phosphate isomerase, and mucin-2-like.
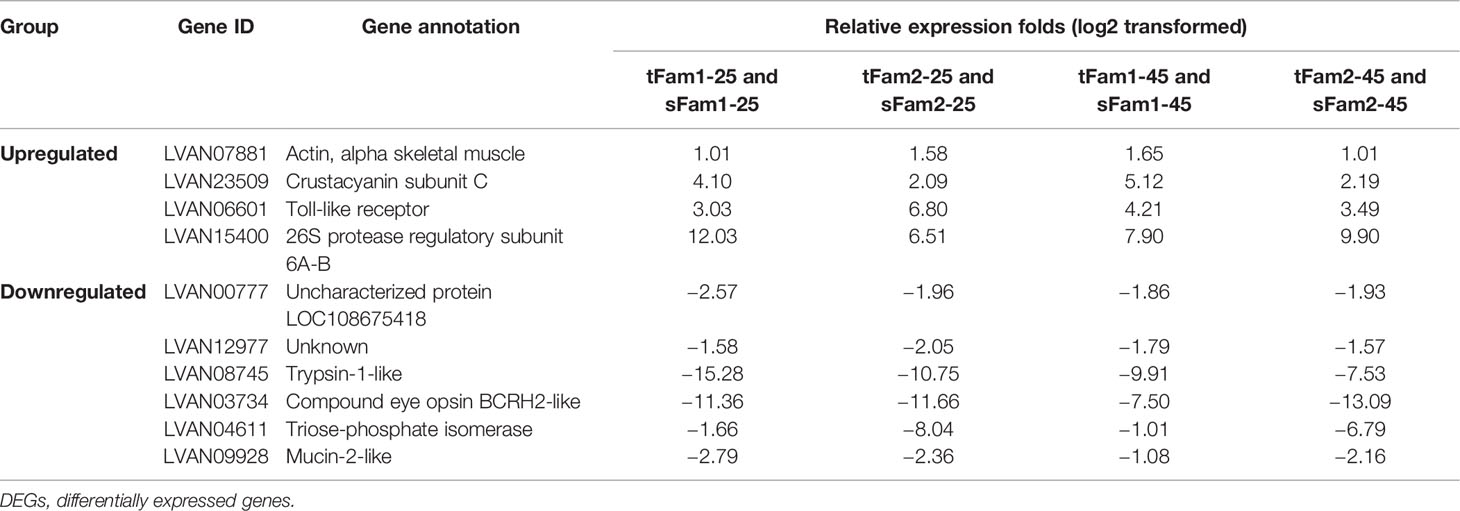
Table 2 DEGs between tolerant families and susceptible families under both normal and high-salinity conditions.
Transcriptomic Response to High-Salinity Treatment in Tolerant and Susceptible Families
A total of 891, 409, 1,649, and 1,149 DEGs were identified from tFam1, sFam1, tFam2, and sFam2 families, respectively, after high-salinity treatment. Further analysis showed that 26 DEGs presented similar expression patterns in these four families. Among them, 21 DEGs showed upregulated expression levels and five DEGs showed downregulated expression levels after high-salinity treatment (Figure 3A). GO enrichment analysis on these DEGs showed that they were enriched in the items including single-organism process, metabolic process, cellular process for biological process, membrane and membrane part for cellular components, catalytic activity, and binding for molecular functions (Figure 3B). Further analysis showed that oxidation–reduction process was the most enriched item for the biological process (Figure 3C). Among the 21 upregulated DEGs, six unigenes were related to the oxidation–reduction process, including cytochrome P450 epoxidase-like protein, D-aspartate oxidase, alkylglycerol monooxygenase-like, spermine oxidase-like isoform X2, type I iodothyronine deiodinase-like isoform X1, and la-related protein 6-like.
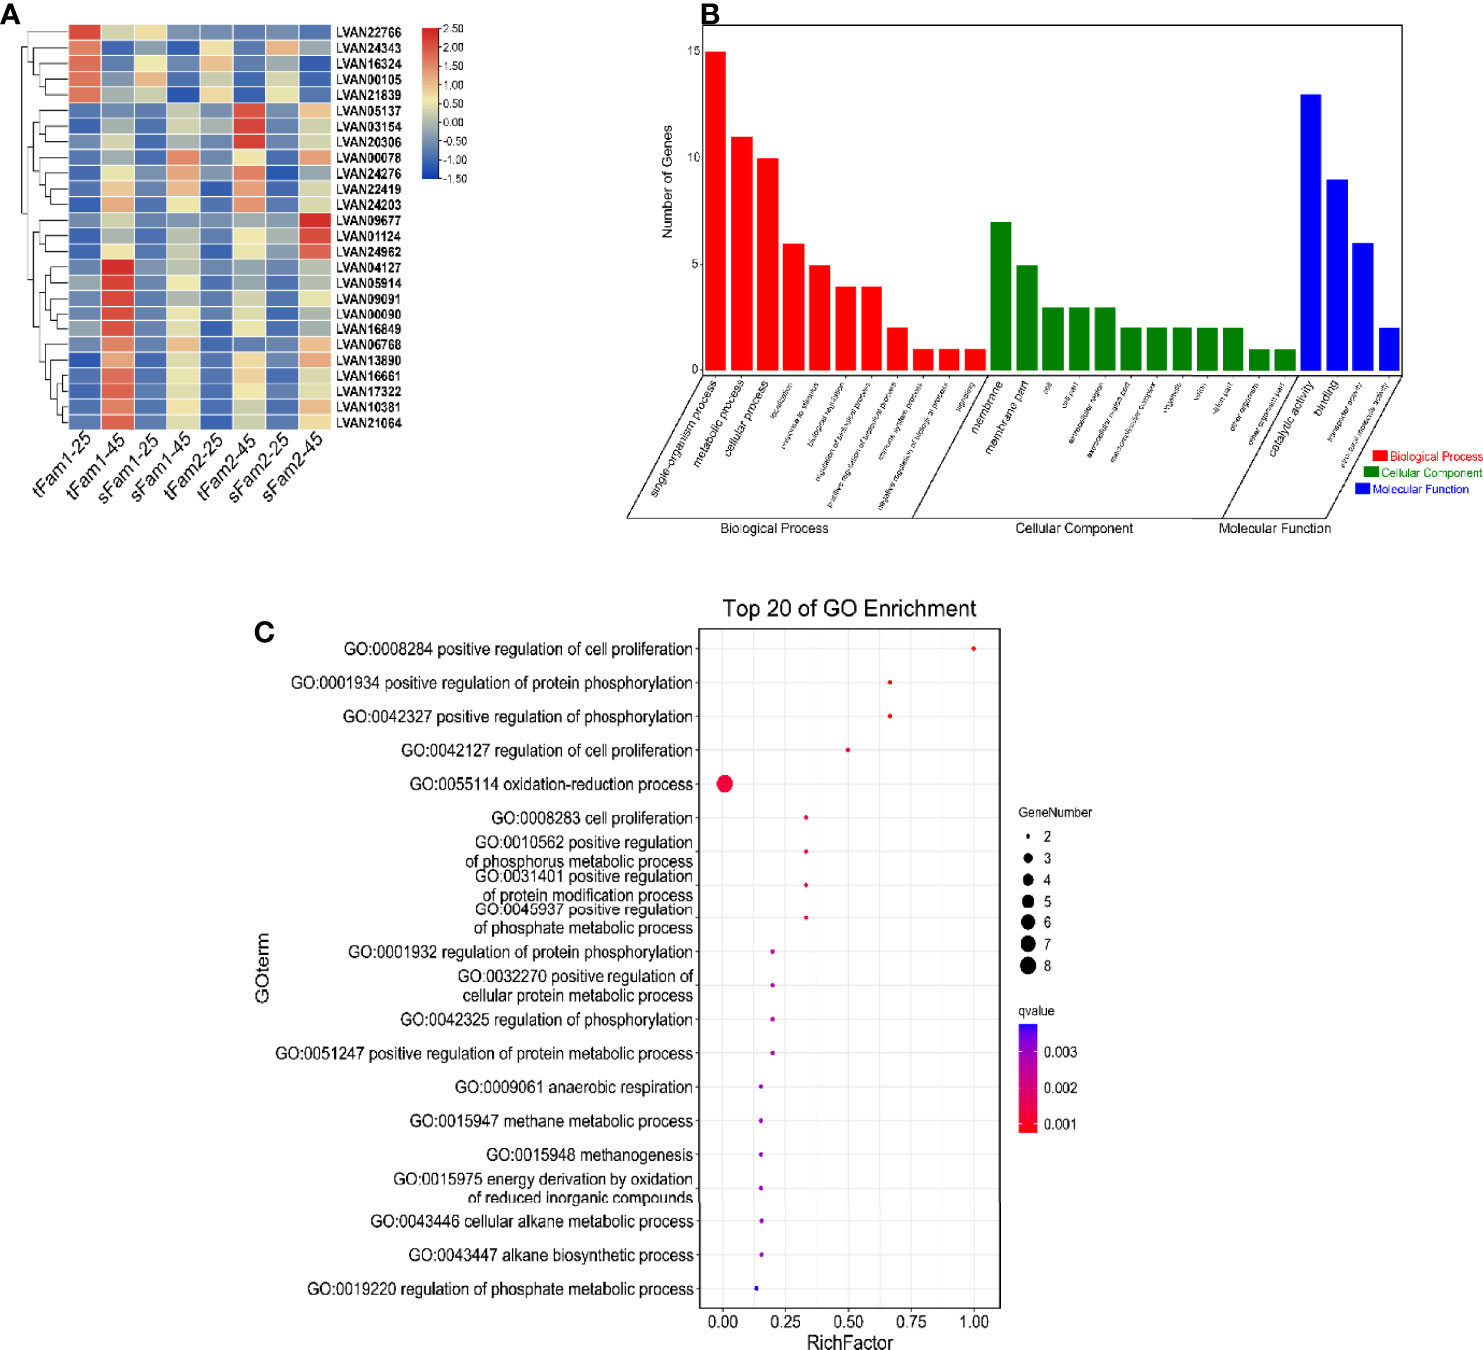
Figure 3 DEGs for high-salinity tolerant families and susceptible families after high-salinity stress in Litopenaeus vannamei. (A) Gene expression heatmap of DEGs with similar expression pattern in four families. (B) GO enrichment analysis of DEGs. (C) Top 20 GO terms enriched in the categories of biological process for DEGs; the point color shows different Q values as indicated on the right. DEGs, differentially expressed genes; GO, Gene Ontology.
In order to elucidate how the tolerant family adapts to high-salinity treatment, the DEGs for the two tolerant families under normal and high salinity were further analyzed. A total of 233 DEGs presented similar expression profiles in these two families (Figure 4A). Among these DEGs, 160 DEGs were upregulated and 73 DEGs were downregulated after high-salinity treatment in comparison with their controls at a salinity of 25 ppt (Figure 4B). GO enrichment analysis indicated that metabolic process was the most enriched GO term for the biological process, membrane was the most enriched one for cellular component, and catalytic activity was the most enriched GO term for molecular function (Figure 4C). Among them, serine-type endopeptidase activity, serine-type peptidase activity, and serine hydrolase activity were the top three enriched GO terms (Figure 4D). Amino acid metabolic process including tyrosine metabolism pathway and beta-alanine metabolism pathway were the top two KEGG enrichment pathways (Figure 4E). Genes encoding serine proteases, prophenoloxidase, and some osmoregulation genes, such as solute carriers and sodium/glucose cotransporter, showed significant upregulations in these two tolerant families after high-salinity treatment. These data indicated that the amino acid metabolism pathway and osmoregulation process might play a key role in shrimp to handle with high-salinity stress. Interestingly, five rhodopsin genes were found to be upregulated in tolerant families under high-salinity treatment, and they were also DEGs between tolerant families and susceptible families under high-salinity conditions.
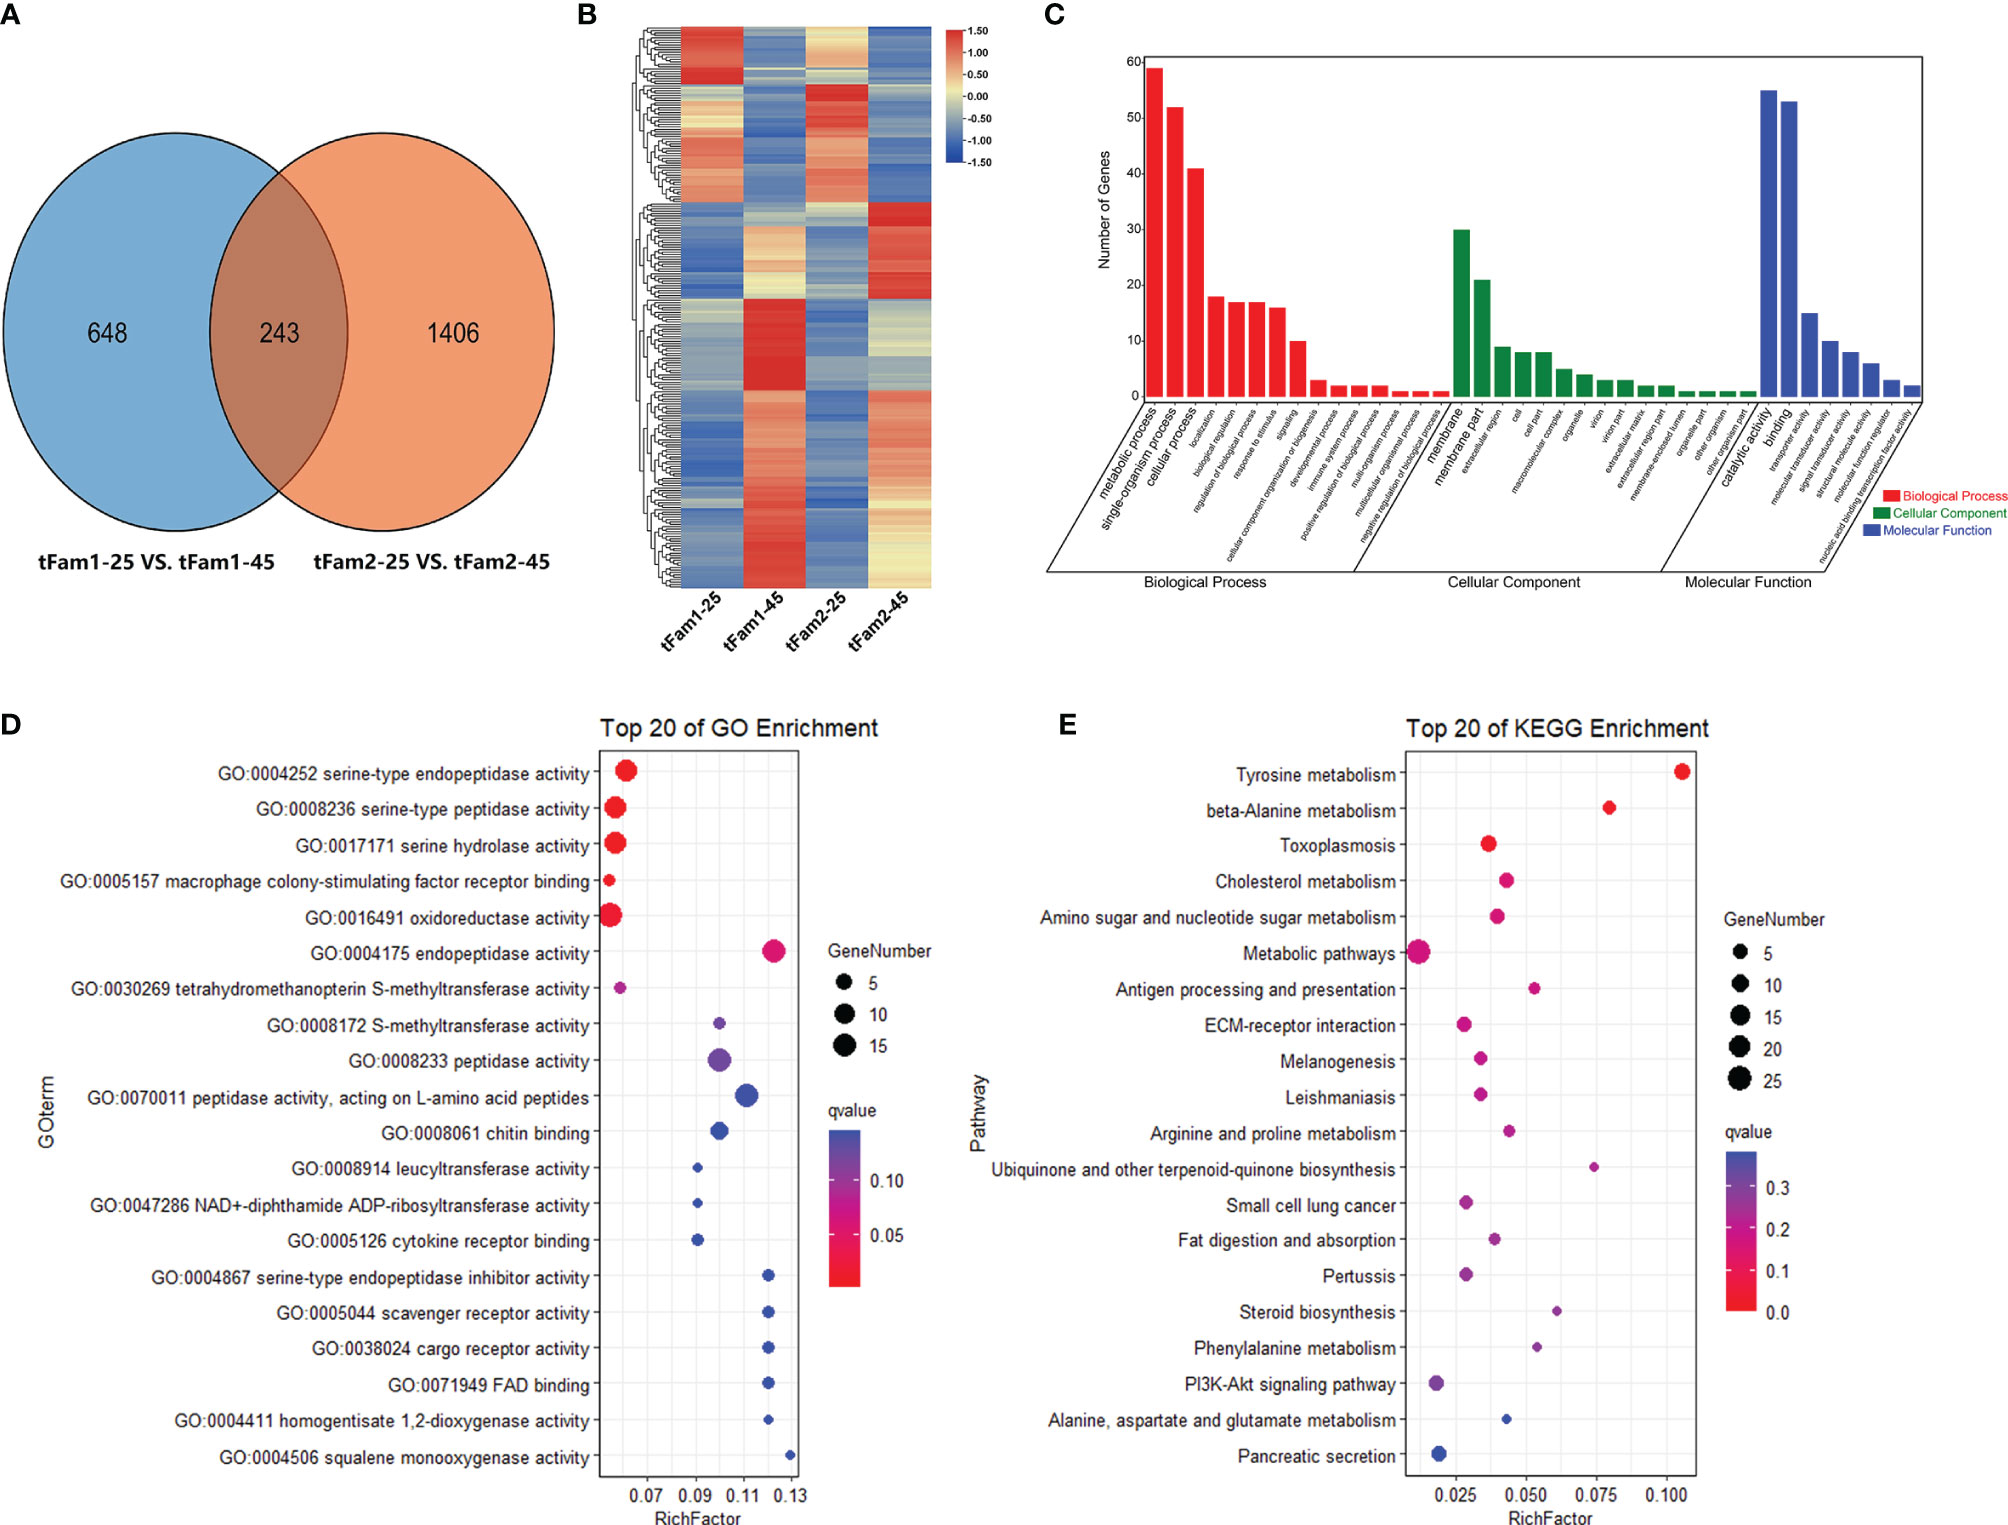
Figure 4 DEGs shared by two high-salinity tolerant families after high-salinity stress in Litopenaeus vannamei. (A) Venn diagram of two pairwise comparisons for DEGs. (B) Gene expression heatmap of common DEGs. (C) GO enrichment analysis of common DEGs. (D) Top 20 GO terms enriched in the categories of molecular function for common DEGs, the point color shows different Q values as indicated on the right, and red color represents the significantly enriched GO term (Q < 0.05). (E) Top 20 KEGG pathways enrichment for common DEGs, the point color shows different Q values as indicated on the right, and red color represents the significantly enriched GO term (Q < 0.05). DEGs, differentially expressed genes; GO, Gene Ontology; KEGG, Kyoto Encyclopedia of Genes and Genomes.
In order to know whether the DEGs shared by two tolerant families showed different expression patterns in susceptible families after high-salinity treatment, the expressions of those DEGs in susceptible families were further analyzed. A total of 63 upregulated DEGs and 45 downregulated DEGs were found to be specifically recognized in tolerant families after high-salinity treatment (Tables 3, 4). Serine-type peptidase activity, serine hydrolase activity, and serine-type endopeptidase activity were the top three enriched GO terms in the DEGs specifically upregulated in the tolerant families. Four genes belonging to serine proteases families, including clip domain serine proteases, serine proteases, chymotrypsin-like protein, and prophenoloxide-activating enzyme III, were shared by the above three GO terms (Figures 5A, B), which showed higher expressions in tolerant families after high-salinity treatment. These data suggested that serine protease activity should play key roles in shrimp tolerance to high salinity. As for the DEGs specifically downregulated in tolerant families, no significant enriched GO term was found (Figures 5C, D).
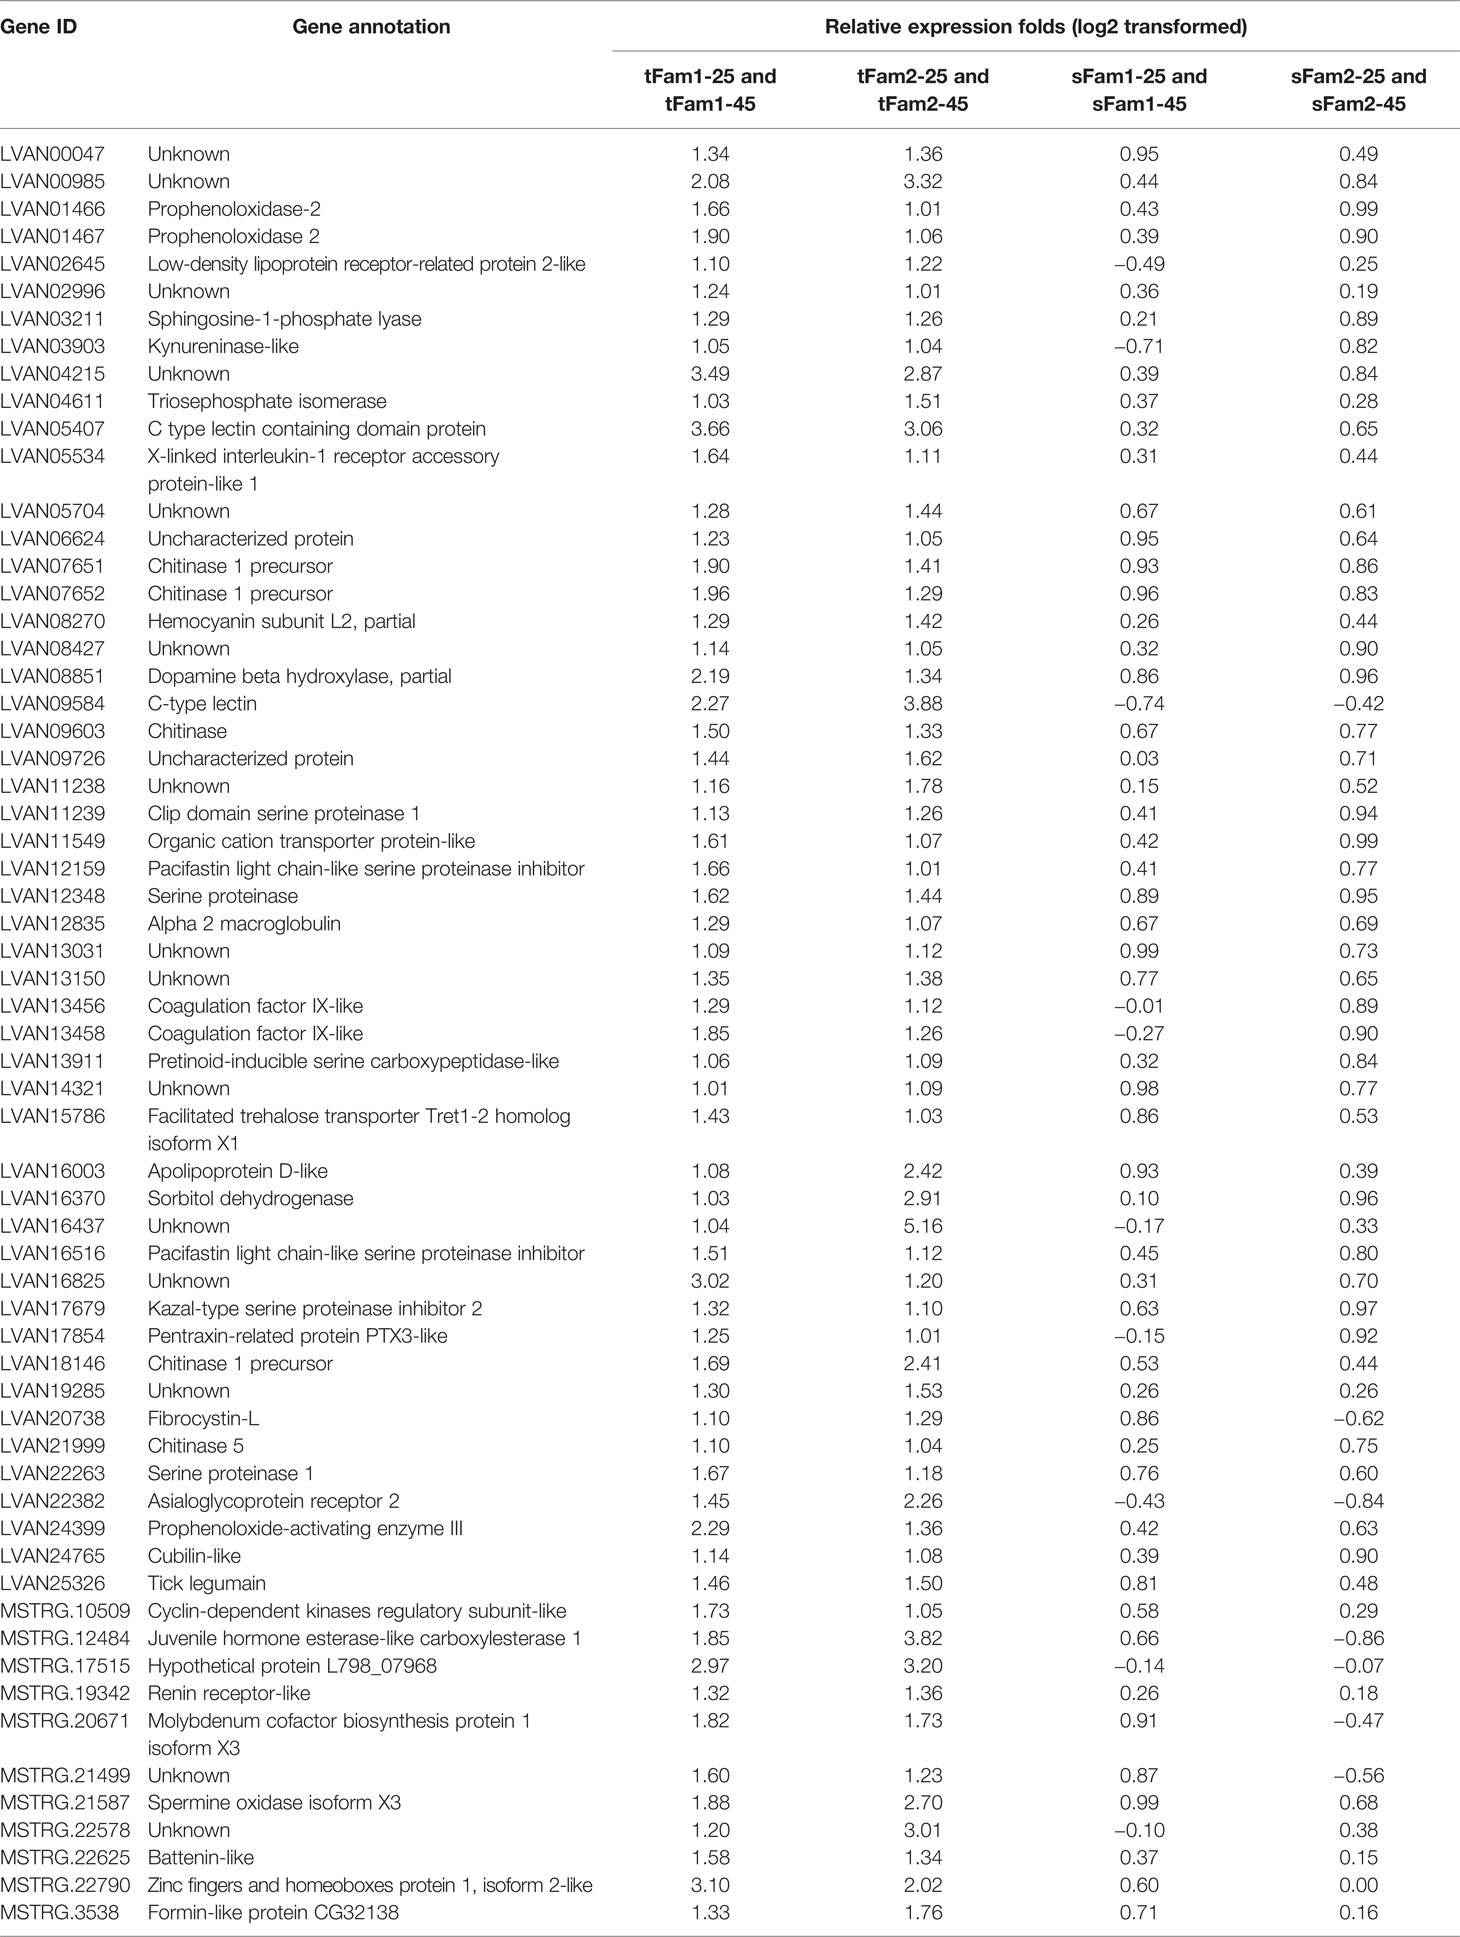
Table 3 Genes upregulated significantly in tolerant families but not significant in susceptible families under high-salinity stress.
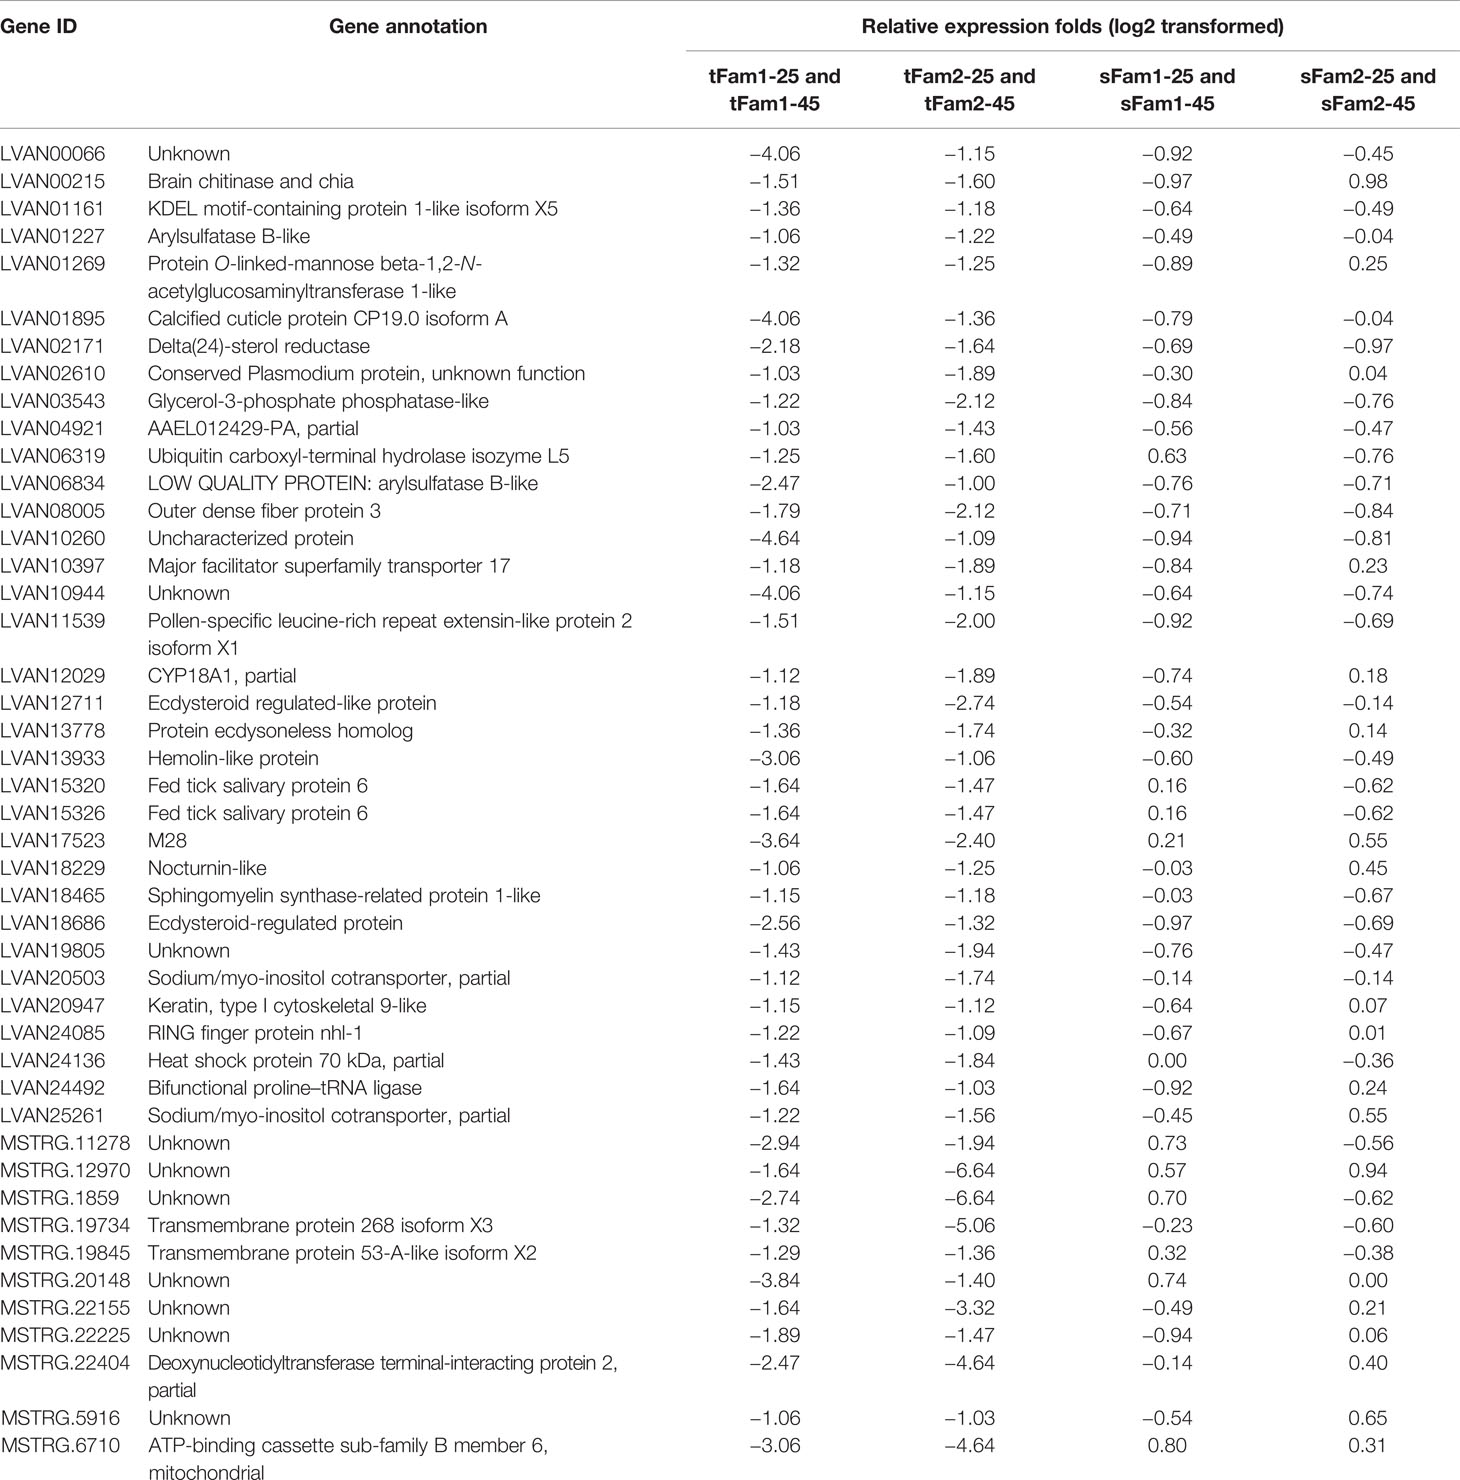
Table 4 Genes downregulated significantly in tolerant families but not significant in susceptible families under high-salinity stress.
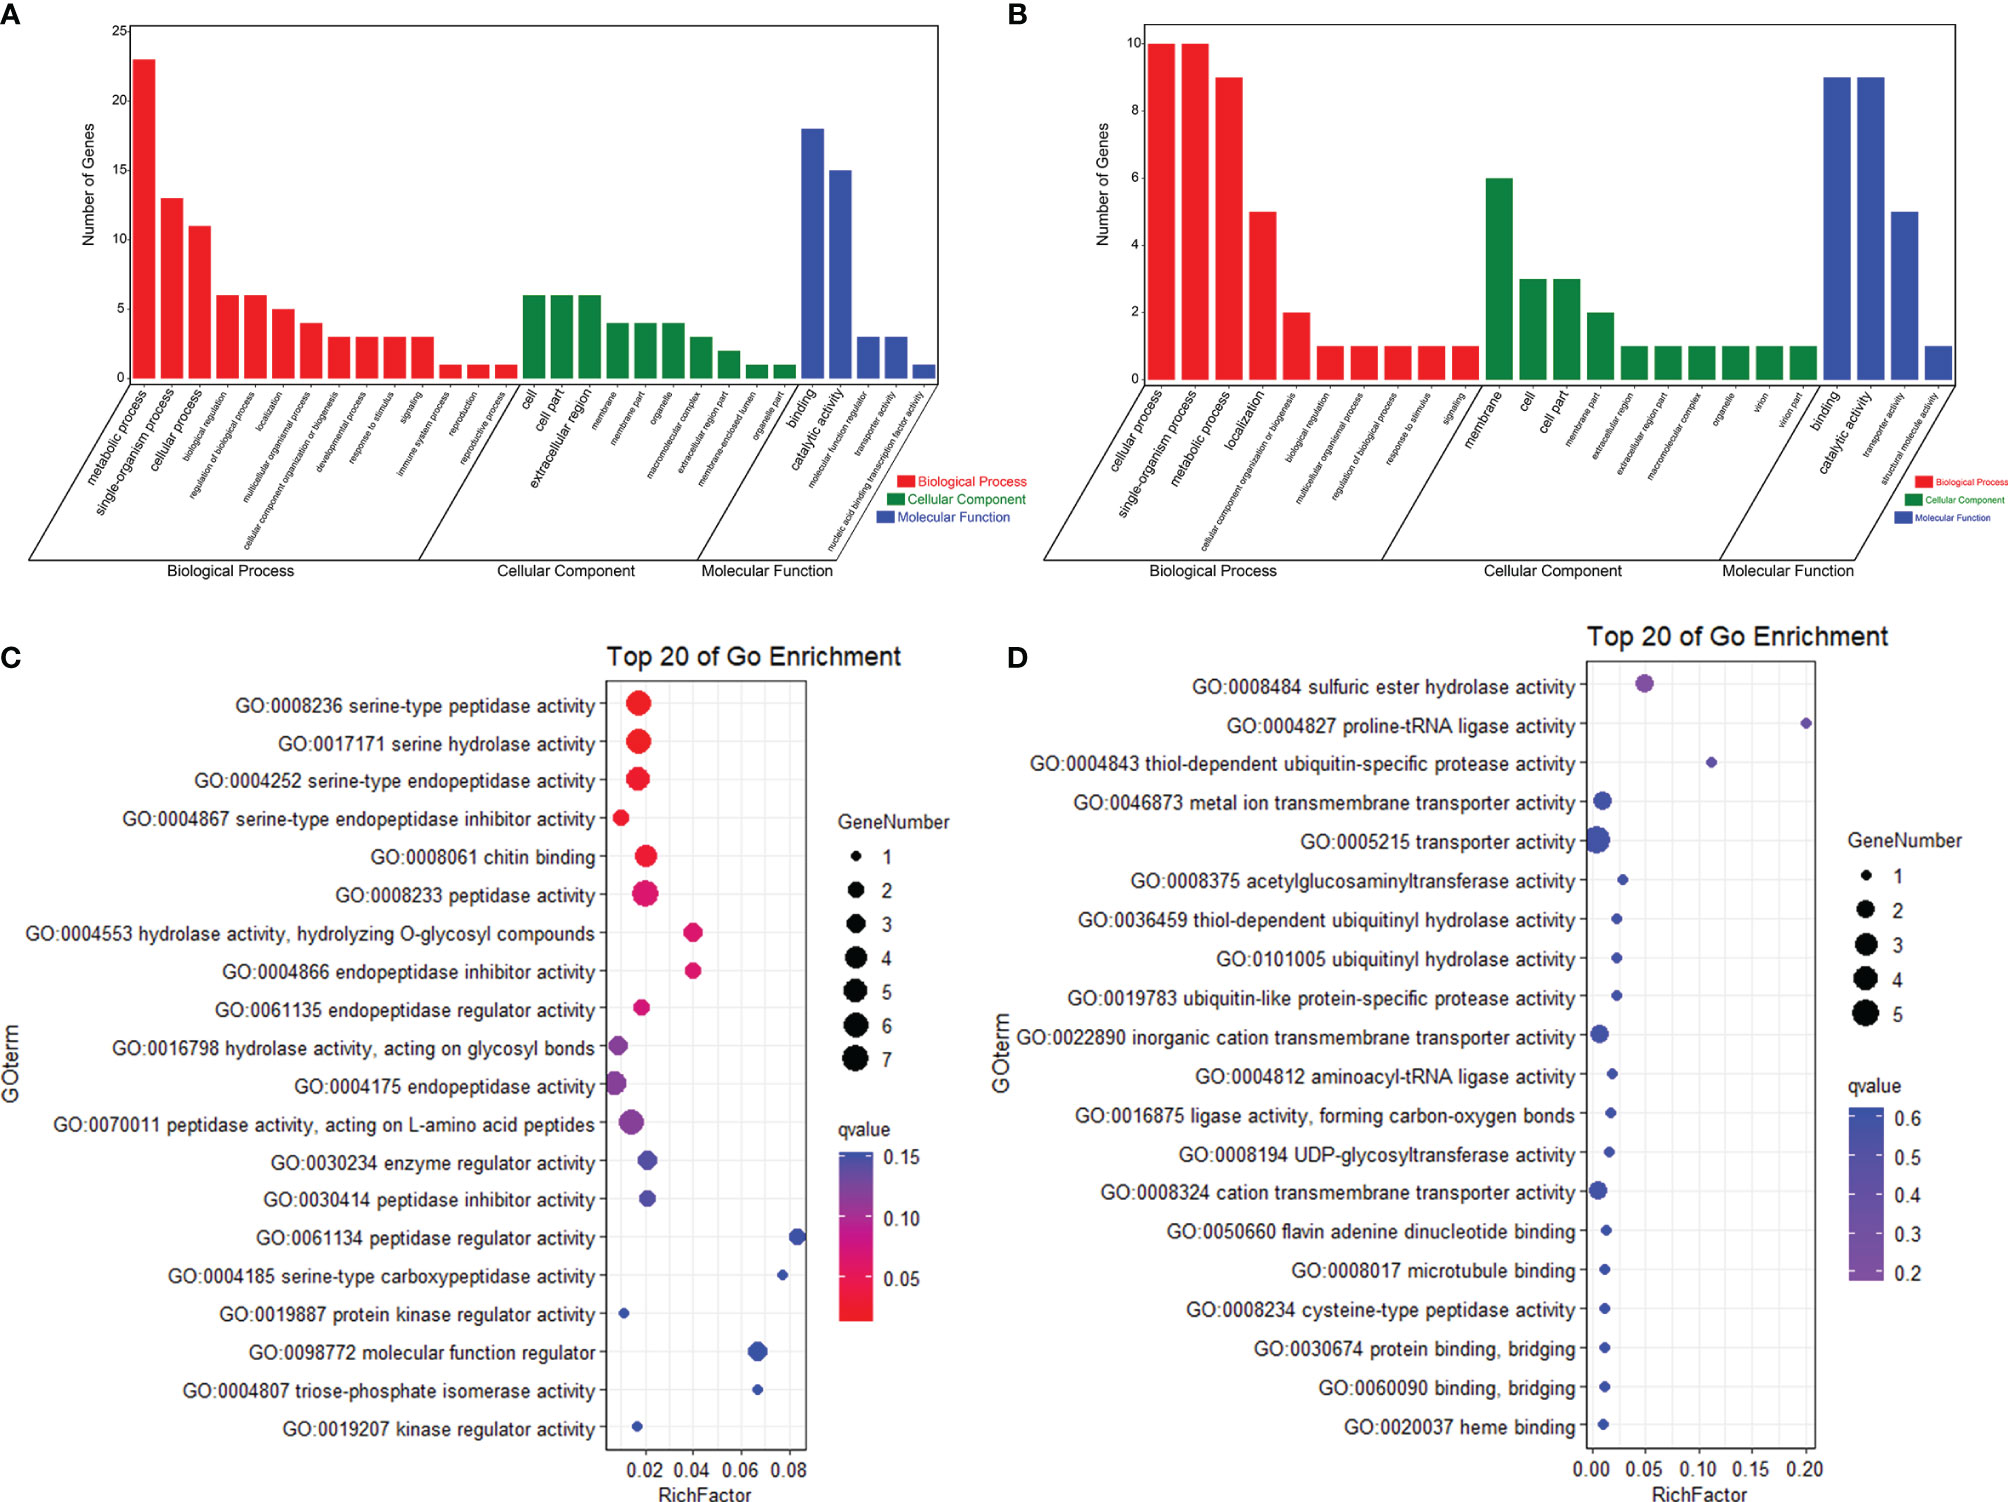
Figure 5 Specific DEGs in high-salinity tolerant families after high-salinity stress in Litopenaeus vannamei. (A) GO enrichment analysis of upregulated DEGs. (B) Top 20 GO terms enriched in the categories of molecular function for the upregulated DEGs, the point color shows different Q values as indicated on the right, and red color represents the significantly enriched GO term (Q < 0.05). (C) GO enrichment analysis of downregulated DEGs. (D) Top 20 GO terms enriched in the categories of molecular function for downregulated DEGs; the point color shows different Q values as indicated on the right. DEGs, differentially expressed genes; GO, Gene Ontology.
Confirmation of Transcriptome Sequencing Data
The qPCR detection of four representative DEGs, including LVAN11695, LVAN07881, LVAN23509, and LVAN04611, are shown in Figure 6. The expression tendency of these four genes was consistent with the transcriptomic sequencing results, suggesting that the transcriptome analysis data were reliable.
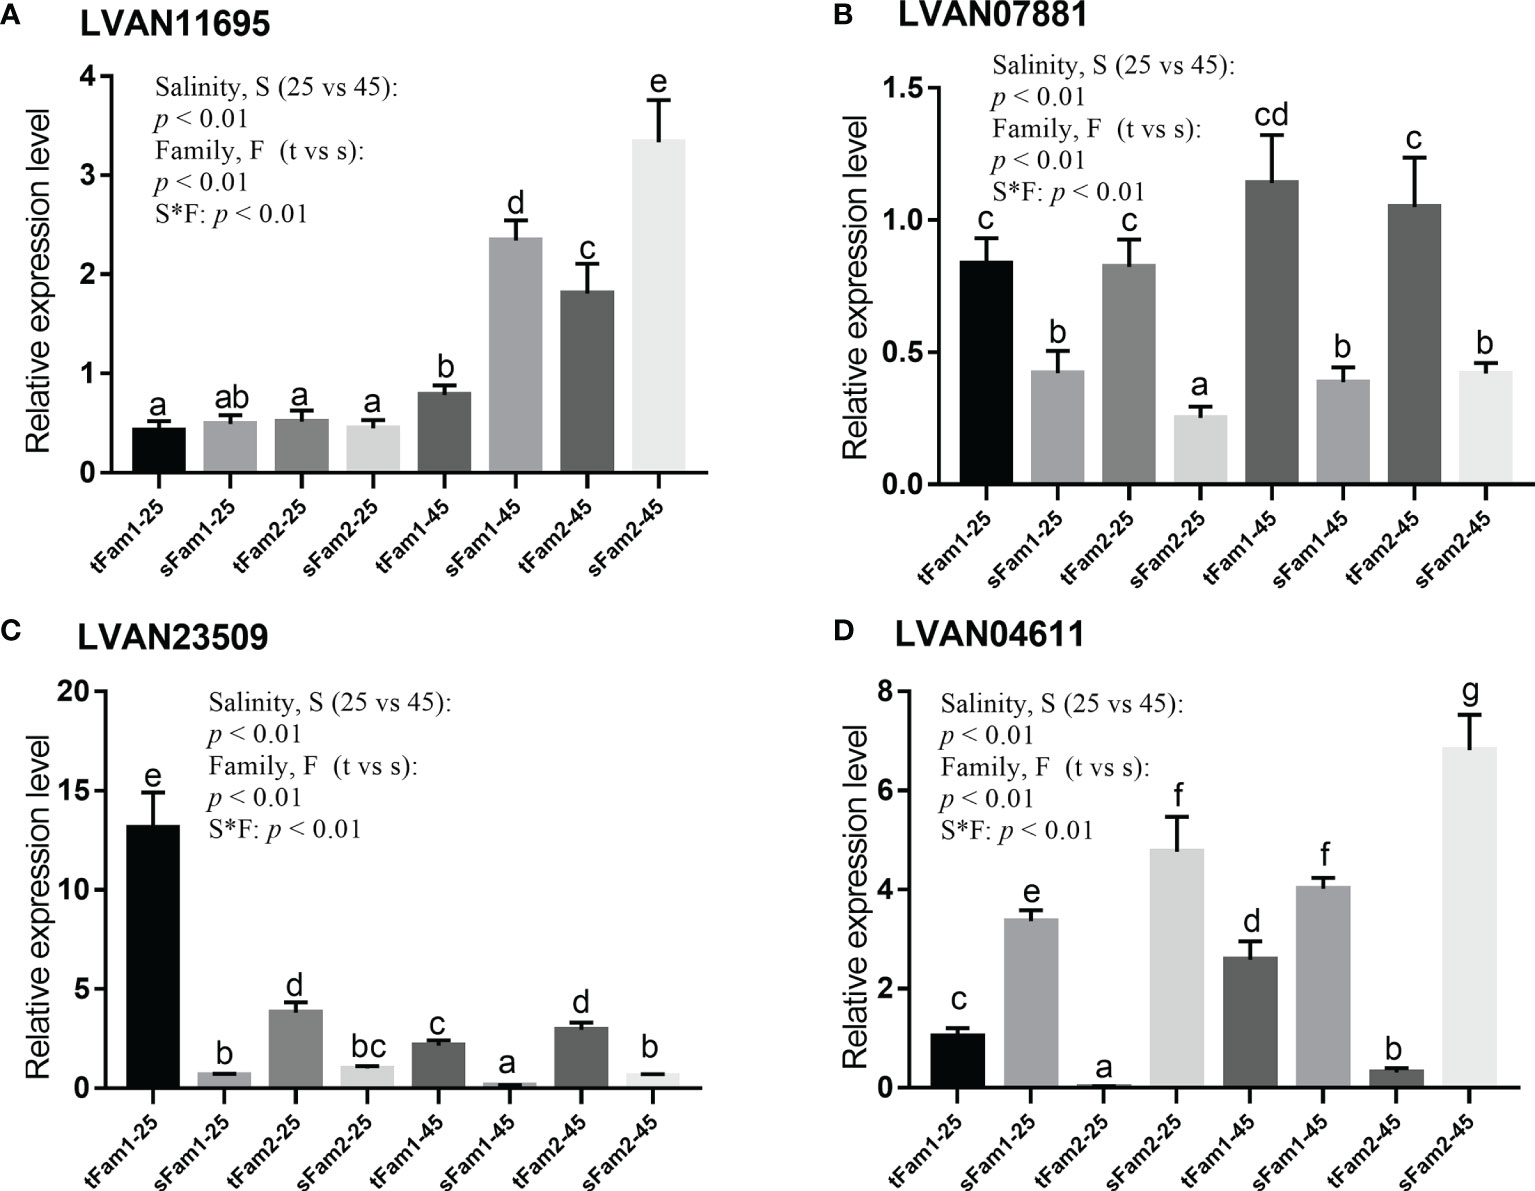
Figure 6 Comparison of the relative expression levels of four DEGs between tolerant families and susceptible families under salinity of 25 and 45 ppt detected by qPCR. Two-way ANOVA (factor: salinity and family) analysis was utilized to determine the statistical differences, and one-way ANOVA was used to reveal the significant differences among different samples, p represents the p-value of two-way ANOVA, S*F represents the interaction between salinity and family, t represents tolerant family, and s represents susceptible family. Columns with the same letters show no significant difference, while columns with different letters indicate significant differences. (A) LVAN11695: betaine–homocysteine S-methyltransferase, (B) LVAN07881: actin, alpha skeletal muscle, (C) LVAN23509: crustacyanin subunit C, and (D) LVAN04611: triose-phosphate isomerase. DEGs, differentially expressed genes.
Discussion
Comparative transcriptome analysis showed that response to stimulus was one of the most enriched GO terms for the biological process among the DEGs upregulated in tolerant families in comparison with susceptible families. There were 20 genes enriched in response to stimulus GO term, which was annotated as crustacyanin, 26S protease regulatory subunit 6A-B, rhodopsin, and myosin heavy chain type 2, etc. It is interesting to note that multiple crustacyanin-encoding genes were present in GO terms of response to a stimulus with higher expressions in tolerant families. Crustacyanins are members of the lipocalin family of proteins, which can bind to astaxanthin to contribute to antioxidation in crustaceans (Ferrari et al., 2012; Gao et al., 2021). Their high expressions in tolerant families might indicate that more astaxanthin could be stored in shrimp however, the content of astaxanthin in shrimps has not been measured yet. Astaxanthin was reported to scavenge reactive oxygen free radicals in cells and reduce oxidative damage (Stanier et al., 1971; Ando & Hatano, 1988). High-salinity stress can cause oxidative stress and stimulate the production of pro-inflammatory and pro-apoptotic factors in aquaculture species, but the antioxidant system can resist oxidative stress and protect the body from high-salinity damage (Caxico Vieira et al., 2018; Wang et al., 2022). In the present study, we found that the oxidation–reduction process was the most enriched term for the biological process in both tolerant and susceptible families after high-salinity treatment. This result also supports that oxidation–reduction process is a main physiological response in shrimp exposed to high-salinity stress. Therefore, higher expressions of crustacyanins in tolerant families should contribute to the shrimp’s tolerance to high salinity.
Aside from crustacyanins, we found that 26S protease regulatory subunit 6A-B, alpha actin, and toll-like receptors also showed higher expressions in tolerant families. 26S proteasome regulatory subunit plays a central role in protein degradation (Fan et al., 2016); the upregulation of the 26S proteasome regulatory subunit gene in tolerant families may help to remove the damaged proteins caused by high-salinity stress and improve oxidative stress tolerance (Kurepa et al., 2008). Alpha actins are often found in muscle tissue cells, which was reported to be related to cytoskeleton remodeling (Beck et al., 2014); the high expression of alpha actin gene in tolerant families may help to reduce the high-salinity damage on muscle tissue. Toll-like receptor, as a pattern recognition receptor, plays key roles in the humoral immunity of shrimp (Li and Xiang, 2013). The upregulation of toll-like receptor gene in tolerant families might produce more immune effectors, such as antimicrobial peptides (AMPs), to stimulate innate immunity and enhance shrimp health, although the health status of shrimps was not assessed in this study. In addition, trypsin-1-like, triose-phosphate isomerase, etc., showed lower expressions in the tolerant families. Trypsin is a digestive protease that mainly participates in food digestion (Huang et al., 2020), and triose-phosphate isomerase also plays important roles in metabolism (Liao et al., 2020). The downregulations of trypsin and triose-phosphate isomerase genes in tolerant families might influence energy supply and substance metabolism. The variance of energy and metabolites may change the salinity tolerance of shrimp.
In addition, the serine-type endopeptidase activity, serine-type peptidase activity, and serine hydrolase activity were the top three GO terms for DEGs, which were only upregulated in two tolerant families after high-salinity stress. These three GO terms were mostly related to the innate immunity of aquatic animals (Sun et al., 2018; Xu et al., 2018; Lyu et al., 2019). Serine proteases regulate several invertebrate defense responses, including hemolymph coagulation, antimicrobial peptide synthesis, and melanization of pathogen surfaces (Gorman and Paskewitz, 2001), which were reported to play an important role in the innate immune response of honeybee and shrimp (Zou et al., 2006; Dong and Xiang, 2007). It was reported that the susceptibility of shrimp to pathogens increased when they were exposed to salinity stress (Wang and Chen, 2005; Joseph and Philip, 2020). Genes related to immune defense and apoptosis were upregulated in the high-salinity environment in L. vannamei (Li et al., 2020). Therefore, we hypothesized that tolerant families might have enhanced immunity to protect them from pathogen infection under high salinity.
It was reported that osmoregulation-related genes, such as solute carriers, sodium/glucose cotransporter, and sodium- and chloride-dependent glycine transporter, were responsive to high-salinity stress (Li et al., 2020; Shen et al., 2020). In the present study, we found that the above genes did not show any difference between tolerant families and susceptible families. These data indicated that although the abovementioned osmoregulation-related genes were responsive to high-salinity stress, they are not the key genes related to the tolerance of shrimp to high salinity. It is very surprising to note that five rhodopsin genes were not only upregulated in tolerant families under high-salinity stress but also the DEGs between tolerant families and susceptible families cultured under high-salinity conditions. Rhodopsins are usually known as primary photoreceptor molecules for the vision of animals (Papatsenko et al., 1997). Recent studies indicated that rhodopsins in bacteria participate in chloride pumps and help them to adapt to salinity changes (Mous et al., 2022). Therefore, we hypothesized that rhodopsins might play important roles in shrimp to adapt to high salinity. As for the functioning mechanism of rhodopsins in the high-salinity tolerance of shrimp, further work needs to be done in the future.
Conclusion
In this study, we performed comparative transcriptome analyses between high-salinity tolerant and susceptible families to explore the adaptation mechanism of L. vannamei to high salinity. Our study identified some pathways or genes associated with shrimp tolerance to high salinity. The identified genes in the present study will not only provide clues for dissecting the molecular mechanism of shrimp tolerance to high salinity but also have the potential to be used as gene markers for assisting the genetic breeding of shrimp by distinguishing tolerant and susceptible families at gene expression levels.
Data Availability Statement
The datasets presented in this study can be found in online repositories. The names of the repository/repositories and accession number(s) can be found below: https://www.ncbi.nlm.nih.gov/genbank/, PRJNA799461.
Author Contributions
ZL, YY, and FL contributed to the conception and design of the study. ZL performed the statistical analysis and wrote the first draft of the manuscript. QZ and ZB prepared the material. YY, JX, and FL wrote sections of the manuscript. All authors contributed to manuscript revision and read and approved the submitted version.
Funding
This work is supported by the National Key R&D Program of China (2018YFD0900303), Shandong Provincial Natural Science Foundation (ZR2020MC191), Strategic Priority Research Program of the Chinese Academy of Sciences (Grant No. XDA24030105), and China Agriculture Research System of MOF and MARA.
Conflict of Interest
The authors declare that the research was conducted in the absence of any commercial or financial relationships that could be construed as a potential conflict of interest.
Publisher’s Note
All claims expressed in this article are solely those of the authors and do not necessarily represent those of their affiliated organizations, or those of the publisher, the editors and the reviewers. Any product that may be evaluated in this article, or claim that may be made by its manufacturer, is not guaranteed or endorsed by the publisher.
Supplementary Material
The Supplementary Material for this article can be found online at: https://www.frontiersin.org/articles/10.3389/fmars.2022.864338/full#supplementary-material
Supplementary Figure 1 | Survival rate of different families under high-salinity stress in L. vannamei. The black columns represent families selected for comparative transcriptome analysis.
Supplementary Table 1 | Primer sequences and annealing temperature used for RT-qPCR.
Supplementary Table 2 | Summary of RNA sequencing data information.
References
Ando S., Hatano M. (1988). Bilirubin-Binding Protein in the Serum of Spawning-Migrating Chum Salmon, Oncorhynchus Keta: Its Identity With Carotenoid-Carrying Lipoprotein. Fish Physiol. Biochem. 5, 69–78. doi: 10.1007/BF01875644
Beck M., Moreels M., Quintens R., Abou-El-Ardat K., El-Saghire H., Tabury K., et al. (2014). Chronic Exposure to Simulated Space Conditions Predominantly Affects Cytoskeleton Remodeling and Oxidative Stress Response in Mouse Fetal Fibroblasts. Int. J. Mol. Med. 34, 606–615. doi: 10.3892/ijmm.2014.1785
Caxico Vieira C., Vieira J. S., Bastos M. S., Zancanela V., Barbosa L. T., Gasparino E., et al. (2018). Expression of Genes Related to Antioxidant Activity in Nile Tilapia Kept Under Salinity Stress and Fed Diets Containing Different Levels of Vitamin C. J. Toxicol. Environ. Health Part A 81, 20–30. doi: 10.1080/15287394.2017.1401968
Chang Z. Q., Neori A., He Y. Y., Li J. T., Qiao L., Preston S. I., et al. (2020). Development and Current State of Seawater Shrimp Farming, With an Emphasis on Integrated Multi-Trophic Pond Aquaculture Farms, in China – a Review. Rev. Aquaculture 12, 2544–2558. doi: 10.1111/raq.12457
Chen S., Zhou Y., Chen Y., Gu J. (2018). Fastp: An Ultra-Fast All-in-One FASTQ Preprocessor. Bioinformatics 34, i884–i890. doi: 10.1093/bioinformatics/bty560
Chong-Robles J., Charmantier G., Boulo V., Lizárraga-Valdéz J., Enríquez-Paredes L. M., Giffard-Mena I. (2014). Osmoregulation Pattern and Salinity Tolerance of the White Shrimp Litopenaeus Vannamei (Boone 1931) During Post-Embryonic Development. Aquaculture 422, 261–267. doi: 10.1016/j.aquaculture.2013.11.034
Dong B., Xiang J. H. (2007). Discovery of Genes Involved in Defense/Immunity Functions in a Haemocytes cDNA Library From Fenneropenaeus Chinensis by ESTs Annotation. Aquaculture 272, 208–215. doi: 10.1016/j.aquaculture.2007.07.217
Fan L., Wang A., Miao Y., Liao S., Ye C., Lin Q. (2016). Comparative Proteomic Identification of the Hepatopancreas Response to Cold Stress in White Shrimp, Litopenaeus Vannamei. Aquaculture 454, 27–34. doi: 10.1016/j.aquaculture.2015.10.016
Ferrari M., Folli C., Pincolini E., Mcclintock T. S., Rössle M., Berni R., et al. (2012). Structural Characterization of Recombinant Crustacyanin Subunits From the Lobster Homarus Americanus. Acta Crystallographica Section F: Struct. Biol. Crystallization Commun. 68, 846–853. doi: 10.1107/S1744309112026103
Gao H., Ma H., Sun J., Xu W., Yan B. (2021). Expression and Function Analysis of Crustacyanin Gene Family Involved in Resistance to Heavy Metal Stress and Body Color Formation in Exopalaemon Carinicauda. J. Exp. Zool. Part B Mol. Dev. Evol. 336, 352–363. doi: 10.1002/jez.b.23025
Gao W., Tian L., Huang T., Yao M., Hu W., Xu Q. (2016). Effect of Salinity on the Growth Performance, Osmolarity and Metabolism-Related Gene Expression in White Shrimp Litopenaeus Vannamei. Aquaculture Rep. 4, 125–129. doi: 10.1016/j.aqrep.2016.09.001
Gorman M. J., Paskewitz S. M. (2001). Serine Proteases as Mediators of Mosquito Immune Responses. Insect Biochem. Mol. Biol. 31, 257–262. doi: 10.1016/S0965-1748(00)00145-4
Huang M., Lin H., Xu C., Yu Q., Wang X., Qin J. G., et al. (2020). Growth, Metabolite, Antioxidative Capacity, Transcriptome, and the Metabolome Response to Dietary Choline Chloride in Pacific White Shrimp Litopenaeus Vannamei. Animals 10, 2246. doi: 10.3390/ani10122246
Joseph A., Philip R. (2020). Immunocompetence of Penaeus Monodon Under Acute Salinity Stress and Pathogenicity of Vibrio Harveyi With Respect to Ambient Salinity. Fish Shellfish Immunol. 106, 555–562. doi: 10.1016/j.fsi.2020.07.067
Kim D., Langmead B., Salzberg S. L. (2015). HISAT: A Fast Spliced Aligner With Low Memory Requirements. Nat. Methods 12, 357–360. doi: 10.1038/nmeth.3317
Kurepa J., Toh-E A., Smalle J. A. (2008). 26S Proteasome Regulatory Particle Mutants Have Increased Oxidative Stress Tolerance. Plant J. 53, 102–114. doi: 10.1111/j.1365-313X.2007.03322.x
Langmead B., Salzberg S. L. (2012). Fast Gapped-Read Alignment With Bowtie 2. Nat. Methods 9, 357–359. doi: 10.1038/nmeth.1923
Liao X., Wang C., Wang B., Qin H., Hu S., Wang P., et al. (2020). Comparative Transcriptome Analysis of Litopenaeus Vannamei Reveals That Triosephosphate Isomerase-Like Genes Play an Important Role During Decapod Iridescent Virus 1 Infection. Front. Immunol. 11. doi: 10.3389/fimmu.2020.01904
Li C., Li N., Dong T., Fu Q., Cui Y., Li Y. (2020). Analysis of Differential Gene Expression in Litopenaeus Vannamei Under High Salinity Stress. Aquaculture Rep. 18, 100423. doi: 10.1016/j.aqrep.2020.100423
Livak K. J., Schmittgen T. D. (2001). Analysis of Relative Gene Expression Data Using Real-Time Quantitative PCR and the 2– ΔΔCT Method. Methods 25, 402–408. doi: 10.1006/meth.2001.1262
Li E., Wang X., Chen K., Xu C., Qin J. G., Chen L. (2017). Physiological Change and Nutritional Requirement of Pacific White Shrimp Litopenaeus Vannamei at Low Salinity. Rev. Aquaculture 9, 57–75. doi: 10.1111/raq.12104
Li F., Xiang J. (2013). Signaling Pathways Regulating Innate Immune Responses in Shrimp. Fish Shellfish Immunol. 34 (4), 973–980. doi: 10.1016/j.fsi.2012.08.023
Li N., Zhao Y., Wang R., Shen M., Li Y. (2018). Effects of High Salinity on Digestive and Immunity-Related Enzymes in Litopenaeus Vannamei. Acta Ecol. Sin. 38, 1411. doi: 10.5846/stxb201701050045
Love M. I., Huber W., Anders S. (2014). Moderated Estimation of Fold Change and Dispersion for RNA-Seq Data With Deseq2. Genome Biol. 15, 550. doi: 10.1186/s13059-014-0550-8
Lyu S., Yuan X., Zhang H., Shi W., Hang X., Liu L., et al. (2019). Complete Genome Sequence and Analysis of a New Lethal Arterivirus, Trionyx Sinensis Hemorrhagic Syndrome Virus (TSHSV), Amplified From an Infected Chinese Softshell Turtle. Arch. Virol. 164, 2593–2597. doi: 10.1007/s00705-019-04324-8
Mous S., Gotthard G., Ehrenberg D., Sen S., Weinert T., Johnson P. J., et al. (2022). Dynamics and Mechanism of a Light-Driven Chloride Pump. Science 375, 845–851. doi: 10.1126/science.abj6663
Papatsenko D., Sheng G., Desplan C. (1997). A New Rhodopsin in R8 Photoreceptors of Drosophila: Evidence for Coordinate Expression With Rh3 in R7 Cells. Development 124, 1665–1673. doi: 10.1242/dev.124.9.1665
Pertea M., Kim D., Pertea G. M., Leek J. T., Salzberg S. L. (2016). Transcript-Level Expression Analysis of RNA-Seq Experiments With HISAT, StringTie and Ballgown. Nat. Protoc. 11, 1650–1667. doi: 10.1038/nprot.2016.095
Pertea M., Pertea G. M., Antonescu C. M., Chang T. C., Mendell J. T., Salzberg S. L. (2015). StringTie Enables Improved Reconstruction of a Transcriptome From RNA-Seq Reads. Nat. Biotechnol. 33, 290–295. doi: 10.1038/nbt.3122
Santos C. A., Andrade S. C., Teixeira A. K., Farias F., Guerrelhas A. C., Rocha J. L., et al. (2021). Transcriptome Differential Expression Analysis Reveals the Activated Genes in Litopenaeus Vannamei Shrimp Families of Superior Growth Performance. Aquaculture 531, 735871. doi: 10.1016/j.aquaculture.2020.735871
Shen M., Cui Y., Wang R., Dong T., Ye H., Wang S., et al. (2020). Acute Response of Pacific White Shrimp Litopenaeus Vannamei to High-Salinity Reductions in Osmosis-, Metabolism-, and Immune-Related Enzyme Activities. Aquaculture Int. 28, 31–39. doi: 10.1007/s10499-019-00441-y
Stanier R. Y., Kunisawa R., Mandel M., Cohen-Bazire G. (1971). Purification and Properties of Unicellular Blue-Green Algae (Order Chroococcales). Bacteriol. Rev. 35, 171. doi: 10.1128/br.35.2.171-205.1971
Sun Y., Luo G., Zhao L., Huang L., Qin Y., Su Y., et al. (2018). Integration of RNAi and RNA-Seq Reveals the Immune Responses of Epinephelus Coioides to sigX Gene of Pseudomonas Plecoglossicida. Front. Immunol. 9, 1624. doi: 10.3389/fimmu.2018.01624
Wang L. U., Chen J. C. (2005). The Immune Response of White Shrimp Litopenaeus Vannamei and its Susceptibility to Vibrio Alginolyticus at Different Salinity Levels. Fish Shellfish Immunol. 18, 269–278. doi: 10.1016/j.fsi.2004.07.008
Wang X., Yao Q., Zhang D. M., Lei X. Y., Wang S., Wan J. W., et al. (2022). Effects of Acute Salinity Stress on Osmoregulation, Antioxidant Capacity and Physiological Metabolism of Female Chinese Mitten Crabs (Eriocheir Sinensis). Aquaculture, 552, 737989. doi: 10.1016/j.aquaculture.2022.737989
Xu Z., Gan L., Li T., Xu C., Chen K., Wang X., et al. (2015). Transcriptome Profiling and Molecular Pathway Analysis of Genes in Association With Salinity Adaptation in Nile Tilapia Oreochromis Niloticus. PloS One 10, e0136506. doi: 10.1371/journal.pone.0136506
Xu Y., Shi J., Hao W., Xiang T., Zhou H., Wang W., et al. (2018). iTRAQ-Based Quantitative Proteomic Analysis of Procambarus Clakii Hemocytes During Spiroplasma Eriocheiris Infection. Fish Shellfish Immunol. 77, 438–444. doi: 10.1016/j.fsi.2018.04.005
Yang F., Li S., Xiang J., Zhao X., Li F. (2020). Transcriptome Analysis Reveals the Regulation of the Shrimp STAT on Host Chitin-Binding Domain Containing Proteins and Energy Metabolism Process During WSSV Infection. Fish Shellfish Immunol. 100, 345–357. doi: 10.1016/j.fsi.2020.03.026
Zhang X., Yuan J., Sun Y., Li S., Gao Y., Yu Y., et al. (2019). Penaeid Shrimp Genome Provides Insights Into Benthic Adaptation and Frequent Molting. Nat. Commun. 10, 356. doi: 10.1038/s41467-018-08197-4
Keywords: high-salinity, comparative transcriptome, tolerant families, susceptible families, Litopenaeus vannamei
Citation: Luo Z, Yu Y, Zhang Q, Bao Z, Xiang J and Li F (2022) Comparative Transcriptome Analysis Reveals the Adaptation Mechanism to High Salinity in Litopenaeus vannamei. Front. Mar. Sci. 9:864338. doi: 10.3389/fmars.2022.864338
Received: 28 January 2022; Accepted: 02 May 2022;
Published: 02 June 2022.
Edited by:
Ivan Viegas, University of Coimbra, PortugalReviewed by:
Yueling Zhang, Shantou University, ChinaKhor Waiho, University of Malaysia Terengganu, Malaysia
Nick Wade, Commonwealth Scientific and Industrial Research Organisation (CSIRO), Australia
Copyright © 2022 Luo, Yu, Zhang, Bao, Xiang and Li. This is an open-access article distributed under the terms of the Creative Commons Attribution License (CC BY). The use, distribution or reproduction in other forums is permitted, provided the original author(s) and the copyright owner(s) are credited and that the original publication in this journal is cited, in accordance with accepted academic practice. No use, distribution or reproduction is permitted which does not comply with these terms.
*Correspondence: Yang Yu, eXV5YW5nQHFkaW8uYWMuY24=; Fuhua Li, ZmhsaUBxZGlvLmFjLmNu