 Elizabeth D. Hetherington
 C. Anela Choy
 Erik V. Thuesen
 Steven H. D. Haddock
- 1Scripps Institution of Oceanography, Integrative Oceanography Division, University of California San Diego, La Jolla, CA, United States
- 2Laboratory I, Evergreen State College, Olympia, WA, United States
- 3Monterey Bay Aquarium Research Institute, Moss Landing, CA, United States
Our perception of deep-sea communities has evolved as various sampling approaches have captured different components of deep-sea habitats. We sampled midwater zooplankton assemblages in Monterey Bay, California to quantify community composition (abundance and biomass) and biodiversity (at the Order level) across three depth ranges, and the effects of sampling methodology on community parameters. We collected zooplankton using two types of opening-closing trawls [Tucker Trawl and Multiple Opening/Closing Net and Environmental Sensing System (MOCNESS)] and video recordings from a remotely operated vehicle (ROV). We quantified the relative contributions of microbes to community biomass using synoptic water-bottle casts and flow cytometry. Overall, the pelagic community was most similar between the Tucker trawl and ROV (dissimilarity = 52.4%) and least similar between the MOCNESS and ROV (dissimilarity = 65.8%). Dissimilarity between sampling methods was driven by the relative abundances of crustaceans and gelatinous taxa, where gelatinous animals (cnidarians, ctenophores, tunicates) were more abundant in ROV surveys (64.2%) and Tucker trawls (46.8%) compared to MOCNESS samples (14.5%). ROV surveys were the only method that sufficiently documented the most physically delicate taxa (e.g., physonect siphonophores, lobate ctenophores, and larvaceans). Biomass was also one order of magnitude lower in MOCNESS trawls compared to Tucker trawls. Due to these large differences, the relative contributions of microbes to total biomass were substantially lower in Tucker trawl samples (mean = 7.5%) compared to MOCNESS samples (mean = 51%). These results illustrate that our view of planktonic composition and community biomass is strongly dependent on sampling methodology.
Introduction
Sampling ecological communities in the expansive deep ocean is challenging, and our perception of community composition (i.e., the identities and relative abundances of animals) is largely shaped and constrained by collection capabilities. The deep-pelagic ocean (> 200 m) is Earth’s largest ecosystem, representing ~90% of the global biosphere and providing vast habitat space to support a diversity of animals (Robison, 2004; Martini and Haddock, 2017; Haddock et al., 2018). The pelagic ocean contains the highest carbon biomass of animals on earth (Bar-On et al., 2018). Identifying the species that comprise animal biomass is essential for understanding ecosystem structure and global biogeochemical cycling.
Deep pelagic communities are numerically dominated by zooplankton and micronekton, which serve integral functions in the food web (Potier et al., 2007; Choy et al., 2013; Duffy et al., 2017) and biological carbon pump (Steinberg et al., 2008; Ariza et al., 2015; Hernández-León et al., 2019). Obtaining comprehensive data of zooplankton and micronekton communities, however, is logistically challenging. Zooplankton and micronekton are species-rich and phylogenetically diverse, with taxa varying in size, morphology, and swimming abilities. This renders it difficult to capture the entire community using one sampling approach (Skjoldal et al., 2013; Giachini Tosetto et al., 2019). Traditionally, net tows have been the primary collection approach for sampling pelagic ecosystems. Net tows, while effective for capturing many hard-bodied taxa (Wiebe and Benfield, 2003), often destroy gelatinous zooplankton or fragile taxa and therefore underestimate their contributions to pelagic biomass. Estimating biomass of larger, more mobile organisms is also challenging, as some taxa exhibit net avoidance behaviors (Kaartvedt et al., 2012).
As new technologies are developed and sampling capabilities improve, notions of pelagic community composition continue to evolve. For example, paradigms have shifted on the ecological roles of gelatinous zooplankton, soft bodied animals that encompass a phylogenetic assemblage of multiple taxa (e.g., Cnidaria, Ctenophora, Tunicata) (Haddock, 2004; Potier et al., 2007).
Complementary techniques that are better-suited to observe and collect fragile organisms are increasingly used (e.g., in-situ or towed video recordings and observations) and there is a growing recognition of their ecological importance in pelagic ecosystems, particularly in the deep pelagic, where they serve various roles as predators, prey, and mediators of carbon flux (Henschke et al., 2016; Choy et al., 2017; Hays et al., 2018). The degree to which different sampling approaches affect estimates of gelatinous abundance, diversity, and biomass is unclear and requires an examination of quantitative differences in community composition between collection techniques.
Our primary goal was to compare estimates of abundance, taxonomic diversity, and biomass of a midwater community, focusing on differences resulting from three distinct collection techniques. We co-collected community samples with two ships in three depth zones using (1) a Multiple Opening/Closing Net and Environmental Sensing System (MOCNESS), (2) a Tucker trawl with a closing cod-end, and (3) in-situ video camera transects collected by a remotely operated vehicle (ROV). Our secondary objective was to quantify microbial biomass relative to metazoan biomass estimated from MOCNESS and Tucker trawls at two depths. To that end, we used near synoptic water-bottle casts and subsequent flow cytometry. Previous studies have suggested that microbial biomass may be higher than metazoan biomass (Pomeroy et al., 2007; Williams and Ducklow, 2019) but estimates of the contributions of microbes to overall community biomass are highly variable. These discrepancies may be influenced by methodological differences between studies that quantify metazoan biomass (Kaartvedt et al., 2012). We illustrate how potential differences in biomass estimates between trawl systems can influences our perception of microbial contributions to midwater communities.
Methods
Samples were collected concurrently on two oceanographic research vessels (R/V Point Lobos and Point Sur) in September 2004 in Monterey Bay, California. Zooplankton samples were collected using three approaches (Figure 1). First, on the R/V Point Sur, two commonly used opening and closing trawling systems were deployed alternately on three days to collect zooplankton samples. Trawls were equipped with identical flow meters to estimate the water volume for each collection. MOCNESS tows are advantageous for discretely sampling different layers of the water column since multiple nets can be opened and shut sequentially during a single deployment (Wiebe et al., 1985). The MOCNESS had a 1-m2 mouth opening and was equipped with 1-mm mesh nets. A large Tucker trawl was also utilized (Childress et al., 1978), with a single net for discrete sampling of one depth range per deployment (fixed or oblique). The Tucker trawl consists of two nets joined end-to-end by a 1-m diameter stainless steel ring. At the front, an 18.3 m long net with a mesh size of 6.35 mm tapers from the 10-m2 mouth to the 1-m ring. Attached to this ring is a 5 m long net with a 707 µm mesh that tapers into a 1.4 m long cod-end (30 liters). The mouth of the net is opened and closed once per deployment, using a MOCNESS piano key system.
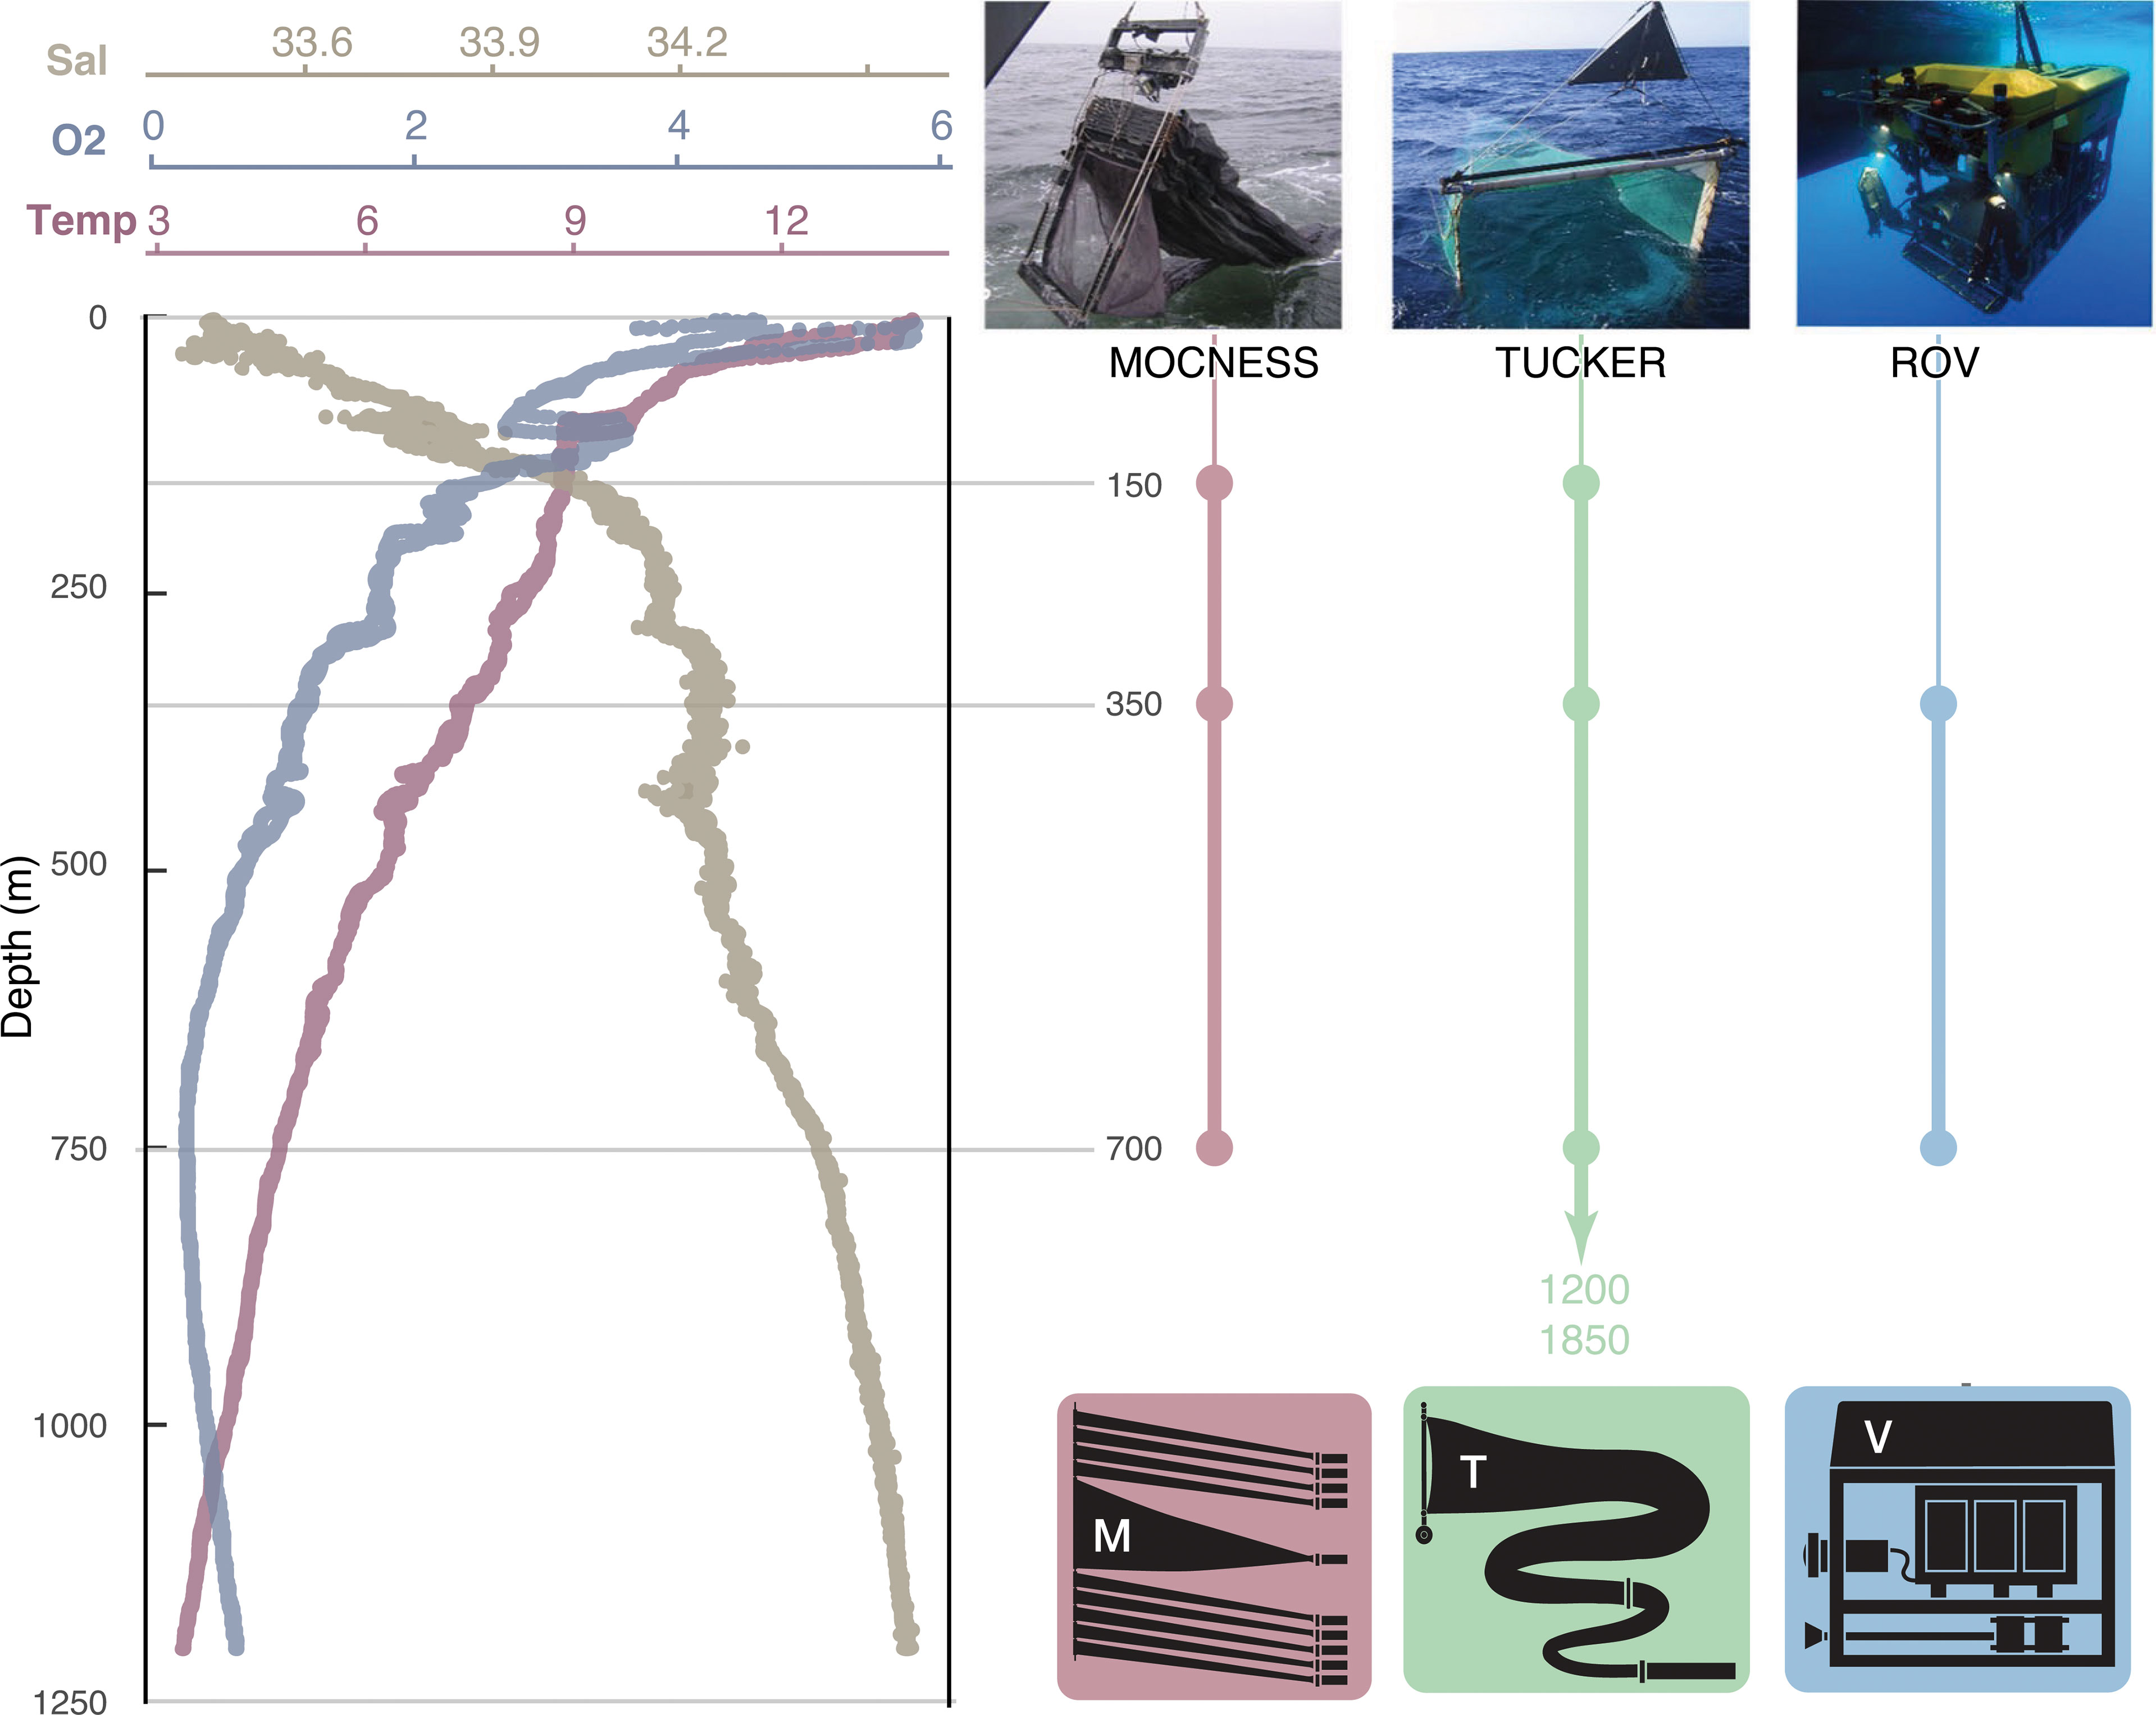
Figure 1 Hydrographic variables (salinity, oxygen, and temperature) in Monterey Bay collected from a CTD deployment where trawl and ROV surveys were conducted. Three sampling approaches were used for the collection of zooplankton communities (from left to right): Multiple Opening and Closing Net with Environmental Sensing System (MOCNESS) (photo credit: SHD Haddock), Tucker trawl (photo credit: SHD Haddock), and a remotely operated vehicle (ROV) equipped with high-definition cameras to record video observations of organisms (photo credit: Monterey Bay Aquarium Research Institute). Three sampling depths were targeted in the epi- and mesopelagic. Not pictured are two additional Tucker trawl sampling depths in the bathypelagic (1200 and 1850 m). See Table 1 for precise depth ranges for each trawl.
The cod end of the Tucker trawl closes when the net is closed at depth and is thermally insulated to reduce heat shock and damage to specimens (Childress et al., 1978). The trawls were towed obliquely over 100m depth range, with the net opened deeper than target depth and closed shallower than the target depth (Table 1). Trawls were conducted during the daytime at a constant speed of 1.5 knots. This low speed reduces damage to gelatinous specimens in the net (Thuesen and Childress, 1994). We targeted three depths habitats in the epi- and mesopelagic, hereafter referred to as 150, 350, and 750 m, although the depth ranges are ±50 meters, and specific depths differed slightly between trawl systems (Table 1). The midpoint depths of MOCNESS trawls were 150, 350, and 750 m and the midpoint depths for Tucker trawls were 150, 420, and 690 (Table 1). Two additional deployments of the Tucker trawl were conducted at greater depths (midpoint depths were 1195 and 1845 m; hereafter referred to as T-1200 and T-1850) in Monterey Bay (Table 1).
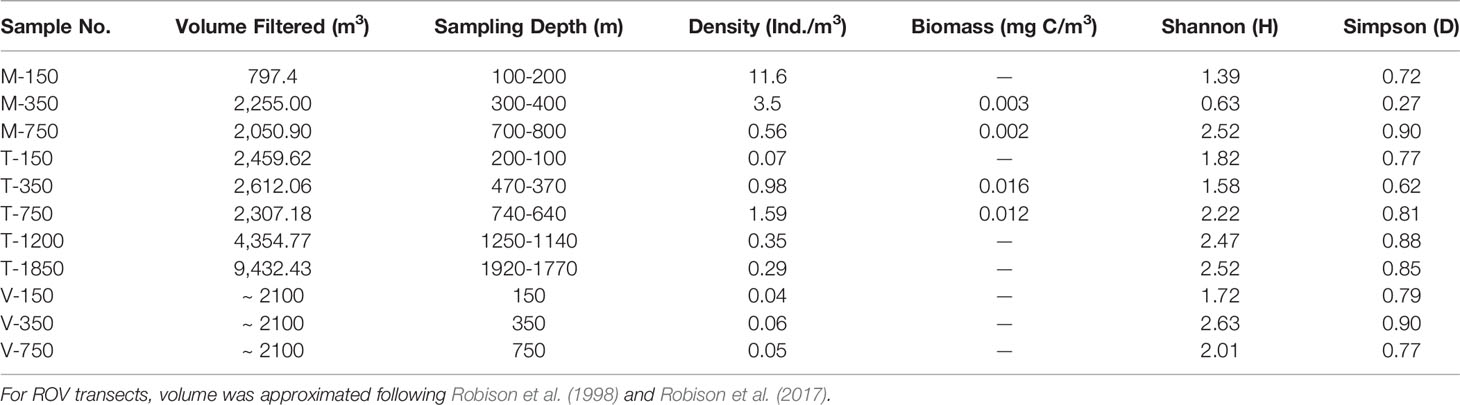
Table 1 Summary of volume filter and depths (meters) where the net was open and obliquely towed, animal density, carbon biomass, and diversity indices for each community, where M = MOCNESS, T = Tucker, and V = ROV video.
On the R/V Point Lobos, MBARI’s electro-hydraulic ROV Ventana was also used to quantify community composition. The ROV was equipped with a high-resolution video camera system and sensors to collect environmental data (e.g., temperature, oxygen, salinity, etc.). ROV transects were conducted through depth ranges targeting 150, 350 and 750 m for 10 minutes each at a constant speed (55 cm s-1) between 09:00 and 13:00 local time (-122.14°W, 36.54°N). The main video camera was set at its widest angle to maximize the field of view. Transect videos were annotated using MBARI’s Video Annotation and Reference System (VARS – Schlining and Jacobsen Stout, 2006), whereby scientists carefully identified and enumerated organisms captured by ROV videos. ROV speed and field of view, and transect lengths were used to estimate water volume, following Robison et al. (1998) and Robison et al. (2017). The ROV was piloted at 0.5 m s-1 and the average field area visualized was 7 m2 at a focal distance of 1.5 m (R.E. Sherlock, pers. comm.). Transect length was 300 m and volume was approximately 2,100 m3 per transect (Table 1). This volume estimate was used to estimate animal density (individuals/m3) in ROV samples (Table 1).
Net-collected zooplankton were enumerated at sea and identified to the most-specific taxonomic level possible, which varied among taxa. Some specimens were frozen in pre-weighed vials for later processing in the lab. ROV videos were comprehensively annotated on a later date, where animals were counted and identified. We collected physical specimens from trawls and estimated biomass and carbon content to examine the contribution of different taxa to overall community composition. To calculate animal density in trawl samples, we estimated water volume filtered from flow meters and divided the individual counts by the water volume (Table 1). We estimated biomass and carbon content of animals in trawl samples at 350 and 750 m, where specimen wet weights were estimated based on settling volume at sea or measured on frozen specimens in the lab after the cruise. Wet weights were then converted to dry weight using taxon-specific conversion factors (Table ST1). Dry weights were subsequently converted to carbon content (%) using taxon-specific conversion factors from the literature (Table ST1). The same conversion factors were used for samples from both trawl systems.
Microbial Sample Collection and Processing
Seawater samples were collected using Niskin bottles deployed on a CTD rosette on the R/V Point Sur between trawls to quantify microbial abundance and biomass. Samples were collected at four depths (150, 350, 750, and 1150 m). Seawater samples were preserved and stored at -80°C until later batch analysis at the University of Hawaii SOEST Flow Cytometry Facility (www.soest.hawaii.edu/sfcf). Microbial cells were enumerated using flow cytometry (Selph et al., 2011). In brief, samples (0.1 mL) were thawed in batches, stained with the DNA dye Hoechst 33342 (1 µg/mL final), then run on a Beckman-Coulter EPICS Altra flow cytometer, using colinear dual laser excitation (488 nm,1 W; UV, 225 mW) and a Harvard apparatus syringe pump for volumetric sample delivery. Polystyrene beads (0.5 µm and 1 µm diameter) were used to normalize fluorescence and scatter signals. Resulting FCS listmode files were analyzed using FlowJo software (Treestar, Inc.) to distinguish microbial populations based on their fluorescence signals (chlorophyll, phycoerythrin, DNA), as well as forward and right-angle light scatter. Heterotrophic bacteria were distinguished from phytoplankton by their DNA-dye signature and absence of pigment. Prochlorococcus and Synechococcus were separated from larger eukaryotic phytoplankton by their light scatter signatures, as well as their characteristic pigment and DNA signatures. Other phytoplankton (eukaryotes, mostly 2-20 µm pico- and nano-sized cells given the small volume analyzed) had higher light scatter and more chlorophyll fluorescence per cell.
The abundance estimates at each depth were converted to carbon content (gC/cell) and dry weights using the following cell masses: 10 fgC/cell (heterotrophic bacteria), 32 fgC/cell (Prochlorococcus), 100 fgC/cell (Synechococcus), and 3 pgC/cell (picoeukaryotes) (Garrison et al., 2000; Brown et al., 2008; Selph et al., 2011). At each depth, carbon content was summed across the four groups and was multiplied by the trawl volume to obtain microbial carbon estimates for each trawl. Values were converted between carbon content and dry weight using a conversion factor from the literature (Table ST1).
Data Analyses
Equal levels of taxonomic resolution were not possible across sampling methodologies within a specific animal group. Thus, the taxonomic resolution differed between sampling methodologies and taxa. For comparisons across methods, taxa were binned into broad categories: Chaetognatha, Cnidaria, Crustacea, Ctenophora, Fishes, Tunicata, Polychaeta, Mollusca, and Other (low abundance taxa). For comparisons between trawl samples, we also conducted analyses at the order and family level, as most specimens were identified to genus or family. Statistical analyses were conducted using the programming software R (R Core Team, 2017). The data files and code to replicate analyses are available as supplementary files.
We conducted an Analysis of Similarities (ANOSIM) test to examine significant differences in community composition between groups (sampling methods and depths) using the package ‘vegan’ (Oksanen et al., 2019). We then calculated the Similarities Percentages (SIMPER; function ‘simper’) to quantify the dissimilarity between groups (sampling methods and depths) and identify taxa that were driving patterns of dissimilarity. ANOSIM and SIMPER used Manhattan distances of relative abundances of taxa. We used Manhattan Distance (based on relative abundances) rather than Bray-Curtis Dissimilarity (based on counts) because the volume filtered was unequal between samples (Table 1) and therefore could not use raw count data. We used relative abundances rather than abundance because the ROV volumes were approximations (see above) unlike trawl samples which had more precise volume measurements from flow meters. Dissimilarities were averaged across three depths to compare between methods and across three methods to compare between depths.
Lastly, we were interested in the contributions of bacteria and protists to mesopelagic biomass and how sampling method affected those contributions. Cell counts from flow cytometry were converted to biomass and added to metazoan biomass from MOCNESS and Tucker trawl samples collected at 350 and 750 m. We calculated the percent biomass and carbon contribution of each group.
Results
We identified specimens to the most-specific taxonomic level, which varied across taxa and sampling methodology. Of all the taxa collected by trawls, 71% were identified to genus, 85% were identified to family and almost all specimens were identified to order, except for copepods, which were grouped together for all analyses. The overall taxonomic resolution was lower for ROV video, where only 62% of taxa were identified to family and 49% to genus.
Between the three methods and all depths, we identified 62 orders and 153 families across 11 samples (Figure 2A). Excluding the two deepest Tucker trawls, we found the highest number of orders found in Tucker trawl samples (40), followed by ROV video (35), and lastly, the MOCNESS (29). At a finer taxonomic level, the number of families identified in the five Tucker trawls (81) was substantially higher than the MOCNESS (53) or ROV video data (49). If we included the deepest Tucker trawls, the number of orders and families was 46 and 116, respectively. However, we did not sample these depths with the MOCNESS or ROV. Diversity indices, based on taxonomic order, ranged from 0.63 to 2.63 (H) and 0.27 to 0.90 (D) (Table 1).
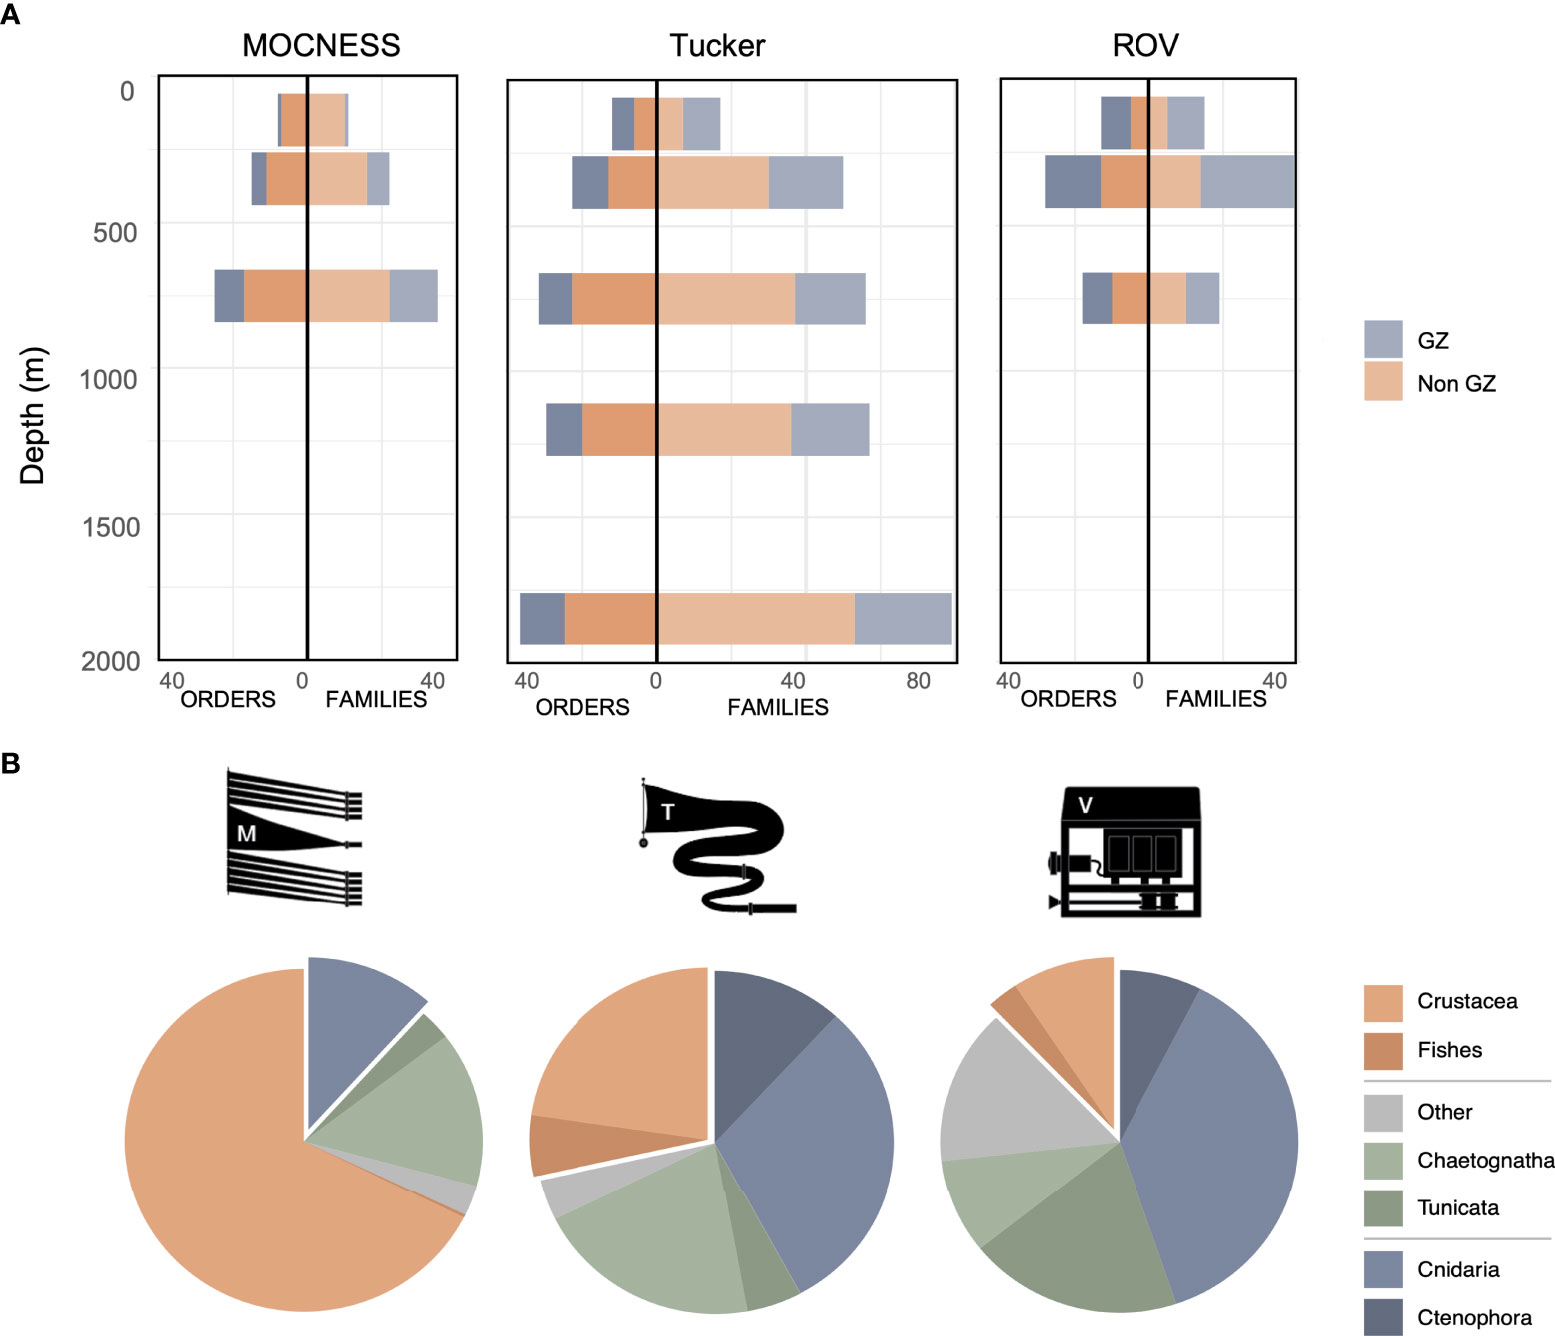
Figure 2 (A) Number of taxonomic orders and families and (B) mean relative abundances (%) of broad taxonomic groups of pelagic animals identified in MOCNESS, Tucker trawl, and ROV video samples in Monterey Bay. Taxa in (A) were grouped into gelatinous zooplankton (GZ; cnidarians, ctenophores, tunicates) or non-gelatinous taxa (crustaceans, fishes, mollusks, worms). Pie slices in (B) for gelatinous animals (blue) and crustaceans (orange) are isolated to highlight the primary differences between sampling methods.
The three most abundant taxa in MOCNESS tows were crustaceans (67.6%), chaetognaths (14.6%), and cnidarians (11.7%). Compared to the MOCNESS, the Tucker trawls were less dominated by crustaceans and collected a more diverse community, where the three most abundant taxa were cnidarians (30.3%), chaetognaths (20.5%), and ctenophores (11.8%). The three most abundant taxa in the ROV video were soft-bodied animals: cnidarians (37.3%), tunicates (19.4%), and other (14.6%; Figure 2B; Table ST2), which was largely composed of polychaetes (Annelida).
An Analysis of Similarities (ANOSIM) based on relative abundances of taxa also indicated that differences in community composition were significant between sampling methods (F = 3.4, R2 = 0.53, p = 0.01). Dissimilarity, quantified by SIMPER (based on Manhattan Distances) was highest between the MOCNESS and ROV (65.8% dissimilar), followed by the MOCNESS and Tucker trawl (61.2%). The Tucker trawl and ROV videos sampled communities that were more similar in taxonomic composition (52.4%) than the Tucker trawl and MOCNESS.
When samples were grouped by depth across all sampling methods, there were 22 orders and 34 families found in the epipelagic, which is lower than the number of orders and families found at 350 m (40 and 85, respectively) and 750 m (45 and 79). Crustaceans were the most abundant taxa at 150 m (32.3%) and 350 m (32.9%). At 750 m, the dominant taxa were more evenly distributed among cnidarians (38.1%) and crustaceans (32.3%; Figure SF1; Table ST2). Taxonomic composition was the most dissimilar between 350 and 750 m (57.4%), followed by the 150 and 750 m (52.9%), and lastly between the 150 and 350 m (55.2%). These differences across depth were not statistically significant (ANOSIM; F = 1.14, R2 = 0.14, p = 0.33).
Animal density was highest in the MOCNESS and lowest in the ROV video (Table 1). Biomass estimates were substantially higher for samples collected by Tucker trawls at 350 and 750 m (0.016 and 0.012 mg C/m3, respectively) compared to MOCNESS tows at the same depths (0.003 and 0.002 mg C/m3, respectively) (Table 1). Overall, zooplankton biomass was higher than microbial biomass at both depths. Due to the biomass differences between trawl systems, the relative contributions of microbial biomass were lower in the Tucker trawls from 350 and 750 m (9 and 8%, respectively) compared to the MOCNESS trawls (48 and 53%) at the same depths (Figure 3; ST3).
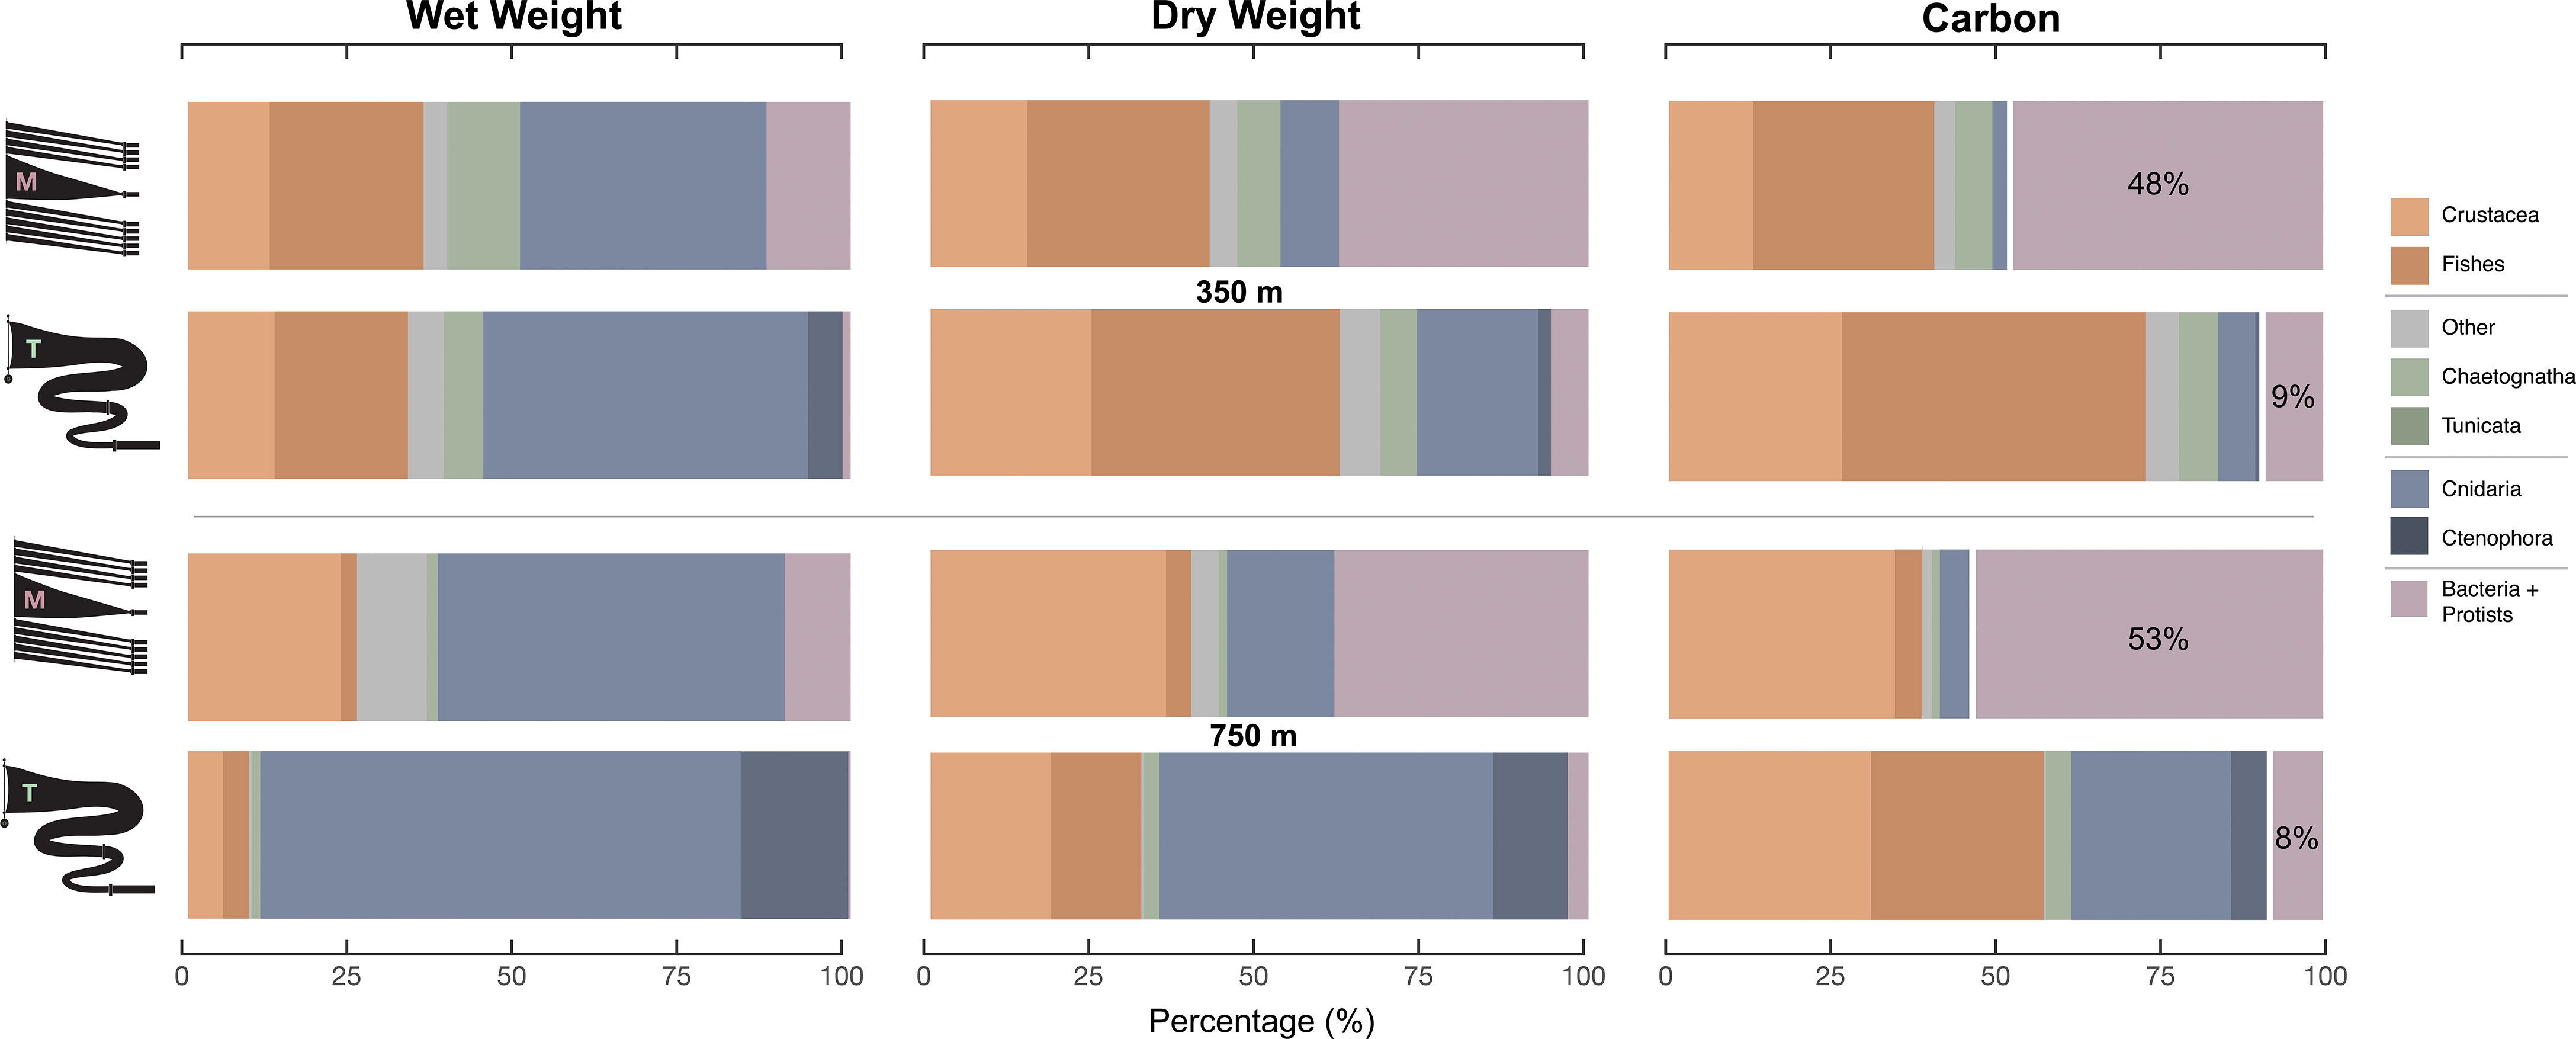
Figure 3 Percentage wet weight, dry weight, and carbon for zooplankton broad taxonomic groups and microbes in Monterey Bay identified in MOCNESS and Tucker trawls at 350 (top) and 750 m (bottom). Bars that represent the relative carbon contributions of bacteria and protists are isolated and their values are shown to highlight the differences between trawl types.
Discussion
Community Composition
Our results indicate that sampling methodology dictates the structure of the pelagic community by species composition, numbers, and weights. The most pronounced difference was between the MOCNESS samples, which were primarily composed of hard-bodied crustaceans, and ROV video, which collected a substantial proportion of soft-bodied taxa but largely omits copepods. Further, the dissimilarity between the Tucker trawl and ROV video was driven by minor differences in the relative abundances of several taxa (cnidarians, chaetognaths, ctenophores, and tunicates), whereas the dissimilarities between the MOCNESS and ROV videos were primarily driven by large differences in the proportions of two taxa (cnidarians and crustaceans) between those sampling methods (Figure SF2), suggesting more prominent differences in community composition. The ROV sampling thus captured a higher proportion of gelatinous and soft-bodied organisms (cnidarians, tunicates, ctenophores, and polychaetes) compared to net tows, which highlights the challenges of using nets to sample the full diversity and abundance of gelatinous zooplankton. Chaetognaths were the second most abundant group in both trawls but ranked fifth in abundance in ROV samples.
Within trawl samples, a large range of body sizes was collected, with a wide variety of wet weights and water contents. The largest contributors to wet weight, dry weight, or carbon content were not necessarily the most numerically abundant taxa. For example, cnidarians have higher water content (95%) compared to fishes (80%) (Table ST1). As a result, in three of four trawls where we estimated carbon compositions, hard-bodied crustacean and fishes were the highest metazoan contributors. Cnidarians and ctenophores comprised a substantial proportion of Tucker trawl wet weight biomass, but contributed less to dry weight and carbon content (Figure 3).
Estimating microbial and metazoan biomass and comparing biomass between two trawl types illustrates how sampling methods can substantially affect our perceptions of community composition. Biomass estimates from Tucker trawl samples were substantially higher than those from the MOCNESS, and thus microbes comprised a smaller percentage (< 10%) of community biomass, compared to MOCNESS samples. Using MOCNESS data, therefore, would suggest that microbes represent more than half of the community carbon, whereas based on Tucker trawl data, microbes represent 7x less than carbon from metazoans. The large difference in microbial carbon contributions between the MOCNESS and Tucker trawls highlights the need to understand how sampling gear affects biomass estimates before extrapolating such estimates to regional or global scales.
Sampling Gear Performance
Given the concurrent sampling design we employed, we were able to co-collect samples and account for spatio-temporal shifts in community composition. Thus, the pronounced differences in community composition and biomass were likely driven by differences in gear performance between the three sampling approaches. Inherent biases and gear performance differ across sampling approaches and directly affects the types and abundances of animals captured. For net tow systems, it is well known that towing speed and mesh and mouth size can influence both trawl performance and catch composition (Broughton and Lough, 2006; Skjoldal et al., 2013; Kwong et al., 2018; Giachini Tosetto et al., 2019). In this study, the Tucker trawl and MOCNESS were both towed at 1.5 knots to facilitate the collection of gelatinous animals and minimize the possibility that towing speed itself contributed to taxonomic differences between sampling techniques.
Differences in composition and overall biomass between the MOCNESS and Tucker trawls were likely driven by differences in the physical structure of the net tow systems. First, the Tucker trawl had a larger mouth area and much more gradual taper than the MOCNESS, which may account for some differences in catch composition. Although we did not examine the size structure of specimens in this study, it is possible that larger, more active micronekton were able to avoid the smaller MOCNESS frame compared to the Tucker trawl. However, the primary differences we found in community composition between trawl methods were related to hard-bodied versus soft-bodied animals, which is not likely to be explained by mouth area.
It is more probable that differences in net mesh size and cod-end size and structure between the Tucker trawl and MOCNESS contributed to differences in catch composition. Previous studies have demonstrated differences in zooplankton community composition based on trawl mesh sizes (Skjoldal et al., 2013; Hosia et al., 2017; Giachini Tosetto et al., 2019). Finer mesh retains smaller organisms but decreases overall filtration volume and may therefore increase the avoidance of mobile animals. In this study, the Tucker trawl fore-net was ~4x the length of the MOCNESS net but was tapered, with a smaller mesh size than the MOCNESS. This design was used to reduce filtration pressure on the net, which minimizes the extrusion of animals out of the net compared to the MOCNESS. Thus, the Tucker trawl was better equipped for keeping gelatinous animals intact and extruded fewer animals from the net.
The styles of cod-ends also likely contributed to differences in community composition between trawl methods. The Tucker trawl was equipped with a large (30 L), insulated cod-end with closing capabilities (Childress et al., 1978). The cod-end was closed at a specific depth, allowing the contents of the trawl to be brought up to the surface at a temperature similar to the seawater temperature at the collection depth (Childress et al., 1978) and with minimal damage during the long recovery to the surface. The thermal insulation of trawl contents increases the likelihood that certain taxa, specifically fragile medusae, siphonophores, and ctenophores are recovered intact. In contrast, each net for the MOCNESS was equipped with a standard cod-end that was not insulated or closed when the net was shut. Additionally, MOCNESS nets are collapsed, so the upper and lower surfaces of the nets abrade against each other, and the organisms may be repeatedly washed in and out of the open cod-ends. The trawl contents in the MOCNESS were more likely to be damaged as the net travels through the water column before it retrieved at the surface.
The insulated cod-end and fine mesh on the Tucker trawl likely contributed to the greater taxonomic similarities with ROV compared to the MOCNESS samples. The Tucker trawl, similar to the ROV video, was able to capture many fragile animals, which is evidenced by the higher abundance of gelatinous taxa. These results differ from previous studies indicating catch composition from midwater trawls is dominated by fishes (e.g., Davison et al., 2013) and may be driven by differences in the cod-ends, mesh size, or towing speed between studies. Since ROV sampling was non-destructive, it was the only method that captured the most physically delicate taxa, such as certain species of physonect siphonophores, ctenophores (particularly lobates), and larvaceans. However, ROV-based methods likely under-sample visual predators, highly mobile animals, and animals that are deterred by (or oversample those attracted to) the ROV’s bright lights and considerable noise. Further, ROVs under-sample small zooplankton that are difficult to visually detect on video, especially while the vehicle is in motion as was the case for data collection here. While the MOCNESS was clearly dominated by hard-bodied crustaceans, and the ROV videos were dominated by soft-bodied animals, the Tucker trawl captured the highest number of taxonomic orders and families, including some delicate taxa.
Conclusions
There are numerous challenges to collecting diverse zooplankton and micronekton assemblages and no single sampling approach is adequately suited to capture the entire community. Therefore, a variety of approaches have been developed to target specific taxa and ecosystems. Here we provided a comparison based on a limited number of samples. Our results demonstrate that sampling approach substantially influences quantification of community composition. Video and Tucker trawls are sampling methods that highlight the diversity and abundance of gelatinous organisms that are often destroyed using a MOCNESS approach, whereas MOCNESS trawls capture a higher biomass of crustaceans. The MOCNESS is also convenient for sampling many discrete layers of the water column, unlike single-net trawl systems. Beyond taxonomic differences, our biomass estimates in Tucker trawl samples were an order of magnitude higher than estimates from MOCNESS samples. Our results illustrate that the relative importance of microbes to overall community biomass and carbon content are highly dependent on the method used to sample the community.
Future studies are needed to further quantify differences between visual and trawl methods, particularly in the bathypelagic, where sampling is less frequent and soft-bodied animals are likely bigger contributors to abundance, diversity, and biomass (Robison, 2004). Complementary sampling approaches have improved our estimates of biomass and community composition. For example, recent studies have quantified community composition using acoustics, net tows, and videos (Blanluet et al., 2019), examined diel vertical migration by combining eDNA and acoustic methods (Easson et al., 2020), and shown how fish biomass estimated from trawls is underestimated compared to acoustic estimates due to net avoidance (Kaartvedt et al., 2012). Complementing trawl surveys with visual methods could provide valuable data on soft-bodied taxa that are less frequently captured by net tows. However, we recognize that using multiple sampling approaches is logistically challenging, operationally expensive, and may not be feasible.
As fisheries expand further into the deep ocean (Watson and Morato, 2013) and deep pelagic ecosystems are increasingly affected by a suite of anthropogenic stressors, such as pollution (Taylor et al., 2016; Choy et al., 2019), deep-sea mining (Drazen et al., 2020), ocean acidification (Sabine et al., 2004), and deoxygenation (Doney et al., 2011; Levin and Le Bris, 2015; Danovaro et al., 2017), measurements of biodiversity and community composition are essential for providing baseline data and for predicting the responses of communities to various pressures and environmental change.
Data Availability Statement
The datasets presented in this study and code to reproduce figures can be found in the Supplementary Material.
Author Contributions
We confirm that all authors have contributed to this manuscript: SH and ET led the study’s conception and data acquisition, EH and AC led formal data analyses and EH wrote the initial draft of the manuscript. All authors contributed substantially to reviewing and editing the manuscript and approve of its submission to Frontiers in Marine Science.
Funding
This research was supported by the Census of Marine Life project of the Alfred P. Sloan Foundation through a subaward to SH and ET from the Census of Marine Zooplankton, administered by Ann Bucklin, Shuhei Nishida, and Sigrid Schiel. Additional ship time and funding were provided by the Office of Naval Research, the David and Lucile Packard Foundation, and National Science Foundation Awards OCE-1829812 to AC, OCE-1829805 to SH and DEB-1542673 to ET.
Conflict of Interest
The authors declare that the research was conducted in the absence of any commercial or financial relationships that could be construed as a potential conflict of interest.
Publisher’s Note
All claims expressed in this article are solely those of the authors and do not necessarily represent those of their affiliated organizations, or those of the publisher, the editors and the reviewers. Any product that may be evaluated in this article, or claim that may be made by its manufacturer, is not guaranteed or endorsed by the publisher.
Acknowledgments
We thank the many people on board the R/V Point Lobos and R/V Point Sur who assisted with data collection and sample processing, including Erich Horgan, Christine Herren, Christine Schnitzler, Kyra Schlining, Brad Seibel, Karen Osborn, Fred Pleijel, Trisha Towanda, William Browne, Pincelli Hull, Alison Sweeney, Susan von Thun, Kurt Buck, and Karen Selph. Erich Horgan assembled and operated the MOCNESS during our cruise, and James Childress loaned us the Tucker trawl.
Supplementary Material
The Supplementary Material for this article can be found online at: https://www.frontiersin.org/articles/10.3389/fmars.2022.864004/full#supplementary-material
Supplementary Figure 1 | Wet weight, dry weight, and carbon biomass for major taxa collected in trawl samples at 350 and 750 m.
Supplementary Figure 2 | Taxonomic identification, counts, and weights for community samples collected by three sampling approaches.
Supplementary Figure 3 | R Markdown file to reproduce figures in the manuscript.
Supplementary Figure 4 | Supplementary Figures and Tables.
References
Ariza A., Garijo J. C., Landeira J. M., Bordes F., Hernández-León S. (2015). Migrant Biomass and Respiratory Carbon Flux by Zooplankton and Micronekton in the Subtropical Northeast Atlantic Ocean (Canary Islands). Prog. Oceanogr. 134, 330–342. doi: 10.1016/j.pocean.2015.03.003
Bar-On Y. M., Phillips R., Milo R. (2018). The Biomass Distribution on Earth. Proc. Natl. Acad. Sci. 115, 6506 LP – 6511. doi: 10.1073/pnas.1711842115
Blanluet A., Doray M., Berger L., Romagnan J. B., Le Bouffant N., Lehuta S., et al. (2019). Characterization of Sound Scattering Layers in the Bay of Biscay Using Broadband Acoustics, Nets and Video. PloS One 14 (10), e0223618. doi: 10.1371/journal.pone.0223618
Broughton E. A., Lough R. G. (2006). A Direct Comparison of MOCNESS and Video Plankton Recorder Zooplankton Abundance Estimates: Possible Applications for Augmenting Net Sampling With Video Systems. Deep Res. Part II Top. Stud. Oceanogr, 2789–2807. doi: 10.1016/j.dsr2.2006.08.013
Brown S. L., Landry M. R., Selph K. E., Yang E. J., Rii Y. M., Bidigare R. R. (2008). Diatoms in the Desert: Plankton Community Response to a Mesoscale Eddy in the Subtropical North Pacific. Deep Res. Part II Top. Stud. Oceanogr. 55 (10-13), 1321–1333. doi: 10.1016/j.dsr2.2008.02.012
Childress J. J., Barnes A. T., Quetin L. B., Robison B. H. (1978). Thermally Protecting Cod Ends for the Recovery of Living Deep-Sea Animals. Deep Sea Res. 25, 419–422. doi: 10.1016/0146-6291(78)90568-4
Choy C. A., Haddock S. H. D., Robison B. H. (2017). Deep Pelagic Food Web Structure as Revealed by in Situ Feeding Observations. Proc. R. Soc B Biol. Sci. 284, 20172116. doi: 10.1098/rspb.2017.2116
Choy C. A., Portner E., Iwane M., Drazen J. C. (2013). Diets of Five Important Predatory Mesopelagic Fishes of the Central North Pacific. Mar. Ecol. Prog. Ser. 492, 169–184. doi: 10.3354/meps10518
Choy C. A., Robison B. H., Gagne T. O., Erwin B., Firl E., Halden R. U. (2019). The Vertical Distribution and Biological Transport of Marine Microplastics Across the Epipelagic and Mesopelagic Water Column. Scientific Reports 9 (1), 1–9. doi: 10.1038/s41598-019-44117-2
Danovaro R., Corinaldesi C., Dell’Anno A., Snelgrove P. V. R. (2017). The Deep-Sea Under Global Change. Curr. Biol. 27, R461–R465. doi: 10.1016/j.cub.2017.02.046
Davison P. C., , Checkley D. M. Jr, Koslow J. A., Barlow J. (2013). Carbon Export Mediated by Mesopelagic Fishes in the Northeast Pacific Ocean. Progr. Oceanogr 116, 14–30. doi: 10.1016/j.pocean.2013.05.013
Doney S. C., Ruckelshaus M., Duffy J. E., Barry J. P., Chan F., English C. A., et al (2011). Climate Change Impacts on Marine Ecosystems. Ann. Rev. Mar. Sci. 4, 11–37. doi: 10.1146/annurev-marine-041911-111611
Drazen J. C., Smith C. R., Gjerde K. M., Haddock S. H., Carter G. S., Choy C. A., et al (2020). Opinion: Midwater Ecosystems Must be Considered When Evaluating Environmental Risks of Deep-Sea Mining. Proc. Natl. Acad. Sci. 117, 17455 LP – 17460. doi: 10.1073/pnas.2011914117
Duffy L. M., Kuhnert P. M., Pethybridge H. R., Young J. W., Olson R. J., Logan J. M., et al (2017). Global Trophic Ecology of Yellowfin, Bigeye, and Albacore Tunas: Understanding Predation on Micronekton Communities at Ocean-Basin Scales. Deep Sea Res. Part II Top. Stud. Oceanogr 140, 55–73. doi: 10.1016/j.dsr2.2017.03.003
Easson C. G., Boswell K. M., Tucker N., Warren J. D., Lopez J. V. (2020). Combined eDNA and Acoustic Analysis Reflects Diel Vertical Migration of Mixed Consortia in the Gulf of Mexico. Front. Mar. Sci. 7. doi: 10.3389/fmars.2020.00552
Garrison D. L., Gowing M. M., Hughes M. P., Campbell L., Caron D. A., Dennett M. R., et al. (2000). Microbial Food Web Structure in the Arabian Sea: A US JGOFS Study Deep Sea Res. Part II Top. Stud. Oceanogr. 47, 1387–1422. doi: 10.1016/S0967-0645(99)00148-4
Giachini Tosetto E., Neumann-Leitão S., Nogueira Júnior M. (2019). Sampling Planktonic Cnidarians With Paired Nets: Implications of Mesh Size on Community Structure and Abundance. Estuar. Coast. Shelf Sci. 220, 48–53. doi: 10.1016/j.ecss.2019.02.027
Haddock S. H. D. (2004). A Golden Age of Gelata: Past and Future Research on Planktonic Ctenophores and Cnidarians. Hydrobiologia 530, 549–556. doi: 10.1007/s10750-004-2653-9
Haddock S. H. D., Christianson L. M., Francis W. R., Martini S., Dunn C. W., Pugh P. R., et al (2018). Insights Into the Biodiversity, Behavior, and Bioluminescence of Deep-Sea Organisms: Using Molecular and Maritime Technology. Oceanography 30 (4), 38–47. doi: jstor.org/stable/26367624
Hays G. C., Doyle T. K., Houghton J. D. R. (2018). A Paradigm Shift in the Trophic Importance of Jellyfish? Trends Ecol. Evol. 33, 874–884. doi: 10.1016/j.tree.2018.09.001
Henschke N., Everett J. D., Richardson A. J., Suthers I. M. (2016). Rethinking the Role of Salps in the Ocean. Trends Ecol. Evol. 31, 720–733. doi: 10.1016/j.tree.2016.06.007
Hernández-León S., Olivar M. P., Fernández de Puelles M. L., Bode A., Castellón A., López-Pérez C., et al. (2019). Zooplankton and Micronekton Active Flux Across the Tropical and Subtropical Atlantic Ocean. Front. Mar. Sci. 6. doi: 10.3389/fmars.2019.00535
Hosia A., Falkenhaug T., Baxter E. J., Pagès F. (2017). Abundance, Distribution and Diversity of Gelatinous Predators Along the Northern Mid-Atlantic Ridge: A Comparison of Different Sampling Methodologies. PloS One 12, e0187491. doi: 10.1371/journal.pone.0187491
Kaartvedt S., Staby A., Aksnes D. L. (2012). Efficient Trawl Avoidance by Mesopelagic Fishes Causes Large Underestimation of Their Biomass. Mar. Ecol. Prog. Ser. 456, 1–6. doi: 10.3354/meps09785
Kwong L. E., Pakhomov E. A., Suntsov A. V., Seki M. P., Brodeur R. D., Pakhomova L. G., et al. (2018). An Intercomparison of the Taxonomic and Size Composition of Tropical Macrozooplankton and Micronekton Collected Using Three Sampling Gears. Deep Sea Res. Part I Oceanogr. Res. Pap. 135, 34–45. doi: 10.1016/j.dsr.2018.03.013
Levin L. A., Le Bris N. (2015). The Deep Ocean Under Climate Change. Science 350 (6262), 766–768. doi: 10.1126/science.aad0126
Martini S., Haddock S. H. D. (2017). Quantification of Bioluminescence From the Surface to the Deep Sea Demonstrates its Predominance as an Ecological Trait. Sci. Rep. 7, 45750. doi: 10.1038/srep45750
Oksanen J., Blanchet F. G., Friendly M., Kindt R., Legendre P., McGlinn D., et al (2019). Vegan: Community Ecology Package. R package version 2.5-6. CRAN.R-project.org/package=vegan.
Pomeroy L. R., leB Williams P. J., Azam F., Hobbie J. R. (2007). The Microbial Loop. Oceanography 20 (2), 28–33. doi: 10.5670/oceanog.2007.45
Potier M., Marsac F., Cherel Y., Lucas V., Sabatié R., Maury O., et al. (2007). Forage Fauna in the Diet of Three Large Pelagic Fishes (Lancetfish, Swordfish and Yellowfin Tuna) in the Western Equatorial Indian Ocean. Fish Res. 83, 60–72. doi: 10.1016/j.fishres.2006.08.020
R Core Team (2017). “R: A Language and Environment for Statistical Computing,” in R Foundation for Statistical Computing (Vienna, Austria). Available at: https://www.R-project.org/.
Robison B. H. (2004). Deep Pelagic Biology. J. Exp. Mar. Bio. Ecol. 300, 253–272. doi: 10.1016/j.jembe.2004.01.012
Robison B. H., Reisenbichler K. R., Sherlock R. E. (2017). The Coevolution of Midwater Research and ROV Technology at MBARI. Oceanography 30 (4), 26–37. doi: 10.5670/oceanog.2017.421
Robison B. H., Reisenbichler K. R., Sherlock R. E., Silguero J. M., Chavez F. P. (1998). Seasonal Abundance of the Siphonophore, Nanomia Bijuga. Monterey Bay Deep-Sea Res. I 45 (8-9), 1741–1751. doi: 10.1016/S0967-0645(98)80015-5
Sabine C. L., Feely R. A., Gruber N., Key R. M., Lee K., Bullister J. L., et al. (2004). The Oceanic Sink for Anthropogenic CO2. Science 305, 367–371. doi: 10.1126/science.1097403
Schlining B. M., Jacobsen Stout N. J. (2006). “MBARI’s Video Annotation and Reference System”, OCEANS. pp. 1–5. doi: 10.1109/OCEANS.2006.306879
Selph K. E., Landry M. R., Taylor A. G., Yang E. J., Measures C. I., Yang J., et al. (2011). Spatially-Resolved Taxon-Specific Phytoplankton Production and Grazing Dynamics in Relation to Iron Distributions in the Equatorial Pacific Between 110 and 140° W. Deep-Sea Res. Pt. II. 58 (3-4), 358–377. doi: 10.1016/j.dsr2.2010.08.014
Skjoldal H. R., Wiebe P. H., Postel L., Knutsen T., Kaartvedt S., Sameoto D. D. (2013). Intercomparison of Zooplankton (Net) Sampling Systems: Results From the ICES/GLOBEC Sea-Going Workshop. Prog. Oceanogr. 108, 1–42. doi: 10.1016/j.pocean.2012.10.006
Steinberg D. K., Van Mooy B. A., Buesseler K. O., Boyd P. W., Kobari T., Karl D. M. (2008). Bacterial vs. Zooplankton Control of Sinking Particle Flux in the Ocean’s Twilight Zone. Limnol. Oceanogr 53 (4), 1327–1338. doi: 10.4319/lo.2008.53.4.1327
Taylor M. L., Gwinnett C., Robinson L. F., Woodall L. C. (2016). Plastic Microfibre Ingestion by Deep-Sea Organisms. Sci. Rep. 6, 33997. doi: 10.1038/srep33997
Thuesen E. V., Childress J. J. (1994). Oxygen Consumption Rates and Metabolic Enzyme Activities of Oceanic California Medusae in Relation to Body Size and Habitat Depth. Biol. Bull. 187, 84–98. doi: 10.2307/1542168
Watson R. A., Morato T. (2013). . Fishing Down the Deep: Accounting for Within-Species Changes in Depth of Fishing. Fish Res. 140, 63–65. doi: 10.1016/j.fishres.2012.12.004
Wiebe P. H., Benfield M. C. (2003). From the Hensen Net Toward Four-Dimensional Biological Oceanography. Prog. Oceanogr. 56, 7–136. doi: 10.1016/S0079-6611(02)00140-4
Wiebe P. H., Morton A. W., Bradley A. M., Backus R. H., Craddock J. E., Barber V., et al. (1985). New Development in the MOCNESS, an Apparatus for Sampling Zooplankton and Micronekton. Mar. Biol. 87, 313–323. doi: 10.1007/BF00397811
Keywords: mesopelagic, biodiversity, gelatinous zooplankton, community ecology, Monterey Bay
Citation: Hetherington ED, Choy CA, Thuesen EV and Haddock SHD (2022) Three Distinct Views of Deep Pelagic Community Composition Based on Complementary Sampling Approaches. Front. Mar. Sci. 9:864004. doi: 10.3389/fmars.2022.864004
Received: 27 January 2022; Accepted: 08 March 2022;
Published: 07 April 2022.
Edited by:
Daniela Zeppilli, Institut Français de Recherche pour l’Exploitation de la Mer (IFREMER), FranceReviewed by:
Jiawang Chen, Zhejiang University, ChinaChih-Lin Wei, National Taiwan University, Taiwan
Copyright © 2022 Hetherington, Choy, Thuesen and Haddock. This is an open-access article distributed under the terms of the Creative Commons Attribution License (CC BY). The use, distribution or reproduction in other forums is permitted, provided the original author(s) and the copyright owner(s) are credited and that the original publication in this journal is cited, in accordance with accepted academic practice. No use, distribution or reproduction is permitted which does not comply with these terms.
*Correspondence: Elizabeth D. Hetherington, ZWhldGhlcmlAdWNzZC5lZHU=; Steven H. D. Haddock, aGFkZG9ja0BtYmFyaS5vcmc=
†ORCID: Elizabeth D. Hetherington, orcid.org/0000-0001-7114-398X
C. Anela Choy, orcid.org/0000-0002-0305-1159
Erik V. Thuesen, orcid.org/0000-0002-1438-6552
Steven H. D. Haddock, orcid.org/0000-0001-9420-4482