 Dongxing Chen
 Xutao Wang1,2,3†
 Qianqian Liu
 Yafeng Zhang
94% of researchers rate our articles as excellent or good
Learn more about the work of our research integrity team to safeguard the quality of each article we publish.
Find out more
ORIGINAL RESEARCH article
Front. Mar. Sci., 28 June 2022
Sec. Marine Ecosystem Ecology
Volume 9 - 2022 | https://doi.org/10.3389/fmars.2022.863611
This article is part of the Research TopicMultiple Stressors and Ecological Response in Marine Fishery EcosystemsView all 18 articles
Fisheries catch is determined by a complex combination of biological and industrial factors. In this study, using data from the online database Sea Around Us from 1950 to 2018, the risk of fisheries collapse was assessed for the three large marine ecosystems (LMEs) around China by analyzing the carbon transfer efficiency, mean trophic level, and mean maximum length of fisheries catch and expansion factor. In addition, these were compared with the corresponding values for other LMEs, especially the Humboldt Current and the North Sea LMEs, which experienced fisheries collapse.
Our results revealed high carbon transfer efficiencies in LMEs around China, suggesting large fishing efforts compared with LMEs with similar primary production. Although marine fish landings did not decline significantly, they were maintained by potential resources associated with offshore and deep expansion and fishing of lower–trophic-level species and juvenile fish. However, the potential resources have been largely consumed in the East China Sea and South China Sea LMEs, where the ratio of the primary production required to sustain catches to the total primary production (%PPR) was greater than 50%. In contrast, this ratio in the Yellow Sea LME was lower; however, this value was still higher than the sustainable ratio in the Humboldt Current LME. Without proper fisheries management, the three fisheries around China are likely to collapse, as observed in case of the North Sea LME in the 1970s.
Fisheries are supported by embedded ecosystems (Unsworth et al., 2019). Therefore, primary production is a fundamental factor influencing fish production and fisheries catch (Pauly and Christensen, 1995; Watson et al., 2014; Anderson et al., 2019). The relationship between primary production and fisheries catch has been extensively investigated since Oglesby (1977) first reported the empirical relationship between the annual catch of fish and primary production in large fresh water systems (Ware and Thomson, 2005; Capuzzo et al., 2018). However, in marine and estuarine systems, (Nixon, 1982; Nixon, 1992) found that the relationship did not hold, which suggested that primary production was not the only driving factor for fisheries catch.
Although primary production sets the potential for fish production, fisheries catch is determined by a complex combination of biological and industrial factors, such as fishing effort and management policies. For the biological factors, it remains controversial whether long-term sustainable fisheries catches from the global oceans are largely controlled by primary production (bottom-up controls) or by predatory–prey interactions at higher trophic levels (top-down controls) (Ware and Thomson, 2005; Mcowen et al., 2015). This is based on the fact that the reported annual global landings of fish have stagnated around 80 million tons (Mt) with inter-annual fluctuations for many years since 1995 (Watson and Pauly, 2001; Pauly and Froese, 2012). However, fishing capacity, measured by the cumulative power of fishing vessels, has continued to increase, indicating that catches taken per unit of fishing effort have actually declined (Watson et al., 2013; Bell et al., 2017). This suggests that global sustainable harvest limits could be approached (Watson et al., 2014). Considering that the global landings did not show signs of overexploitation or stock collapse (Pauly, 2018), available studies have presented three potential but still debatable reasons contributing to the stable landings: offshore extension of pelagic and demersal fisheries (Watson and Morato, 2013), downtrend of trophic level (Bhathal and Pauly, 2008; Liang and Pauly, 2020), and juvenile fishing (Krumme et al., 2013; Yang et al., 2021).
As one of the most productive fishing zones in the world, coastal oceans around China significantly contribute to seafood production and support food for the high population. Although its fishery-associated resources are crucial for food security and export trade in its bordering countries, studies by Sumaila and Cheung (2015) revealed that some key species sourced from the East and South China Seas are under serious threat due to long-term overfishing, climate change, and other stressors. In this study, fisheries data in the broad coastal oceans around China were comprehensively investigated by considering both biological and industrial controls to assess the vulnerability to collapse of large marine ecosystems (LMEs) in China.
To effectively assess and manage transnational coastal fisheries and environments in the global ocean, scientists divided the ecosystem into LMEs, which are defined as marine ecosystems around the world with unique sets of ecological, oceanographic, and biogeochemical characteristics (Watson et al., 2014; Selig et al., 2019). Coastal LMEs account for 95% of the total annual fisheries catch, although they cover only 20% of the global ocean area (Garibaldi and Limongelli, 2003; Stock et al., 2017). There are three LMEs along China’s coasts: Yellow Sea LME, East China Sea LME, and South China Sea LME. Over 60% of the Yellow Sea and East China Sea are on the continental shelf and are among the most productive parts of the world’s oceans (Chen, 1996). In contrast, the South China Sea LME, located on the tropical–subtropical rim of the western North Pacific Ocean at an average depth of approximately 1212 m (Sumaila, 2019), has low nutrient concentrations throughout the year (Lu et al., 2020). Owing to the distinct geographical and nutrient conditions in the three LMEs, primary production and fisheries catches are distinct; however, only a few studies comparing their fisheries have been performed (Jin and Tang, 1996; Zhang et al., 2018; Pauly and Liang, 2020). The main objectives of this study were to assess the fisheries in the three LMEs around China and to compare them with other LMEs, especially the Humboldt Current and North Sea LMEs, which experienced fisheries collapse.
Carbon transfer efficiency (CTE) and the ratio of primary production required for fisheries catch to total primary production (%PPR) were two important factors for the assessment of fisheries in this research. The CTE is an indicator for estimating fish production and is widely applied in the study of carbon cycling, marine ecosystems, and food web interactions to determine energy transfer efficiency (Degerman et al., 2018; Fakhraee et al., 2020; Eddy et al., 2021). The %PPR is often used to analyze the ecological pressure of different species or systems (Morissette et al., 2012; Ding et al., 2020). A rough measure of CTE from primary production to fisheries is based on the analysis of 63 LMEs (66 LMEs in total; however, the data for the three of them were missing data, and therefore, these were eliminated from the statistics) around the world (Figure 1) was used to evaluate fisheries in the three LMEs around China. To compare the bottom-up and top-down controls, %PPR was assessed under the assumption that the reported marine fish landings effectively reflected total fish production. In addition, the mean maximum length of fish catches, trends in trophic levels, and expansion factors (EFs) were also analyzed to verify whether offshore and deep extension, downtrend of trophic level, and juvenile overfishing occurred in the LMEs around China. Most of the data were obtained from Sea Around Us (https://www.seaaroundus.org, SAU), which is one of the very few databases with near-uniform data regarding major fisheries around the world.
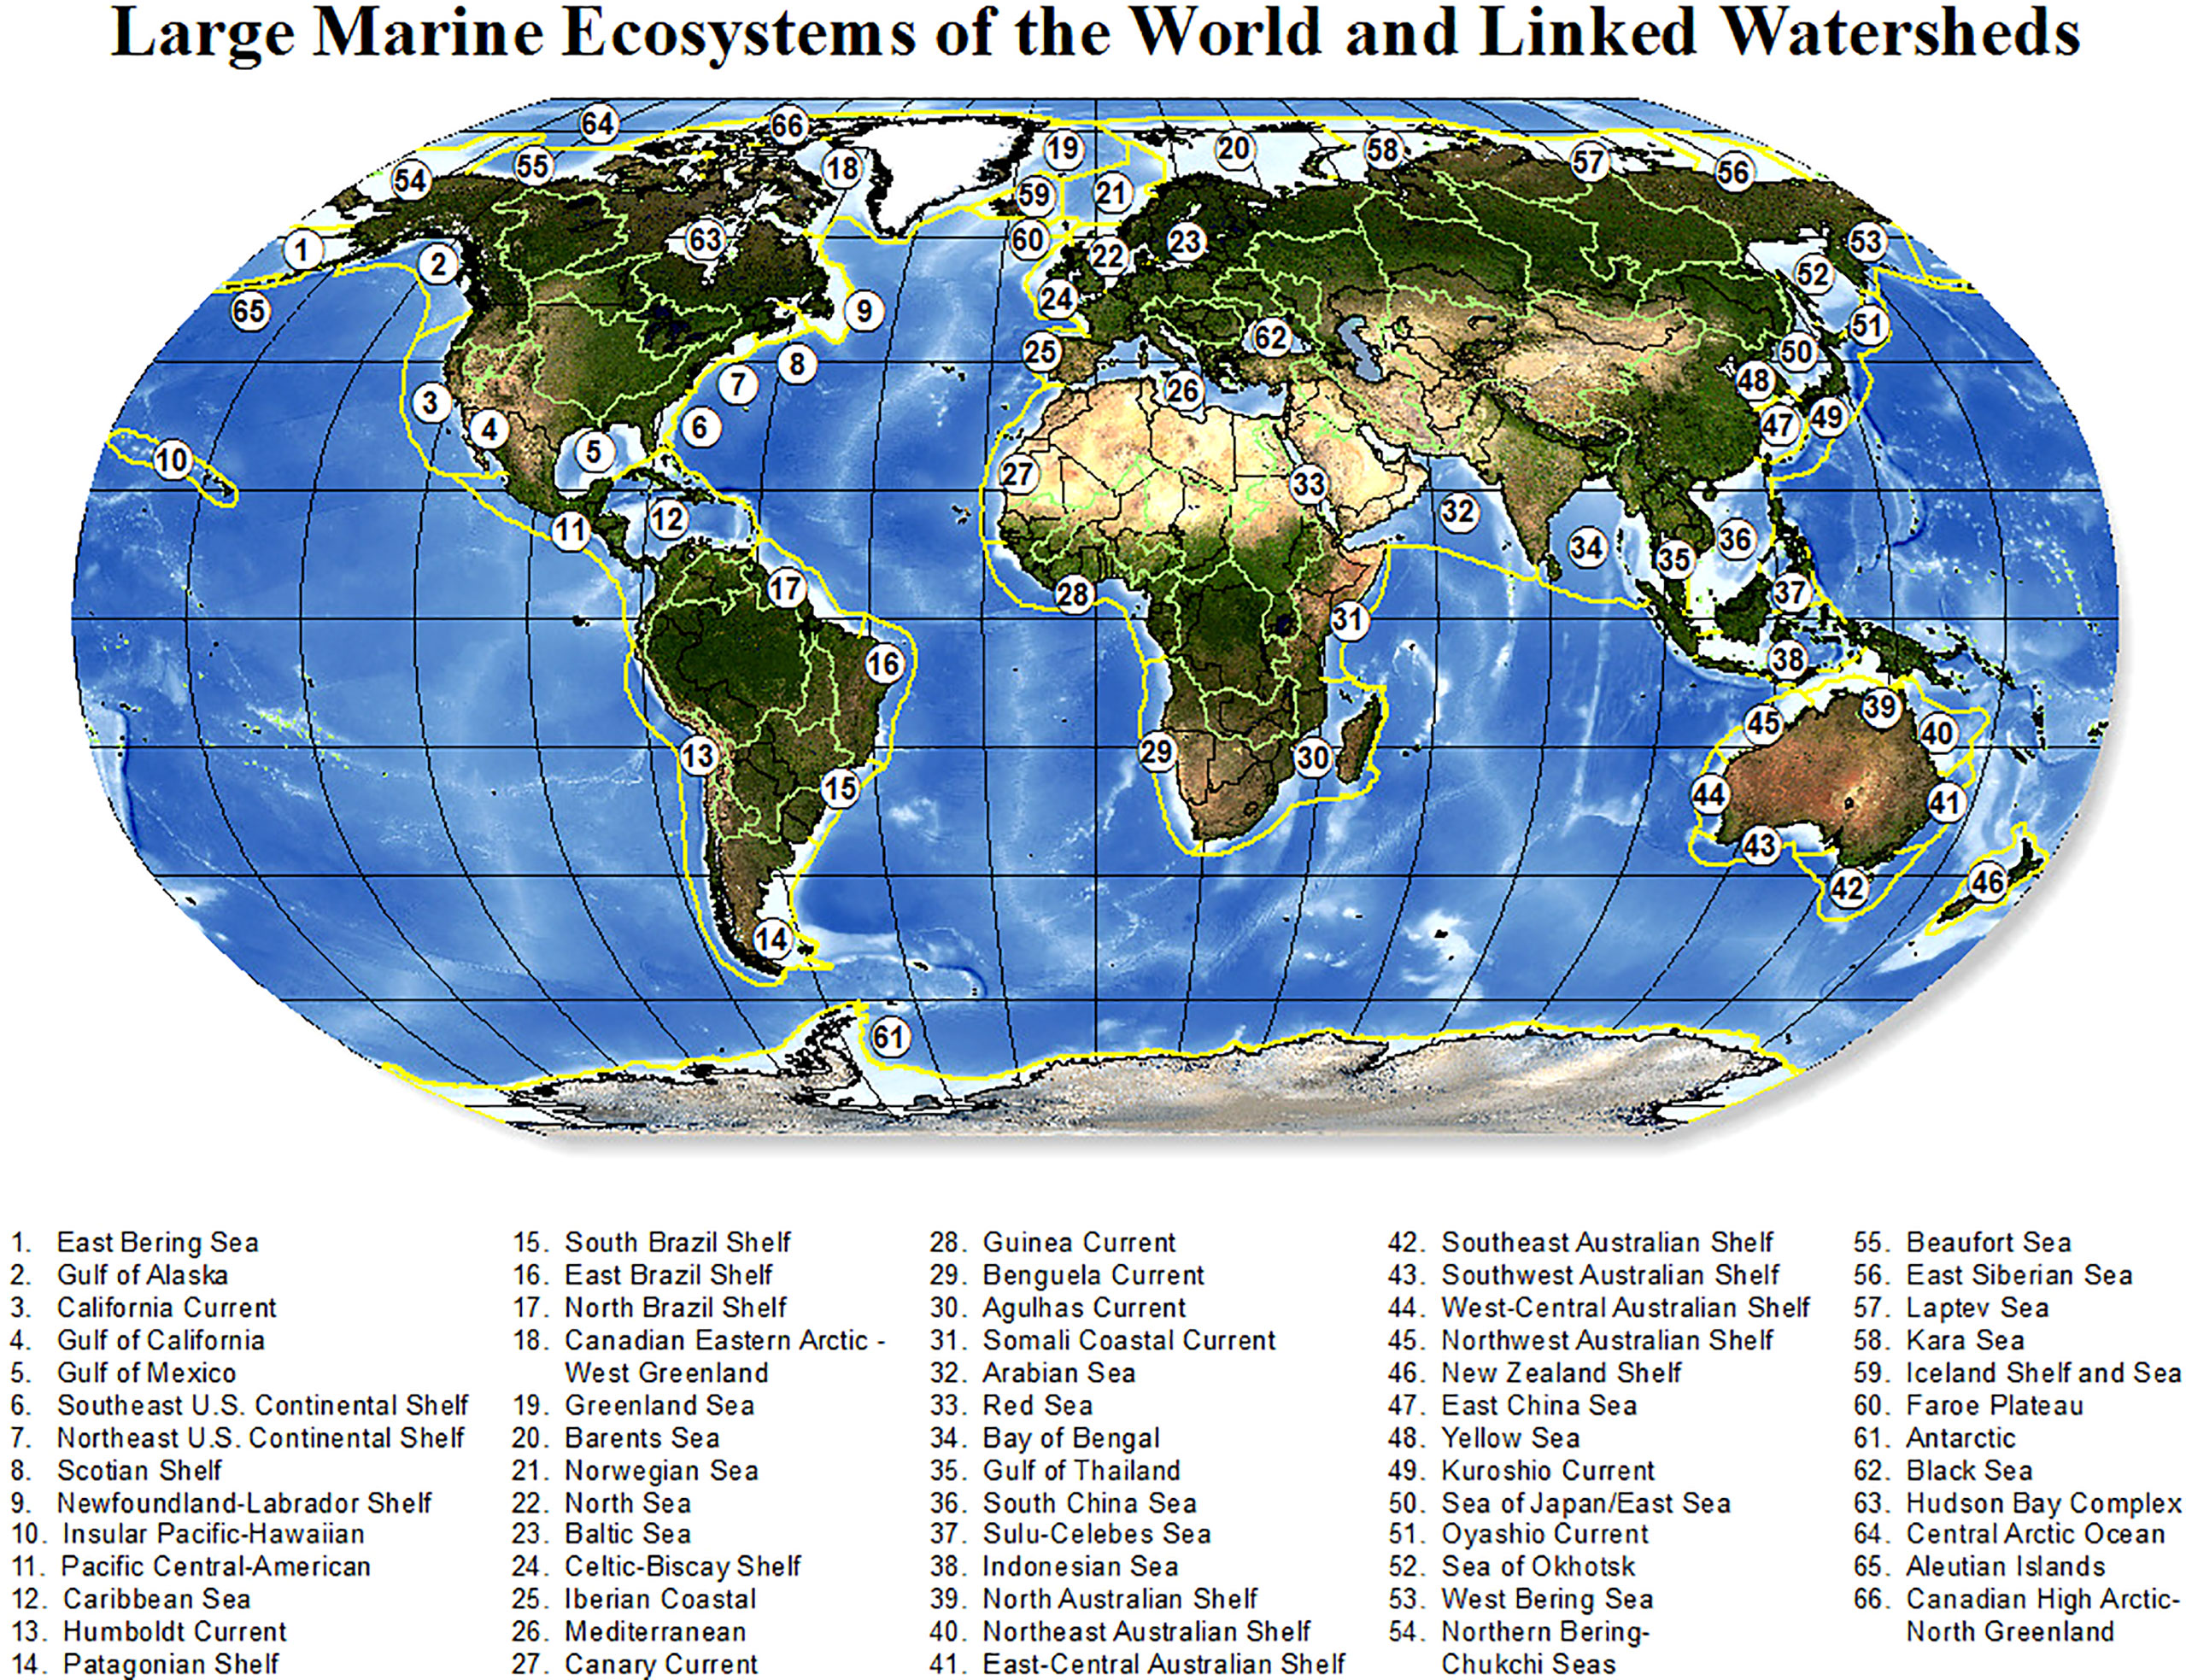
Figure 1 Global map of Large Marine Ecosystems. The global ocean is divided into 66 LMEs by Oceanographers [Image credit,Sherman and Hamukuaya (2016)].
Primary production data for 63 LMEs (1950–2018) were obtained from the online database of the SAU. It was estimated on the basis of the chlorophyll pigment concentration derived from SeaWiFS data (http://seawifs.gsfc.nasa.gov) with a spatial resolution of 9 km (Siswanto et al., 2016; Sharma et al., 2019). Primary production for the northern South China Sea before 1990s may be overestimated as the estimation was based on current nutrients loads, which have been increasing since the 1990s (Liu et al., 2002). However, considering that the northern South China Sea covers only approximately 6% of the entire South China Sea LME (Yu and Zhang, 2005), this overestimation was negligible in the entire LME area.
Annual fisheries catch and mean trophic levels of fisheries catch data from the SAU database was derived mainly from the corrected Food and Agriculture Organization (FAO) of the United Nation’s global fisheries landings statistics, complemented by statistics from various international and national agencies and some reconstructed data sets (Watson et al., 2014). It should be noticed that fisheries catch data from the SAU were reanalyzed with catches and discards. For most countries, the baseline data were statistics reported by member countries or international bodies to the FAO. It was also necessary to source available alternative information sources for missing data in other countries. A six-step approach for data processing was developed and reported by Zeller and Pauly (2016) in detail. Chinese catches from China’s exclusive economic zone were over-reported since the mid-1980s (Watson and Pauly, 2001). However, this was resolved after China corrected the data submitted to FAO; the FAO subsequently revised the related historical statistics for the period of 1997–2005 (Pauly and Froese, 2012). In addition, this over-reporting was diluted owing to the fact that China’s exclusive economic zone being part of the LMEs around China (Pauly et al., 2014). Therefore, the fisheries catch data for LMEs around China were valid for analysis.
The mean maximum length estimates were mainly obtained from the “ISSCAAP Table” of FishBase 2000 (Rosenberg et al., 2014), which consisted of standard lengths for all species of bony fish. In addition, data from the FAO Species Catalogues and Identification Guides were included to complement the ISSCAAP table for several invertebrate taxa. The mean maximum lengths were averaged by genera, families, and higher groups. To account for the expansion and contraction of fishing fleets over time, reflected by the trophic level of catches, the Fishing-in-Balance (FiB) index was introduced, with an increasing trend representing a geostrophic expansion of fisheries to new grounds (Bhathal and Pauly, 2008). On the basis of this, the spatial EF was introduced to make the implied expansion of fisheries explicit by re-interpretating the FiB index in the form of EF = 10FiB (Bhathal and Pauly, 2008). The EF was used as an indicator of the expansion of fisheries, which is widely used in research regarding changes in fisheries or the health of the ecosystem (Liang and Pauly, 2017; Mashjoor et al., 2018). In the present study, 1950 was used as the reference year (Pauly and Christensen, 1995).
The primary production required (PPR) for the fisheries catch (Pauly and Christensen, 1995) was computed as follows:
Here, Ci is the catch of species i, CR is the conversion rate of wet weight to carbon, TE is the transfer efficiency between trophic levels, TLi is the trophic level of species i, and n is the total number of species caught in a given area. A CR of 9:1 and TE of 10% were used for this study (Pauly and Christensen, 1995). The TE is a re-estimated value based on annual world fisheries catches (94.3 million tons) from 1988 to 1991, which has been widely used in previous research (Mehner et al., 2018; Barneche et al., 2021). The analysis for the period from 1950 to 2018 was based on the data from the SAU. Using %PPR as the fishing pressutrre index, the relationship between fisheries catch and intrinsic energetic limits for each LME was assessed (Knight and Jiang, 2009; Conti and Scardi, 2010).
The relationship between fisheries catches and primary production provided a rough measure of the efficiency in carbon transfer from primary production to fisheries in different LMEs (CTE) (Figure 2). Affected by a variety of environmental factors, a positive correlation (r2 = 0.21, p < 0.05) was found between the fisheries catch and primary production, with the CTE varying from 0.01% to 0.1% for the 63 LMEs. Our results indicate that LMEs with high primary production usually showed a higher CTE. Yet, fisheries catch could be markedly different for ecosystems with similar primary production levels. In the three LMEs around China, the fisheries were higher than most of the other LMEs with the similar levels of primary production, producing high CTEs of approximately 0.1%. Therefore, the high CTEs in the three LMEs around China were more likely to result from the fishing efforts, rather than primary production.

Figure 2 Relationships between primary production and fisheries catch in the 63 large marine ecosystems (LMEs) in 2018 based on the data from SAU. The asterisks indicate the South China Sea (SCS), Humboldt Current (HUMC), East China Sea (ECS), North Sea (NS), and Yellow Sea (YS). The diagonal lines and associated % values show different levels of efficiency in carbon transfer from primary production to fisheries catch [carbon transfer efficiency (CTE)].
The global and regional fisheries experienced different stages from 1950 to 2018 (Figure 3). The global fisheries catch increased from 24.1 Mt in 1950 to a peak of 107.8 Mt in 1996 and then declined and stabilized at about 90 Mt, with inter-annual fluctuations. In contrast to the global trend, the fisheries catch in the Humboldt Current and North Sea peaked around 1970 and then declined, whereas in the Humboldt Current, the fisheries catch recovered in the mid-1980s. The fisheries catch in the three LMEs around China experienced the same pattern as the global trend, with a peak in the 2000s, and then stabilized or slightly declined. Therefore, the global annual fisheries catch was relatively stable since it reached the maximum, and the regional fisheries catch can vary significantly, regardless of trends, peak periods, or their magnitudes.
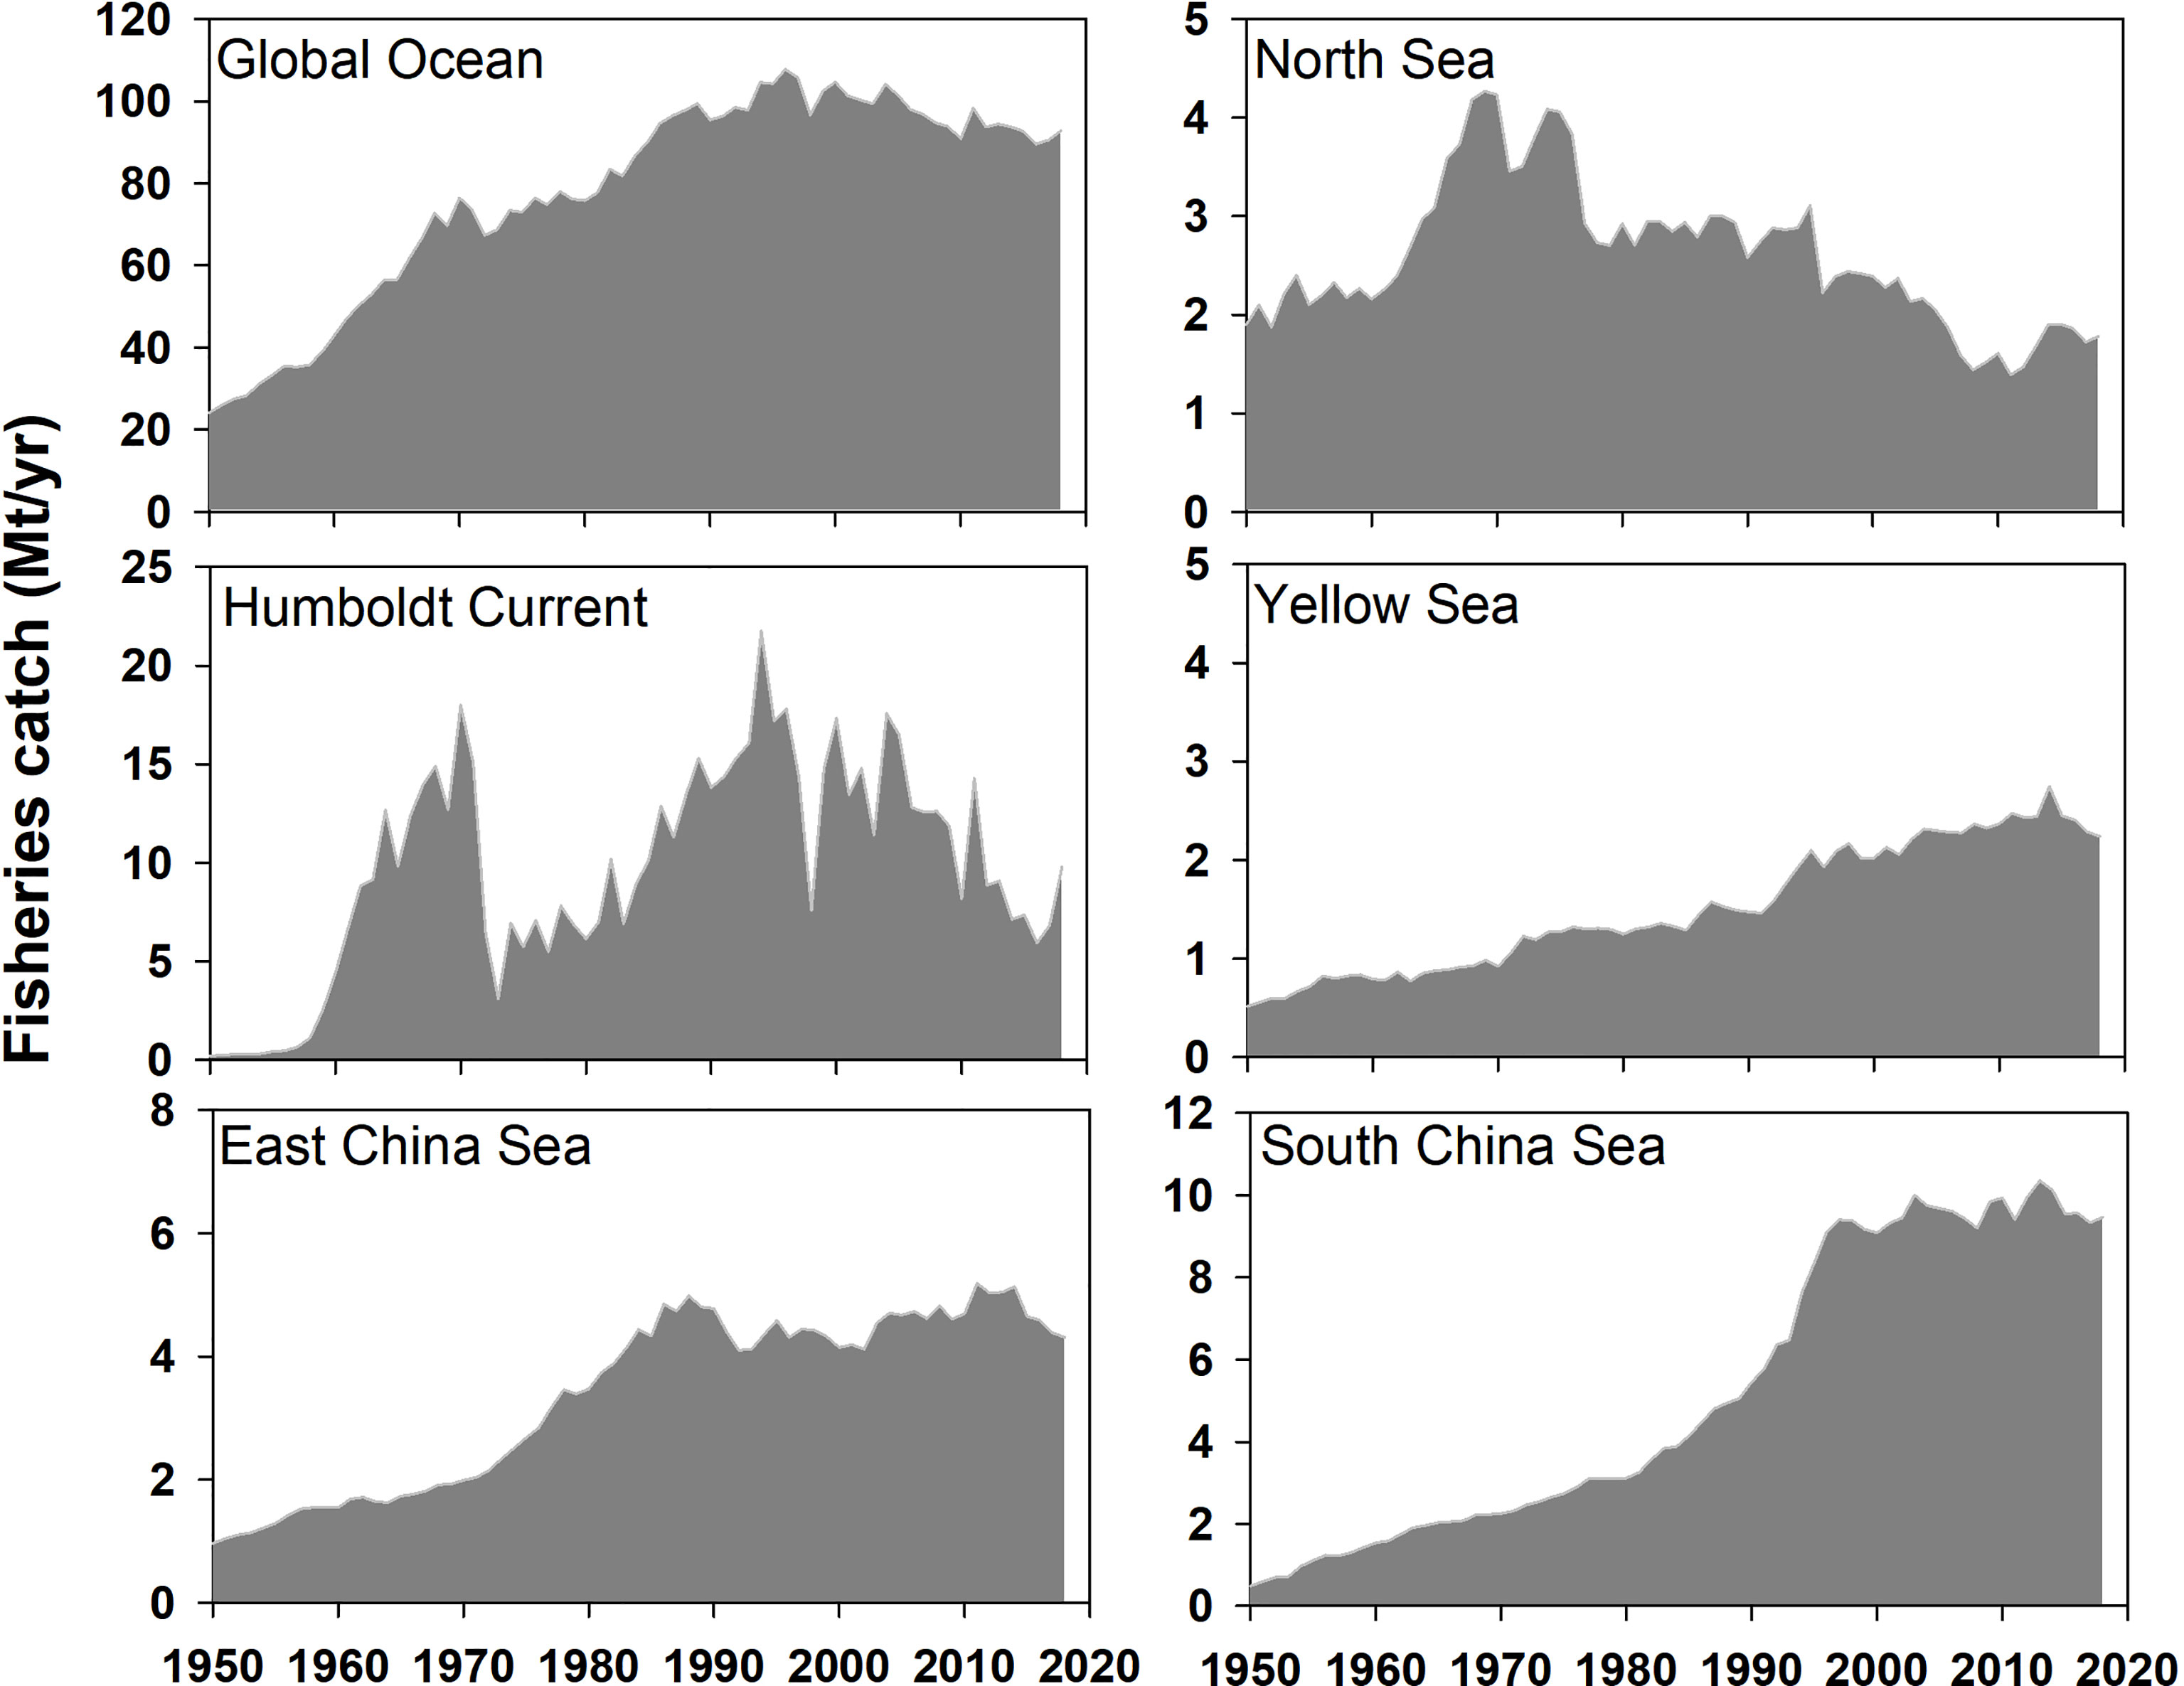
Figure 3 Fisheries catch (Mt/yr) in the global ocean and five LMEs from 1950 to 2018.
By examining the mean trophic level of global and regional fisheries over 68 years starting in 1950 (Figure 4), we found that, although the downtrend of the mean trophic level for global fisheries was found to be modest, the mean trophic level in some regional fisheries decreased remarkably. The trophic level varied less than 0.3 in the global ocean and South China Sea in the past decades. In contrast, a remarkable downward trend occurred in the Humboldt Current during the 1950s, with a trophic level decrease of 1, from 3.9 in 1950 to 2.7 in 1960, and then, the trophic level stabilized at a low level of 3.0. For the Yellow Sea and East China Sea, the mean trophic level change from 1950 to 2018 was small but showed a trough during the 1980s and the 1990s.
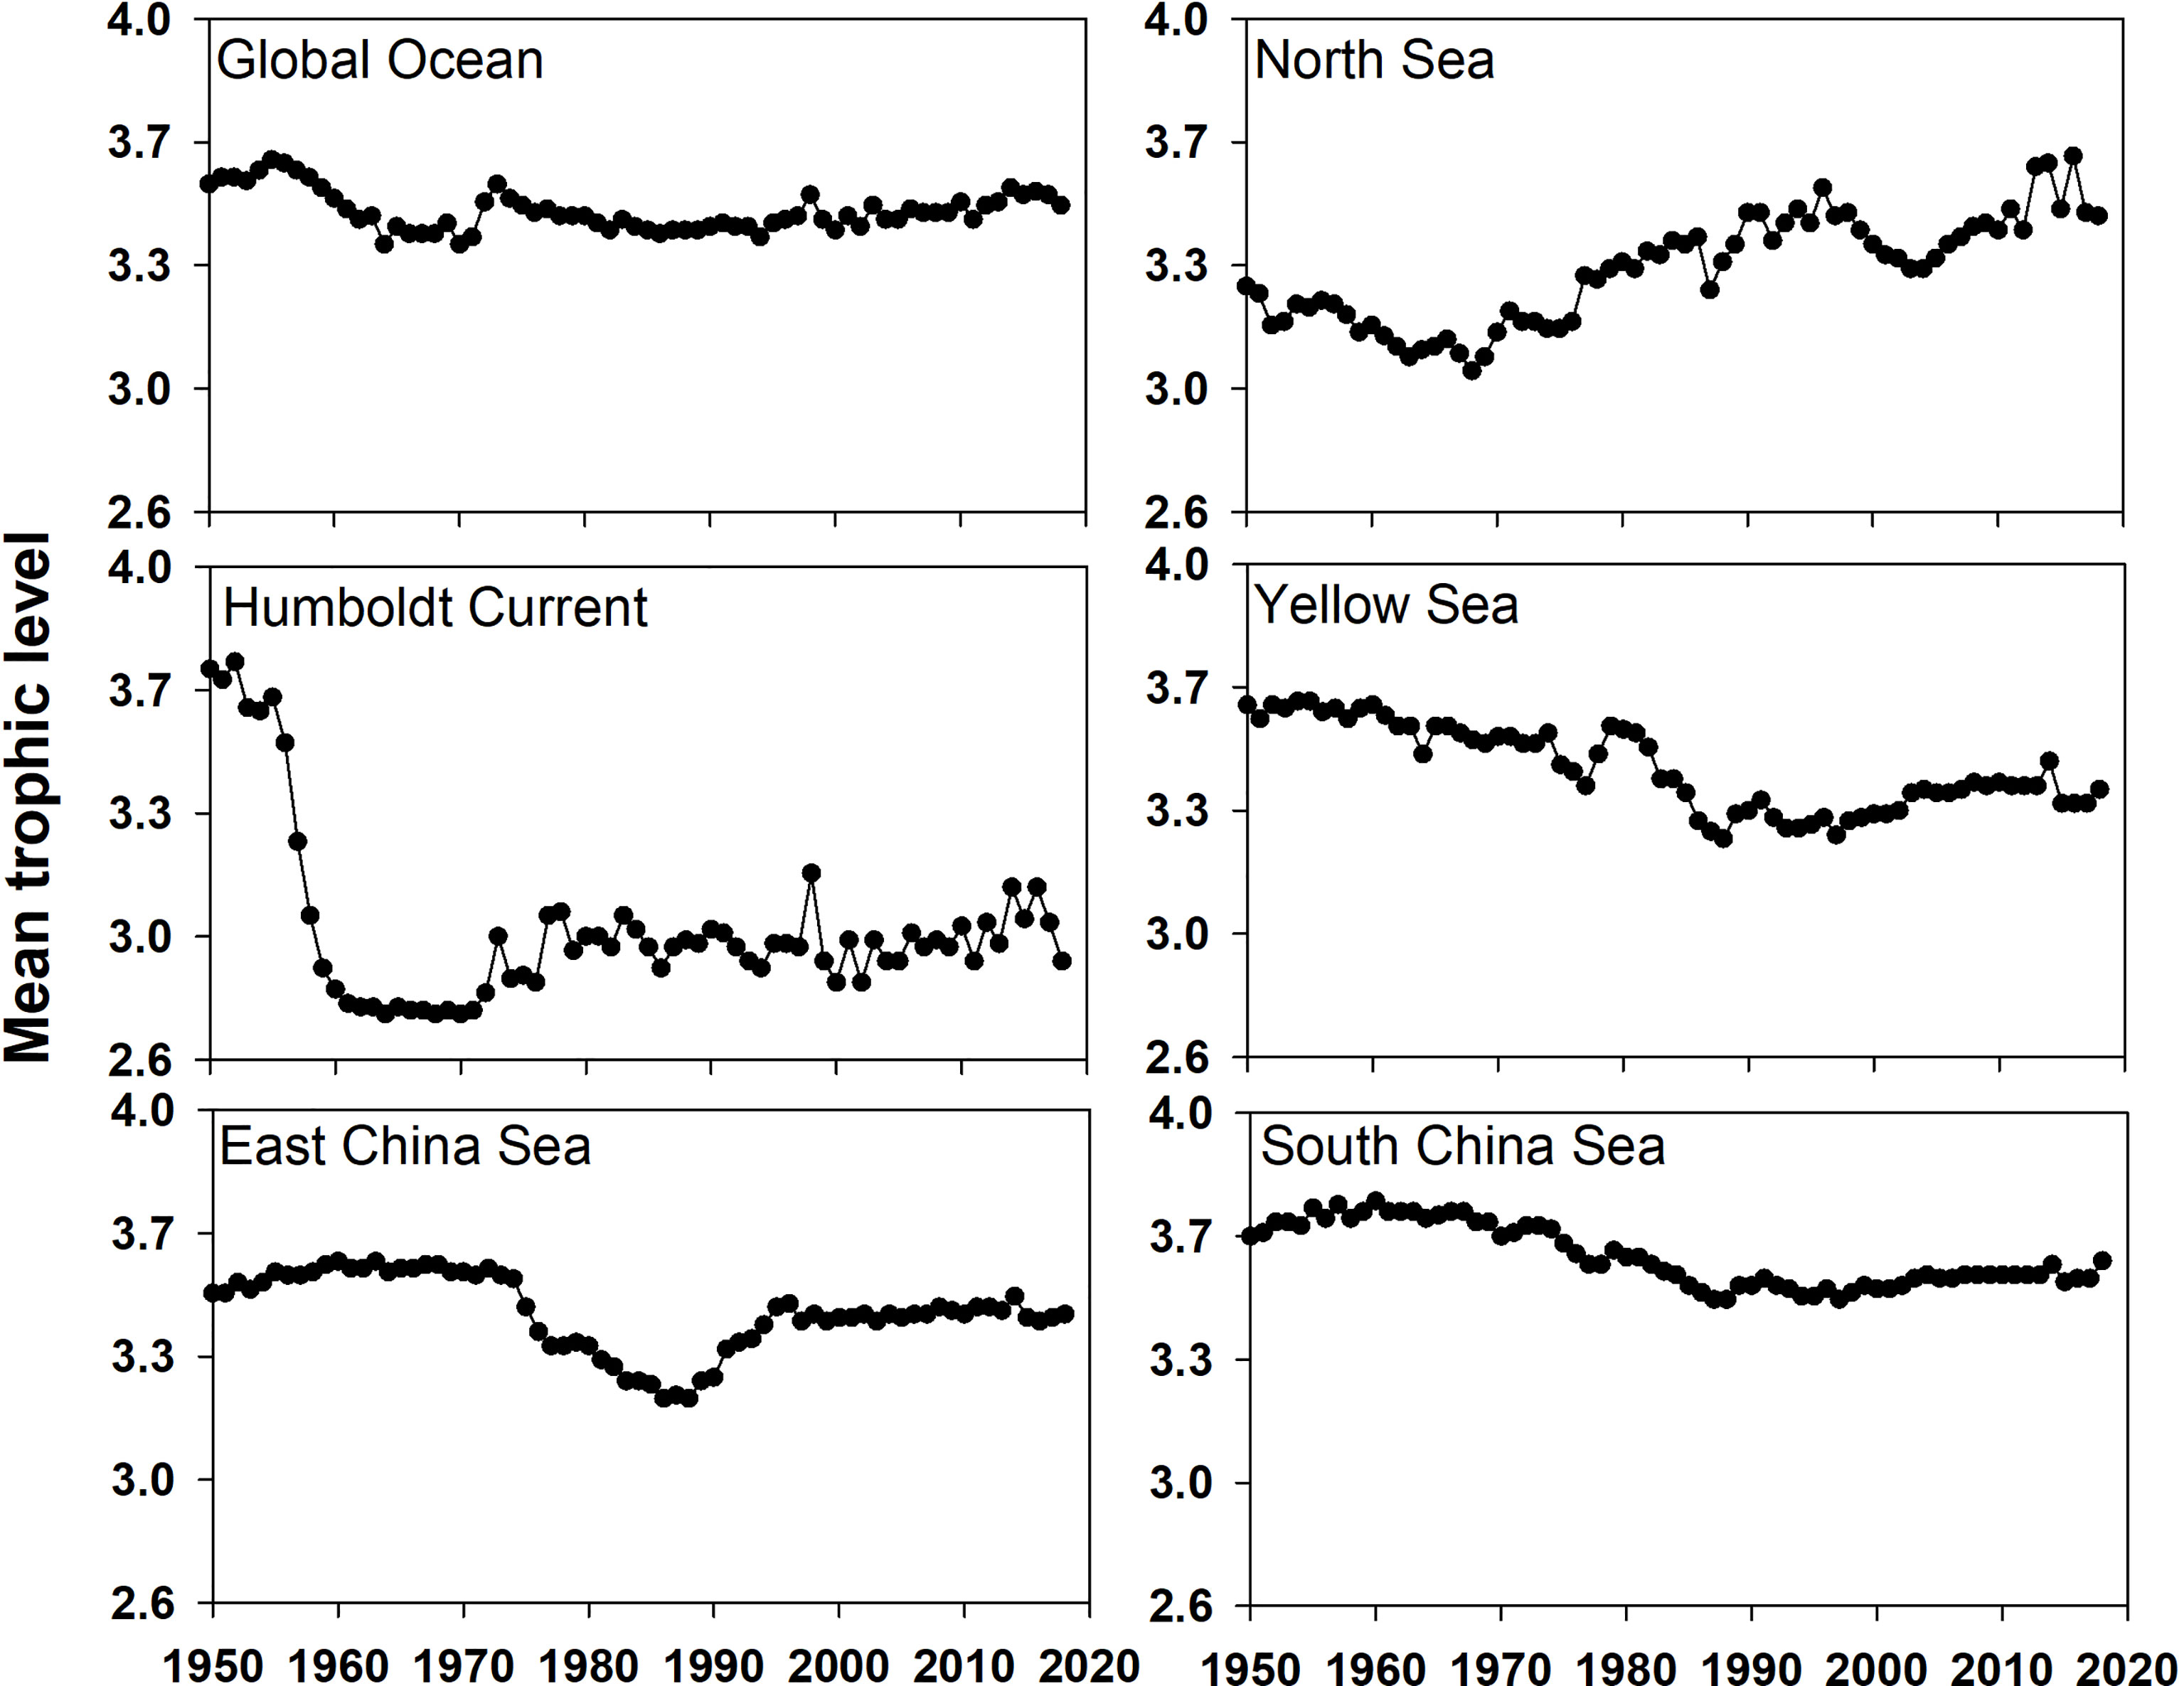
Figure 4 Mean trophic level of fisheries catch in the global ocean and five LMEs from 1950 to 2018.
The mean maximum length of fisheries catch was an important indicator for evaluating the impact of fishing on marine ecosystems (Figure 5). The mean maximum length in the global ocean and Humboldt Current stabilized following the sharp drop in the 1950s; however, in the Humboldt Current, the value decreased by 80%, which was much larger than that in the global ocean (25%). There was a recovery when the mean maximum length in the Humboldt Current during the 2010s was 64.8 cm, which was close to that in the global ocean (64.9 cm). Similar to the North Sea, the mean maximum length in the South China Sea continually decreased from 1950 to 2018; however, the total decline was only ~15 cm. The mean maximum length in the Yellow Sea and East China Sea varied in the same pattern, with the largest fall in the 1980s and then slightly rebounded; however, the overall decrease was smaller than that in the South China Sea. In general, the mean maximum length of the fisheries catch decreased in the past 56 years, although different variation patterns were observed for different LMEs.
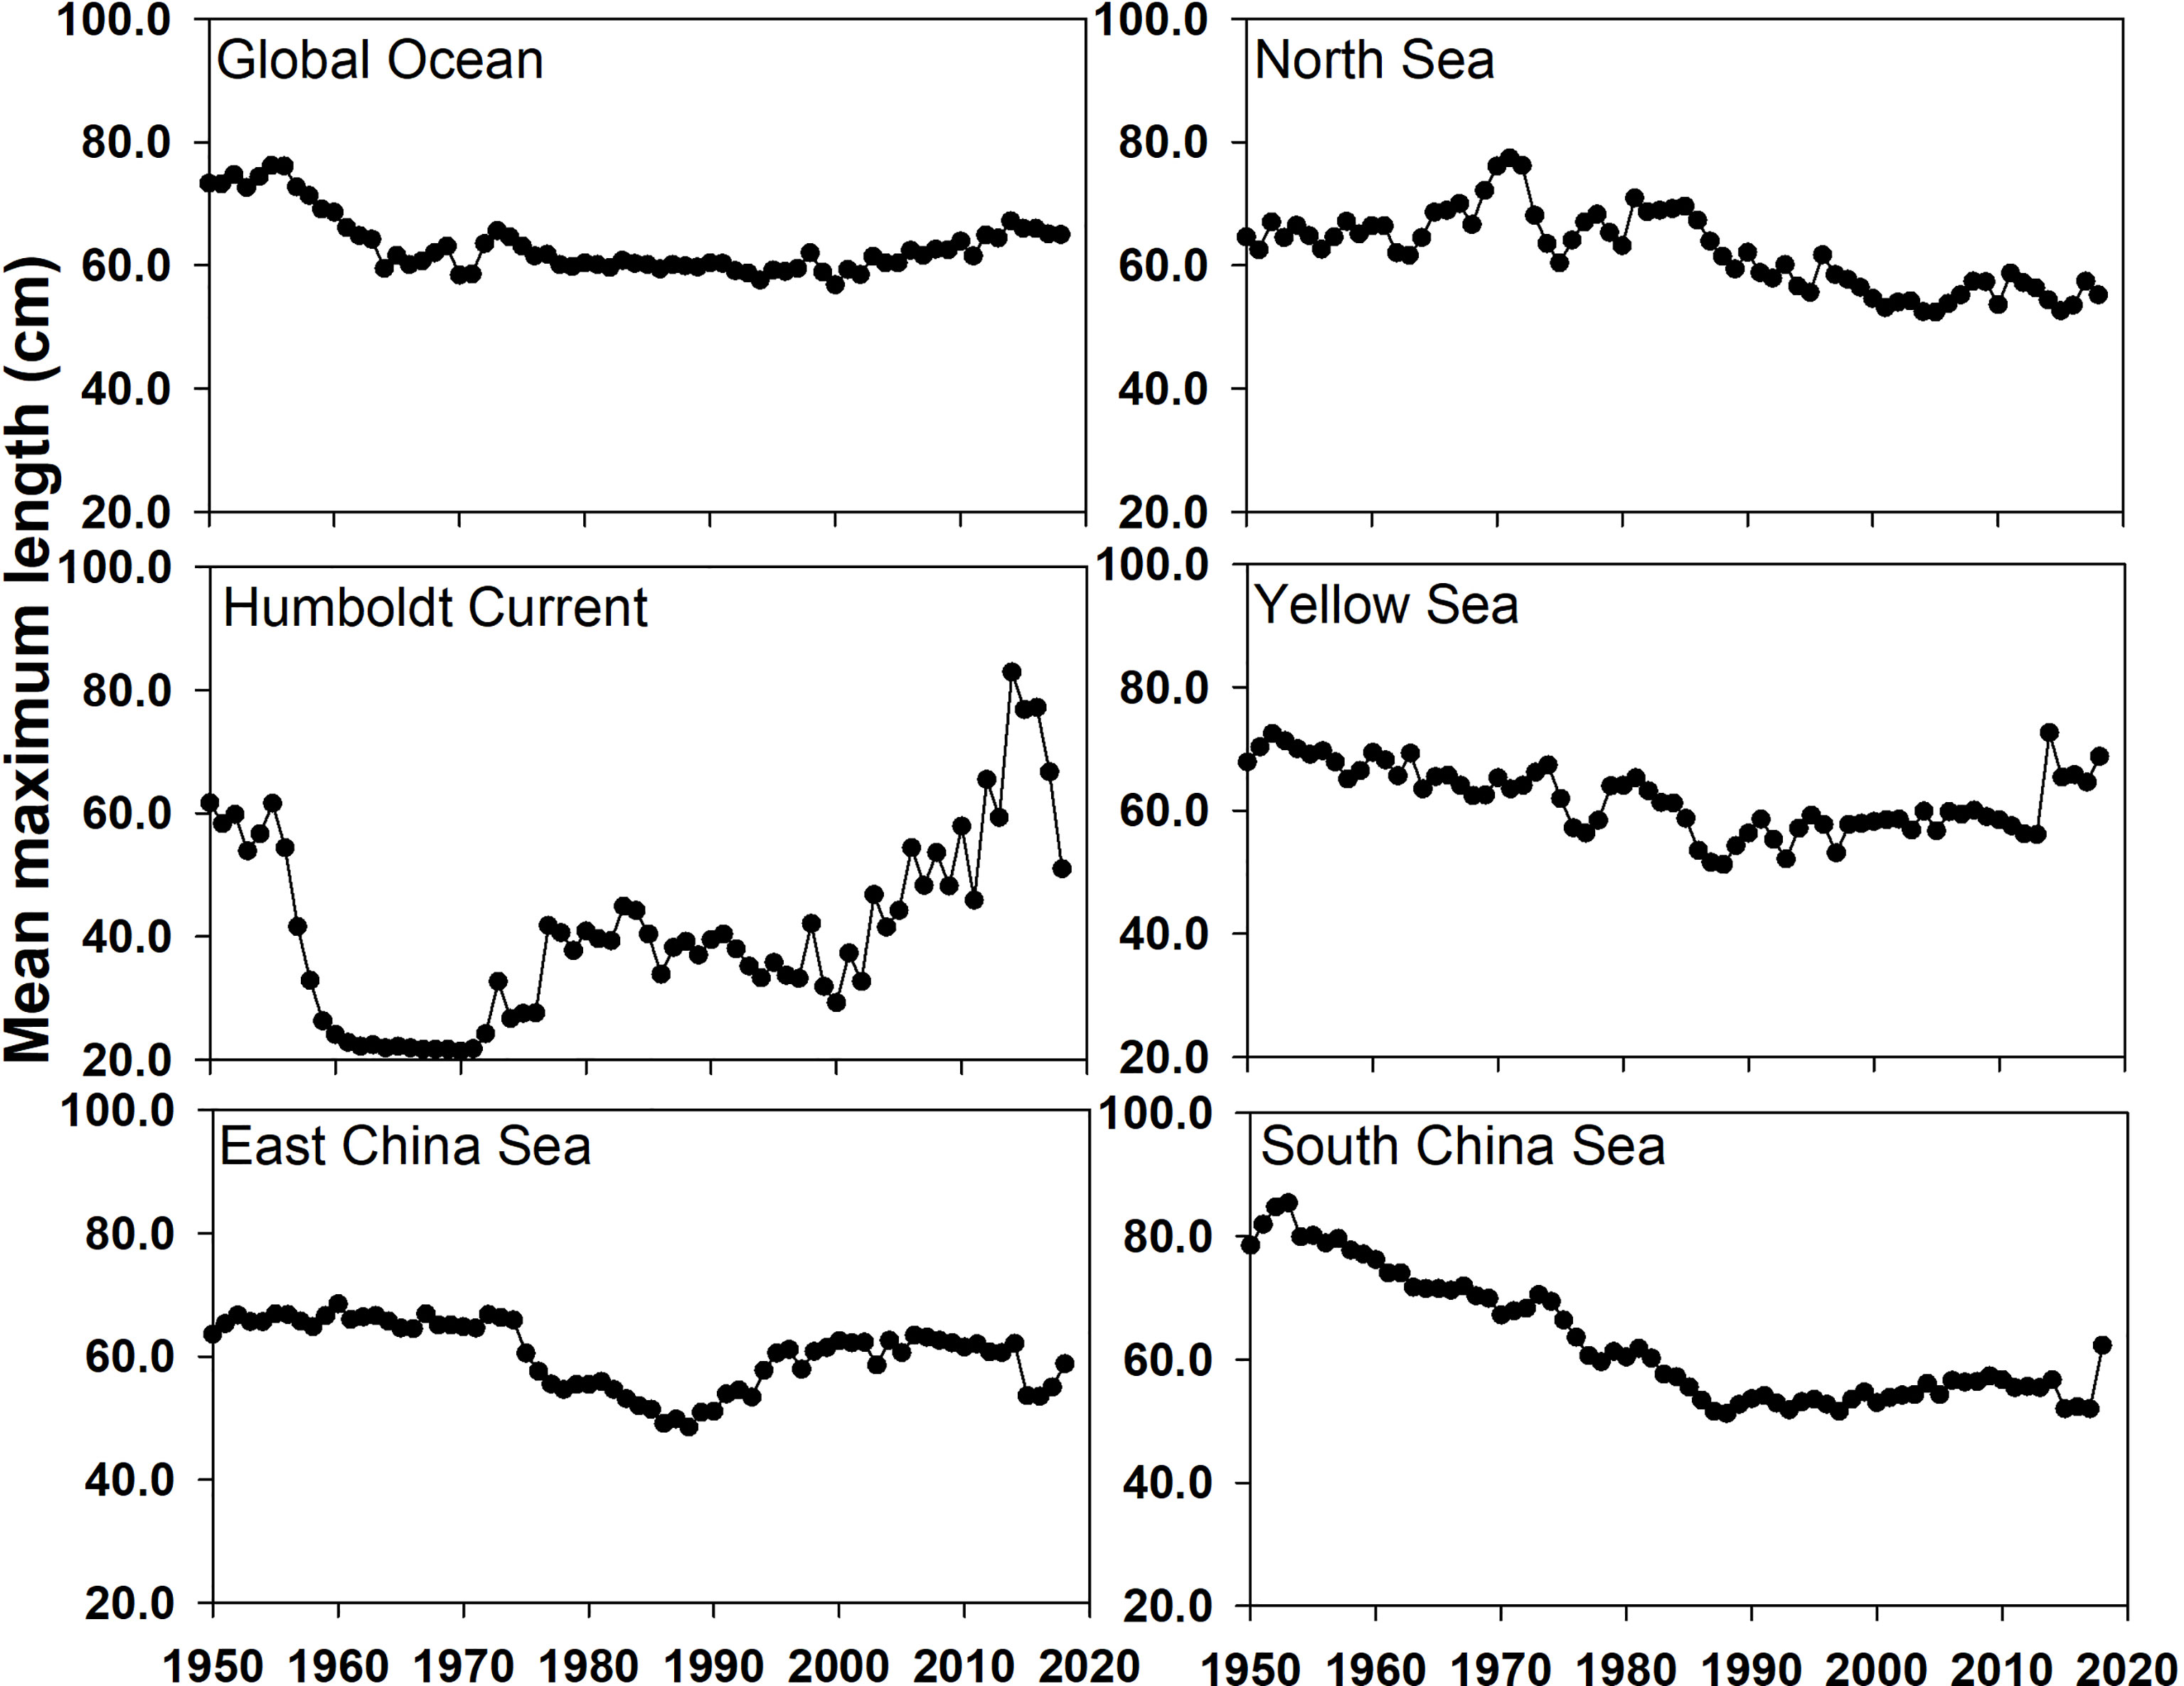
Figure 5 Mean maximum length of fisheries catch in the global ocean and five LMEs from 1950 to 2018.
To assess fishing efforts around China, the spatial expansion in the three LMEs around China were analyzed and compared them with the North Sea LME, Humboldt Current LME, and the global ocean (Figure 6). The EF for the Humboldt Current LME showed an increasing trend prior to the mid-1990s and a decreasing trend thereafter, with strong interannual variabilities. The EFs in the global ocean and most of the regional fisheries in LMEs around China increased from 1950 to 2018, except in the North Sea, where the EF remained lower than 1.5, except in the years around 1970, when a peak occurred. Among the regions with increasing fishing efforts, the South China Sea was especially prominent as the EF increased from approximately 1 in 1950 to ~15 in 2018. In 2018, its EF was approximately 3.5 times the EF of the global ocean, without signs of decrease. In contrast, the increasing speed for the Yellow Sea and East China Sea was comparable to that of the global ocean, with an increase of less than 3 from 1950 to 2018.
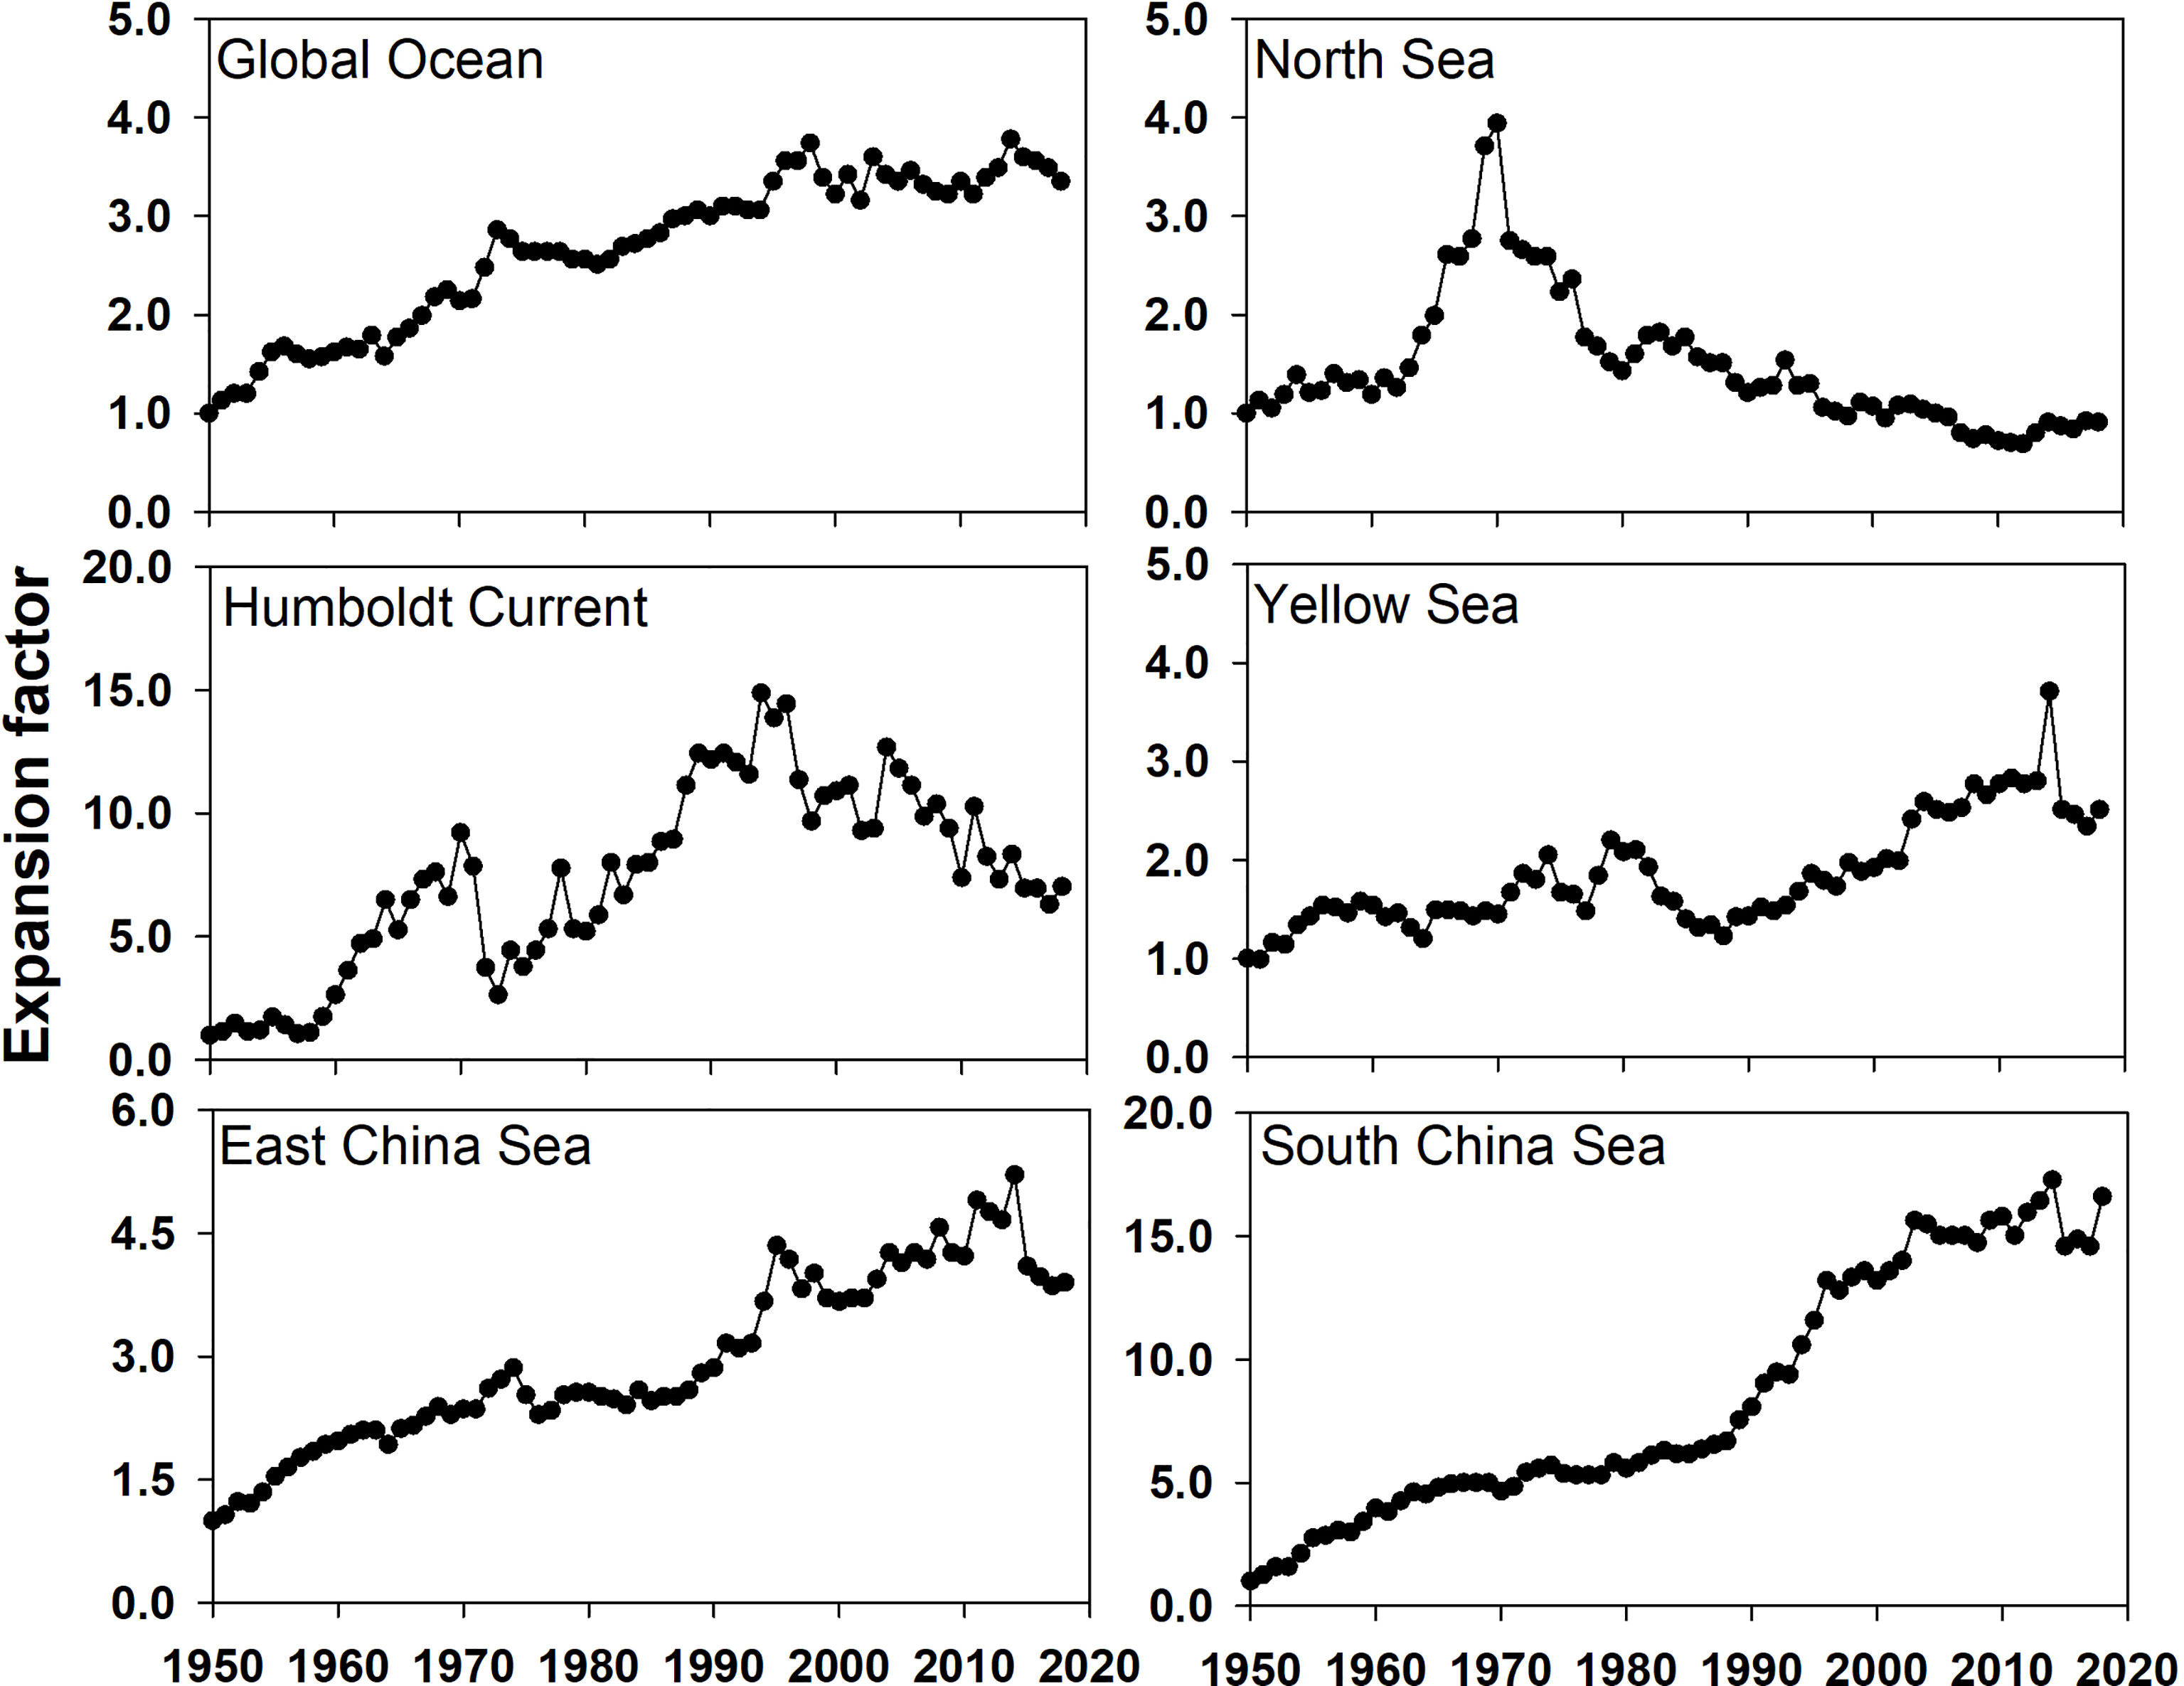
Figure 6 The expansion factors in the global ocean and five LMEs from 1950 to 2018.
The ratio of the primary production required for fisheries to the total primary production (%PPR) in global and regional fisheries from 1950 to 2018 (Figure 7) was examined; it was found that, since the late 1990s, accompanied by a rising demand for fishery-associated resources, global fishing fleets removed approximately 5%–6% of the total primary production by fishing. The ratios were larger than 30% in the 1990s for the North Sea, East China Sea and South China Sea; this was caused by the ever-increasing marine fish landings in the three LMEs around China since the 1990s. The ratio in the East China Sea and South China Sea was approximately 50% in 2018, which was almost two and five times higher than the values for the North Sea Humboldt Current, respectively. The analysis demonstrated that although the global %PPR had stabilized at a low level, the regional ratios could be quite high and unstable.
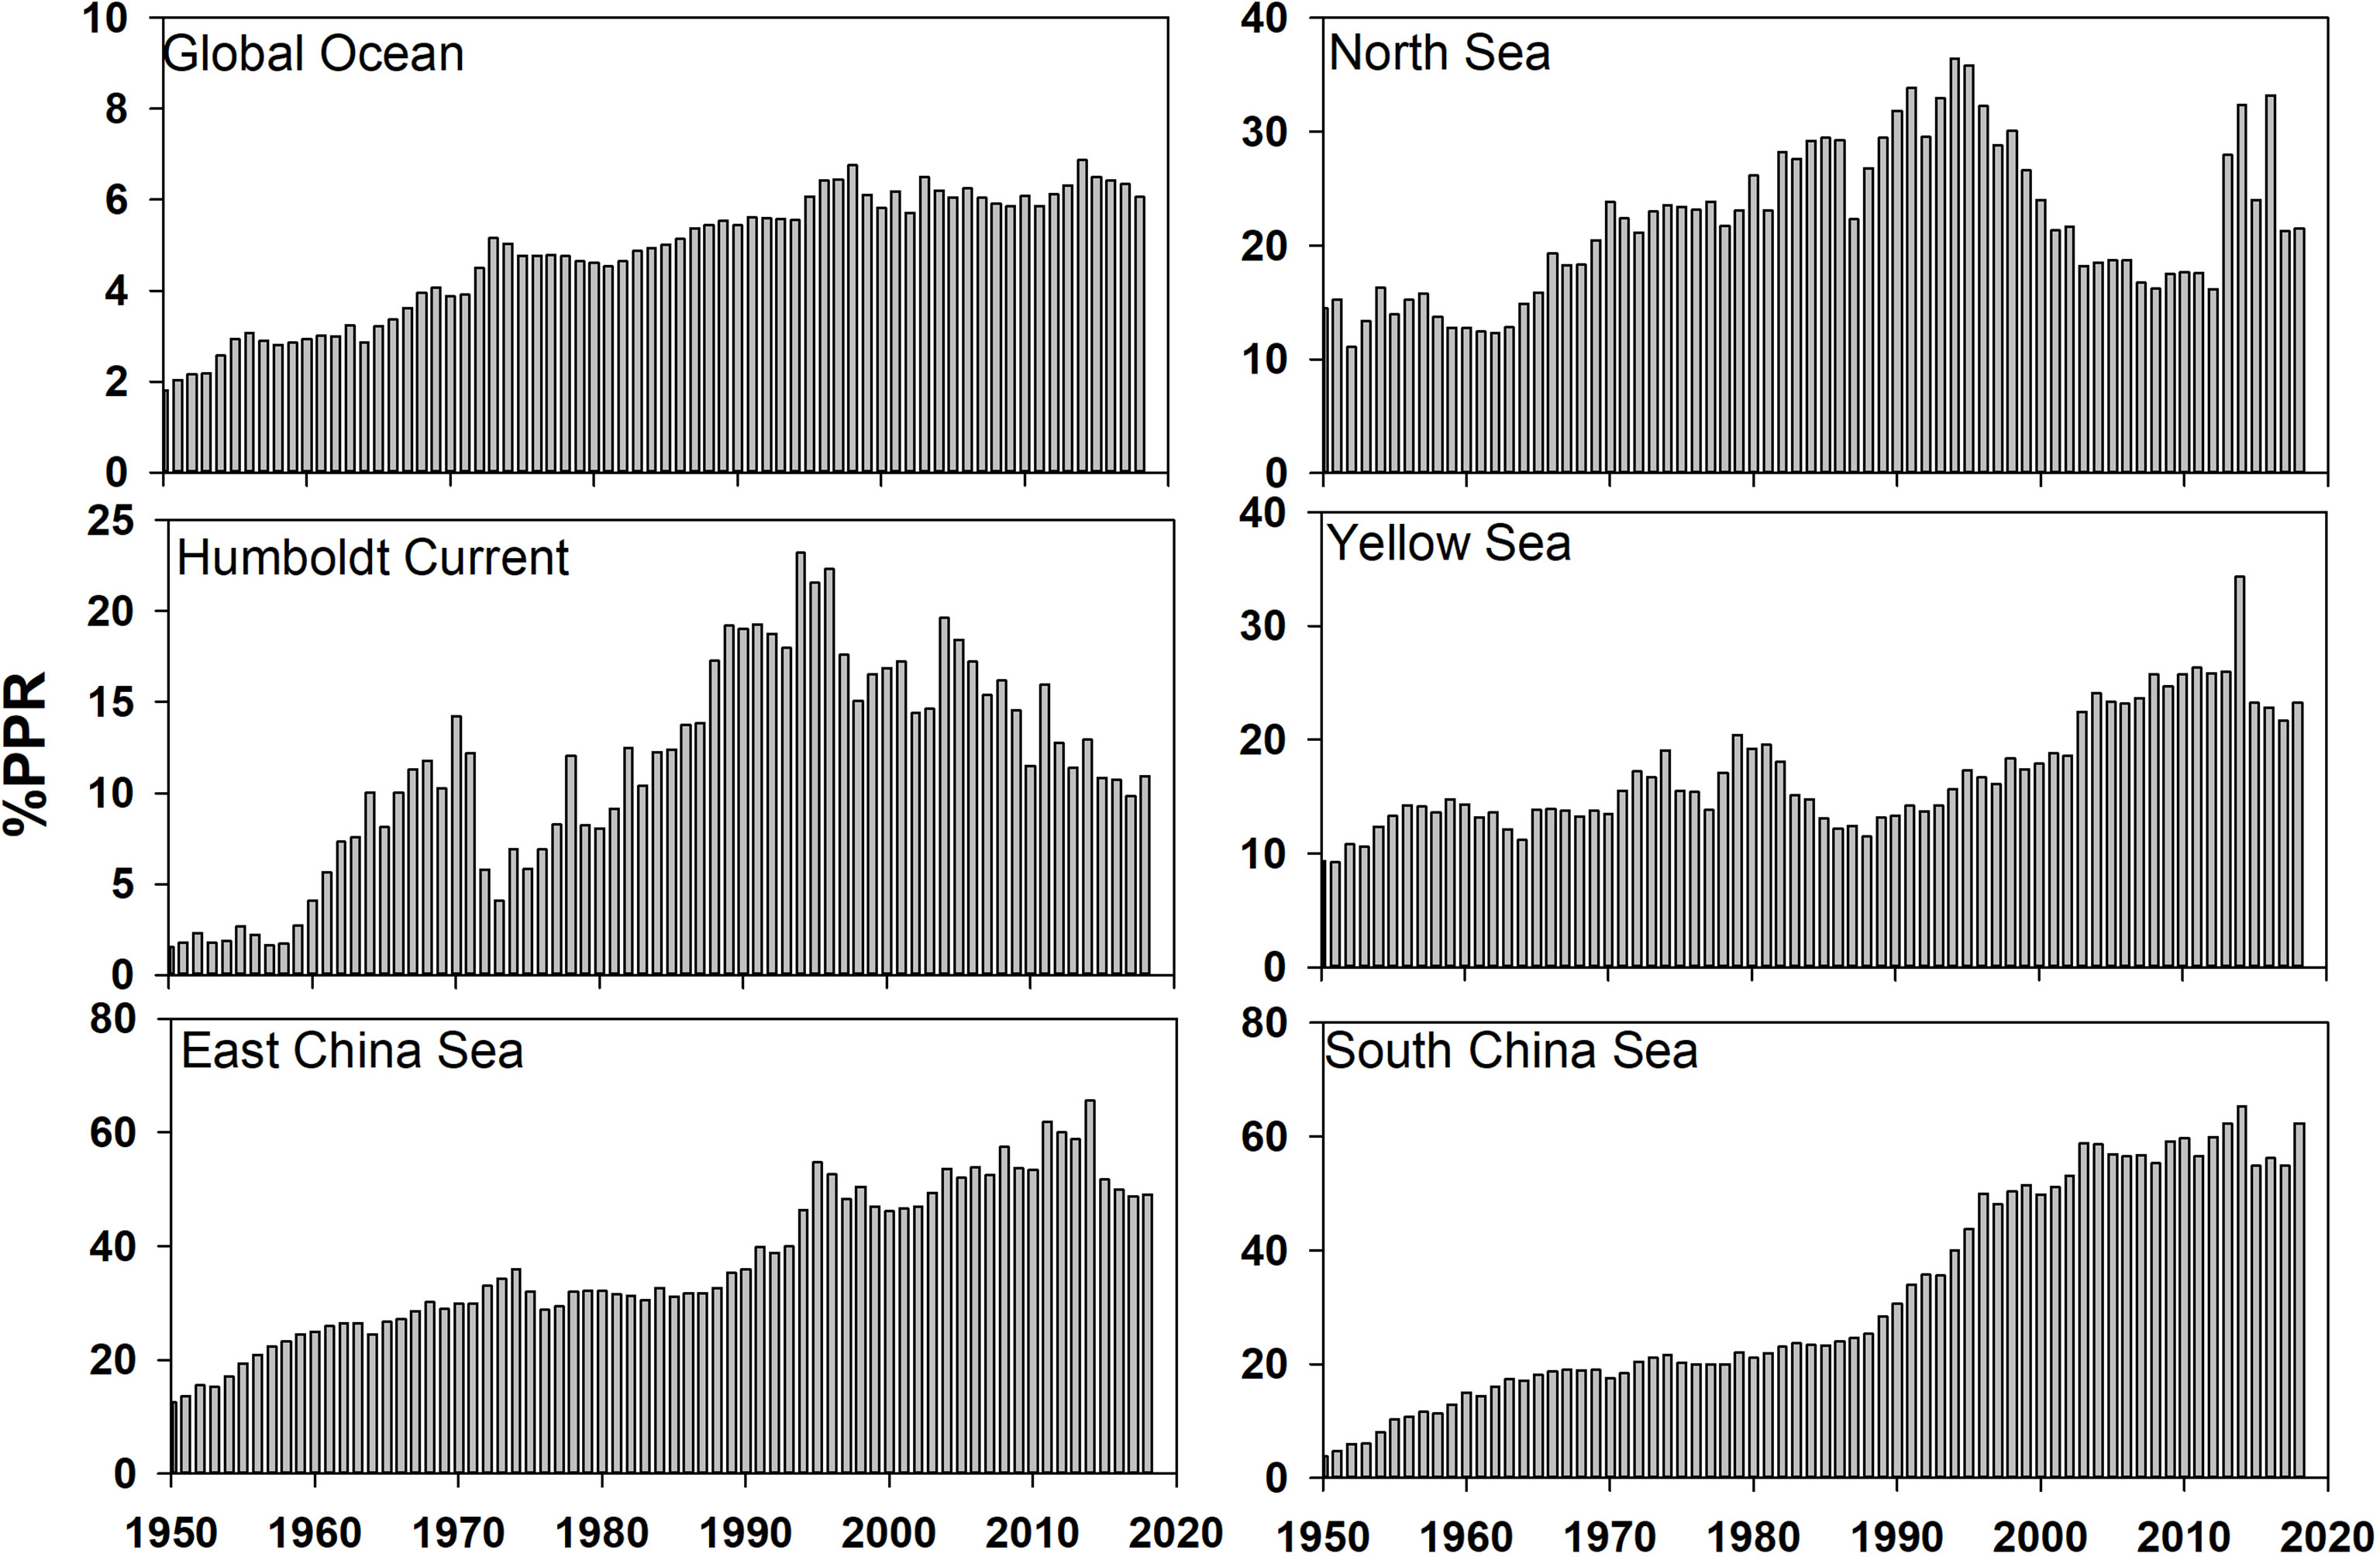
Figure 7 The ratios of primary production required for fisheries catch to the total primary production (%PPR) in the global ocean and five LMEs from 1950 to 2018.
The positive correlation between primary production and fisheries catch in the 63 LMEs further proved that bottom-up processes set the potential for fisheries catch (Pauly and Christensen, 1995). Meanwhile, the CTE variations among different LMEs with similar levels of primary production indicated that top-down controls, including fishing effort and differences in ecosystem structure, also contributed to fisheries catch (Stock et al., 2017; Henson et al., 2019; Ding et al., 2020). Therefore, although primary production in the three LMEs around China (except the Yellow Sea) were moderate or even low among the 63 LMEs, their CTEs were all near the highest due to the high fishing effort, as indicated by their high EFs. This was consistent with the findings of the study by Watson and Pauly (2014) found for the South China Sea LME and other LMEs, revealing the general intensification and extension of fishing offshore and into depths over the decades.
The PPR estimated the amount of primary production needed to support the biomass of fish removed from marine ecosystems. For comparison, the sustainable %PPR for the Humboldt Current LME, a highly productive ecosystem with rich nutrient supply by ocean currents (Gutiérrez et al., 2016), was about 10%–15% in recent years. Although the ratios in the three LMEs around China were much higher, the values for the East China Sea and South China Sea LMEs were larger than 50% after the 2000s, indicating that the carbon fixed by phytoplankton in these regions could not support such high demands. This high %PPR due to high fishing intensity will threatens the diversity of the ecosystem (Watson et al., 2014). Therefore, both fishing effort and environmental drivers shape the fisheries catch in the three LMEs around China, with high fishing effort being the main reason for the high CTE and %PPR.
Global annual marine fish landings have stagnated around 80 Mt since the1990s, with an additional 20 Mt of additional illegal/unreported catches (Agnew et al., 2009), reaching the upper limits for sustainable marine fish landings, which was between 100 and 140 Mt per year (Grainger and Garcia, 1996; Chassot et al., 2010; Watson et al., 2014). Considering that fishing effort is still increasing, high marine fish landings are maintained by unsustainable factors, including spatial expansion, fishing of lower trophic level species, and juvenile fish.
Watson and Pauly (2014) reported that fishing gear improvements has increased the mean depth of fishing to 600 m in the late 1960s. EFs in the global ocean and LMEs confirmed this offshore and deep extension trend; however, the extension intensity among the different LMEs was quite different. Owing to shallow water depths, the potential for deep extension in the Yellow Sea and East China Sea LMEs was limited. In contrast, the extension of the South China Sea LME was still increasing, although the present EF is already very high. This could result from fishermen struggling to find new grounds in tropical fisheries because of reduced catches within the inshore area (Watson and Pauly, 2014). Pauly and Liang (2020) reported that fisheries in the South China Sea LME further intensified and gradually extended to encompass the entire LME. Although the mean trophic level for the entire global ocean had not significantly decreased in the past 60 years, Branch et al. (2010) argued that in some LMEs, such as the Humboldt Current, Yellow Sea, and East China Sea, remarkable downtrends had appeared. A low mean trophic level could result in more biological production to being captured by fishing in an ecosystem (Chassot et al., 2010). A decline in the mean maximum length for global LMEs confirmed the overfishing of juveniles, as the commercial fisheries with long-lived and slow-growing species were almost depleted (Pauly et al., 1998; He and Field, 2019). Furthermore, the increasing demand for trash fish as feed for mariculture led to the increased overfishing of juvenile fish stocks in the Asia-Pacific region (Krumme et al., 2013; Mahesh et al., 2019; Zhang et al., 2020). In addition, the impact of climatic events on decadal variation at the trophic level was one of the factors that could not be ignored, for example, the abnormal change in the Humboldt LME due to the El Niño-Southern Oscillation in the 1960s and 1970s (Alheit and Niquen, 2004).
In general, although global sustainable harvest limits have been exceeded, overexploitation in fisheries for individual LMEs was obscured by the sustainable marine fish landings. This was supported by the offshore, deep expansion, and overfishing of lower–trophic-level species and juvenile fish, which could directly influence exploited populations and alter their structure, function, and dynamics of fisheries.
Marine fisheries in the Asia-Pacific region play an important role in global and national economies. Many fisheries in this region are overexploited, both biologically and economically (Pang et al., 2018; Lam and Pauly, 2019). Historical data show that, once a fishery has collapsed, it is difficult for the ecosystem to reconstruct its productive potentials and diversity, and one typical example was the sudden fisheries collapse in the North Sea in 1970s (Fromentin, 2009; Dadswell et al., 2022). Since the early 21st century, various management intervention schemes were implemented to recover fisheries in the North Sea (Steadman et al., 2014; Hutchings and Kuparinen, 2020). Although the %PPR had sharply decreased and fishing mortality had decreased below the sustainable level, various studies suggested that the reduction in fishing mortality was too late to prevent irrevocable, long-term genetic, and population disturbance (Steadman et al., 2014). Olsen et al. (2009) found that variability in body size for the Skagerrak juvenile population was reduced in the 21st century, compared with the data from the 20th century, which suggested that the North Sea sub-population had already suffered functional extinction. The opportunity to rebuild the stocks may have passed (Winter et al., 2020). Recent studies indicated that the changes in oceanic climate conditions induced a certain degree of limitation to fisheries catch recovery in the North Sea as well (Sguotti et al., 2019; Bluemel et al., 2022).
The three fisheries around China are likely to experience the same collapse as the North Sea LME. Given the similarity between the fishery-associated indicators for the three LMEs around China (particularly the trend in %PPR) and the North Sea before the fisheries collapse period, this lesson should be taken into account. Chinese fishery managers instituted a 2- to 3-month fishing-off season every year to reduce fishing effort and to sustain yields since mid-1990. However, marine fish landings in the East China Sea and South China Sea LMEs continue to grow, with a corresponding %PPR of > 50% at its peak. Potential fishery-associated resources, based on offshore and deep extension, and fisheries catch of lower–trophic-level species and juvenile fish could have been depleted during the 1980s to 2000s, according to the sharp increase in fisheries catch and EFs and decrease in trophic level and mean maximum length. Although the mean trophic level recovered to some extent after the 1990s, owing to the regulation of the fishing-off season in China, the overall situation is still hardly optimistic. The decline in fisheries catch since the early 2010s was a sign of fish resource depletion. This was supported by the results of a study by Wan and Bian (2012), who found that anchovy egg size had notably decreased and mortality rates had notably increased from the 1980s to the 2000s; these authors compared the size and natural mortality rates of anchovy eggs from the spawning grounds in the Yellow Sea and East China Sea LMEs. Although the marine fish landings in the South China Sea LME did not significantly decrease, supported by the assessment of the potential fishery-associated resources in offshore and deep-water and juvenile fishing (Butchart et al., 2010), they were already at the highest level and %PPR was already as high as 60%, which was much higher than the sustainable ratio of 40% (Pauly and Christensen, 1995). Therefore, well-organized and strict fishing policies should be implemented in the future for a long time to reduce fishing pressure and ensure the sustainable development of the LMEs in China.
The SAU data from 1950 to 2018 were analyzed and compared with the data for the LMEs of the global ocean, Humboldt Current, and the North Sea, to assess the situations of the fisheries in the three LMEs around China. Fisheries catch was controlled by both primary production (bottom-up controls) and fishing effort (top-down controls); however, fishing effort mainly accounted for the high efficiency of carbon lost to fishing in the Yellow Sea, East China Sea, and South China Sea, which showed a high CTE. The high fisheries landings were maintained by exhausting the potential fish resources provided by the offshore and deep expansion, the lower trophic level, juvenile fishing, and mariculture, which could result in the irrevocable destruction of fishery-associated ecosystems.
The original contributions presented in the study are included in the article/Supplementary Material. Further inquiries can be directed to the corresponding authors.
DC and XW developed the conceptualization and methodology. DC, XW, and HH wrote the original manuscript. XW, YZ, and QL revised the manuscript. MH and QW are responsible for conducting the research and collecting data. All authors contributed to the article and approved the submitted version.
The authors declare that the research was conducted in the absence of any commercial or financial relationships that could be construed as a potential conflict of interest.
All claims expressed in this article are solely those of the authors and do not necessarily represent those of their affiliated organizations, or those of the publisher, the editors and the reviewers. Any product that may be evaluated in this article, or claim that may be made by its manufacturer, is not guaranteed or endorsed by the publisher.
We thank David Kirchman, School of Marine Science and Policy, University of Delaware, for his valuable comments. We also thank to Yongsong Qiu, the Chief of the Fishery Resources Division at South China Sea Fisheries Research Institute, Chinese Academy of Fishery Sciences, who provided some valuable insights. We acknowledge the support from the Sea Around Us, funded by a number of philanthropic foundations.
The Supplementary Material for this article can be found online at: https://www.frontiersin.org/articles/10.3389/fmars.2022.863611/full#supplementary-material
Agnew D. J., Pearce J., Pramod G., Peatman T., Watson R., Beddington J. R., et al. (2009). Estimating the Worldwide Extent of Illegal Fishing. PLoS One 4 (2), e4570. doi: 10.1371/journal.pone.0004570
Alheit J., Niquen M. (2004). Regime Shifts in the Humboldt Current Ecosystem. Prog. Oceanog. 60 (2-4), 201–222. doi: 10.1016/j.pocean.2004.02.006
Anderson T. R., Martin A. P., Lampitt R. S., Trueman C. N., Henson S. A., Mayor D. J. (2019). Quantifying Carbon Fluxes From Primary Production to Mesopelagic Fish Using a Simple Food Web Model. Ices. J. Mar. Sci. 76 (3), 690–701. doi: 10.1093/icesjms/fsx234
Barneche D. R., Hulatt C. J., Dossena M., Padfield D., Woodward G., Trimmer M., et al. (2021). Warming Impairs Trophic Transfer Efficiency in a Long-Term Field Experiment. Nature 592 (7852), 76–79. doi: 10.1038/s41586-021-03352-2
Bell J. D., Watson R. A., Ye Y. (2017). Global Fishing Capacity and Fishing Effort From 1950 to 2012. Fish. Fisheries. 18 (3), 489–505. doi: 10.1111/faf.12187
Bhathal B., Pauly D. (2008). ‘Fishing Down Marine Food Webs’ and Spatial Expansion of Coastal Fisheries in India 1950–2000. Fish. Res. 91 (1), 26–34. doi: 10.1016/j.fishres.2007.10.022
Bluemel J. K., Fischer S. H., Kulka D. W., Lynam C. P., Ellis J. R. (2022). Decline in Atlantic Wolffish Anarhichas Lupus in the North Sea: Impacts of Fishing Pressure and Climate Change. J. Fish. Biol. 100 (1), 253–267. doi: 10.1111/jfb.14942
Branch T. A., Watson R., Fulton E. A., Jennings S., McGilliard C. R., Pablico G. T., et al. (2010). The Trophic Fingerprint of Marine Fisheries. Nature 468 (7322), 431–435. doi: 10.1038/nature09528
Butchart S. H., Walpole M., Collen B., Van Strien A., Scharlemann J. P., Almond R. E., et al. (2010). Global Biodiversity: Indicators of Recent Declines. Science 328 (5982), 1164–1168. doi: 10.1126/science.1187512
Capuzzo E., Lynam C. P., Barry J., Stephens D., Forster R. M., Greenwood N., et al. (2018). A Decline in Primary Production in the North Sea Over 25 Years, Associated With Reductions in Zooplankton Abundance and Fish Stock Recruitment. Global. Change. Biol. 24 (1), e352–e364. doi: 10.1111/gcb.13916
Chassot E., Bonhommeau S., Dulvy N. K., Mélin F., Watson R., Gascuel D., et al. (2010). Global Marine Primary Production Constrains Fisheries Catches. Ecol. Lett. 13 (4), 495–505. doi: 10.1111/j.1461-0248.2010.01443.x
Chen C. (1996). The Kuroshio Intermediate Water is the Major Source of Nutrients on the East China Sea Continental Shelf. Oceanol. Acta 19 (5), 523–527.
Conti L., Scardi M. (2010). Fisheries Yield and Primary Productivity in Large Marine Ecosystems. Mar. Ecol. Prog. Ser. 410, 233–244. doi: 10.3354/meps08630
Dadswell M., Spares A., Reader J., McLean M., McDermott T., Samways K., et al. (2022). The Decline and Impending Collapse of the Atlantic Salmon (Salmo Salar) Population in the North Atlantic Ocean: A Review of Possible Causes. Rev. Fish. Sci. Aquac. 30 (2), 1–44. doi: 10.1080/23308249.2021.1937044
Degerman R., Lefébure R., Byström P., Båmstedt U., Larsson S., Andersson A. (2018). Food Web Interactions Determine Energy Transfer Efficiency and Top Consumer Responses to Inputs of Dissolved Organic Carbon. Hydrobiologia 805 (1), 131–146. doi: 10.1007/s10750-017-3298-9
Ding Q., Shan X., Jin X. (2020). Ecological Footprint and Vulnerability of Marine Capture Fisheries in China. Acta Oceanol. Sin. 39 (4), 100–109. doi: 10.1007/s13131-019-1468-y
Eddy T. D., Bernhardt J. R., Blanchard J. L., Cheung W. W., Colléter M., Du Pontavice H., et al. (2021). Energy Flow Through Marine Ecosystems: Confronting Transfer Efficiency. Trends Ecol. Evol. 36 (1), 76–86. doi: 10.1016/j.tree.2020.09.006
Fakhraee M., Planavsky N. J., Reinhard C. T. (2020). The Role of Environmental Factors in the Long-Term Evolution of the Marine Biological Pump. Nat. Geosci. 13 (12), 812–816. doi: 10.1038/s41561-020-00660-6
Fromentin J. M. (2009). Lessons From the Past: Investigating Historical Data From Bluefin Tuna Fisheries. Fish. Fisheries. 10 (2), 197–216. doi: 10.1111/j.1467-2979.2008.00311.x
Garibaldi L., Limongelli L. (2003). Trends in Oceanic Captures and Clustering of Large Marine Ecosystems. Two Stud. based. FAO capture. database 639 (2), 435.
Grainger R. J., Garcia S. M. (1996). “Trend Analysis and Fisheries Potential,” in Chronicles of Marine Fishery Landings, (1950-1994) (Rome: FAO).
Gutiérrez D., Akester M., Naranjo L. (2016). Productivity and Sustainable Management of the Humboldt Current Large Marine Ecosystem Under Climate Change. Environ. Dev. 17, 126–144. doi: 10.1016/j.envdev.2015.11.004
He X., Field J. C. (2019). Effects of Recruitment Variability and Fishing History on Estimation of Stock-Recruitment Relationships: Two Case Studies From US West Coast Fisheries. Fish. Res. 217, 21–34. doi: 10.1016/j.fishres.2018.06.001
Henson S., Le Moigne F., Giering S. (2019). Drivers of Carbon Export Efficiency in the Global Ocean. Global. Biogeochem. Cy 33 (7), 891–903. doi: 10.1029/2018GB006158
Hutchings J. A., Kuparinen A. (2020). Implications of Fisheries-Induced Evolution for Population Recovery: Refocusing the Science and Refining its Communication. Fish. Fisheries. 21 (2), 453–464. doi: 10.1111/faf.12424
Jin X., Tang Q. (1996). Changes in Fish Species Diversity and Dominant Species Composition in the Yellow Sea. Fish. Res. 26 (3-4), 337–352. doi: 10.1016/0165-7836(95)00422-X
Knight B. R., Jiang W. (2009). Assessing Primary Production Constraints in New Zealand Fisheries. Fish. Res. 100 (1), 15–25. doi: 10.1016/j.fishres.2009.06.001
Krumme U., Wang T. C., Wang D. R. (2013). From Food to Feed: Assessment of the Stationary Lift Net Fishery of East Hainan, Northern South China Sea. Cont. Shelf. Res. 57, 105–116. doi: 10.1016/j.csr.2012.04.011
Lam V. W., Pauly D. (2019). Status of Fisheries in 13 Asian Large Marine Ecosystems. Deep. Sea. Res. Part II 163, 57–64. doi: 10.1016/j.dsr2.2018.09.002
Liang C., Pauly D. (2017). Fisheries Impacts on China's Coastal Ecosystems: Unmasking a Pervasive ‘Fishing Down’effect. PLoS One 12 (3), e0173296. doi: 10.1371/journal.pone.0173296
Liang C., Pauly D. (2020). Masking and Unmasking Fishing Down Effects: The Bohai Sea (China) as a Case Study. Ocean. Coast. Manage. 184, 105033. doi: 10.1016/j.ocecoaman.2019.105033
Liu K.-K., Chao S.-Y., Shaw P.-T., Gong G.-C., Chen C.-C., Tang T. (2002). Monsoon-Forced Chlorophyll Distribution and Primary Production in the South China Sea: Observations and a Numerical Study. Deep. Sea. Res. Part I 49 (8), 1387–1412. doi: 10.1016/S0967-0637(02)00035-3
Lu Z., Gan J., Dai M., Zhao X., Hui C. R. (2020). Nutrient Transport and Dynamics in the South China Sea: A Modeling Study. Prog. Oceanogr. 183, 102308. doi: 10.1016/j.pocean.2020.102308
Mahesh V., Dineshbabu A. P., Naik A., Anjanayappa H. N., Khavi M. (2019). Characterization of Low Value Bycatch in Trawl Fisheries Off Karnataka Coast, India and its Impact on Juveniles of Commercially Important Fish Species. Indian J. Mar. Sci. 48 (11), 1733–1742.
Mashjoor S., Jamebozorgi F. H., Kamrani E. (2018). Fishery-Induced Inter-Annual Changes in the Mean Trophic Level, the Northern Sea of Oman Off the Iranian Coast 2002–2011. Ocean. Sci. J. 53 (4), 655–665. doi: 10.1007/s12601-018-0046-7
Mcowen C. J., Cheung W. W., Rykaczewski R. R., Watson R. A., Wood L. J. (2015). Is Fisheries Production Within L Arge M Arine E Cosystems Determined by Bottom-Up or Top-Down Forcing? Fish. Fisheries. 16 (4), 623–632. doi: 10.1111/faf.12082
Mehner T., Lischke B., Scharnweber K., Attermeyer K., Brothers S., Gaedke U., et al. (2018). Empirical Correspondence Between Trophic Transfer Efficiency in Freshwater Food Webs and the Slope of Their Size Spectra. Ecology 99 (6), 1463–1472. doi: 10.1002/ecy.2347
Morissette L., Christensen V., Pauly D. (2012). Marine Mammal Impacts in Exploited Ecosystems: Would Large Scale Culling Benefit Fisheries? PLoS One 7 (9), e43966. doi: 10.1371/journal.pone.0043966
Nixon S. W. (1982). Nutrient Dynamics, Primary Production and Fisheries Yields of Lagoons. Oceanol. Acta. Special. Issue 4, 357–71.
Nixon S. W. (1992). Quantifying the Relationship Between Nitrogen Input and the Productivity of Marine Ecosystem. Pro. Adv. Mar. Tech. Conf. Tokyo 5, 57–83.
Oglesby R. T. (1977). Relationships of Fish Yield to Lake Phytoplankton Standing Crop, Production, and Morphoedaphic Factors. J. Fisheries. Board. Canada. 34 (12), 2271–2279. doi: 10.1139/f77-305
Olsen E. M., Carlson S. M., Gjøsæter J., Stenseth N. C. (2009). Nine Decades of Decreasing Phenotypic Variability in Atlantic Cod. Ecol. Lett. 12 (7), 622–631. doi: 10.1111/j.1461-0248.2009.01311.x
Pang Y., Tian Y., Fu C., Wang B., Li J., Ren Y., et al. (2018). Variability of Coastal Cephalopods in Overexploited China Seas Under Climate Change With Implications on Fisheries Management. Fish. Res. 208, 22–33. doi: 10.1016/j.fishres.2018.07.004
Pauly D. (2018). A Vision for Marine Fisheries in a Global Blue Economy. Mar. Policy 87, 371–374. doi: 10.1016/j.marpol.2017.11.010
Pauly D., Belhabib D., Blomeyer R., Cheung W. W., Cisneros-Montemayor A. M., Copeland D., et al. (2014). China's Distant-Water Fisheries in the 21st Century. Fish. Fisheries. 15 (3), 474–488. doi: 10.1111/faf.12032
Pauly D., Christensen V. (1995). Primary Production Required to Sustain Global Fisheries. Nature 374 (6519), 255–257. doi: 10.1038/374255a0
Pauly D., Christensen V., Dalsgaard J., Froese R., Torres F. (1998). Fishing Down Marine Food Webs. Science 279 (5352), 860–863. doi: 10.1126/science.279.5352.860
Pauly D., Froese R. (2012). Comments on FAO's State of Fisheries and Aquaculture, or ‘SOFIA 2010’. Mar. Policy 36 (3), 746–752. doi: 10.1016/j.marpol.2011.10.021
Pauly D., Liang C. (2020). The Fisheries of the South China Sea: Major Trends Since 1950. Mar. Policy 121, 103584. doi: 10.1016/j.marpol.2019.103584
Rosenberg A. A., Fogarty M. J., Cooper A. B., Dickey-Collas M., Fulton E. A., Gutiérrez N. L., et al. (2014). Developing New Approaches to Global Stock Status Assessment and Fishery Production Potential of the Seas. FAO Fisheries. Aquaculture. Circular. Rome: FAO 1086, 175.
Selig E. R., Hole D. G., Allison E. H., Arkema K. K., McKinnon M. C., Chu J., et al. (2019). Mapping Global Human Dependence on Marine Ecosystems. Conserv. Lett. 12 (2), e12617. doi: 10.1111/conl.12617
Sguotti C., Otto S. A., Frelat R., Langbehn T. J., Ryberg M. P., Lindegren M., et al. (2019). Catastrophic Dynamics Limit Atlantic Cod Recovery. P. Roy.l Soc B 286 (1898), 20182877. doi: 10.1098/rspb.2018.2877
Sharma P., Marinov I., Cabre A., Kostadinov T., Singh A. (2019). Increasing Biomass in the Warm Oceans: Unexpected New Insights From SeaWiFS. Geophys. Res. Lett 46 (7), 3900–10. doi: 10.1029/2018GL079684
Sherman K., Hamukuaya H. (2016). Sustainable Development of the World's Large Marine Ecosystems. Environ. Dev. 17, 1–6. doi: 10.1016/j.envdev.2015.12.002
Siswanto E., Honda M. C., Matsumoto K., Sasai Y., Fujiki T., Sasaoka K., et al. (2016). Sixteen-Year Phytoplankton Biomass Trends in the Northwestern Pacific Ocean Observed by the SeaWiFS and MODIS Ocean Color Sensors. J. Oceanogr. 72 (3), 479–489. doi: 10.1007/s10872-016-0357-1
Steadman D., Appleby T., Hawkins J. (2014). Minimising Unsustainable Yield: Ten Failing European Fisheries. Mar. Policy 48, 192–201. doi: 10.1016/j.marpol.2014.03.030
Stock C. A., John J. G., Rykaczewski R. R., Asch R. G., Cheung W. W., Dunne J. P., et al. (2017). Reconciling Fisheries Catch and Ocean Productivity. Proc. Natl. Acad. Sci. 114 (8), E1441–E1449. doi: 10.1073/pnas.1610238114
Sumaila U. R. (2019). Comparative Valuation of Fisheries in Asian Large Marine Ecosystems With Emphasis on the East China Sea and South China Sea LMEs. Deep. Sea. Res. Part II 163, 96–101. doi: 10.1016/j.dsr2.2018.12.008
Sumaila U. R., Cheung W. W. (2015). Boom or Bust: The Future of Fish in the South China Sea (Vancouver, BC: University of British Columbia).
Unsworth R. K., Nordlund L. M., Cullen-Unsworth L. C. (2019). Seagrass Meadows Support Global Fisheries Production. Conserv. Lett. 12 (1), e12566. doi: 10.1111/conl.12566
Wan R., Bian X. (2012). Size Variability and Natural Mortality Dynamics of Anchovy Engraulis Japonicus Eggs Under High Fishing Pressure. Mar. Ecol. Prog. Ser. 465, 243–251. doi: 10.3354/meps09795
Ware D. M., Thomson R. E. (2005). Bottom-Up Ecosystem Trophic Dynamics Determine Fish Production in the Northeast Pacific. Science 308 (5726), 1280–1284. doi: 10.1126/science.1109049
Watson R. A., Cheung W. W., Anticamara J. A., Sumaila R. U., Zeller D., Pauly D. (2013). Global Marine Yield Halved as Fishing Intensity Redoubles. Fish. Fisheries. 14 (4), 493–503. doi: 10.1111/j.1467-2979.2012.00483.x
Watson R. A., Morato T. (2013). Fishing Down the Deep: Accounting for Within-Species Changes in Depth of Fishing. Fish. Res. 140, 63–65. doi: 10.1016/j.fishres.2012.12.004
Watson R., Pauly D. (2001). Systematic Distortions in World Fisheries Catch Trends. Nature 414 (6863), 534–536. doi: 10.1038/35107050
Watson R., Pauly D. (2014). Coastal Catch Transects as a Tool for Studying Global Fisheries. Fish. Fisheries. 15 (3), 445–455. doi: 10.1111/faf.12025
Watson R., Zeller D., Pauly D. (2014). Primary Productivity Demands of Global Fishing Fleets. Fish. Fisheries. 15 (2), 231–241. doi: 10.1111/faf.12013
Winter A. M., Richter A., Eikeset A. M. (2020). Implications of Allee Effects for Fisheries Management in a Changing Climate: Evidence From Atlantic Cod. Ecol. Appl. 30 (1), e01994. doi: 10.1002/eap.1994
Yang B., Herrmann B., Yan L., Li J., Wang T. (2021). Effects of Six Codend Meshes on the Size Selection of Juvenile White Croaker (Pennahia Argentata) in Demersal Trawl Fishery of the South China Sea. PLoS One 16 (7), e0253723. doi: 10.1371/journal.pone.0253723
Yu X., Zhang Z. (2005). Characteristics of Neogene Depositional Systems on the Northern Continental Slope of the South China Sea and Their Relationships With Gas Hydrate. Geology. China 32 (3), 470–476.
Zeller D., Pauly D. (2016). Catch Reconstruction: Concepts, Methods, and Data Sources. Global Atlas. Mar. Fisheries.: A. Crit. Appraisal. Catches. Ecosystem. Impacts. 59 (5), 12–33.
Zhang W., Liu M., Sadovy de Mitcheson Y., Cao L., Leadbitter D., Newton R., et al. (2020). Fishing for Feed in China: Facts, Impacts and Implications. Fish. Fisheries. 21 (1), 47–62. doi: 10.1111/faf.12414
Keywords: large marine ecosystem, primary production, carbon transfer efficiency, fishery collapse, fisheries catch
Citation: Chen D, Wang X, Hou M, Wang Q, Liu Q, Huang H and Zhang Y (2022) Carbon Transfer Efficiency and Risk of Fisheries Collapse in Three Large Marine Ecosystems Around China. Front. Mar. Sci. 9:863611. doi: 10.3389/fmars.2022.863611
Received: 27 January 2022; Accepted: 30 May 2022;
Published: 28 June 2022.
Edited by:
Jun Xu, Institute of Hydrobiology (CAS), ChinaReviewed by:
Jayasankar Jayaraman, Central Marine Fisheries Research Institute (ICAR), IndiaCopyright © 2022 Chen, Wang, Hou, Wang, Liu, Huang and Zhang. This is an open-access article distributed under the terms of the Creative Commons Attribution License (CC BY). The use, distribution or reproduction in other forums is permitted, provided the original author(s) and the copyright owner(s) are credited and that the original publication in this journal is cited, in accordance with accepted academic practice. No use, distribution or reproduction is permitted which does not comply with these terms.
*Correspondence: Yafeng Zhang, emhhbmd5YWZAempuaGpnLm1lZS5nb3YuY24=
†These authors have contributed equally to this work and share first authorship
Disclaimer: All claims expressed in this article are solely those of the authors and do not necessarily represent those of their affiliated organizations, or those of the publisher, the editors and the reviewers. Any product that may be evaluated in this article or claim that may be made by its manufacturer is not guaranteed or endorsed by the publisher.
Research integrity at Frontiers
Learn more about the work of our research integrity team to safeguard the quality of each article we publish.