 Xiaohui Jiao
 Jicai Zhang
 Qun Li
 Chunyan Li
94% of researchers rate our articles as excellent or good
Learn more about the work of our research integrity team to safeguard the quality of each article we publish.
Find out more
ORIGINAL RESEARCH article
Front. Mar. Sci. , 28 April 2022
Sec. Physical Oceanography
Volume 9 - 2022 | https://doi.org/10.3389/fmars.2022.862857
Based on the CTD data from 58 stations in the Bering Sea and the Chukchi Sea in the summer of 2019, the values of mixed layer depth (MLD) were obtained by using the density difference threshold method. It was concluded that the MLD can be estimated more accurately by using a criterion of 0.125 kg/m3 in this region. The average MLD in the Bering Sea basin was larger than that in the Bering Sea shelf, and both of them were smaller than that in the Bering Sea slope. The MLD increased northward in both the Chukchi Sea shelf and the Chukchi Sea slope. The farther northward, the greater the difference between the MLD calculated from temperature (MLDt) and the MLD calculated from density (MLDd). The water masses and their interaction played an important role in the variation of MLD in the northern Bering Sea shelf and Chukchi Sea. The MLD was large due to the vertically homogeneous Anadyr Water in the northwestern Bering Sea shelf. The horizontal advection of Bering Sea Anadyr Water and Alaska Coastal Water in the Bering Sea shelf led to shallower MLD in the central northern Bering Sea shelf. The westward advection of the Alaska Coastal Water caused shallow mixed layers (MLs) in some regions of the Chukchi Sea shelf in the summer of 2019. The observed large MLD at BL01 station near the Aleutian Island was caused by an anticyclonic eddy. The northward increase in the MLD in the Chukchi Sea was related to the low-salinity seawater from sea ice melting in summer. The spatial variation of MLD was also closely related to the surface momentum flux and the sea surface buoyancy flux. Stratification plays an even more important role in determining the variation of MLD. The ML in 2019 was shallower and warmer than those in previous years, especially in the Bering Sea shelf and Chukchi Sea where sea ice volume, thickness, and coverage were significantly larger than the Bering Sea basin, which was related to the small sea ice volume in winter and spring of 2019 compared to previous years.
The exploration of the upper ocean mixed layer depth (MLD) in the Bering Sea and the Chukchi Sea is very beneficial because the ML strongly influenced the northward heat and freshwater transport through the Bering Strait, which had increased from 0.7 Sv in 2001 to 1.2 Sv in 2014 (Woodgate, 2018; Woodgate and Peralta-Ferriz, 2021). The onset of marine heatwaves (Schlegel et al., 2021), air-sea heat fluxes (Sirevaag et al., 2011), characteristics of water masses (Timmermans et al., 2014), and melting/freezing of sea ice (Mizobata and Shimada, 2012) are also highly sensitive to the variations of MLD. Direct observations and further understanding of the ML are of great significance for reducing the deviations of global model simulation results (D'Asaro, 2014), since the MLD derived from the ocean model still has large deviations from observations.
The variation of MLD in the Bering Sea and the Chukchi Sea is complicated due to the influence of circulation, surface buoyancy flux, eddies (Gaube et al., 2019), wind (Hu and Wang, 2010), and sea ice (Peralta-Ferriz and Woodgate, 2015). The major currents in the Bering Sea include the Bering Slope Current (BSC) along the Bering Sea slope (BSp), the Alaskan Coastal Current along the western coast of Alaska, the Anadyr Current, and the Aleutian North Slope Current (Danielson et al., 2014; Gong and Pickart, 2015; Stabeno et al., 2018). A sketch is shown in Figure 1. The hydrological characteristics in the Bering Sea are influenced by the Pacific Ocean due to water exchange, such as the major inflow through the Near Strait and outflow through the Kamchatka Strait (Woodgate, 2018). Strong eddy activities and mixing have been observed along BSp due to the instability of BSC (Mizobata et al., 2006). The sea ice in the Bering Sea and Chukchi Sea showed a trend of later freezing and earlier melting over the period from 1979 to 2018 (Ji et al., 2021), which might change the temporal variation of the ML (Rosenblum, E. 2018). As a result, the MLD varies drastically in time and space. The mean MLD was approximately 15–20 m in August and approximately 80–160 m in February and March according to 6,198 Argo profiles in BSb over the period from 2001 to 2017 (Johnson and Stabeno, 2017).
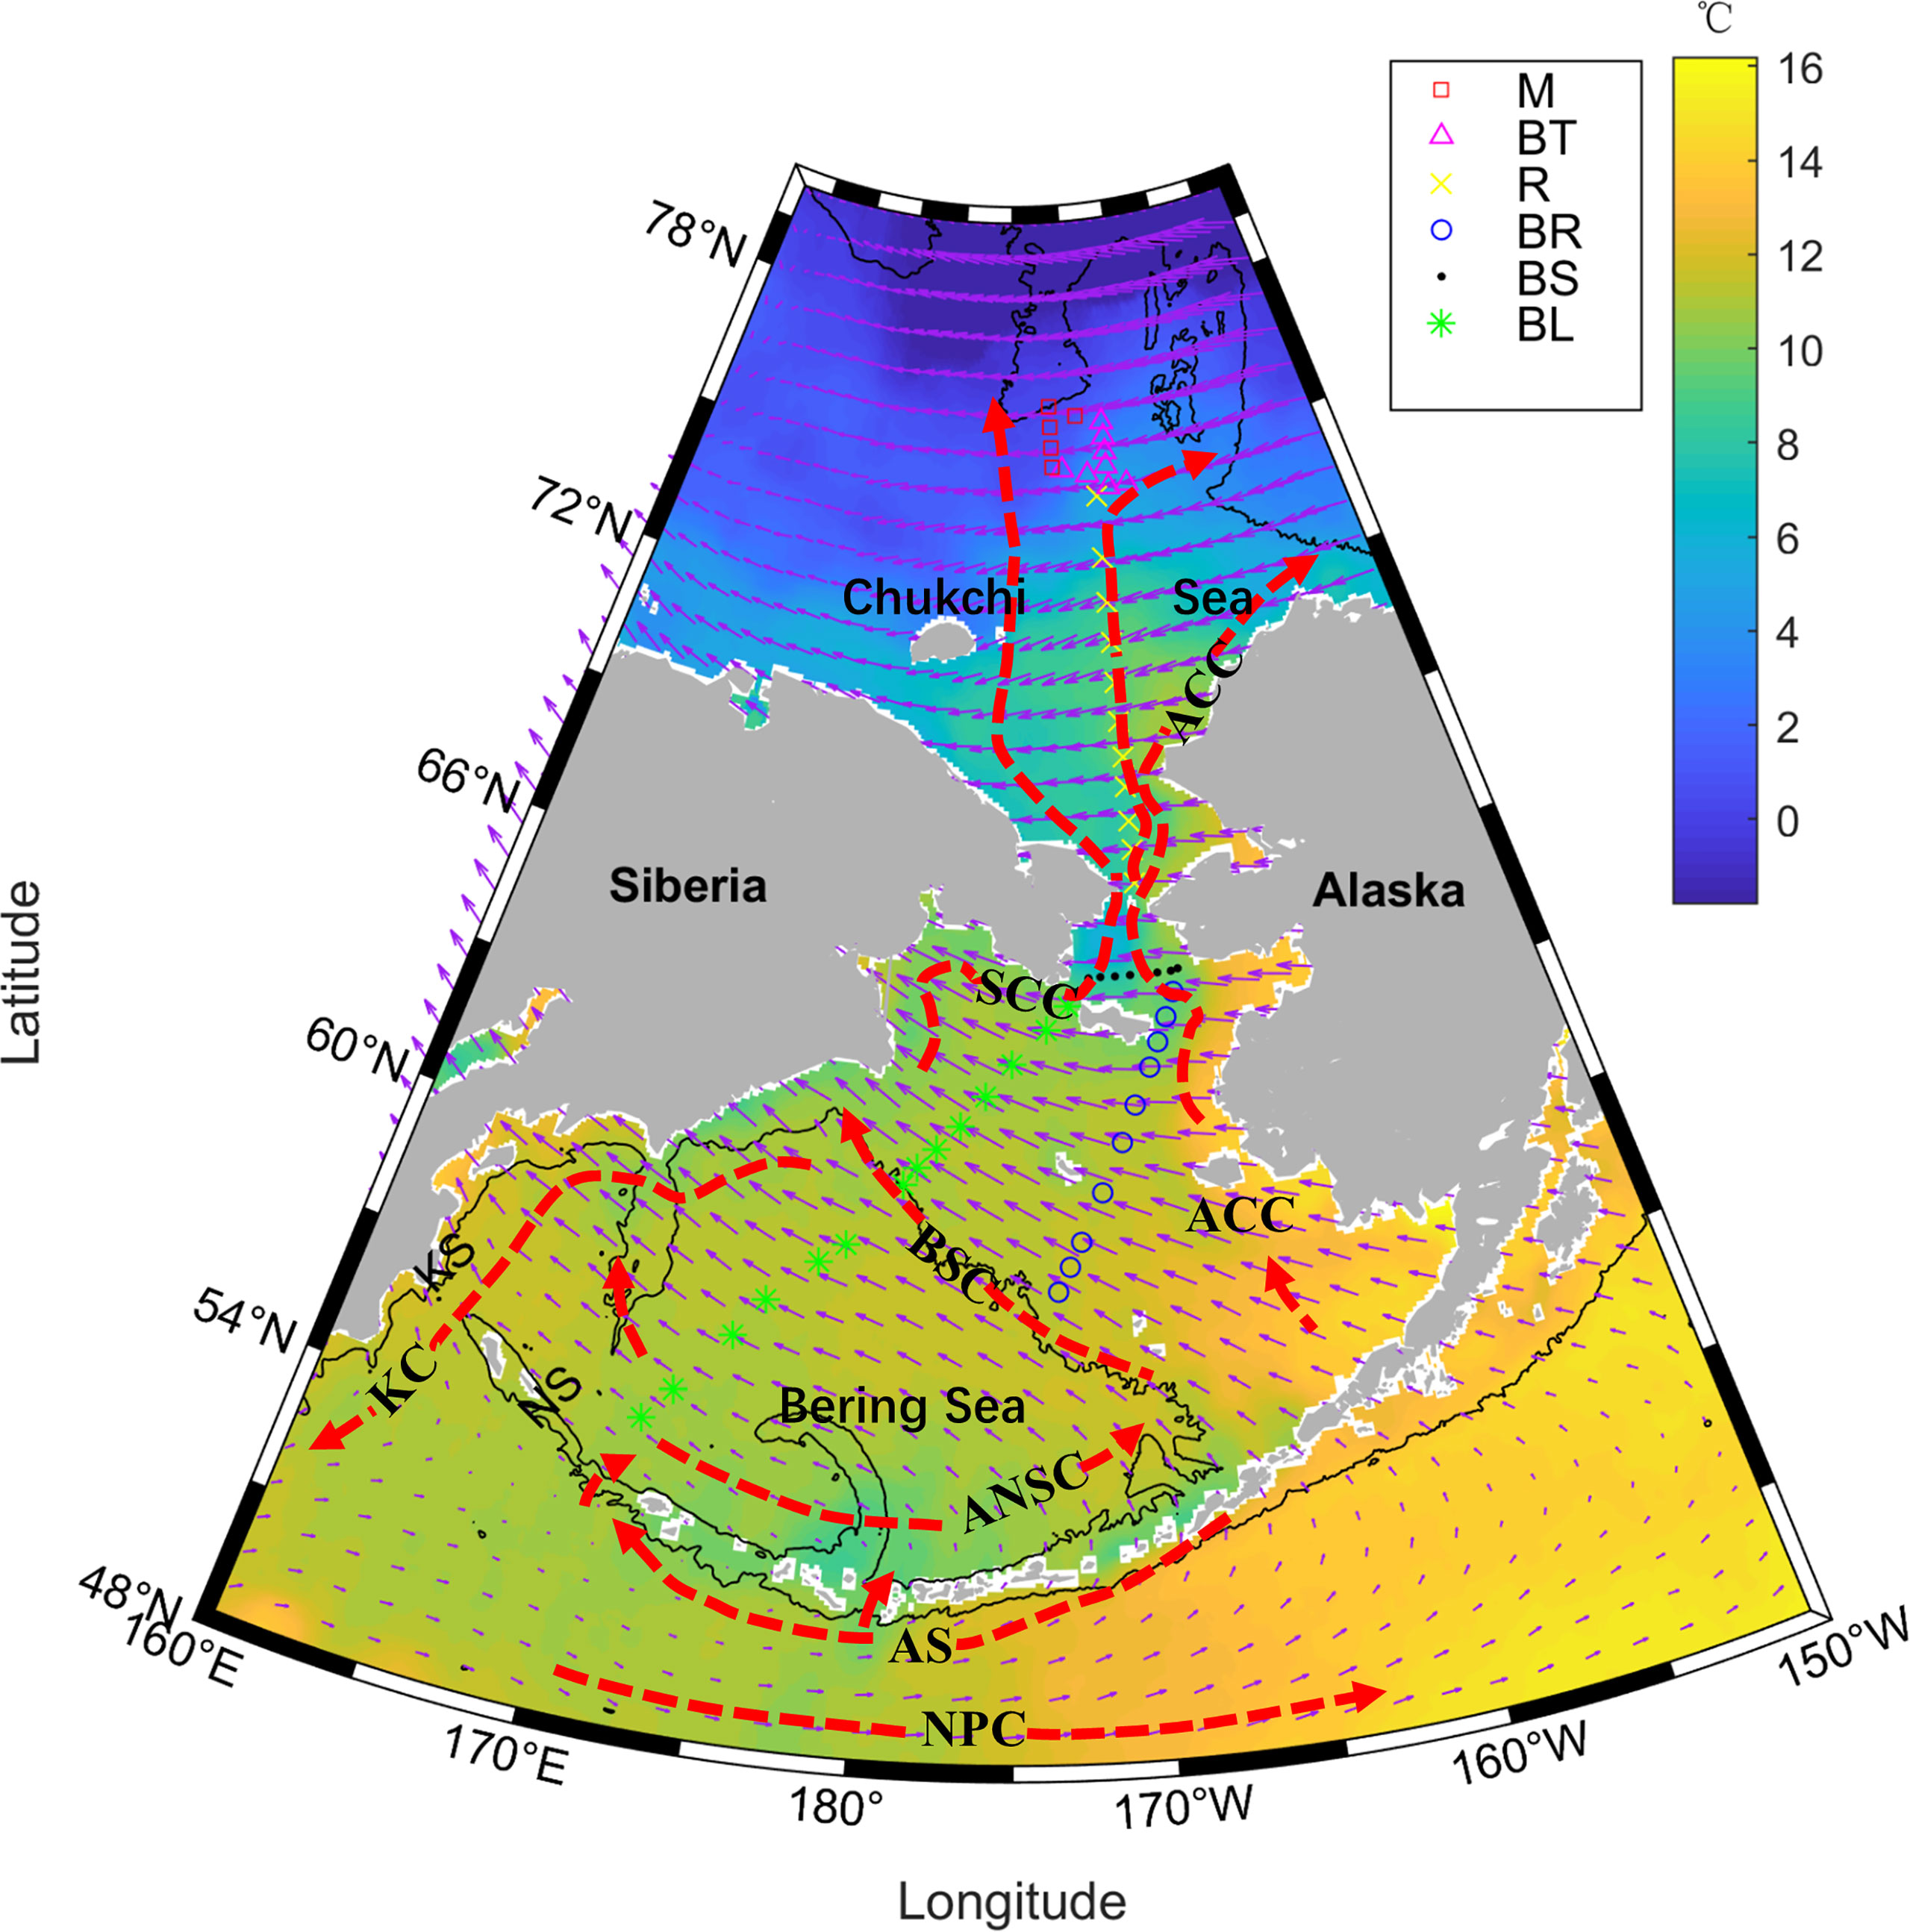
Figure 1 The distribution of 58 observation stations and patterns of major circulations in the study area. The asterisks, dots, circles, crosses, triangles, and squares represent the BL, BS, BR, R, BT, and M sections, respectively. The color denotes the mean sea surface temperature during the expedition. The arrows were the wind during the expedition. The black solid lines denote 2000-m isobaths. ACC, Alaskan Coastal Current; SCC, Siberian Coastal Current; KC, Kamchatka Current; BSC, Bering Slope Current; ANSC, Aleutian North Slope Current; AS, Alaskan Stream; NPC, North Pacific Current; KS, Kamchatka Strait; NS, Near Strait (Danielson et al., 2014; Gong and Pickart, 2015; Stabeno et al., 2018).
Global MLD climatology (de Boyer Montégut et al., 2004; Schmidtko et al., 2013; Holte et al., 2017) was coarse, and it was hard to recognize the variation of the ML in the Bering Sea and Chukchi Sea. A 30-year dataset (from 1979 to 2012) indicated ML shoaling in the Arctic, coincident with ML freshening and stratification intensifying (Peralta-Ferriz and Woodgate, 2015). Johnson and Stabeno (2017) found that the temperature of the ML exhibited significant variation in the Bering Sea basin, e.g., warm periods in 2004–2005 and 2015–2016, and the salinity of the ML decreased from 2001 to 2016. In the Bering Sea shelf, stratification breakdown of the upper ocean exhibited a trend toward later in the fall from 1995 to 2008 (Ladd and Stabeno, 2012). Under the condition that the sea ice extent in the summer of 2019 in the Arctic showed a continuous decrease compared to previous years (Figure S1 in Supplementary Material I), it was important to clarify whether these trends in the ML occurred in 2019. In this study, the spatial variations of MLD in the Bering Sea and the Chukchi Sea were analyzed based on the field observational data sampled during the summer of 2019. The interannual change compared to previous years was explored and underlying dominant processes, including anticyclonic eddies, wind, stratification, and sea ice melt water, were analyzed.
This work is organized as follows. Section 2 introduces the data and methods. The results of the analysis are given in Section 3. The processes related to the variation of MLD are discussed in Section 4. Section 5 presents the summary and conclusions.
The primary dataset analyzed in this work was the in situ observational temperature, salinity, and pressure datasets (Table 1). They were used to calculate the MLD, which were obtained during the 10th Chinese National Arctic Research Expedition from August 10 to September 30, 2019. As shown in Figure 1, 58 stations were distributed in the BL, BR, BS, R, BT, and M sections. The longitude, latitude, and time of each station can be found in Table S1 in the Supplementary Material II. Detailed information of the instruments can be found in Table S2 and Table S3 in the Supplementary Material III and IV. The CTD observations from the Chinese National Arctic Research Expeditions in 1999, 2003, 2010, 2012, 2014, and 2017 were also used to explore the inter-annual variations of MLD.
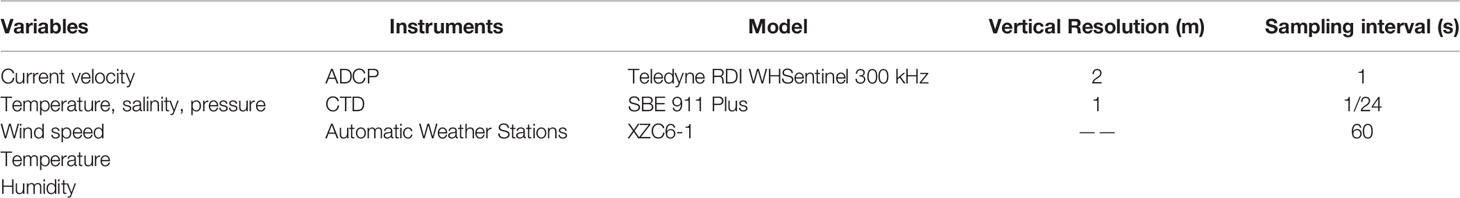
Table 1 Description of multiple observations during the expedition.
In order to supplement the inadequacy of field observation data, remote sensing and reanalysis datasets were also employed to investigate the influence factors of the MLD variability. The Bering Sea level was obtained from the Copernicus Marine Service and it was used to identify eddies. The wind speed and momentum flux were extracted to estimate their influence on deepening MLD and they were derived from the Version 2 CCMP Wind Vector Analysis Product offered by the Remote Sensing Systems (Wentz et al., 2015). The CCMP dataset was evaluated by in situ wind measurements obtained from the shipboard automatic meteorological station (AWS) and the results was in Supplementary Material V. The sea surface heat flux and water flux were obtained from the National Centers for Environmental Prediction (NCEP) Climate Forecast System Version 2 (CFSv2) (Saha et al., 2011). The significant wave height was obtained from the Copernicus Marine Service. The bathymetric dataset used in plotting the CTD profiles and isobaths were extracted from ETOPO1 (NOAA National Geophysical Data Center, 2009). The subsets for August and September from the World Ocean Atlas 2018 (Boyer et al., 2018) were compared with the in situ observations in 2019 to explore the changes in temperature, salinity, and MLD. The sea ice volume and thickness were used to estimate the influence of melt water on MLD, and they were extracted from the output of the PIOMAS model from Polar Science Center in University of Washington (Zhang and Rothrock, 2003).
Several methods have been developed to estimate the MLD, including the difference threshold (Kara et al., 2000; Kara et al., 2003; de Boyer Montégut et al., 2004), gradient threshold (Lukas and Lindstrom, 1991), curvature method (Lorbacher et al., 2006), split and merge method (Thomson and Fine, 2003), and hybrid method (Holte and Talley, 2009). After quantitative comparison, in this study the widely adopted threshold method (de Boyer Montégut et al., 2004; Peralta-Ferriz and Woodgate, 2015) was selected. The criterion was critical, as the small vertical fluctuations of the temperature and density within the ML brought confusion when calculating the MLD. A group of criteria was tested, and the results were shown in Supplementary Material VI. The adopted optimal criterion for the MLDd was Δσ = 0.125 kg/m3, and the reference depth was 5 m. The suitable criterion for the temperature difference method was 0.5°C. Visual examination confirmed that the criteria successfully identify the variations of MLD. To distinguish the role of temperature and salinity in the spatial variation of MLD, the MLDd (MLD estimated from the density profiles) and the MLDt (MLD from the temperature profiles) were both calculated, and in the following, MLD specifically referred to MLDd.
For the stratification index (SI) due to temperature (salinity), the density profile p is calculated using the temperature (salinity) profile and a vertically averaged salinity (temperature), as Equation (1) shows.
where Vθ represents the stratification index due to temperature, is the density profile derived from the temperature profile and a vertically averaged salinity, and is the vertically averaged salinity. h is the value of MLD here.
The MLD was closely related to the distribution and interaction of water masses. There were several water masses in the Bering Sea and Chukchi Sea, including three in the northern BSs: Anadyr Water (AW), Alaskan Coastal Water (ACW), and Bering Shelf Water. As shown in Figure 2, the average temperature of the cold and salt AW (S > 32.5, T < 4°C) was approximately 2°C and the average salinity was about 32.6. The average temperature of ACW was about 9°C with the salinity significantly lower than that of AW (Figure 2). The water mass below the surface was termed the cold intermediate layer (CIL) in BSb. The core temperature (the lowest temperature in the vertical section of potential temperature) of CIL was approximately 3°C (Figure 2).
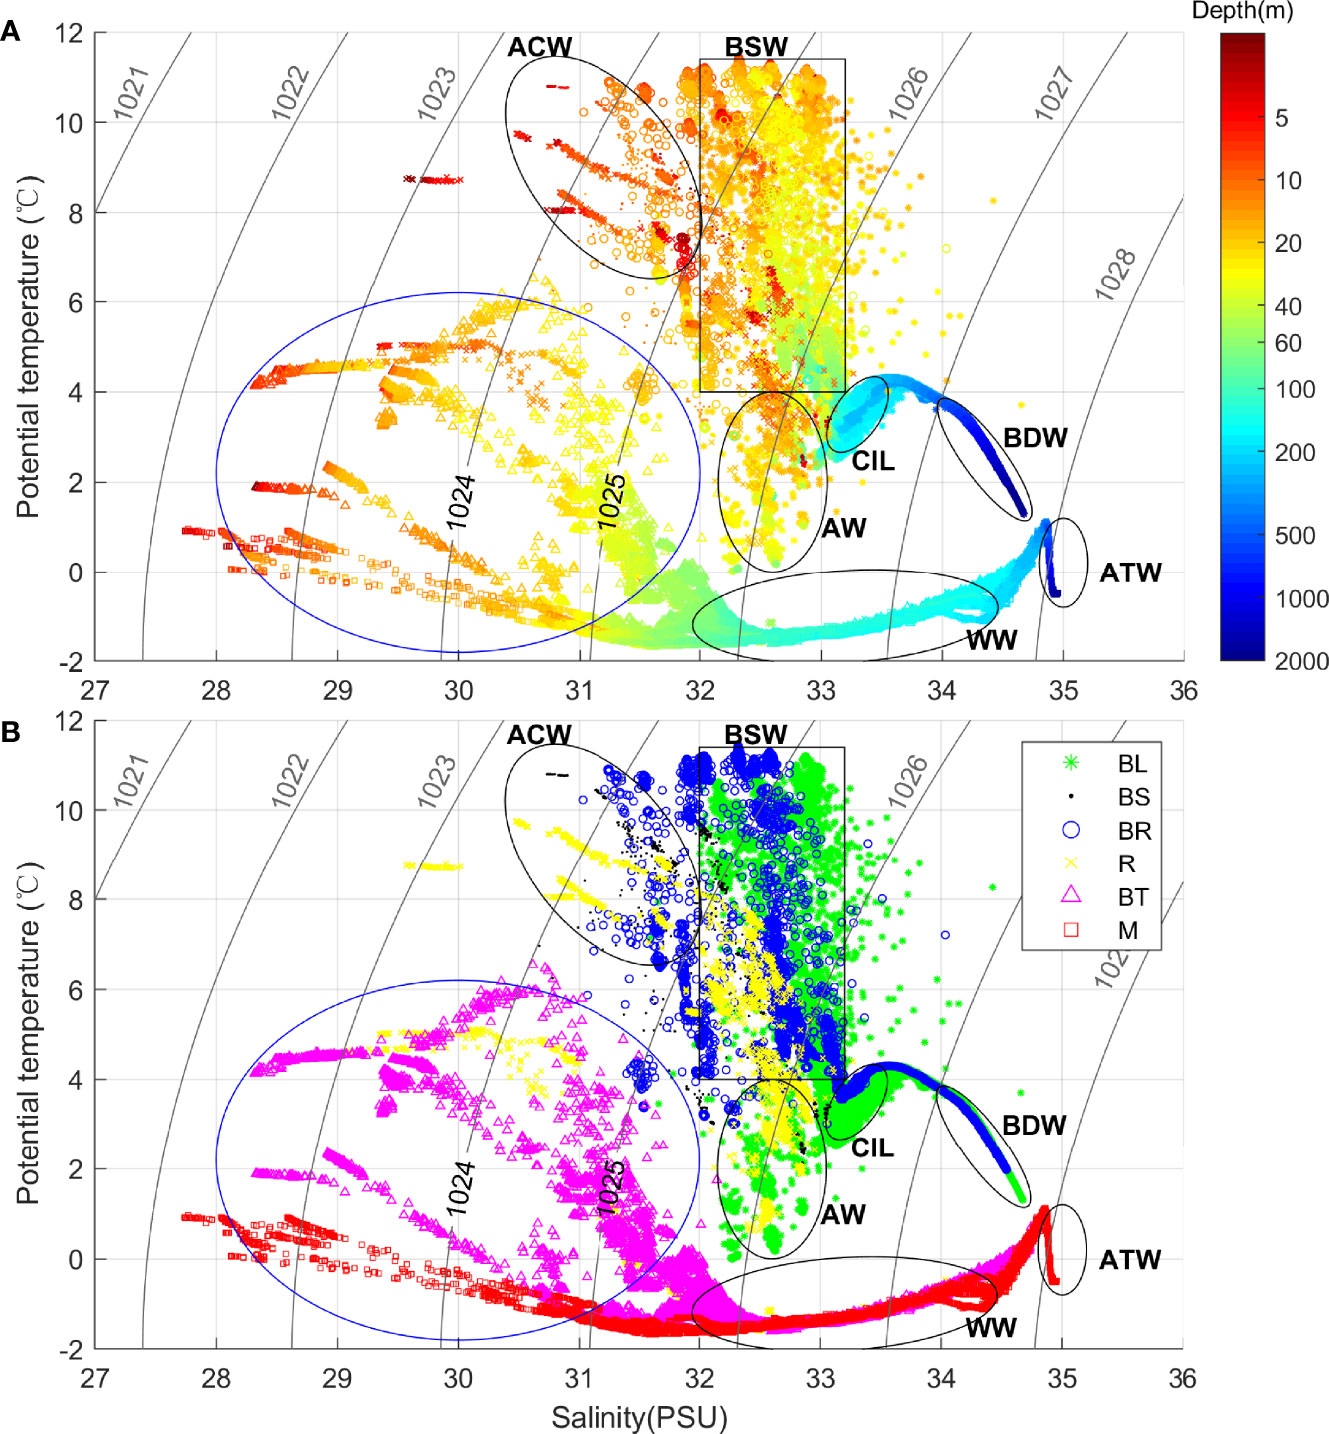
Figure 2 T-S diagram shows distinct water masses in the Bering Sea and Chukchi Sea based on CTD observations. (A) The color represents depth. (B) The color represents different areas. AW, Anadyr Water; ACW, Alaska Coastal Water; BDW, Bering Sea Deep Water; BSW, Bering Sea Shelf Water; CIL, Cold Intermediate Layer; WW, Winter Water; ATW, Atlantic Water. The blue circle represents the water masses in the Chukchi Sea except ACW.
In summer, the water mass in the Chukchi Sea shelf was a product of the mixing of Bering Sea Water, ACW, and Meltwater (Corlett and Pickart, 2017; Pisareva, 2018). Fundamentally, the farther north, the colder and fresher the water mass was (blue circle in Figure 2). The cold water mass in the intermediate layer was Winter Water and the deep water was Atlantic Water on the north of the Chukchi Sea slope (Figure 2). Vertical sections of potential temperature and salinity can be found in Supplementary Material VII (Figure S4, Figures S6–S8).
In general, the mean MLD in BSb was 17 m (with standard deviation being 1.5 m), greater than 13 m (with standard deviation being 4.2 m) on the BSs. The mean MLD in BSp was 28 m (with standard deviation of 3.3 m), significantly greater than BSb and Bss. The BL section was representative of the main circulation and water masses during the expedition period in both the BSb and BSs. Stations BL01–BL06 were located in BSb, and the MLDs at these stations were all greater than 15 m (Figure 3A). The maximum value of MLD at these stations reached 30 m, which was observed at station BL01 near Aleutian Islands. This deep ML was caused by an anticyclonic eddy and will be discussed in Section 3.5.1. In contrast, at stations BL11–BL14 in the west of BSs, the MLD was shallower than 15 m. In addition, the minimum MLD at BL section was 6 m, which was observed at station BL14 on the northwestern BSs. The MLD at station BL07 located in BSp was 25 m. Both of the MLD at stations BL01 and BL07 were markedly larger than other stations in BSb and BSs.
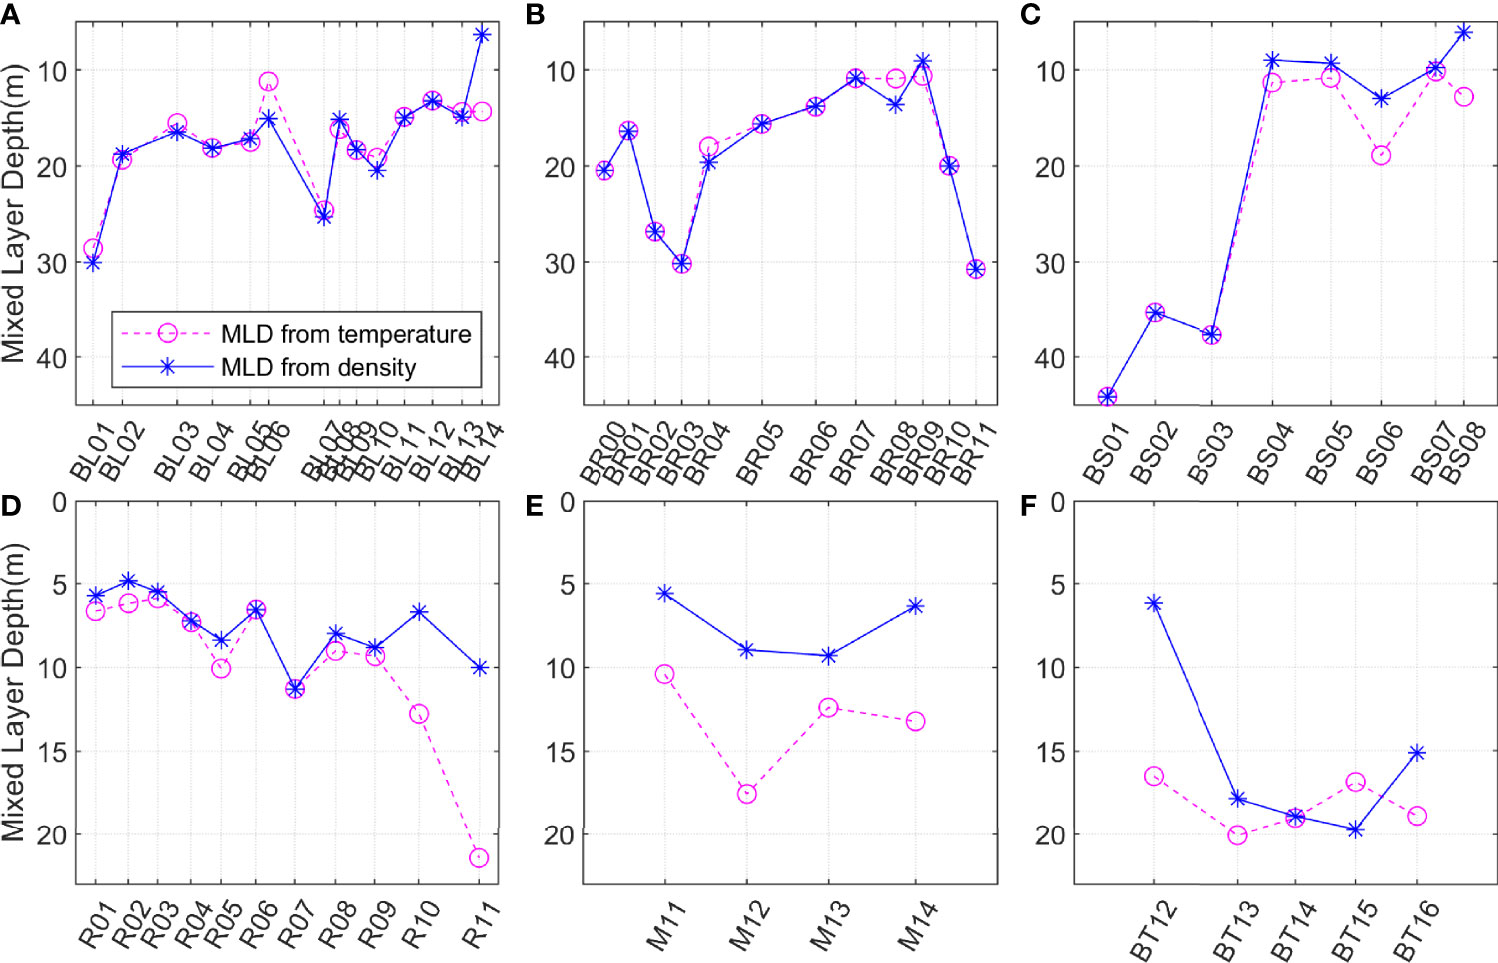
Figure 3 The MLD from temperature and density. (A–F) represent the BL, BR, BS, R, M, and BT sections, respectively. The magenta dashed lines represent the MLDt calculated from the temperature, and the blue solid lines represent the MLD calculated from the density. Notice that the y-axis was reversed.
The stations BR00–BR03 were located in BSp. The maximum MLD reached 30 m at station BR03 (Figure 3B). The average MLD at stations BR04–BR09 was 14 m in BSs, which was much smaller than the 23 m in BSp. Stations BR10 and BR11 were in the northeastern BSs, and isohalines and isotherms were almost vertical there. Correspondingly, the MLD at stations BR10 and BR11 were greater than those at other BR stations on BSs.
The western BS section was under the influence of AW in the northwestern Bering Sea shelf, and the eastern BS section was under the influence of ACW in the northeastern Bering Sea shelf. Therefore, the BS section represented the MLD under the influence of the advection of these two water masses. As the water column at BS01–BS03 was well mixed, the MLDs were larger than 35 m (Figure 3C). The MLD in the northeast was much smaller and was in the range of 6–13 m. The MLD at stations BS04 and BS05 was small, because the interaction of the light ACW and dense AW stratified the upper ocean there.
In general, the MLD in CSs had an overall trend of deepening from south to north (Figure 3D, F). The MLD increased from 5 m in the southern CSs to 10 m in the northern CSs, which covered a distance of about 880 km (Figure 3D). The MLD at Section R was in the range of 4–12 m. The MLD at R06 was shallower than the other stations along Section R (Figure 3D). A northward increase was also observed in the BT section. The maximum MLD was 20 m at station BT15. The MLD at stations BT13–BT16 was greater than 15 m and was also greater than the MLD in CSs (Figure 3F).
Though Sections M and BT were at the same latitude and close to each other, the MLD at Section M was in the range of 5–10 m, much shallower than that at Section BT (Figure 3E). The water mass along Section M was colder and fresher than that along Section BT. It seemed that Section BT was more easily influenced by the warm and salt water through the Bering Sea shelf, while Section M was more influenced by the sea ice melt water.
The MLD and MLDt had little difference in the southern Bering Sea, while the MLDt was generally larger than the MLD in the northern BSs and the Chukchi Sea (Figure 3). The MLD and MLDt had little difference at stations BL02–BL05, but the difference approached 4 m at station BL06 (Figure 3A). It should be noted that the MLDt (14 m) was much larger than the MLD (6 m) at station BL14. The average difference dMLD (MLD minus MLDt) was 0.51 m in the southern Bering Sea (including BL01–BL06, BR00), while the dMLD was −3.25 m in the northern BSs and the Chukchi Sea. The largest dMLD was less than 4 m in the southern Bering Sea, while the largest difference between MLDt and MLD was greater than 11 m in the Chukchi Sea.
The spatial variation of MLD was closely related to the water masses. The larger vertical density gradient and shallower MLD at stations BS04 and BS05 were related to the westward advection of the warm and fresh ACW. The northward increase in the MLD in the Chukchi Sea was accompanied by a high meridional gradient of salinity and temperature. This was the result of the advection of low-salinity water generated from the melting of sea ice in summer in the Chukchi Sea. Around station R06, the warm and fresh ACW, with shallower MLD, was diverted onto the western CSs due to Ekman transport under the influence of anomalously strong northerly winds (Pisareva et al., 2015). The same situation has been observed in September 2004 (Pisareva, 2018), 2008 (Linders et al., 2017), 2009 (Pisareva et al., 2015), and 2012 (Pisareva, 2018). The shallower MLD at station M was also related to the deviation of ACW.
Although the MLD increased in CSp as that in BSp, there was a difference between them. Remarkably, from the ocean basin towards the continental shelf, the isotherm and isohaline tended to be parallel to the continental slope in the Chukchi Sea, while they tended to be perpendicular to the continental slope in the Bering Sea. The MLD variation in CSp was related to the low-salinity water generated from the melting of sea ice in summer and topographical constraints. However, in BSp the isotherm, isohaline, and MLD were mainly affected by BSC.
The stratification index (SI) was calculated over the whole depth of the ML. The value of SI was O (1,000 J/m2) in BSb and the southern BSs, including BL01–BL13, as shown in Figures 4A, B. In BSb, eastern BSs, and western BSs, the SI was dominant by salinity. This was different from the research of Ladd and Stabeno (2012), which concluded that temperature and salinity both influence the stratification of the Eastern Bering Sea shelf with their relative importance varying spatially and temporally. This was because their measurements were influenced by ACW with high temperature and low salinity. In the northeastern BSs, due to the high salinity of AW, the SI was significantly larger (Figure 4C). In the northwestern BSs and the Chukchi Sea, the SI was smaller (Figures 4C–F). The SI showed a trend of northward decreasing and was dominated by salinity. The contribution of the temperature to stratification was too weak and could be ignored for our observations. Therefore, it was reasonable to assume that the characteristics of the ML were dominated by the low-salinity water generated from the melting of sea ice in the Chukchi Sea and the northern BSs in the summer of 2019. In addition, the farther north, the greater the difference between the MLDt and MLD was in the Chukchi Sea, and salinity played a more important role in determining the MLD. This was consistent with the research of Johnson et al. (2012), which showed that the seasonal variation of the ML in the Arctic was dominated by salinity.
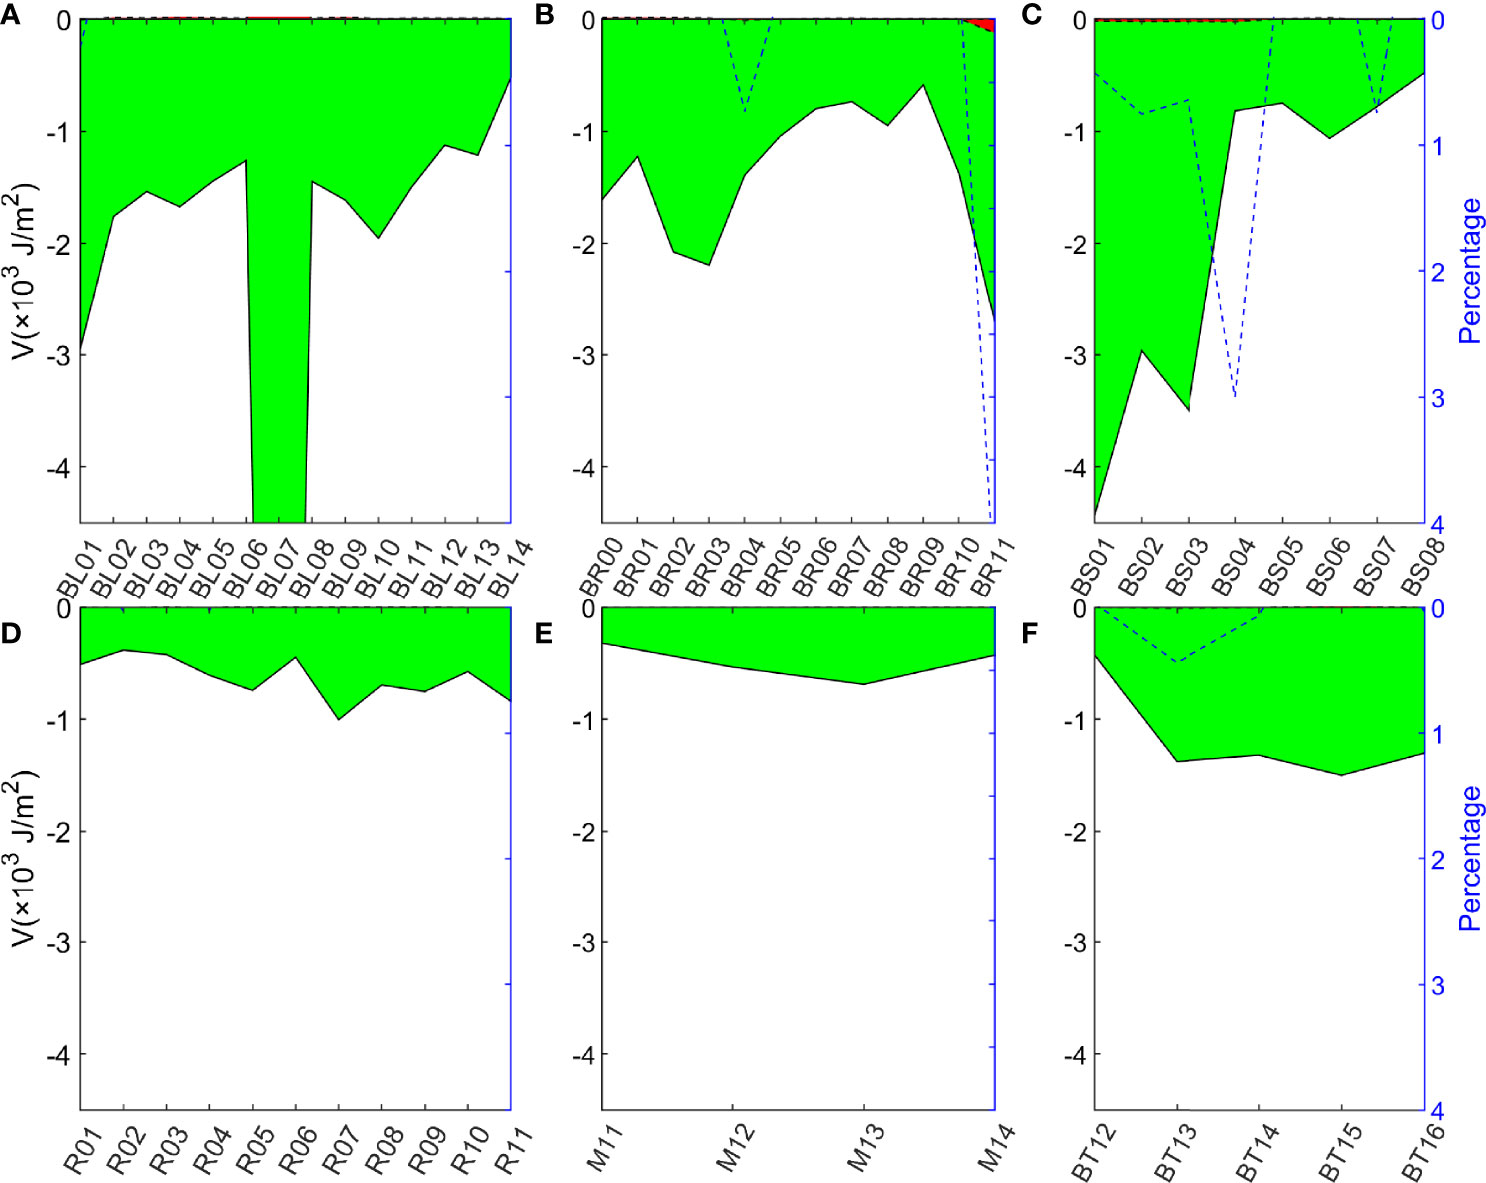
Figure 4 The left axis represents the stratification index. Red indicates the proportion of stratification due to temperature. Green was the proportion due to salinity. The right axis represents the percentage of the contribution of the temperature. The blue dashed line represents the proportion of the contribution of the temperature to the stratification at different stations.(A–F) represent BL, BR, BS, R, M, BT section, respectively.
Peralta-Ferriz and Woodgate (2015) found that the overall ML gradually became shallower from 1978 to 2012 by studying the seasonal and inter-annual changes of MLD in the Arctic region, including the northern Chukchi Sea in winter. However, MLD in the Bering Sea and summer Chukchi sea was not presented in their study. According to our observations, the MLD in 2019 was shallower, and the temperature of the ML was higher than the mean temperature of the other five (1999, 2003, 2010, 2012, and 2014) years along the BL section in the Bering Sea (Figures 5A, B). The mean MLD was 17 m (standard deviation being 5 m) in 2019, while the mean MLD was 23 m (with standard deviation being 5 m) for previous years mentioned above. The shoaling of the ML was more evident in the Bering Sea basin than that in the Bering Sea shelf. It should be noted that, although warmer ML was found along the whole BL section (Figure 5B), the shallower MLD does not occur in BSp and the continental slope north of Aleutian Island (BL01) (Figure 5A). This shallower MLD was accompanied by the warming of 7the surface layer and CIL. The minimum temperature of the CIL water mass in BSb showed an increasing trend: 0.54°C, 0.94°C, 0.82°C, 0.69°C, 1.99°C, and 2.50°C for 1999, 2003, 2010, 2012, 2014, and 2019, respectively. The ML was saltier in 2019, which led to denser ML in the Bering Sea shelf (Figures 5C, D). On the contrary, the ML was fresher in the Bering Sea basin in 2019, which led to lighter ML (Figures 5C, D).
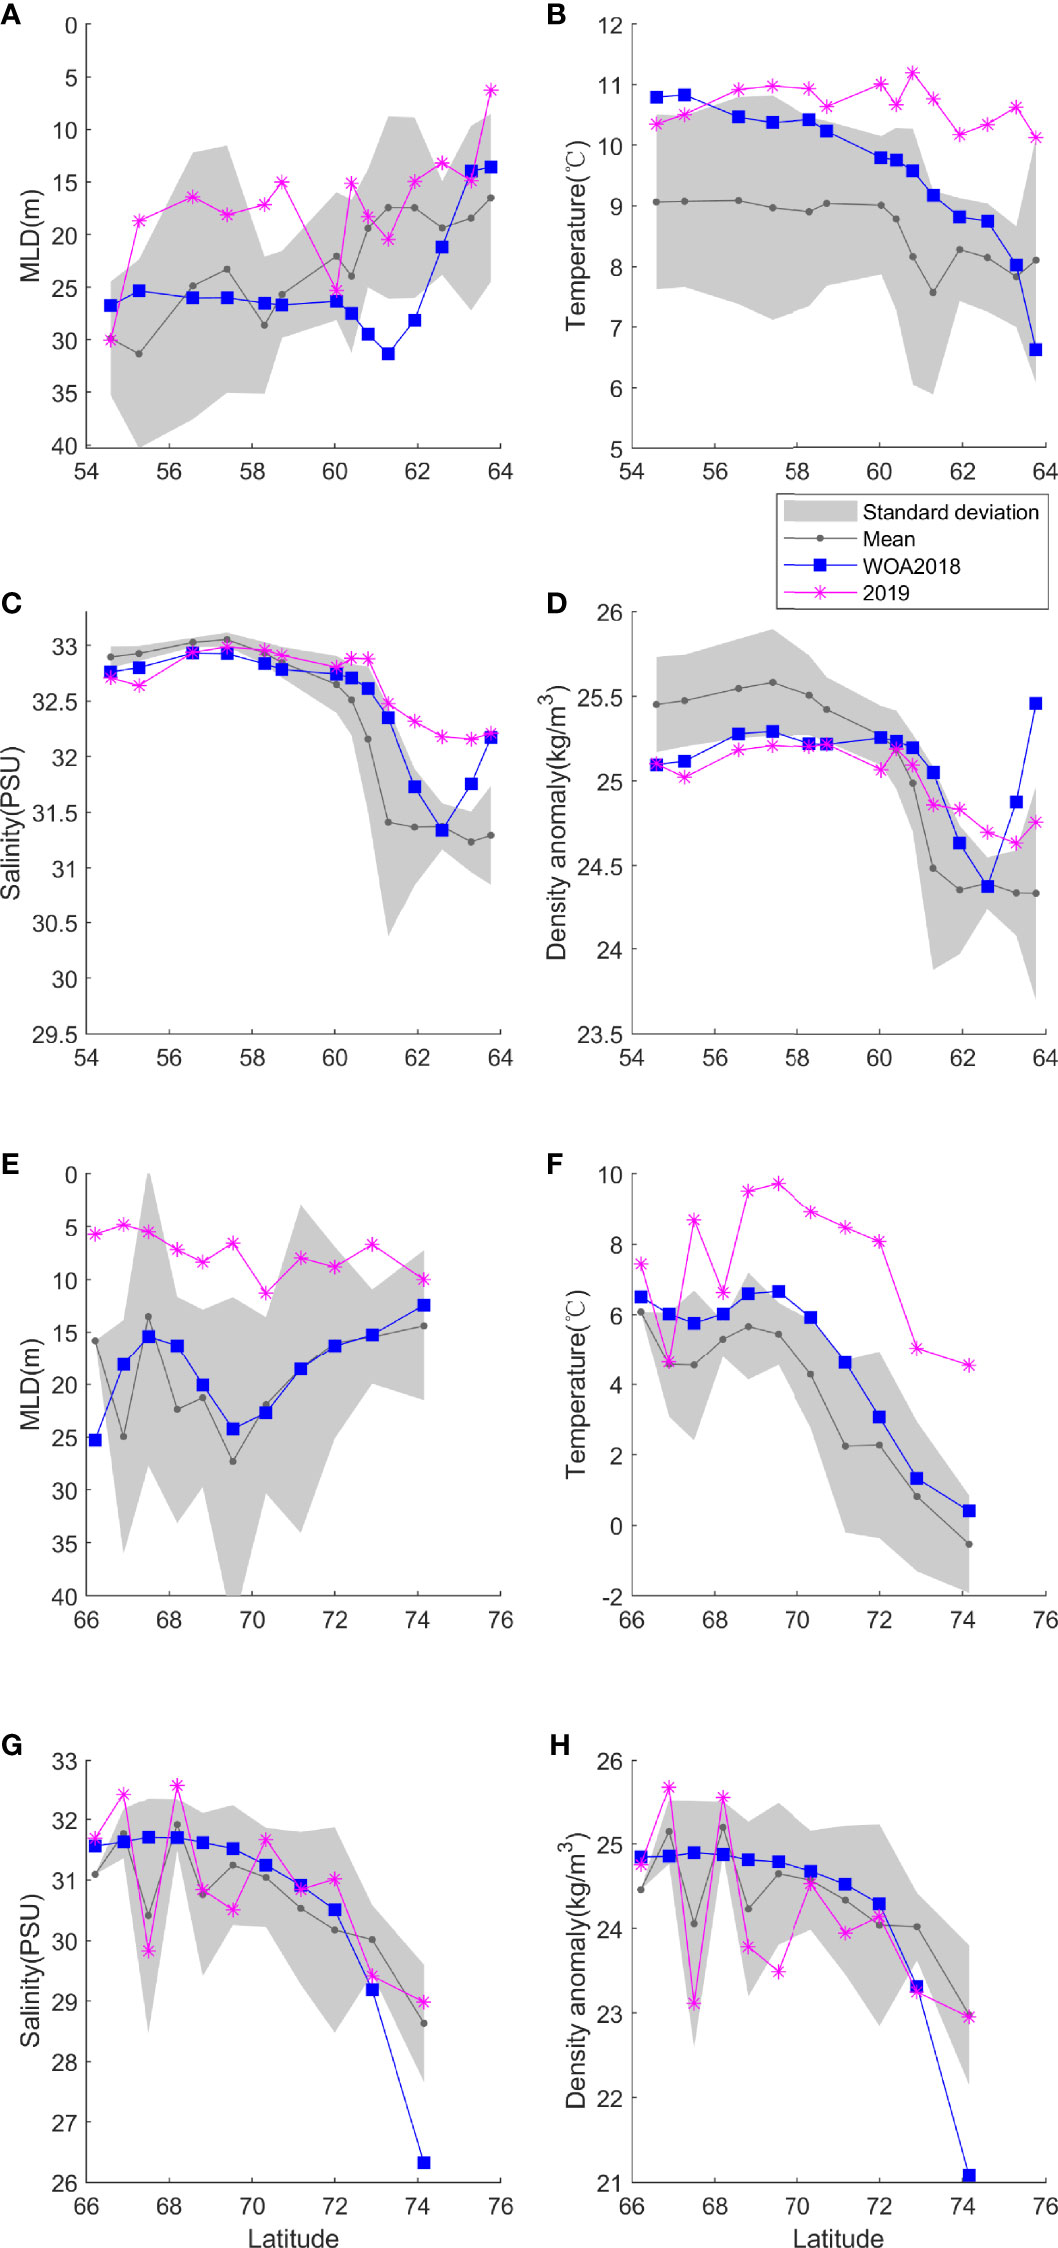
Figure 5 The inter-annual variation of MLD, temperature, salinity, and density of the mixed layer from the Chinese National Arctic Research Expeditions and the climatological MLD from the WOA along the BL [(A–D)] and R [(E–G), and (H)] sections. The gray line was the mean MLD from the data of 1999, 2003, 2010, 2012, and 2014. The shaded area was the standard deviation.
The MLD in 2019 was shallower than the mean MLD of 1999, 2003, 2010, 2012, 2014, and 2017 along the R section in the Chukchi Sea (Figure 5E). The mean MLD was 8 m (standard deviation being 2 m) in 2019, while the mean MLD was 19 m (with standard deviation being 5 m) for previous years mentioned above. This was accompanied by the warming of the ML (Figure 5F). The ML showed a trend of cold and freshening northward along the R section in all these years, including 2019. The warming and freshening around 69°–70°N may be caused by the westward advection of ACW, and the ML showed a deepening there. The warming, freshening, and shoaling of the ML around“69°–70°N”indicated by our observations were not identified by WOA2018. Salinity dominated the spatial fluctuation of the density for most of the year (Figures 5G, H).
As mentioned in Section 3.2, the large MLD at BL01 in the northern continental slope of the Aleutian Islands was related to the anticyclonic eddy along the Aleutian Islands, as shown in Figure 6A. The maximum speed radius of the eddy next to BL01 was derived from SSH datasets according to the method developed by Dong et al. (2009) and Nencioli et al. (2010). The amplitude, maximum speed radius, and effective radius of the eddy were 0.30 m, 49 km, and 83 km, respectively. The distance between the eddy center and BL01 was 40 km, which indicated that the station was influenced by the eddy, especially by the dynamics adjacent to the eddy periphery (Figure 6B). Pumping exerts its impact on the upper layer inside the eddy, while multiple processes, including advection and submesoscales, are involved outside the eddy periphery (Wang et al., 2018). Hence, the large MLD at BL01 was caused by this anticyclonic eddy through the downwelling effect. This coincides with the conclusion that anticyclones deepen the MLD in the research of Gaube et al. (2019). The MLD at BL01 was 30 m, significantly larger than that at BL02, which was 19 m (Figure 3A). The upper-ocean current velocity at BL01 was approximately 0.2 m/s, while it was less than 0.1 m/s in BSb according to the ADCP observations. There was enhanced shear at the base of the ML at BL01 (Figure 6C). Under the interaction of ocean currents and the Aleutian Islands, the eddies near the Aleutian Islands were relatively active, which result in deep MLD.
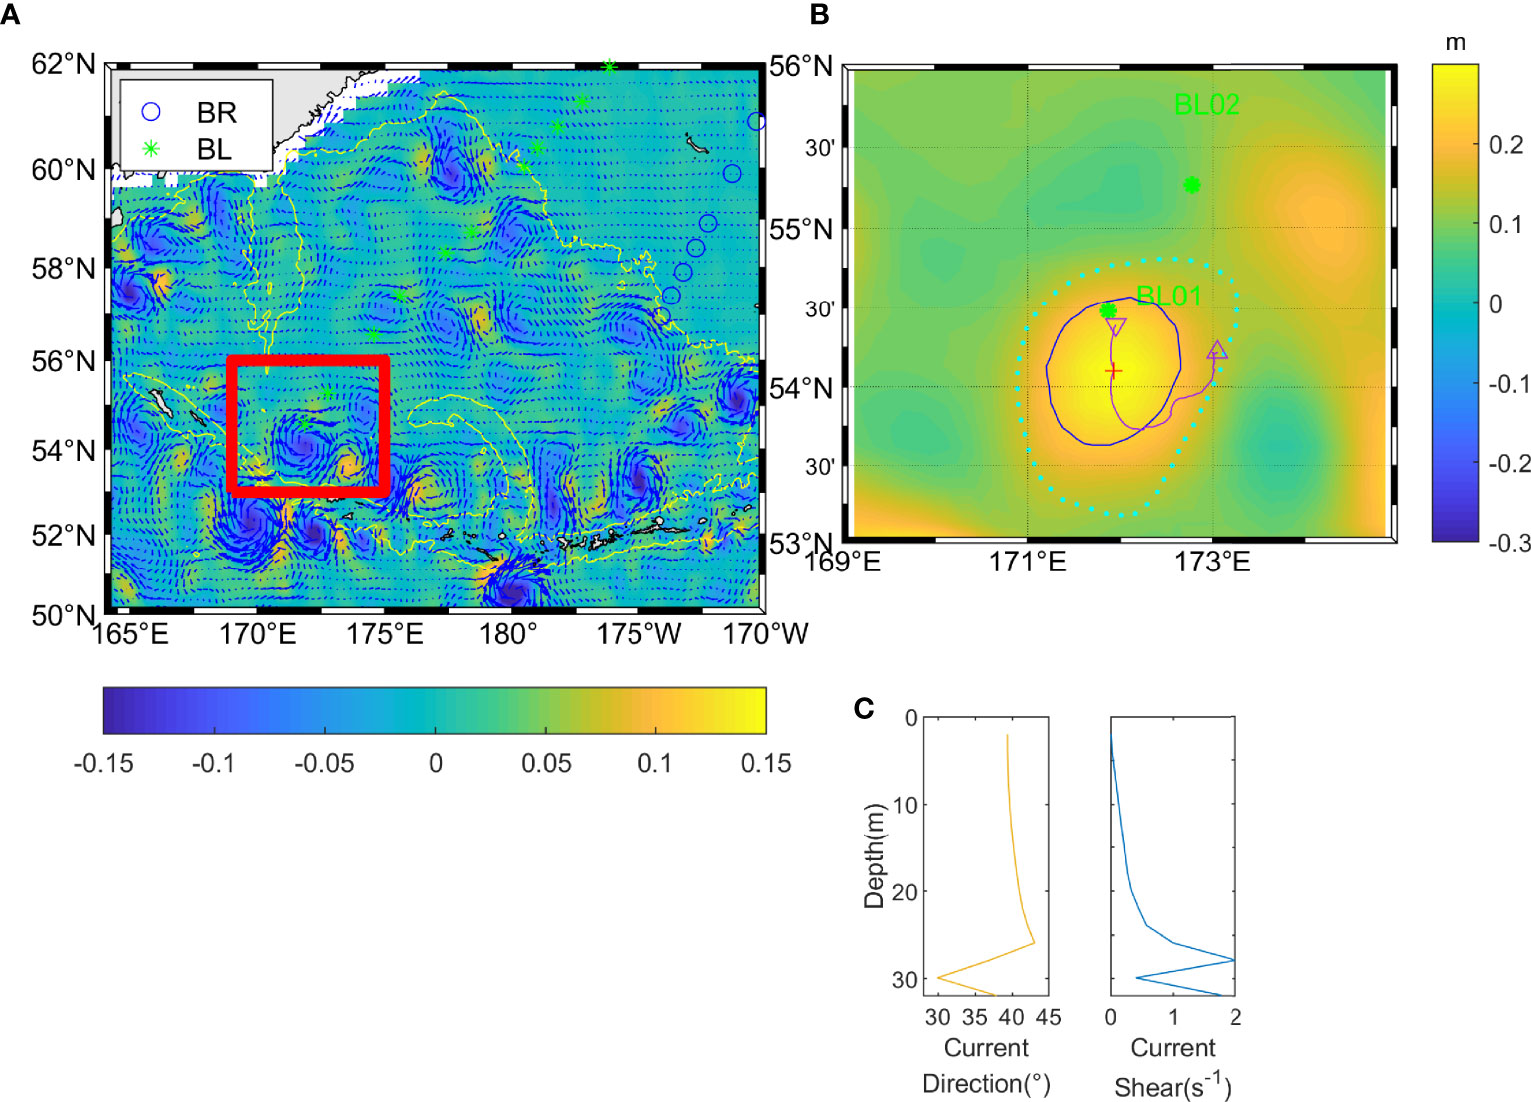
Figure 6 (A) The vectors represent the surface geostrophic flow anomaly. The color denotes the vertical relative vorticity (normalized by the local planetary vorticity f) at the sea surface. The yellow solid lines denote the 2000-m isobaths. The red rectangle is the location of subplot (B). (B) The anticyclonic eddy next to station BL01 [the red rectangle in subplot (A)]. The contours denote the sea surface height from satellite observations. The red plus sign, blue solid line, cyan dotted line, and purple solid line are the center, max speed shape, effective contour shape, and track of the eddy. The upward-pointing triangle and downward-pointing triangle are the center of the eddy on June 1 and September 30, respectively. (C) The vertical distribution of the current direction and vertical current shear at BL01 from ADCP.
The relationship between MLD and buoyancy flux as well as momentum flux was explored through correlation and linear regression analysis. The momentum flux and average buoyancy flux caused by sea surface net heat flux and freshwater flux from July 1 to September 8 are shown in Figure 7. The MLD had a positive correlation with the momentum flux, and the correlation coefficient was 0.60 at 99% significant test level. The kinetic energy input into the ocean due to the large wind speed enhanced the sea surface turbulent mixing. Although this pattern can be found at most stations, it was not always valid, e.g., the larger MLD at BS01, BS02, and BS03 was related to the vertical homogeneous Anadyr Water there (as indicated in Figure S4C in Supplementary Material VII). Anadyr Water was cold and vertically homogeneous. As mentioned in Section 4.1, the deepening of the ML at station BL01 resulted from the anticyclonic eddy. The correlation coefficient between MLD and buoyancy flux was −0.30 at 98% significant test level.
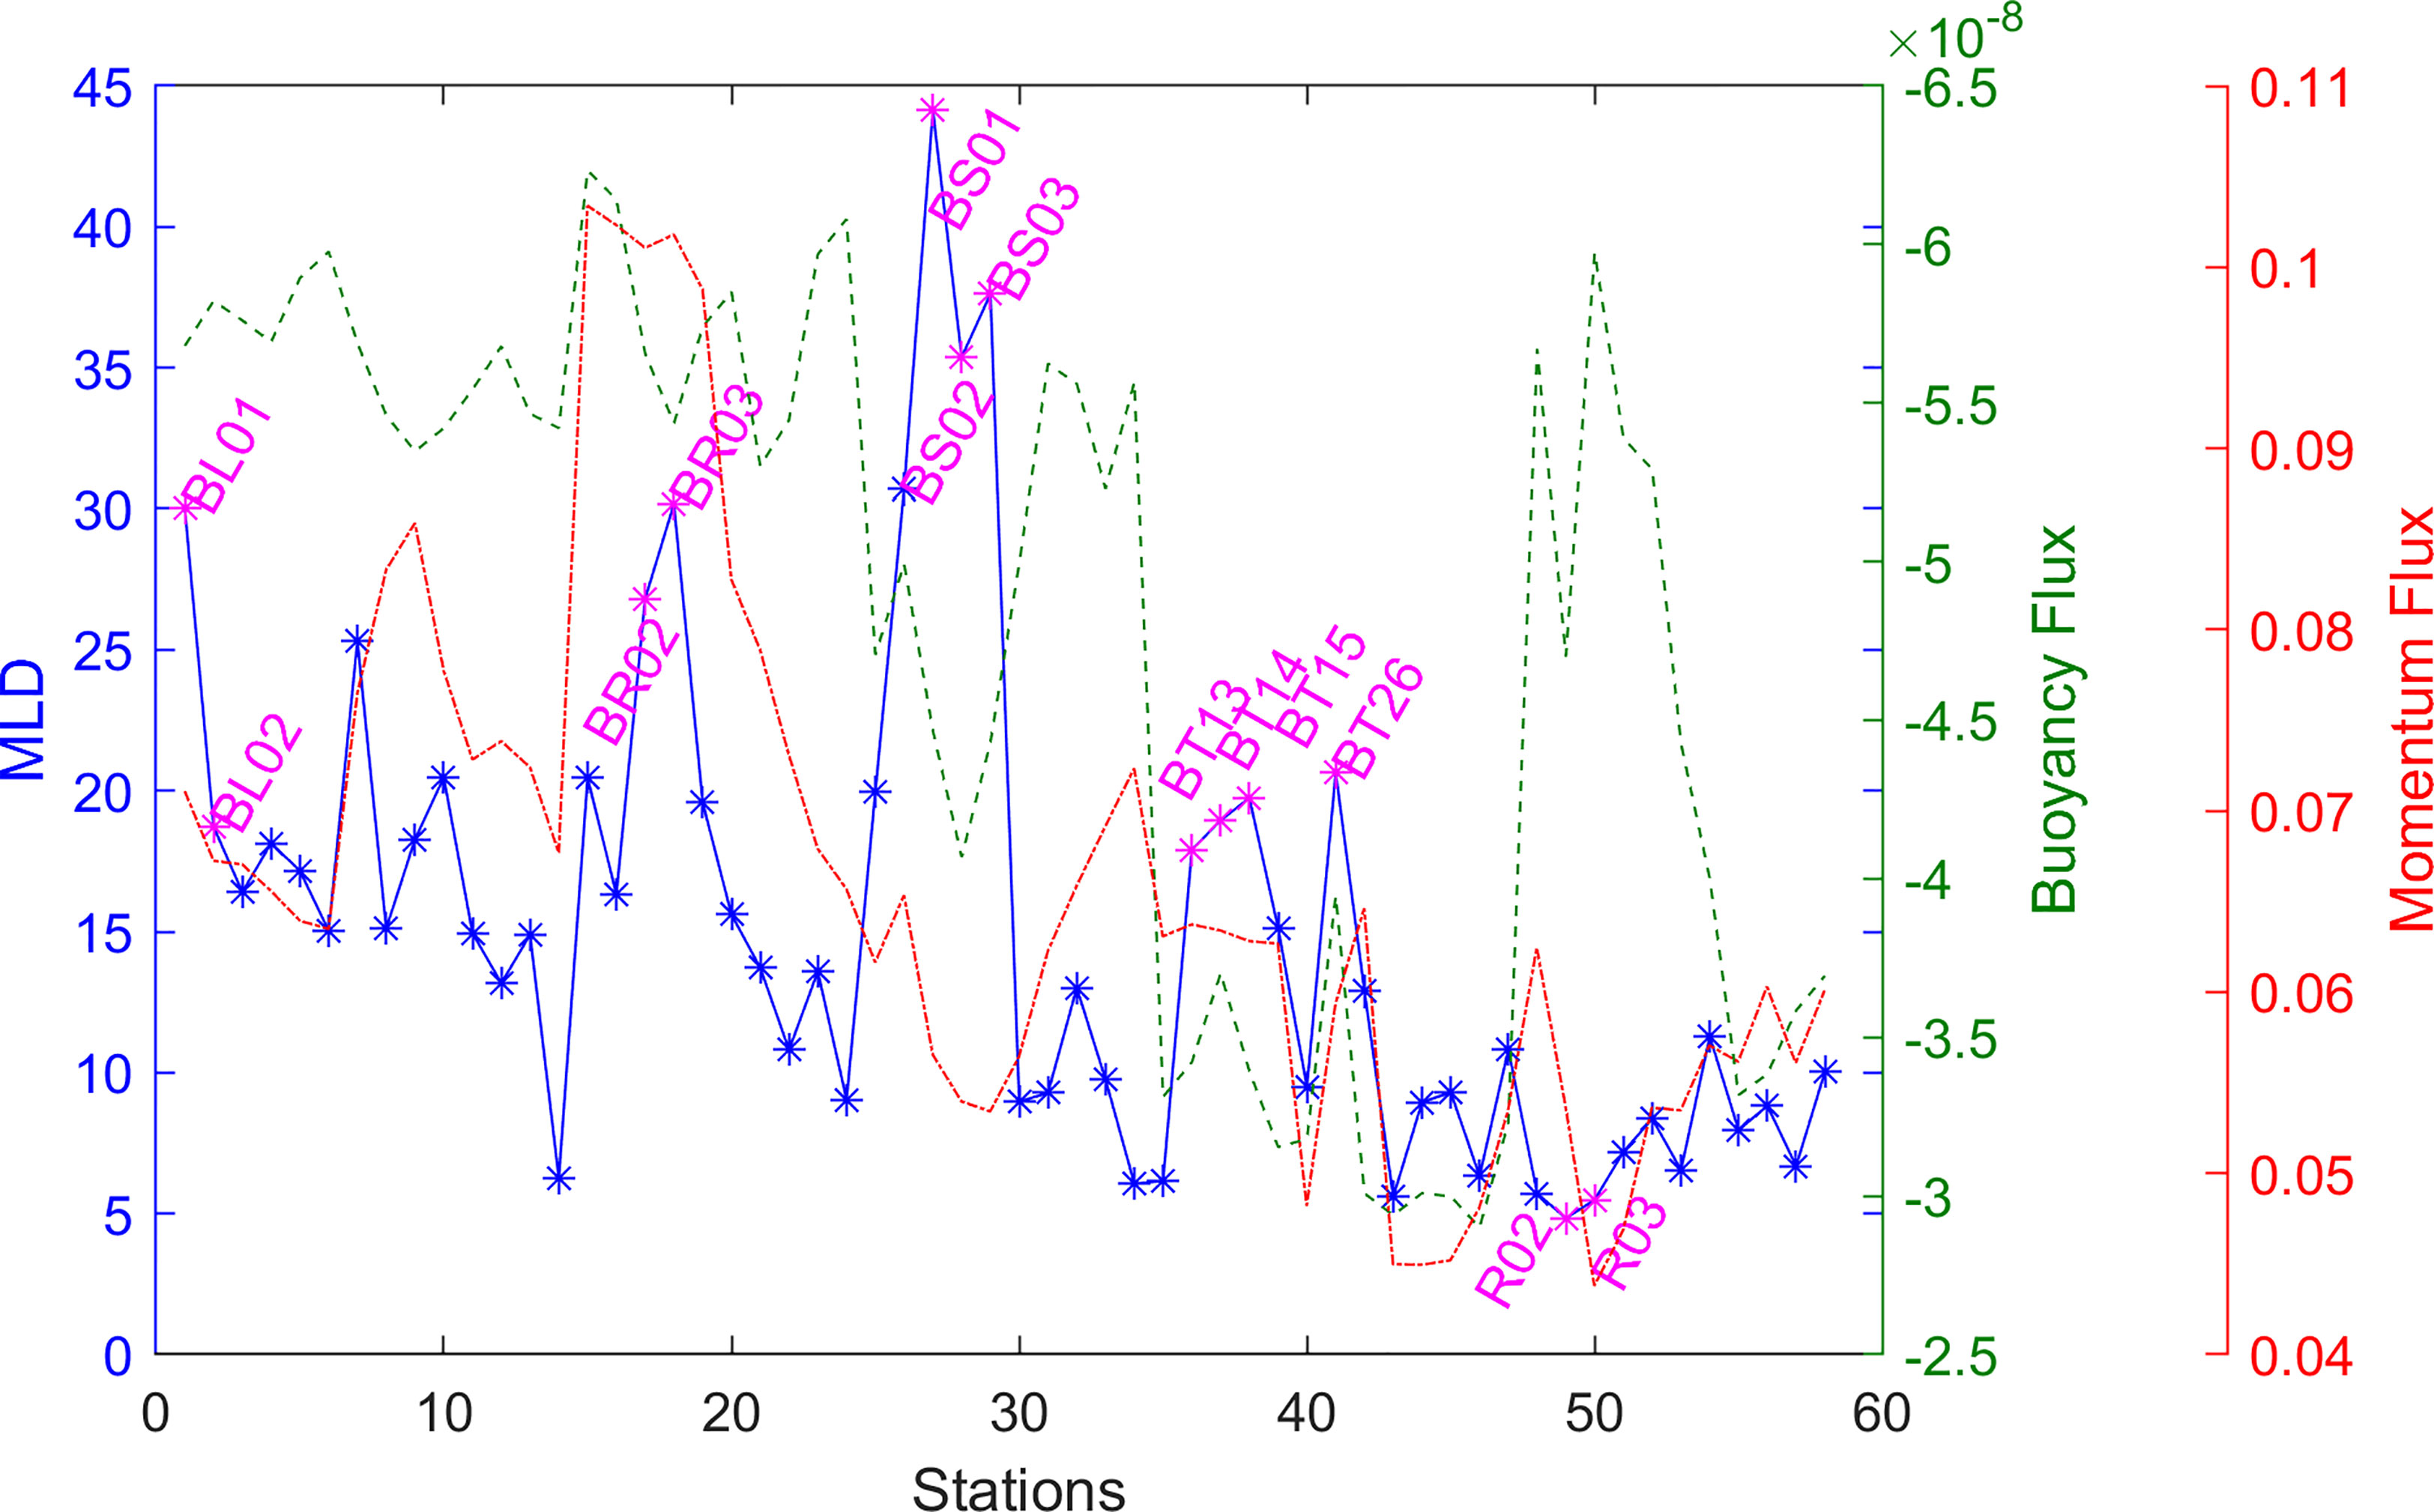
Figure 7 The buoyancy flux, momentum flux, and MLD of all stations. The buoyancy flux and momentum were averaged from July 1 to September 8. The order of stations is the same as in Table S1 in the Supplementary Material II.
The MLDs at BR02 and BR03 (in the central Bering Sea) were significantly large under the combined effect of the buoyancy flux and the momentum flux. Though not as significant as BR02 and BR03, the MLDs at BT13, BT14, BT15, and BT26 were still larger than other stations nearby in the Chukchi Sea. As momentum flux played a more important role than buoyancy flux, the small momentum flux led to small MLD, such as R02 and R03 (southern Chukchi Sea). This convinced the modeling work by Hordoir et al. (2022) that wind led to the spatial variation of MLD in ice-free conditions in the Arctic.
However, multiple linear regression showed that the combined effect of momentum flux and buoyancy flux only explained 12% of the variance of MLD, and 11% of the variance of MLD was attributed to momentum flux (p = 0.01). So, there were more important factors to be explored, such as stratification to be discussed in the next section.
Controlling effects of stratification on MLD were estimated through the approach proposed by Peralta-Ferriz and Woodgate (2015) in the study on pan-Arctic surface mixed layer properties. In their study, to investigate reasonable relationships between MLD and stratification, an empirical expression was proposed as follows:
with the exponents α β, and constant C (in S.I. units) to be estimated from multiple regression of observational data. W was wind magnitude (m/s). Δρ (kg/m3) was the stratification for each cast and it was quantified as the difference between the average density of a 20-m-thick layer below the ML and the average ML density.
Based on observational data in 2019, the detailed fit results are shown in Table 2. Besides the combined effect of wind and stratification, the wind-only and stratification-only exercises were also conducted by assuming β or α to be zero.

Table 2 The multiple regression results for equation (3) based on observational data in 2019.
In both combined and wind-only exercises, α was ~0.5. In both combined and stratification-only exercise, β was ~0.5, larger than the results from Pollard et al. (1973) (β ~0.25) and Manucharyan (2010) (β ~ 0.33). This suggested that MLD in this region was more dependent on stratification. The estimated value of α and β here were similar to those estimated by Peralta-Ferriz and Woodgate (2015) in the pan-Arctic. This indicated the relationship between MLD and stratification in the Bering Sea and Chukchi Sea had similar patterns with that in the pan-Arctic. The combined effect of wind and stratification explained 57% of the variance of MLD, much larger than the combined effect of momentum flux and buoyancy flux in Section 4.2. This was smaller than the mean value (67%) from the pan-Arctic sample in the study of Peralta-Ferriz and Woodgate (2015). This indicated that there were other factors needed to be considered in this marginal sea. The stratification explained 40% of the variance of MLD, much larger than wind (14%), and this suggested that in order to understand the variation of MLD in this region, it was necessary to focus on investigating processes affecting upper ocean stratification, i.e., sea ice melt water in the next section.
The less sea ice volume resulted in less melt water in summer (Figure 8), which led to the saltier and shallower ML in 2019 than previous years. As the mean wind speed did not change significantly in 2019 compared to previous years (Figure S9 in Supplementary Material VIII), it was not related to the shallower of the ML. It should be noted that the salinity of the water in BSs was larger than the climatology (Figure 5C), while it was not in CSs (Figure 5G). This may be linked to the inflow of freshwater due to the increasing net glacial ablation in the Gulf of Alaska watershed (Danielson et al., 2020). The surface warming in the Chukchi Sea was related to the regional air-sea heat flux and Arctic amplification (Danielson et al., 2020). Recent trends to earlier ice melt and increasing heat flux through the Bering Strait have also impacted the Chukchi Sea (Woodgate, 2018). The warming of CIL may be related to the air temperature warming in the previous winter and the processes in the Bering Sea (Overland et al., 2012).
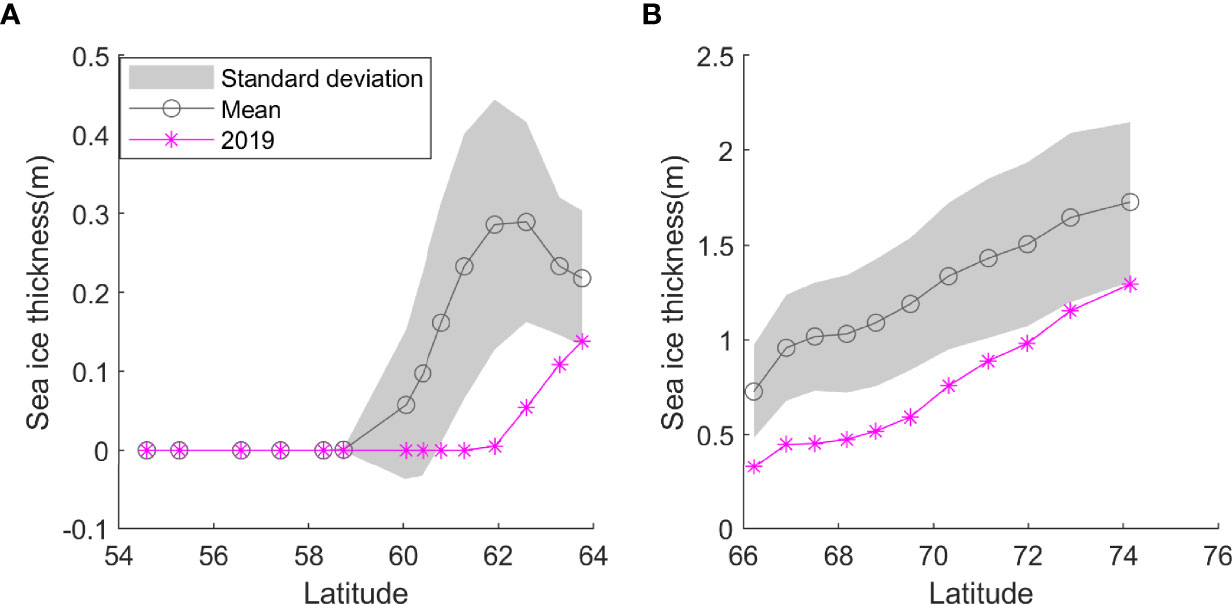
Figure 8 The monthly mean sea ice thickness from January to August. (A) BL section. (B) R section.
The MLD in BSb was deeper than that in BSs, but both were shallower than that in BSp. In CSs, the MLD deepened from south to north. Water masses, eddies, sea ice melting, wind, and air-sea heat flux influenced the spatial variation of MLD in the Bering Sea and Chukchi Sea. The MLD in the northwestern BSs was large due to the existence of AW. The horizontal advection of ACW and AW led to a shallow ML in the northern BSs. The shallow MLD at station R06 was related to the westward extending of ACW in the Chukchi Sea. The spread of the water mass from sea ice melting and terrain constraints led to the northward increase of the MLD in CSs and CSp.
The correlation coefficient between the momentum flux and the MLD was 0.60, larger than that between the buoyancy flux and the MLD, which was −0.30. The combined effect of the momentum and buoyancy flux led to local extrema, such as BR03 in the Bering Sea, and BT26 and R03 in the Chukchi Sea. However, they only explained 12% of the variance of MLD. Compared to the momentum flux and buoyancy flux, the stratification was more important in determining MLD, and it explained 40% of the variance of MLD.
The ML in 2019 was shallower and warmer than those in previous years in the BSb, BSs, and CSs. This shallower and warmer ML was linked to the increase in heat flux and decrease in freshwater flux from sea ice melting under the background of Arctic amplification and increasing net glacial ablation.
Due to the temporal limitation of in situ observation, the data provided a glimpse of the statement of the oceans in summer. Sub-mesoscale and small-scale processes, which may influence MLD, were hardly recognized even with satellite observations. High-resolution and continuous in situ observations will be beneficial to exploring their effects on MLD in the future.
The CTD data are available through Harvard Dataverse (Jiao, 2020) at https://doi.org/10.7910/DVN/H07MTR. The Chinese National Arctic Research Expeditions datasets can be obtained at https://www.chinare.org.cn/data. Version 2 CCMP Wind Vector Analysis Product produced by Remote Sensing Systems is available online at http://www.remss.com/measurements/ccmp/. The Bering Sea level obtained from the COPERNICUS MARINE SERVICE was available online at https://resources.marine.copernicus.eu/?option=com_csw&view=details&product_id=SEALEVEL_GLO_PHY_L4_NRT_OBSERVATIONS_008_046. The sea surface heat flux and water flux obtained from the National Centers for Environmental Prediction (NCEP) Climate Forecast System Version 2 (CFSv2) are available online at https://rda.ucar.edu/datasets/ds094.0/. The significant wave height obtained from the COPERNICUS MARINE SERVICE is available online at https://resources.marine.copernicus.eu/?option=com_csw&view=details&product_id=WAVE_GLO_WAV_L4_SWH_NRT_OBSERVATIONS_014_003. The bathymetric dataset from ETOPO1 (NOAA National Geophysical Data Center, 2009) is available online at https://www.ngdc.noaa.gov/mgg/global/global.html. The sea ice volume and thickness was the output of PIOMAS model from Polar Science Center (available online at http://psc.apl.uw.edu/research/projects/arctic-sea-ice-volume-anomaly/data/model_grid).
XJ performed the in situ observations, analyzed the data, and prepared the manuscript. JZ and QL gave expert guidance on research orientation. CL provided suggestions to improve the analysis and polish the language. All authors contributed to the article and approved the submitted version.
This work was supported by the National Key Research and Development Plan of China [grant numbers 2019YFE0105700 and 2017YFA0604100], and the National Natural Science Foundation of China [grant numbers 41876086 and 42176244].
The authors declare that the research was conducted in the absence of any commercial or financial relationships that could be construed as a potential conflict of interest.
All claims expressed in this article are solely those of the authors and do not necessarily represent those of their affiliated organizations, or those of the publisher, the editors and the reviewers. Any product that may be evaluated in this article, or claim that may be made by its manufacturer, is not guaranteed or endorsed by the publisher.
We are extremely grateful to the chief scientist Professor Wei Zexun for his guidance and support. We are very grateful to Liu Na, Chen Hongxia, and He Yan from the First Institute of Oceanography for their help.
The Supplementary Material for this article can be found online at: https://www.frontiersin.org/articles/10.3389/fmars.2022.862857/full#supplementary-material
Boyer T. P., Garcia H. E., Locarnini R. A., Zweng M. M., Mishonov A. V., Reagan J. R., et al. (2018) World Ocean Atlas 2018. [Temperature and Salinity] (NOAA National Centers for Environmental Information). Available at: https://accession.nodc.noaa.gov/NCEI-WOA18 (Accessed [2021]).
Corlett W. B., Pickart R. S. (2017). The Chukchi Slope Current. Prog. Oceanog. 153, 50–65. doi: 10.1016/j.pocean.2017.04.005
D’Asaro E. A. (2014). Turbulence in the Upper-Ocean Mixed Layer. Annu. Rev. Mar. Sci. 6 (1), 101–115. doi: 10.1146/annurev-marine-010213-135138
Danielson S. L., Ahkinga O., Ashjian C., Basyuk E., Cooper L. W., Eisner L., et al. (2020). Manifestation and Consequences of Warming and Altered Heat Fluxes Over the Bering and Chukchi Sea Continental Shelves. Deep-Sea. Res. II. 177, 104781. doi: 10.1016/j.dsr2.2020.104781
Danielson S. L., Weingartner T. J., Hedstrom K. S., Aagaard K., Woodgate R., Curchitser E., et al. (2014). Coupled Wind-Forced Controls of the Bering–Chukchi Shelf Circulation and the Bering Strait Throughflow: Ekman Transport, Continental Shelf Waves, and Variations of the Pacific–Arctic Sea Surface Height Gradient. Prog. Oceanog. 125, 40–61. doi: 10.1016/j.pocean.2014.04.006
de Boyer Montégut C., Madec G., Fischer A. S., Lazar A., Iudicone D. (2004). Mixed Layer Depth Over the Global Ocean: An Examination of Profile Data and a Profile-Based Climatology. J. Geophys. Res.: Ocean. 109, C12003. doi: 10.1029/2004JC002378
Dong C., Mavor T., Nencioli F., Jiang S., Uchiyama Y., McWilliams J., et al. (2009). An Ocean Cyclonic Eddy on Lee Side of Lanai Island, Hawaii. J. Geophys. Res. Ocean. 114, C10008. doi: 10.1029/2009JC005346
Gaube P., McGillicuddy D. Jr., Moulin A. J. (2019). Mesoscale Eddies Modulate Mixed Layer Depth Globally. Geophys. Res. Lett. 46 (3), 1505–1512. doi: 10.1029/2018GL080006
Gong D., Pickart R. S. (2015). Summertime circulation in the eastern Chukchi Sea. Deep Sea Res. 2 Top. Stud. Oceanogr. 118, 18–31. doi: 10.1016/j.dsr2.2015.02.006
Holte J., Talley L. (2009). A New Algorithm for Finding Mixed Layer Depths With Applications to Argo Data and Subantarctic Mode Water Formation. J. Atmos. Ocean. Technol. 26 (9), 1920–1939. doi: 10.1175/2009JTECHO543.1
Holte J., Talley L. D., Gilson J., Roemmich D. (2017). An Argo Mixed Layer Climatology and Database. Geophys. Res. Lett. 44 (11), 5618–5626. doi: 10.1002/2017GL073426
Hordoir R., Skagseth Ø., Ingvaldsen R. B., Sandø A. B., Löptien U., Dietze H., et al. (2022). Changes in Arctic Stratification and Mixed Layer Depth Cycle: A Modeling Analysis. J. Geophys. Res. Oceans 127 (1), e2021J–e17270J. doi: 10.1029/2021JC017270
Hu H., Wang J. (2010). Modeling Effects of Tidal and Wave Mixing on Circulation and Thermohaline Structures in the Bering Sea: Process Studies. J. Geophys. Res.: Ocean. 115 (C1), C01006 doi: 10.1029/2008JC005175
Jiao X. H. (2020). Replication Data for Observational Study on the Variability of Mixed Layer Depth in the Bering Sea and the Chukchi Sea in the Summer of 2019, V1. Harvard. Dataverse. doi: 10.7910/DVN/H07MTR
Ji M., Liu G. C., He Y. W., Li Y., Li T. (2021). Analysis of Sea Ice Timing and Navigability Along the Arctic Northeast Passage From 2000 to 2019. J. Mar. Sci. Eng. 9 (7), 728. doi: 10.3390/jmse9070728
Johnson G. C., Schmidtko S., Lyman J. M. (2012). Relative Contributions of Temperature and Salinity to Seasonal Mixed Layer Density Changes and Horizontal Density Gradients. J. Geophys. Res.: Ocean. 117, C04015. doi: 10.1029/2011JC007651
Johnson G. C., Stabeno P. J. (2017). Deep Bering Sea Circulation and Variabilit–2016, From Argo Data. J. Geophys. Res.: Ocean. 122, 9765– 9779. doi: 10.1002/2017JC013425
Kara A. B., Rochford P. A., Hurlburt H. E. (2000). An Optimal Definition for Ocean Mixed Layer Depth. J. Geophys. Res. 105, 16803–16821. doi: 10.1029/2000JC900072
Kara A. B., Rochford P. A., Hurlburt H. E. (2003). Mixed Layer Depth Variability Over the Global Ocean. J. Geophys. Res. 108, 3079. doi: 10.1029/2000JC000736
Ladd C., Stabeno P. J. (2012). Stratification on the Eastern Bering Sea Shelf Revisited. Deep. Sea. Res. Part II 65–70, 72-83. doi: 10.1016/j.dsr2.2012.02.009
Linders J., Pickart R. S., Björk G., Moore G. (2017). On the Nature and Origin of Water Masses in Herald Canyon, Chukchi Sea: Synoptic Surveys in Summer 2004, 2008, and 2009. Prog. Oceanog. 159, 99–114. doi: 10.1016/j.pocean.2017.09.005
Lorbacher K., Dommenget D., Niiler P. P., Köhl A. (2006). Ocean Mixed Layer Depth: A Subsurface Proxy of Ocean-Atmosphere Variability. J. Geophys. Res.: Ocean. 111, C07010. doi: 10.1029/2003JC002157
Lukas R., Lindstrom E. (1991). The mixed layer of the western equatorial Pacific Ocean. J. Geophys. Res. Oceans 96 (S01), 3343–3357. doi: 10.1029/90JC01951
Manucharyan G. E. (2010). “Dynamics of the Mixed Layers in Stratified Shear Flows,” in Paper presented at WHOI GFD Summer School, Ann. Proc.
Mizobata K., Shimada K. (2012). East-West Asymmetry in Surface Mixed Layer and Ocean Heat Content in the Pacific Sector of the Arctic Ocean Derived From AMSR-E Sea Surface Temperature. Deep-Sea. Res. II. 77, 62–69. doi: 10.1016/j.dsr2.2012.04.005
Mizobata K., Wang J., Saitoh S. (2006). Eddy-Induced Cross-Slope Exchange Maintaining Summer High Productivity of the Bering Sea Shelf Break. J. Geophys. Res.: Ocean. 111, C10017. doi: 10.1029/2005JC003335
Nencioli F., Dong C., Dickey T., Washburn L., Mcwilliams J. C. (2010). A Vector Geometry-Based Eddy Detection Algorithm and its Application to a High-Resolution Numerical Model Product and High-Frequency California Bight. J. Atmos. Ocean. Technol. 27 (3), 564–579. doi: 10.1175/2009JTECHO725.1
NOAA National Geophysical Data Center (2009). ETOPO1 1 Arc-Minute Global Relief Model. NOAA National Centers for Environmental Information Accessed 2020.12.01. doi: 10.7289/V5C8276M
Overland J. E., Wang M., Wood K. R., Percival D. B., Bond N. A. (2012). Recent Bering Sea Warm and Cold Events in a 95-Year Context. Deep. Sea. Res. Part II: Top. Stud. Oceanog. 65, 6–13. doi: 10.1016/j.dsr2.2012.02.013
Peralta-Ferriz C., Woodgate R. A. (2015). Seasonal and Interannual Variability of Pan-Arctic Surface Mixed Layer Properties From 1979 to 2012 From Hydrographic Data, and the Dominance of Stratification for Multiyear Mixed Layer Depth Shoaling. Prog. Oceanog. 134, 19–53. doi: 10.1016/j.pocean.2014.12.005
Pisareva M. N. (2018). An Overview of the Recent Research on the Chukchi Sea Water Masses and Their Circulation. Russ. J. Earth. Sci. 18, ES4005. doi: 10.2205/2018ES000631
Pisareva M. N., Pickart R. S., Spall M. A., Nobre C., Torres D. J., Moore G. W. K., et al. (2015). Flow of Pacific Water in the Western Chukchi Sea: Results From the 2009 RUSALCA Expedition. Deep-Sea. Res. I 105, 53–73. doi: 10.1016/j.dsr.2015.08.011
Pollard R. T., Rhines P. B., Thompson R. O. R. Y. (1973). The Deepening of the Wind Mixed Layer. Geophys. Fluid. Dynamic. 4 (1), 381–404. doi: 10.1080/03091927208236105
Rosenblum E. (2018). Arctic Sea Ice Retreat and Mixed-Layer Processes. UC San Diego. ProQuest ID: Rosenblum_Ucsd_0033D_17832. Merr. ID. https://escholarship.org/uc/item/6mq5q2zp.
Saha S., Moorthi S., Wu X., Wang J., Nadiga S., Tripp P., et al. (2011). Updated Daily, NCEP Climate Forecast System Version 2 (CFSv2) 6-Hourly Products. doi: 10.5065/D61C1TXF
Schlegel R. W, Oliver E. C., Chen K. (2021). Drivers of Marine Heatwaves in the Northwest Atlantic: The Role of Air Sea Interaction During Onset and Decline. Front. Mar. Sci. 8, 627970. doi: 10.3389/fmars.2021.627970
Schmidtko S., Johnson G. C., Lyman J. M. (2013). MIMOC: A Global Monthly Isopycnal Upper-Ocean Climatology With Mixed Layers. J. Geophys. Res.: Ocean. 118 (4), 1658–1672. doi: 10.1002/jgrc.20122
Sirevaag A., de la Rosa S., Fer I., Nicolaus M., Tjernström M., McPhee M. G. (2011). AndMixing, Heat Fluxes and Heat Content Evolution of the Arctic Ocean Mixed Layer. Ocean. Sci. 7, 335–349. doi: 10.5194/os-7-335-2011
Stabeno P., Kachel N., Ladd C., Woodgate R. (2018). Flow Patterns in the Eastern Chukchi Sea: 2010-2015. J. Geophys. Res-Ocean. 123 (2), 1177–1195. doi: 10.1002/2017JC013135
Thomson R. E., Fine I. V. (2003). Estimating Mixed Layer Depth From Oceanic Profile Data. J. Atmos. Ocean. Technol. 20 (2), 319–329. doi: 10.1175/1520-0426(2003)020<0319:EMLDFO>2.0.CO;2
Timmermans M. L., Proshutinsky A., Golubeva E., Jackson J. M., Krishfield R., McCall M., et al. (2014). Mechanisms of Pacific Summer Water Variability in the Arctic's Central Canada Basin. J. Geophys. Res.: Ocean. 119 (11), 7523–7548. doi: 10.1002/2014JC010273
Wang Y., Zhang H.-R., Chai F., Yuan Y. (2018). Impact of Mesoscale Eddies on Chlorophyll Variability Off the Coast of Chile. PloS One 13 (9), e0203598. doi: 10.1371/journal.pone.0203598
Wentz F. J., Scott J., Hoffman R., Leidner M., Atlas R., Ardizzone J., et al. (2015)Remote Sensing Systems Cross-Calibrated Multi-Platform (CCMP) 6-Hourly Ocean Vector Wind Analysis Product on 0.25 Deg Grid, Version 2.0. Available at: www.remss.com/measurements/ccmp.
Woodgate R. A. (2018). Increases in the Pacific Inflow to the Arctic From 1990 to 2015, and Insights Into Seasonal Trends and Driving Mechanisms From Year-Round Bering Strait Mooring Data. Prog. Oceanog. 160, 124–154. doi: 10.1016/j.pocean.2017.12.007
Woodgate R. A., Peralta-Ferriz C. (2021). Warming and Freshening of the Pacific Inflow to the Arctic From 1990-2019 Implying Dramatic Shoaling in Pacific Winter Water Ventilation of the Arctic Water Column. Geophys. Res. Lett. 48, e2021GL092528. doi: 10.1029/2021GL092528
Keywords: mixed layer depth, in situ observation, Bering Sea, Chukchi Sea, momentum flux, eddy, stratification
Citation: Jiao X, Zhang J, Li Q and Li C (2022) Observational Study on the Variability of Mixed Layer Depth in the Bering Sea and the Chukchi Sea in the Summer of 2019. Front. Mar. Sci. 9:862857. doi: 10.3389/fmars.2022.862857
Received: 26 January 2022; Accepted: 21 March 2022;
Published: 28 April 2022.
Edited by:
Sabrina Speich, École Normale Supérieure, FranceReviewed by:
Fajin Chen, Guangdong Ocean University, ChinaCopyright © 2022 Jiao, Zhang, Li and Li. This is an open-access article distributed under the terms of the Creative Commons Attribution License (CC BY). The use, distribution or reproduction in other forums is permitted, provided the original author(s) and the copyright owner(s) are credited and that the original publication in this journal is cited, in accordance with accepted academic practice. No use, distribution or reproduction is permitted which does not comply with these terms.
*Correspondence: Jicai Zhang, amljYWlfemhhbmdAMTYzLmNvbQ==; Qun Li, bGlxdW5AcHJpYy5vcmcuY24=
Disclaimer: All claims expressed in this article are solely those of the authors and do not necessarily represent those of their affiliated organizations, or those of the publisher, the editors and the reviewers. Any product that may be evaluated in this article or claim that may be made by its manufacturer is not guaranteed or endorsed by the publisher.
Research integrity at Frontiers
Learn more about the work of our research integrity team to safeguard the quality of each article we publish.