 Miao Yu
 Peng Lu
 Bin Cheng
 Matti Leppäranta3
 Zhijun Li
- 1State Key Laboratory of Coastal and Offshore Engineering, Dalian University of Technology, Dalian, China
- 2Finnish Meteorological Institute, Helsinki, Finland
- 3Institute of Atmosphere and Earth Sciences, University of Helsinki, Helsinki, Finland
The recent rapid changes in Arctic sea ice have occurred not only in ice thickness and extent, but also in the microstructure of ice. To understand the role of microstructure on partitioning of incident solar shortwave radiation within the ice and upper ocean, this study investigated the sensitivity of the optical properties of summer sea ice on ice microstructures such as the volume fraction, size, and vertical distribution of gas bubbles, brine pockets, and particulate matter (PM). The results show that gas bubbles are the predominant scatterers within sea ice. Their effects on the scattering coefficient and ice albedo are 5 and 20 times stronger respectively than the effect of brine pockets. Albedo and transmittance of ice decrease with higher concentration and larger size of PM particles. A 4-cm top layer of ice with high PM concentration (50 g/m3) results in a 10% increase in radiation absorption. The role of ice microstructure in the partitioning of radiation transfer is more important for seasonal than for multiyear ice, and more important for ponded than for snow-covered ice. Varying ice microstructure can obviously alter solar radiation transfer in the ice-ocean system, even with a constant ice thickness. Our results suggest that numerical models should take the variable microstructure of sea ice into account to improve model accuracy and to understand the interaction between internal variations in Arctic sea ice and the ocean, especially in summer.
1 Introduction
Sea ice plays an important role in the atmosphere–ocean system of polar regions, where heat and mass balances are influenced by the partitioning of solar radiation in sea ice (Hudson et al., 2013; Mayer et al., 2016). Absorbed, reflected, and transmitted radiation by sea ice have received increasing attention with rapid change in the Arctic Ocean. The absorbed solar energy within sea ice result in variations in ice extent and thickness, which in turn affects energy transfer on regional scales (Perovich et al., 2007; Pistone et al., 2014). The changing reflected radiation is a major factor in seasonal ice retreat due to the contrast between the albedo of ice and water, known as the albedo feedback (Kashiwase et al., 2017). The transmittance of radiation affects ocean temperature and biological processes beneath the ice, which affect ice bottom melting and primary production (Palmer et al., 2013; Timmermans, 2015; Castellani et al., 2020; Hobbs et al., 2021).
Based on extensive field measurements, the partition of solar radiation through sea ice has been linked with changes in ice thickness, type, and surface condition to improve the parameterizations of apparent optical properties (AOPs, i.e. albedo, transmittance, and absorptivity) of ice (Perovich, 2002; Katlein et al., 2019). These empirical relationships were traditionally used in albedo estimations in climate models (Briegleb et al., 2004). Such results were also used in large-scale estimations for temporal and spatial variations of under-ice light (Nicolaus et al., 2012; Arndt and Nicolaus, 2014). Furthermore, exponential attenuation of light with depth is another widely used method for simulating the under-ice light field (Perovich et al., 2020; Stroeve et al., 2021; Castellani et al., 2022). Although these parameterizations can provide a reasonable mean climate state, they may differ considerably in response to a forcing perturbation (Curry et al., 2001). Therefore, radiation transfer models based on inherent optical properties are becoming a more physically based method to simulate the evolution of ice AOPs because of their explicit representation of scattering and absorption by ice (Holland et al., 2012).
However, changes are also occurring within the ice interior under the scenario of enhanced Arctic warming (Hunke et al., 2011). For example, the bulk density of Arctic sea ice was lower in the past decade than was reported in the 1990s, due to the increasing porosity of ice (Wang et al., 2020). This decrease occurred because pressure variation within sea-ice inclusions directly impacts the aqueous–gaseous equilibrium, which changes the volume of bubbles and brine pockets (Crabeck et al., 2019). Meanwhile, both gas bubble and brine pocket size change during melting (Light et al., 2003). Besides, particulate matter (PM), such as sediment and algae, is often entrained into Arctic sea ice, especially in summer (Dagsson-Waldhauserova et al., 2014). These microstructures of sea ice are the key factors that determine the inherent optical properties (IOPs, e.g., scattering coefficient, absorption coefficient, and asymmetry parameter) of ice (Grenfell, 1991; Perovich and Grenfell, 1981; Taskjelle et al., 2017). Such variations in microstructure resulted in IOPs that differerd from previous observations, further changing the energy absorbed in Arctic sea ice and that transmitted to the upper ocean (Grenfell et al., 2006; Light et al., 2015).
Several previous studies have investigated the linkage between ice microstructure and optical properties (Light et al., 2004; Frantz et al., 2019), but a comprehensive and quantitative understanding of how microstructures affect the IOPs and AOPs of sea ice is still missing, especially the role of different kinds of inclusion with distinct variations (Vancoppenolle et al., 2019; Wang et al., 2020). Furthermore, even in the latest models, sea-ice IOPs are set as constants based on previous field observations (Briegleb and Light, 2007; Perovich et al., 2020). With enhanced warming and PM deposition in the Arctic, the IOPs of sea ice based on earlier observations are no longer appropriate to study the energy balance of the current Arctic, especially in summer.
In light of these ideas, a model sensitivity study was conducted to quantitatively investigate how microstructures affect the optical properties of sea ice. This paper is organized as follows. The parameterization of IOPs and the radiative transfer model are introduced in Section 2. Section 3 describes the influence of microstructures on ice optical properties, and provides a discussion. Section 4 gives the implications of the sensitivity study for the Arctic Ocean. Finally, Section 5 draws conclusions.
2 Method
2.1 IOPs
The method proposed by Grenfell (1991) was used to parameterize sea-ice IOPs as functions of the wavelength, refractive index, size, and distribution of inclusions. Similar parameterizations have been widely used to link ice microstructure with optical properties and have been verified by extensive observations (Mullen and Warren, 1988; Taskjelle et al., 2017). This study followed the basic assumptions that pure ice can absorb light, whereas gas bubbles can only scatter light (Grenfell, 1991), and that brine pockets and PM can both scatter and absorb light. Furthermore, independent scattering was assumed for the individual scatterers. Therefore, the bulk scattering coefficient (σ), absorption coefficient (κ), and asymmetry parameter (g) of sea ice can be obtained by the sum of the coefficients of each component, as follows (Grenfell, 1991):
where subscripts i, b, a, and p represent pure ice, brine pockets, gas bubbles, and PM respectively, ki is the absorption coefficient of bubble-free ice, Vi is the volume fraction of pure ice, r is the radius of each inclusion, l is the length of each brine pocket, Qsca and Qabs are the scattering efficiency and absorption efficiency respectively, which can be calculated through the refractive indices and size of inclusions by Mie theory, and N is the size distribution function. This information can be found in Table S1. The bulk absorption coefficients (κB), which are described in the following sections, are derived by integrating κ weighted by the downwelling incident irradiance (F0), a method that is also adopted in the Los Alamos sea-ice model (CICE) (Briegleb and Light, 2007). The asymmetry coefficients were fixed as ga = 0.86 and gb = 0.99, which are independent of wavelength, because the bubbles and brine pockets are large enough (Light et al., 2004), and PM particles are treated as spheres so that gp can be obtained using Mie theory.
The effective radius of inclusions in a specific size range, which can be obtained according to Hansen and Travis (1974), was used when calculating Qabs and Qsca. Because brine pockets given by channels longer than 0.03 mm are cylindrical rather than spherical, a conversion function was used to represent spheres as hexagonal columns with the same optical properties (Grenfell and Warren, 1999).
2.2 AOPs
The Delta-Eddington multiple scattering model was used to estimate sea-ice AOPs. This model is also embedded in CICE and has been verified by extensive observations (Briegleb and Light, 2007). The spectral albedo (αλ) and transmittance (Tλ) are represented by the proportions of reflected and transmitted irradiance to incident irradiance, respectively, which can be directly estimated through the radiative transfer model. The spectral absorptivity (Aλ) can be expressed as:
where the subscript λ refers to wavelength. The broadband albedo (αB), transmittance (TB), and absorptivity (AB) were calculated by integrating the spectral values in the F0 band (λ1 to λ2). The symbols that are commonly used in the following sections are summarized in Table 1.
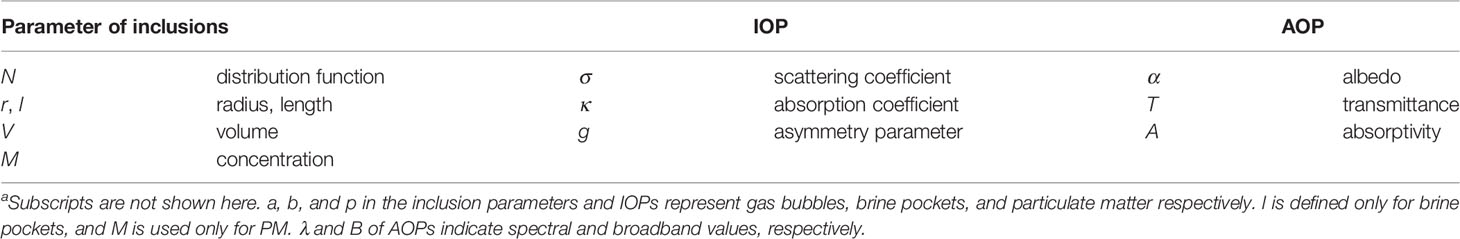
Table 1 Summary of symbols and variables used a.
2.3 Input Parameters
The wavelength band used in the present study extended from 350 nm to 1000 nm, which is consistent with most field observations and model simulations (Light et al., 1998; Ehn et al., 2008). Incident solar irradiance under an overcast sky in August as described by Grenfell and Perovich (2008) was chosen as the default (Figure 1). Hence, the simulated AOPs are based on diffuse incident irradiance, which can be assumed representative of summer conditions in the Arctic (Grenfell and Perovich, 2008).
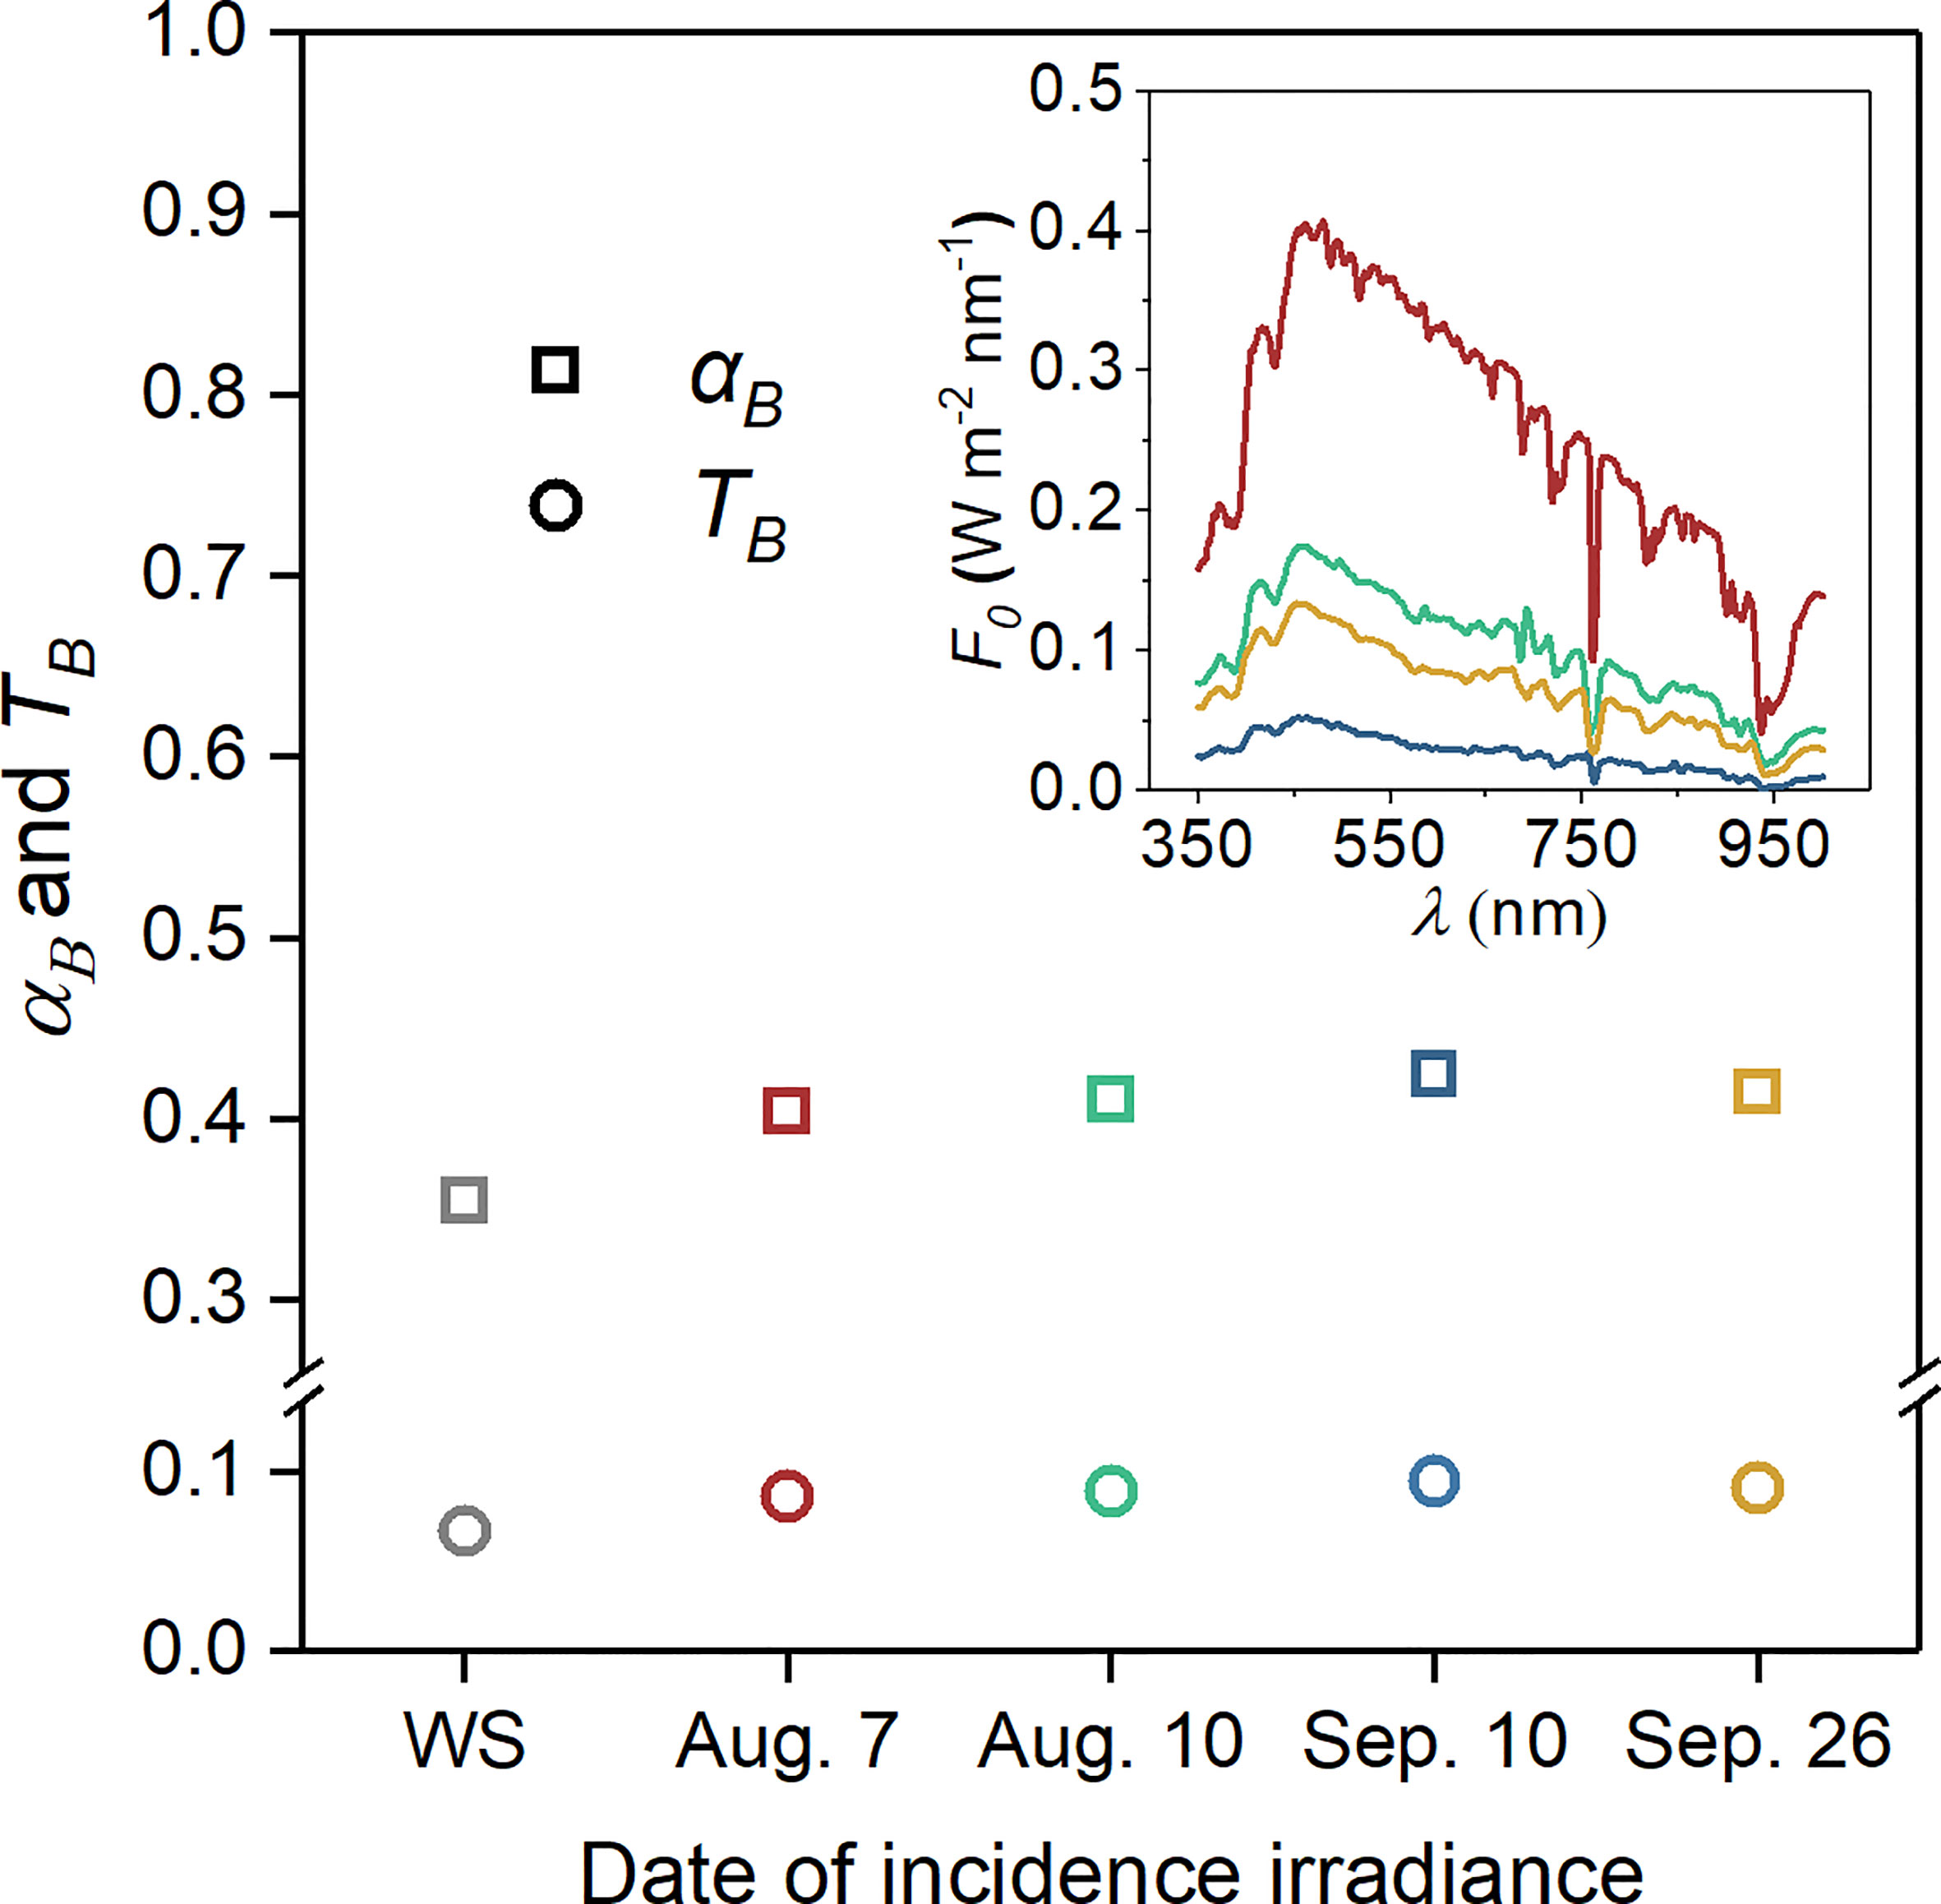
Figure 1 Broadband albedo αB and transmittance TB of ice with default parameters under different solar irradiances. The corresponding spectral irradiances are shown in the same color in the top right corner. Also shown in grey marks are the AOPs under a white spectrum (WS, F0 = constant over all wavelengths). Incident irradiance on Aug. 7 was the default value of F0.
According to field observations in late April at Hudson’s Bay (Ehn et al., 2008) the gas volume Va of melting blue ice varies between 0.5% and 13% with an average of 2.6%, and the brine volume Vb was found to vary between 4% and 30% with an average of 14%. In the following study, the default values of Va and Vb were assumed as 3% and 10%, respectively. The size of observed gas bubbles in growing young ice in fall varies between 0.1 and 2.0 mm (Grenfell, 1983). Frantz et al. (2019) carried out field measurements on the size of inclusions in landfast and drifting ice in July in the Arctic. Their measurements showed an average value of 3 mm (ranging from 1 to 5 mm) in July. The length of brine pockets lb in first-year Arctic ice was found to range from 0.01 to 8 mm at -15°C by Light et al. (2003). Combining the above results led to the assumption that the default ranges of ra and lb in summer ice were 0.5–2.0 mm and 0.5–10 mm, respectively. According to the field observations of Light et al. (1998) in August in the Arctic, the default PM parameters were set as concentration Mp = 5 g/m3 and radius rp = 10 μm.
3 Results and Discussion
3.1 Sensitivity Study
We quantitatively investigated how gas bubbles, brine pockets, and PM affect the IOPs and AOPs of sea ice through several sensitivity studies, which are described in this section. The ice is regarded as a uniform layer with constant IOPs and default thickness Hi = 1 m to highlight the influences of variations in microstructures on the AOPs. The effects of surface properties (snow or ponds) and different ice types on ice AOPs are presented in Section 4.2.
3.1.1 Influence of the Incident Irradiance F0
Variations in albedo αB and transmittance TB with incident irradiance F0 were first examined by setting the ice properties as the default values. Three radiation spectra in the summer Arctic measured by Grenfell and Perovich (2008) and a white spectrum (WS, F0 = constant over all wavelengths) were chosen as the input spectra for comparison. To avoid the influence of the solar zenith angle on the AOPs, all incident irradiances were measured under a completely overcast sky. Figure 1 shows that the estimated ice αB and TB were larger under the three measured solar irradiances than under WS due to the particular spectral distribution of sunlight. There were also small differences among the solar irradiances. The biggest difference compared with AOPs under the default irradiance (Aug. 7) appeared on Sep. 10: the default case gave αB = 0.40 and TB = 0.09, but on Sep. 10, αB = 0.42 and TB = 0.10. This occurred because what affects the AOPs is the spectral distribution of the incident irradiance, but not the intensity (Lu et al., 2018). The influence of irradiance on AOPs is ignored in the following study to highlight the influence of microstructures on the AOPs of ice.
3.1.2 Influence of Gas Bubbles
To examine the influence of gas bubbles on the AOPs of ice, the properties of the gas bubbles were first set to the default values except for the gas volume fraction (Va). When Va increased from 2% to 10%, the scattering coefficient σ changed from 40.1 m-1 to 130.5 m-1 due to the increasing boundary area of the gas bubbles (Figure 2A). In addition, the broadband absorption coefficient κB decreased from 1.22 m-1 to 1.12 m-1 due to the decreasing volume of absorbers, and the asymmetry parameter g changed from 0.92 to 0.88 because gas bubbles with small g made a stronger contribution to the ice scattering coefficient (see Equation 3).
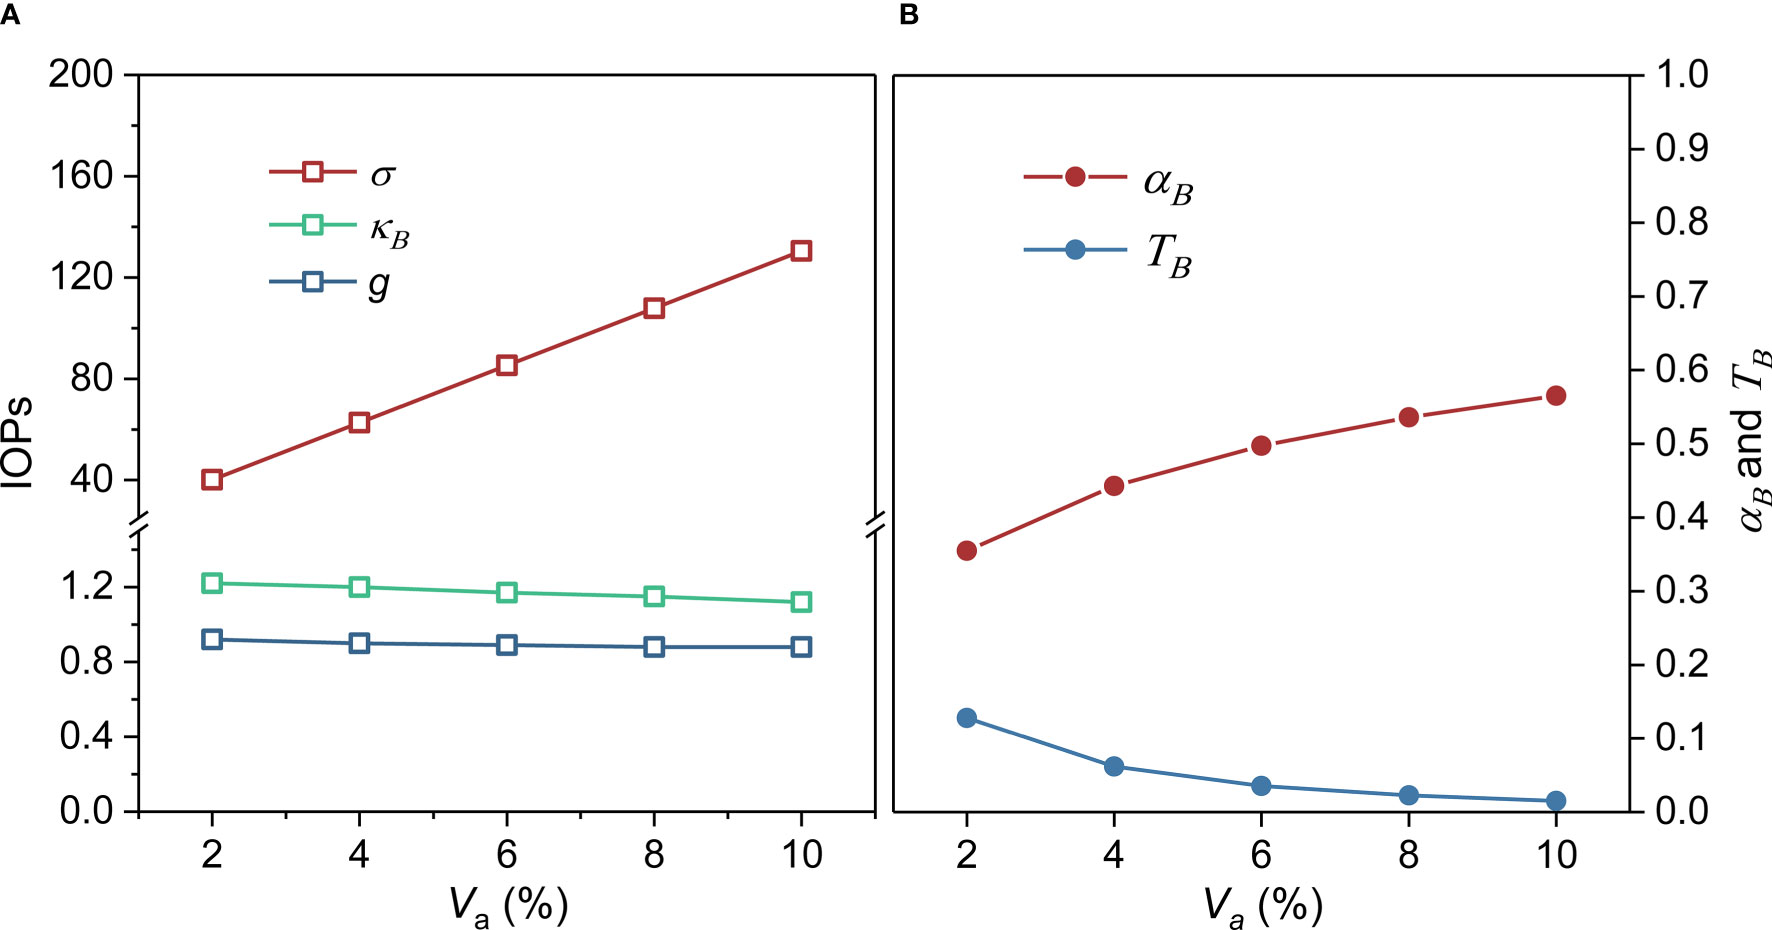
Figure 2 (A) IOPs and (B) broadband albedo αB and transmittance TB with increasing gas bubble volume Va from 2% to 10%. The corresponding spectral AOPs are shown in Figure S1A in supporting information.
Figure 2B shows the resulting changes in the broadband AOPs. The broadband albedo αB changed from 0.36 to 0.57 when the volume of gas bubbles Va increased from 2% to 10%. For the broadband transmittance TB, the change was from 0.13 to nearly 0.02. αB and TB are both sensitive to Va, but the relations are not linear. The effect of Va decreased with increasing σ. A similar situation was also seen for TB. The bubbles affected the spectral albedo αλ throughout the entire study band (Figure S1), but the effects in the UV-optical band were more evident than those in the near-IR band, due to the large IR absorption coefficient of ice. The impacts of bubbles on the spectral transmittance Tλ were mainly concentrated in wavelengths shorter than 850 nm. For longer wavelengths, Tλ was nearly zero due to strong absorption in ice.
Apart from gas content, previous studies have reported that an increase in gas bubble size can cause changes in surface albedo (Mullen and Warren, 1988). To obtain a sufficient understanding of this mechanism, different ranges of bubble radius ra with a constant volume Va = 3% were considered; the results are shown in Figure 3. Note that these ranges were determined arbitrarily because only a few studies have been performed of variations in the gas bubble size distribution Na in summer ice, but they are reasonable considering previous studies (Light et al., 2003; Frantz et al., 2019). The results showed that a constant Va leaves the absorption in ice unchanged (κB = 1.21 m-1, Figure 3A), but that the impact of variable ra on scattering, and consequently on the AOPs, is clear. The lower limit of ra affected the AOPs less than the upper limit. The broadband albedos αB (or transmittances TB) for ra ranges of 0.1–2 mm, 0.05–2 mm, and 0.01–2 mm were nearly identical, and the scattering coefficient σ remained almost the same. If the upper limit increases from 1 mm to 2 mm (for example as an effect of warming), the average αB changes from 0.51 to 0.42, and TB simultaneously increases to more than twice the original value. The reason is that large bubbles contribute more to total Va than small bubbles (Crabeck et al., 2016), meaning that small bubbles have only a slight effect on σ. Besides, the decrease in αλ showed a spectral variation, in which changes at shorter wavelengths were larger (Figure S1). The variations in Tλ were the largest at wavelength λ ≈ 500 nm, as can also be seen in Figure S1.
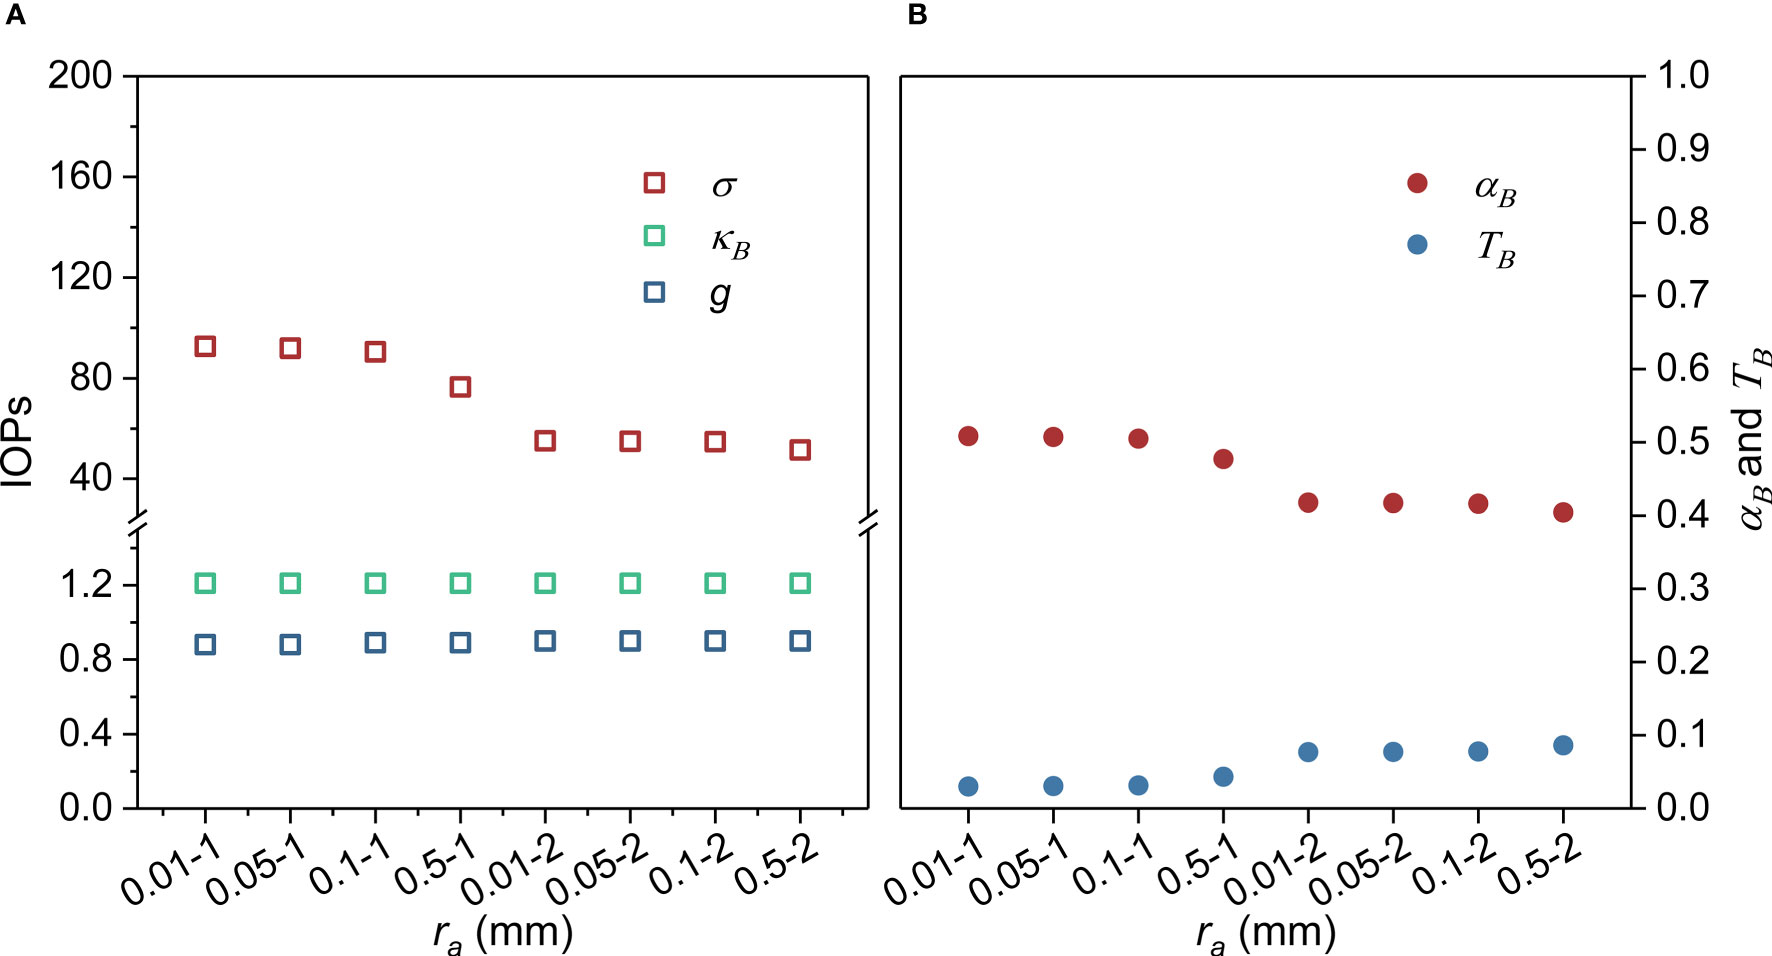
Figure 3 (A) IOPs and (B) broadband albedo αB and transmittance TB with changing gas bubble radius ra at a constant volume Va = 3%. The corresponding spectral AOPs are shown in Figure S1B in supporting information.
3.1.3 Influence of Brine Pockets
As the brine volume fraction Vb increased from 5% to 30%, the scattering coefficient σ increased from 42.8 m-1 to 86.1 m-1 (Figure 4A). The effects of the increasing volume of brine pockets on σ were about one-fifth those of gas bubbles because the refractive indices of brine pockets and pure ice are close. The absorption coefficient κB and the asymmetry parameter g changed from 1.27 to 0.97 m-1 and from 0.89 to 0.94, respectively. Broadband albedo αB increased from 0.40 to 0.43 as Vb increased from 5% to 30% (Figure 4B), showing only about one-twentieth of the effect of gas bubbles. Almost no changes were seen in broadband transmittance TB with Vb because the effect of decreased absorption largely counteracted that of increased scattering. Unlike the situation with gas bubbles, the brine pockets affected αλ throughout the entire study band to a similar degree (Figure S2A).
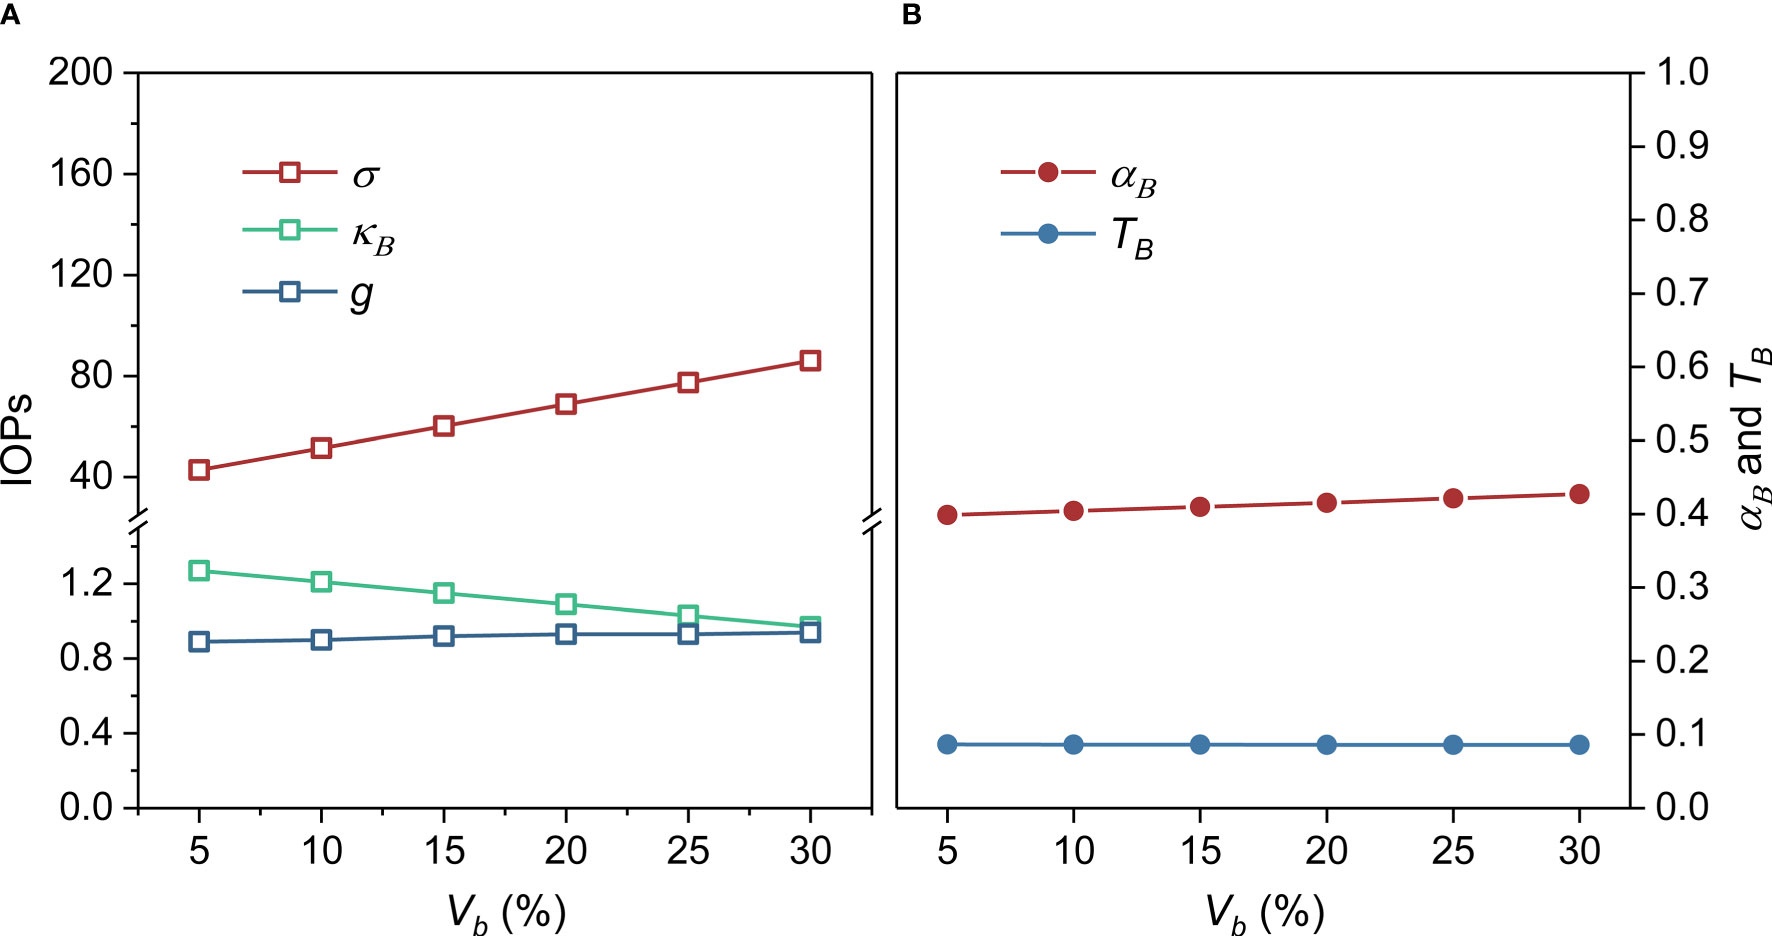
Figure 4 (A) IOPs and (B) broadband albedo αB and transmittance TB as brine pocket volume Vb increased from 5% to 30%. The corresponding spectral AOPs are shown in Figure S2A in supporting information.
Next, we set Vb to 10% and investigated the effects of six selected ranges of brine pocket length (lb) on the AOPs, as illustrated in Figure 5. In general, the lower limit of brine pocket size had more influence on the scattering coefficient σ and the absorption coefficient κB than the upper limit. This situation occurred because even large brine pockets have a relatively small equivalent radius (Grenfell and Warren, 1999). Hence, the extensive small pockets contributed predominantly to scattering and absorption. An increase of lb at the lower limit decreased σ more than an increase at the upper limit, with impact on αB. For instance, for three lb ranges, from 0.05 to 5 mm, 0.1 to 5 mm, and 0.5 to 5 mm, αB was 0.49, 0.48, and 0.47 respectively. However, for lb ranges from 0.1 to 5 mm and 0.1 to 10 mm, σ and κB were similar, as was the resulting αB. The transmittance, TB, increased when the upper and lower limits increased. However, the upper limit had less influence. For three lb ranges of 0.05 to 10 mm, 0.05 to 5 mm, and 0.1 to 5 mm, TB increased by about 0.002 (2.2%) when the upper limit increased from 5 to 10 mm, but by 0.008 (11.3%) when the lower limit changed from 0.05 to 0.1 mm.
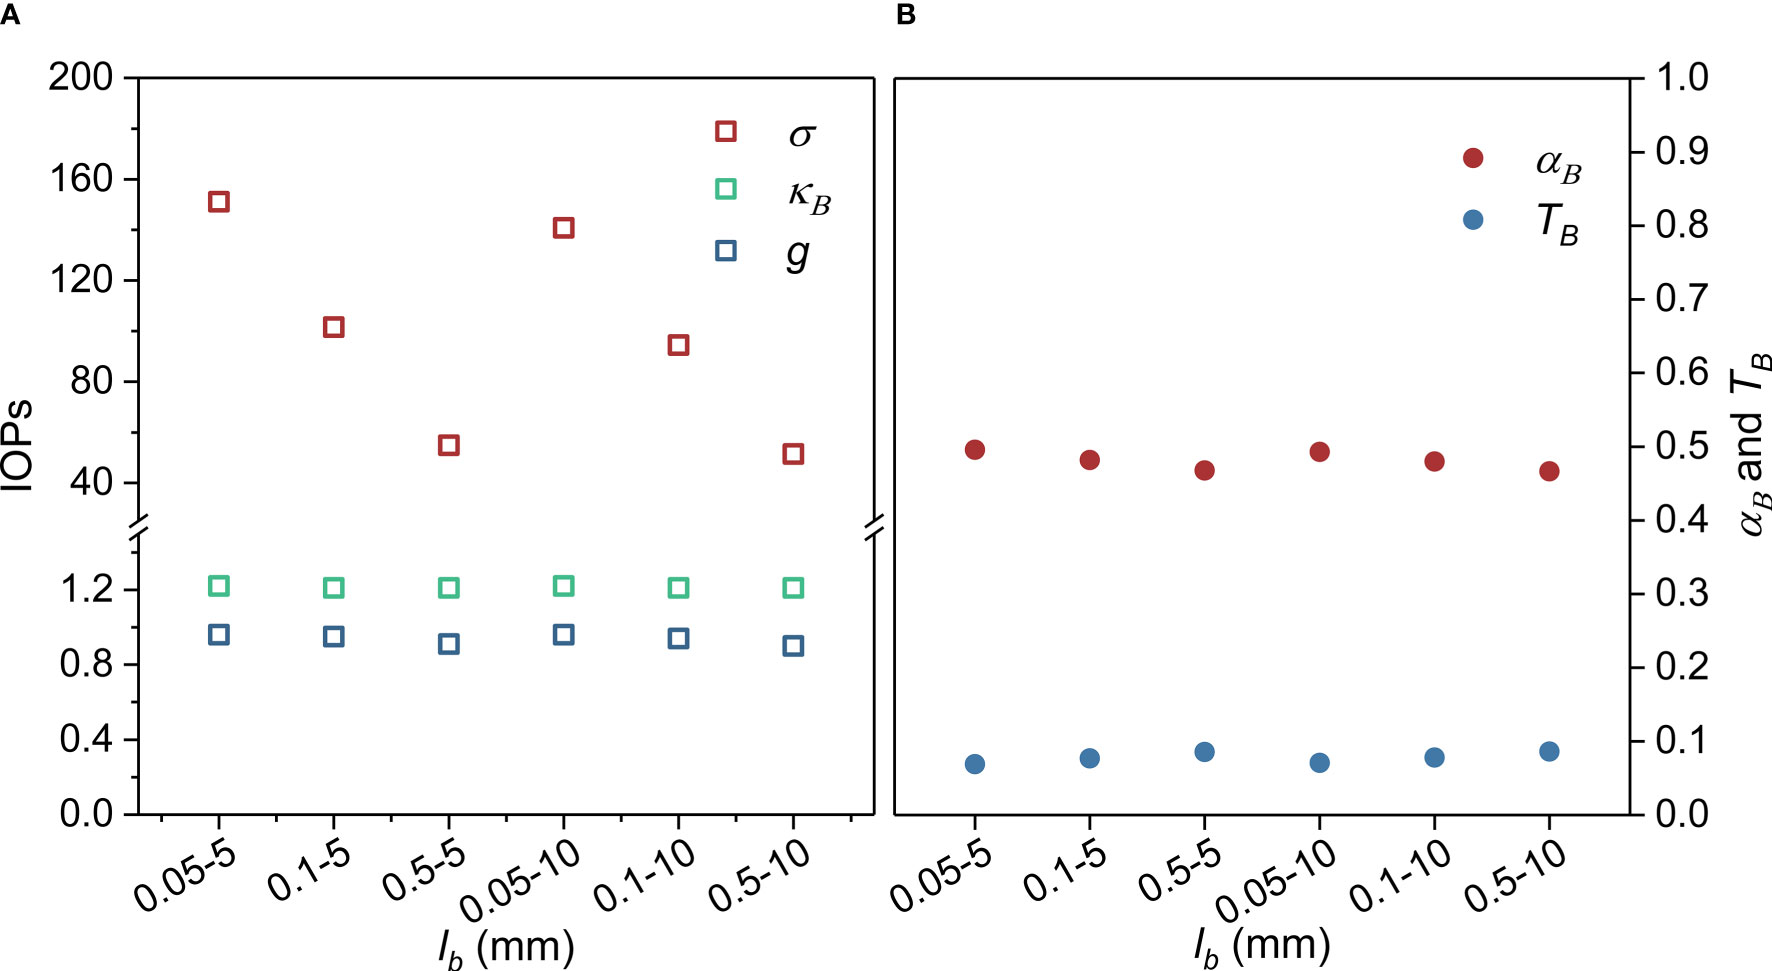
Figure 5 (A) IOPs and (B) broadband albedo αB and transmittance TB with changing brine pocket length lb in ice at a constant brine volume Vb = 10%. The corresponding spectral AOPs are shown in Figure S2B in supporting information.
3.1.4 Influence of PM
Taking sediment as an example, the effects of PM on ice IOPs and AOPs are shown in this section. Other kinds of PM are discussed in later sections. Unlike gas bubbles and brine pockets, sediment is deposited mostly in the shallow top layer of ice (Light et al., 1998). Therefore, an abundant PM layer was added to the top 5 cm of the uniform ice structure, following Marks and King (2013). In this layer, the concentration of PM (Mp) varied from 10 to 200 g/m3, and the particle radius rp varied from 10 to 200 μm. Below, in the remaining 95 cm of ice, Mp was 5 g/m3, and rp was the same as in the top layer.
The radius rp and concentration Mp of PM can influence the ice AOPs (Figure 6). The scattering and absorption coefficients (σp, κp) of PM increased with increasing Mp, with κp rising faster than σp (not shown here). Consequently, albedo αB and transmittance TB decreased with increasing Mp. Furthermore, the rates of decrease were small when Mp was sufficiently large because the changes in PM-IOPs were decreasing with increasing Mp. Taking rp = 20 μm as an example: αB decreased by 0.016 (3.2%) as Mp changed from 10 to 20 g/m3, but by 0.007 (2.2%) when Mp changed from 190 to 200 g/m3. The corresponding drops in TB were 0.003 (2.6%) and 0.002 (2.0%), respectively. When the radius was sufficiently large (e.g., rp > 100 μm), the PM concentration had almost no effect on αB and TB. This was the case because the ‘self-shading effect’ is more obvious for larger particles, which resulted in the absorption in sea ice not increasing concurrently with Mp (Light et al., 1998). Below a specific concentration, αB and TB increased with radius due to the change in the total PM surface area, and the magnitude of the increase became greater with concentration. Comparing the two cases of Mp = 20 and 200 g/m3, αB increased by 0.128 (30.3%) and 0.323 (166.6%), respectively, when rp changed from 10 to 200 μm. This amounted to TB doubling and more than tripling, respectively.
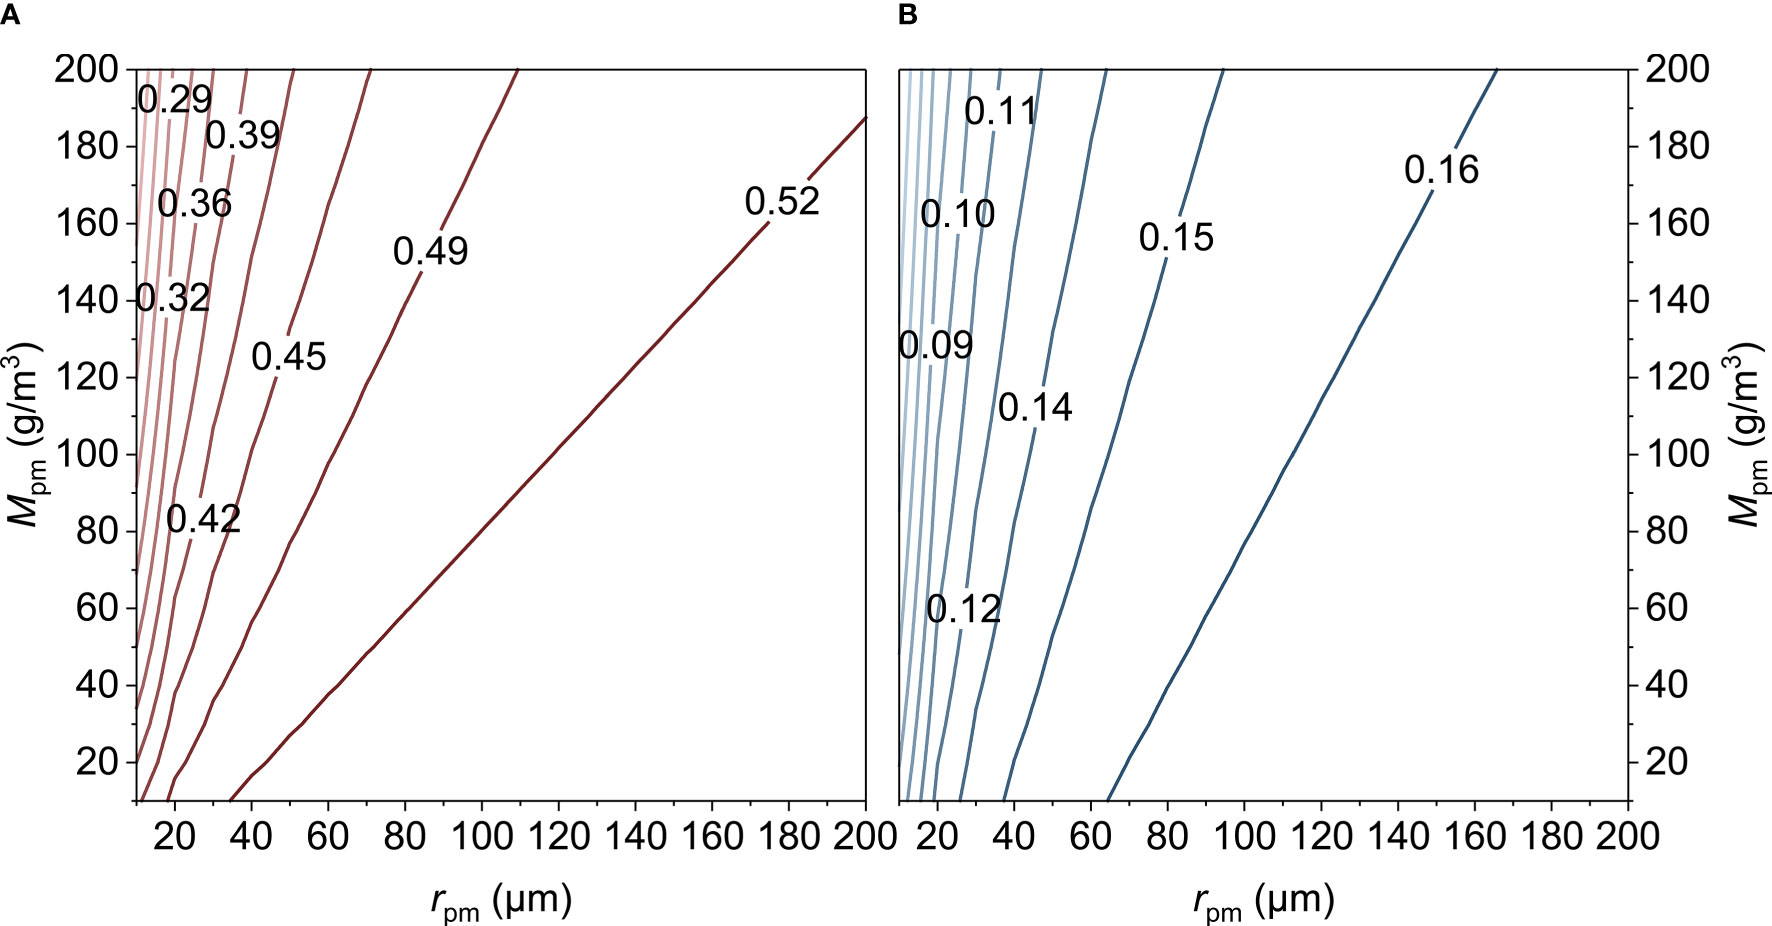
Figure 6 Sensitivity of broadband (A) albedo and (B) transmittance to the concentration Mp and size rp of PM particles. The PM is distributed evenly within the top 5 cm of ice.
Due to different times of deposition, the thickness of the abundant PM layer can vary. This study therefore examined how the thickness of this layer affected the AOPs. The concentration Mp of the upper layer was 50 g/m3, compared with 5 g/m3 in the lower layer. The particle radius was held constant at 10 μm. The thickness of the upper layer ranged from 4 to 20 cm, following Light et al. (1998). As the upper layer became thicker, albedo and transmittance decreased gradually (Figure 7A), but the reduction was not the same in different bands (Figure 7B). The decrease was more obvious for wavelengths shorter than 800 nm because ice becomes the predominant absorber at longer wavelengths. For instance, at 400 nm, albedo decreased by 0.136 (34.8%) as the thickness of the upper layer changed from 4 to 20 cm, but at 900 nm, the decrease was 0.011 (7.5%). At 850 nm, transmittance was nearly zero, but in the other bands, transmittance was reduced as the upper layer thickness increased, and the rate of change with thickness slightly decreased, although not as clearly as in the case of albedo.
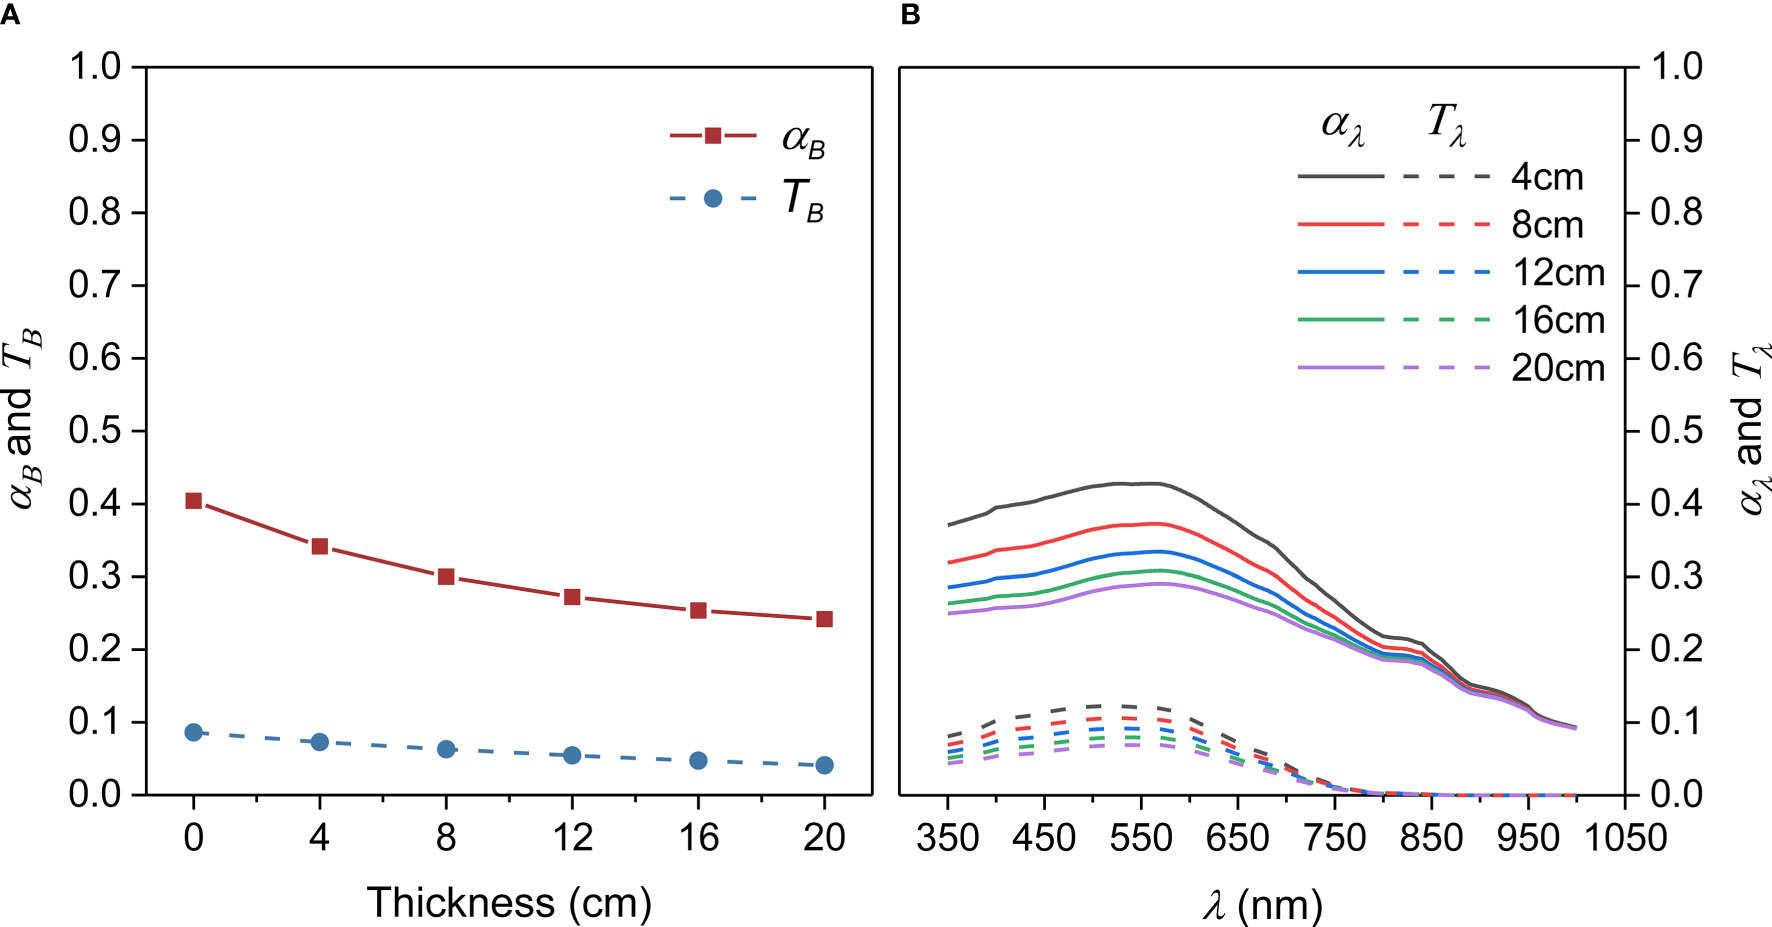
Figure 7 (A) Broadband and (B) spectral albedo and transmittance in different bands as functions of the upper-layer thickness of sea ice containing PM at high concentration (50 g/m3).
3.2 Evolution During a Warming Process
Gas bubbles and brine pockets change continuously with ice temperature. It is interesting to study the effects of ice microstructure on AOPs during an idealized warming process. Due to the absence of field observations of variation in microstructures, laboratory measurements of brine inclusions in springtime Arctic ice (ice thickness is 20 cm) from Perovich and Gow (1996) were used. The brine volume Vb and the cross-sectional area were documented. The radius of the brine pocket cross-section can be calculated from the area assuming that brine pockets are cylindrical. Next, the aspect ratio function from Light et al. (2003) was used to obtain lb. As for the gas bubbles, sea-ice phase diagrams (Cox and Weeks, 1983; Leppäranta and Manninen, 1988) were used. The error ranges of the temperature and salinity measurements were ± 0.1°C and ± 0.2 ppt, respectively (Perovich and Gow, 1996). The ranges of gas bubble volume Va are plotted as red bars in Figure 8A. The initial radius of the gas bubbles ra was assumed as 0.5 mm, but when the temperature increased, the gas bubbles tended to become larger (Light et al., 2003; Crabeck et al., 2019). The number of bubbles was assumed constant, and ra increased with Va. In this way, AOPs at different ice temperatures can be obtained.
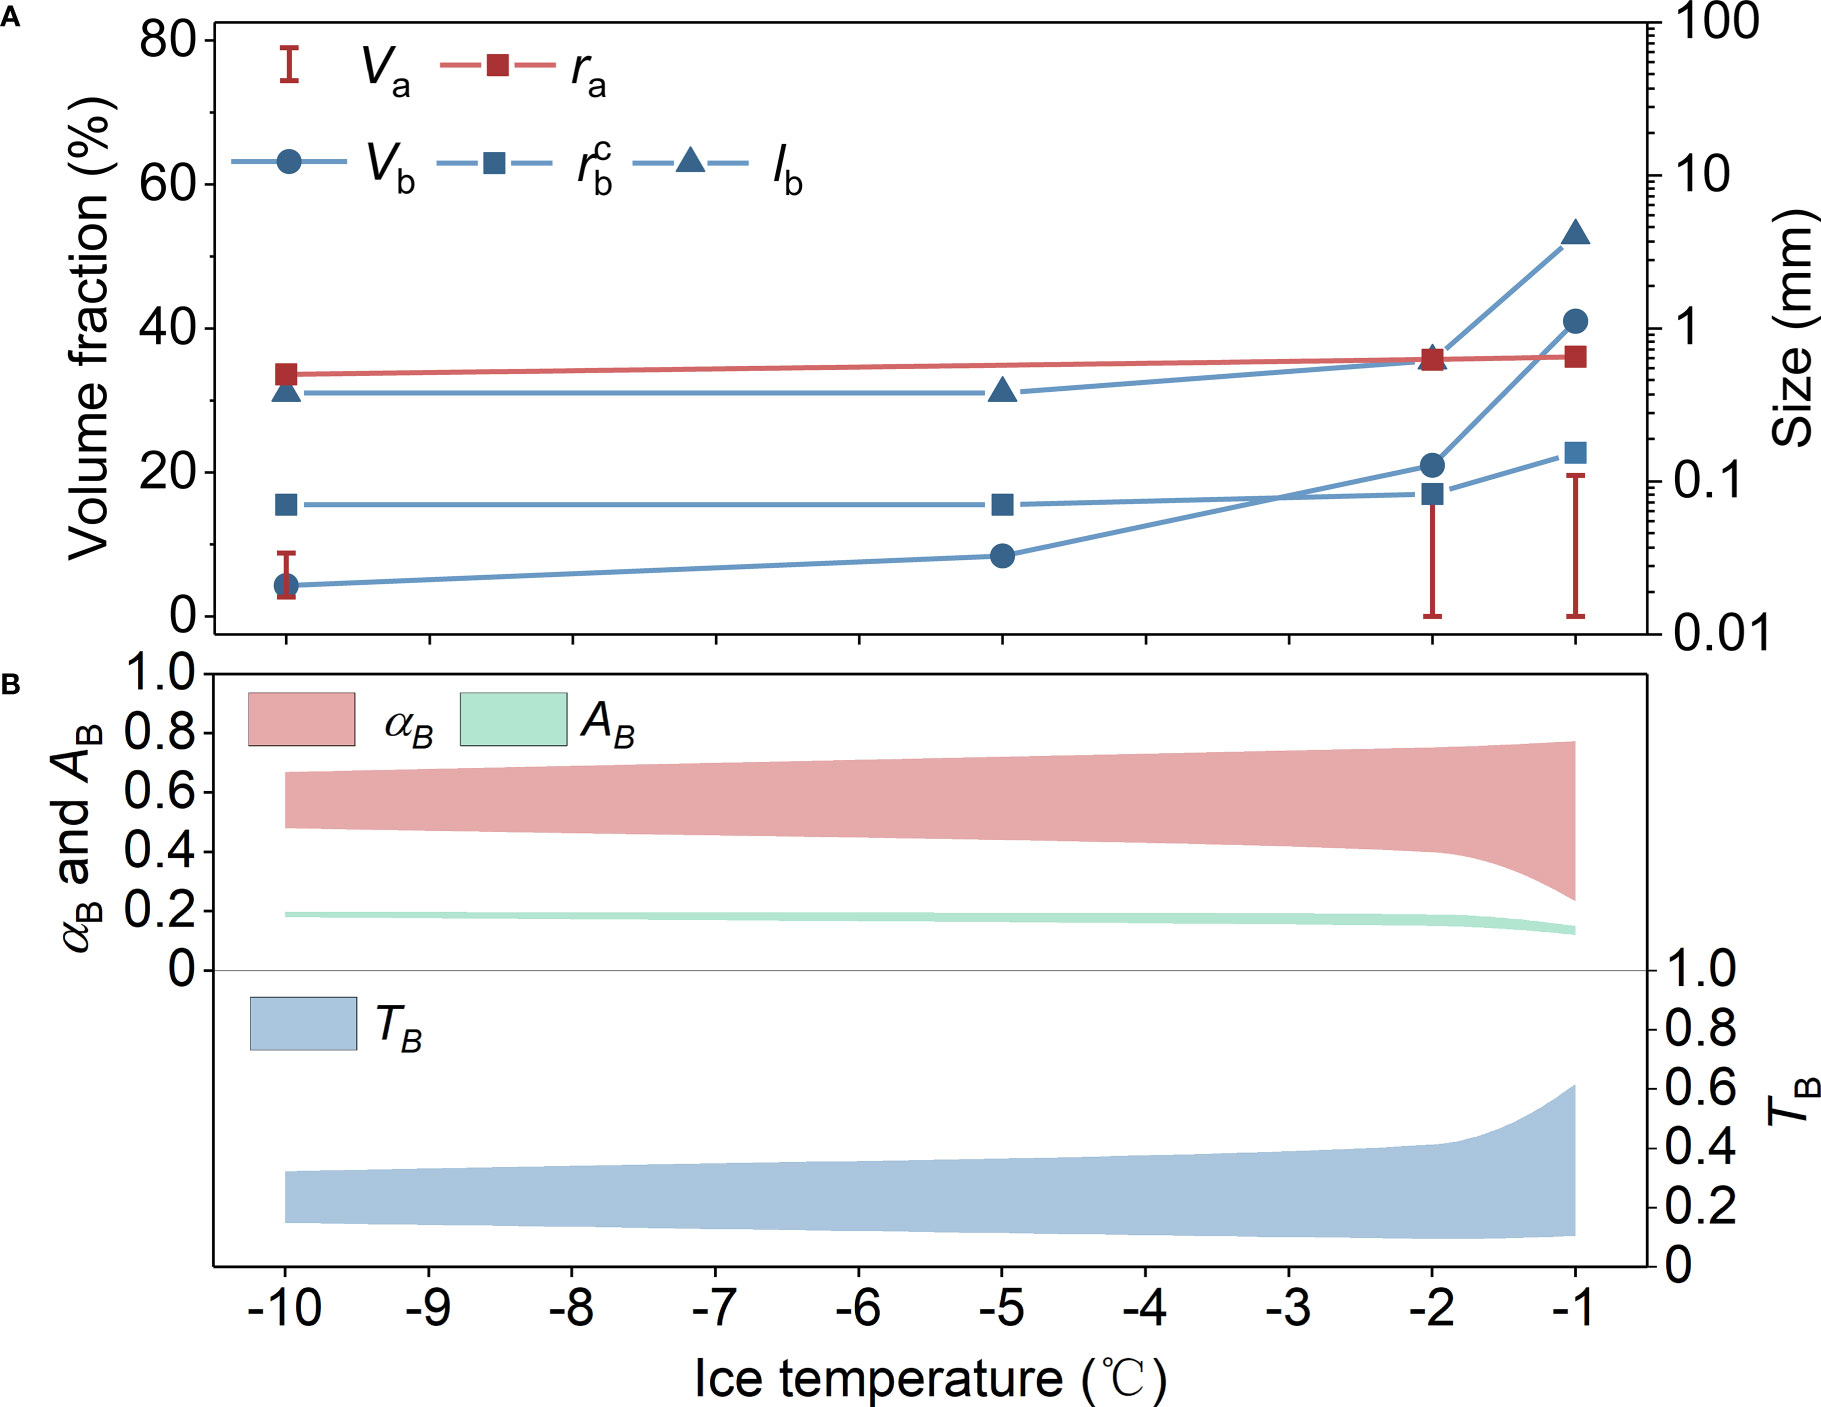
Figure 8 (A) Changes in inclusion volume and size during warming (data from Perovich and Gow, 1996); (B) changes in albedo αB, transmittance TB, and absorptivity AB of ice during the warming process. Note that the range of values obtained for albedo and transmittance is due to the range of values for Va.
As shown in Figure 8A, and lb were nearly constant at low ice temperature, and the brine pockets grew rapidly when the ice temperature was high enough (> -2°C). On the contrary, the changes in gas bubbles were not clear due to experimental errors. According to the maximum and minimum Va, distinct trends of albedo αB with temperature can be found, as shown by the red area in Figure 8B. This implies that the gas bubbles have a predominant role in melting-ice AOPs, even without variations in ice thickness. Although the changes in αB and TB were not identical under different Va, the ice absorptivity AB was relatively stable. Indeed, AB was nearly constant (0.19) when ice temperature increased from -10°C to -2°C, then decreased to about 0.15 at -1°C. This was due to the abundance of brine pockets, which have less absorptivity than pure ice.
3.3 Comparison With Other Studies
Validation of the present method with available information encounters limitations because only a few studies on the optical properties of sea ice make any mention of microstructures. Figure 9A shows a comparison of variations in albedo with Va in the present study (Figure 2) and other studies. Although only the gas content is considered here, the present results agree with other studies. There was no PM reported in these compared ices. Other details can be found in Table S2. The albedo in Grenfell (1983) was greater than in the present study because their gas bubble size was small (0.1–2 mm). Ice thickness in Mobley et al. (1998) was 1.74 m, which resulted in a greater albedo. The blue ice in Grenfell and Maykut (1977) was saturated with meltwater, which was the reason for its lower albedo. These comparisons confirm the ability of microstructure-dependent IOPs to predict AOPs. The predominant role of gas bubbles in sea-ice albedo was also verified because they have stronger effects on the scattering coefficient than brine pockets (Sections 3.1.2, 3.1.3).
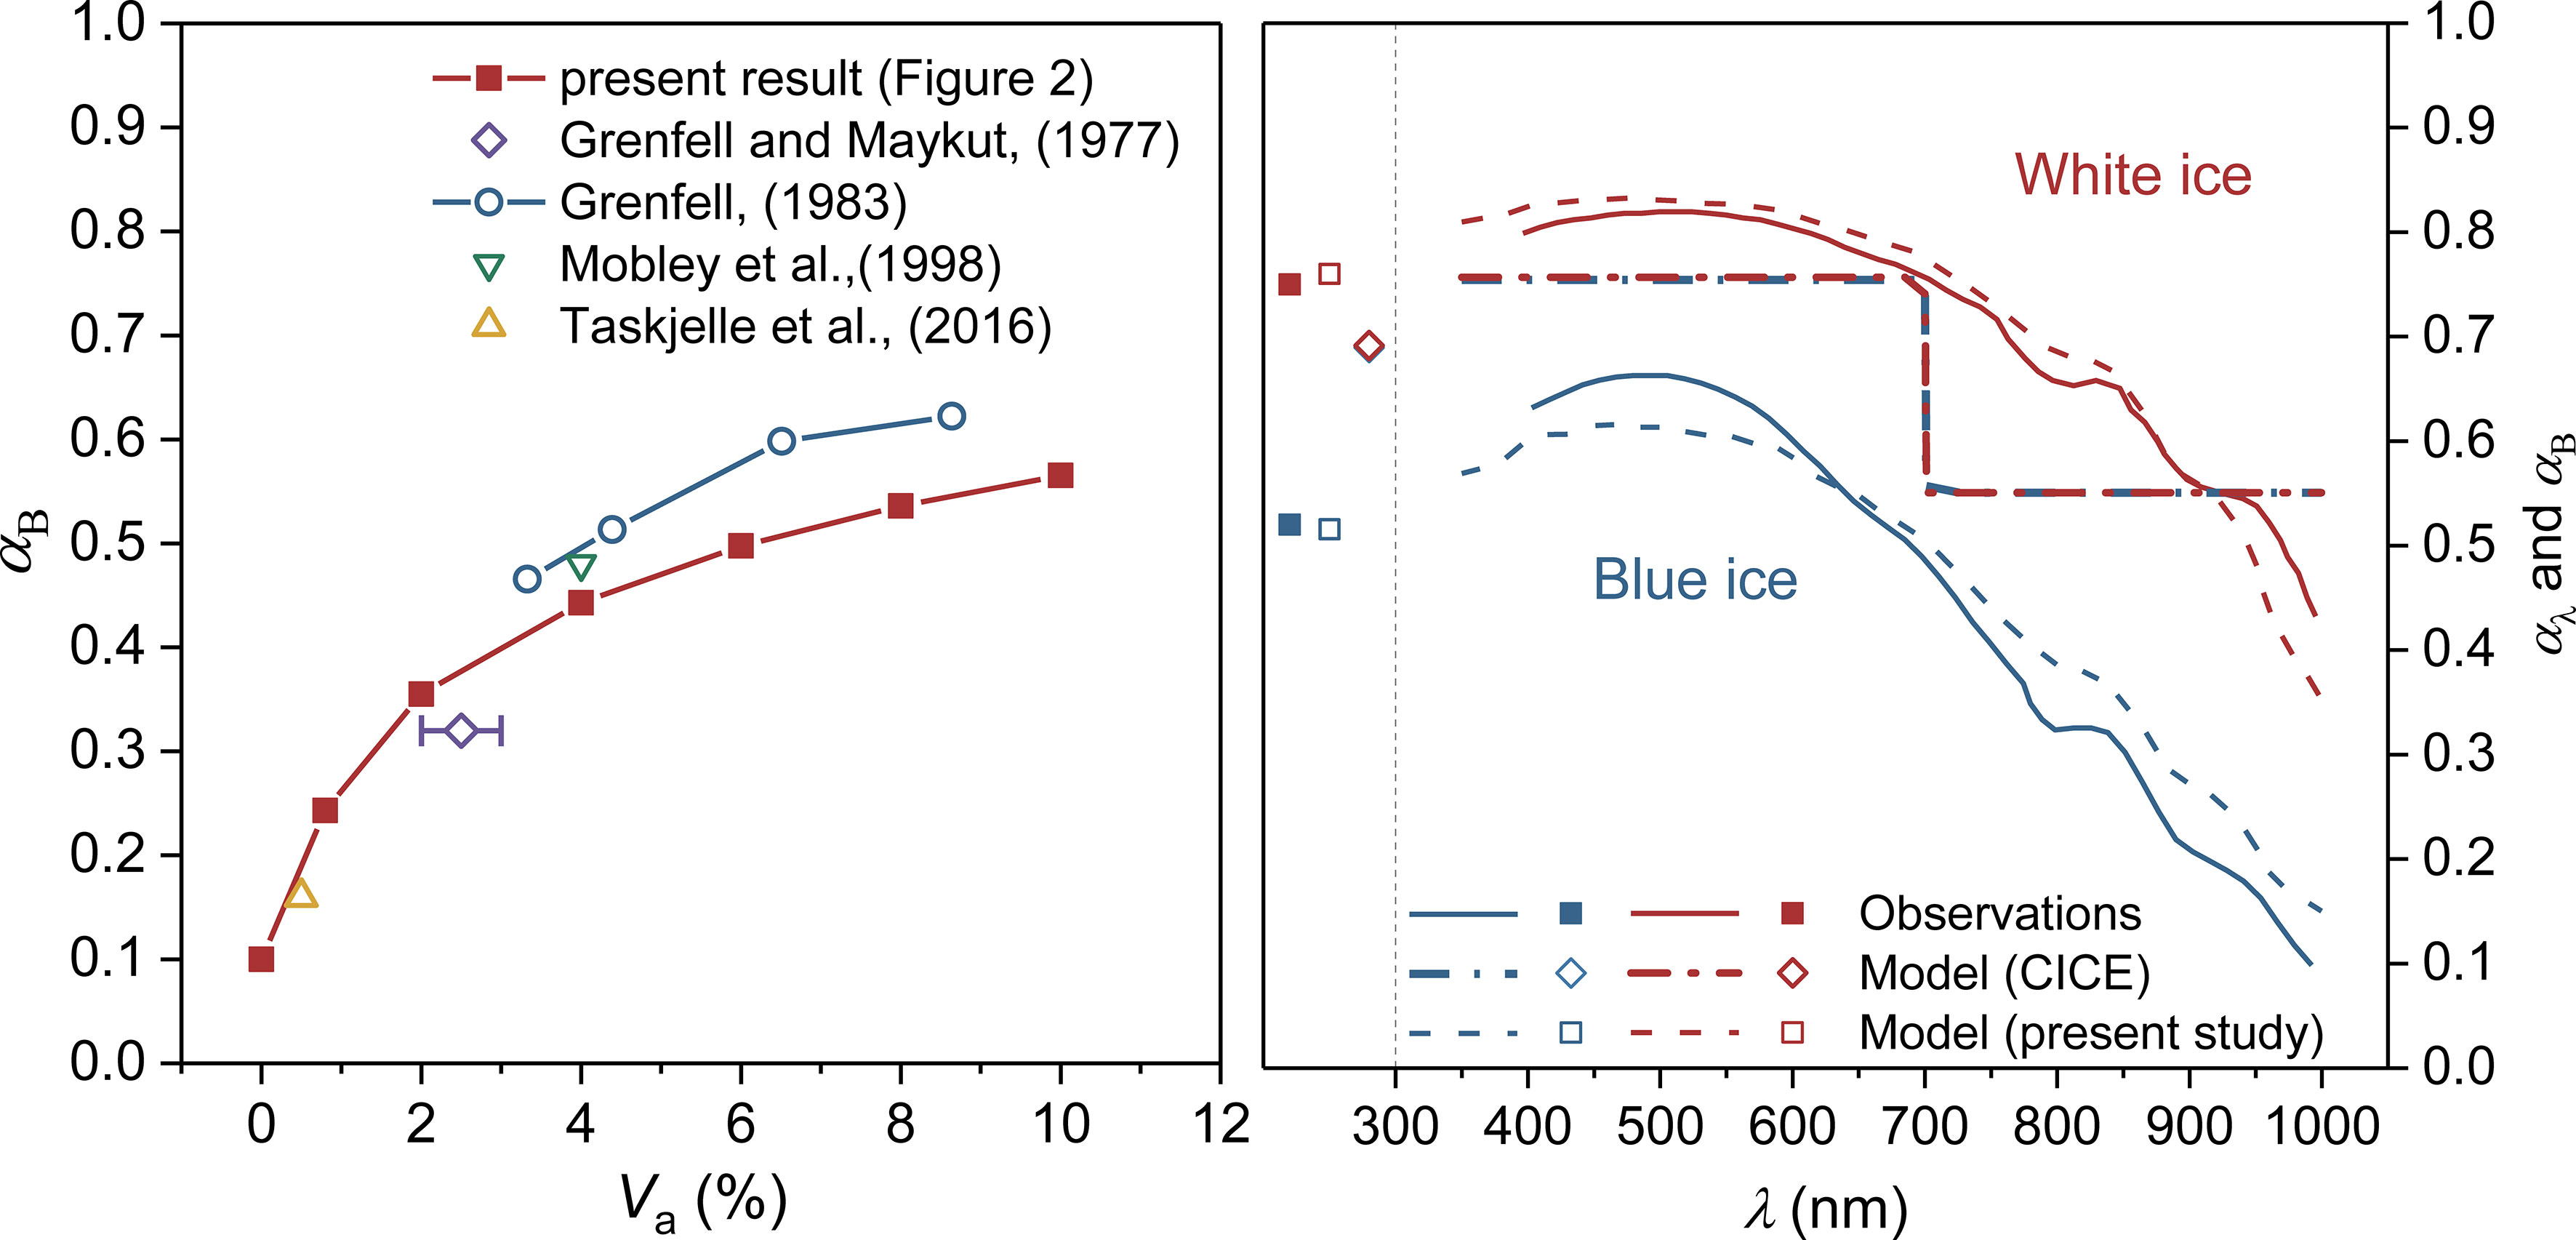
Figure 9 Comparisons of albedo (A) as a function of Va between present and previous studies, and (B) according to the microstructure-dependent IOPs (dashed lines) and the CICE-IOPs parameterization (dot-dash lines). The field observations (solid lines) come from Ehn et al. (2008). Also shown is the broadband albedo on the left. Note that the albedos of blue and white ice according to CICE-IOPs are nearly identical and hence overlap and that the step behavior is due to different spectral bands in the CICE parameterization.
Next, the estimated AOPs were compared according to the microstructure-dependent IOPs (Section 2.1) and the constant IOPs (parameterization in CICE), as shown in Figure 9B. The observed spectral albedos of melting white and blue ice in late April 2005 were measured by Ehn et al. (2008) in western Hudson’s Bay. They also recorded the layered volume fractions of gas bubbles and brine pockets and the effective radius of scatterers, which ranged in blue ice from 0.297 to 2.75 mm and from 0.107 to 2.75 mm in white ice. In the following comparisons, it was assumed that the gas-bubble radius of the two types of ice (white ice and blue ice) was consistent with the effective radius and that the brine pocket length ranged from 0.05 to 10 mm. The PM concentration in the upper layer of ice was recorded by Ehn et al. (2008), but the refractive indices and sizes of the particles were not included in their study. Hence, the default PM parameters in the present study were adopted.
As shown in Figure 9B, the estimated broadband albedo depends on the microstructure-dependent IOPs agree better with the observed results than do the constant IOPs. The specific differences in the shape of the spectral albedo can be explained by the PM parameters not corresponding to reality. The PM concentration was greater in blue ice (2.9 g/m3) than in white ice (0.013 g/m3), and therefore the difference in the shortwave band of blue ice is more obvious. Clear overestimation can be seen in the broadband albedo of blue ice by the CICE-IOPs parameterization, as well as underestimation for white ice. This behavior occurs because the thickness of the top porous layer in the CICE parameterization is controlled by ice thickness. This assumption overestimates the porosity and scattering coefficient of the blue ice surface layer (no obvious porous layer) and underestimates them for white ice (0.17 m porous layer), which results in the estimated broadband albedos of blue ice and white ice being nearly identical. Hence, fixed IOP parameterization is not suitable for different ice types, and inaccurate representation of ice microstructure results in large uncertainties in AOP estimation.
Apart from PM, another possible uncertainty of microstructure-dependent IOPs is introduced by the size distribution functions of gas bubbles and brine pockets. The functions used here were obtained at a temperature of -15°C and were chosen because of the very limited available data. At high temperatures, the distributions shift toward larger sizes (Light et al., 2003; Perovich and Gow, 1996). Because the effects of brine pockets on AOPs are very limited compared with those of gas bubbles (Figures 2, 4), the influence of the size distributions of gas bubbles is regarded as the main discussion target. Generally, the influence of bubble size distribution is more obvious on the broadband transmittance TB than on the broadband albedo αB because the content of small bubbles is more sensitive to the exponent of the distribution power law (Figure S3). However, the distribution of bubbles in natural sea ice is unlikely to show much variation. For comparison, an exponent of -1.5 was used by Light et al. (2003) and one of -1.24 by Grenfell (1983). The deviation of αB was 0.004 (0.9%) between these two distributions under the default ice parameters. The corresponding deviation of TB was 0.003 (3.1%). Therefore, the results in Section 3.1 derived from the distribution function at -15°C can be considered acceptable.
4 Implications for the Arctic
4.1 Influence of Interannual Difference in Ice Microstructure
It is straightforward to check the effects of different ice microstructures on sea-ice AOPs in the real Arctic. Wang et al. (2020) reported the volume fractions of gas bubbles and brine pockets within summer sea ice in the Arctic Ocean for 2008–2016, which was used in this section. The mean volume fractions of gas bubbles Va and brine pockets Vb in ice cores were calculated for different years, and PM information was not included in this dataset. A constant ice thickness of 1 m was also adopted here to highlight the effects of microstructures.
Differences in gas bubbles and brine pockets resulted in changes in ice IOPs (Figure 10). The bulk Va ranged from 11.6% to 18.5% during the period from 2008–2016, and Vb ranged from 5.1% to 16.5% concurrently. It can be seen that changing microstructures affect the ice scattering coefficient σ more than the absorption coefficient κB or the asymmetry factor g. The σ in 2008, 2012, and 2014 were larger than those in 2010 and 2016 by ~30%. Although Vb in 2016 was the greatest (16.5%) in these five years, the ice scattering coefficient σ was relatively small (159.6 m-1). This confirms the role of Va in σ.
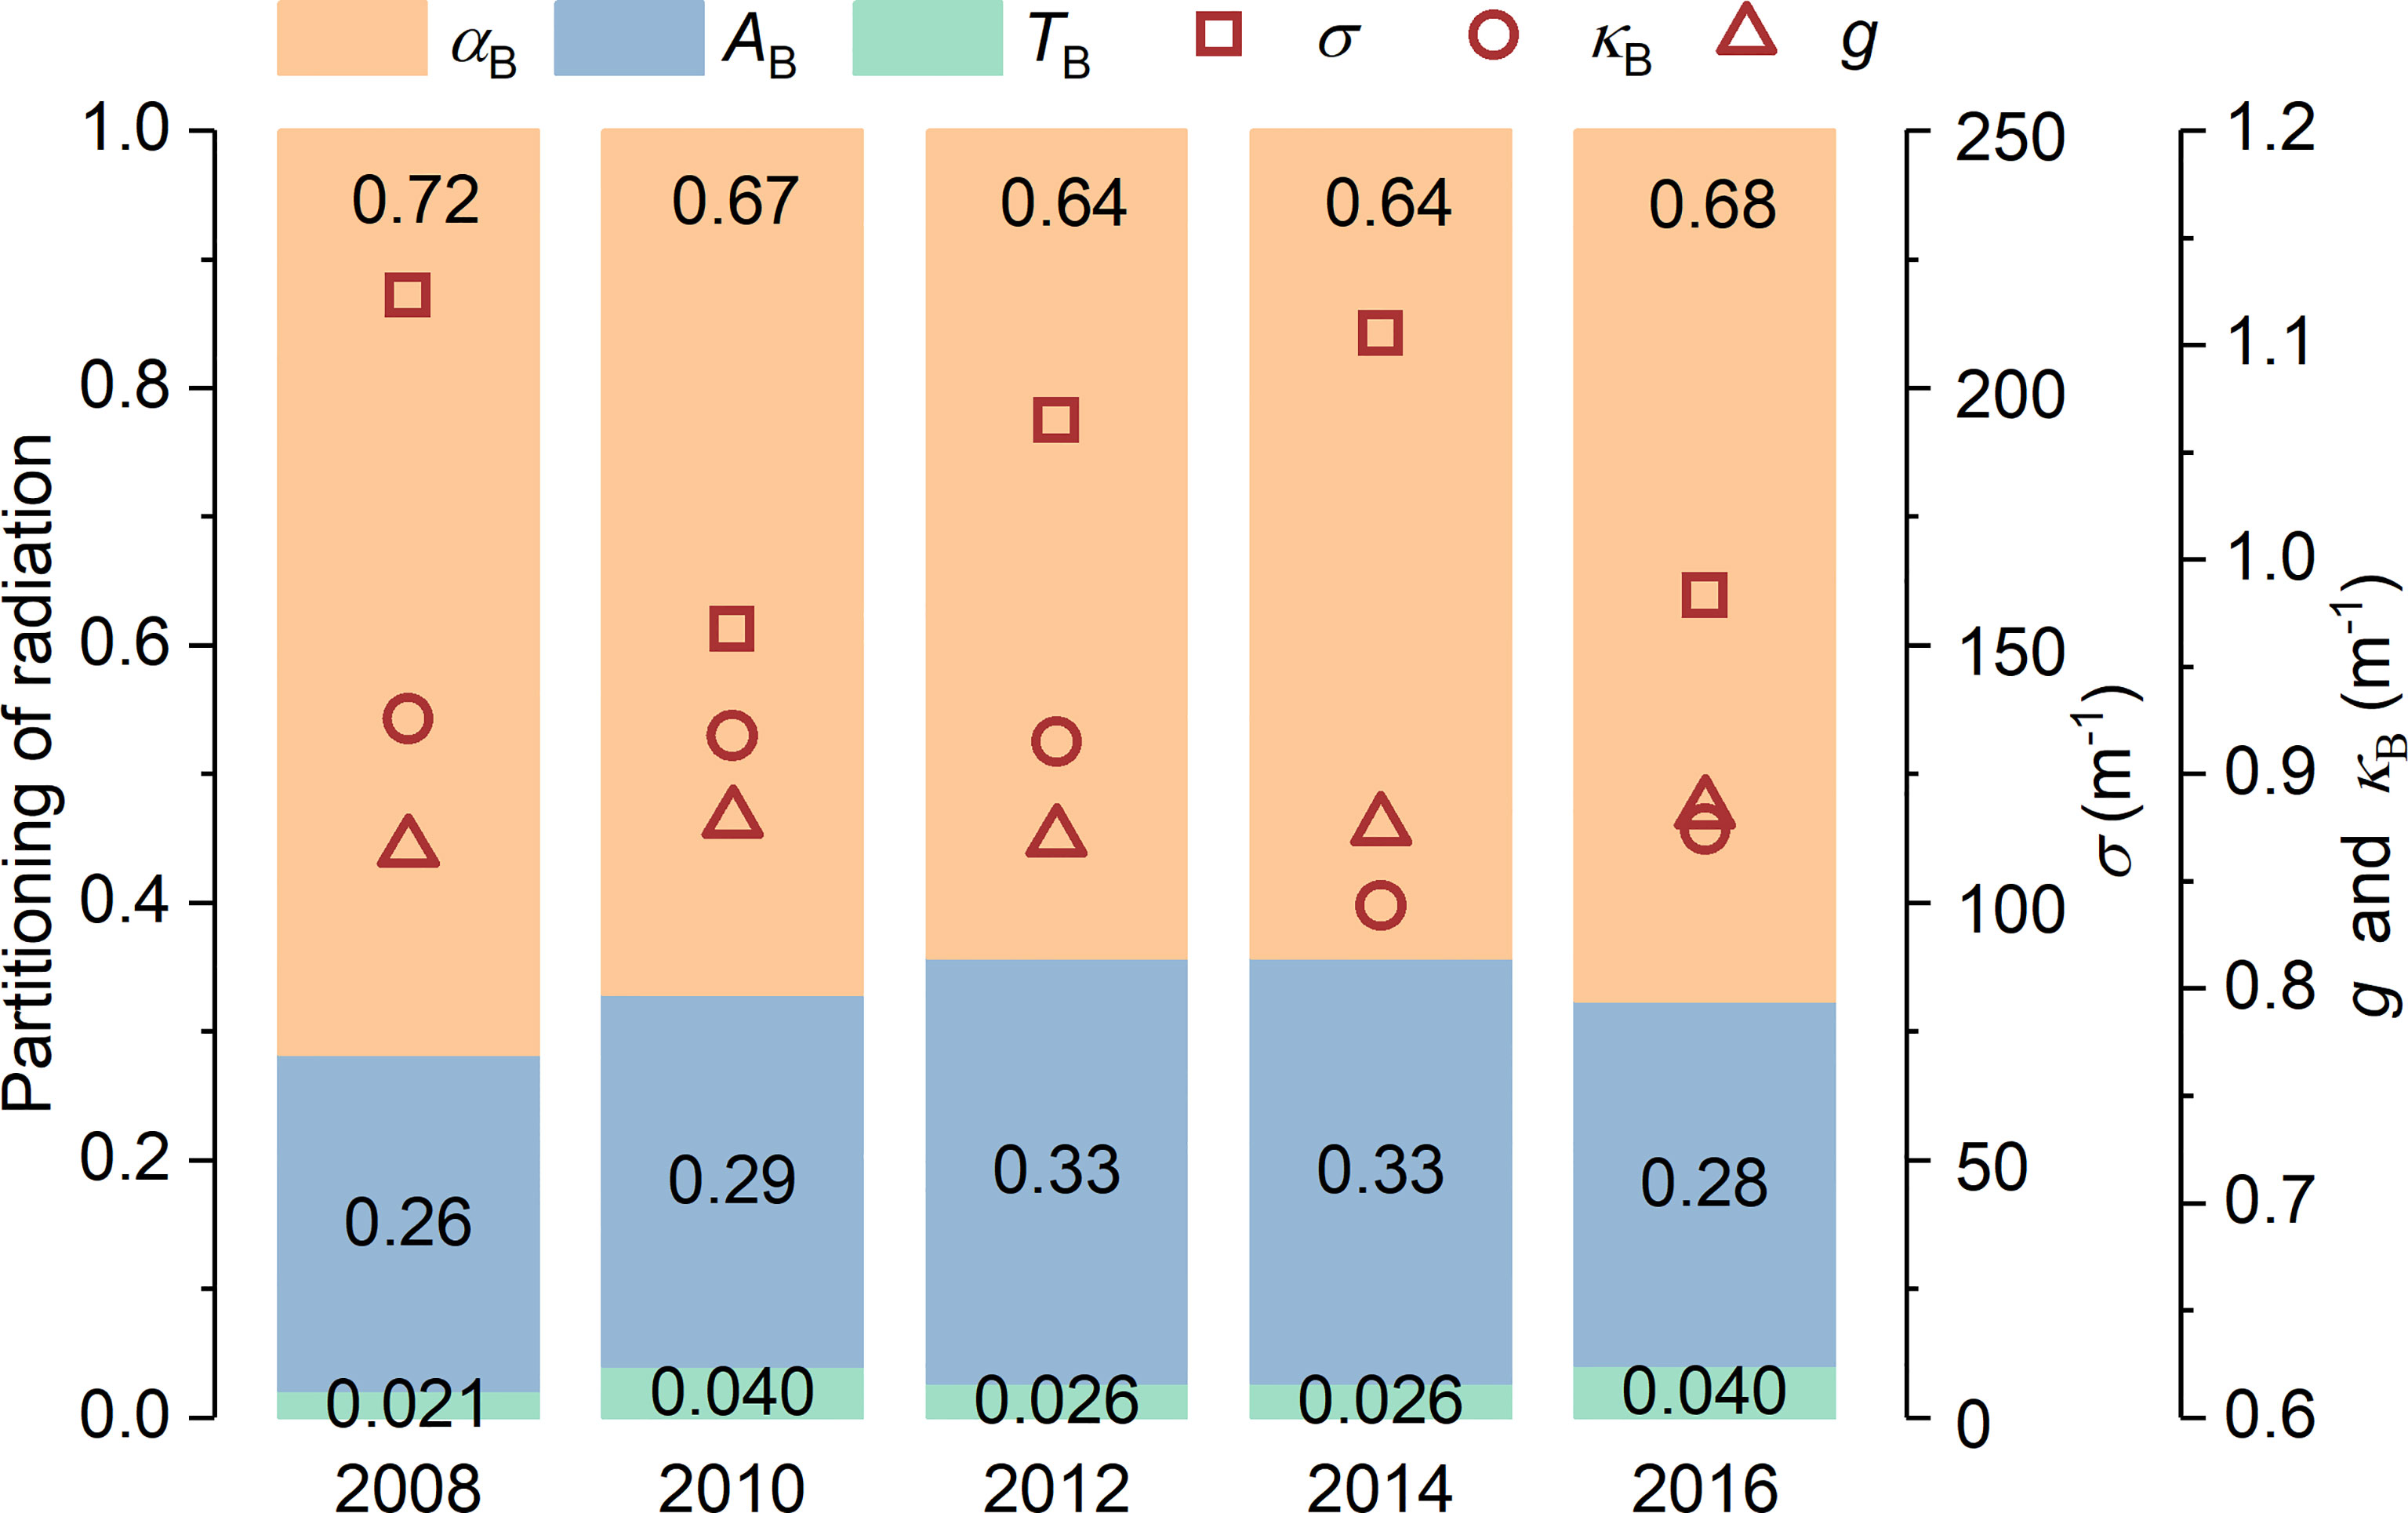
Figure 10 IOPs and partitioning of radiation on Arctic ice in different years. The data used were obtained from summer ice cores sampled in the Pacific Sector of the Arctic (Wang et al., 2020). PM is not considered here.
Figure 10 shows that differences in microstructure have a minor effect on albedo, but their effects on transmittance are evident. In these five years, changing ice microstructure introduced an uncertainty of 0.08 in the estimated albedo (11.1%-12.5%) and of 0.02 (47.5%-90.5%) at most in the estimated transmittance. Taking the ice in 2008 and 2016 as an example, the variations in microstructure changed the ice albedo by only 5%, but increased transmittance by 90.5%. An increasing absorption by sea ice (8%) can also be seen. Given the incident solar irradiance of 100 W/m2, the different sea-ice microstructure between 2008 and 2016 resulted in ~2 W/m2 more radiation transmitted through the ice. If the accumulated PM in the ice surface is considered (5 g/cm3 PM in the 5-cm surface layer), the increase in absorbed radiation will be greater (by ~4.7 W/m2) due to an increase in κB. Increasing solar radiation absorbed by either sea ice or the underlying ocean encourages melting of the ice cover, and therefore the fixed optical properties of sea ice are not enough to describe such a process.
4.2 Effects of Microstructure Under Different Sea-Ice Conditions
Uniform bare ice was considered in Section 3.1 to highlight the effects of microstructures, resulting in a relatively narrow variation range of ice AOPs compared with observations. It would be interesting to study the impact of microstructures under various sea-ice conditions based on these idealized results for bare ice.
Sea-ice properties change with the age of the ice. Multiyear ice has more gas bubbles than first-year ice (9.3% vs. 2.6%) due to brine drainage in previous seasons (Perovich, 2002; Ehn et al., 2008). Hence, the effect of the same changing gas bubbles on AOPs of first-year ice is approximately five times that of multiyear ice, according to Figure 2. Analogously, Mark and King (2013) demonstrated that the albedo of first-year ice is more sensitive to additional PM than that of multiyear ice. Furthermore, saline first-year ice is more prone to brine convection events, which then enhance gas exchange in sea ice (Jardon et al., 2013). In other words, gas bubbles change more easily in first-year ice than in multiyear ice. This suggests that ice microstructures play important roles in seasonal AOP changes, and that their effects will likely become more pronounced with the expected decline of multiyear ice (Stroeve and Notz, 2018) and the changes in the structure of first year ice (Veyssière et al., 2022) in the future Arctic.
Ice surface conditions also affect ice AOPs. In the Arctic, snow accumulates mostly between August and the following April, especially in autumn (Nicolaus et al., 2021). Due to the strong scattering of light on snow, most of the effects of ice microstructures on AOPs are removed by snow protection. Marks and King (2013) demonstrated that ice microstructures still have an effect on AOPs in the presence of a 5-cm wet snow cover. Besides, variations in gas bubbles and brine pockets become notable only at an ice temperature approaching -2°C (Figure 8A). Therefore, it can be deduced that the effects of ice microstructures on AOPs of snow-covered ice in the cold seasons are limited.
However, things are different for sea ice covered by melt ponds. Ponded ice has lower albedo and higher transmittance than bare ice, and its AOPs mainly depend on the depth of the pond and on scattering by the underlying ice (Lu et al., 2016). The results in Section 3.1 are still applicable to the IOPs of the underlying ice. Due to the high absorption of ponded ice, changes in summer are clearer in ponded ice than in bare ice (Perovich, 2002). These changes in ponded ice not only increase the area and depth of ponds, but also result in fewer bubbles, darkening the underlying ice. The scattering coefficient of this darkened ice is less than 0.1 times the scattering coefficient of light-colored (white/grey) ice (Malinka et al., 2018). This will enhance the increase in absorbed and transmitted radiation by ponded ice.
4.3 Implications for Models and Ice-Ocean Interactions
Using constant IOPs introduces uncertainties when estimating ice AOPs (Figure 9). These remind us that more attention is needed to the further effects of changing IOPs on modeling Arctic sea ice, especially in the summer.
First, gas bubbles have been found to have an effect more than 20 times stronger than brine pockets on albedo (Sections 3.1.2, 3.1.3). The results in Figure 8 show that the microstructures change sharply when the ice temperature rises above -2°C, which is a representative ice temperature from June to August (Frantz et al., 2019). In natural ice, gas bubbles in brine pockets escape to the atmosphere by buoyancy when individual pockets are sufficiently large and connected (Crabeck et al., 2019). The decreasing gas volume (Figure 2) results in a decreasing scattering coefficient and albedo, as seen in the results in Figure 8 with low gas content. Similar trends have been observed in the ice extinction coefficient, which is another kind of IOP used in exponential models and which can be expressed as a function of both the scattering and absorption coefficients (Grenfell et al., 2006). For example, decreasing extinction coefficients were observed in melting multiyear ice (June to August) in field measurements by Light et al. (2008), and Perovich and Grenfell (1981) reported that ice albedo decreased by 18.4% when ice temperature increased from -10°C to -2°C in a tank study. Therefore, it can be suspected that replacing gas in bubbles by brine convection is the predominant process that affects melting-ice AOPs. This process is seldom considered in current models. A brine volume Vb = 7.5%–10% was suggested by Zhou et al. (2013) as the critical threshold for upward transport of gas bubbles.
Unlike gas bubbles and brine pockets, PM does not change with ice temperature, but accumulates over time from atmospheric deposition and primary production. Figure 7 shows the effects of PM on ice AOPs using the case of sediment as example. A 4-cm upper layer of ice that contains PM at a high concentration of 50 g/m3 results in 10% more radiation absorbed in ice, which promotes surface-layer ice melting. Marks and King (2013) showed that about 0.1 g/m3 black carbon in the ice surface layer can result in over 10% more absorbed radiation in first-year ice. This demonstrates the differences between different types of PM on the ice surface. Additionally, the effects of PM also depend on its vertical distribution because PM is not always deposited on top of the ice. In 2-m ice with a 20-mm layer of algae at the bottom, 300 mg/m2 algae reduce ice transmittance by more than a factor of 10 at 450 nm (Grenfell, 1991). However, the effects of algae on albedo are not evident. In summary, not only the PM concentration, but also its type and vertical distribution are needed to understand the effects of PM.
Second, Figure 8 shows that ice IOPs vary with temperatures due to changing microstructure. These differences result in changes in solar radiation transfer in the air-ice-ocean system, even with constant ice thickness, which agrees with field observations. For example, the extinction coefficient of bare ice decreases continuously from 1.6 to 0.7 m-1 from June through August and then increases (Light et al., 2008; Katlein et al., 2021). For 1-m thick ice, due to changing microstructure, transmitted radiation through ice increases by a factor of ~1.4 from June through August. This difference means ~10 W/m2 more radiation reaching the ocean water (assuming 100 W/m2 incident radiation on ice). In addition to seasonal differences, there are also inter-annual differences in ice IOPs. Figure 10 shows a relative difference in the scattering coefficient of 26.8% between 2008 and 2016. Similarly, the extinction coefficient of melting multiyear ice during SHEBA [~0.7 m-1, Grenfell et al. (2006)] was smaller than the observed value (~1.5 m-1) in Grenfell and Maykut (1977). These seasonal and inter-annual differences change the transmitted radiation through the ice. Using constant values derived from previous observations inevitably introduces uncertainties to sea-ice models.
Finally, the differences in sea-ice microstructures appear to affect the ice melt by changing the heat flux from the upper ocean, but not by directly absorbed radiation. This occurs because the variations in absorption during ice warming are not large compared to changes in transmittance (Figure 8B). This interpretation is also justified by Figure 10. Mayer et al. (2016) also demonstrated that most of the energy imbalance of the Arctic climate system warms the ocean and that a comparatively small fraction goes into sea-ice melting. Previous studies explained the increasing transmitted radiation into the Arctic Ocean by decreasing ice thickness (e.g. Perovich et al., 2020; Stroeve et al., 2021), but the microstructure of ice was ignored. The results in Figure 8, 10 imply that changing sea-ice microstructures alone clearly affect ice transmittance. Ice microstructures and visible ice properties (e.g., thickness, extent, etc.) would together influence the under-ice light field and the temperature of the upper ocean. As a result, the melting of sea ice from the bottom is affected by the warmer ocean. In addition to thinning, sea ice becomes porous with melting, which affects the IOPs of sea ice in turn. If the interaction between the sea-ice microstructure and the ocean are considered in future sea-ice models, the predicted decrease in ice thickness will be changed, possibly bringing modeled Arctic developments into better agreement with reality.
5 Conclusions
In this study, extensive investigations were conducted to present a quantitative view of how variable microstructure (gas bubbles, brine pockets, and PM) affect the IOPs and AOPs of sea ice. The results demonstrated that the volume and size of gas bubbles and brine pockets change ice IOPs. Furthermore, gas bubbles have a stronger effect on ice scattering capacity than brine pockets. PM is a powerful absorber in ice, and its deposition on ice can reduce transmittance. The influence of PM on albedo also depends on ice stratification. Our study of warming ice suggests that gas bubbles play an important role in the AOPs of melting ice. Differences in ice IOPs alone have been clearly shown to change the solar radiation through the ice. These findings suggest that the default values of the optical parameters used in current sea-ice models may need to be taken as variables. Considering the variations of ice microstructures is helpful to improve model accuracy and to understand the interactions between ice microstructures and ocean in the changing Arctic.
Future research on the dynamics of brine pockets and gas bubbles during summer warming would be most helpful for understanding the evolution of sea-ice IOPs. In particular, one major issue is the variability of the size and volume of gas bubbles when ice permeability increases. In addition, more observations of the composition and stratification of PM in ice are needed to understand its role in solar energy partitioning in the Arctic Ocean.
Data Availability Statement
The original contributions presented in the study are included in the article/Supplementary Material. Further inquiries can be directed to the corresponding author.
Author Contributions
MY initiated the manuscript and prepared all figures. All the authors discussed the methods and results, and edited the manuscript.
Funding
This study was funded by the National Key Research and Development Program of China (Grant number 2018YFA0605901), the National Natural Science Foundation of China (Grant numbers 41922045 and 41876213), and the Academy of Finland (Grant numbers 317999, 333889, and 325363), LiaoNing Revitalization Talents Program (XLYC2007033).
Conflict of Interest
The authors declare that the research was conducted in the absence of any commercial or financial relationships that could be construed as a potential conflict of interest.
Publisher’s Note
All claims expressed in this article are solely those of the authors and do not necessarily represent those of their affiliated organizations, or those of the publisher, the editors and the reviewers. Any product that may be evaluated in this article, or claim that may be made by its manufacturer, is not guaranteed or endorsed by the publisher.
Supplementary Material
The Supplementary Material for this article can be found online at: https://www.frontiersin.org/articles/10.3389/fmars.2022.861994/full#supplementary-material
References
Arndt S., Nicolaus M. (2014). Seasonal Cycle and Long-Term Trend of Solar Energy Fluxes Through Arctic Sea Ice. Cryosphere. 8 (6), 2219–2233. doi: 10.5194/tc-8-2219-2014
Briegleb B. P., Bitz C. M., Hunke E. C., Lipscomb W., Holland M. M., Schramm J. L., et al. (2004). Scientific Description of the Sea Ice Component in the Community Climate System Model. NCAR Tech, Note NCAR/TN-463_STR.
Briegleb B. P., Light B. (2007). A Delta-Eddington Multiple Scattering Parameterization for Solar Radiation in the Sea Ice Component of the Community Climate System Model (No. NCAR/TN-472+STR). Univ. Corp. Atmos. Res. doi: 10.5065/D6B27S71
Castellani G., Schaafsma F. L., Arndt S., Lange B. A., Peeken I., Ehrlich J., et al. (2020). Large-Scale Variability of Physical and Biological Sea-Ice Properties in Polar Oceans. Front. Mar. Sci. 7. doi: 10.3389/fmars.2020.00536
Castellani G., Veyssière G., Karcher M., Stroeve J., Banas S. N., Bouman A. H., et al. (2022). Shine a Light: Under-Ice Light and its Ecological Implications in a Changing Arctic Ocean. AMBIO. 51 (2), 307–317. doi: 10.1007/s13280-021-01662-3
Cox G. F. N., Weeks W. F. (1983). Equations for Determining the Gas and Brine Volumes in Sea-Ice Samples. J. Glaciol. 29 (102), 306–316. doi: 10.1017/S0022143000008364
Crabeck O., Galley R., Delille B., Else B., Geilfus N., Lemes M., et al. (2016). Imaging Air Volume Fraction in Sea Ice Using Non-Destructive X-Ray Tomography. Cryosphere. 10 (3), 1125–1145. doi: 10.5194/tc-10-1125-2016
Crabeck O., Galley R. J., Mercury L., Delille B., Tison J. L., Rysgaard S. (2019). Evidence of Freezing Pressure in Sea Ice Discrete Brine Inclusions and its Impact on Aqueous-Gaseous Equilibrium. J. Geophys. Res. 124 (3), 1660–1678. doi: 10.1029/2018JC014597
Curry J. A., Schramm J. L., Perovich D. K., Pinto J. O. (2001). Applications of Sheba/Fire Data to Evaluation of Snow/Ice Albedo Parameterizations. J. Geophys. Res.: Atmosphere 106 (D14), 15345–15355.
Dagsson-Waldhauserova P., Arnalds O., Olafsson H. (2014). Long-Term Variability of Dust Events in Icelan–2011). Atmos. Chem. Phys. 14 (24), 13411–13422. doi: 10.5194/acp-14-13411-2014
Ehn J. K., Papakyriakou T. N., Barber D. G. (2008). Inference of Optical Properties From Radiation Profiles Within Melting Landfast Sea Ice. J. Geophys. Res. 113, C9024. doi: 10.1029/2007JC004656
Frantz C. M., Light B., Farley S. M., Carpenter S. (2019). Physical and Optical Characteristics of Heavily Melted "Rotten" Arctic Sea Ice. Cryosphere. 13 (3), 775–793. doi: 10.5194/tc-2018-141
Grenfell T. C. (1983). A Theoretical Model of the Optical Properties of Sea Ice in the Visible and Near Infrared. J. Geophys. Res.: Ocean. 88 (C14), 9723–9735. doi: 10.1029/JC088iC14p09723
Grenfell T. C. (1991). A Radiative Transfer Model for Sea Ice With Vertical Structure Variations. J. Geophys. Res.: Ocean. 96 (C9), 16991–17001. doi: 10.1029/91JC01595
Grenfell T. C., Light B., Perovich D. K. (2006). Spectral Transmission and Implications for the Partitioning of Shortwave Radiation in Arctic Sea Ice. Ann. Glaciol. 44 (1), 1–6. doi: 10.3189/172756406781811763
Grenfell T. C., Maykut G. A. (1977). The Optical Properties of Ice and Snow in the Arctic Basin. J. Glaciol. 18 (80), 445–463. doi: 10.3189/S0022143000021122
Grenfell T. C., Perovich D. K. (2008). Incident Spectral Irradiance in the Arctic Basin During the Summer and Fall. J. Geophys. Res. 113, D12117. doi: 10.1029/2007JD009418
Grenfell T. C., Warren S. G. (1999). Representation of a Nonspherical Ice Particle by a Collection of Independent Spheres for Scattering and Absorption of Radiation. J. Geophys. Res. 104 (D24), 31697–31709. doi: 10.1029/1999JD900496
Hansen J. E., Travis L. D. (1974). Light Scattering in Planetary Atmosphere. Space. Sci. Rev. 16, 527–610. doi: 10.1007/BF00168069
Hobbs L., Banas N. S., Cohen J. H., Cottier F. R., Berge J., Varpe O. (2021). A Marine Zooplankton Community Vertically Structured by Light Across Diel to Interannual Timescales. Biol. Letter. 17 (2), 20200810. doi: 10.1098/rsbl.2020.0810
Holland M. M., Bailey D. A., Briegleb B. P., Light B., Hunke E. (2012). Improved Sea Ice Shortwave Radiation Physics in Ccsm4: The Impact of Melt Ponds and Aerosols on Arctic Sea Ice. J. Clim. 25 (5), 1413–1430. doi: 10.1175/JCLI-D-11-00078.1
Hudson S. R., Granskog M. A., Sundfjord A., Randelhoff A., Renner A. H. H., Divine D. V. (2013). Energy Budget of First-Year Arctic Sea Ice in Advanced Stages of Melt. Geophys. Res. Lett. 40 (11), 2679–2683. doi: 10.1002/grl.50517
Hunke E. C., Notz D., Turner A. K., Vancoppenolle M. (2011). The Multiphase Physics of Sea Ice: A Review for Model Developers. Cryosphere. 5 (4), 989–1009. doi: 10.5194/tc-5-989-2011
Jardon F. P., Vivier F., Vancoppenolle M., Lourenço A., Bouruet-Aubertot P., Cuypers Y. (2013). Full-Depth Desalination of Warm Sea Ice. J. Geophys. Res.: Ocean. 118 (1), 435–447. doi: 10.1029/2012JC007962
Kashiwase H., Ohshima K. I., Nihashi S., Eicken H. (2017). Evidence for Ice-Ocean Albedo Feedback in the Arctic Ocean Shifting to a Seasonal Ice Zone. Sci. Rep.-UK. 7 (1), 8170. doi: 10.1038/s41598-017-08467-z
Katlein C., Arndt S., Belter H. J., Castellani G., Nicolaus M. (2019). Seasonal Evolution of Light Transmission Distributions Through Arctic Sea Ice. J. Geophys. Res.: Ocean. 124 (8), 5418–5435. doi: 10.1029/2018JC014833
Katlein C., Valcic L., Lambert-Girard S., Hoppmann M. (2021). New Insights Into Radiative Transfer Within Sea Ice Derived From Autonomous Optical Propagation Measurements. Cryosphere. 15 (1), 183–198. doi: 10.5194/tc-15-183-2021
Leppäranta M., Manninen T. (1988). The Brine and Gas Content of Sea Ice With Attention to Low Salinities and High Temperature (Helsinki: Finnish Institute for Marine Research), 88–2, pp.
Light B., Eicken H., Maykut G. A., Grenfell T. C. (1998). The Effect of Included Particulates on the Spectral Albedo of Sea Ice. J. Geophys. Res. 103 (C12), 27739–27752. doi: 10.1029/98JC02587
Light B., Grenfell T. C., Perovich D. K. (2008). Transmission and Absorption of Solar Radiation by Arctic Sea Ice During the Melt Season. J. Geophys. Res. 113, C3023. doi: 10.1029/2006JC003977
Light B., Maykut G. A., Grenfell T. C. (2003). Effects of Temperature on the Microstructure of First-Year Arctic Sea Ice. J. Geophys. Res.: Ocean. 108 (C2), 3051. doi: 10.1029/2001JC000887
Light B., Maykut G. A., Grenfell T. C. (2004). A Temperature-Dependent, Structural-Optical Model of First-Year Sea Ice. J. Geophys. Res. 109, C6013. doi: 10.1029/2003JC002164
Light B., Perovich D. K., Webster M. A., Polashenski C., Dadic R. (2015). Optical Properties of Melting First-Year Arctic Sea Ice. J. Geophys. Res.: Ocean. 120 (11), 7657–7675. doi: 10.1002/2015JC011163
Lu P., Cao X., Wang Q., Leppäranta M., Cheng B., Li Z. (2018). Impact of a Surface Ice Lid on the Optical Properties of Melt Ponds. J. Geophys. Res.: Ocean. 123 (11), 8313–8328. doi: 10.1029/2018JC014161
Lu P., Leppäranta M., Cheng B., Li Z. (2016). Influence of Melt-Pond Depth and Ice Thickness on Arctic Sea-Ice Albedo and Light Transmittance. Cold Reg. Sci. Technol. 124, 1–10. doi: 10.1016/j.coldregions.2015.12.010
Malinka A., Zege E., Istomina L., Heygster G., Spreen G., Perovich D., et al. (2018). Reflective Properties of Melt Ponds on Sea Ice. Cryosphere. 12 (6), 1921–1937. doi: 10.5194/tc-12-1921-2018
Marks A. A., King M. D. (2013). The Effects of Additional Black Carbon on the Albedo of Arctic Sea Ice: Variation With Sea Ice Type and Snow Cover. Cryosphere. 7 (4), 1193–1204. doi: 10.5194/tc-7-1193-2013
Mayer M., Haimberger L., Pietschnig M., Storto A. (2016). Facets of Arctic Energy Accumulation Based on Observations and Reanalyses 2000-2015. Geophys. Res. Lett. 43 (19), 10, 410–420, 429. doi: 10.1002/2016GL070557
Mobley C. D., Cota G. F., Grenfell T. C., Maffione R. A., Pegau W. S., Perovich D. K. (1998). Modeling Light Propagation in Sea Ice. IEEE T. Geosci. Rem. 36 (5), 1743–1749. doi: 10.1109/36.718642
Mullen P. C., Warren S. G. (1988). Theory of the Optical-Properties of Lake Ice. J. Geophys. Res. 93 (D7), 8403–8414. doi: 10.1029/jd093id07p08403
Nicolaus M., Hoppmann M., Arndt S., Hendricks S., Katlein C., Nicolaus A., et al. (2021). Snow Depth and Air Temperature Seasonality on Sea Ice Derived From Snow Buoy Measurements. Front. Mar. Sci. 8. doi: 10.3389/fmars.2021.655446
Nicolaus M., Katlein C., Maslanik J., Hendricks S. (2012). Changes in Arctic Sea Ice Result in Increasing Light Transmittance and Absorption. Geophys. Res. Lett. 39 (24), L24501. doi: 10.1029/2012GL053738
Palmer M. A., van Dijken G. L., Mitchell B. G., Seegers B. J., Lowry K. E., Mills M. M., et al. (2013). Light and Nutrient Control of Photosynthesis in Natural Phytoplankton Populations From the Chukchi and Beaufort Seas, Arctic Ocean. Limnol. Oceanog. 58 (6), 2185–2205. doi: 10.4319/lo.2013.58.6.2185
Perovich D. K. (2002). Seasonal Evolution of the Albedo of Multiyear Arctic Sea Ice. J. Geophys. Res. 107 (C10), 8044. doi: 10.1029/2000JC000438
Perovich D. K., Gow A. J. (1996). A Quantitative Description of Sea Ice Inclusions. J. Geophys. Res. 101 (C8), 18327–18343. doi: 10.1029/96JC01688
Perovich D. K., Grenfell T. C. (1981). Laboratory Studies of the Optical Properties of Young Sea Ice. J. Glaciolog. 27 (96), 331–346. doi: 10.1017/S0022143000015410
Perovich D., Light B., Dickinson S. (2020). Changing Ice and Changing Light: Trends in Solar Heat Input to the Upper Arctic Ocean From 1988 to 2014. Ann. Glaciol. 61 (83), 401–407. doi: 10.1017/aog.2020.62
Perovich D. K., Nghiem S. V., Markus T., Schweiger A. (2007). Seasonal Evolution and Interannual Variability of the Local Solar Energy Absorbed by the Arctic Sea Ice–Ocean System. J. Geophys. Res. 112, C3005. doi: 10.1029/2006JC003558
Pistone K., Eisenman I., Ramanathan V. (2014). Observational Determination of Albedo Decrease Caused by Vanishing Arctic Sea Ice. Proc. Natl. Acad. Sci. 111 (9), 3322–3326. doi: 10.1073/pnas.1318201111
Stroeve J., Notz D. (2018). Changing State of Arctic Sea Ice Across All Seasons. Environ. Res. Lett. 13 (10), 103001. doi: 10.1088/1748-9326/aade56
Stroeve J., Vancoppenolle M., Veyssiere G., Lebrun M., Castellani G., Babin M., et al. (2021). A Multi-Sensor and Modeling Approach for Mapping Light Under Sea Ice During the Ice-Growth Season. Front. Mar. Sci. 7. doi: 10.3389/fmars.2020.592337
Taskjelle T., Hudson S. R., Granskog M. A., Hamre B. (2017). Modelling Radiative Transfer Through Ponded First-Year Arctic Sea Ice With a Plane-Parallel Model. Cryosphere. 11 (5), 2137–2148. doi: 10.5194/tc-11-2137-2017
Timmermans M. L. (2015). The Impact of Stored Solar Heat on Arctic Sea Ice Growth. Geophys. Res. Lett. 42 (15), 6399–6406. doi: 10.1002/2015GL064541
Vancoppenolle M., Madec G., Thomas M., McDougall T. J. (2019). Thermodynamics of Sea Ice Phase Composition Revisited. J. Geophys. Res.: Ocean. 124 (1), 615–634. doi: 10.1029/2018JC014611
Veyssière G., Castellani G., Wilkinson J., Karcher M., Hayward A., Stroeve J. C., et al. (2022). Under-Ice Light Field in the Western Arctic Ocean During Late Summer. Front. Earth Sci. 9. doi: 10.3389/feart.2021.643737
Wang Q., Lu P., Leppäranta M., Cheng B., Zhang G., Li Z. (2020). Physical Properties of Summer Sea Ice in the Pacific Sector of the Arctic During 2008–2018. J. Geophys. Res.: Ocean. 125 (9). doi: 10.1029/2020JC016371
Keywords: Arctic, sea ice, microstructure, optical properties, radiation transfer
Citation: Yu M, Lu P, Cheng B, Leppäranta M and Li Z (2022) Impact of Microstructure on Solar Radiation Transfer Within Sea Ice During Summer in the Arctic: A Model Sensitivity Study. Front. Mar. Sci. 9:861994. doi: 10.3389/fmars.2022.861994
Received: 25 January 2022; Accepted: 05 April 2022;
Published: 02 May 2022.
Edited by:
Leandro Ponsoni, Danish Meteorological Institute (DMI), DenmarkReviewed by:
Giulia Castellani, Alfred Wegener Institute Helmholtz Centre for Polar and Marine Research (AWI), GermanyTerry Whitledge, Retired, Fairbanks, AK, United States
Copyright © 2022 Yu, Lu, Cheng, Leppäranta and Li. This is an open-access article distributed under the terms of the Creative Commons Attribution License (CC BY). The use, distribution or reproduction in other forums is permitted, provided the original author(s) and the copyright owner(s) are credited and that the original publication in this journal is cited, in accordance with accepted academic practice. No use, distribution or reproduction is permitted which does not comply with these terms.
*Correspondence: Peng Lu, bHVwZW5nQGRsdXQuZWR1LmNu