 Ángela Fontán-Bouzas
 Umberto Andriolo
 Paulo A. Silva
 Paulo Baptista4
95% of researchers rate our articles as excellent or good
Learn more about the work of our research integrity team to safeguard the quality of each article we publish.
Find out more
ORIGINAL RESEARCH article
Front. Mar. Sci. , 08 April 2022
Sec. Coastal Ocean Processes
Volume 9 - 2022 | https://doi.org/10.3389/fmars.2022.861569
This article is part of the Research Topic Coastal Environment in a Changing World View all 11 articles
At coasts, sandy beach-dune systems act as natural barriers to environmental forcing, preventing coastal flooding and protecting coastal communities. In the context of coastal studies, it is fundamental to identify beach-dune sectors exposed to wave impact to support coastal management and suggest soft engineering interventions. This work examines the morphodynamics of the Mira beach-dune system on the northern-central littoral of Portugal over the winter 2016-2017. Coupling topographic data with the estimation of wave runup and total water level (TWL) timeseries, we proposed an operational framework to spot the beach-dune system sectors most vulnerable to dune collision and overwash. The highest topographic variations occurred in the northern sector of the study area, where overwash events occurred due to low dune crest (DC) elevation. The dune toe (DT) was frequently collided by waves in the central sector, where the upper beach profile was the most variable during winter. Overall, wave collision and overwash events were registered not only during storms, but also during spring tides and mild wave conditions. Results highlight the importance of uploading the intertidal beach slope when computing the total water levels on wave-dominated mesotidal sandy beaches, and therefore, the need for a consistent monitoring program of the coastal zones. Findings of this work also supported the coastal management of beach-dune systems, where regional authorities need to restore dune ridges to prevent further overwash events and erosion. The presented framework can be applied to build a beach-dune system vulnerability map in response to wave forecast and predicted sea-level rise.
The coastal zone is the highly dynamic interface between land, sea and atmosphere, important both in the environmental and socioeconomic contexts (e.g., Martínez et al., 2007). Currently, climate changes threaten most of the coastlines worldwide (e.g., Hinkel et al., 2013; Ranasinghe, 2016; Vousdoukas et al., 2020), and an erosional trend has been observed at about 30% worldwide in the last decade (Luijendijk et al., 2018; Mentaschi et al., 2018). The estimation of the vulnerability of coastal areas to erosion and hazard has received considerable attention. Most of works focused on the long-term prediction and evaluation of factors induced by climate changes, such as sea level rise (Alexandrakis and Poulos, 2014; Vousdoukas et al., 2018; Rocha et al., 2020; Sekovski et al., 2020) and storm occurrence (Beniston et al., 2007; Vousdoukas et al., 2016). However, it is of interest to assess the coastal vulnerability also in the short-term, since drastic changes may occur abruptly on the high dynamic coastal environment, and immediate mitigation measures may be needed. Among coastal features, sandy beach-dune systems occur along most global coastlines (Martínez et al., 2008). Beach-dune systems act as natural barriers to environmental forcing, prevent flooding of landward areas (Durán et al., 2016; Pagán et al., 2019) and islands (Matias et al., 2010; Timmons et al., 2010; Fontán-Bouzas et al., 2019; Matias et al., 2019; Blanco-Chao et al., 2020), and protect coastal communities (Ciavola et al., 2014). Tide, waves and wind dominate coastal processes, whereas beaches and dunes interact with a dynamic and delicate equilibrium. Beach configuration prevents the wave impact on dunes, while dunes play the role of sand reservoir for natural beach nourishment (Houser and Ellis, 2013; Jackson et al., 2019). Nevertheless, environmental forcing and human interventions (e.g. coastal structures) may affect this morphological equilibrium (Karunarathna et al., 2014; Castelle et al., 2015; Dissanayake et al., 2015; Flor-Blanco et al., 2021). Common morphodynamic analysis generally considers the spatial variation of proxy indicators such as coastline (Harley et al., 2014; Splinter et al., 2014; Angnuureng et al., 2017), beach width and volume (Phillips et al., 2017; Wiggins et al., 2019; Santos C. J. et al., 2020), along with beach profiles variability (Ludka et al., 2015; Turner et al., 2016; Eichentopf et al., 2020). However, the analysis of beach slope changes and wave hydrodynamics, coupled with geomorphological features such as dune toe and crest elevations, is crucial to understand morphodynamic processes (Del Río et al., 2012; Armaroli et al., 2013; Masselink and Van Heteren, 2014; Wernette et al., 2016), and to evaluate the wave impact on a beach-dune system (Sallenger, 2000; Vousdoukas et al., 2012; Masselink and Van Heteren, 2014; Castelle and Harley, 2020; Masselink, 2021). In particular, Sallenger (2000) proposed a scale of impact on a beach-dune system, based on four regimes: i) swash regime, when the maximum wave runup is confined to the foreshore; ii) collision regime, when waves impact the dune face, iii) overwash regime, when waves overtop the dune crest and iv) breaching and inundation regime. This work analyses the morphodynamics of the 2300 m long-shore Mira beach-dune system on the North Atlantic Portuguese coast during the winter 2016-2017. Beach and dune topographic surveys were performed by two conventional methods over five months on a fortnightly basis. We propose an operational framework that couples temporal and spatial morphological changes to total water level (TWL) dynamics on the foreshore i) to understand the influence of the beach profile configuration in preventing and/or determining wave impact on dunes and ii) to identify the dune sectors most vulnerable to wave collision and overwash regimes, following Sallenger (2000). This work provided a valid support to local authorities for the choice and implementation of soft engineering interventions, which were further adopted to restore the vulnerable sectors of the Mira beach dune ridge. This study also aims to shed light on the understanding of sedimentary deficit beach-dune systems including run-up processes to improve models and long-term predictions of their future evolution under a climate change scenario. The presented showcase can be implemented worldwide for improving coastal vulnerability assessment and support coastal management.
Mira beach (Praia de Mira; 40°27’28.76”N, 8°48’10.74”W) is a sandy beach-dune system located on the western Portuguese coast facing the North Atlantic Ocean (Figure 1). The study area extends 2300 m long-shore with NNE-SSW orientation, limited northward by a 200 m-long groin, and backed by a dune system with crest elevation varying between 5 and 16 m (Figure 1). The study site belongs to a sandy barrier eastward limited by the Aveiro lagoon. The dune system is the geomorphologic element that protects several socio-economic activities located eastward of these dunes. The beach is composed of medium-sized sand with relatively spatial uniformity (D50 ∼ 0.4 mm) and supplied by a natural N-S littoral drift (Silva et al., 2009; Stronkhorst et al., 2018; Fernández-Fernández et al., 2019). Tides are semidiurnal and the tidal range oscillates between 2.8 m and 1.2 m for the spring and neaps tides, respectively (Antunes and Taborda, 2009; Baptista et al., 2014). Mira beach-dune system processes are dominated by the North Atlantic swell, with a mean annual significant wave height (Hs) of 2 m and wave periods between 7 s and 15 s mainly concentrated in the interval between W and NNW directions (Dodet et al., 2010; Oliveira et al., 2018). During winter seasons (from November to March), the mean Hs is approximate 3 m, and storm height can exceed 8 m (Silva et al., 2009). Previous multi-annual studies have observed that this littoral is subjected to coastline retreat between 5 and 8 m/year (Baptista et al., 2014 and Ponte Lira et al., 2016, respectively). This progressive long-term erosional trend, in which the frontal dunes have been progressively destroyed, under the action of winter waves, has been caused by the deficit in sediment supply from Douro River, which decreased from 1.5 million m3/year to about 0.25 million m3/year during the last decade (Coelho et al., 2009; Marinho et al., 2018). In this coastal stretch, beach erosion effects have been propagated southward due to sediment blockage by manmade structures (Costa and Coelho, 2013; Pereira and Coelho, 2013). The northern sector of the beach has been the more affected, largely induced by the groin built in 2003 (Baptista et al., 2014). During 2015, a nourishment was carried out on the northern Mira beach-dune system sector (Marinho et al., 2019).
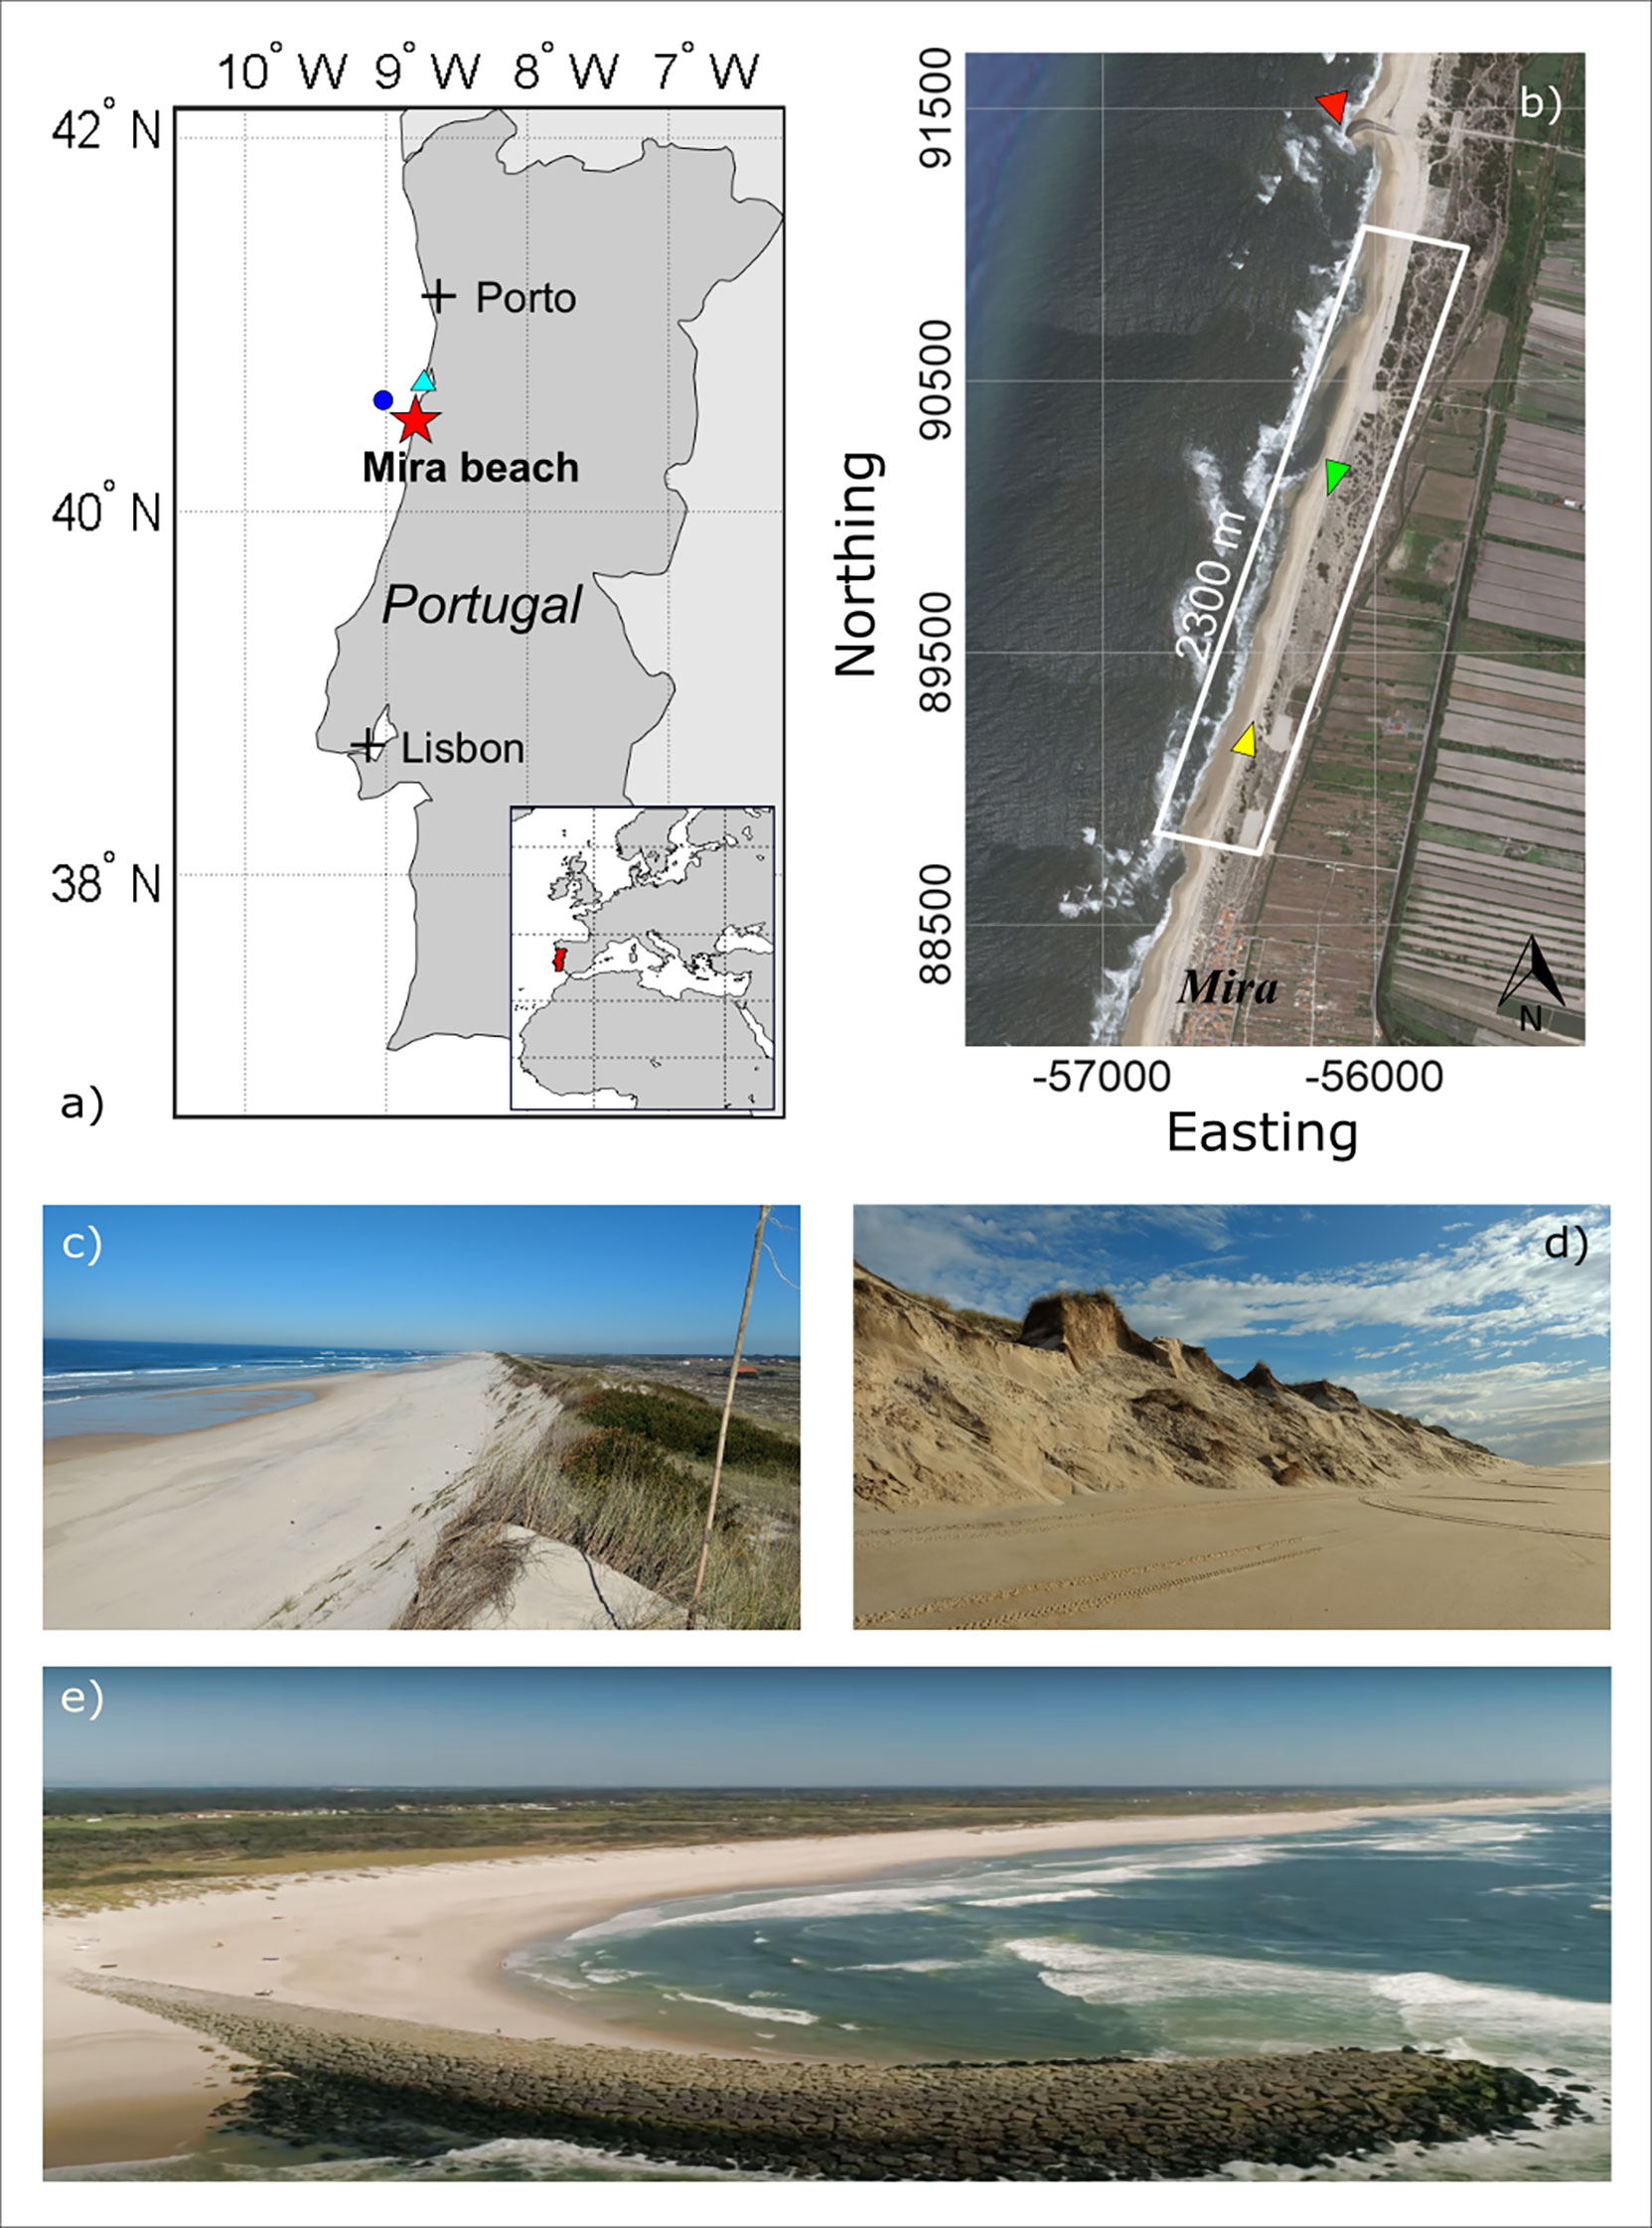
Figure 1 Study site. (A) study site location (red star), SIMAR wave point (blue dot) and tidal gauge (cyan triangle); (B) map of Mira beach-dune system and study area (white rectangle). Yellow, green and red triangles indicate the location of pictures in (C–E), respectively.
A beach-dune morphology survey program was performed from October 2016 to February 2017 during the winter. A four-wheel motor quad (hereinafter ATV, Figure 2B), equipped with three high-grade Global Positioning System receivers and a laser distance sensor (INSHORE monitoring system - Baptista et al., 2011), was used to carry out three-dimensional beach topographic surveys. Subaerial beach area elevation (Figure 2A) was surveyed at a frequency of 1 s with vertical errors of 0.02–0.03 m and less than 0.01 horizontal errors (Baptista et al., 2011).
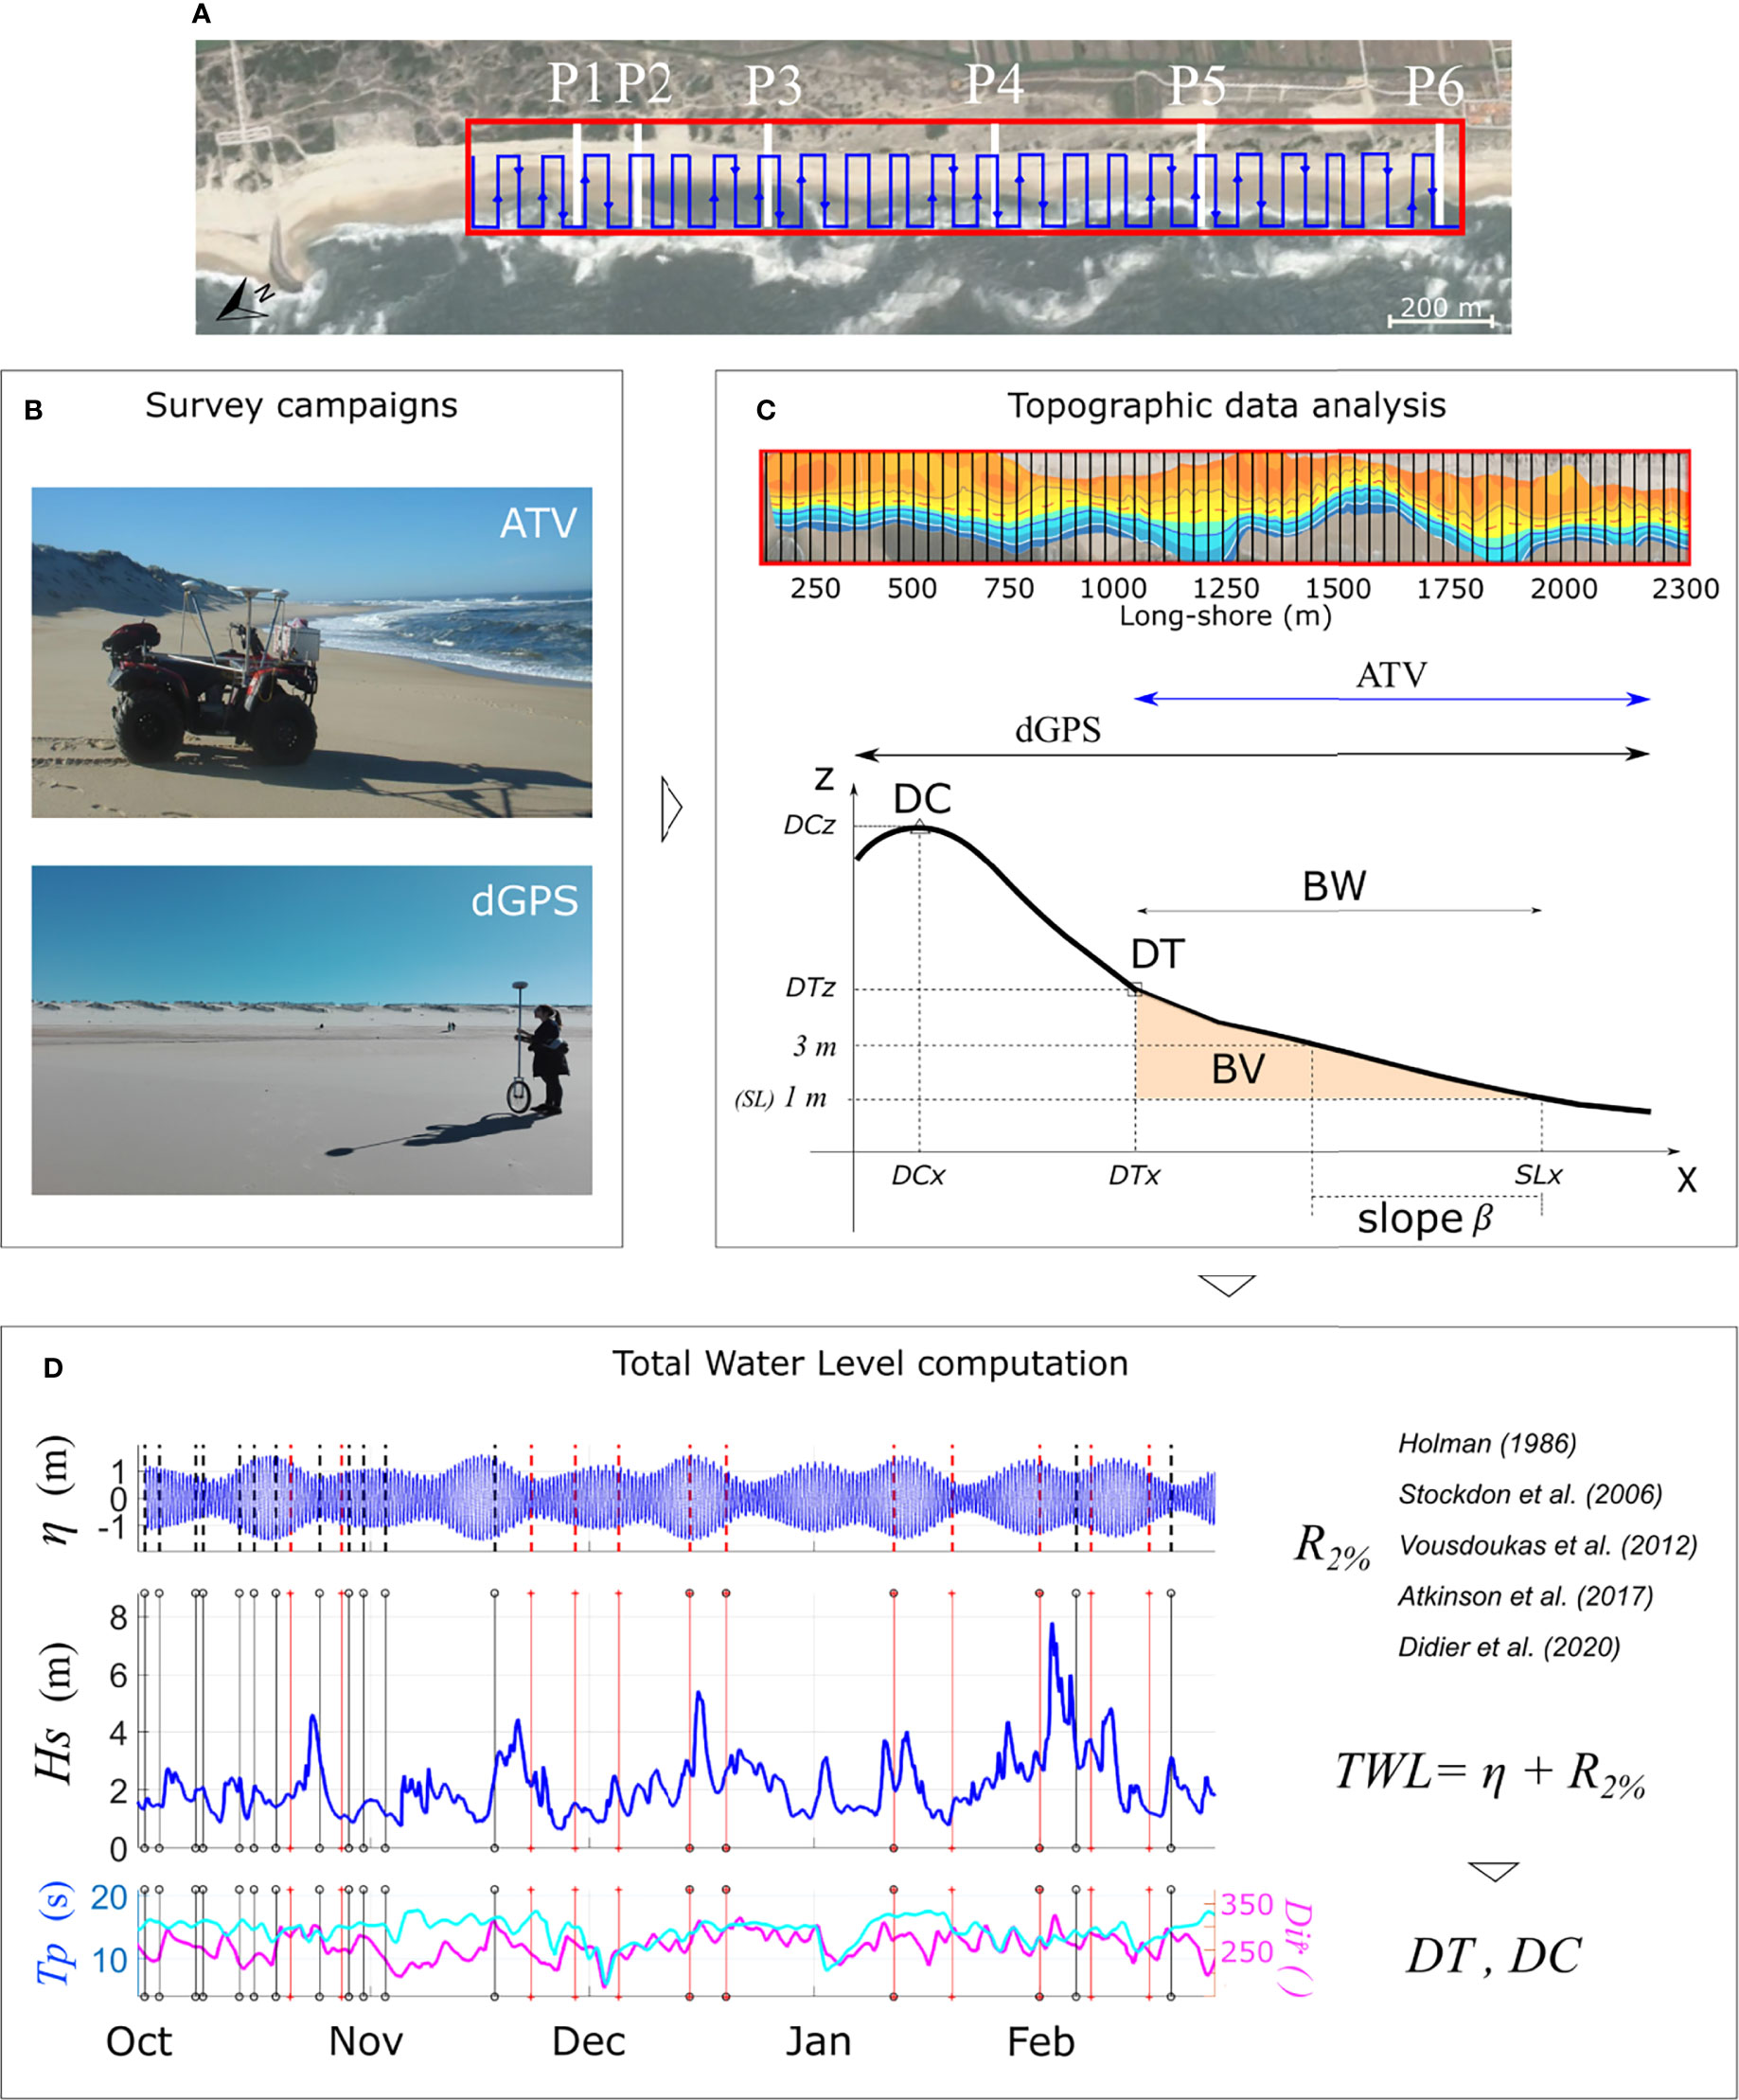
Figure 2 Workflow and hydrodynamics. (A) Mira beach-dune system aerial photo and study area (red rectangle), with all-terrain vehicle (ATV) trajectories example (blue lines) on the subaerial beach, and locations of the six beach profiles (P1-P6, white lines) surveyed by the differential Global Positioning System (dGPS); (B) pictures of ATV (upper) and dGPS (lower) systems; (C) example of digital elevation model (DEM, upper) and series of transects (black lines) used to retrieve morphological indicators. Idealized beach profile (lower) with indicators used for the analysis:position of the shoreline (SLx), dune toe (DT), dune crest (DC), intertidal beach slope β (retrieved considering the profile sector between SL and 3 m elevation), beach width (BW) and beach volume (BV); (D) hydrodynamic data with tidal elevation (η), significant wave height (Hs), wave peak period (Tp) and wave direction (Dir). Black and red vertical lines indicate the dates of ATV and dGPS surveys, respectively. Wave runup and tidal elevation were combined to compute total water level (TWL) timeseries (right), eventually coupled to DC and DT elevations for evaluating beach-dune vulnerability.
In the post-processing phase, for each survey dataset, using more than 5,000 topographic points, the collected points were spatially interpolated on a regular 1x1 m grid using the geostatistical Kriging method of Surfer Golden Software to obtain the digital elevation models (DEM) with 0.08–0.12 vertical (RMS) accuracy (Figure 2C). The whole dataset was homogenized, clipping each produced DEM to the same area extent. Besides the ATV surveys, one differential Global Positioning System (dGPS) receiver was used by an operator to obtain cross-shore transects elevation between the low tide limit and the backdune (Figure 2B). Transects were numbered from 1 to 6, starting from the northern sector of the beach (Figure 2A). The final topographic dataset comprised 18 DEMs (from the ATV surveys) and 72 beach-dune profiles, 12 for each of the six considered transects. On average, we produced three DEMs and collected two beach-dune profiles per month (Figure 2D). Yet, surveys were also performed before and after storms, to better describe the changes induced by the most energetic events. In addition topographical data collected by the COSMO programme (https://cosmo.apambiente.pt) was used to provide the morphological evolution and nourishment works effects after monitoring topographical dataset.
DEM dataset was used to retrieve the beach width (BW), the beach volume (BV) and the intertidal beach slope, while P1-P6 beach profiles were exploited to describe the dune characteristics. Moreover, a total amount of 230 transects were extracted from DEMs, with an offset of 10 m (Figure 2C). An ad hoc automated algorithm was developed to automatise the analysis.
The BW was considered as the subaerial beach horizontal distance between the location of shoreline (SL, 1 m) and the most landward points collected by the ATV, approximately coinciding with the dune toe (DT) location (Figure 2C). The BV was computed as the area underneath the BW, between the SL and DT elevation.
From the dGPS cross-shore transects P1-P6, the dune crest location (DC) was recognised as the point with the maximum elevation (Figure 2C). The location and elevation of DT were identified as the first point with local maximum concave curvature seaward the DC, found as the local minima of the beach profile first derivative (similarly to Diamantidou et al., 2020 and Gonçalves et al., 2020). For both DEMs and cross-shore transects, the intertidal beach slope was found as the average of the first derivative values considering the beach profile comprised between the SL (1 m) and 3 m elevations (Gonçalves et al., 2020).
Offshore wave conditions (Figure 2D) were obtained from the hindcast WAM numerical model at the SIMAR point 1044062 (40.50° N; 9.00° W) 10 km from the coast. The dataset, provided by the Spanish State port authority (http://www.puertos.es/, Pilar et al., 2008), was composed of hourly significant wave height (Hs), wave peak period (Tp), wave direction (Dir) for the period in analysis.
To complete the study of hydrodynamics, the time series of total water level (TWL) excursion on the beach slope was computed following Sallenger (2000) as:
Where η is the mean sea level, and R2% is the wave runup. The mean sea level η was the hourly average of the tidal level (Figure 2D) measured by the Aveiro tidal gauge (Figure 1), which included both astronomical tide and storm surge.
The R2% indicates the vertical swash extent exceeded by 2% on the beach. Many predictors have been developed over the past decades based on field and laboratory experiments, generally parametrizing R2% as a function of offshore wave conditions (HS and wavelength LS) and the intertidal beach slope β (Gomes da Silva et al., 2020 and references therein). For the computation of R2%, we considered five among the most common and recent formulas (Table 1) derived and from field measurements dataset collected by coastal video monitoring on sandy beaches, namely Holman (1986); Stockdon et al. (2006); Vousdoukas et al. (2012); Atkinson et al. (2017) and Didier et al. (2020). Besides being compiled over a wide range of hydrodynamic conditions and beach states, the considered formulas incorporate the wave setup component. Of note that for the computation of R2%, the intertidal beach slope β was updated for each profile measured over the monitored period.
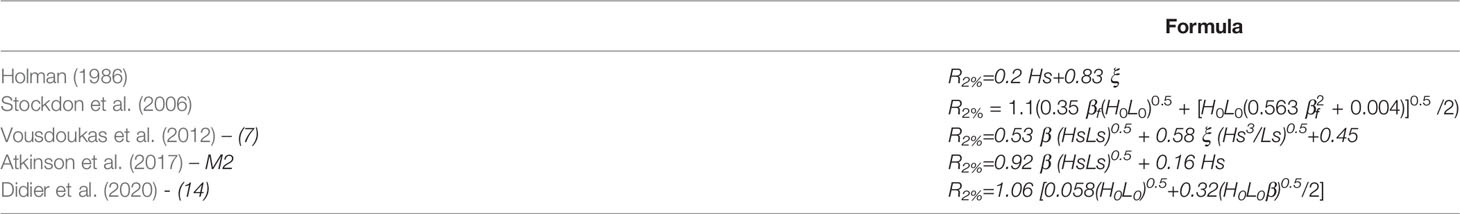
Table 1 Wave runup R2% formulas, based on offshore wave significant height (Hs), offshore wavelength (Ls), beach slope (β) and Iribarren number (ξ).
The morphological parameters (BW and BV) were analysed to understand the long-shore beach topographical changes. The six beach transects and the respective dune characteristics (DT and DC), along with the intertidal beach slope, were used to verify the wave impact on the dune ridge, coupling the modelled TWL timeseries to the spatial information collected by the surveys. Finally, the beach slope over the long-shore, derived from DEM dataset, was used to compute the TWL excursion over the long-shore extent.
To characterise the wave impact on the beach-dune system, we adopted the Storm Impact Scale (SIS) presented by Sallenger (2000), which considered distinct impact regimes according to the relation between the TWL, the DT and DC heights. For example, in the collision regime the SIS=TWL/DC ranges between DT/DC and 1.
Figure 3 shows the generated DEMs on a monthly basis, and the analysis of beach width (BW) and beach volume (BV) evolution.
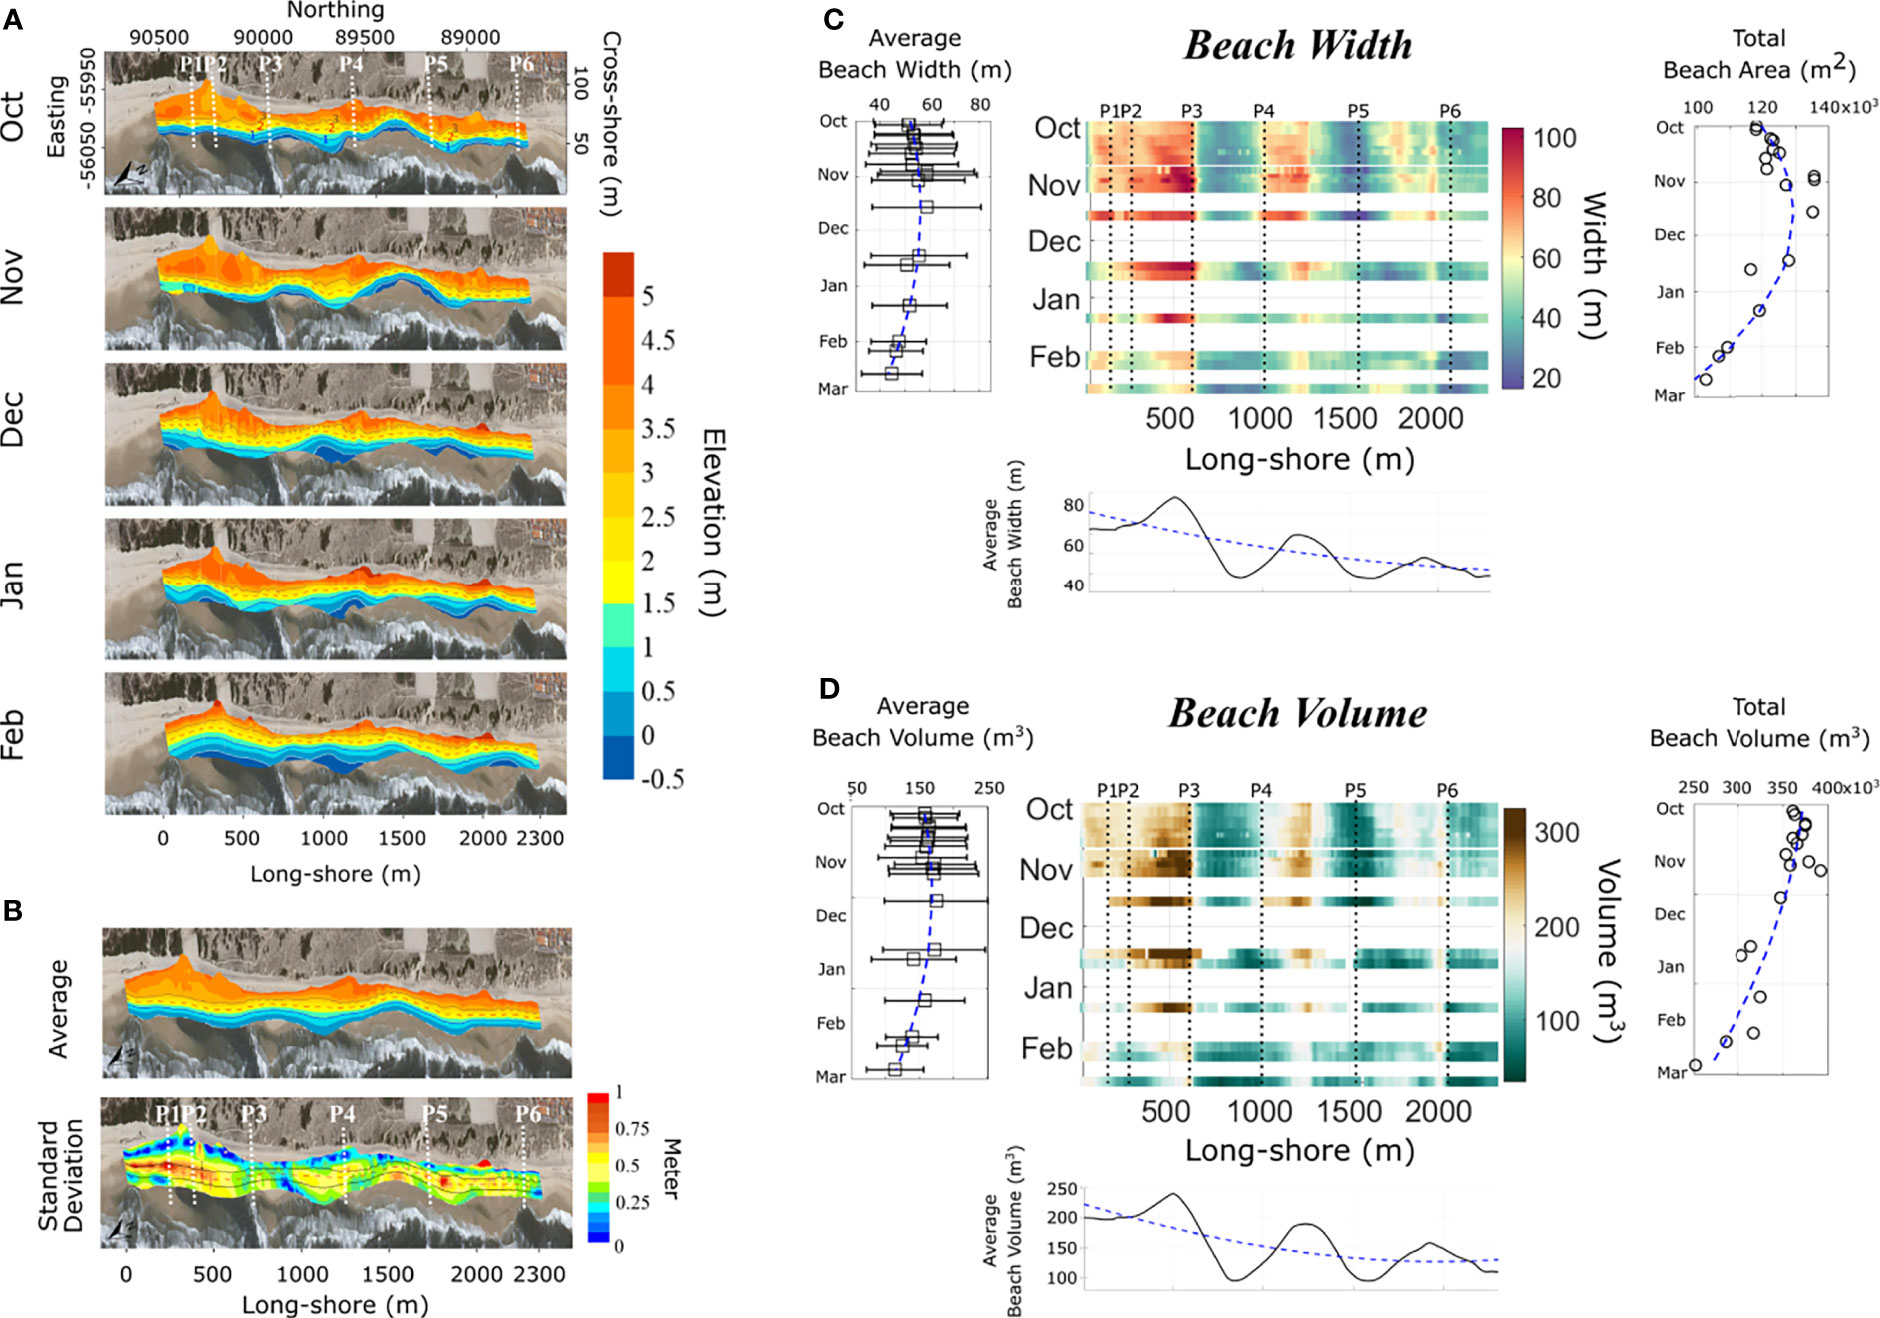
Figure 3 Beach width and beach volume changes. (A) Digital elevation models (DEMs) of subaerial beach obtained by ATV surveys, on a monthly basis; (B) average (upper) and standard deviation (lower) values considering DEMs on a monthly basis. Common to a) and b), dashed orange line indicates the 2 m elevation contour, while solid black lines the contours of 1 m (seaward) and 3 m (landward) elevations; (C) beach width (BW) evolution over time and space (central panel), average BW over time (left), average BW over space (lower) and total beach area evolution over time (right); (D) beach volume (BV) evolution over time and space (central panel), average BV over time (left), average BV over space (lower) and total BV over time (right).
The long-shore was characterised by the presence of beach mega-cusps, with long-shore embayments spacing between 500 m and 700 m, and horns protruding zones with an elevation of about 3 m (Figure 3A). The shortest BW and lowest BV values corresponded to the locations of the embayments. Over the winter, the mega-cusps gradually disappeared, resulting in more homogeneous BW and BV values over the long-shore. The standard deviation of the beach surface elevation (Figure 3B) revealed that the intertidal zone, which was considered to retrieve the beach slope (1-3 m), was the most variable, with the highest changes in the northern sector (about 1 m).
During the monitoring period, Hs varied between 0.6 and 7 m, with a mean value of 1.9 m, while Tp between 6 and 18 s, with a mean value of 12 s. These values are in agreement with the characteristic wave climate at the study site. The average BW (Figure 3C) increased from October (60 m) to November (80 m) and then decreased till the end of February (40 m). Overall, the subaerial beach surface diminished about 20% over the winter. The BV was most variable in the northern and central sectors, increasing till middle November, whereas it did not change significantly in the southern sector (Figure 3D). The BV was about 400.000 m3 at the start of winter, and decreased of about 27% with a constant trend in February.
Figure 4 shows the results of the 12 surveys of the six cross-shore transects P1-P6. From P1 to P4, the presence of beach berm determined the highest volume values, already observed in Figure 3, during the early winter months. Over the monitored period, the beach profile became smoother with a gentler slope. On P5 and P6, instead, the beach profiles did not change significantly. Overall, the DT elevation varied between 4 m (P2) and 6 m (P6), while the DC was between 5.5 m (P2) and 15.2 m (P6). The foredune slope differed among profiles, with the steepest gradient in the central part of the beach (from P3 to P5).
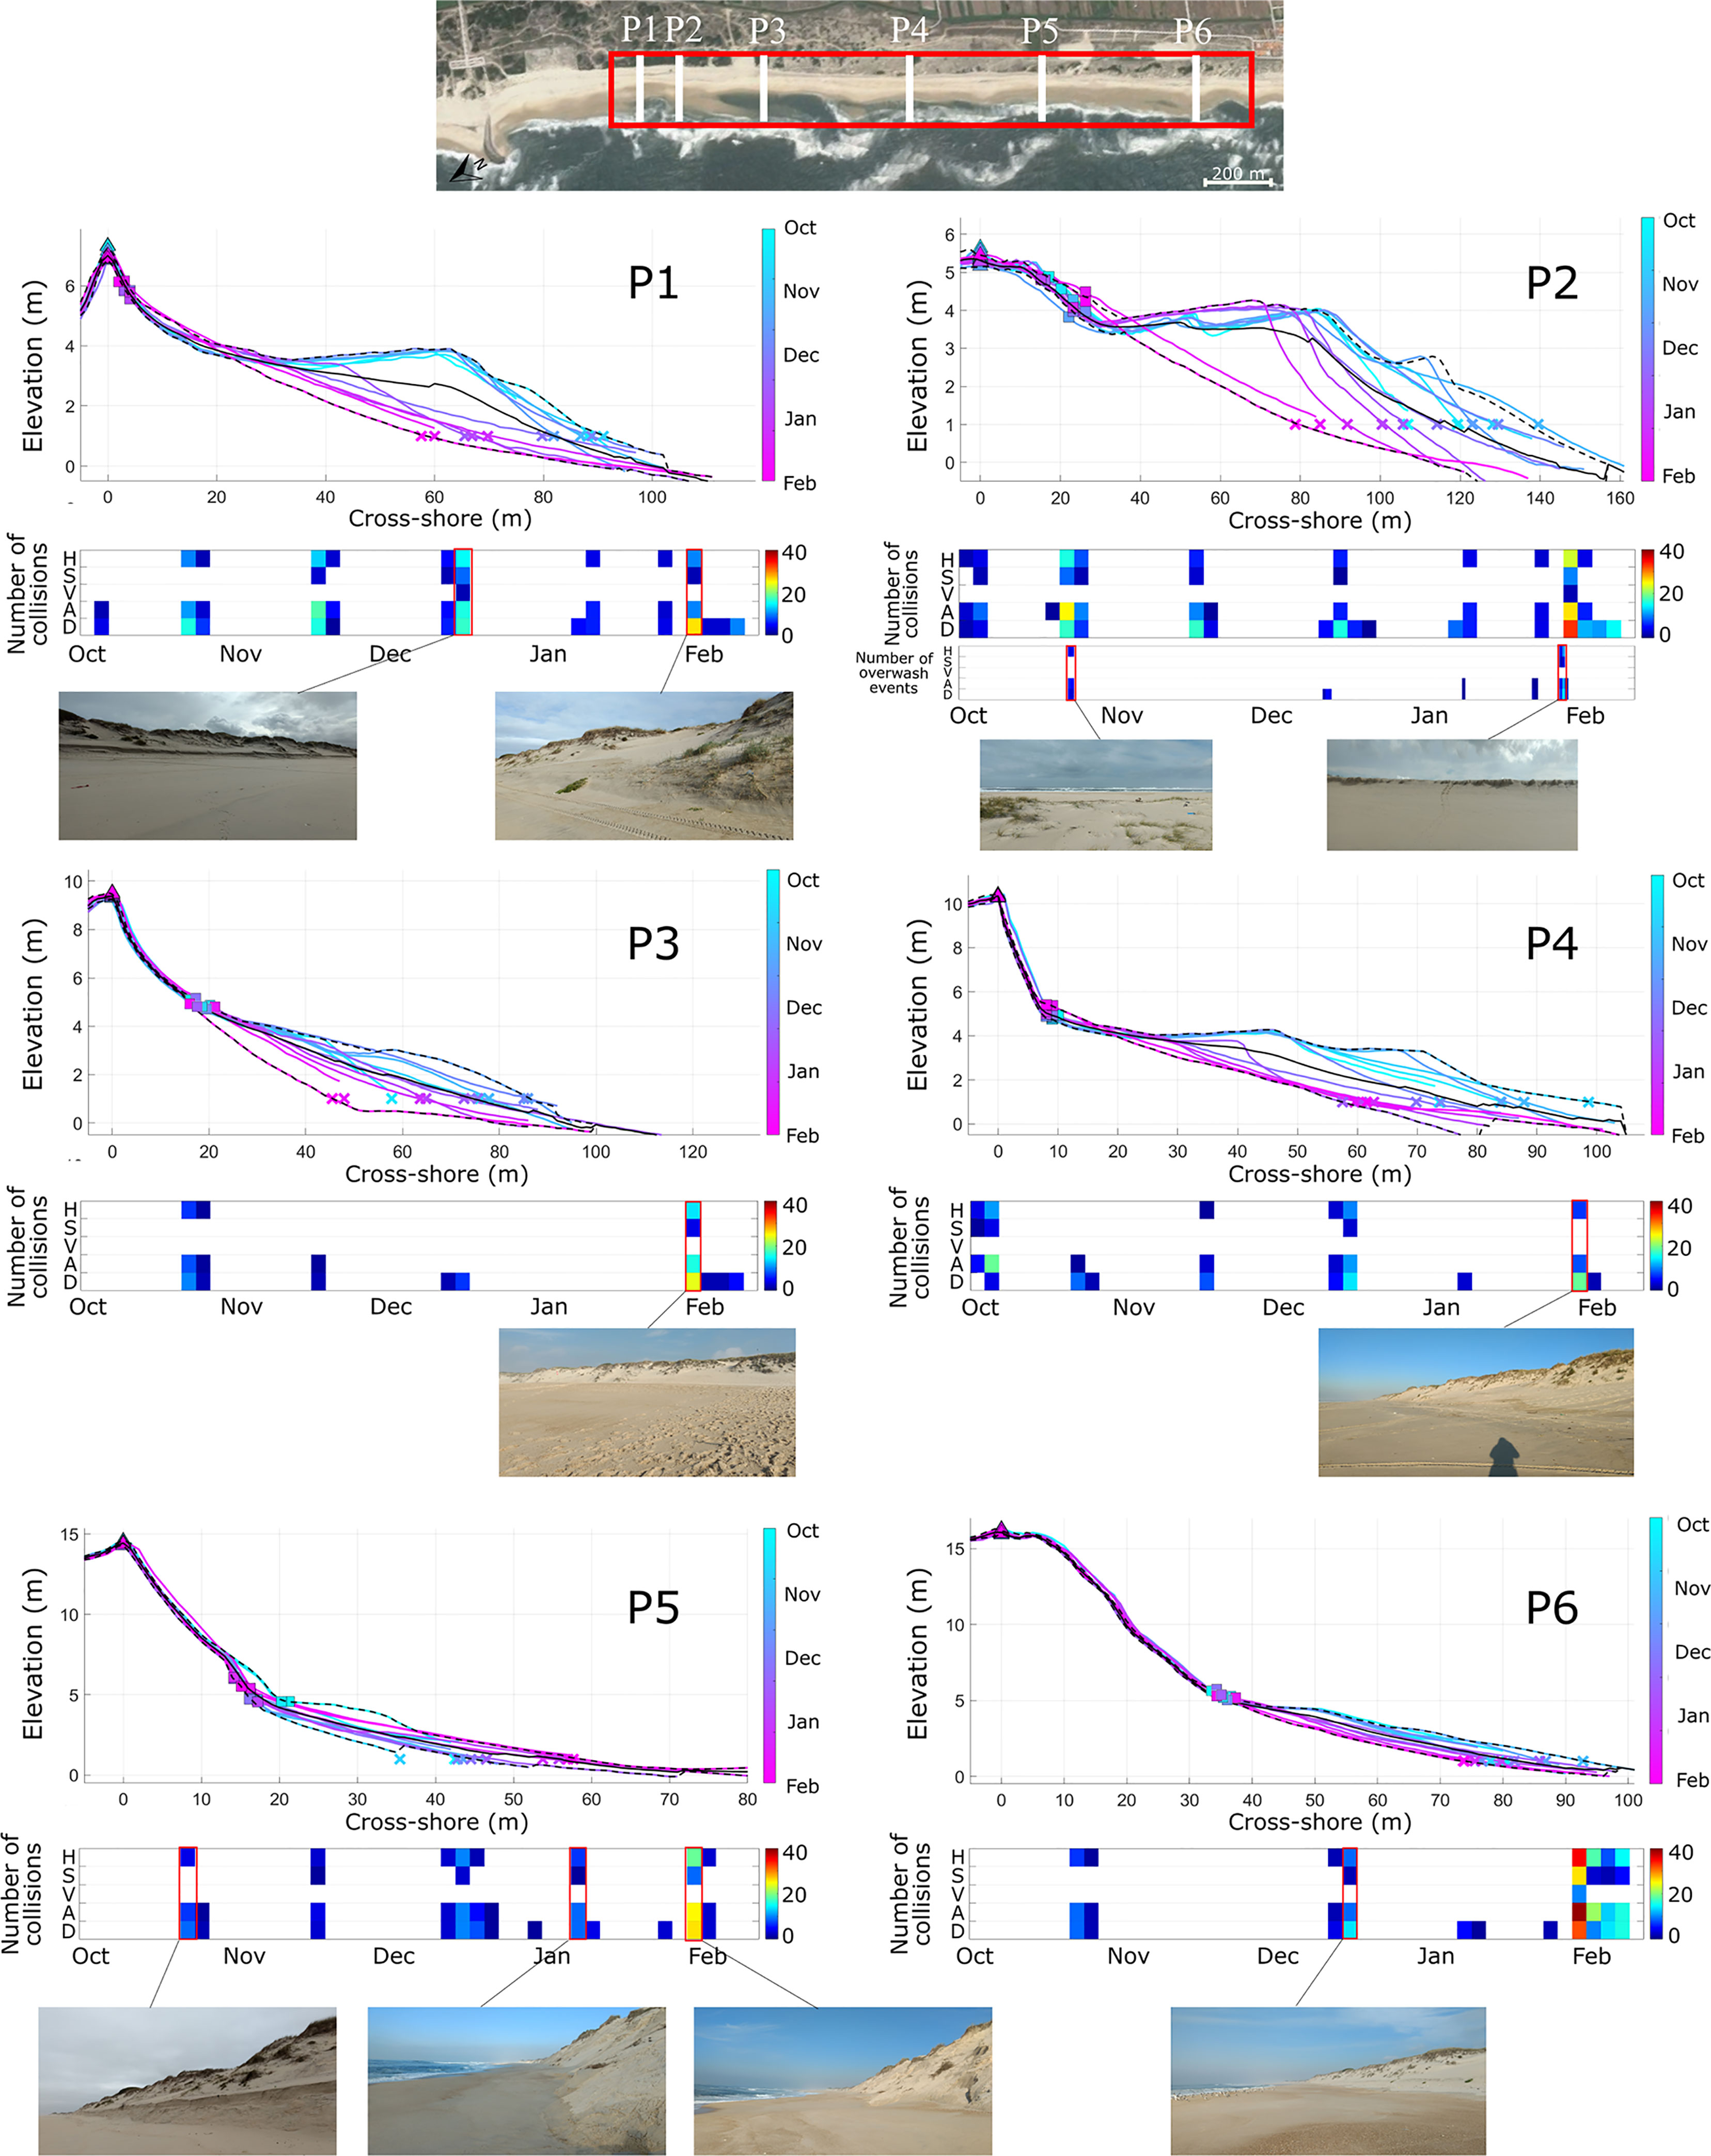
Figure 4 Beach profiles changes and total water level (TWL) timeseries. Upper: beach transect location (white lines) within the study area (red rectangle). For each of the six profiles, colors refer to chronological order of surveys (see colorbar), while black line indicates the average profile. Squares and triangles indicate the dune toe (DT) and dune crest (DC), respectively, while crosses the shoreline (SL, 1 m). Below each profile plot, graph shows the number of DT collisions and overwash (registered only on P2) based on Sallenger (2000) method computed considering the five R2% formulas. Letters stand for the initials name of formulas, see Table 1).
Figure 4 also shows the number of collisions calculated considering i) the TWL based on the five R2% formulas (Table 1), ii) the updated intertidal beach slope iii) the updated DT elevation, on a three-days basis. In the central part of the beach, P3 and P4 were less collided than the northern (P1 and P2) and southern (P5 and P6) profiles.
The analysis of TWL timeseries coupling morphologic features after Sallenger verify the foredune variability and scarped front dunes (P1, P3 on December, P4 Jan 2017 and P5 Oct 2016) and the signature of previous swash events up in the dune (P1 P4 Dec 2016, P5 Jan and Feb 2017). Regarding P2, Figure 4 shows evidence of overwash events collected during the high-frequency field surveys. It was possible to verify the occurrence of overwash events during the storm event in the early February, with the presence of microliter on the foredune, and the observation of the typical overwash fan on the backdune (Figure 5).
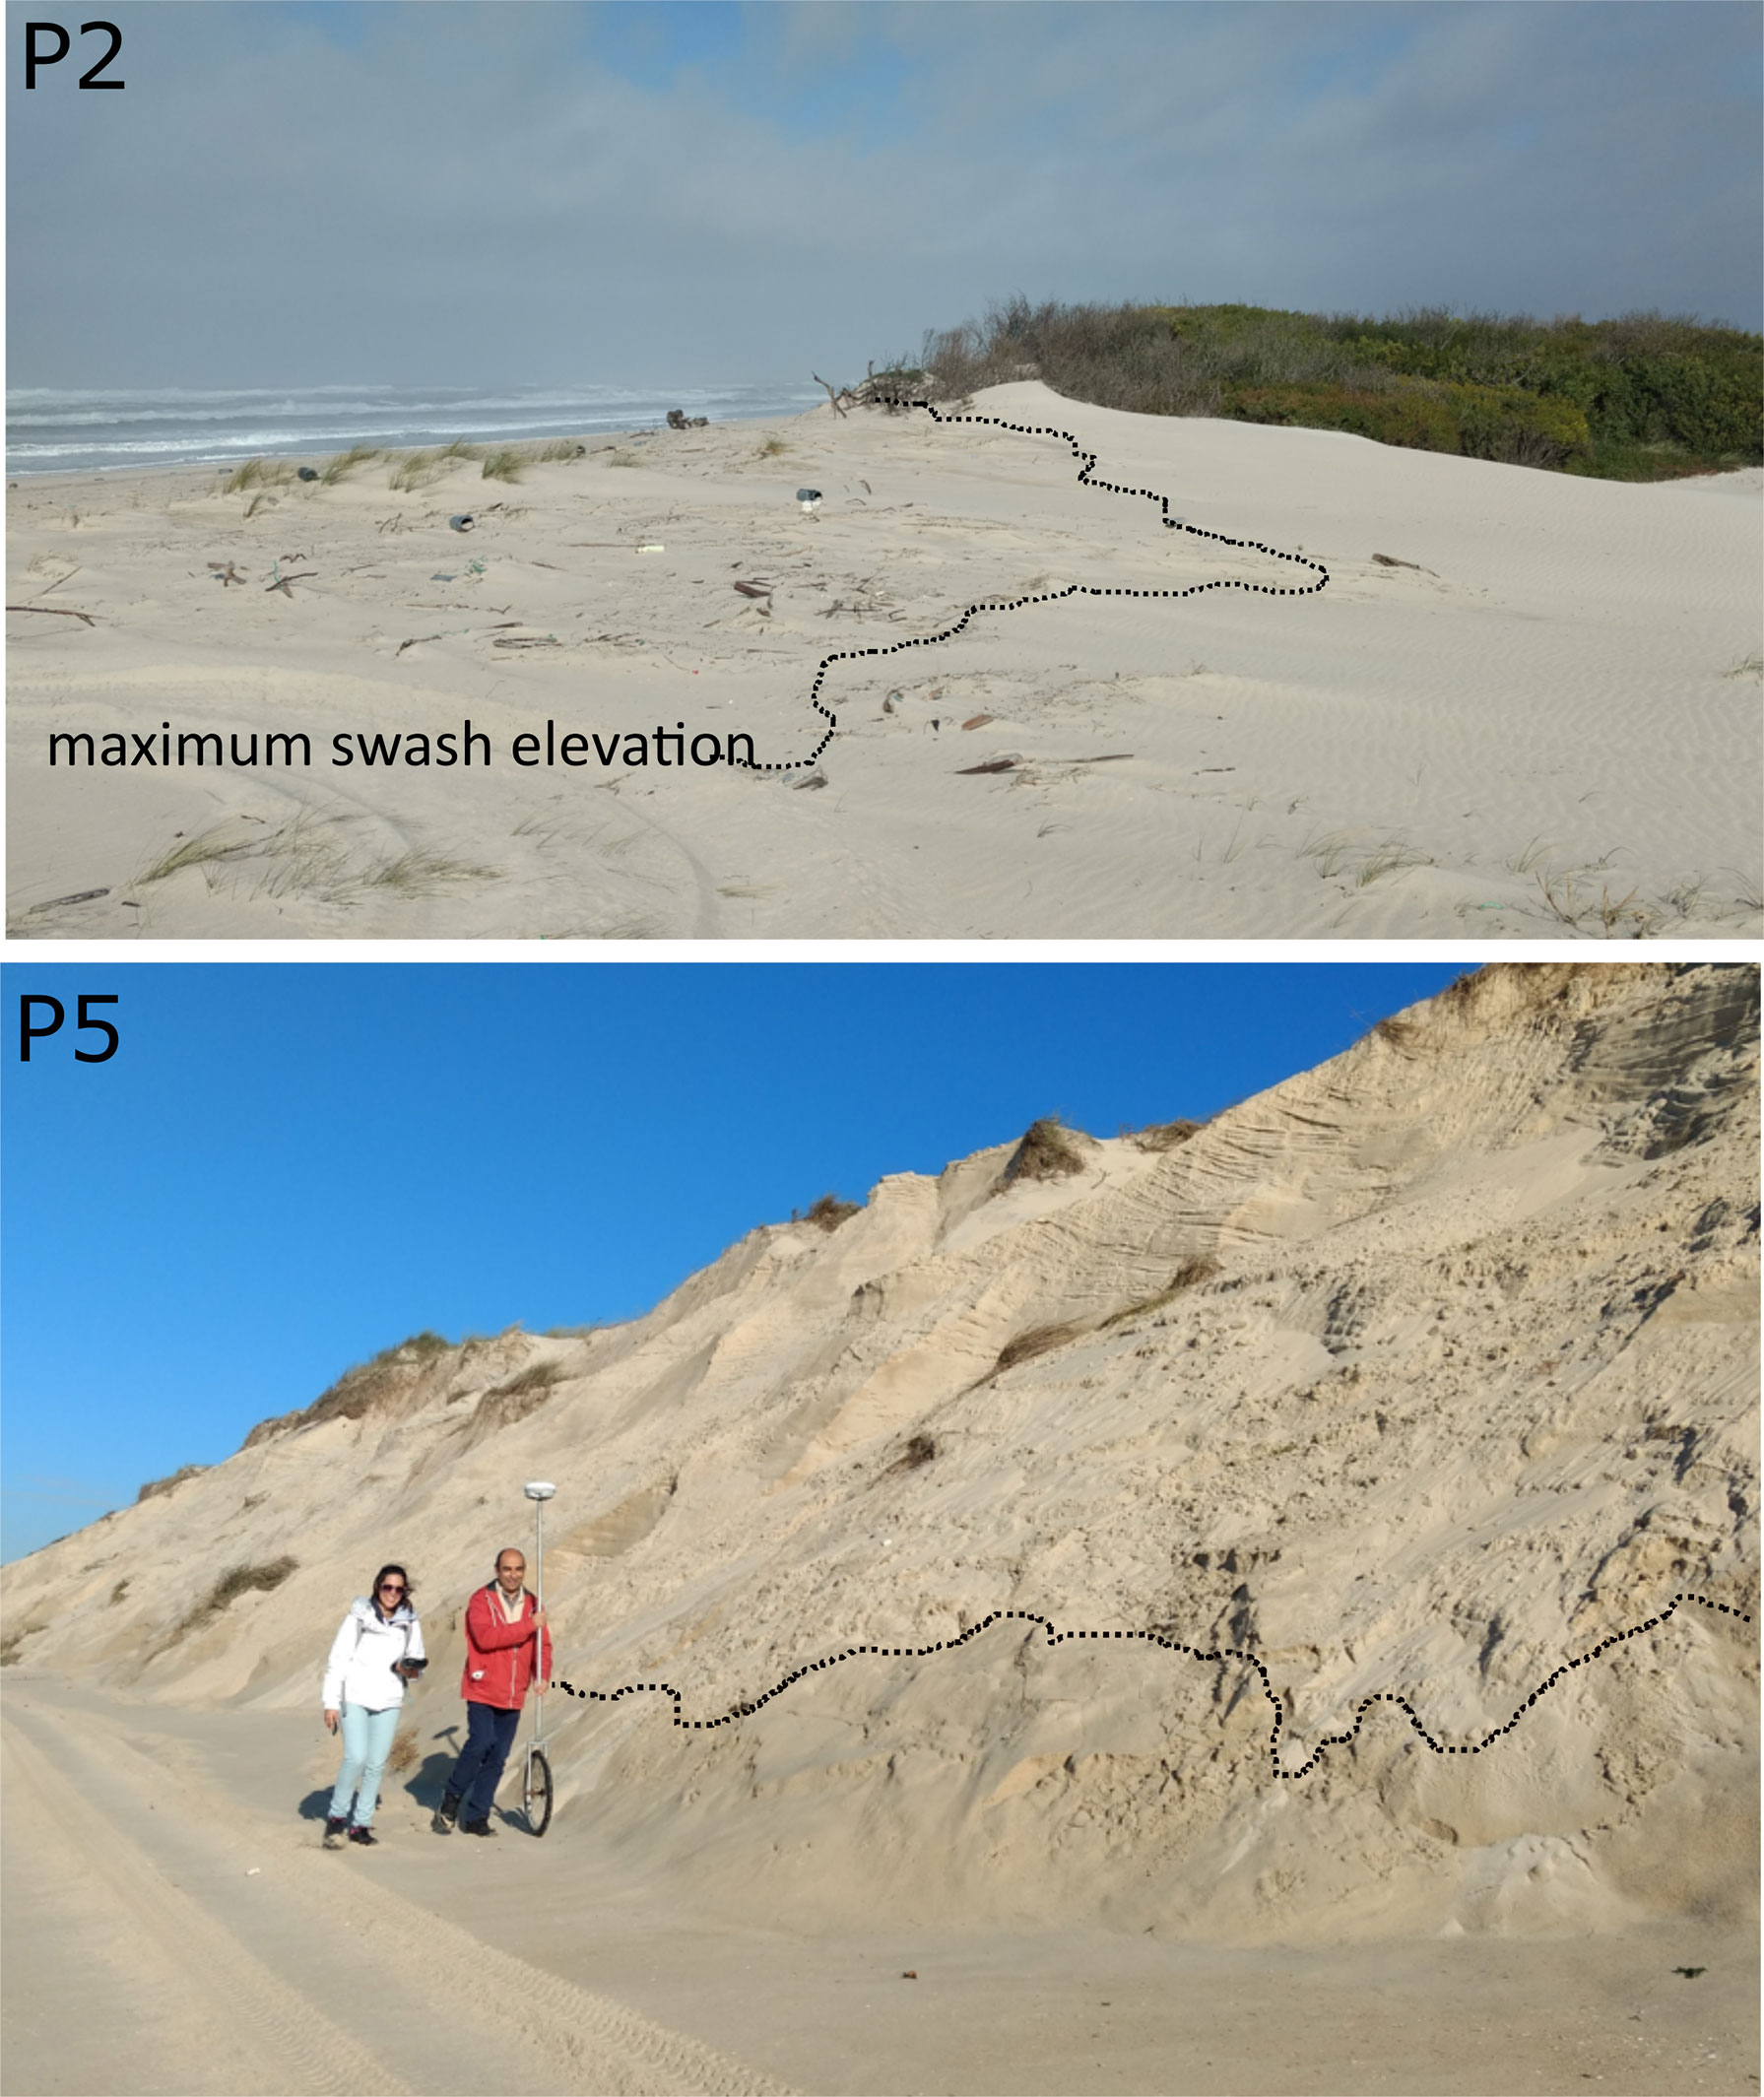
Figure 5 Observations on P2 and P5 dune-beach profiles of the maximum swash during the previous high tide. The limit between dry and wet sand shows the level reached by the total water level in this period (February 06, 2017).
The TWL estimated with the Stockdon et al. (2006) and Vousdoukas et al. (2012) formulations, did not indicate overwash events, suggesting that these formulations underestimated R2%. On the other hand, the ones computed according to Didier et al. (2020) methodology predicted overwash during the December storm, which was not observed during the field inspection. Finally, Holman (1986) and Atkinson et al. (2017) R2% formulations estimate a TWL in the overwash regime, which is in agreement with field observations (Figure 5)
Similar prediction accuracy was registered for P5. The dune retreat observed at the start of the monitoring period denotes a collision regime, with a TWL higher than the DT. This was correctly predicted by Holman (1986) and Atkinson et al. (2017) R2% formulations. Instead, the formula from Didier et al. (2020) still overestimated the R2%, while Stockdon et al. (2006) and Vousdoukas et al. (2012) formulations slightly underestimated collision.
Overall, evidence collected in the field and the comparison among different R2% formulas for TWL computations (Figures 4, 5) confirmed the good performance of Holman (1986) and Atkinson et al. (2017) when applied in the field, as already pointed out by works specifically dedicated to evaluate the general accuracy of different R2% predictions (e.g., Gomes da Silva et al., 2020). Given this, we further considered Atkinson et al. (2017) to describe TWL over the whole beach long-shore extent.
Using data obtained by the ATV for the whole long-shore extent, Figures 6A shows the intertidal beach slope variation, along with DT and DC average elevations. The beach slope varied between 0.05 and 0.12. In October, the average slope was about 0.1, with the highest long-shore variation, and decreased almost regularly over the monitored period. At the end of winter season, the intertidal beach slope was spatially more homogeneous, with an average value of 0.06 changing from reflective to dissipative beach state. Averaged-over-time beach slope was lowest in the central part, coinciding with the mega-cusp embayment, and generally higher on the northern and southern sectors. The minimum values of beach slope were lowest on the northern sector and linearly increased till the southern highest value. The highest points collected by the ATV coincided with the DT elevation retrieved by profiling surveys. Iribarren number (Battjes, 1988) had a median value of 0.95, with an interquartile between 0.2 and 2. However, it reached 3.5 during the most energetic events.
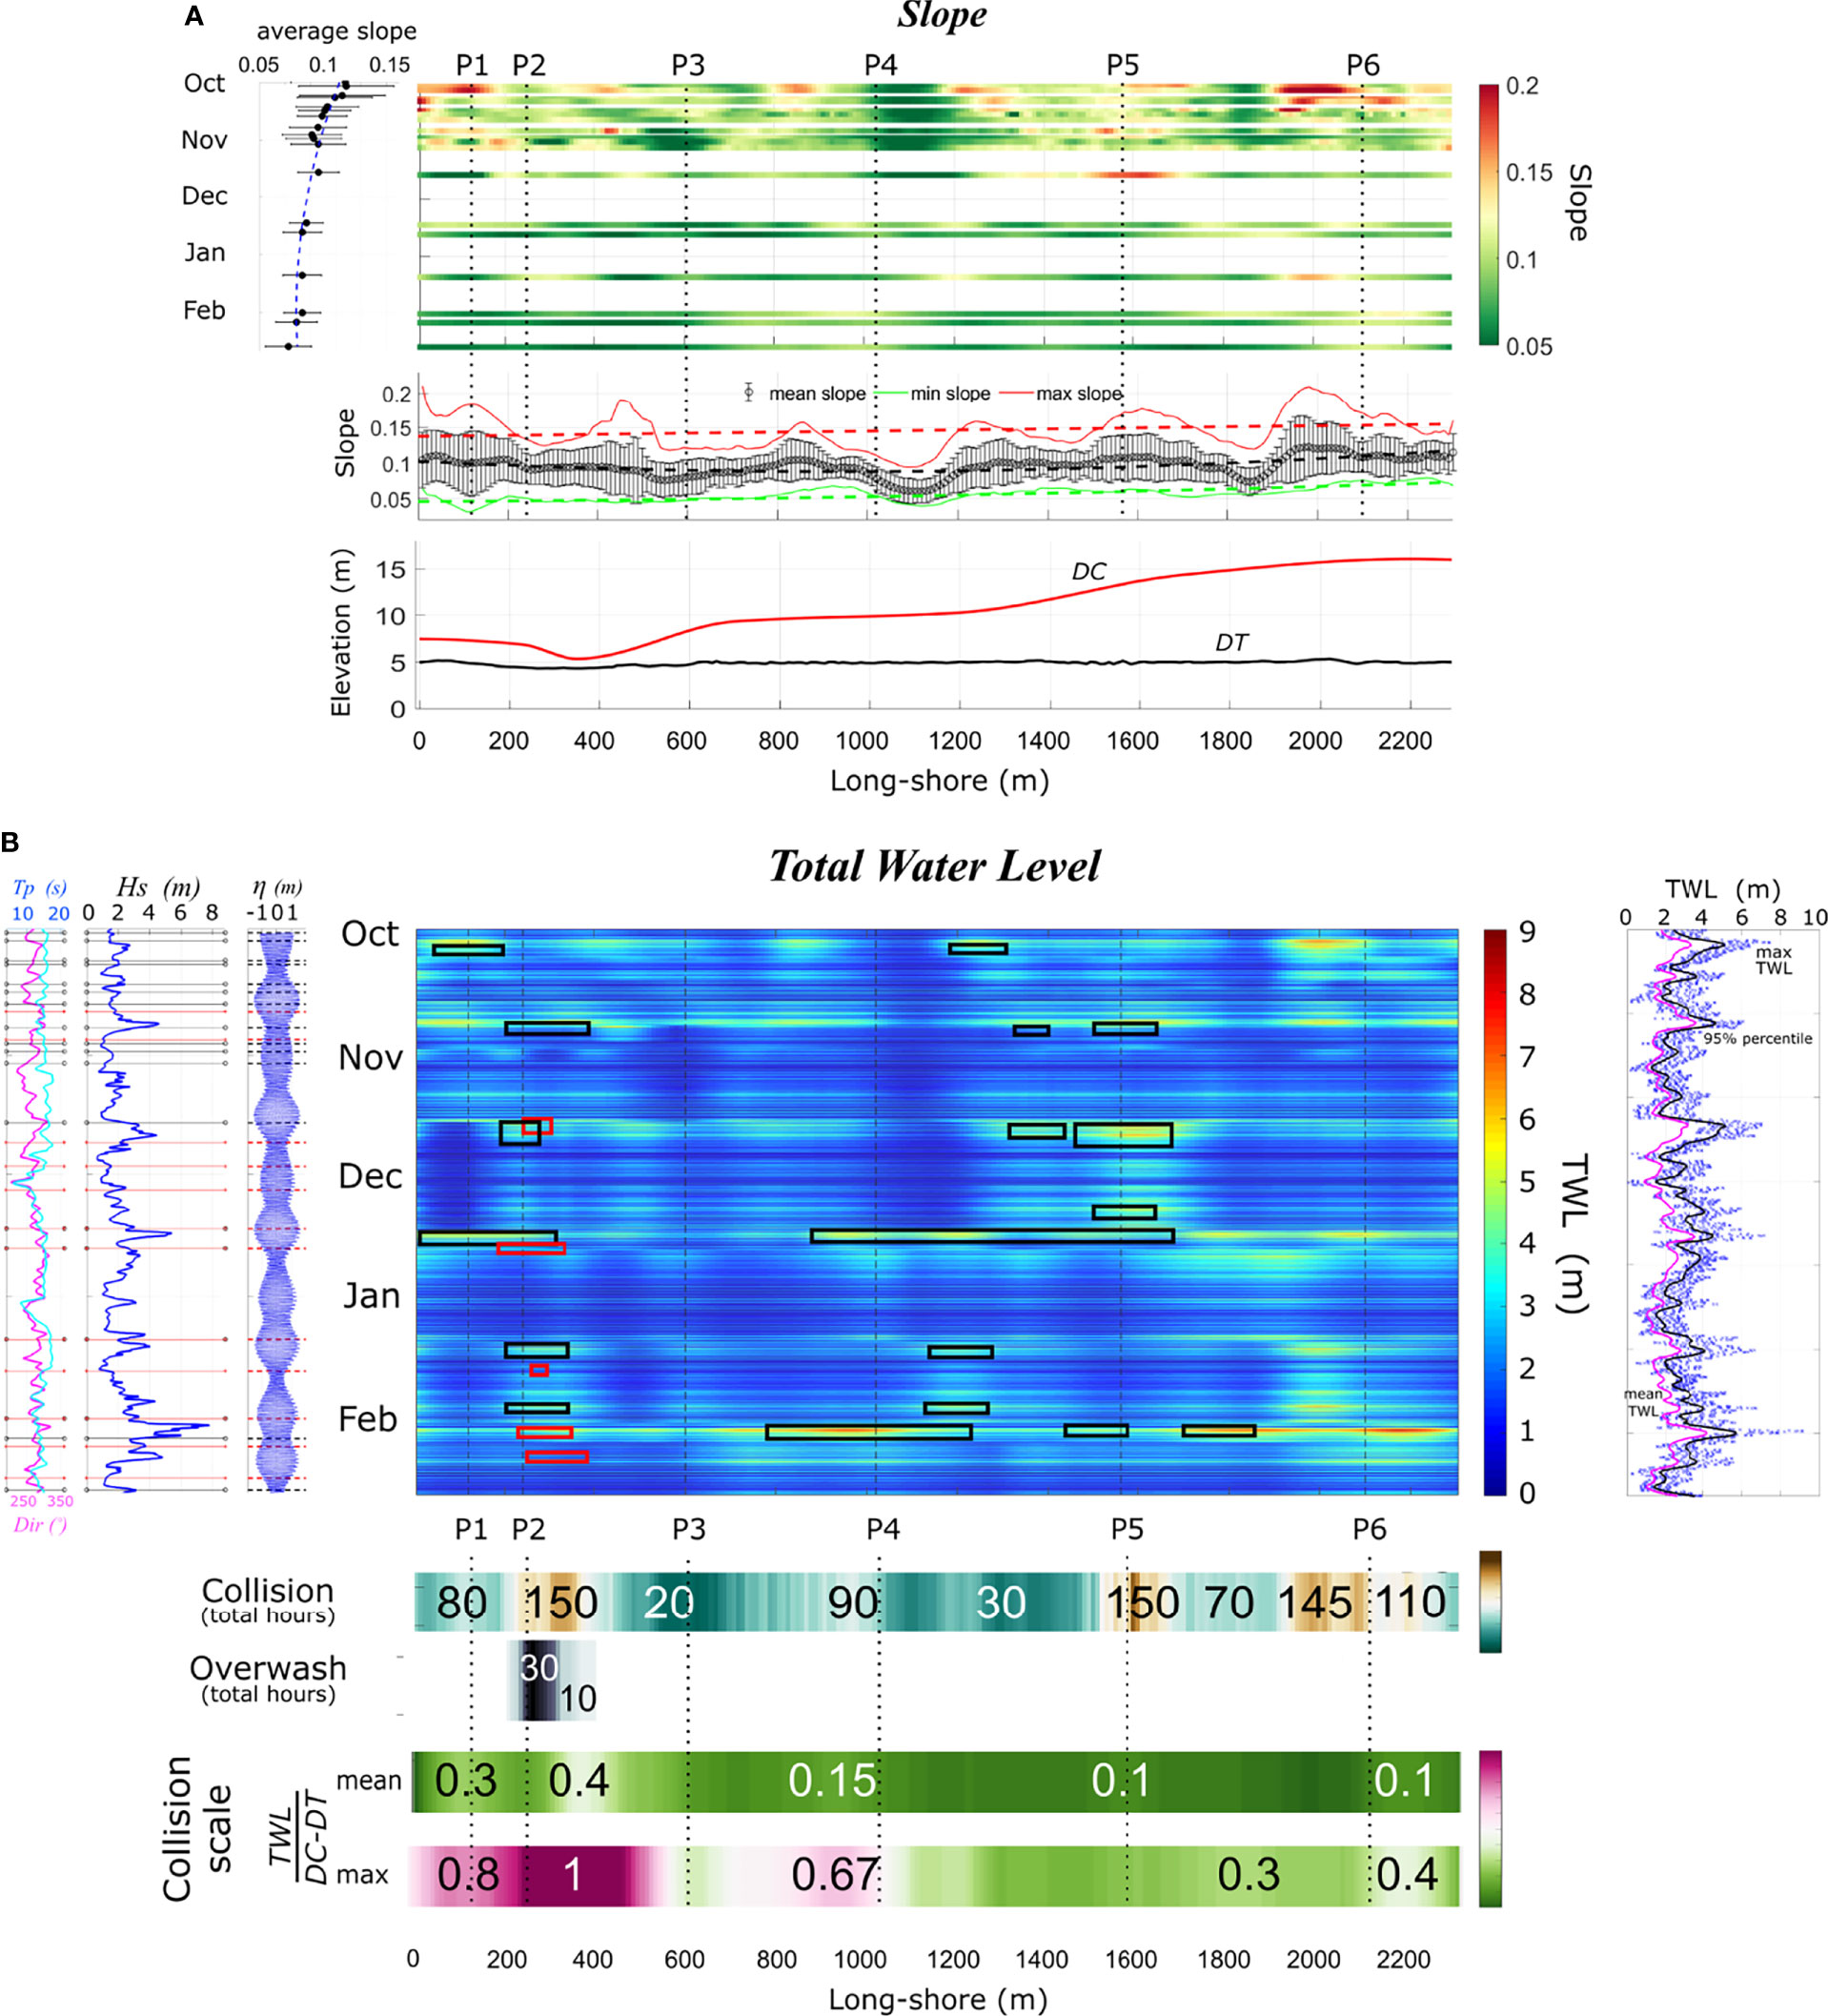
Figure 6 Wave impact on dunes. (A) Beach slope change over time and space (central panel), average slope over time (left panel) and statistical values over the long-shore (minimum, maximum and average, middle panel). Lower graph shows the average dune toe (DT) and dune crest (DC) elevations; (B) total water level (TWL) timeseries over time and space (central panel). Black boxes indicate wave impact on DT, while red boxes overwash occurrence. Hydrodynamics (left panel), with peak period (Tp), significant wave height (Hs) and tide (η). Right panels show maximum values (blue crosses), 95% percentile (black line) and mean values (magenta line) of TWL. Lower panels show the total events of collisions and overwash (hour values), along with the average and maximum collision SIS of Sallenger (2000).
In Figure 6B, the TWL timeseries was coupled with the DT and DC elevations to characterize the wave impact regimes. Overall, waves collided the dune ridge for the whole long-shore extent, for a maximum period of 150 hours, corresponding to one and six days, respectively, over the monitored five months. Collision events were more numerous in the northern and southern sectors, corresponding to P2 and P5. In the central sector, where the mildest slope and lowest intertidal sector variation were observed over the winter, the dune was the less impacted.
As already observed in Figure 4, P2 was overwashed for a total period of 30 hours, and these events extend up to 250 m south of P2, where the DC was lower than 7 m, and the highest volume change occurred (Figure 3).
Considering all collision and overwash events, Figure 6 characterizes the TWL impacts normalized with the dune ridge (DC-DT) height, following Sallenger (2000). The mean values of SIS were lower than 0.2 for the whole long-shore extent, apart for the northern sector, where the ratio was higher than 0.3. The northern sector also registered the highest impact during the most energetic events, with overwash events (values >1) and dune collision up to 80% of the dune height. Between P3 and P4, the event of middle February also impacted the dune up to the 67%, however the impact was mitigated by dune vegetation. Overall, despite the high number of collision events in the southern sector, the normalize level of impact was lower than the 40%.
The mechanisms that controls the response of the dune and beach system at short and medium term (days, months) on high energetic coasts strongly depended on the collision and overwash events and morphological configuration.
The high-frequency and high-resolution survey campaign was essential to monitor the short-term morphological variation of Mira beach. In particular, it was crucial updating beach slope changes for accurately describing total water level (TWL) excursion over space and time (Figure 6). On the one hand, the ATV provided a complete description of subaerial beach surfaces (Figure 3), whereas dGPS profiling only allowed to survey a limited number of transects with high long-shore offset. On the other hand, dGPS profiling allowed to describe wave collision and overwash on the dune compartment, along with corroborating the total water level (TWL) model (Figure 4). Winter 2016/17 was characterized by energetic waves and more significant events during 15th December with wave peak at Hs=4.5 m and 2nd February storm with wave heights above Hs=7.5 m, both with Tp more than 15 s. Wave directions occurred between 280-295°, concentrated on W to NNW directions. The morphological context of Mira as an open beach facing the Atlantic swell confers a uniformity on shoreline orientation. The sandy barrier extends in an NNE– SSW direction, with similar wave conditions in this coastal stretch from north to south. It was found that the northern sector of Mira beach was the most variable in terms of beach width (BW) and volume (BV), with the gradual beach berm formation and disappearing on the intertidal area (Figure 3). Although the BW was the longest here, the northern sector resulted in being the most vulnerable to wave impact and intrusion, with a high rate of dune collision (~150h), a considerable wave collision elevation relative to the dune height and, in some sectors overpassing the dune crest (DC). As previous works showed, no direct relationship between beach morphodynamics and dune erosion was found (Armaroli et al., 2013; Cohn et al., 2019). However, spatial variability in total water levels relative to antecedent beach and dune morphology can change wave collision % events and therefore exert a substantial control on dune evolution (e.g. Serafin et al., 2019). The largest variability and the major vulnerability of northern sector may be related to the presence of the groin at the northern limit of the beach (Figure 1). Groins influences the beach behaviour, causes downdrift erosion and generally affect the natural north-south littoral drift on the Portuguese coast (Rosa-Santos et al., 2009; Baptista et al., 2014).
The analysis showed that the DT was also impacted in the northern sector (between P1 and P3), where it was registered the highest variation of the upper beach profile (Figures 3, 4), and the southern sector (P5, P6). However, the relative height of wave collision in the southern sector is lower than in the northern sector and small beach profile changes were observed. Where high dunes exist, the shoreline variation, and vertical elevation of beach-dune profiles remained more stable. In contrast, a clear sign of dune degradation was shown at northernmost (P1, P2). Given these, we emphasise that on a high-energy meso-tidal coast, the analysis of long-shore variation of shoreline, BW and BV, may not be sufficient to understand the complex interaction between hydrodynamic and morphology of a beach-dune system. We also showed that the local sea level elevation must be considered for an accurate evaluation of dune vulnerability since assuming the Hs exclusively as representative of storm impact may provide unsophisticated and incomplete analysis. As seen from TWL analysis, impacts on DT and overwash events occurred not only when the highest offshore wave height Hs was registered (8 m) but also during lower Hs (about 3 m) and spring tides (Figure 6).
Although the search for the most accurate R2% prediction was beyond the scope of this study, the formula proposed by Atkinson et al. (2017) was chosen as the best representative for computing the TWL prediction at Mira beach (Figure 6). As this formula was built to fit a realistic range of conditions and different runup models (Atkinson et al., 2017), it has been proven to be best performing when compared with other formulas (e.g., Gomes da Silva et al., 2020), and already validated with field data on the Portuguese coast (Andriolo et al., 2020b; Gonçalves et al., 2020). Instead, we found that Stockdon et al. (2006) and Vousdoukas et al. (2012) underestimated the TWL, perhaps since they were parameterized considering gentler slope, milder Hs and lower wave steepness ranges (Table 2) than at our study site. Even though the Hs range for the parameterization of Holman (1986) and Atkinson et al. (2017) did not reach the Hs of 7 m registered during the monitored period at Mira beach, the estimation of R2% was more accurate than Didier et al. (2020). The latest formula overestimated TWL at the open coast study site, likely due to the fact that it was parameterized considering sheltered beaches data, where the wave set up component plays a significant role in the total computation of R2%.
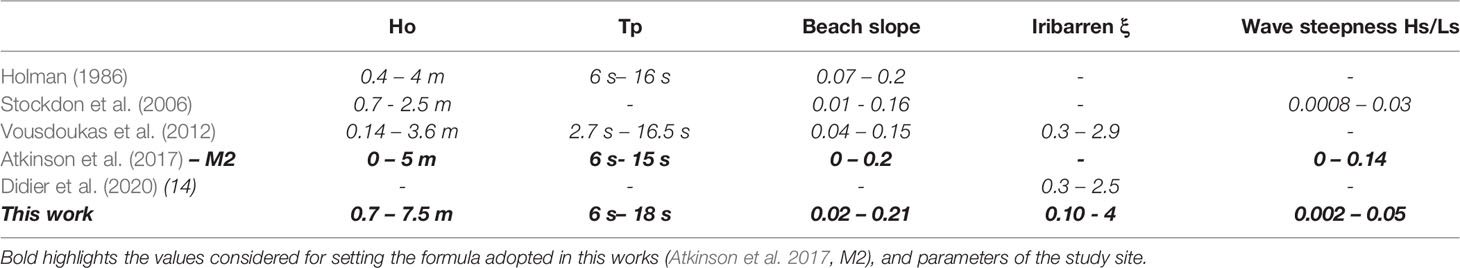
Table 2 Wave runup R2% formulas considered in this work, with the range of conditions tested in the field [from Gomes da Silva et al. (2020)].
As already mentioned, the good assessment of TWL was prone to the beach slope update provided by the high-frequency monitoring program; therefore, the technique can be considered valuable also for future works. Nevertheless, field surveys required intense human effort and time spent in the field.
In recent years, remote sensing techniques, such as video monitoring (Holman and Stanley, 2007; Andriolo et al., 2019), unmanned aerial systems (Manfreda et al., 2018; Tmušić et al., 2020) and satellite images (McCarthy et al., 2017) have been shown to be suitable to support coastal studies (Splinter et al., 2018). However, remote sensing applications still have some limitations compared to conventional (high resolution) surveys. First, video monitoring technique may allow the estimation of beach profile slope with high frequency (Vousdoukas et al., 2011; Valentini et al., 2017; Andriolo et al., 2018), nearshore wave transformation (Andriolo, 2019), and wave breaking height (Andriolo et al., 2020c). Nevertheless, the quantitative use of video imagery is spatially constrained and dependent on the camera installation height, with an approximated ratio of 1/10 (10 m camera height allows to cover approximately 100 m with good spatial resolution). Second, satellite imagery has been used to retrieve the beach-dune morphology and beach slope (Almeida et al., 2019; Vos et al., 2020). Although satellites allow a comprehensive spatial coverage, the use of Pleiades images (Almeida et al., 2019) is still economically demanding. On the other hand, the accuracy of the beach slope estimation from freely-available Sentinel 2 (Vos et al., 2020) seems not be appropriate for the detailed wave runup modelling yet, as 10 x 10 m spatial resolution may be too low to retrieve the highly variable foreshore beach slope (Figure 4). Finally, the use of drones has been shown to be effective for a high-resolution survey of the subaerial beach (Trembanis et al., 2017; Duo et al., 2018; Pagán et al., 2019), coastal dunes (Laporte-Fauret et al., 2019; Taddia et al., 2020) and cliffs (Gómez-Gutiérrez and Gonçalves, 2020; Gonçalves et al., 2021) through the Structure-from-Motion technique. Drones also allow integrating different types of environmental observations to beach-dune topographical surveys, such as coastal cliffs (Gómez-Gutierrez and Gonçalves, 2020; Gonçalves et al., 2021), such as marine litter abundance (Andriolo et al., 2020a; Andriolo et al., 2020b; Gonçalves et al., 2020; Andriolo et al., 2021a; Andriolo et al., 2021b) and coastal dune vegetation census (Taddia et al., 2019; Laporte-Fauret et al., 2020). However, the SfM technique has been shown to be inadequate to retrieve the foreshore slope, as wet saturated sand can negatively affects the 3D reconstruction of the intertidal area (e.g., Brunier et al., 2016). Given the above-cited remote sensing techniques limitations, the use of conventional methods was optimal for the detailed description of beach slope variation all over the monitored 2300 m of Mira beach.
It is worth mentioning that the missing bathymetry data limited the morphodynamic analysis, since the nearshore bars location may also influence nearshore wave transformation on the barred coastal stretch of Mira beach (Rey and Bernardes, 2004), and be spatially related to wave impact on dunes (Cox et al., 2013; Castelle et al., 2015; Gomes da Silva et al., 2020). Conventional vessel-based bathymetric measurements are complex tasks to perform with the required frequency, in particular on high-energy coasts (Fontán et al., 2012). Therefore, the depth-inversion method from satellites (Pacheco et al., 2015; Bergsma et al., 2019a; Pereira et al., 2019), coastal video stations (Holman et al., 2013; Abessolo Ondoa et al., 2016; Simarro et al., 2019; Thuan et al., 2019; Santos D. et al., 2020) and unmanned aerial systems (e.g., Bergsma et al., 2019b; Hashimoto et al., 2021) imagery may be useful to retrieve nearshore bottom configuration in future works.
It must be highlighted that the study site is situated in a sensitive ecosystem adjacent to the Aveiro lagoon, with vast areas with farms and road axis. Therefore, it is mandatory to preserve the socio-economic activities. Local authorities and decision-makers must be well documented to make the best choices in a cost-benefit approach (Elko et al., 2016). The work results here provided valuable information to achieve this goal. In fact, following this work within a local adaptive project for dune management, Regional authorities (Polis Litoral Ria de Aveiro) restored the dune ridge of Mira beach, placing natural sand (260.000 m3) prior the winter 2017-2018 (Figure 7) aiming to improve shoreline stability and reduction of the vulnerability to coastal overwash/flooding (Pinto et al., 2020).
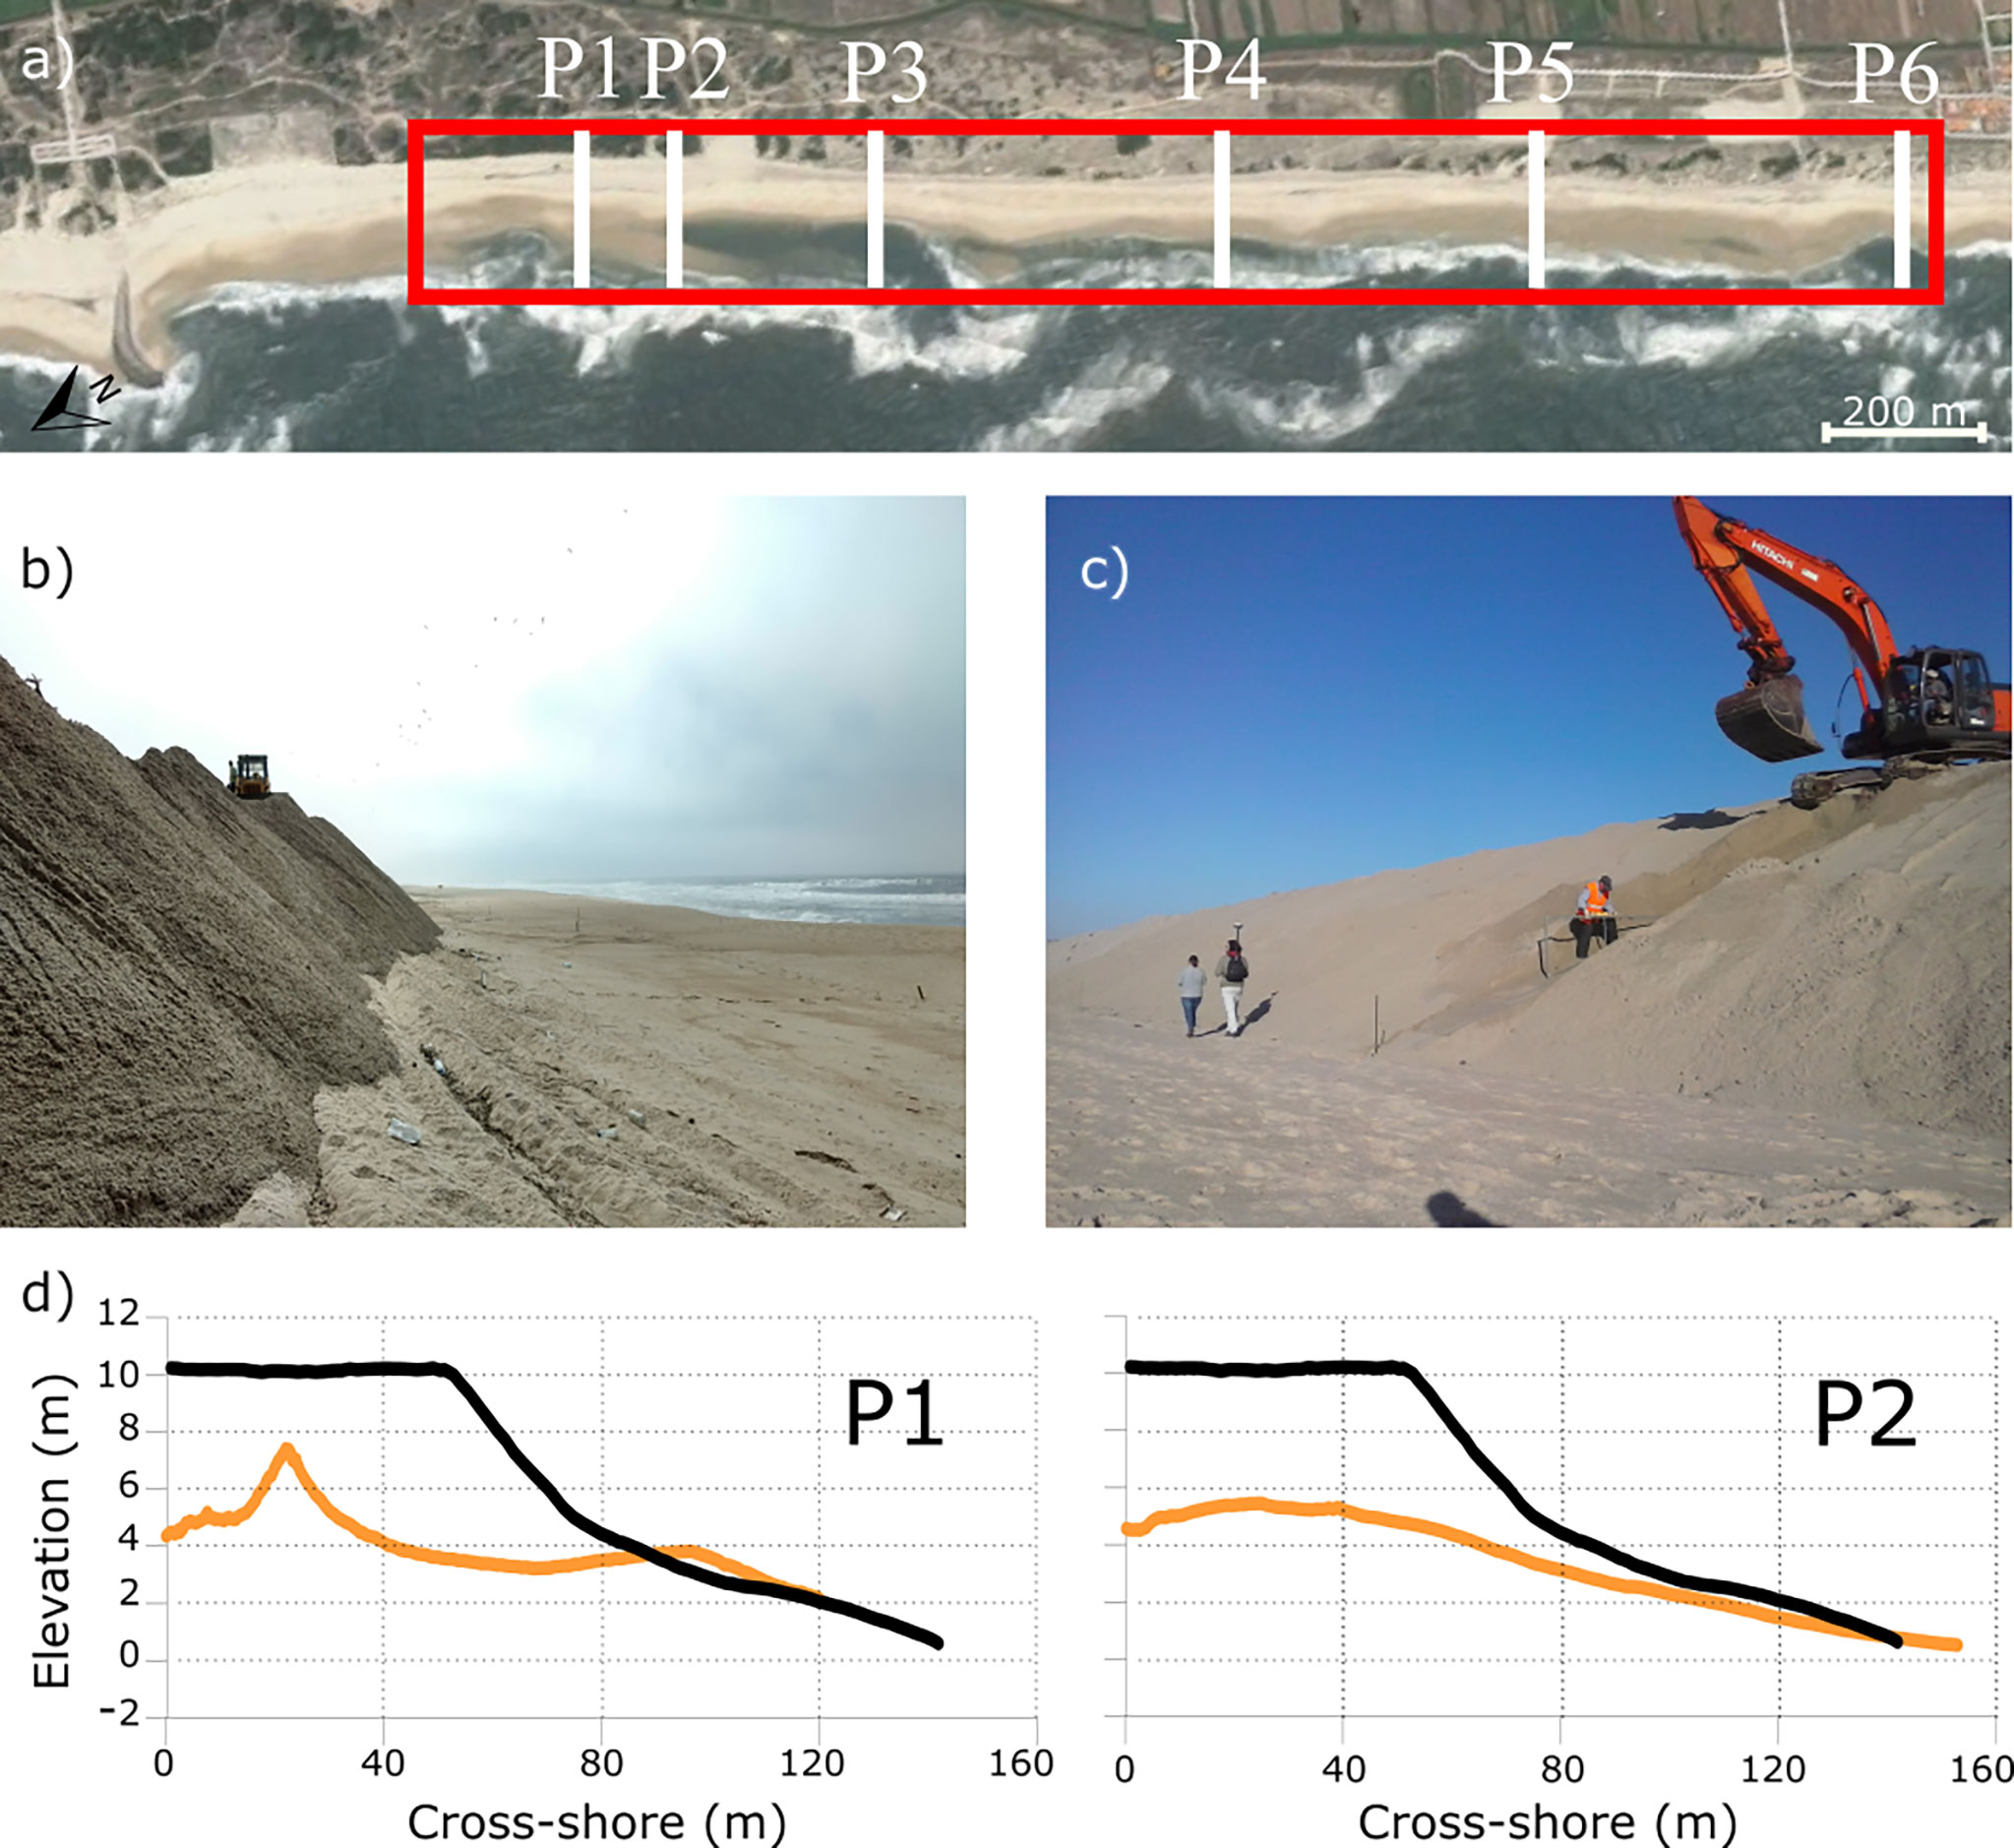
Figure 7 Nourishment along Mira dune ridge. (A) Satellite image of the study area (red rectangle)and beach-dune profiles location (white lines); (B,C) pictures taken during dune nourishment operations at P1 and P2 (November 13, 2017); (D) beach-dune profiles prior (orange lines) and after (black lines) nourishment works.
Analysing the topographical data collected by the COSMO programme (https://cosmo.apambiente.pt) in summer 2018 (Figure 7), we verified that the intervention on the Mira dune ridge was efficient to decrease the beach-dune system vulnerability. On P1 and P2, the DC height was re-established at 11 m (Figure 7), an elevation sufficient to prevent overwash events and thus dune erosion. Further monitoring of the Mira beach-dune system evolution will be necessary to support future coastal management (Silva et al., 2020; Mendes et al., 2021; Pinto et al., 2022) and dune vulnerability maps to wave forecast and predicted sea level rise (e.g., Vousdoukas et al., 2012; Mickey et al., 2018; Cunha et al., 2021). Besides this, research works point towards a significant increase in overwash frequency and magnitude by 2055 and further aggravation by 2100, particularly at the central part of a barrier (Ferreira et al., 2021). Thus, nature-based (soft) solutions, such as dune-beach nourishment, is regarded as the most viable mitigation and adaptation action, which have been implemented with success along the Portugal coast during the last decades (Teixeira, 2016; Pinto et al., 2020; Pinto et al., 2022).
This work examined the wave impact on the 2300 m long-shore Mira beach-dune system on the Portuguese coast over the winter 2016-2017. A high-frequency field survey campaign collected beach topographic data, which were coupled to the description of total water level (TWL) dynamic. The analysis focused on evaluating the beach-dune vulnerability to the wave impact, identifying i) the locations where TWL reached the dune toe (DT) causing sand removal and ii) the locations where overwash of the dune crest (DC) occurred.
The northernmost long-shore 500 m extent was the most vulnerable to overwash events, and in general the most variable in terms of beach width (BW) and volume (BV), likely due to the influence of cross-shore coastal structure that limits the beach northward. Collision of DT was more significant in the northern and central part of the beach, where it was registered the most significant variation of the upper beach profile over the winter. Instead, DT collision was mildest in the southern sector, where beach profiles did not change significantly and dunes were the tallest and best preserved. The analysis underlined that the total water level excursion on the foreshore must be taken in account for an accurate evaluation of dune vulnerability, since impacts on DT and overwash occurred not only during storm events, but also during spring tides and mild wave conditions.
Results highlight the importance of uploading the intertidal beach slope when computing the total water levels on wave-dominated mesotidal sandy beaches. A consistent monitoring program of the hydrodynamic drivers (e.g., waves and wind) and morphological parameters (e.g., topo-bathymetry) which determine both the sediment transport and waves impact on foredune is vital for a better knowledge of the state of the coastal zone environment regarding erosion and accretion and management decision-making.
This work supported the coastal management of Mira beach-dune system, where regional authorities nourished and restored the northern dune ridge to prevent further overwash events and erosion. The presented framework can be applied to build a beach-dune system vulnerability map in response to forecasted and predicting sea level rise, upon a detailed development of a morphodynamic model for describing the beach slope variation.
The raw data supporting the conclusions of this article will be made available by the authors, without undue reservation.
Written informed consent was obtained from the individual(s) for the publication of any potentially identifiable images or data included in this article.
AF-B: Conceptualization, Methodology, Software, Formal Analysis, Investigation, Data curation, Validation, Writing- Original draft preparation, Writing – Review and Editing, Visualization, Funding acquisition. UA: Conceptualization, Methodology, Software, Formal Analysis, Investigation, Data curation, Validation, Writing- Original draft preparation, Writing – Review and Editing, Visualization. PS: Investigation, Data curation, Writing – Review and Editing, Funding acquisition. PB: Investigation, Data curation, Writing – Review & Editing, Funding acquisition. All authors contributed to the article and approved the submitted version.
AF-B is supported by a Post-Doc Fellowship (ED481D2019/028) awarded by Xunta de Galicia (Spain). We acknowledge financial support to GEOMA-XM2 ED431C2019/27 Xunta de Galicia grant and CESAM by FCT/MCTES (UIDP/50017/2020+UIDB/ 50017/2020+ LA/P/0094/2020), through national funds. UA was supported by the Portuguese Foundation for Science and Technology (FCT) and by the European Regional Development Fund (FEDER) through COMPETE 2020 - Operational Program for Competitiveness and Internationalization (POCI) in the framework of UIDB/00308/ 2020 and the research project UAS4Litter (PTDC/EAM-REM/30324/2017).
The authors declare that the research was conducted in the absence of any commercial or financial relationships that could be construed as a potential conflict of interest.
All claims expressed in this article are solely those of the authors and do not necessarily represent those of their affiliated organizations, or those of the publisher, the editors and the reviewers. Any product that may be evaluated in this article, or claim that may be made by its manufacturer, is not guaranteed or endorsed by the publisher.
The authors wish to gratefully thank Javier Alcántara-Carrió, Sandra Fernández-Fernández, Caroline Costa Ferreira, Laura López Olmedilla and Laura Teresa Nobre Tubarão for fruitful discussions and their fundamental help and support during fieldwork. We are also grateful to Rita Nolasco for the tide data computed for the Aveiro tidal gauge.
Abessolo Ondoa G., Almar R., Kestenare E., Bahini A., Houngue G.-H., Jouanno J., et al. (2016). Potential of Video Cameras in Assessing Event and Seasonal Coastline Behaviour: Grand Popo, Benin (Gulf of Guinea). J. Coast. Res. 75, 442–446. doi: 10.2112/SI75-089.1
Alexandrakis G., Poulos S. E. (2014). An Holistic Approach to Beach Erosion Vulnerability Assessment. Sci. Rep. 4, 6078. doi: 10.1038/srep06078
Almeida L. P., Almar R., Bergsma E. W. J., Berthier E., Baptista P., Garel E., et al. (2019). Deriving High Spatial-Resolution Coastal Topography From Sub-Meter Satellite Stereo Imagery. Remote Sens. 11, 590. doi: 10.3390/rs11050590
Andriolo U. (2019). Nearshore Wave Transformation Domains From Video Imagery. J. Mar. Sci. Eng. 7, 186. doi: 10.3390/jmse7060186
Andriolo U., Almeida L. P., Almar R. (2018). Coupling Terrestrial LiDAR and Video Imagery to Perform 3D Intertidal Beach Topography. Coast. Eng. 140, 232–239. doi: 10.1016/j.coastaleng.2018.07.009
Andriolo U., Gonçalves G., Bessa F., Sobral P. (2020a). Mapping Marine Litter on Coastal Dunes With Unmanned Aerial Systems: A Showcase on the Atlantic Coast. Sci. Total Environ. 736. doi: 10.1016/j.scitotenv.2020.139632
Andriolo U., Gonçalves G., Rangel-Buitrago N., Paterni M., Bessa F., Gonçalves L. M. S., et al. (2021a). Drones for Litter Mapping: An Inter-Operator Concordance Test in Marking Beached Items on Aerial Images. Mar. Pollut. Bull. 169, 112542. doi: 10.1016/j.marpolbul.2021.112542
Andriolo U., Gonçalves G., Sobral P., Bessa F. (2021b). Spatial and Size Distribution of Macro-Litter on Coastal Dunes From Drone Images: A Case Study on the Atlantic Coast. Mar. Pollut. Bull. 169, 112490. doi: 10.1016/j.marpolbul.2021.112490
Andriolo U., Gonçalves G., Sobral P., Fontán-Bouzas Á., Bessa F. (2020b). Beach-Dune Morphodynamics and Marine Macro-Litter Abundance: An Integrated Approach With Unmanned Aerial System. Sci. Total Environ. 749, 141474. doi: 10.1016/j.scitotenv.2020.141474
Andriolo U., Mendes D., Taborda R. (2020c). Breaking Wave Height Estimation From Timex Images: Two Methods for Coastal Video Monitoring Systems. Remote Sens. 12, 204. doi: 10.3390/rs12020204
Andriolo U., Sánchez-García E., Taborda R. (2019). Operational Use of Surfcam Online Streaming Images for Coastal Morphodynamic Studies. Remote Sens. 11, 78. doi: 10.3390/rs11010078
Angnuureng D. B., Almar R., Senechal N., Castelle B., Addo K. A., Marieu V., et al. (2017). Shoreline Resilience to Individual Storms and Storm Clusters on a Meso-Macrotidal Barred Beach. Geomorphology 290, 265–276. doi: 10.1016/j.geomorph.2017.04.007
Antunes C., Taborda R. (2009). Sea Level at Cascais Tide Gauge: Data, Analysis and Results. J. Coast. Res. 2009, 218–222.
Armaroli C., Grottoli E., Harley M. D., Ciavola P. (2013). Beach Morphodynamics and Types of Foredune Erosion Generated by Storms Along the Emilia-Romagna Coastline, Italy. Geomorphology 199, 22–35. doi: 10.1016/j.geomorph.2013.04.034
Atkinson A. L., Power H. E., Moura T., Hammond T., Callaghan D. P., Baldock T. E. (2017). Assessment of Runup Predictions by Empirical Models on non-Truncated Beaches on the South-East Australian Coast. Coast. Eng. 119, 15–31. doi: 10.1016/j.coastaleng.2016.10.001
Baptista P., Coelho C., Pereira C., Bernardes C., Veloso-Gomes F. (2014). Beach Morphology and Shoreline Evolution: Monitoring and Modelling Medium-Term Responses (Portuguese NW Coast Study Site). Coast. Eng. 84, 23–37. doi: 10.1016/j.coastaleng.2013.11.002
Baptista P., Cunha T. R., Matias A., Gama C., Bernardes C., Ferreira Ó. (2011). New Land-Based Method for Surveying Sandy Shores and Extracting DEMs: The INSHORE System. Environ. Monit. Assess. 182, 243–257. doi: 10.1007/s10661-011-1873-5
Battjes J. A. (1988). Surf-Zone Dynamics. Annu. Rev. Fluid Mech. 20, 257–291. doi: 10.1146/annurev.fl.20.010188.001353
Beniston M., Stephenson D. B., Christensen O. B., Ferro C. A. T., Frei C., Goyette S., et al. (2007). Future Extreme Events in European Climate: An Exploration of Regional Climate Model Projections. Clim. Change. 81, 71–95. doi: 10.1007/s10584-006-9226-z
Bergsma E. W. J., Almar R., Maisongrande P. (2019a). Radon-Augmented Sentinel-2 Satellite Imagery to Derive Wave-Patterns and Regional Bathymetry. Remote Sens. 11 (16), 1918. doi: 10.3390/rs11161918
Bergsma E. W. J., Almar R., Melo de Almeida L. P., Sall M. (2019b). On the Operational Use of UAVs for Video-Derived Bathymetry. Coast. Eng. 152, 103527. doi: 10.1016/j.coastaleng.2019.103527
Blanco-Chao R., Cajade-Pascual D., Costa-Casais M. (2020). Rotation, Sedimentary Deficit and Erosion of a Trailing Spit Inside Ria of Arousa (NW Spain). Sci. Total Environ. 749, 141480. doi: 10.1016/j.scitotenv.2020.141480
Brunier G., Fleury J., Anthony E. J., Gardel A., Dussouillez P. (2016). Close-Range Airborne Structure-From-Motion Photogrammetry for High-Resolution Beach Morphometric Surveys: Examples From an Embayed Rotating Beach. Geomorphology 261, 76–88. doi: 10.1016/j.geomorph.2016.02.025
Castelle B., Harley M. (2020). Extreme Events: Impact and Recovery, in: Sandy Beach Morphodynamics. Elsevier pp, 533–556. doi: 10.1016/b978-0-08-102927-5.00022-9
Castelle B., Marieu V., Bujan S., Splinter K. D., Robinet A., Sénéchal N., et al. (2015). Impact of the Winter 2013-2014 Series of Severe Western Europe Storms on a Double-Barred Sandy Coast: Beach and Dune Erosion and Megacusp Embayments. Geomorphology 238, 135–148. doi: 10.1016/j.geomorph.2015.03.006
Ciavola P., Ferreira O., Van Dongeren A., Van Thiel de Vries J., Armaroli C., Harley M. (2014). Prediction of Storm Impacts on Beach and Dune Systems. Hydrometeorol. Hazards Interfacing Sci. Policy 9781118629, 227–252. doi: 10.1002/9781118629567.ch3d
Coelho C., Silva R., Veloso-gomes F., Taveira-pinto F. (2009). Potential Effects of Climate Change on Northwest Portuguese Coastal Zones. ICES J. Marine Sci. 66 (7), 1497–1507. doi: 10.1093/icesjms/fsp132
Cohn N., Ruggiero P., García-Medina G., Anderson D., Serafin K. A., Biel R. (2019). Environmental and Morphologic Controls on Wave-Induced Dune Response. Geomorphology 329, 108–128. doi: 10.1016/J.GEOMORPH.2018.12.023
Costa S., Coelho C. (2013). Northwest Coast of Portugal – Past Behavior and Future Coastal Defense Options. J. Coast. Res. 65, 921–926. doi: 10.2112/si65-156.1
Cox N., Dunkin L. M., Irish J. L. (2013). An Empirical Model for Infragravity Swash on Barred Beaches. Coast. Eng. 81, 44–50. doi: 10.1016/j.coastaleng.2013.06.008
Cunha J., Cardona F. S., Bio A., Ramos S. (2021). Importance of Protection Service Against Erosion and Storm Events Provided by Coastal Ecosystems Under Climate Change Scenarios. Front. Mar. Sci. 8. doi: 10.3389/fmars.2021.726145
Del Río L., Plomaritis T. A., Benavente J., Valladares M., Ribera P. (2012). Establishing Storm Thresholds for the Spanish Gulf of Cádiz Coast. Geomorphology 143–144, 13–23. doi: 10.1016/j.geomorph.2011.04.048
Diamantidou E., Santinelli G., Giardino A., Stronkhorst J., De Vries S. (2020). An Automatic Procedure for Dune Foot Position Detection: Application to the Dutch Coast. J. Coast. Res. 36, 668–675. doi: 10.2112/JCOASTRES-D-19-00056.1
Didier D., Caulet C., Bandet M., Bernatchez P., Dumont D., Augereau E., et al. (2020). Wave Runup Parameterization for Sandy, Gravel and Platform Beaches in a Fetch-Limited, Large Estuarine System. Cont. Shelf Res. 192, 104024. doi: 10.1016/J.CSR.2019.104024
Dissanayake P., Brown J., Wisse P., Karunarathna H. (2015). Effects of Storm Clustering on Beach/Dune Evolution. Mar. Geol. 370, 63–75. doi: 10.1016/j.margeo.2015.10.010
Dodet G., Bertin X., Taborda R. (2010). Wave Climate Variability in the North-East Atlantic Ocean Over the Last Six Decades. Ocean Model. 31, 120–131. doi: 10.1016/j.ocemod.2009.10.010
Duo E., Chris Trembanis A., Dohner S., Grottoli E., Ciavola P. (2018). Local-Scale Post-Event Assessments With GPS and UAV-Based Quick-Response Surveys: A Pilot Case From the Emilia-Romagna (Italy) Coast. Nat. Hazards Earth Syst. Sci. 18, 2969–2989. doi: 10.5194/nhess-18-2969-2018
Durán R., Guillén J., Ruiz A., Jiménez J. A., Sagristà E. (2016). Morphological Changes, Beach Inundation and Overwash Caused by an Extreme Storm on a Low-Lying Embayed Beach Bounded by a Dune System (NW Mediterranean). Geomorphology 274, 129–142. doi: 10.1016/j.geomorph.2016.09.012
Eichentopf S., Alsina J. M., Christou M., Kuriyama Y. (2020). Storm Sequencing and Beach Profile Variability at Hasaki , Japan. Mar. Geol. 424, 106153. doi: 10.1016/j.margeo.2020.106153
Elko N., Brodie K., Stockdon H., Nordstrom K., Houser C., McKenna K., et al. (2016). Dune Management Challenges on Developed Coasts. Shore Beach 84, 15.
Fernández-Fernández S., Ferreira C. C., Silva P. A., Baptista P., Romão S., Fontán-Bouzas Á., et al. (2019). Assessment of Dredging Scenarios for a Tidal Inlet in a High-Energy Coast. J. Mar. Sci. Eng. 7 (11), 395. doi: 10.3390/jmse7110395
Ferreira Ó., Kupfer S., Costas S. (2021). Implications of Sea-Level Rise for Overwash Enhancement at South Portugal. Nat. Hazards. 109, 2221–2239. doi: 10.1007/s11069-021-04917-0
Flor-Blanco G., Alcántara-Carrió J., Jackson D. W. T., Flor G., Flores-Soriano C. (2021). Coastal Erosion in NW Spain: Recent Patterns Under Extreme Storm Wave Events. Geomorphology 387, 107767. doi: 10.1016/j.geomorph.2021.107767
Fontán A., Alcántara-Carrió J., Correa I. D. (2012). Combined Beach - Inner Shelf Erosion in Short and Medium Term (Maspalomas, Canary Islands). Geol. Acta. 10, 4111–426. doi: 10.1344/105.000001756
Fontán-Bouzas Á., Alcántara-Carrió J., Albarracín S., Baptista P., Silva P. A., Portz L., et al. (2019). Multiannual Shore Morphodynamics of a Cuspate Foreland: Maspalomas (Gran Canaria, Canary Islands). J. Mar. Sci. Eng. 7 (11), 416. doi: 10.3390/jmse7110416
Gomes da Silva P., Coco G., Garnier R., Klein A. H. F. (2020). On the Prediction of Runup, Setup and Swash on Beaches. Earth-Science Rev. 204, 103148. doi: 10.1016/j.earscirev.2020.103148
Gómez-Gutiérrez Á., Gonçalves G. R. (2020). Surveying Coastal Cliffs Using Two UAV Platforms (Multi-Rotor and Fixed- Wing) and Three Different Approaches for the Estimation of Volumetric Changes. Int. J. Remote Sens. 0, 1–33. doi: 10.1080/01431161.2020.1752950
Gonçalves G., Andriolo U., Pinto L., Bessa F. (2020). Mapping Marine Litter Using UAS on a Beach-Dune System: A Multidisciplinary Approach. Sci. Total Environ. 706, 135742. doi: 10.1016/j.scitotenv.2019.135742
Gonçalves G., Gonçalves D., Gómez-gutiérrez Á., Andriolo U., Pérez-alvárez J. A. (2021). 3d Reconstruction of Coastal Cliffs From Fixed-Wing and Multi-Rotor Uas: Impact of Sfm-Mvs Processing Parameters, Image Redundancy and Acquisition Geometry. Remote Sens. 13 (6), 1222. doi: 10.3390/rs13061222
Harley M. D., Andriolo U., Armaroli C., Ciavola P. (2014). Shoreline Rotation and Response to Nourishment of a Gravel Embayed Beach Using a Low-Cost Video Monitoring Technique: San Michele-Sassi Neri, Central Italy. J. Coast. Conserv. 18, 551–565. doi: 10.1007/s11852-013-0292-x
Hashimoto K., Shimozono T., Matsuba Y., Okabe T. (2021). Unmanned Aerial Vehicle Depth Inversion to Monitor River-Mouth Bar Dynamics. Remote Sens. 13 (3), 412. doi: 10.3390/rs13030412
Hinkel J., Nicholls R. J., Tol R. S. J., Wang Z. B., Hamilton J. M., Boot G., et al. (2013). A Global Analysis of Erosion of Sandy Beaches and Sea-Level Rise: An Application of DIVA. Glob. Planet. Change. 111, 150–158. doi: 10.1016/j.gloplacha.2013.09.002
Holman R. A. (1986). Extreme Value Statistics for Wave Run-Up on a Natural Beach. Coast. Eng. 9 (6), 527–544. doi: 10.1016/0378-3839(86)90002-5
Holman R., Plant N., Holland T. (2013). CBathy: A Robust Algorithm for Estimating Nearshore Bathymetry. J. Geophys. Res. Ocean. 118, 2595–2609. doi: 10.1002/jgrc.20199
Holman R. A., Stanley J. (2007). The History and Technical Capabilities of Argus. Coast. Eng. 54, 477–491. doi: 10.1016/j.coastaleng.2007.01.003
Houser C., Ellis J. (2013). Beach and Dune Interaction, in: Treatise on Geomorphology. (San Diego: Elsevier Inc.), 267–288. doi: 10.1016/B978-0-12-374739-6.00283-9
Jackson D. W. T., Costas S., Guisado-Pintado E. (2019). Large-Scale Transgressive Coastal Dune Behaviour in Europe During the Little Ice Age. Glob. Planet. Change 175, 82–91. doi: 10.1016/j.gloplacha.2019.02.003
Karunarathna H., Pender D., Ranasinghe R., Short A. D., Reeve D. E. (2014). The Effects of Storm Clustering on Beach Profile Variability. Mar. Geol. 348, 103–112. doi: 10.1016/j.margeo.2013.12.007
Laporte-Fauret Q., Lubac B., Castelle B., Michalet R., Marieu V., Bombrun L., et al. (2020). Classification of Atlantic Coastal Sand Dune Vegetation Using in Situ, UAV, and Airborne Hyperspectral Data. Remote Sens. 12 (14), 2222. doi: 10.3390/rs12142222
Laporte-Fauret Q., Marieu V., Castelle B., Michalet R., Bujan S., Rosebery D. (2019). Low-Cost UAV for High-Resolution and Large-Scale Coastal Dune Change Monitoring Using Photogrammetry. J. Mar. Sci. Eng. 7 (3), 63. doi: 10.3390/jmse7030063
Ludka B. C., Guza R. T., O’Reilly W. C., Yates M. L. (2015). Field Evidence of Beach Profile Evolution Toward Equilibrium. J. Geophys. Res. Ocean. 120 (11), 7574–7597. doi: 10.1002/2015JC010893
Luijendijk A., Hagenaars G., Ranasinghe R., Baart F., Donchyts G., Aarninkhof S. (2018). The State of the World’s Beaches. Sci. Rep. 8, 1–11. doi: 10.1038/s41598-018-24630-6
Manfreda S., Mccabe M. F., Miller P., Lucas R., Pajuelo V. M., Mallinis G., et al. (2018). Use of Unmanned Aerial Systems for Environmental Monitoring. Remote Sens. 10 (4), 641. doi: 10.3390/rs10040641
Marinho B., Coelho C., Hanson H., Tussupova K. (2019). Coastal Management in Portugal: Practices for Reflection and Learning. Ocean Coast. Manage. 181, 104874. doi: 10.1016/j.ocecoaman.2019.104874
Marinho B., Coelho C., Larson M., Hanson H. (2018). Short- and Long-Term Responses of Nourishments: Barra-Vagueira Coastal Stretch, Portugal. J. Coast. Conserv. 22, 475–489. doi: 10.1007/s11852-017-0533-5
Martínez M. L., Intralawan A., Vázquez G., Pérez-Maqueo O., Sutton P., Landgrave R. (2007). The Coasts of Our World: Ecological, Economic and Social Importance. Ecol. Econ. 63 (2–3), 254–272. doi: 10.1016/j.ecolecon.2006.10.022
Martínez M. L., Psuty N. P., Lubke R. A. (2008). A Perspective on Coastal Dunes. Ecolog. Studies 171. doi: 10.1007/978-3-540-74002-5_1
Masselink G. (2021). Sandy Beach Morphodynamics. J. Coast. Res. 37 (2), 456–457. doi: 10.2112/jcoastres-d-20a-00008.1
Masselink G., Van Heteren S. (2014). Response of Wave-Dominated and Mixed-Energy Barriers to Storms. Mar. Geol. 352, 321–347. doi: 10.1016/j.margeo.2013.11.004
Matias A., Ferreira Ó., Vila-Concejo A., Morris B., Dias J. A. (2010). Short-Term Morphodynamics of non-Storm Overwash. Mar. Geol. 274, 69–84. doi: 10.1016/j.margeo.2010.03.006
Matias A., Rita Carrasco A., Loureiro C., Masselink G., Andriolo U., McCall R., et al. (2019). Field Measurements and Hydrodynamic Modelling to Evaluate the Importance of Factors Controlling Overwash. Coast. Eng. 152, 103523. doi: 10.1016/j.coastaleng.2019.103523
McCarthy M. J., Colna K. E., El-Mezayen M. M., Laureano-Rosario A. E., Méndez-Lázaro P., Otis D. B., et al. (2017). Satellite Remote Sensing for Coastal Management: A Review of Successful Applications. Environ. Manage. 60 (2), 323–339. doi: 10.1007/s00267-017-0880-x
Mendes D., Pais-Barbosa J., Baptista P., Silva P. A., Bernardes C., Pinto C. (2021). Beach Response to a Shoreface Nourishment (Aveiro, Portugal). J. Mar. Sci. Eng. 9, 1112. doi: 10.3390/jmse9101112
Mentaschi L., Vousdoukas M. I., Pekel J. F., Voukouvalas E., Feyen L. (2018). Global Long-Term Observations of Coastal Erosion and Accretion. Sci. Rep. 8, 12876. doi: 10.1038/s41598-018-30904-w
Mickey R., Long J., Dalyander P. S., Plant N., Thompson D. (2018). A Framework for Modeling Scenario-Based Barrier Island Storm Impacts. Coast. Eng. 138, 98–112. doi: 10.1016/J.COASTALENG.2018.04.012
Oliveira T. C. A., Neves M. G., Fidalgo R., Esteves R. (2018). Variability of Wave Parameters and Hmax/Hs Relationship Under Storm Conditions Offshore the Portuguese Continental Coast. Ocean Eng. 153, 10–22. doi: 10.1016/j.oceaneng.2018.01.080
Pacheco A., Horta J., Loureiro C., Ferreira (2015). Retrieval of Nearshore Bathymetry From Landsat 8 Images: A Tool for Coastal Monitoring in Shallow Waters. Remote Sens. Environ. 159, 102–116. doi: 10.1016/j.rse.2014.12.004
Pagán J. I., Bañón L., López I., Bañón C., Aragonés L. (2019). Monitoring the Dune-Beach System of Guardamar Del Segura (Spain) Using UAV, SfM and GIS Techniques. Sci. Total Environ. 687, 1034–1045. doi: 10.1016/j.scitotenv.2019.06.186
Pereira P., Baptista P., Cunha T., Silva P. A., Romão S., Lafon V. (2019). Estimation of the Nearshore Bathymetry From High Temporal Resolution Sentinel-1a C-Band SAR Data - A Case Study. Remote Sens. Environ. 223 (15), 166–178. doi: 10.1016/j.rse.2019.01.003
Pereira C., Coelho C. (2013). Mapping Erosion Risk Under Different Scenarios of Climate Change for Aveiro Coast, Portugal. Nat. Hazards 69, 1033–1050. doi: 10.1007/s11069-013-0748-1
Phillips M. S., Blenkinsopp C. E., Splinter K. D., Harley M. D., Turner I. L., Cox R. J. (2017). “High-Frequency Observations of Berm Recovery Using a Continuous Scanning Lidar,” in Australas. Coasts Ports 2017 Conf. (Cairns, Australia: Australasian Coasts and Ports Conference).
Pilar P., Soares C. G., Carretero J. C. (2008). 44-Year Wave Hindcast for the North East Atlantic European Coast. Coast. Eng. 55 (11), 861–871. doi: 10.1016/j.coastaleng.2008.02.027
Pinto C. A., Silveira T. M., Teixeira S. B. (2020). Beach Nourishment Practice in Mainland Portugal, (1950–2017): Overview and Retrospective. Ocean Coast. Manage. 192, 105211. doi: 10.1016/j.ocecoaman.2020.105211
Pinto C. A., Taborda R., Andrade C., Baptista P., Silva P. A. (2022). Morphological Development and Behaviour of a Shoreface Nourishment in the Portuguese Western Coast. J. Mar. Sci. Eng. 10 (2), 146. doi: 10.3390/jmse10020146
Ponte Lira C., Silva A. N., Taborda R., De Andrade C. F. (2016). Coastline Evolution of Portuguese Low-Lying Sandy Coast in the Last 50 Years: An Integrated Approach. Earth Syst. Sci. Data 8, 265–278. doi: 10.5194/essd-8-265-2016
Ranasinghe R. (2016). Assessing Climate Change Impacts on Open Sandy Coasts: A Review. Earth-Science Rev. 160, 320–332. doi: 10.1016/j.earscirev.2016.07.011
Rey S., Bernardes C. (2004). Short-Term Morphodynamics of Intertidal Bars The Case of Areão Beach (Aveiro, Northwest Portugal). J. Coast. Res. 2006, 588–593.
Rocha C., Antunes C., Catita C. (2020). Coastal Vulnerability Assessment Due to Sea Level Rise: The Case Study of the Atlantic Coast of Mainland Portugal. Water (Switzerland) 12, 1–24. doi: 10.3390/w12020360
Rosa-Santos P., Veloso-Gomes F., Taveira-Pinto F., Silva R., Pais-Barbosa P. (2009). Evolution of Coastal Works in Portugal and Their Interference With Local Morphodynamics. J. Coast. Res. 2009, 757–761.
Santos D., Abreu T., Silva P. A., Baptista P. (2020). Estimation of Coastal Bathymetry Using Wavelets. J. Mar. Sci. Eng. 8, 1–16. doi: 10.3390/jmse8100772
Santos C. J., Andriolo U., Ferreira J. C. (2020). Shoreline Response to a Sandy Nourishment in a Wave-Dominated Coast Using Video Monitoring. Water (Switzerland) 12, 1–15. doi: 10.3390/W12061632
Sekovski I., Del Río L., Armaroli C. (2020). Development of a Coastal Vulnerability Index Using Analytical Hierarchy Process and Application to Ravenna Province (Italy). Ocean Coast. Manage. 183, 104982. doi: 10.1016/j.ocecoaman.2019.104982
Serafin K. A., Cohn N., Anderson D., García-Medina G., Ruggiero P., Biel R. (2019). Environmental and Morphologic Controls on Wave-Induced Dune Response. Geomorphology 329, 108–128. doi: 10.1016/j.geomorph.2018.12.023
Silva R., Baptista P., Veloso-Gomes F., Coelho C., Taveira-Pinto F. (2009). Sediment Grain Size Variation on a Coastal Stretch Facing the North Atlantic (NW Portugal). J. Coast. Res. I, 762–766.
Silva R., Martínez M. L., van Tussenbroek B. I., Guzmán-rodríguez L. O., Mendoza E., López-portillo J. (2020). A Framework to Manage Coastal Squeeze. Sustain. 12, 1–21. doi: 10.3390/su122410610
Simarro G., Calvete D., Luque P., Orfila A., Ribas F. (2019). UBathy: A New Approach for Bathymetric Inversion From Video Imagery. Remote Sens. 11 (23), 2722. doi: 10.3390/rs11232722
Splinter K. D., Harley M. D., Turner I. L. (2018). Remote Sensing is Changing Our View of the Coast: Insights From 40 Years of Monitoring at Narrabeen-Collaroy, Australias. Remote Sens. 10 (11), 1744. doi: 10.3390/rs10111744
Splinter K. D., Turner I. L., Davidson M. A., Barnard P., Castelle B., Oltman-shay J. (2014). Journal of Geophysical Research: Earth Surface A Generalized Equilibrium Model for Predicting Daily to Interannual Shoreline Response. J. Geophys. Res. Earth Surf., 1936–1958. doi: 10.1002/2014JF003106.Received
Stockdon H. F., Holman R. A., Howd P. A., Sallenger A. H. (2006). Empirical Parameterization of Setup, Swash, and Runup. Coast. Eng. 53, 573–588. doi: 10.1016/j.coastaleng.2005.12.005
Stronkhorst J., Huisman B., Giardino A., Santinelli G., Santos F. D. (2018). Sand Nourishment Strategies to Mitigate Coastal Erosion and Sea Level Rise at the Coasts of Holland (The Netherlands) and Aveiro (Portugal) in the 21st Century. Ocean Coast. Manage. 156, 266–276. doi: 10.1016/j.ocecoaman.2017.11.017
Taddia Y., Corbau C., Zambello E., Pellegrinelli A. (2019). UAVs for Structure-From-Motion Coastal Monitoring: A Case Study to Assess the Evolution of Embryo Dunes Over a Two-Year Time Frame in the Po River Delta, Italy. Sensors (Switzerland) 19 (7), 1717. doi: 10.3390/s19071717
Taddia Y., Stecchi F., Pellegrinelli A. (2020). Coastal Mapping Using DJI Phantom 4 RTK in Post-Processing Kinematic Mode. Drones 4, 9. doi: 10.3390/drones4020009
Teixeira S. B. (2016). A Alimentaçao Artificial Como Medida De Redução do Risco Em Praias Suportadas Por Arribas Rochosas Na Costa do Barlavento (Algarve, Portugal). J. Integr. Coast Zone Manag/rev Gestão Costeira Integr. 16 (3), 327–342.
Thuan D. H., Almar R., Marchesiello P., Viet N. T. (2019). Video Sensing of Nearshore Bathymetry Evolution With Error Estimate. J. Mar. Sci. Eng. 7, 233. doi: 10.3390/jmse7070233
Timmons E. A., Rodriguez A. B., Mattheus C. R., DeWitt R. (2010). Transition of a Regressive to a Transgressive Barrier Island Due to Back-Barrier Erosion, Increased Storminess, and Low Sediment Supply: Bogue Banks, North Carolina, USA. Mar. Geol. 278, 100–114. doi: 10.1016/j.margeo.2010.09.006
Tmušić G., Manfreda S., Aasen H., James M. R., Gonçalves G., Ben-Dor E., et al. (2020). Current Practices in UAS-Based Environmental Monitoring. Remote Sens. 12 (6), 1001. doi: 10.3390/rs12061001
Trembanis A., Duo E., Dohner S., Grottoli E., Ciavola P. (2017). Quick Response Assessment of the Impact of an Extreme Storm Combining Aerial Drone and RTK GPS. Nat. Hazards Earth Syst. Sci. Discuss., 1–30. doi: 10.5194/nhess-2017-337
Turner I. L., Harley M. D., Short A. D., Simmons J. A., Bracs M. A., Phillips M. S., et al. (2016). A Multi-Decade Dataset of Monthly Beach Profile Surveys and Inshore Wave Forcing at Narrabeen, Australia. Sci. Data 3, 1–13. doi: 10.1038/sdata.2016.24
Valentini N., Saponieri A., Damiani L. (2017). A New Video Monitoring System in Support of Coastal Zone Management at Apulia Region, Italy. Ocean Coast. Manage. 142, 122–135. doi: 10.1016/j.ocecoaman.2017.03.032
Vos K., Harley M. D., Splinter K. D., Walker A., Turner I. L. (2020). Beach Slopes From Satellite-Derived Shorelines. Geophys. Res. Lett. 47, e2020GL088365. doi: 10.1029/2020GL088365
Vousdoukas M. I., Ferreira P. M., Almeida L. P., Dodet G., Psaros F., Andriolo U., et al. (2011). Performance of Intertidal Topography Video Monitoring of a Meso-Tidal Reflective Beach in South Portugal. Ocean Dyn. 61, 1521–1540. doi: 10.1007/s10236-011-0440-5
Vousdoukas M. I., Mentaschi L., Voukouvalas E., Verlaan M., Jevrejeva S., Jackson L. P., et al. (2018). Global Probabilistic Projections of Extreme Sea Levels Show Intensification of Coastal Flood Hazard. Nat. Commun. 9, 2360. doi: 10.1038/s41467-018-04692-w
Vousdoukas M. I., Ranasinghe R., Mentaschi L., Plomaritis T. A., Athanasiou P., Luijendijk A., et al. (2020). Sandy Coastlines Under Threat of Erosion. Nat. Clim. Change 10, 260–263. doi: 10.1038/s41558-020-0697-0
Vousdoukas M. I., Voukouvalas E., Annunziato A., Giardino A., Feyen L. (2016). Projections of Extreme Storm Surge Levels Along Europe. Clim. Dyn. 47, 3171–3190. doi: 10.1007/s00382-016-3019-5
Vousdoukas M. I., Wziatek D., Almeida L. P. (2012). Coastal Vulnerability Assessment Based on Video Wave Run-Up Observations at a Mesotidal, Steep-Sloped Beach. Ocean Dyn. 62, 123–137. doi: 10.1007/s10236-011-0480-x
Wernette P., Houser C., Bishop M. P. (2016). An Automated Approach for Extracting Barrier Island Morphology From Digital Elevation Models. Geomorphology 262, 1–7. doi: 10.1016/j.geomorph.2016.02.024
Keywords: coastal monitoring, coastal erosion, beach slope, beach-dune nourishment, wave run up
Citation: Fontán-Bouzas Á, Andriolo U, Silva PA and Baptista P (2022) Wave Impact Analysis on a Beach-Dune System to Support Coastal Management and Nourishment Works: The Showcase of Mira, Portugal. Front. Mar. Sci. 9:861569. doi: 10.3389/fmars.2022.861569
Received: 24 January 2022; Accepted: 14 March 2022;
Published: 08 April 2022.
Edited by:
Javier Benavente, University of Cádiz, SpainReviewed by:
Rodolfo Silva, National Autonomous University of Mexico, MexicoCopyright © 2022 Fontán-Bouzas, Andriolo, Silva and Baptista. This is an open-access article distributed under the terms of the Creative Commons Attribution License (CC BY). The use, distribution or reproduction in other forums is permitted, provided the original author(s) and the copyright owner(s) are credited and that the original publication in this journal is cited, in accordance with accepted academic practice. No use, distribution or reproduction is permitted which does not comply with these terms.
*Correspondence: Ángela Fontán-Bouzas, YWZvbnRhbkB1dmlnby5lcw==
Disclaimer: All claims expressed in this article are solely those of the authors and do not necessarily represent those of their affiliated organizations, or those of the publisher, the editors and the reviewers. Any product that may be evaluated in this article or claim that may be made by its manufacturer is not guaranteed or endorsed by the publisher.
Research integrity at Frontiers
Learn more about the work of our research integrity team to safeguard the quality of each article we publish.