 Krupa Ratnam
 Dilip Kumar Jha
 M. Prashanthi Devi
 Gopal Dharani1
- 1Ocean Science and Technology for Islands, National Institute of Ocean Technology, Ministry of Earth Sciences, Government of India, Chennai, India
- 2Department of Environmental Science and Management, School of Environmental Sciences, Bharathidasan University, Tiruchirappalli, India
The Swarnamukhi river estuary (SRE), and the surrounding sea in Nellore, southeast coast of India, is one of the least studied marine environments, notably for physicochemical characteristics. Seawater samples were collected from five stations every month from 2014 to 2017 to assess physicochemical characteristics. The open sea (OS) station was significantly different from the inner stations, according to non-metric multidimensional scaling and cluster analysis. The variability was shown by strong factor loadings of atmospheric temperature (0.87), water temperature (0.84), biochemical oxygen demand (0.77), ammonia (0.85), and total nitrogen (0.78). Furthermore, one-way ANOVA and box-whisker plots facilitated simplifying and corroborating multivariate results that showed high concentration in the inner stations. Based on the N/P and Si/N ratios, nitrate and silicate were the key limiting factors in this study. The findings are critical for establishing reference conditions for comparison studies with other comparable ecosystems in the tropical region for better environmental conservation and management.
Introduction
The coastal ecosystems harbor a rich diversity of marine flora and fauna because of their higher productivity (Saravanan et al., 2013). These ecosystems are the most precious and vulnerable environments (Jickells, 1998). Rapid urbanization and industrial growth showed a significant impact on coastal ecosystems, such as estuaries and the surrounding coastal areas. The presence of a dense human population in their watersheds contaminates the environment (Jha et al., 2015). Coastal environment reference characteristics are necessary to provide a better management solution for the coastal ecosystem (Barbier Edward et al., 2011).
A growing number of seawater quality monitoring programs to collect huge datasets are crucial for a better understanding of how anthropogenic activities affect the coastal environments (Jha et al., 2015). Previous scientific records on the seawater quality parameters are minimal in this region. Although a few environmental contamination studies have been carried out on metal pollution (foraminifera, seawater, sediment, bivalves, and benthos) in this area (Sundara Raja Reddy et al., 2016; Patel et al., 2018; Jha et al., 2019; Pandey et al., 2021), long-term studies on the physicochemical parameters are sparse (Sreenivasulu et al., 2016).
Nellore is a coastal district of Andhra Pradesh situated on the southeast coast of India, and it is an ecologically and economically important location for fisheries and aquaculture (Sundara Raja Reddy et al., 2016). However, anthropogenic activities such as the use of pesticides and fertilizers in agriculture and aquaculture, respectively, will have a harmful impact on the physicochemical characteristics of these coastal waters. Therefore, the measurement of physicochemical parameters for a long term is crucial for developing a baseline dataset for sustainable coastal conservation and management.
The physicochemical parameters provide information about the environmental conditions in the region. In recent times, multivariate tools have been used to estimate the seawater contamination level in coastal environments. This study aims to perceive the variation of physicochemical parameters in the Swarnamukhi river estuary (SRE) and the surrounding sea in Nellore. Due to anthropogenic runoff from point and non-point sources, these estuaries get contaminated, posing environmental challenges. Hence, environmental monitoring needs to be addressed through efficient regular sampling, data collection for assessment of water quality, and efficient management approaches for coastal conservation.
The multivariate tool explores and identifies the physicochemical characteristics and their variations in coastal waters (Zhou et al., 2007). Multivariate statistical approaches were used to characterize the physicochemical properties of the SRE in this study. The information gathered as a baseline might be utilized to offer mitigation measure suggestions for tropical coastal environments. The objectives of this study are (1) to estimate physicochemical parameters in SRE and the surrounding coastal area and (2) to estimate the spatiotemporal variation through multivariate analysis to evaluate the anthropogenic for better conservation management.
Materials and Methods
Study Area Description
The SRE is located in Vakadu Mandal, Nellore district, Andhra Pradesh, on the southeast coast of India (Figure 1A) and is approximately 200 km north of Chennai city. It is a dynamic ecosystem located at latitude 13°48′–13°50′N and longitude 80°09′–80°15′E. It is shallow with an average depth of 2.35 m and approximately 3.0 km in length, which covers a total area of 6.25 km2 (Reddi et al., 1993). It supports a mangrove ecosystem and fishery resources and runs perpendicular to the coast. There are approximately 45 aquafarms that are in operation in the Vakadu Mandal. According to Census of India (2011)1, the population in the Nellore district is 2,963,557.2
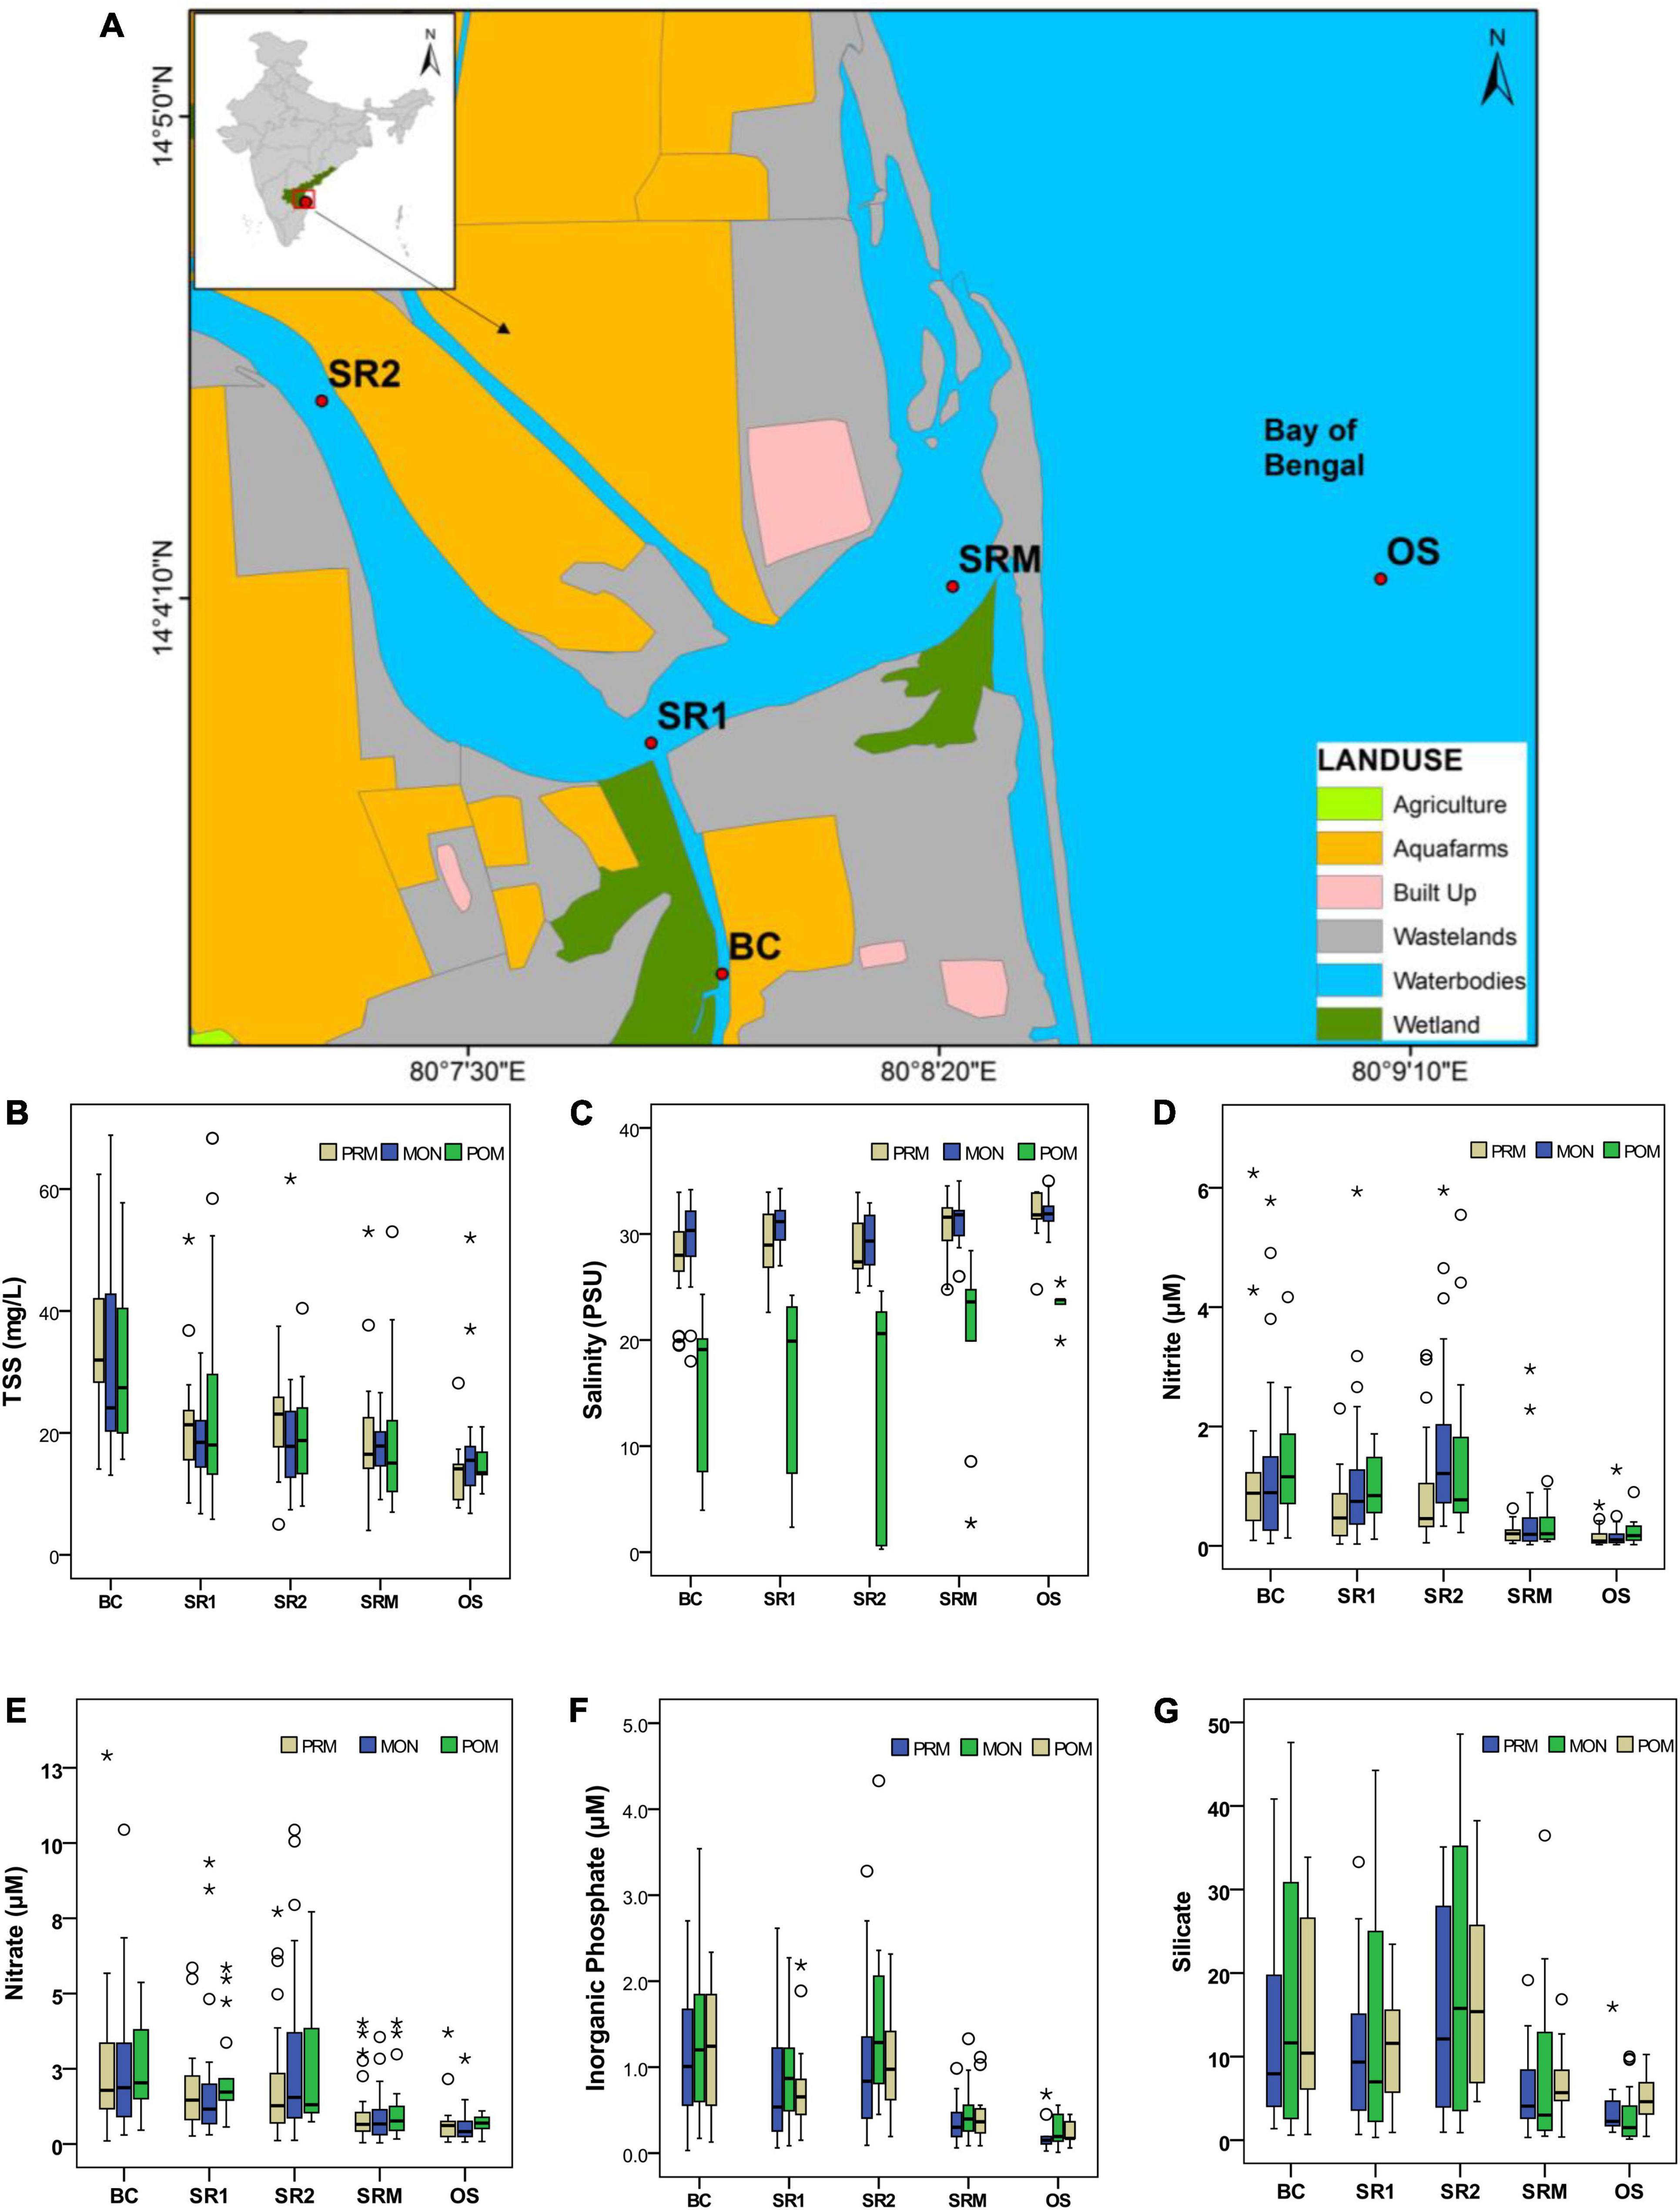
Figure 1. Sampling stations and box-whisker plots show the variation for the selected environmental parameters. (A) Study area map, (B) TSS, (C) salinity, (D) nitrite, (E) nitrate, (F) inorganic phosphate, and (G) silicate. In each box plot, the central point represents the median, the rectangle gives the interval between the 25th and 75th percentiles, and the whisker indicates the range [(*extreme outlier;°mild outlier); PRM, pre-monsoon; MON, monsoon; POM, post-monsoon; BC, Buckingham Canal, estuary away from the mouth; SR2, near to the mouth; SR1, mouth at SRM; OS, open sea].
Seasons are classified as pre-monsoon (PRM) (January–May), monsoon (MON), i.e., southwest monsoon (SWM) (June–September), and post-monsoon (POM), i.e., northeast monsoon (NEM) (October–December). The rainfall occurs from late August (SWM) to early November (NEM) in the Nellore region. The average annual rainfall in the coastal regions in the Nellore district decreases from 1,270 to 762 mm from the eastern to the western extremity of the basin, respectively (Sreenivasulu et al., 2016). The atmospheric temperature (AT) ranged from 29.7 to 40.9°C in the summer, and it varied from 21.4 to 29.3°C in the winter.
Sample Collection and Processing
Sampling was carried out monthly (5 stations × 48 months = 240 samples), which covered the open sea (OS), SRE (SR1, SR2, and SRM), and Buckingham Canal (BC), from May 2014 to December 2017. Out of five sampling stations, four stations were selected from the inner station of the SRE, while one station was selected from the surrounding coastal area, i.e., OS. A Niskin’s sampler was used to collect seawater samples in polypropylene bottles for nutrient estimation. After collection, the samples were stored in a container at 1–4°C before analysis in the laboratory. The geographical locations of the sampling stations were marked using a handheld Global Positioning System (GPS) (Garmin etrex/Vista). Surface seawater was collected using acid-cleaned Niskin’s sampler (USEPA, 1986). Samples for dissolved oxygen (DO) and biochemical oxygen demand (BOD) were analyzed using Winkler’s titration method (Winkler, 1888). Salinity was analyzed using the argentometric titration method. The AT was measured using a mercury thermometer, whereas water temperature (WT) and pH using a pre-calibrated multiparameter water quality monitoring system (model HI9829, Hanna), respectively. Total suspended solids (TSS) were determined by filtering the measured volume of seawater in pre-dried and pre-weighed (0.45 μm, Millipore GF/C) filter paper and washed with Milli-Q water to remove salt contents (APHA, 2012). Nutrients such as nitrite, nitrate, ammonia, total nitrogen (TN), inorganic phosphate (IP), total phosphorus (TP), and silicate were estimated following standard methods (Grasshoff et al., 1999).
Data on physicochemical variables were subjected to the pretreatment process by normalizing the variables to render the data dimensionless for principal component analysis (PCA) (Wunderlin et al., 2001; Su et al., 2011). The factor loadings were sorted according to the criteria of Liu et al. (2003), i.e., strong (> 0.75), moderate (0.75–0.50), and weak (0.50–0.30). To determine sampling adequacy, the Kaiser-Meyer-Olkin (KMO) criterion was followed. The SPSS software (version 18.0) was used for box-whisker plots and PCA. The one-way ANOVA was also used. Nutrient ratios were compared with dissolved inorganic nitrogen (nitrate + nitrite + ammonium = N), silicate, and phosphate to evaluate potential nutrient control on biological productivity as per the Redfield ratio (Si:N:P = 16:16:1) (Van Nieuwerburgh et al., 2004).
Results and Discussion
The range, mean, and SD of physicochemical data collected from the years 2014 to 2017 are presented in Table 1. The high SD of most parameters indicates the presence of temporal and spatial variations likely caused by polluting sources and climatic factors (Vega et al., 1998). Transparency was good (5.5 m) toward the OS, while it was poor at inner stations especially BC. In the study area, the depth was at a maximum in the OS (10 m), whereas it varied in the SRE (from 0.2 to 4.5 m), and the variation was significant (p < 0.05, F = 3.252). TSS was high in the inner stations (SR1, SR2, and BC) and was recorded at its maximum (68.8 mg/L) at BC in the monsoon. Although temperature plays a vital role in regulating the productivity in the coastal region, it was insignificant at the spatial scale (p > 0.05) for WT (20.4–33.6°C) and AT (24.0–39.3°C) but significant (p < 0.05) at the temporal scale. The pH value indicates the buffering capacity of seawater (Moresco et al., 2012), and its spatial variation was significant (p < 0.05, F = 5.54). A low pH value was recorded in the inner stations of the SRE (SR2 and BC), which could be attributed to effluent discharge from the surrounding environments (aqua farms and settlement areas). A reduction in salinity [0.28 practical salinity unit (PSU)] was observed in the inner station (SR2) in the POM season, i.e., the NEM, which is prevalent in coastal regions of the southeast coast of India, and its variation was significant (p < 0.005; F = 3.55). A higher load of TSS and a reduction in salinity could be attributed to heavy rainfall (775 mm) in November 2015 compared with the average rainfall (248 mm) in the Nellore coastal region. Furthermore, frequent operation of fishing boats, occasional dredging in shallow coastal mouths, and freshwater input have been reported to increase the TSS load of the water column (Shanthi et al., 2013; Jha et al., 2022), which was observed in the inner stations. The spatial variation of DO was insignificant (p > 0.05, F = 1.5); however, it was significant for BOD (p < 0.05, F = 139). The DO and temperature are inversely proportional because warm water holds less DO (Wu et al., 2010). Furthermore, a few BOD values (Table 1) were higher in the inner stations (BC, 6.48 mg/L; SR1, 5.47 mg/L; and SR2, 5.47 mg/L) and exceeded the recommended permissible standard (< 3.0 mg/L) for the coastal waters (Gupta et al., 2003). The higher BOD values indicate poor water quality and have been related to anthropogenic activities (Pandey et al., 2022), which was evident in the inner stations. The natural level of nitrite in seawater is usually very low (< 0.1 μM), but in the transition zone between oxic and anoxic layers, it increases to > 3 μM (Grasshoff et al., 1999). In this study, the values of nitrite and nitrate concentration recorded were at 6.25 and 12.9 μM, respectively, at the BC, especially, in the year 2017. Ammonia concentration rarely exceeds 5 μM in oxygenated, unpolluted seawater, but in anoxic stagnant seawater, it could exceed as high as 100 μM as reported (Grasshoff et al., 1999). In this study, the range of ammonia was comparatively high (0.06–20.1 μM) at BC during the PRM season, which could be attributed to no mixing of oceanic water for a few months due to the closure of the SRE mouth. Low scale fish mortality in the region during the particular period was also observed. IP showed a higher range at SR2 (4.33 μM), but the mean concentration was comparatively high (1.21 ± 0.80 μM) at BC. The silicate concentration was high (48.6 μM) at the SR2 in the PRM season compared with BC (47.6 μM). Furthermore, TN and TP ranges were comparatively high at SR2, but the mean concentration of both the parameters was higher at BC, which could be attributed to consistent mixing of anthropogenic discharge from the aquafarms and enhanced the organic load in the surrounding environment. The SRE ecosystem is being fed regularly with tidal water, thus, maintaining the ecosystem comparatively in good condition; however, every year during NEM, if precipitation is less, its mouth gets closed for a few months (2–3 months). During this period, the concentration of physicochemical parameters changes drastically due to stagnation, which is depicted in this study. Besides, activities such as aqua farms, agriculture, and human settlement contribute to anthropogenic discharge into the ecosystem, which increases the concentration of nutrients in the inner stations of the estuary especially, at BC, which could be attributed to low depth and less mixing of oceanic waters. The spatial variation was significant for the physicochemical parameters such as nitrite (p < 0.05, F = 14.1), nitrate (p < 0.05, F = 10.03), ammonia (p < 0.05, F = 12.3), TN (p < 0.05, F = 10.6), IP (p < 0.05, F = 20.9), TP (p < 0.05, F = 19.5), and silicate (p < 0.05, F = 10.9) during the study period. Similarly, temporal variation was significant for AT (p < 0.05, F = 19.00), WT (p < 0.05, F = 23.22), pH (p < 0.05, F = 4.82), salinity (p < 0.05, F = 34.16), DO (p < 0.05, F = 3.52), nitrite (p < 0.05, F = 3.28), nitrate (p < 0.05, F = 3.95), IP (p < 0.05, F = 2.67), TP (p < 0.05, F = 4.50), and silicate (p < 0.05, F = 2.02).
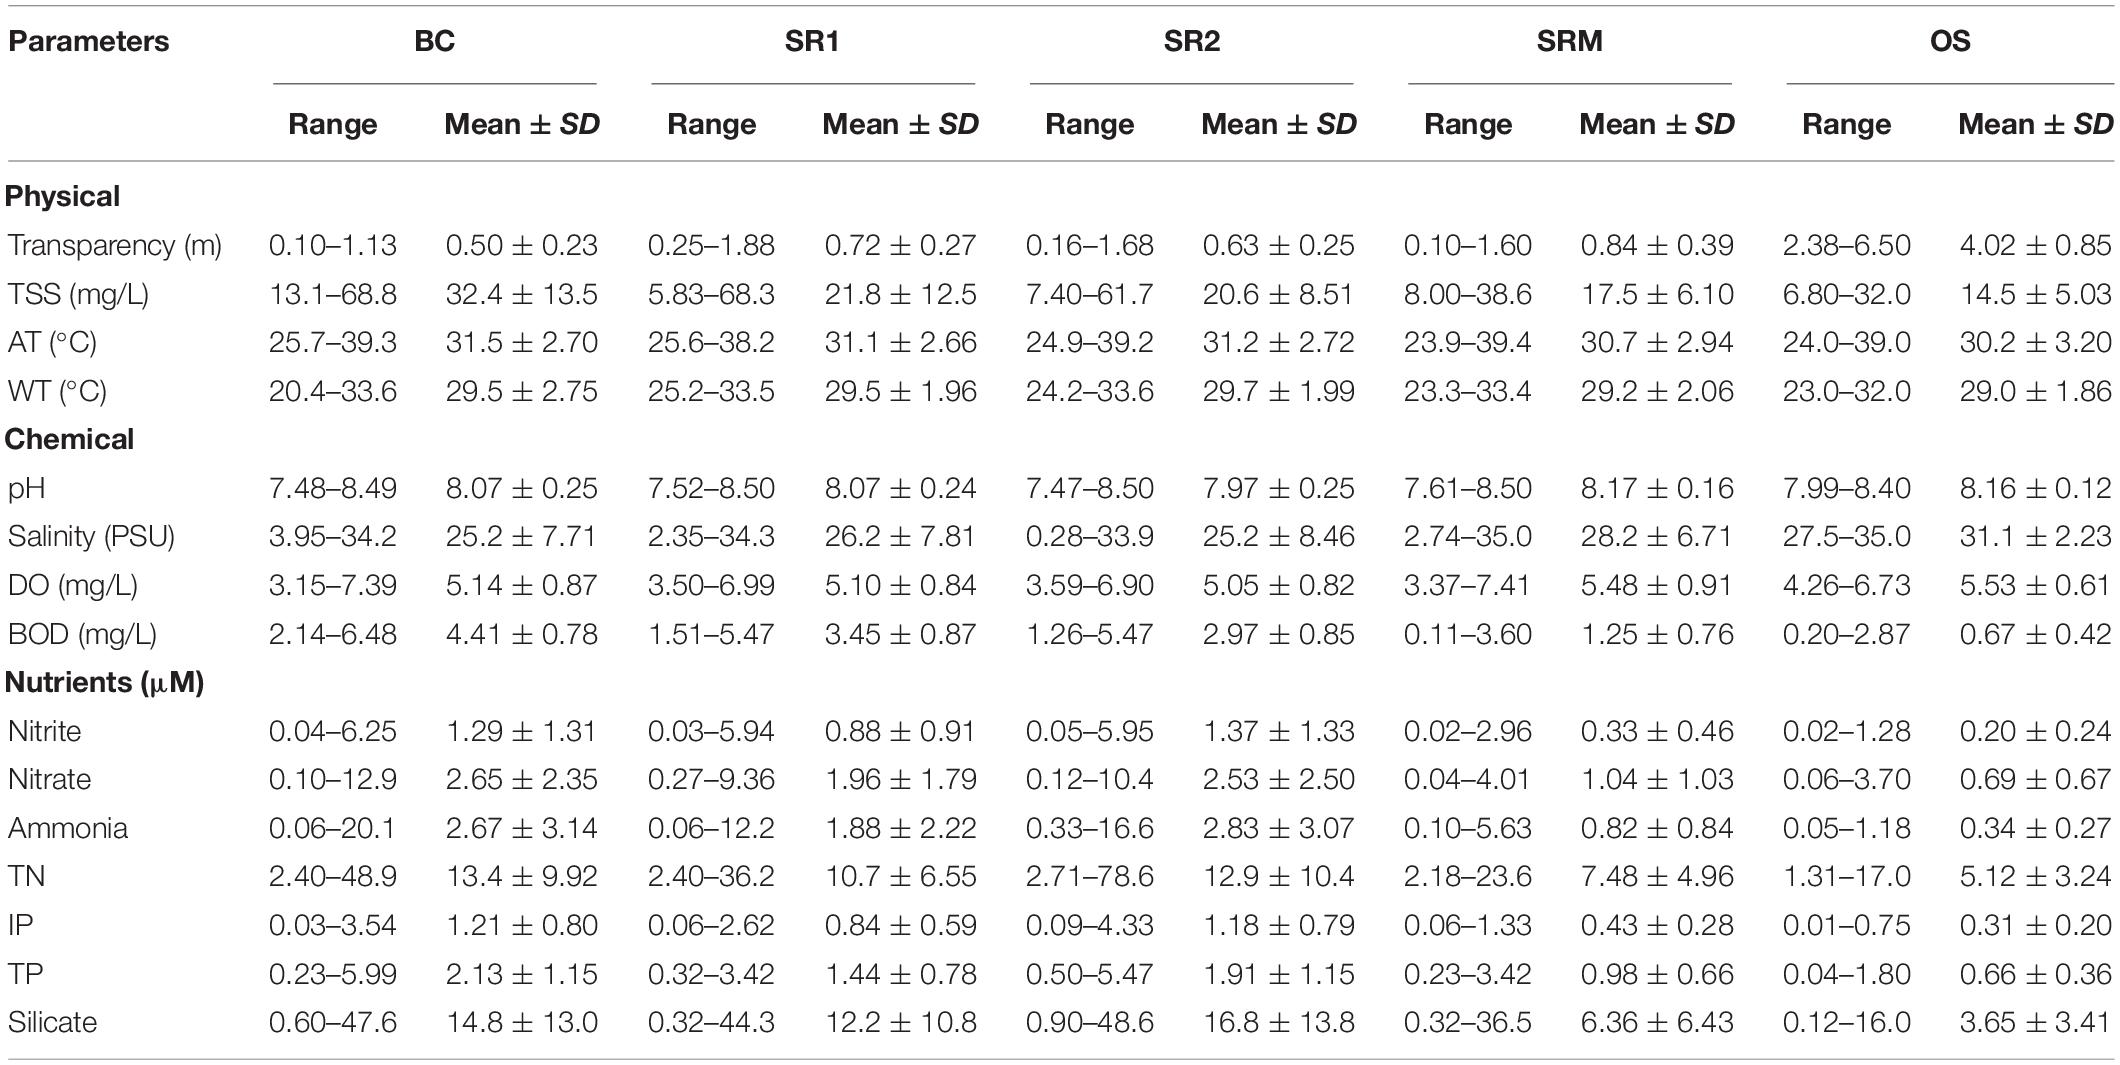
Table 1. Physicochemical variable in Nellore coastal waters during the years 2014–2017.
The box-whisker plots of selected physicochemical parameters are shown at the spatiotemporal scale (Figures 1B–G). From the box-whisker plots, it was observed that optimal concentrations of the physicochemical parameters were recorded at the OS, whereas they were high at inner stations, namely, BC, SR1, and SR2. The box plots with long whiskers at the top of the box (such as that for nitrite and nitrate) indicate that the underlying distribution is skewed toward high concentration. Box plots with large spreads indicate seasonal variations of the water composition (refer to TSS, IP, and silicate box plot). The outliers, such as asterisks in the box plot, pointing to a change in the measured variables in some stations, are likely caused by some anthropogenic activities or climatic factors.
Factor analyses provided four significant factors (Eigenvalue > 1) that explained 61% of the total variance of the dataset in seawater; however, only the first three factors were considered for the result interpretation. The KMO criterion of 0.707 indicated that a significant reduction in the dimensionality of the original dataset has been achieved through factor analysis (FA) for seawater (Wu et al., 2010). The factor loadings and communality of physicochemical parameters are presented in Supplementary Table 1 for seawater. Factor 1 (VF1) explains 27.7% of the total variance and indicates a strong positive loading of ammonia (0.85) and TN (0.78). Furthermore, moderate positive loadings of nitrite (0.69), nitrate (0.55), TP (0.58), and silicate (0.73) were recorded in the seawater (Figure 2A). This could be attributed to the existence of anthropogenic activities such as agriculture and aqua farming in the surrounding vicinities (Iscen et al., 2008; Yuvaraj et al., 2018). Factor 2 (VF2) explains 13.68% of the total variance and indicates a strong positive loading of BOD (0.77), while moderate negative loading of transparency (−0.65), moderate positive loading of TSS (0.67), and IP (0.56) were observed. Lower transparency in the study area indicates a comparatively high TSS concentration, which reduces light penetration (Sarma et al., 2010). Factor 3 (VF3) explains 10.46% of the total variance and indicates a strong positive loading of AT (0.87) and WT (0.84). The temperature could influence the biogeochemical cycles in the environment such as eutrophication (Gupta, 2005; Talukder et al., 2016).
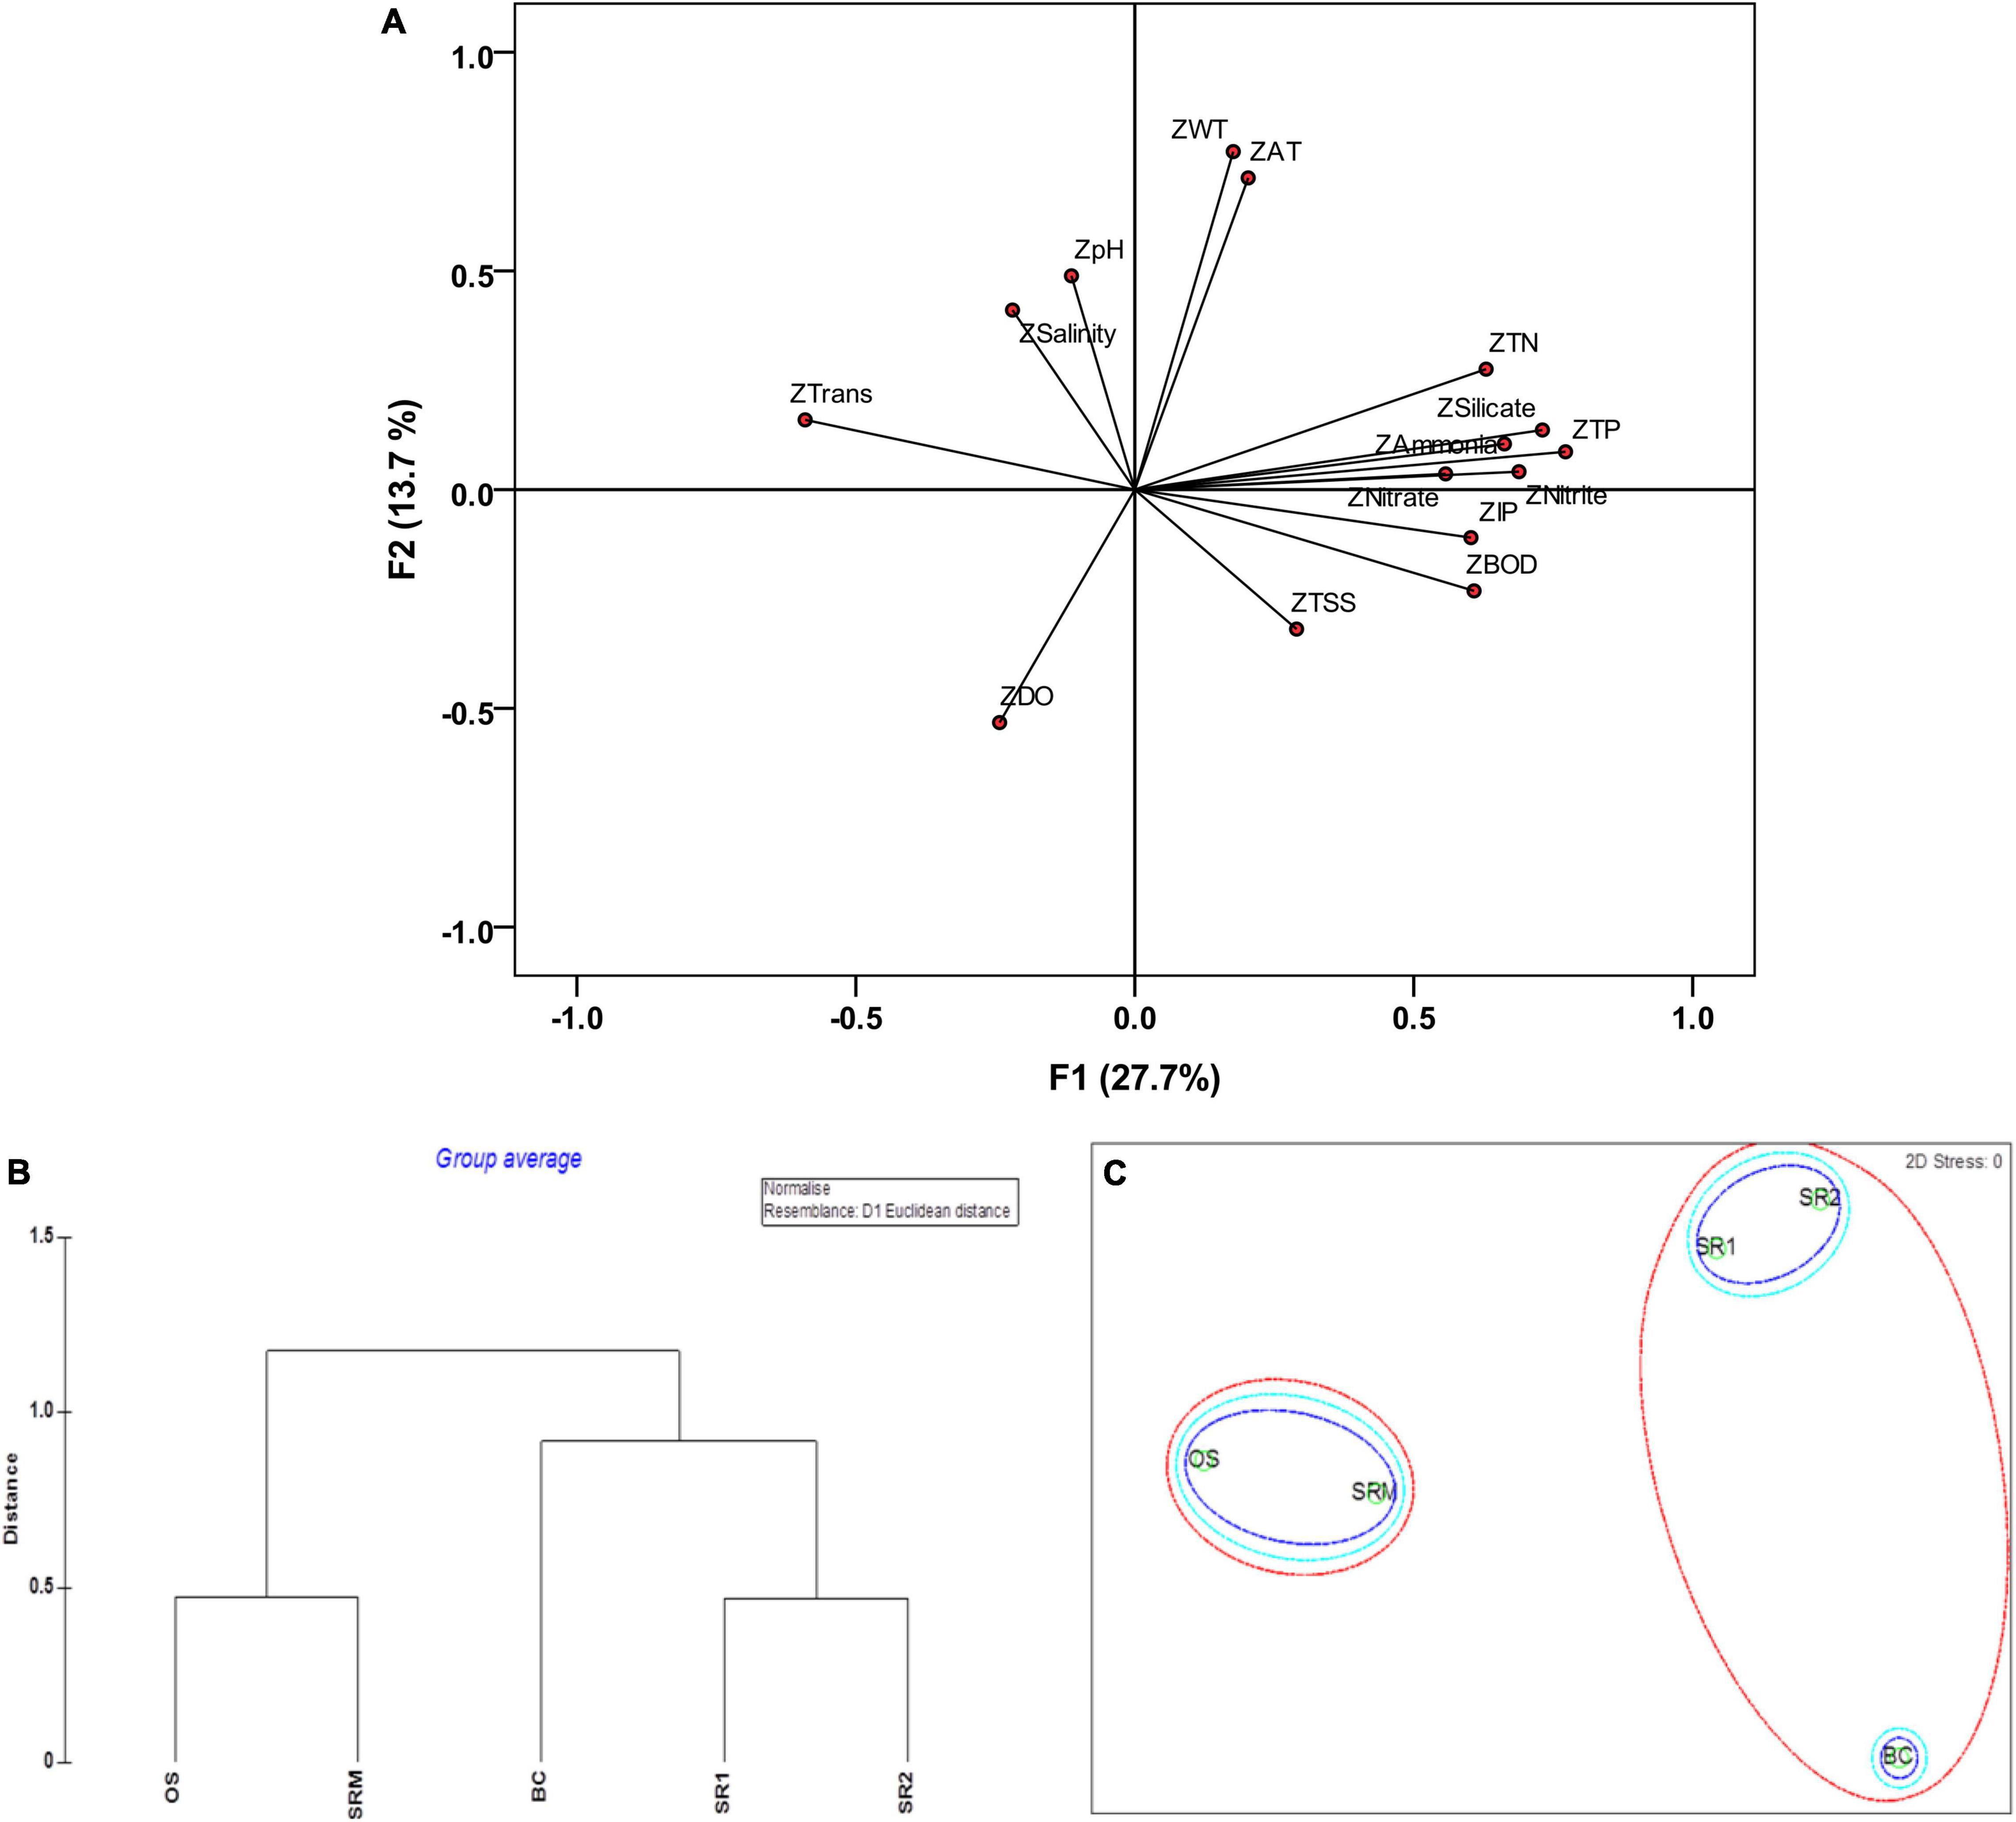
Figure 2. Factor analysis, cluster analysis, and 2D NMDS; (A) factor loading F1 and F2 for the physicochemical parameters, (B) dendrogram based on the physicochemical parameters in seawater, and (C) non-metric multidimensional scaling (NMDS) ordination based on the resemblance (Euclidean distance) similarity coefficient.
The physicochemical data were subjected to cluster analysis (CA) and two-dimensional (2D) non-metric multidimensional scaling (NMDS) ordinations to identify the relationships between the five sampling stations. The analysis provided a dendrogram, which clustered all five sampling stations into three statistically significant clusters (Figure 2B). Cluster 1 was formed between OS and SRM, which revealed that the concentrations of physicochemical parameters at these stations were more similar (for these parameters, TSS, WT, AT, pH, salinity, and DO) to each other than to the other stations. In Cluster 2, the physicochemical parameter concentrations at SR1 and SR2 were more similar to each other than those of BC. The BC showed a higher concentration and, thus, formed a separate cluster, although the wide distance between OS and other stations was due to the dissimilar values obtained. Furthermore, BC, SR1, and SR2 were surrounded by aqua farming, agriculture, and anthropogenic activity, while SRM was a mixing zone (bar mouth) between the estuary and the sea. The physiochemical parameters in seawater distribution showed a similar pattern to that of the CA when subjected to 2D NMDS ordinations (Figure 2C).
The nutrient ratio revealed that the mean N/P ratio was 5.47 and 5.42 at high and low tides, respectively. Similarly, the Si/N ratio was 0.32 and 2.25 at high and low tides, respectively. The N/P ratios lower than 16 indicate nitrate as a limiting factor. Likewise, the Si/N ratio of more than 1 also proposes nitrate as a limiting factor (Sarma et al., 2010). The study reveals that nitrate is the main limiting factor, as reported earlier from other coastal areas (Gupta et al., 1981). Nutrients are brought to the coastal bays by rivers and sewage channels under certain environmental conditions (Xu, 1989). In this study, nitrate and silicate are the main limiting factors for phytoplankton growth. In particular, the multivariate results revealed that the higher concentrations recorded in the inner stations (BC, SR1, and SR2) were mainly due to continuous discharge from the neighboring areas. Anthropogenic input from the surrounding industrial areas and agricultural and aquaculture farms could be a reason for the higher concentration of nutrients in the inner areas. However, the concentration was optimal toward the OS. Although anthropogenic discharge (from aquafarms and settlement areas) is high at the BC, tidal amplitude (0.59 m) (Jha et al., 2019) helps to diminish this effect. An earlier study from the area (Pandey et al., 2021) also suggests that anthropogenic disturbances at BC are considerably higher than other stations, which resulted in poor environmental and ecological quality status.
In particular, the multivariate results revealed that the higher concentrations recorded in the inner stations (BC, SR1, and SR2) were mainly due to continuous discharge from the surrounding areas such as aquafarms, agricultural, and built-up, which could be a reason for the higher concentration of nutrients in the inner stations. However, the concentration was optimal toward the OS. The results presented in this study are consistent with the previous observations, which demonstrated that inner stations (BC, SR1, and SR2) were found with high nutrient concentrations, whereas outer stations (SRM and OS) were within the normal variation of any tropical coastal waters. It was reported that rainfall-runoff has a potential impact on the environment (Mallin et al., 2000), which was observed during November 2015 when a heavy rainfall (775 mm) above the average rainfall (248 mm) was recorded in the Nellore coastal region. Although tidal amplitude minimizes the nutrient concentrations through oceanic dilution, it has an adverse impact on aquatic flora and fauna of the region in the long term if appropriate mitigation and management plan is not developed. Regular monitoring of seawater quality will help to develop a mitigation plan to control the untreated discharges into the coastal environment.
Conclusion
A multivariate statistical approach was used to assess the concentrations and potential impacts of physicochemical parameters on the coastal environment in the Nellore coastal region. Non-metric multidimensional scaling and CA grouped the sampling stations based on prevailing distinctive environmental conditions. The concentrations of physicochemical parameters at the OS illustrated optimal values in seawater compared with that in the other stations. However, the inner stations, such as BC, SR1, and SR2, were categorized as contaminated zones, which could be attributed to anthropogenic activities in the region. FA illustrated that the major sources of variation were anthropogenic discharges [agriculture, aquaculture farms, and settlement (built-up) effluents]. This study suggests that increasing anthropogenic activities draw the need for creating a comprehensive database and monitoring strategy to better plan, conserve, and manage the tropical coastal environment.
Data Availability Statement
The original contributions presented in the study are included in the article/Supplementary Material, further inquiries can be directed to the corresponding author/s.
Author Contributions
KR: sample collection, laboratory analysis, methodology validation, data processing, and writing-original draft. DJ: conceptualization, sampling design, data validation, and manuscript review. MP: manuscript corrections and suggestions. GD: reviewing the manuscript, suggestion, and project administration. All authors contributed to the article and approved the submitted version.
Conflict of Interest
The authors declare that the research was conducted in the absence of any commercial or financial relationships that could be construed as a potential conflict of interest.
Publisher’s Note
All claims expressed in this article are solely those of the authors and do not necessarily represent those of their affiliated organizations, or those of the publisher, the editors and the reviewers. Any product that may be evaluated in this article, or claim that may be made by its manufacturer, is not guaranteed or endorsed by the publisher.
Acknowledgments
We are grateful to the Ministry of Earth Sciences (MoES), Government of India, for providing support to carry out this study. We are thankful to G. A. Ramadass, the director, NIOT, MoES, Government of India, Chennai, for the approval and constant support. We thank R. Kirubagaran, Scientist-G (Retd.), NIOT, for his encouragement. We also thank their colleagues S. Rajaguru, S. Venkatesh, V. P. Limna Mol, and Vikas Pandey and the Indian Meteorological Department.
Supplementary Material
The Supplementary Material for this article can be found online at: https://www.frontiersin.org/articles/10.3389/fmars.2022.857957/full#supplementary-material
Footnotes
- ^ http://www.caa.gov.in/uploaded/doc/registration/AP/Nellore.pdf
- ^ https://www.census2011.co.in/census/district/136-sri-potti-sriramulu-nellore.html
References
APHA (2012). Standard Methods for the Examination of Water and Wastewater, 22nd edition 2540 D. Total Suspended Solids Dried at 103–105 °C. Washington, DC: APHA, 2–56.
Barbier Edward, B., Hacker Sally, D., Kennedy, C., Koch, E. W., Stier, A. C., and Silliman, B. R. (2011). The value of estuarine and coastal ecosystem services. Ecol. Monogr. 81, 169–193. doi: 10.1890/10-1510.1
Grasshoff, K., Kremling, K., and Ehrhardt, M. (1999). Methods of Seawater Analysis, 3rd Edn. Weinheim: Verlag Chemie. doi: 10.1002/9783527613984
Gupta, A. K., Gupta, S. K., and Patil, R. S. (2003). A comparison of water quality indices for coastal water. J. Environ. Sci. Health A 38, 2711–2725. doi: 10.1081/ese-120024458
Gupta, R. S., Moraes, C., George, M. D., Kureishy, T. W., Noronha, R. J., and Fondekar, S. P. (1981). Chemistry & hydrography of the Andaman Sea. Indian J. Mar. Sci. 10, 228–233.
Iscen, C. F., Emiroglu, O., Ilhan, S., Arslan, N., Yilmaz, V., and Ahiska, S. (2008). Application of multivariate statistical techniques in the assessment of surface water quality in Uluabat Lake, Turkey. Environ. Monit. Assess. 144, 269–276. doi: 10.1007/s10661-007-9989-3
Jha, D. K., Devi, M. P., Vidyalakshmi, R., Brindha, B., Vinithkumar, N. V., and Kirubagaran, R. (2015). Water quality assessment using water quality index and geographical information system methods in the coastal waters of Andaman Sea, India. Mar. Pollut. Bull. 100, 555–561. doi: 10.1016/j.marpolbul.2015.08.032
Jha, D. K., Pandey, V., Santhanakumar, J., Sathish Kumar, P., Venkatnarayanan, S., Jebakumar, J. P. P., et al. (2022). Evaluation of site suitability for artificial reefs deployment in southeast coast of India using GIS as a management tool. Front. Mar. Sci. 8:817975. doi: 10.3389/fmars.2021.817975
Jha, D. K., Ratnam, K., Rajaguru, S., Dharani, G., Devi, M. P., and Kirubagaran, R. (2019). Evaluation of trace metals in seawater, sediments, and bivalves of Nellore, southeast coast of India, by using multivariate and ecological tool. Mar. Pollut. Bull. 146, 1–10. doi: 10.1016/j.marpolbul.2019.05.044
Jickells, T. D. (1998). Nutrient biogeochemistry of the coastal zone. Science 281, 217–222. doi: 10.1126/science.281.5374.217
Liu, C. W., Lin, K. H., and Kuo, Y. M. (2003). Application of factor analysis in the assessment of groundwater quality in a blackfoot disease area in Taiwan. Sci. Total Environ. 313, 77–89. doi: 10.1016/S0048-9697(02)00683-6
Mallin, M., Williams, K., Esham, E., and Lowe, R. (2000). Effect of human development on bacteriological water quality in coastal watersheds. Ecol. Appl. 10, 1047–1056. doi: 10.1890/1051-0761(2000)010[1047:eohdob]2.0.co;2
Moresco, V., Viancelli, A., Nascimento, M. A., Souza, D. S. M., Ramos, A. P. D., Garcia, L. A. T., et al. (2012). Microbiological and physicochemical analysis of the coastal waters of Southern Brazil. Mar. Pollut. Bull. 64, 40–48. doi: 10.1016/j.marpolbul.2011.10.026
Pandey, V., Jha, D. K., Sathish Kumar, P., Santhanakumar, J., Venkatnaraynan, S., Jebakumar, J. P. P., et al. (2022). Effect of multiple stressors on the functional traits of sub-tidal macrobenthic fauna: a case study of the southeast coast of India. Mar. Pollut. Bull. 175:113355. doi: 10.1016/j.marpolbul.2022.113355
Pandey, V., Venkatnarayanan, S., Sathish Kumar, K., Ratnam, K., Jha, D. K., Rajaguru, S., et al. (2021). Assessment of ecological health of Swarnamukhi river estuary, southeast coast of India, through AMBI indices and multivariate tools. Mar. Pollut. Bull. 164:112031. doi: 10.1016/j.marpolbul.2021.112031
Patel, P., Raju, N. J., Reddy, B. C. S. R., Suresh, U., Sankar, D. B., and Reddy, T. V. K. (2018). Heavy metal contamination in river water and sediments of the Swarnamukhi river basin, India: risk assessment and environmental implications. Environ. Geochem. Health 40, 609–623. doi: 10.1007/s10653-017-0006-7
Reddi, K. R., Jayaraju, N., Suriyakumar, I., and Sreenivas, K. (1993). Tidal fluctuation in relation to certain physio-chemical parameters in Swarnamukhi river estuary, East coast of India. Ind. J. Mar. Sci. 22, 232–234.
Saravanan, K. R., Sivakumar, K., and Choudhury, B. C. (2013). “Important coastal and marine biodiversity areas of India,” in Coastal and Marine Protected Areas in India: Challenges and Way Forward, ENVIS Bulletin: Wildlife & Protected Areas, Vol. 15, ed. K. Sivakumar (Dehradun: Wildlife Institute of India), 134–188. doi: 10.1007/978-3-642-38200-0_30
Sarma, V. V. S. S., Prasad, V. R., Kumar, B. S. K., Rajeev, K., Devi, B. M. M., Reddy, N. P. C., et al. (2010). Intra-annual variability in nutrients in the Godavari estuary, India. Cont. Shelf Res. 30, 2005–2014. doi: 10.1016/j.csr.2010.10.001
Shanthi, R., Poornima, D., Raja, S., Vijayabaskara Sethubathi, G., Thangaradjou, T., Balasubramanian, T., et al. (2013). Validation of OCM-2 sensor performance in retrieving chlorophyll and TSM along the southwest Bay of Bengal Coast. J. Earth Syst. Sci. 122, 479–489. doi: 10.1007/s12040-013-0286-y
Su, S., Junjun, Z., Liping, L., Fang, H., Xia, C., and Jiaping, W. (2011). Spatio-temporal patterns and source apportionment of pollution in Qiantang river (China) using neural-based modeling and multivariate statistical techniques. Phys. Chem. Earth 36, 379–386. doi: 10.1016/j.pce.2010.03.021
Sreenivasulu, G., Jayaraju, N., Sundara Raja Reddy, B. C., Lakshmi Prasad, T., Lakshmanna, B., Nagalakshmi, K., et al. (2016). River mouth dynamics of Swarnamukhi estuary, Nellore coast, southeast coast of India. Geod. Geodyn. 7, 387–395. doi: 10.1016/j.geog.2016.09.003
Sundara Raja Reddy, B. C., Jayaraju, N., Sreenivasulu, G., Suresh, U., and Reddy, A. N. (2016). Heavy metal pollution monitoring with foraminifera in the estuaries of Nellore coast, East coast of India. Mar. Pollut. Bull. 113, 542–551. doi: 10.1016/j.marpolbul.2016.08.051
Talukder, A., Mallick, D., Hasin, T., Anka, I., and Hasan, M. M. (2016). Spatio-temporal variability in hydrochemical characteristics of coastal waters of Salimpur, Chittagong along the Bay of Bengal. J. Fish. 4, 335–344. doi: 10.17017/jfish.v4i1.2016.104
Van Nieuwerburgh, L., Wanstrand, I., and Snoeijs, P. (2004). Growth and C:N:P ratios in copepods grazing on N- or Si-limited phytoplankton blooms. Hydrobiologia 514, 57–72. doi: 10.1023/b:hydr.0000018206.02271.2b
Vega, M., Pardo, R., Barrado, E., and Deban, L. (1998). Assessment of seasonal and polluting effects on the quality of river water by exploratory data analysis. Water Res. 32, 3581–3592. doi: 10.1016/s0043-1354(98)00138-9
Winkler, L. W. (1888). Die bestimmung des in wasser gelosten sauerstoffen. Ber. Der Dtsch. Chemischen Ges. 21, 2843–2855.
Wu, M. L., Wang, Y. S., Sun, C. C., Wang, H., Dong, J. D., Yin, J. P., et al. (2010). Identification of coastal water quality by statistical analysis methods in Daya Bay, South China Sea. Mar. Pollut. Bull. 60, 852–860. doi: 10.1016/j.marpolbul.2010.01.007
Wunderlin, D. A., Diaz, M. P., Ame, M. V., Pesce, S. F., Hued, A. C., and Bistoni, M. (2001). Pattern recognition techniques for the evaluation of spatial and temporal variation in water quality. a case study: Suquia river basin (Cordoba Argentina). Water Res. 35, 2881–2894. doi: 10.1016/s0043-1354(00)00592-3
Yuvaraj, P., Satheeswaran, T., Damotharan, P., Karthikeyan, V., Jha, D. K., Dharani, G., et al. (2018). Evaluation of the environmental quality of Parangipettai, southeast coast of India, by using multivariate and geospatial tool. Mar. Pollut. Bull. 131, 239–247. doi: 10.1016/j.marpolbul.2018.04.022
Keywords: physicochemical, multivariate, factor analysis, cluster, Nellore
Citation: Ratnam K, Jha DK, Prashanthi Devi M and Dharani G (2022) Evaluation of Physicochemical Characteristics of Coastal Waters of Nellore, Southeast Coast of India, by a Multivariate Statistical Approach. Front. Mar. Sci. 9:857957. doi: 10.3389/fmars.2022.857957
Received: 19 January 2022; Accepted: 07 February 2022;
Published: 10 March 2022.
Edited by:
Rathinam Arthur James, Bharathidasan University, IndiaReviewed by:
Rajani Kanta Mishra, National Centre for Polar and Ocean Research (NCPOR), IndiaVinitha Ebenezer, Dalhousie University, Canada
Copyright © 2022 Ratnam, Jha, Prashanthi Devi and Dharani. This is an open-access article distributed under the terms of the Creative Commons Attribution License (CC BY). The use, distribution or reproduction in other forums is permitted, provided the original author(s) and the copyright owner(s) are credited and that the original publication in this journal is cited, in accordance with accepted academic practice. No use, distribution or reproduction is permitted which does not comply with these terms.
*Correspondence: Krupa Ratnam, cmF0bmFta3J1cGFAZ21haWwuY29t; M. Prashanthi Devi, cHJhc2hhbnRoaWRldmlAZ21haWwuY29t