 Tianyuan Zheng
 Mingpeng Gao1,2
94% of researchers rate our articles as excellent or good
Learn more about the work of our research integrity team to safeguard the quality of each article we publish.
Find out more
ORIGINAL RESEARCH article
Front. Mar. Sci. , 29 March 2022
Sec. Coastal Ocean Processes
Volume 9 - 2022 | https://doi.org/10.3389/fmars.2022.857807
Fresh groundwater resources in coastal regions are valuable but deteriorated by seawater intrusion. To prevent deterioration of the fresh groundwater resources, a common approach is to build cut-off walls. However, the construction of cut-off walls may trap a large amount of residual saltwater in the landward aquifer. This study explored the dynamic behavior and the desalination process of the intruding seawater after the construction of a cut-off wall, using a numerical model validated against a laboratory experiment. Field-scale simulations reveal that a fast saltwater repulsion process proceeds within a short period (100-150 days), while the retreat of the residual saltwater wedge is rather slow at the beginning. This is because the desalination process always starts first in the vertical direction. Meanwhile, the saltwater area significantly increases in the downstream of the cut-off wall. The amount of residual saltwater mainly depends on the depth and the hydraulic conductivity of the cut-off wall, while the retreat time is affected by the location of the wall. Although a deeper cut-off wall can enhance the removal of residual saltwater, the desalination effectiveness may notably decrease when the depth exceeds a certain value (25 m in the simulated scenarios). The desalination performance degrades dramatically when the hydraulic conductivity of the wall is greater than a certain threshold (8×10⁻⁷ m/s in the simulated cases). A near-complete removal of residual saltwater can be achieved within three years with optimal designs of the depth, location, and hydraulic conductivity of the cut-off wall.
● The dynamic behavior of saltwater wedge after installing a cut-off wall is firstly revealed.
● The timescale of residual saltwater retreat ranges from several months to several years.
● A deeper cut-off wall may reduce the desalination effect and determination of optimal depth is required before practical work.
Over the past few decades, the continuous increase in sea levels resulting from climate changes (Rozell & Wong, 2010) and groundwater level drops induced by overexploitation of coastal aquifers led to seawater intrusion (SWI), which has become a serious threat to coastal groundwater quality (Lu et al., 2009; Werner & Simmons, 2009; Werner et al., 2013; Walther et al., 2017). In this context, it is imperative to develop efficient approaches to control SWI, thereby ensuring water supply for human activities (Lu et al., 2010; Abarca et al., 2013; Lu et al., 2015). Existing engineering approaches for SWI prevention can be categorized into two groups: physical barriers (Chang et al., 2019; Zhang et al., 2019; Zheng et al., 2020; Chang et al., 2021; Gao et al., 2021; Sun et al., 2021) and hydraulic barriers (artificial recharge by injection or infiltration, saltwater extraction) (Abarca et al., 2006; Luyun et al., 2009; Luyun et al., 2011; Allow, 2012; Lu et al., 2017).
The geological conditions of many parts of China and Japan (i.e., islands and arid areas) are not suitable for constructing the traditional water supply systems, thereby limiting the installation of hydraulic barriers (Luyun et al., 2009). Owing to the relatively low operating costs and stable desalination performance, subsurface physical barriers have been widely applied in China, Japan, USA, and African countries (Luyun et al., 2009; Chang et al., 2019). According to the structure and layout, impermeable subsurface physical barriers can be classified as subsurface dams or cut-off walls (Zheng et al., 2020), as shown in Figure 1. A subsurface dam is installed at the bottom of the aquifer, leaving an opening at the top of the barrier for upstream fresh groundwater discharge (Fang et al., 2021) (Figure 1A). A cut-off wall is constructed at the top of the aquifer, leaving an opening at the bottom (Figure 1B). In this case, the intruding saltwater could be pushed back with increased freshwater flux. Since the 1990s, eight physical barriers have been successfully installed for desalinizing the intruding seawater in Yantai, Weihai, and Qingdao, China (Sun et al., 2019). These walls are 0.3-1.5 m thick and constructed using the rotary jet grouting technique. Figure 2 shows a practical cut-off wall constructed in Yantai.
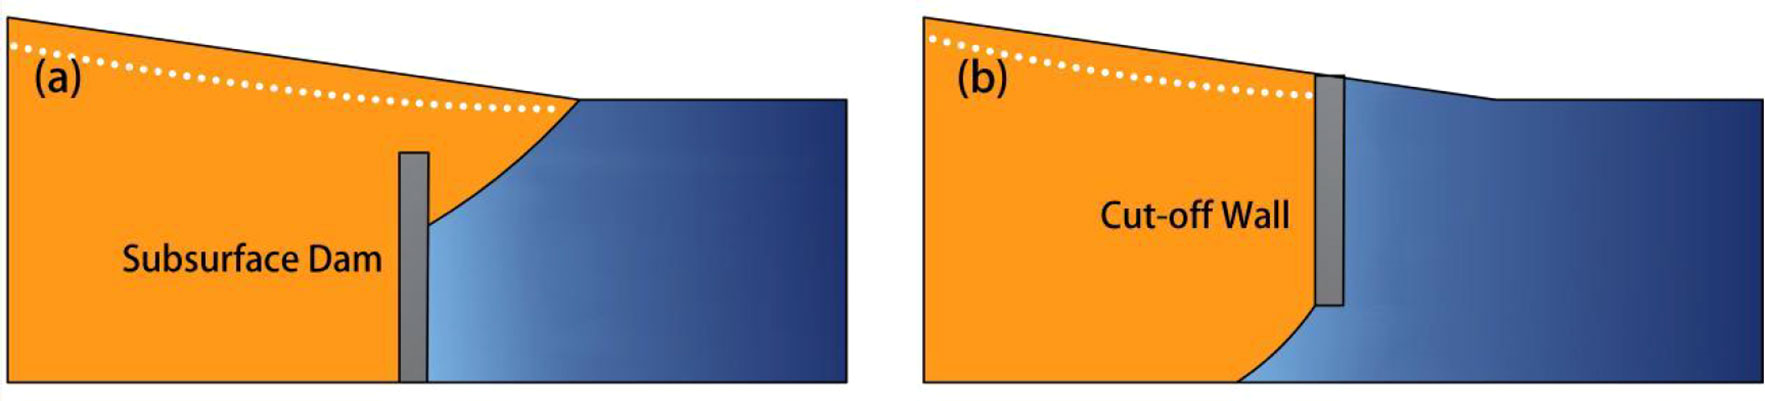
Figure 1 Schematic of a subsurface dam (A) and a cut-off wall (B).
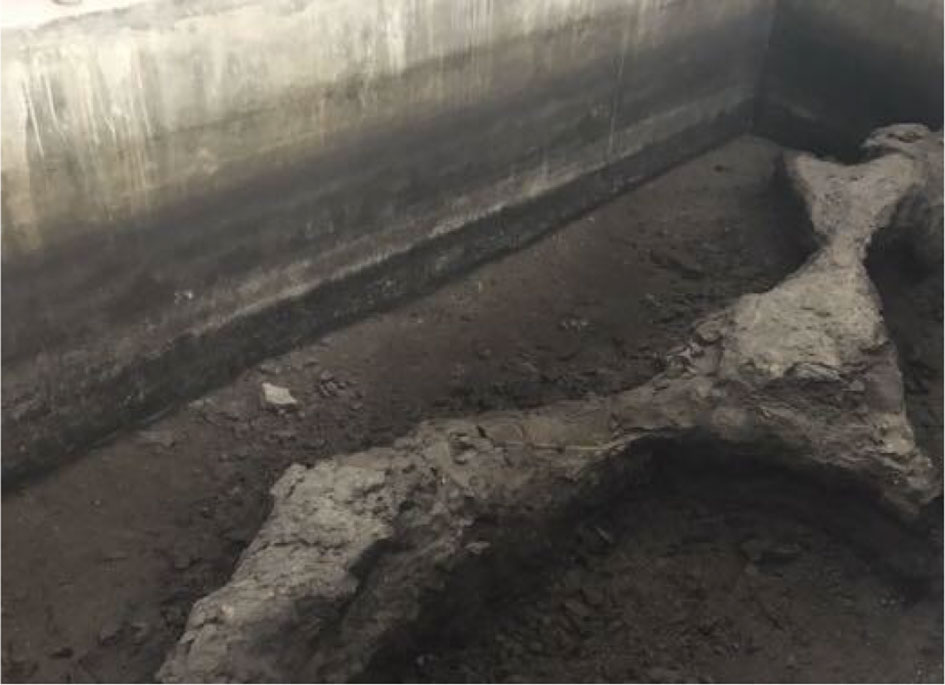
Figure 2 Photo of the cut-off wall constructed in Yantai, China.
A cut-off wall is regarded as an effective method to control the residual saltwater in many situations, e.g., in the thin phreatic aquifers (Chang et al., 2021; Sun et al., 2021). After installation, the intruding seawater can be flushed out by the relatively high flow rate generated at the bottom opening of the aquifer. Several studies have evaluated the effectiveness of cut-off walls under different hydrological conditions. For example, Kaleris and Ziogas (2013) numerically investigated the effectiveness of cut-off walls in SWI prevention with groundwater extractions. The results indicated that the cut-off wall may more effectively prevent SWI when when the extractions are located at relatively small distance from the coast, at relatively large depth and the aquifer is characterized by small groundwater velocity compared to the velocity of the intruding saltwater, weak mixing and high-level anisotropy. Zheng et al. (2020) proposed a new cut-off wall with varying permeability (an impermeable zone on the top and a semi-permeable region on the bottom) to mitigate the nitrate accumulation. Besides the efficient prevention of SWI, the inland nitrate accumulation is also significantly reduced by the newly designed cut-off wall. Gao et al. (2021) investigated the combined effect of a cut-off wall and a subsurface dam. They found that the combination of the two structures may enhance the prevention of SWI and discharge of freshwater simultaneously.
Insights into the saltwater behavior after the construction of physical barriers is of great significance for the use of groundwater resources in the coastal aquifers. Oswald et al. (2002) and Oswald and Kinzelbach (2004) found that, under certain conditions, the saltwater would remain stagnant for a long period. Cantalice et al. (2016) pointed out the significant desalination of the upstream groundwater after the installation of subsurface dams. Zheng et al. (2021) pointed out that the long removal period (up to decades) of residual saltwater after installation of subsurface dams. Wu et al. (2020) used a 3-D model to investigate the influence of dam length on the effectiveness of SWI prevention. Zhang et al. (2021) found that using local pit lake can enhance the efficiency of saltwater desalination. Yan et al. (2021) investigated the potential of constructing subsurface dams to expand freshwater lense in islands.
Most previous studies only focused on the prevention effects of subsurface physical barriers. The dynamic desalination process and transient behavior of the saltwater wedge rather than simple saltwater intrusion and retreat induced by the construction of cut-off walls were not investigated sufficiently. Meanwhile, all the experiments and numerical simulations were limited in the scale of centimeters to meters and the total desalination process only takes several hours (Luyun et al., 2009; Luyun et al., 2011). Given the economic consideration and technical limitations of cut-off walls in different regions of the world, the depth, location, and hydraulic conductivity of the walls may vary greatly from case to case. In this study, we conducted field-scale numerical simulations to (i) capture the dynamic processes of the residual saltwater in the upstream aquifer after the construction of cut-off walls; (ii) evaluate the effects of the depth, location and hydraulic conductivity of the wall on the residual saltwater desalination; (iii) clarify the removal timescales of residual saltwater desalination in a real-world aquifer scale.
Regarding the characteristics of the investigated problem in this study, the following assumptions are made: (a) the aquifer is unconfined, homogeneous, and isotropic, (b) the fluid density only depends on the salt concentration, (c) both the fluid and solid matrix are incompressible, (d) a static seaward boundary without considering tides. On this basis, a set of testing scenarios with different wall configurations are designed (Chang et al., 2019; Zheng et al., 2021).
Considering the above assumptions, the Richard’s equation coupled with a solute transport equation is used for the mathematical model. The Richard’s equation is as follows,
where θ is the porosity of aquifer, s is the water saturation, ρ is the fluid density, kr is the relative hydraulic conductivity, K is the hydraulic conductivity, ψ is the capillary pressure and e is the gravitational unit vector. The solute transport equation is given as,
where C is dissolved concentration.
The density ratio α was given by:
where ρ0 is the inland freshwater density.
The relationship between relative permeability, capillary pressure, and phase saturation was described by Van Genuchten (1980):
where sres is the residual water saturation, α and n are the constants.
A laboratory experiment was conducted in a flow tank to validate the presented numerical model. The tank dimensions and experimental setup are shown in Figure 3. The tank was segmented into three parts with porous acrylic plates: the freshwater reservoir, the porous medium chamber, and the saltwater reservoir arranged left-to-right (Gao et al., 2021). Two fine mesh screens were inserted into the porous acrylic plates between the reservoirs, respectively, allowing water to flow through and stemming the porous medium. A homogeneous aquifer is represented by filling uniform glass beads with a diameter of 0.7 mm into the chamber.
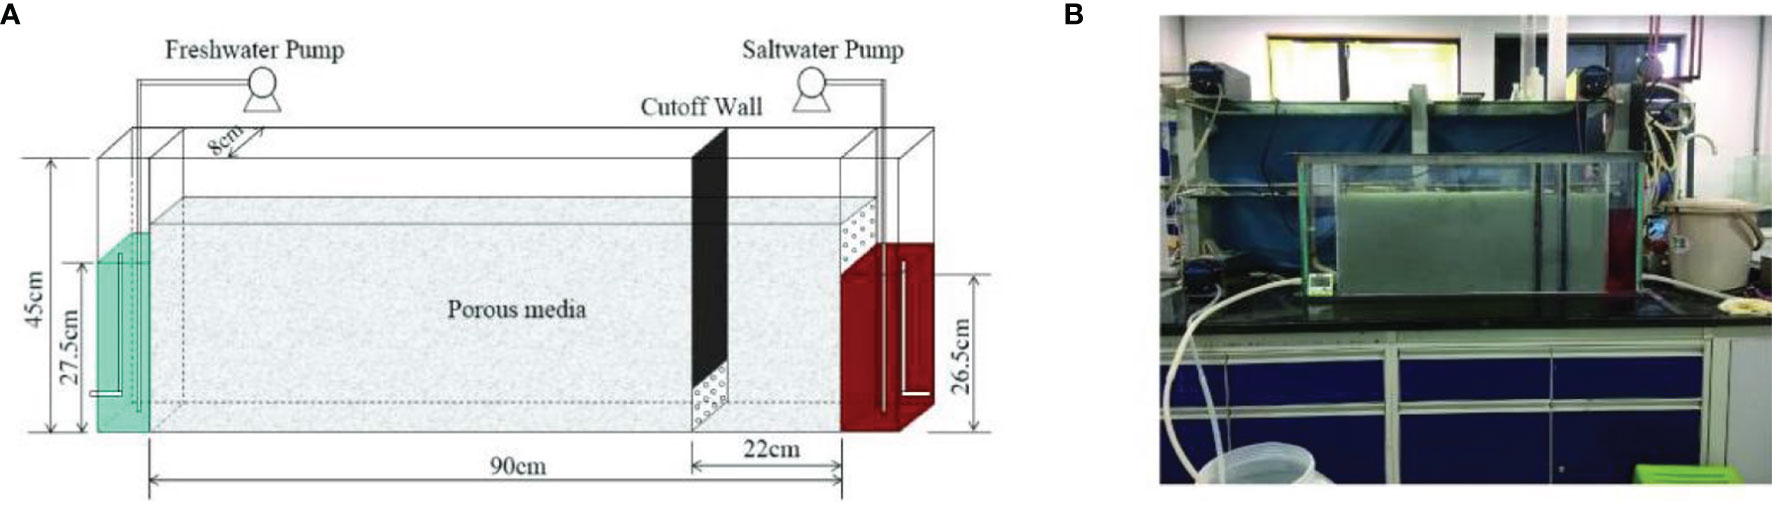
Figure 3 The schematic (A) and photo (B) of the experimental setup (Gao et al., 2021).
A slot was prepared for the insertion of a physical barrier, representing the construction of the cut-off wall. This slot was located in the porous medium chamber 22 cm away from the saltwater reservoir (Figure 3A). The slot baffles were made of fine mesh screens covered porous acrylic sheets. The barrier was installed after the SWI reached the steady state. Particularly, the installation of the barrier must be quick enough to minimize disturbance to the flow field. Tape measures with 1-mm accuracy were attached to the bottom and two sides of the tank to evaluate the intrusion distance of the saltwater wedge.
Tap water was used to represent inland freshwater, and saltwater was prepared by mixing commercial salt with the tap water. A densitometer (AlfaMirage sd-200l) was used to determine the densities of the saltwater (ρs) and the freshwater (ρf). To differentiate the saltwater from the freshwater, we dyed the saltwater with a carmine dye (red food color, provided by Sinopharm Chemical Reagent Co., Ltd) with a concentration of 0.5 g/L. Two peristaltic pumps were used to extract the freshwater and saltwater at constant rates. Constant water heads at the saltwater side and the freshwater side were maintained to be 0.265 m and 0.275 m, respectively.
Glass beads were filled into the porous medium chamber under saturated conditions and stirred every 5 minutes during the filling to minimize the generation of air bubbles. The freshwater pumped into the freshwater reservoir on the left side of the tank was slowly filled in the porous medium. The saltwater was pumped into the reservoir from the right side after the freshwater flowed out in the outlet of the saltwater reservoir. A saltwater wedge formed at the bottom of the tank due to the density difference between the freshwater and the saltwater. By adjusting the inlet flow rates, water head fluctuations were controlled to be within 1-mm to ensure the accuracy of the experiment.
The porosity (ϕ) measured by the volume method was 0.4. Specifically, we took a certain volume of the glass beads in the beaker and filled it with water until being saturated. The porosity was then obtained by dividing the filled water amount with the volume of the glass beads. The average hydraulic conductivity (Kavg) of the porous medium was determined by Darcy’s law and Kavg= 0.0048 m/s. The longitudinal dispersivity (αL) of the porous medium was acquired by fitting the breakthrough curves in a 1-D column experiment and αL= 0.0015 m, a reasonable value in laboratory-scale experiments, cf. Sun et al. (2019) and Chang et al. (2020). The transversal dispersivity (αT) was set to 10% of the longitudinal dispersivity, i.e., αT= 0.00015 m. We recorded the toe position of the saltwater wedge every 10 minutes as a quantitative indicator for evaluating the SWI process (Feseker, 2007; Watson et al., 2010; Yu et al., 2019). The record was ceased when the saltwater wedge reached the quasi-steady state, i.e., the change of toe position within 30 minutes was less than 1 mm.
Based on the measured parameters from the experiment and the laboratory settings, we set up a laboratory-scale numerical model using OpenGeoSys (Kolditz et al., 2012) to simulate the desalination process. The model domain was a homogeneous, 2-D cross section with the dimensions being 0.90 m (length) × 0.27 m (height). The boundary conditions and the initial conditions were consistent with the experiment.
Figure 4 shows the measured and simulated transient intrusion and retreat process after the construction of the cut-off wall. Clearly, due to the cut-off wall, the saltwater wedge first stretches, meaning that the saltwater wedge toe position advances and reaches the maxima after 10 minutes. Then, it starts to retreat until around 80 minutes and the saltwater wedge length has decreased to 21 cm at that time. Also, the simulation results generally agree well with the experimental data. Note that the insertion of the barrier may disturb the flow field in the retreat process, leading to a slight difference between the two approaches.
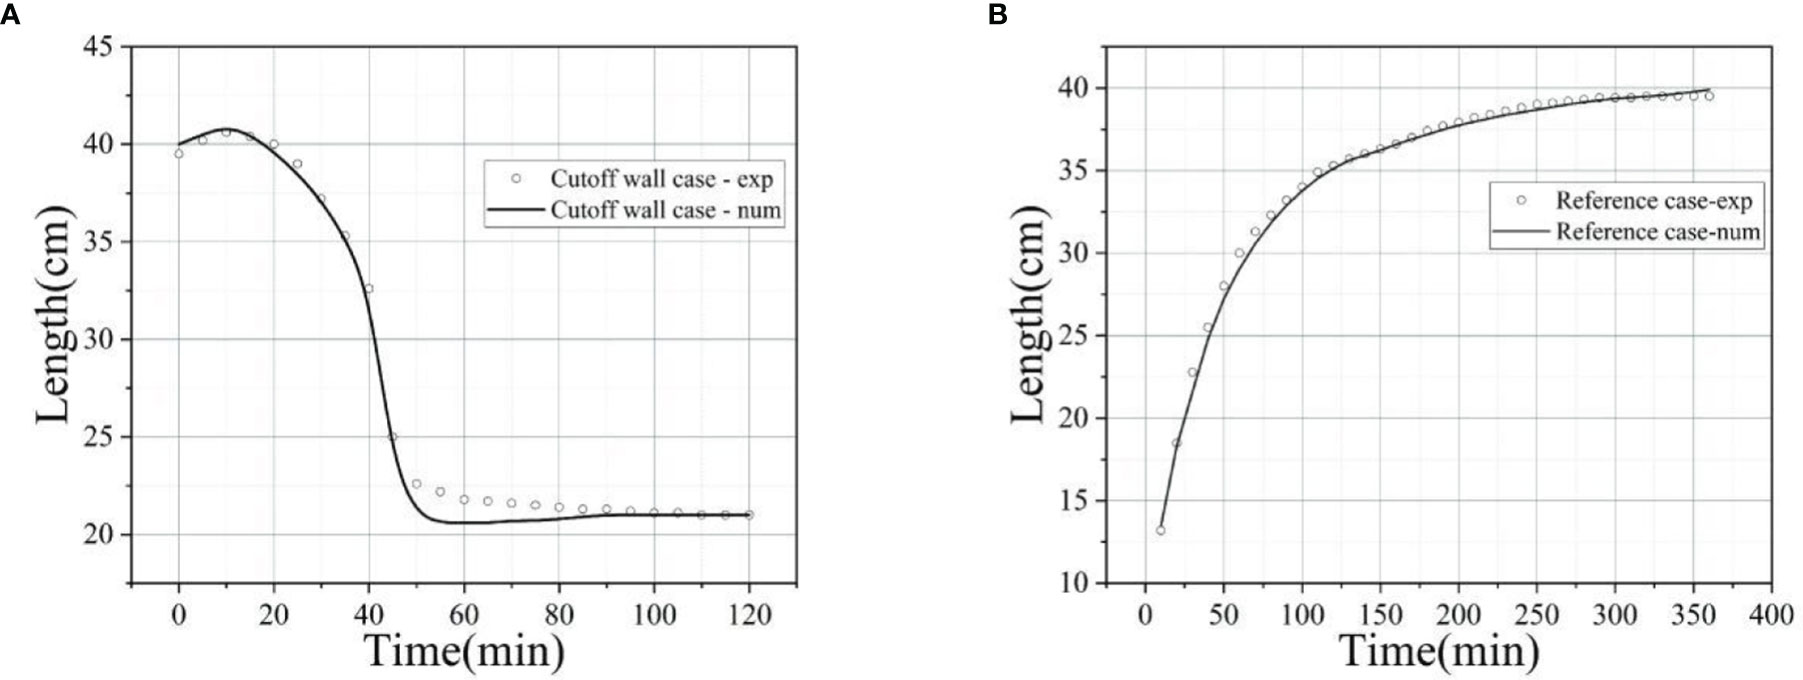
Figure 4 Comparison of the simulated transient numerical model with experimental results during the intrusion process (A) and the retreat process after the construction of the cut-off wall (B). The hollow dots represent the experimental data, and the black lines represent the simulation results.
Figure 5 delineates the model setup (Zheng et al., 2021), in which q is the fluid flow and P is pressure. The model domain is 300 m (length) × 30 m (height). Neumann no-flow boundary conditions for both mass and fluid transport are assigned on the upper and bottom of the domain. Dirichlet constant water level boundaries are set to both the left (29.7 m) and the right sides (28.8 m) of the domain. Dirichlet mass boundaries are assigned with a constant salt concentration of cs= 36000 mg/L and cf= 0 mg/L on the seaward and the inland boundaries, respectively. A 0.5-m thick cut-off wall is installed at a prescribed location along the x -axis of the domain. Before the simulation, no saltwater existed in the domain.

Figure 5 Model setup for the field-scale numerical simulation in an unconfined aquifer.
The presented model is implemented by OpenGeoSys (Kolditz et al., 2012). The iterative solver Preconditioned Conjugate-Gradient (PCG) is applied for solving the linear matrix with a relative tolerance of 10-8. Matlab (Mathworks, I., 2012) and Paraview (Ahrens et al., 2005) are used for post-processing the simulation results.
An adaptive time step method is employed. The entire simulation period is separated into two stages: a warm-up period and a desalination period. The warm-up period takes 1000 days until the intruding saltwater wedge reaches a steady-state. The simulated water heads and salt concentrations from the first period are set as initial values for the removal process of the residual saltwater. During the desalination period, a very low-permeability region (hydraulic conductivity of 1 × 10⁻⁷ m/s for the reference case) is set inside the aquifer to represent the cut-off wall. All simulations are run for 1080 days to ensure that the retreat of the residual saltwater wedge reaches a steady-state. The construction of the cut-off wall is assumed to be instantaneous.
The hydrological parameters used in the simulated scenarios are listed in Table 1, with the cut-off wall parameters used in the reference case highlighted. To quantify the impact of wall design on the desalination process, we simulate different cases with the wall heights ranging from 19 to 27 m, the wall being 20-70 m away from the seaward boundary, and the hydraulic conductivity varying between 1 × 10⁻⁸ and 2 × 10⁻⁵ m/s.
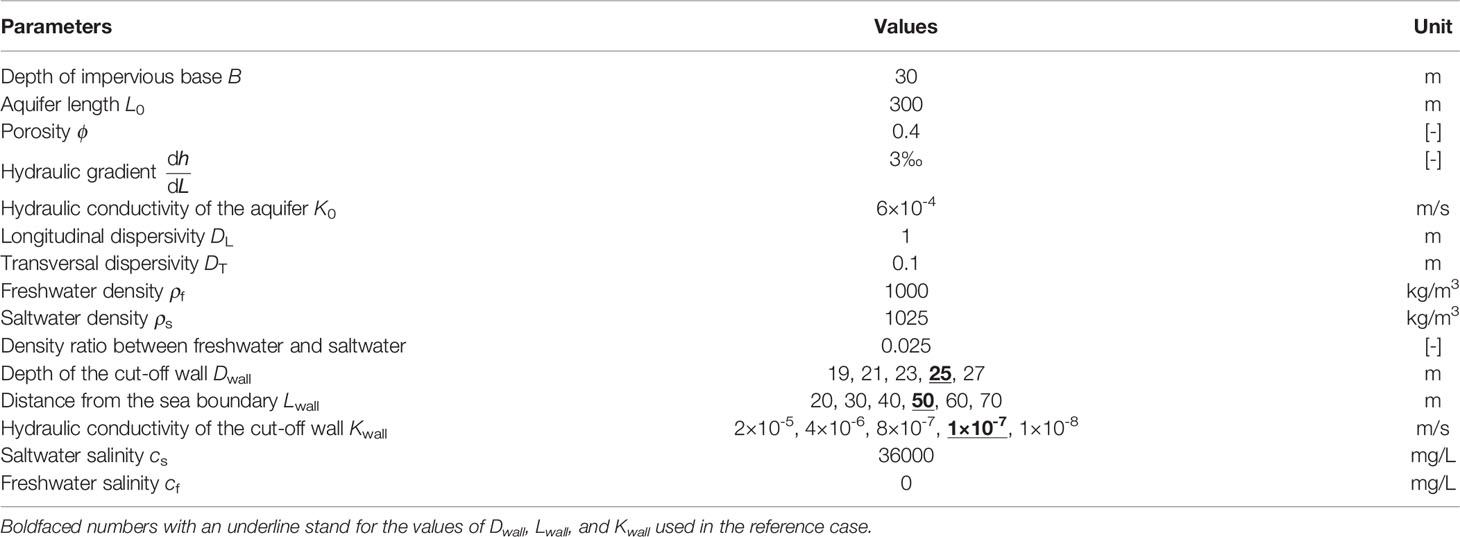
Table 1 Parameters used in simulations (adopted from Ishida et al., 2011, Badaruddin et al., 2017, Zheng et al., 2021).
To evaluate the desalination process of the residual saltwater after the construction of cut-off walls, two indicators are used: the reduction rate of residual saltwater wedge length (RSWL*) and the removal rate of total residual salt mass (RTSM*) in the aquifer (Zheng et al., 2021). RSWL and RTSM for quantitative evaluations have been previously adopted by Zheng et al. (2021). Here, we also give a brief review for the sake of the integrity of the context. The saltwater wedge is considered to be the area of saltwater surrounded by the isoline of 50%cs (18000 mg/L) (Goswami and Clement, 2007; Strack et al., 2016). RSWL* is defined as,
where RSWL is the distance between the residual saltwater toe and the cut-off wall (Figure 5). RSWL0 represents the initial length of residual saltwater wedge downstream the cut-off wall. RSWL0 is constant for most of the cases and only varies for the cases with wall at different positions. RSWL* becomes negative when the saltwater wedge advances into the fresh aquifer after the construction of the cut-off wall, and is positive when the saltwater wedge retreats toward the seaward boundary.
RTSM* is defined in a dimensionless form as,
where RTSM is the total residual saltwater mass downstream the cut-off wall in the landward aquifer. RTSM0 is the initial total saltwater mass trapped behind the wall. It is constant for most cases but varies in the cases with different wall locations. RTSM is always smaller than RTSM0 and thus positive.
Regarding the definitions stated above, it can be summarized that RSWL* is used to evaluate the intrusion states of high-concentration saltwater surrounded by the isoline of 50%cs, while RTSM* quantifies the effectiveness of complete removal of the residual saltwater. With the two indexes, the dynamics of the residual saltwater can be accurately described.
In this section, we investigate the transient groundwater flow and salt transport before and after the construction of the cut-off wall. We model a scenario where a 150 m-length saltwater wedge has intruded into the bottom of a freshwater aquifer and reached the steady state (Figure 6A). The whole aquifer can be divided into three zones: the saltwater zone, the freshwater zone and the mixing zone. In the saltwater zone, the saltwater flows slowly toward the inland boundary. Meanwhile, the fresh groundwater carrying some saltwater through the dispersive zone flows above the saltwater wedge influenced by the combined effects of hydraulic gradient and buoyancy, and finally the groundwater merges into the seaward boundary. In general, the freshwater moves much faster than the saltwater in the aquifer.
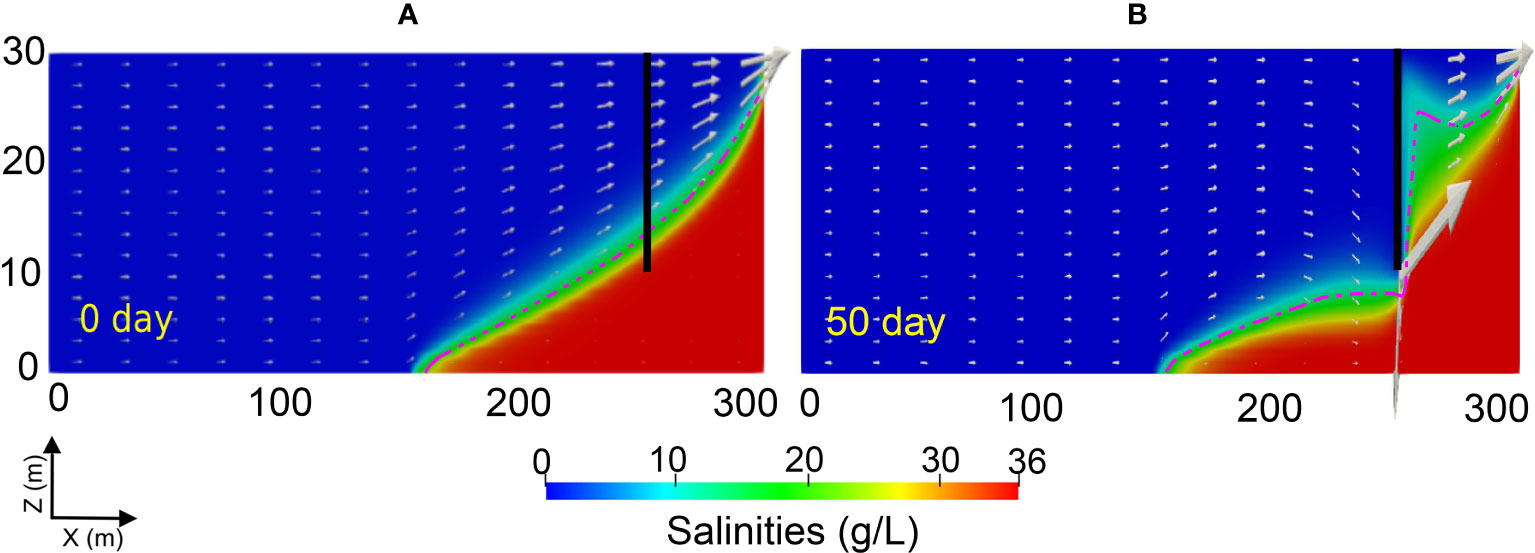
Figure 6 Transient distributions of groundwater flow and saltwater wedge after the construction of a 25 m-depth cut-off wall at 50 m from the seaward boundary at 0 day (A) and 50 days (B). The vertical black lines indicate the installed cut-off wall, the red dotted lines represent the isolines of 50% salinity of the saltwater, the white arrows represent the magnitude and direction of groundwater flows.
50 days after the construction of a 20 m-depth cut-off wall at 50-m away from the seaward boundary, the freshwater is forced to flow through the opening below the impermeable cut-off wall. The flow rate increases near the cut-off wall and reaches the maximum exactly below the wall (Figure 6B). Meanwhile, the freshwater flows through the narrow opening and carries salt toward the seaward boundary, resulting in a reduction of the residual saltwater upstream the cut-off wall. At the seaside, the mixing zone becomes much wider than that at the beginning and the freshwater area at the upper part of the aquifer is mitigated. This is because a large amount of saltwater is discharged through the opening downstream.
The depth of the cut-off wall was found to be a critical factor affecting the effectiveness of the residual saltwater desalination (Luyun et al., 2011). Therefore, we perform a series of case studies based on the reference case to investigate the effects of the wall depth on the effectiveness of the cut-off wall and the dynamics of the residual saltwater removal. The transient desalination processes of the residual saltwater after the construction of a 20 m- and a 25 m-depth cut-off wall are shown in Figure 7. RSWL0 is 100 m. In 20 m wall depth case, RSWL increases slightly to 102 m on day 30, and 104 m on day 180 in the landward aquifer. Also, a notable reduction in the thickness of the wedge can be observed, indicating that the retreat process initially occurs along the vertical direction. This is because the saltwater in the landward aquifer is flushed out downward through the opening toward the seaward boundary. At the seaside, the area of freshwater gradually mitigates in the downstream aquifer and the whole seaside region is completely salinized after 180 days, indicating that the local freshwater has been fully displaced by the saltwater from the landward aquifer. RSWL is reduced to 63 m after 720 days. It is noteworthy that, at this point, the salt concentration in the upper part of the downstream aquifer starts to reduce again. This is because the freshwater carries much less salt downward than before and the salinized water has been mixed with the freshwater. For the 25-m wall depth case, RSWL increases to 104 m after 30 days and to 114 m by day 180. Comparing Figures 7A, B, a further reduction of the wedge thickness can be observed. The amount of upstream residual saltwater reduces while the downstream intruding saltwater increases. After 720 days, the high-concentration residual saltwater is almost completely flushed out of the landward aquifer. Only a small amount of low-concentration saltwater remains in the upstream aquifer. The 25 m-depth cut-off wall exhibits a better desalination effect than the 20 m-depth wall. The removal effect to the residual saltwater in the landward aquifer can be enhanced with the extension of the cut-off wall depth, since a deeper cut-off wall leads to a larger groundwater flux being able to remove more residual saltwater and the carried salt dispersed downstream of the cut-off wall.
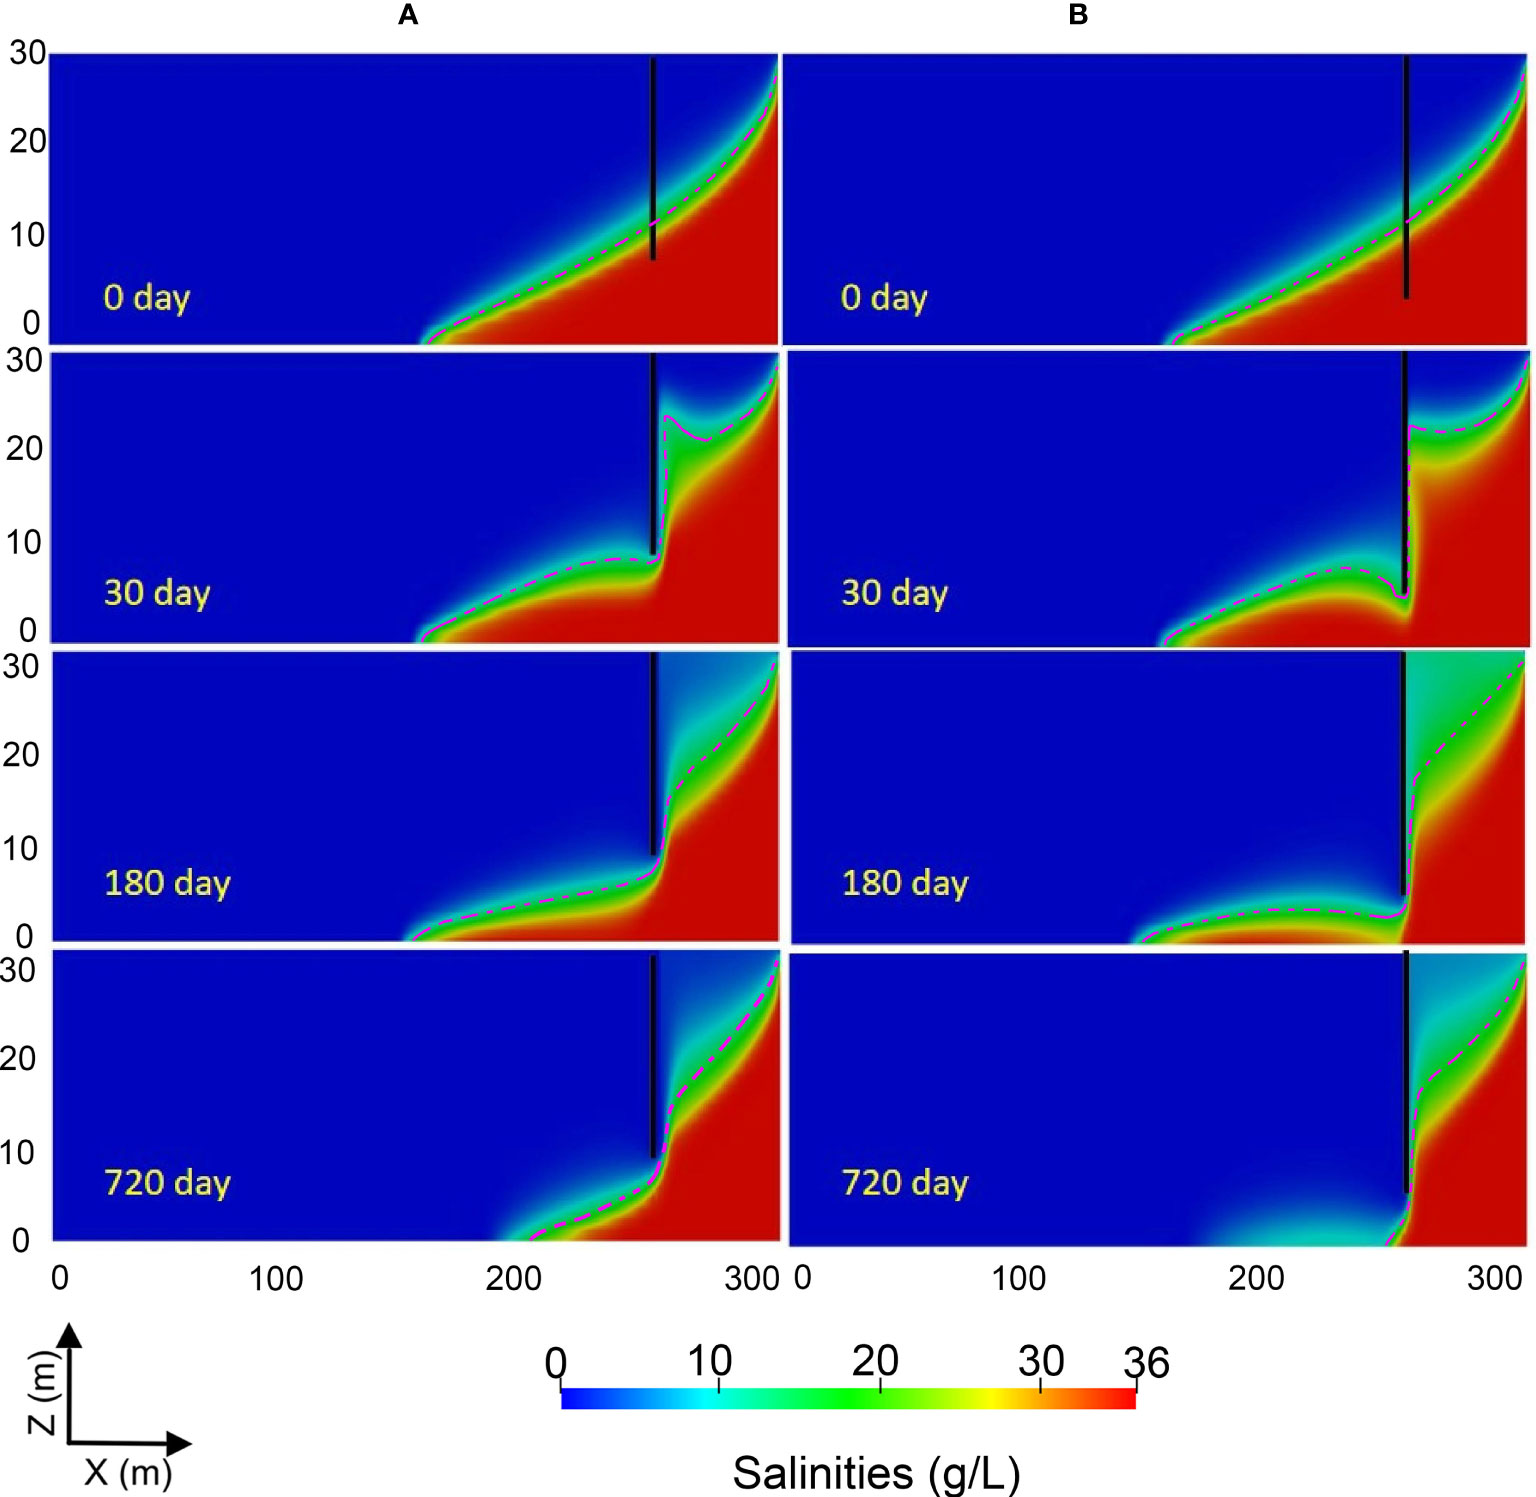
Figure 7 Transient distributions of residual saltwater after the construction of a 20 m-depth (A) and a 25 m-depth (B) cut-off wall at 50 m from the seaward boundary at day 0, day 30, day 180 and day 720. The vertical black lines represent the cut-off walls, and the red dotted lines stand for the isolines of 50% saltwater salinity.
To further quantify the effects of wall depth on the removal of the residual saltwater, we calculate RSWL* and RTSM* for 19, 21, 23, 25, and 27 m wall depth. The time-dependent variations of RSWL* and RTSM* are shown in Figure 8. RSWL0 is 100 m in all these cases. After the construction of the cut-off wall, the evolution of RSWL* can be divided into three stages: extension, retreat and equilibrium (Figure 8A). At the extension stage, RSWL* reduces to the lowest value, i.e., -0.04, -0.05, -0.07, -0.11 and -0.13 m on day 140, 165, 187, 213, and 235, corresponding to 19 m-, 21 m-, 23 m-, 25 m-, and 27 m-depth wall case, respectively. This interprets that the intruding saltwater advances to the maximum length. The advance of the saltwater wedge is because that the freshwater in the upstream aquifer is forced to flow through the opening below the wall, pushing the residual saltwater wedge behind the wall to advance landward. Generally, the time for the wedge to reach the maximum intrusion distance and the maximum intrusion length increase with the increment of the cut-off wall depth. At the retreat stage, a sharp increase of RSWL* within a short period is observed. During this stage, the residual saltwater wedge is flushed out of the wall downward in the landward aquifer. In the meantime, the thickness of the saltwater wedge is reduced because the residual saltwater has been removed first in the vertical direction. It should be noted that RSWL* only describes the change of saltwater toe along the 50% saltwater concentration isoline. At the equilibrium stage, the values of RSWL* remain at 1.00, 0.92, 0.78, 0.57 and 0.39 for 27 m-, 25 m-, 23 m-, 21 m-, and 19 m-depth wall, respectively, suggesting that in the upstream aquifer, RSWL decreases with the increase of the cut-off wall depth.
Figure 8 The change of RSWL* (A) and RTSM* (B) over time after the construction of cut-off walls, having 19, 21, 23, 25, 27 m depth, respectively.
As can be seen in Figure 8B, RTSM* increases rapidly within 100-150 days. Then, the increasing rate reduces as the freshwater carries less salt toward the seaward boundary during the retreat process. After 1080 days, the values of RTSM* increase to 0.95, 0.96, 0.91, 0.80, 0.65, corresponding to 27 m-, 25 m-, 23 m-, 21 m-, 19 m-depth wall case, respectively. RTSM* rises with the increase of the cut-off wall depth. From the results of RSWL* and RTSM*, it can be seen that the desalination effect of the cut-off wall is improved by increasing the depth of the wall. However, note that the desalination effect starts to degrade when the wall depth reaches 27 m. RTSM* in the 27-m depth case is slightly smaller than that in 25-m depth case, indicating that there is an optimal depth for the cut-off wall to desalinize the intruding saltwater the most effectively. This is because when the cut-off wall penetrates too deep, the opening becomes rather narrow, thereby significantly mitigating the volume of freshwater with carried residual salt flowing toward the sea boundary.
Previous studies have also shown that the location of the cut-off wall can be critical for the control of SWI, cf. Luyun et al. (2011) and Chang et al. (2019). However, studies on the influence of cut-off wall location on the desalination process were limited to the laboratory scale. In the present study, we investigate the effects of wall location on the retreat of the residual saltwater wedge at a field scale. The transient processes of the residual saltwater wedge after the construction of a 25 m depth cut-off wall at 50 m and 80 m away from the sea boundary are shown in Figures 9A, B, respectively. In the 80 m case, the cut-off wall extends vertically into the shallow layer of the saltwater zone, and about 70 m length saltwater wedge (RSWL0) is trapped behind the wall. After 30 days, about half the amount of the saltwater is flushed out of the wall, and the freshwater in the upper part of the aquifer is replaced by the saltwater. By day 180, most of the saltwater is flushed out, and the freshwater is almost completely polluted. Compared to day 0, a wider mixing zone is also observed on day 180 showing that the construction of a cut-off wall can significantly enlarge the mixing zone. Finally, all the residual saltwater in the landward aquifer is removed after 720 days, and the salinized water is diluted again in the downstream aquifer, because the freshwater with less salt flows through the opening toward the sea boundary at this time. Compared to the 80 m case, the retreat of the residual saltwater wedge in the 50 m case is slower. This is because a longer saltwater wedge (RSWL0= 100 m) is trapped behind the 50 m distance wall.
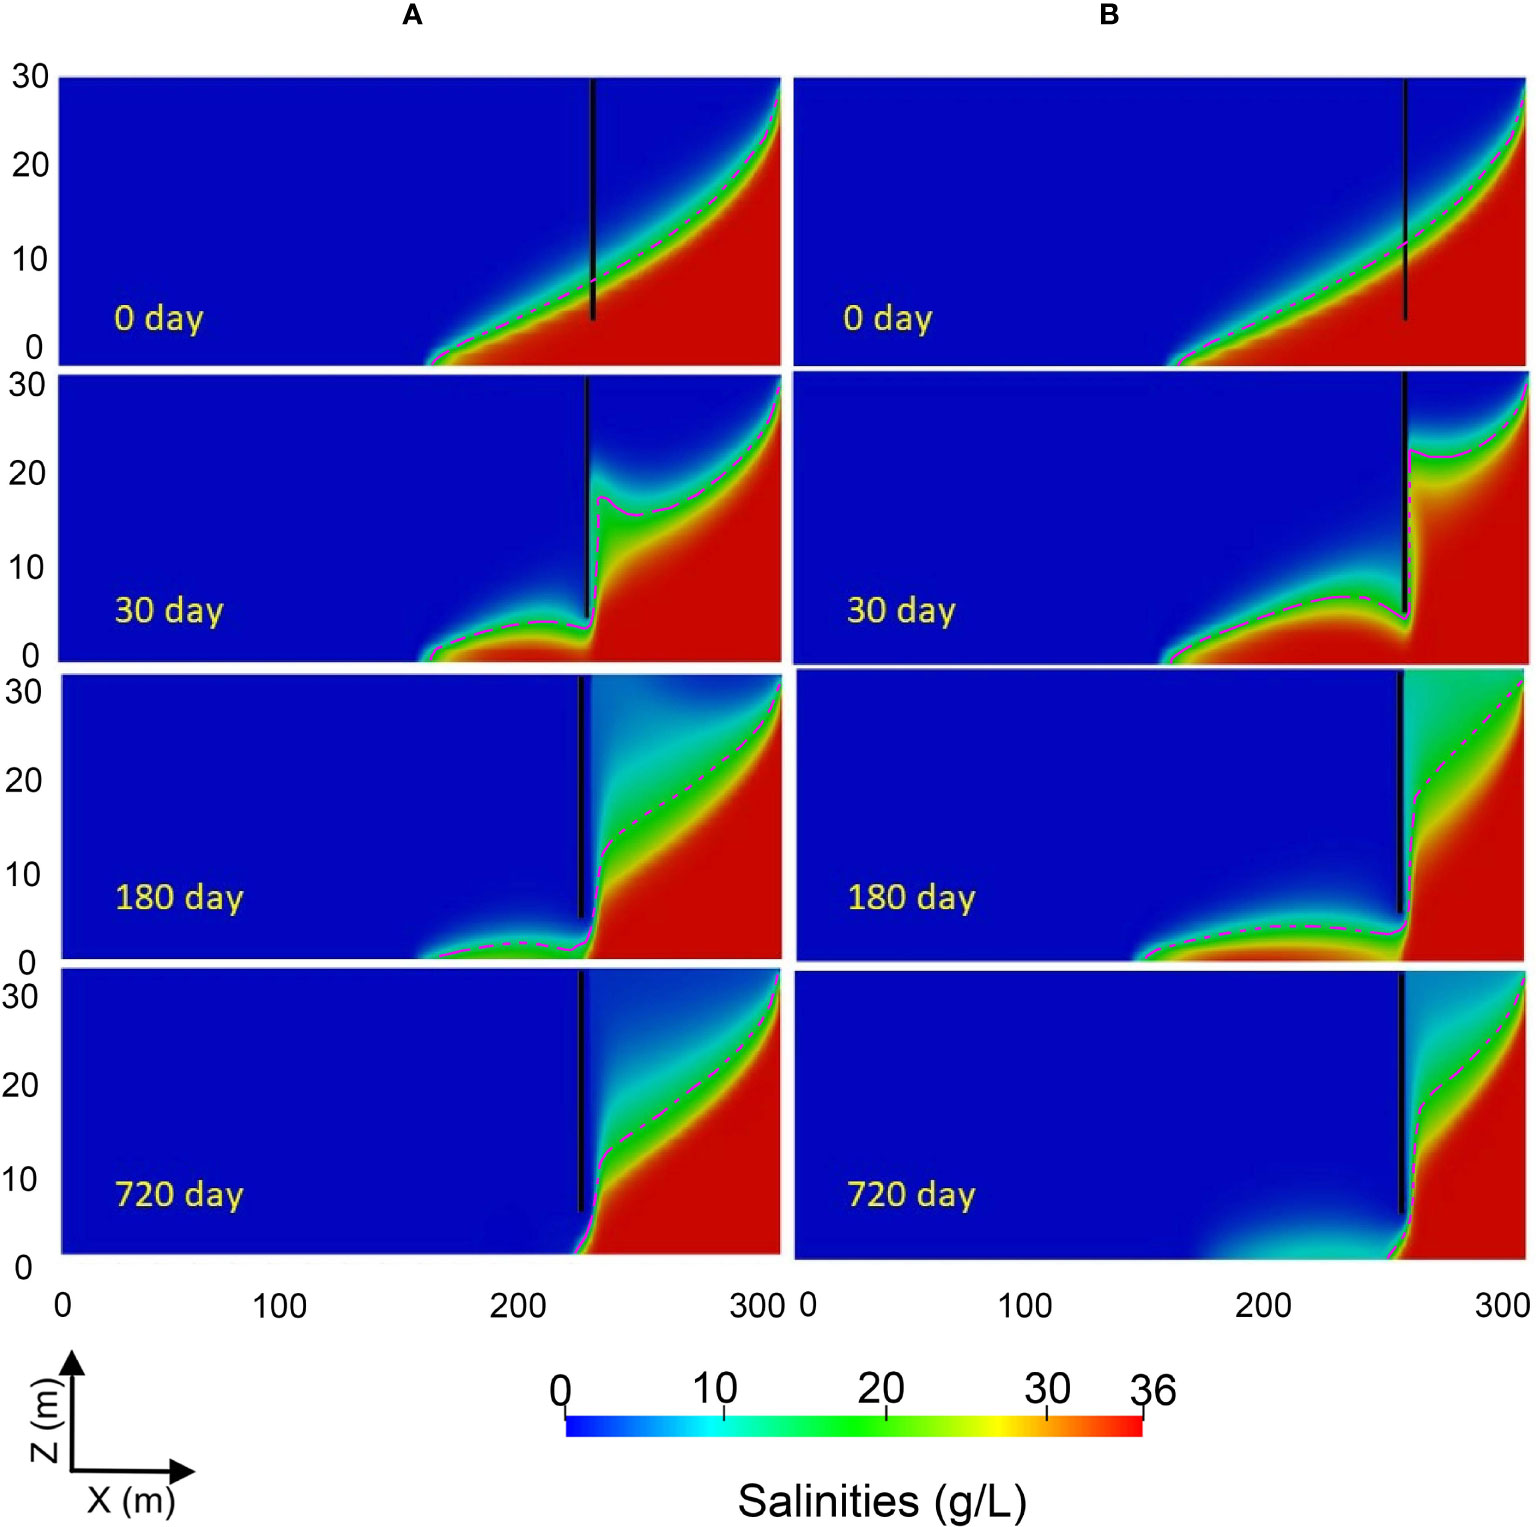
Figure 9 Transient distributions of residual saltwater after the construction of a 25 m depth cut-off wall at the location of 80 m (A) and 50 m (B) from the sea boundary at 0, 30, 180 and 720 day. The vertical black lines represent the cut-off walls and the red dotted lines are the isolines of 50% salinity of the saltwater.
To comprehensively evaluate the effects of the wall position on the retreat of the residual saltwater wedge, we model a 25 m-depth wall installed at 20, 30, 40, 50, and 60 m from the sea boundary, respectively. The corresponding RSWL0 are 130 m, 120 m, 110 m, 100 m, and 90 m. The time-dependent variations of RSWL* and RTSM* are shown in Figure 10. Again, the evolution of RSWL* can be divided into three stages the same as that in the wall depth cases (Figure 8A). At the first stage, the values of RSWL* reduce to the lowest value, i.e., -0.10, -0.11, -0.12, -0.13 and -0.14 at 176, 213, 254, 322, and 420 d, corresponding to 60 m, 50 m, 40 m, 30 m, and 20 m distance wall, respectively. This indicates that the intruding saltwater advances to the maximum length. At the second stage, RSWL* experiences a sharp increase within a short period. Finally, the values of RSWL* in different wall distance cases become identical to each other (0.97) at different times, suggesting that the final RSWL is determined by the depth of the wall, and the distance of the wall from the seaward boundary affects the retreat time. In Figure 10B, we observe a rapid increase of RTSM* between 100-150 d. The increasing rate starts decreasing when the amount of salt carried by the freshwater toward the seaward boundary reduces. After 1080 days, the values of RTSM* increase to 0.88, 0.91, 0.94, 0.96, and 0.98, corresponding to 20 m-, 30 m-, 40 m-, 50 m-, and 60 m-distance case, respectively. Comparing the values of RSWL* and RTSM* in all the cases, it can be seen that the location of the cut-off wall does not significantly affect the removal effectiveness of the high- and low-concentration saltwater, but the retreat time is prolonged with the wall installed further away from the seaside.
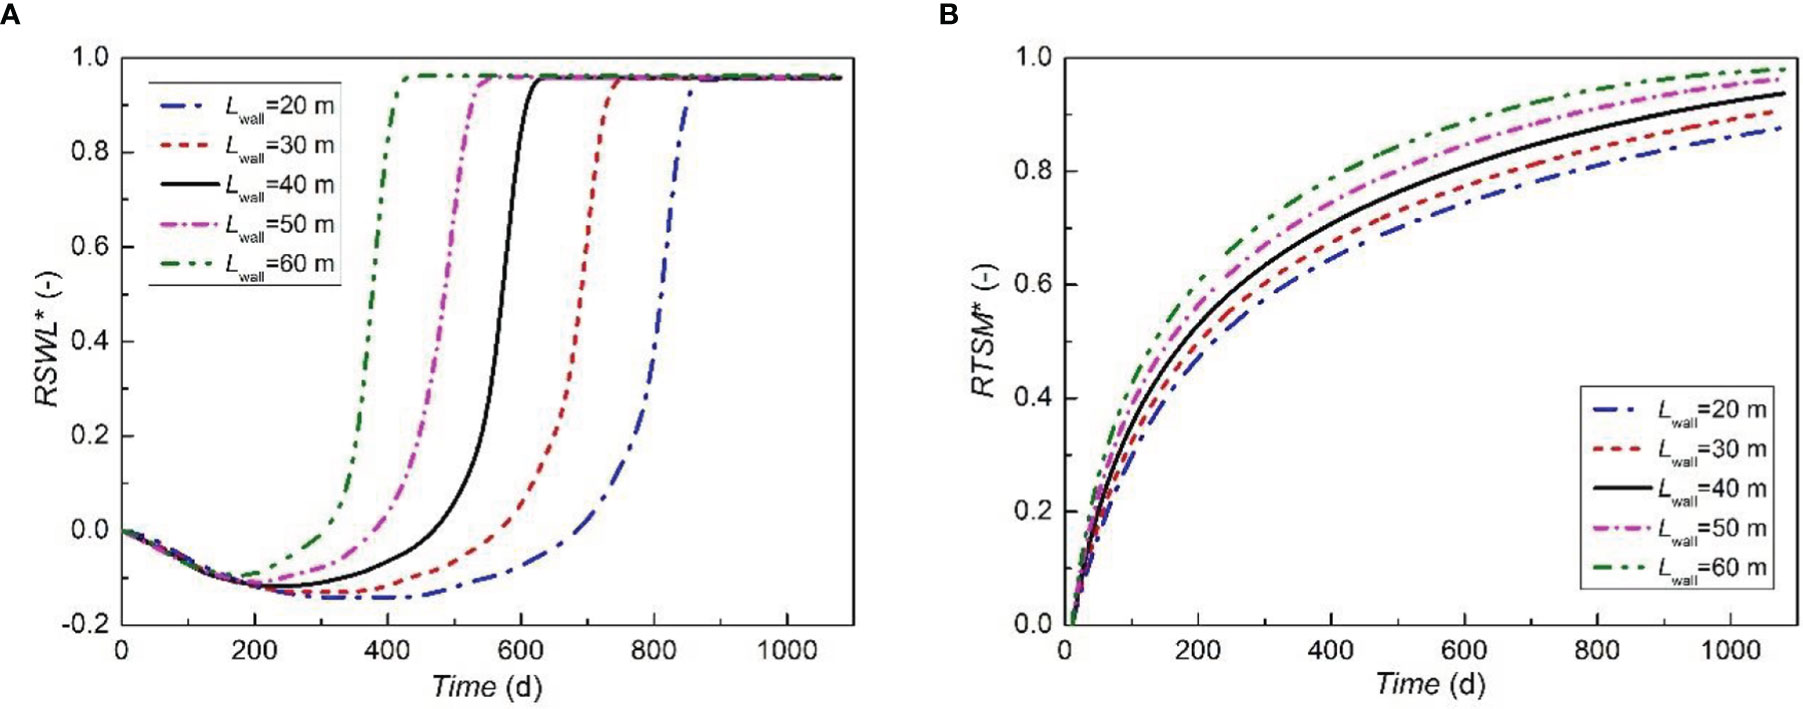
Figure 10 The change of RSWL* (A) and RTSM* (B) over time after the construction of a 25 m-depth cut-off wall at 20, 30, 40, 50, and 60 m from the sea boundary.
Due to limitations of construction materials and methods for building cut-off walls, the structure of a wall may not be uniform, and the hydraulic conductivity may not be constant (e.g., Figure 2). To investigate the effects of hydraulic conductivity of the cut-off wall on the removal dynamics of the residual saltwater in the upstream aquifer, we conduct a case study based on the reference case, by adopting different hydraulic conductivities. The transient processes of the residual saltwater wedge after the construction of a cut-off wall with hydraulic conductivity of 4 × 10⁻⁶ m/s (about 0.35 m/day) and 1 × 10⁻⁷ m/s (about 0.01 m/day, the reference case) are shown in Figure 11. The comparison of Figures 11A, B shows that the removal of the residual saltwater using a cut-off wall with higher hydraulic conductivity is slower, i.e., the retreat time increases with the increase in the hydraulic conductivity. This is because the saltwater can penetrate through the wall with a high hydraulic conductivity to the upstream. When the hydraulic conductivity of the wall is beyond a certain limit, the cut-off wall will fail. On the seaside, the distributions of the freshwater and the saltwater in the aquifer are almost constant in the high hydraulic conductivity case, indicating that in the two simulated scenarios with hydraulic conductivities of 4 × 10⁻⁶ m/s and 1 × 10⁻⁷ m/s, the influence of hydraulic conductivity is weak.
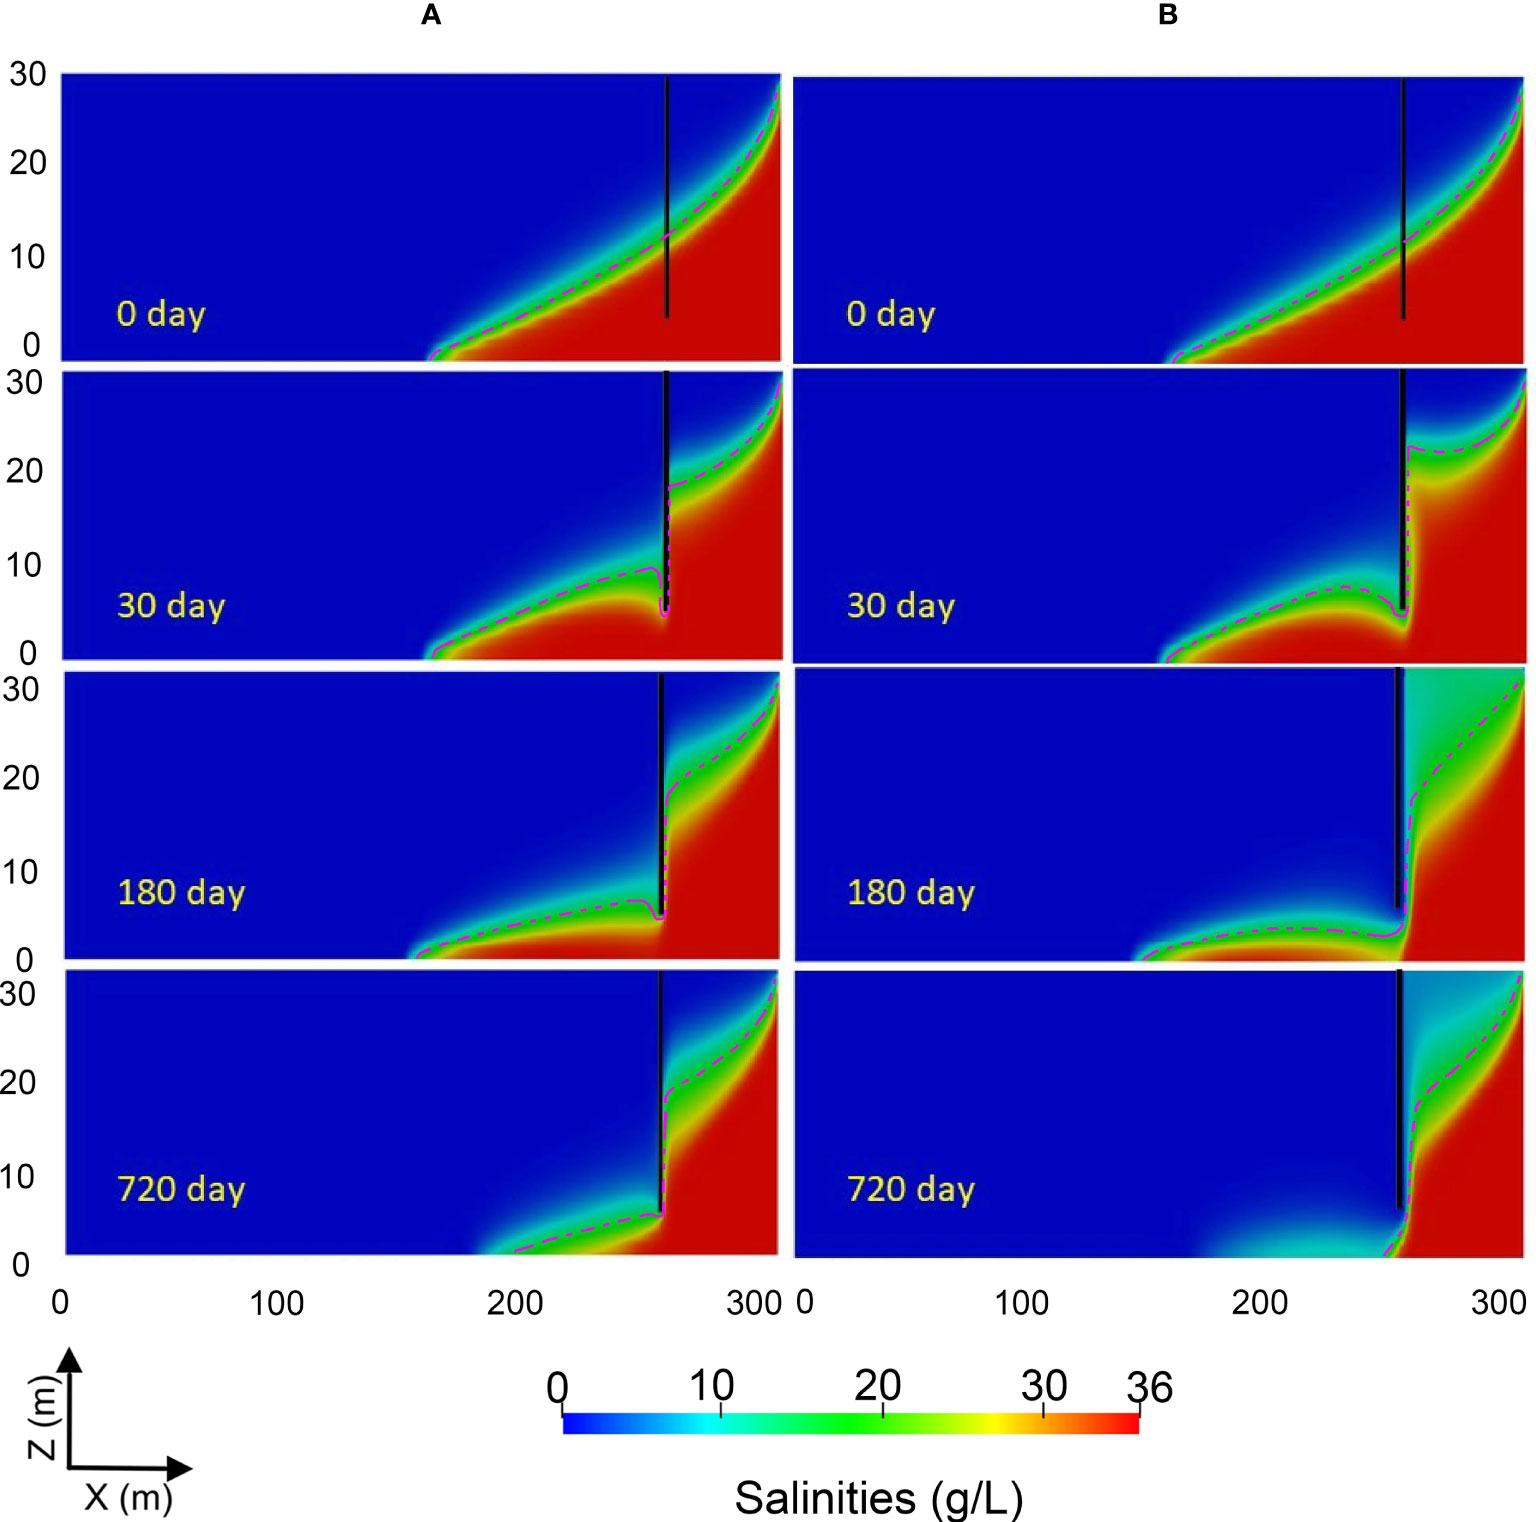
Figure 11 Transient distributions of residual saltwater after the construction of a 25 m-depth cut-off wall with hydraulic conductivity of 4×10⁻⁶ m/s (A) and 10-7 m/s (B) at 50 m from the sea boundary at 0, 30, 180 and 720 day. The vertical black lines represent the cut-off walls, and the red dotted lines are the isolines of 50% salinity of the saltwater.
To quantify the effects of wall hydraulic conductivity on the removal of the residual saltwater, we calculate RSWL* and RTSM* for the reference cut-off wall with hydraulic conductivity of 2 × 10⁻⁵, 4 × 10⁻⁶, 8 × 10⁻⁷, 10-7, and 10-8 m/s, respectively. These designed hydraulic conductivities are 30, 150, 750, 6000 and 60000 times smaller than that of the aquifer (K0= 6×10⁻⁴ m/s), respectively. As can be seen in Figure 12A, RSWL* first reduces to the lowest value, i.e., -0.03, -0.07, -0.10, -0.11 and -0.11 at 152, 180, 195, 213 and 215 d, corresponding to a wall hydraulic conductivity of 2 × 10⁻⁵, 4 × 10⁻⁶, 8 × 10⁻⁷, 10-7, and 10-8 m/s, respectively. We can observe a clear staged dynamic behavior of RSWL* when the hydraulic conductivity is higher than 4 × 10⁻⁶ m/s. The values of RSWL* in 8 × 10⁻⁷, 10-7, and 10-8 m/s cases increase rapidly within a short period and reach to the maximum at 520 d, i.e., 0.93, 0.94 and 0.94, respectively. After 520 days, the retreat proceeds in the equilibrium stage, and the values of RSWL* remain unchanged for the rest of the simulation period. In these cases, the walls are almost impermeable. The freshwater carrying residual salt is forced to flow through the opening. The high-concentration saltwater in the upstream aquifer is almost flushed out of the wall at the same time. For the wall with a relatively high hydraulic conductivity, e.g., 2×10⁻⁵ m/s, RSWL* increases slowly during the entire simulation period, i.e., the retreat process does not proceed in the equilibrium stage within the simulated time. At the end of the simulation, the values of RSWL* in the 2 × 10⁻⁵ and 4 × 10⁻⁶ m/s cases are 0.08 and 0.53, respectively. The very small RSWL* in 2 × 10⁻⁵ m/s case suggests that the wall fails to stem the landward SWI. The saltwater can directly flow through the wall toward the upstream aquifer. It can be seen from Figure 12B that the change of RTSM* corresponds with the change of RSWL*. Generally, RTSM* increases with the decrease of the hydraulic conductivity of the cut-off wall. After the construction of cut-off walls for 1080 days, the values of RTSM* increase to 0.96, 0.95, 0.94, 0.80, 0.22, corresponding to 10-8, 10-7, 8 × 10⁻⁷, 4 × 10⁻⁶, 2 × 10⁻⁵ m/s case, respectively. Based on the simulation results, we can conclude that the hydraulic conductivity of the cut-off wall is also a critical factor affecting the retreat of the residual saltwater wedge in the upstream aquifer. The most decisive point is that there exists a threshold value (8 × 10⁻⁷ m/s in this case study) for the wall hydraulic conductivity, beyond which the desalination rate will be greatly reduced and the cut-off wall is disabled.
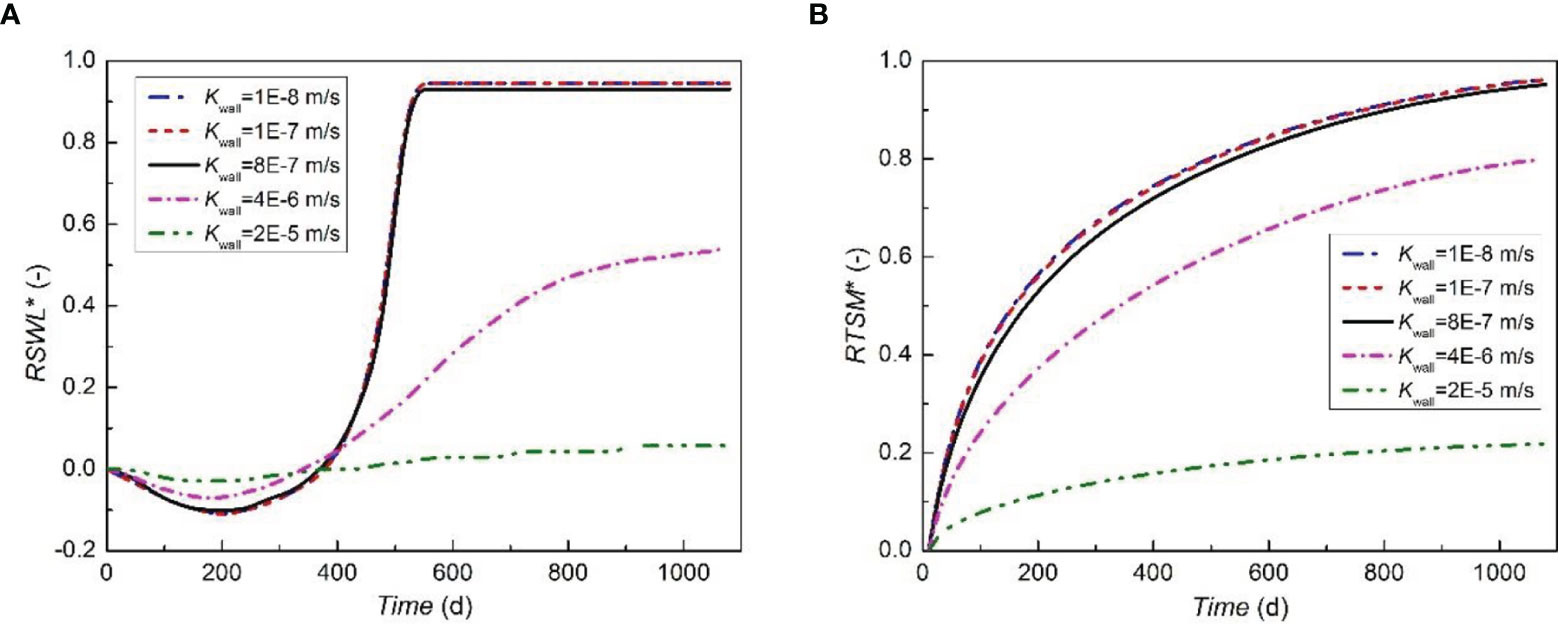
Figure 12 The change of RSWL* (A) and RTSM* (B) over time after the construction of a 25 m-depth cut-off wall with hydraulic conductivity equal to 10-8, 10-7, 8×10⁻⁷, 4×10⁻⁶, 2×10⁻⁵ m/s, respectively.
This study investigates the dynamic cleaning process of intruding saltwater after construction of a cut-off wall and the timescale of desalination. In our previous research (Zheng et al., 2021), we focus on the desalination process of residual saltwater after installation of a subsurface dam, which leaves an opening on top of the dam. We found that, in this case, the desalination process is rather slow, lasting from several decades to almost 100 years. Compared to subsurface dams, using cut-off walls can efficiently reduce the desalination timescale. We can see that the cleaning process after installing a cut-off wall is normally within several years. This is because that the desalination mechanisms of the two physical barriers are completely different. When subsurface dams are used, the residual saltwater has to be first mixed with freshwater and this process is controlled by dispersivity, then the mixed liquid could be pushed seaward by groundwater. The whole process is dominated by diffusion. While for the case using cut-off walls, the residual saltwater could be somehow directly pushed seaward by high-velocity groundwater in the low opening. Advection is the controlling factor. For most of the scenarios, advection is a much faster process compared to diffusion, leading to a completely different desalination timescale. Therefore, if decision makers plan to remove the residual saltwater as fast as possible, cut-off walls might be a better option.
Except for the relatively small desalination timescale, the dynamic cleaning process after installation of a cut-off wall is also rather unique. For the desalination process with a subsurface dam, the retreat of the saltwater wedge is continuous. Nevertheless, after building a cut-off wall, the position of the saltwater wedge toe remains stagnant and the saltwater wedge always disappears in the vertical direction. After several months, the saltwater wedge suddenly retreats dramatically in the horizontal direction. At that time, only slight residual saltwater is left in the domain.
For subsurface dams, the influence of the dam height on the desalination process is monotonic. Higher dam always results in a slower cleaning process of the residual saltwater. For cut-off walls, we found that, in most situations, a deeper cut-off wall induces a faster desalination process. When the depth of cut-off wall exceeds a threshold (25 m in this study), further increase of the depth could weaken cleaning effect instead. Thus, for practical work, decision makers should identify the optimal depth in advance to maximize the desalination effect.
In this study, field-scale numerical models containing density-dependent flow and solute transport are implemented to investigate the influence of cut-off walls on the residual saltwater dynamics and desalination effectiveness of intruding saltwater. Three key controlling variables are investigated with a parametric study, including the depth, location, and hydraulic conductivity of the wall. Two indicators (the reduction rate of residual saltwater wedge length, and the removal rate of total residual salt mass) are applied to quantify the desalination process of the residual saltwater after the construction of cut-off walls. Major findings from this study can be summarized as follows:
(1) Different from the hours of desalination time obtained from laboratory-scale experiments and simulations, in field scales, the removal of the residual saltwater after the construction of a cut-off wall may take up to three years.
(2) The desalination process always occurs first in the vertical direction and may last for hundreds of days. During this period, the location of saltwater wedge toe position almost remains stagnant. Then, a fast retreat proceeds in a short period (between 100-150 days in the simulated scenarios).
(3) The construction of a cut-off wall can significantly enlarge the polluted area between the cut-off wall and the seaward boundary. The area of the mixing zone between the intruding saltwater and freshwater also gradually increases.
(4) The removal rates of high- and low-concentration saltwater trapped in the landward aquifer generally increase with the increase of the cut-off wall depth. This is because the freshwater flows through the wider saltwater zone and carries more salt toward the sea boundary. However, the desalination effectiveness reduces when the wall depth reaches 27 m, suggesting the existence of an optimal depth for constructing cut-off walls.
(5) The desalination effectiveness mitigates with the increase of the hydraulic conductivity of the cut-off wall. There exists a threshold (8 × 10⁻⁷ m/s in the simulated scenarios), beyond which the desalination rate can be greatly reduced. This is because for a wall with a high hydraulic conductivity, both the saltwater and freshwater can directly flow through the wall, and the cut-off wall essentially loses its function.
These findings provide significant practical insights into the desalination process of cut-off walls for the intruding saltwater. Particularly, the optimal depth and limiting hydraulic conductivity of the cut-off wall deserves a close attention. Future work may include tidal effect on the seaward boundary and seasonal freshwater input at the inland boundary. In the next step, we will also investigate the combined effect of pumping and cut-off wall on the desalination process.
The original contributions presented in the study are included in the article/supplementary material. Further inquiries can be directed to the corresponding author.
TZ: Conceptualization, Methodology, Software, Validation, Investigation, Writing - Original Draft, Visualization. MG: Validation, Investigation. QC: Data Curation XZ: Funding acquisition. MW: Writing - Review and Editing. All authors contributed to the article and approved the submitted version.
This research was financially supported by National Natural Science Foundation of China (No.42002250) and the Key Project of Joint Foundation of NSFC-Shandong (No.U1806210).
The authors declare that the research was conducted in the absence of any commercial or financial relationships that could be construed as a potential conflict of interest.
All claims expressed in this article are solely those of the authors and do not necessarily represent those of their affiliated organizations, or those of the publisher, the editors and the reviewers. Any product that may be evaluated in this article, or claim that may be made by its manufacturer, is not guaranteed or endorsed by the publisher.
Abarca E., Karam H., Hemond H. F., Harvey C. F. (2013). Transient Groundwater Dynamics in a Coastal Aquifer: The Effects of Tides, the Lunar Cycle, and the Beach Profile. Water Resour. Res. 49 (5), 2473–2488. doi: 10.1002/wrcr.20075
Abarca E., Vázquez-Suñé E., Carrera J., Capino B., Gámez D., Batlle F. (2006). Optimal Design of Measures to Correct Seawater Intrusion. Water Resour. Res. 42 (9), W09415. doi: 10.1029/2005WR004524
Ahrens J., Geveci B., Law C. (2005). Paraview: An End-User Tool for Large Data Visualization. Visualization Handb. 717 (8), 717–31. doi: 10.1016/B978-012387582-2/50038-1
Allow K. A. (2012). The Use of Injection Wells and a Subsurface Barrier in the Prevention of Seawater Intrusion: A Modelling Approach. Arabian J. Geosci. 5 (5), 1151–1161. doi: 10.1007/s12517-011-0304-9
Badaruddin S., Werner A. D., Morgan L. K. (2017). Characteristics of active seawater intrusion. J. Hydrol. 551, 632–647.
Cantalice J. R. B., Piscoya V. C., Singh V. P., Silvia Y. J. A. B., Barros M. F. C. B., Guerra S. M. S., et al. (2016). Hydrology and Water Quality of an Underground Dam in a Semiarid Watershed. Afr. J. Agric. Res. 11 (28), 2508–2518. doi: 10.5897/AJAR2016.11163
Chang Q., Zheng T., Chen Y., Zheng X., Walther M. (2020). Investigation of the Elevation of Saltwater Wedge Due to Subsurface Dams. Hydrol. Processes 34 (22), 4251–4261. doi: 10.1002/hyp.13863
Chang Q., Zheng T., Chen Y., Zheng X., Walther M. (2021). Influence of Inland Freshwater Influx on the Natural Desalination of Coastal Aquifers With a Cutoff Wall. Desalination 499, 114863. doi: 10.1016/j.desal.2020.114863
Chang Q., Zheng T., Zheng X., Zhang B., Sun Q., Walther M. (2019). Effect of Subsurface Dams on Saltwater Intrusion and Fresh Groundwater Discharge. J. Hydrol. 576, 508–519. doi: 10.1016/j.jhydrol.2019.06.060
Fang Y., Zheng T., Wang H., Zheng X., Walther M. (2021). Experimental and Numerical Evidence on the Influence of Tidal Activity on the Effectiveness of Subsurface Dams. J. Hydrol. 603 (4), 127149. doi: 10.1016/j.jhydrol.2021.127149
Fang Y., Zheng T., Zheng X., Yang H., Wang H., Walther M. (2021). Influence of Tide-Induced Unstable Flow on Seawater Intrusion and Submarine Groundwater Discharge. Water Resour. Res. 57 (4), e2020WR029038. doi: 10.1029/2020WR029038
Feseker T. (2007). Numerical Studies on Saltwater Intrusion in a Coastal Aquifer in Northwestern Germany. Hydrogeol. J. 15 (2), 267–279. doi: 10.1007/s10040-006-0151-z
Gao M., Zheng T., Chang Q., Zheng X., Walther M. (2021). Effects of Mixed Physical Barrier on Residual Saltwater Removal and Groundwater Discharge in Coastal Aquifers. Hydrol. Processes 35 (7), e14263. doi: 10.1002/hyp.14263
Goswami R. R., Clement T. P. (2007). Laboratory-Scale Investigation of Saltwater Intrusion Dynamics. Water Resour. Res 43 (4), W04418.
Ishida S., Tsuchihara T., Yoshimoto S., Imaizumi M. (2011). Sustainable Use of Groundwater With Underground Dams. Jpn. Agric. Res. Q. 45 (1), 51–61.
Jamali I. A., Olofsson B., Mörtberg U. (2013). Locating Suitable Sites for the Construction of Subsurface Dams Using GIS. Environ. Earth Sci. 70 (6), 2511–2525. doi: 10.1007/s12665-013-2295-1
Kaleris V. K., Ziogas A. I. (2013). The Effect of Cutoff Walls on Saltwater Intrusion and Groundwater Extraction in Coastal Aquifers. J. Hydrol. 476, 370–383. doi: 10.1016/j.jhydrol.2012.11.007
Kolditz O., Görke U.-J., Shao H., Wang W. (2012). Thermo-Hydro-Mechanical-Chemical Processes in Porous Media - Benchmarks and Examples, Vol. 86, ISBN: 978-3-642-27176-2.
Li F. L., Chen X. Q., Liu C. H., Lian Y. Q., He L. (2018). Laboratory Tests and Numerical Simulations on the Impact of Subsurface Barriers to Saltwater Intrusion. Natural Hazards 91 (3), 1223–1235. doi: 10.1007/s11069-018-3176-4
Lu C., Kitanidis Kitadanis, P. K., Luo J. (2009). Effects of Kinetic Mass Transfer and Transient Flow Conditions on Widening Mixing Zones in Coastal Aquifers. Water Resour. Res. 45 (12), W12402. doi: 10.1029/2008WR007643
Lu C., Luo J. (2010). Dynamics of Freshwater-Seawater Mixing Zone Development in Dual-Domain Formations. Water Resour. Res. 46 (11), W11601. doi: 10.1029/2010WR009344
Lu C., Shi W., Xin P., Wu J., Werner A. D. (2017). Replenishing an Unconfined Coastal Aquifer to Control Seawater Intrusion: Injection or Infiltration? Water Resour. Res. 53 (6), 4775–4786. doi: 10.1002/2016WR019625
Lu C., Xin P., Kong J., Li L., Luo J. (2016). Analytical Solutions of Seawater Intrusion in Sloping Confined and Unconfined Coastal Aquifers. Water Resour. Res. 52 (9), 6989–7004. doi: 10.1002/2016WR019101
Luyun R. Jr., Momii K., Nakagawa K. (2009). Laboratory-Scale Saltwater Behavior Due to Subsurface Cutoff Wall. J. Hydrol. 377 (3-4), 227–236. doi: 10.1016/j.jhydrol.2009.08.019
Luyun R. Jr., Momii K., Nakagawa K. (2011). Effects of Recharge Wells and Flow Barriers on Seawater Intrusion. Groundwater 49 (2), 239–249. doi: 10.1111/j.1745-6584.2010.00719.x
Oswald S. E., Kinzelbach W. (2004). Three-Dimensional Physical Benchmark Experiments to Test Variable-Density Flow Models. J. Hydrol. 290 (1–2), 22–42. doi: 10.1016/j.jhydrol.2003.11.037
Oswald S. E., Scheidegger M. B., Kinzelbach W. (2002). Time-Dependent Measurement of Strongly Density-Dependent Flow in a Porous Medium via Nuclear Magnetic Resonance Imaging. Transport Porous Media 47 (2), 169–193. doi: 10.1023/A:1015508410514
Robinson C. E., Xin P., Santos I. R., Charette M. A., Li L., Barry D. A. (2018). Groundwater Dynamics in Subterranean Estuaries of Coastal Unconfined Aquifers: Controls on Submarine Groundwater Discharge and Chemical Inputs to the Ocean. Adv. Water Resour. 115, 315–331. doi: 10.1016/j.advwatres.2017.10.041
Rozell D. J., Wong T. F. (2010). Effects of Climate Change on Groundwater Resources at Shelter Island, New York State, USA. Hydrogeol. J. 18 (7), 1657–1665. doi: 10.1007/s10040-010-0615-z
Shen Y., Xin P., Yu X. (2020). Combined Effect of Cutoff Wall and Tides on Groundwater Flow and Salinity Distribution in Coastal Unconfined Aquifers. J. Hydrol., 581, 124444. doi: 10.1016/j.jhydrol.2019.124444
Strack O. D. L., Stoeckl L., Damm K., Houben G., Ausk B. K., de Lange W. J. (2016). Reduction of saltwater intrusion by modifying hydraulic conductivity. Water Resources Research 52, 6978–6988. doi: 10.1002/2016WR019037
Sun Q., Zheng T., Zheng X., Chang Q., Walther M. (2019). Influence of a Subsurface Cut-Off Wall on Nitrate Contamination in an Unconfined Aquifer. J. Hydrol. 575, 234–243. doi: 10.1016/j.jhydrol.2019.05.030
Sun Q., Zheng T., Zheng X., Walther M. (2021). Effectiveness and Comparison of Physical Barriers on Seawater Intrusion and Nitrate Accumulation in Upstream Aquifers. J. Contaminant Hydrol. 243, 103913. doi: 10.1016/j.jconhyd.2021.103913
Van Genuchten M. T. (1980). A Closed-Form Equation for Predicting the Hydraulic Conductivity of Unsaturated Soils1. Soil Sci. Soc. America J. 44 (5), 892–898. doi: 10.2136/sssaj1980.03615995004400050002x
Walther M., Graf T., Kolditz O., Liedl R., Post V. (2017). How Significant is the Slope of the Sea-Side Boundary for Modelling Seawater Intrusion in Coastal Aquifers? J. Hydrol. 551, 648–659. doi: 10.1016/j.jhydrol.2017.02.031
Watson T. A., Werner A. D., Simmons C. T. (2010). Transience of Seawater Intrusion in Response to Sea Level Rise. Water Resour. Res. 46 (12), W12533. doi: 10.1029/2010WR009564
Werner A. D., Bakker M., Post V. E., Vandenbohede A., Lu C., Ataie-Ashtiani B., et al. (2013). Seawater Intrusion Processes, Investigation and Management: Recent Advances and Future Challenges. Adv. Water Resour. 51, 3–26. doi: 10.1016/j.advwatres.2012.03.004
Werner A. D., Simmons C. T. (2009). Impact of Sea-Level Rise on Sea Water Intrusion in Coastal Aquifers. Groundwater 47 (2), 197–204. doi: 10.1111/j.1745-6584.2008.00535.x
Wu H., Lu C., Kong J., Werner A. D. (2020). Preventing Seawater Intrusion and Enhancing Safe Extraction Using Finite-Length, Impermeable Subsurface Barriers: 3d Analysis. Water Resour. Res. 56 (11), e2020WR027792. doi: 10.1029/2020WR027792
Yan M., Lu C., Werner A. D., Luo J. (2021). Analytical, Experimental, and Numerical Investigation of Partially Penetrating Barriers for Expanding Island Freshwater Lenses. Water Resour. Res. 57 (3), e2020WR028386. doi: 10.1029/2020WR028386
Zhang B., Zheng T., Zheng X., Walther M. (2021). Utilization of Pit Lake on the Cleaning Process of Residual Saltwater in Unconfined Coastal Aquifers. Sci. Total Environ. 770, 144670. doi: 10.1016/j.scitotenv.2020.144670
Zhang B., Zheng X., Zheng T., Xin J., Sui S., Zhang D. (2019). The Influence of Slope Collapse on Water Exchange Between a Pit Lake and a Heterogeneous Aquifer. Front. Environ. Sci. Eng. 13 (2), 20. doi: 10.1007/s11783-019-1104-9
Zheng T., Zheng X., Chang Q., Zhan H., Walther M. (2021). Timescale and Effectiveness of Residual Saltwater Desalinization Behind Subsurface Dams in an Unconfined Aquifer. Water Resour. Res. 57 (2), e2020WR028493. doi: 10.1029/2020WR028493
Keywords: seawater intrusion, numerical model, desalination, cut-off wall, dynamic process
Citation: Zheng T, Gao M, Chang Q, Zheng X and Walther M (2022) Dynamic Desalination of Intruding Seawater After Construction of Cut-Off Walls in a Coastal Unconfined Aquifer. Front. Mar. Sci. 9:857807. doi: 10.3389/fmars.2022.857807
Received: 19 January 2022; Accepted: 04 March 2022;
Published: 29 March 2022.
Edited by:
Zeng Zhou, Hohai University, ChinaReviewed by:
Fangfang Zhu, The University of Nottingham Ningbo, ChinaCopyright © 2022 Zheng, Gao, Chang, Zheng and Walther. This is an open-access article distributed under the terms of the Creative Commons Attribution License (CC BY). The use, distribution or reproduction in other forums is permitted, provided the original author(s) and the copyright owner(s) are credited and that the original publication in this journal is cited, in accordance with accepted academic practice. No use, distribution or reproduction is permitted which does not comply with these terms.
*Correspondence: Tianyuan Zheng, emhlbmd0aWFueXVhbkBvdWMuZWR1LmNu
Disclaimer: All claims expressed in this article are solely those of the authors and do not necessarily represent those of their affiliated organizations, or those of the publisher, the editors and the reviewers. Any product that may be evaluated in this article or claim that may be made by its manufacturer is not guaranteed or endorsed by the publisher.
Research integrity at Frontiers
Learn more about the work of our research integrity team to safeguard the quality of each article we publish.