
94% of researchers rate our articles as excellent or good
Learn more about the work of our research integrity team to safeguard the quality of each article we publish.
Find out more
ORIGINAL RESEARCH article
Front. Mar. Sci. , 10 May 2022
Sec. Coastal Ocean Processes
Volume 9 - 2022 | https://doi.org/10.3389/fmars.2022.855479
This article is part of the Research Topic Eutrophication, Algal Bloom, Hypoxia and Ocean Acidification in Large River Estuaries View all 11 articles
 Xiaosong Zhong1,2Maojun Yan3Wenqi Xu1Zhenwei Yan1,2Feng Xu1,2Shuhang Dong1,2
 Yu Xin1,2*
 Xiaoyong Shi2,4*
Dissolved organic nitrogen (DON) is an important component of the marine nitrogen (N) inventory and plays an essential role in N cycling in global estuaries and marginal seas. Understanding DON cycling is important but challenging. Global estuaries and marginal seas are experiencing significant anthropogenic impacts and have intensive physical/biochemical gradients. Therefore, high-quality DON concentration and N-isotope (δ15N–DON) data are very difficult to obtain. To enrich this knowledge, we take the Changjiang Estuary and the adjacent East China Sea shelf seas as a representative example and analyzed multiple isotopes and the concentrations of nitrate (), particulate nitrogen (PN), and DON. N isotopes combined with optimum multiparameter analysis proved to be very informative. This integrated analysis discriminates active DON production and consumption from a seemingly conservative distribution pattern of DON. The study area was divided into DON production zones 1 and 2 (P-zone 1 and 2) and DON consumption zones 1 and 2 (C-zone 1 and 2). For P-zone 1, the PN-originated DON elevated the δ15N–DON, while in P-zone 2, the DON excreted by phytoplankton was characterized by low δ15N and lowered δ15N–DON. DON consumption occurred in the depleted surface waters (C-zone 1) as well as the shelf middle and bottom waters (C-zone 2). This study discovers and consolidates the active and dynamical zoning of DON cycling from the estuary to the offshore marginal sea and establishes a useful means that is of valuable reference to DON cycling studies in global estuaries and marginal seas.
Dissolved organic nitrogen (DON) is often the dominant form of fixed N in global oceans (Berman and Bronk, 2003; Jani and Toor, 2018; Lim et al., 2019). DON has been recognized as a potential N source for primary production, i.e., bacteria and phytoplankton, in the marine environment (Bronk et al., 2007; Sipler and Bronk, 2015). Thus, DON dynamics is one of the key building blocks for a comprehensive understanding of the nutrient biogeochemical cycle. The role of DON in N cycling has been investigated in terms of its production and consumption. Accumulated datasets of DON concentration and its isotope (δ15N–DON) have suggested that DON significantly affects nutrient biogeochemical cycling in most tropical and subtropical surface waters (Letscher et al., 2013; Knapp et al., 2018; Zhang et al., 2020). However, for estuaries and marginal seas, there are a few limited studies on DON bioavailability and its contribution to local N cycling. There are only rare reports on DON cycling based on δ15N–DON, especially where the dissolved inorganic nitrogen (DIN) overwhelms DON in concentration. It becomes particularly challenging to study DON cycling when intensive physical gradients, vigorous biological activities, and significant anthropogenic activities co-exist and join to impact DON cycling in estuaries and marginal seas. What is the major cycling process of DON and how does DON cycling affect the N cycling and nutrient biogeochemistry in estuaries and marginal seas? A substantial amount of terrestrial-derived DON input into estuaries and marginal seas is transported into the open ocean by offshore currents. What is the fate of terrestrial-derived DON from estuaries to marginal seas? The answers to the above-mentioned questions would provide valuable clues to understanding the land–ocean interactions under the current global climate conditions. Therefore, we specifically highlight DON biogeochemical cycling in estuaries and marginal seas and present a case study of the Changjiang Estuary and the adjacent East China Sea shelf areas (CEECS).
The Changjiang Estuary is a well-known, large, river-dominated estuary that is affected by one of the most developed areas in China. The conveyed nutrients, marked by various N species, have significantly increased with the industrialization and urbanization in the river basin (Dai et al., 2011; Liu et al., 2018; Zhang et al., 2021). These anthropogenic loadings are driving the CEECS N budget beyond its natural resilience boundaries (Moon et al., 2021). The excess N could stimulate the growth of phytoplankton and increase the production of phytoplanktonic organic matter, which could further exacerbate local water hypoxia through organic matter degradation and the associated oxygen consumption (Wang et al., 2016). Thus, N cycling in the CEECS has attracted increasing attention in recent years. Published studies have focused mainly on the N cycling reflected by nitrate (), particulate nitrogen (PN), and their isotopes (Liu et al., 2009; Umezawa et al., 2014; Gao et al., 2020). Neither the quantity nor the quality of DON concentration and δ15N–DON is adequate to elucidate the DON sources, sinks, and cycling in the CEECS (Zhang et al., 2003; Zhang et al., 2015; Liu et al., 2016; Kwon et al., 2018). Recent findings suggest that DON appears to be conservative in the CEECS, given its small variances in concentration. Such a DON distribution pattern seems to suggest that physical mixing processes are the major driver rather than biochemical processes (Kwon et al., 2018; Kim et al., 2020). Besides this, the high DIN concentration and comparatively low DON concentration in the CEECS create difficulties in acquiring the DON concentration and δ15N–DON (Knapp et al., 2005). As a result, DON cycling in the CEECS has not been clearly recognized or explained yet.
It is difficult to reveal DON cycling in the complicated surroundings of CEECS only through the DON concentration dataset. The multiple-isotope approach developed in recent years provides a useful means of studying marine N cycling processes in the CEECS—for example, in a previous study, we have identified the sources and traced its transformation processes as well for evaluating the relative importance of each process in the CEECS by the compositions of dual isotopes of (Zhong et al., 2020). The changes in isotopic signals can reflect the transformation processes between different forms of N, i.e., assimilation, nitrification, and remineralization (Liu et al., 2020). In this study, we presented the DON concentration and multiple N-isotope datasets (detailed description in Supplementary Information Text S1) and described the spatial variation patterns of different forms of N in the CEECS under the joint impacts of physical and biochemical processes. Then, the isotopic fractionation factors of DON production and consumption were estimated. We aim to disentangle the field coupling of DIN, DON, and PN and further clarify the impacts of DIN and PN on the biogeochemical cycling of DON. Finally, a conceptual diagram of DON cycling in the estuary and marginal sea was constructed. This study will serve as a valuable reference for studying DON cycling in global estuaries and shelf marginal seas that are characterized by rigorous physical gradients and biological processes.
Samples were collected from the CEECS during a cruise abroad the R/V Science III from July 10 to 20, 2018 (Figure 1). The temperature, salinity, and depth were measured by CTD (Seabird 911 Plus, USA). Seawater samples were collected in 12-L Niskin bottles attached to the CTD rosette, and the sampling depths were set as the surface (3 to 4 m deep), middle (about 50% depth), and bottom (3–5 m above the seabed) layers. Upon retrieval, the dissolved oxygen was analyzed using the Winkler titration method (with a precision of 5 × 10⁻³ mg/L). Samples for nutrients, total dissolved nitrogen (TDN), and stable N (and O for ) isotope analysis were filtered immediately through 0.2-μm polycarbonate filters (Ф = 47 mm, Millipore, USA) on a Nalgene filter and then were stored in acid‐cleaned and sample‐rinsed high‐density polyethylene bottles (125 ml, Thermo Co., USA). The filters for suspended particulate matter (SPM), particulate organic carbon (POC), particulate nitrogen (PN), and the corresponding δ13C (relative to V-PDB) and δ15N (relative to air N2) measurements were filtered through pre-combusted (500°C for 5 h) and pre-weighed 0.7-μm GF/F filters (Φ = 25 mm, Whatman, UK). After filtration, the filters were dried on board at 45°C for 24 h. All the samples were stored at −20°C until further analysis was carried out in the laboratory.
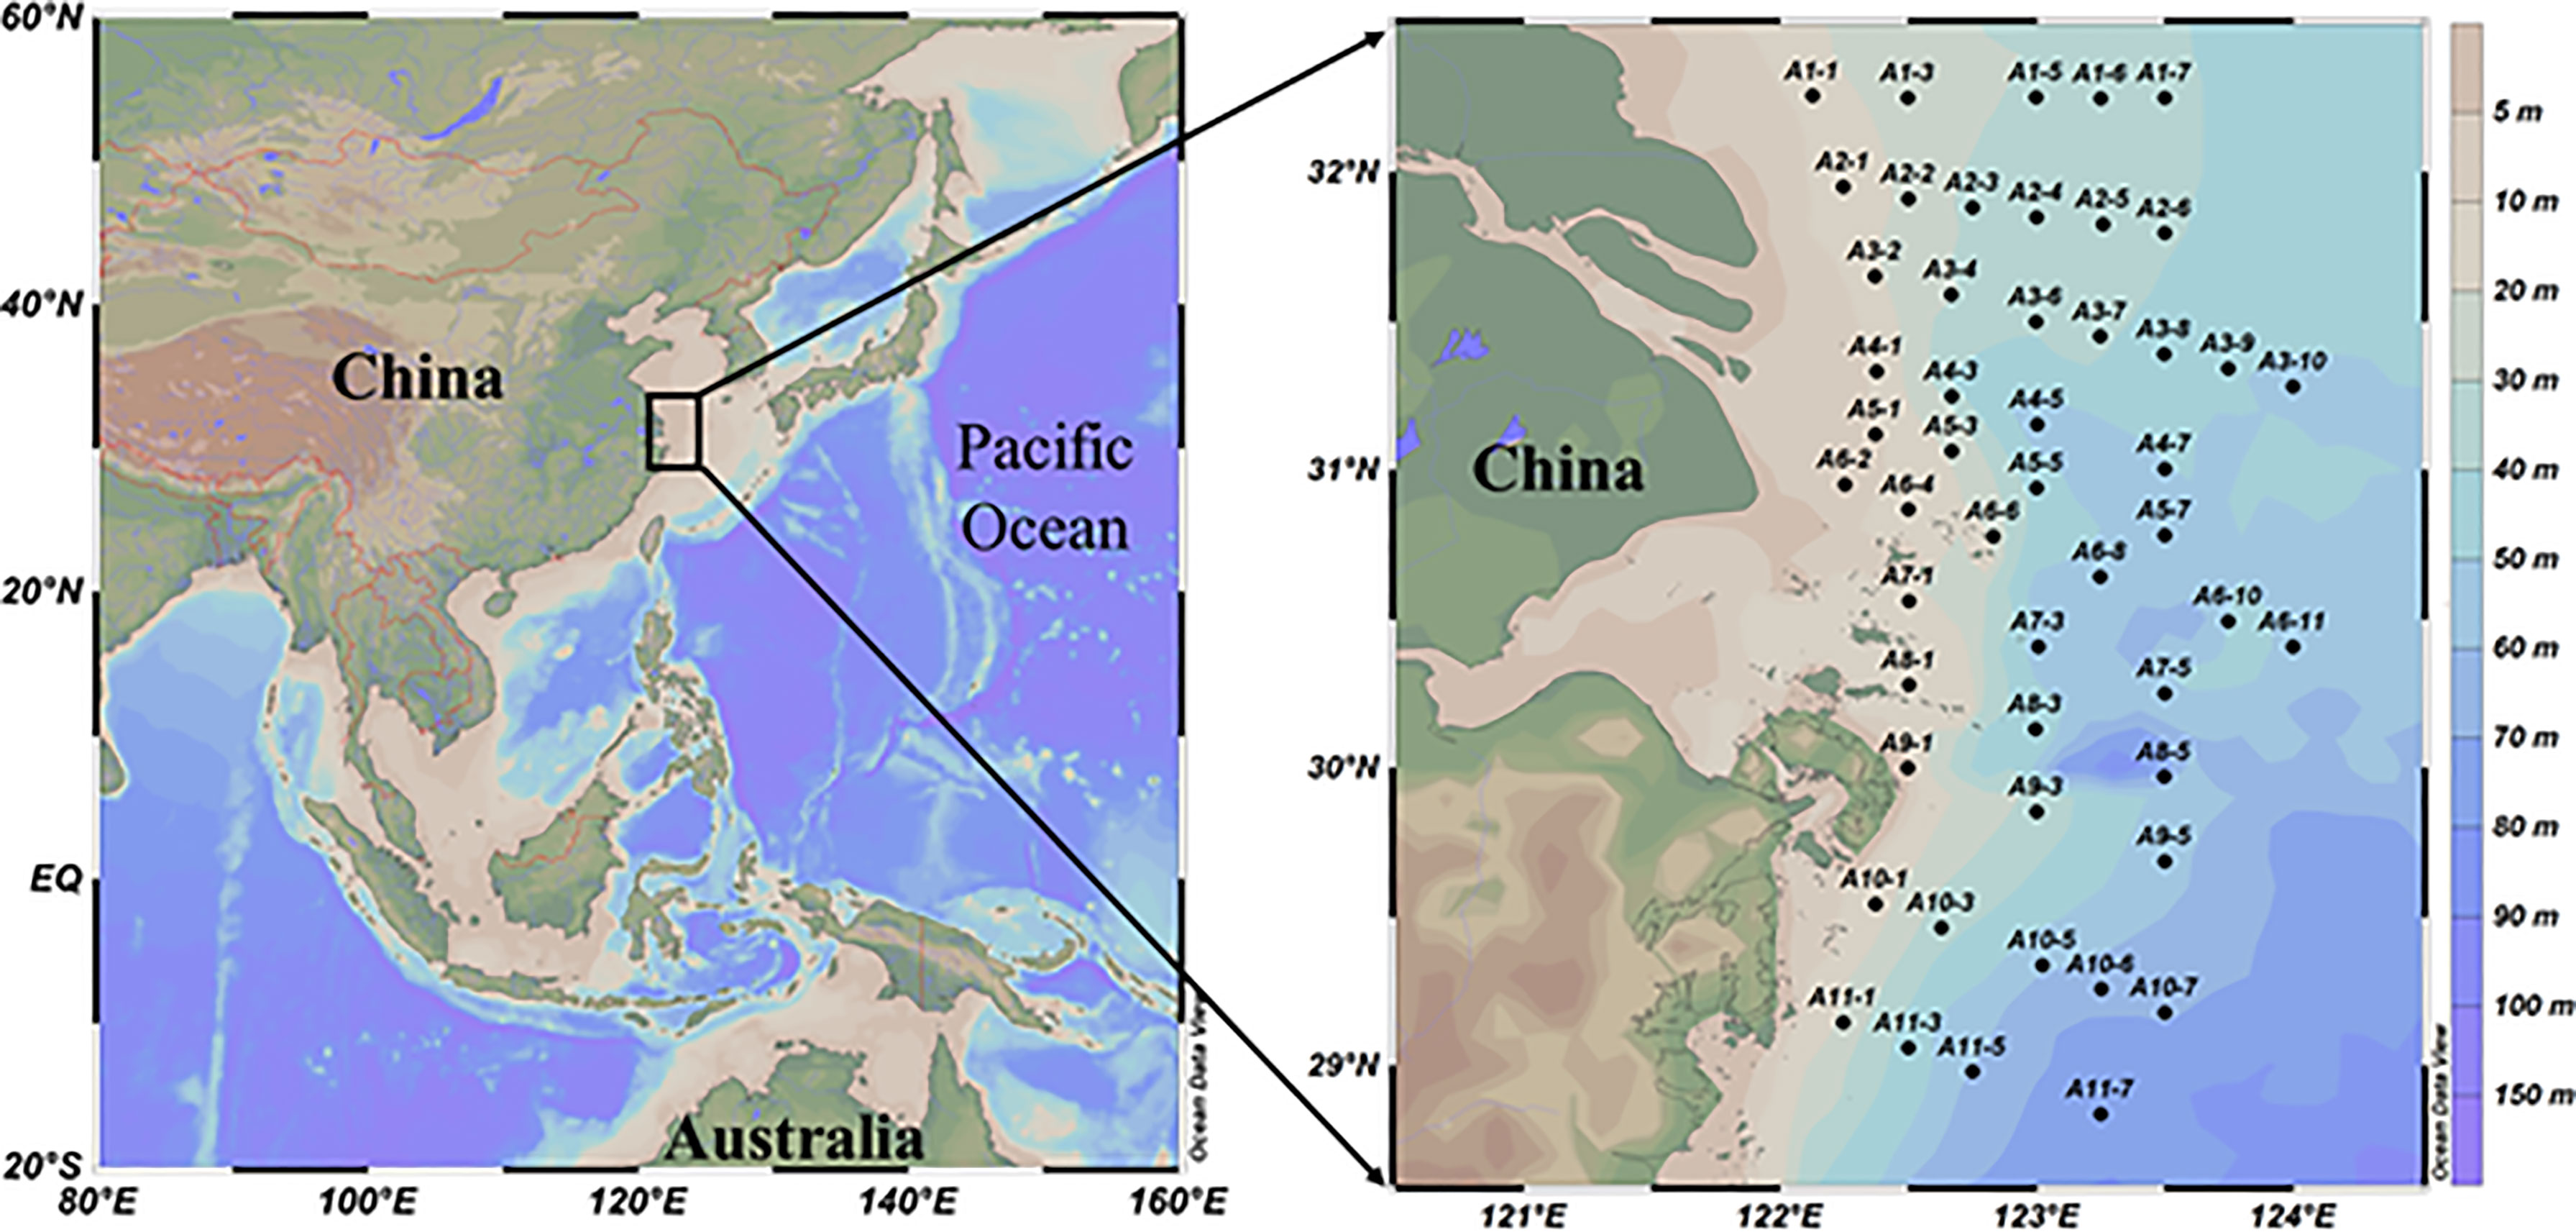
Figure 1 A map of the study areas showing the sampling stations.
The concentrations of seawater phosphate, dissolved silicate, nitrate (), and nitrite () were measured using the spectrophotometry method (Hansen and Koroleff, 2007) on a flow injection analyzer (QuAAtro, Seal Analytical, Germany). The detection limits were 0.04, 0.09, 0.02, and 0.005 μmol/L, respectively. Ammonium () was measured immediately upon the retrieval of water samples following a procedure described by Holmes et al. (1999). However, in about 30% of samples was below the detection limit of the method (<0.006 μmol/L). Given our inability to determine the δ15N of the low-concentration in our samples (averaging 0.20 ± 0.33 μmol/L), we did not subtract the concentration or the δ15N of from DON and δ15N of DON. Thus, the DON concentration here was defined as the difference between TDN and . The concentration of was quantified using the chemiluminescence method (Braman and Hendrix, 1989) using a . analyzer (200 EU, Teledyne, USA); the analytical precision is better than ± 0.1 μmol/L. The TDN was first converted into using the persulfate oxidation method (Hansen and Koroleff, 2007). Briefly, 1 ml of persulfate oxidizing reagent (POR, 1.5 g NaOH + 3 g H3BO3 + 5 g K2S2O8 in 100 ml low-DON Milli-Q water) was added to 10 ml of seawater sample in a precleaned and precombusted (500°C for 5 h) 15-ml quartz tube with a Teflon-lined cap. The screw caps were closed tightly, followed by autoclaving for 30 min. After digestion, the sample was quantified using the chemiluminescence method. The DON concentration was calculated by subtracting the concentrations of and the N-blank of POR.
The , and δ15N-TDN were determined using the denitrifier method (Sigman et al., 2001; Weigand et al., 2016) on an isotope ratio mass spectrometer (PreCon-IRMS, IsoPrime, UK) coupled with a nitrous oxide extraction system. Three reference materials, IAEA-NO-3 , USGS-34, and USGS-35 , were used for calibration. For data quality assurance, an internal standard of hadal water from the Mariana Trench (8,000 m in depth, , and was analyzed with each batch of samples. Replicate measurements were performed. The analytical precision was ± 0.2‰ or better for δ15N and ± 0.5‰ or better for δ18O. Since both and were reduced to N2O by the “denitrifier method,” we analyzed the samples for and by using sulfamic acid to remove prior to conversion to N2O (Granger and Sigman, 2009). To evaluate the oxidation efficiency and quantify the isotope deviation caused by the POR-associated N blank, the reference material IAEA-600 (δ15N = 1.0‰) and the POR were autoclaved and measured with each batch of δ15N-TDN samples. The δ15N–DON was calculated from the isotopic mass balance equation (Eqs. 1 and 2).
where the TDN concentration was calculated by subtracting the N-blank concentration of POR.
The SPM was determined as the weight difference between the dried filters and their counterparts before filtration. The C and N content and the corresponding δ13C (relative to V-PDB) and δ15N (relative to air N2) were measured at the University of California Davis Stable Isotope Facility. The mean standard deviation for reference material replicates was ± 0.06‰ for δ13C and ± 0.08‰ for δ15N.
Optimum multiparameter (OMP) analysis, described by Tomczak and Large (1989), is a water mass inverse model based on linear mixing that is used to find the relative abundances of different source water types (SWT). It finds a solution that best reproduces the observed data and minimizes the residuals in a non-negative least square sense. The OMP was constructed based on two main physically realistic constraints: (i) the study area can be fully represented by the combination of predefined SWT and (ii) the contribution of SWT must be non-negative and add up to 100%. The OMP can be summarized in a matrix form as follows:
where G is the matrix with the property values of SWT, X is the vector of proportional contribution of each SWT to be solved, d is the vector of the observed data, and R is the residual vector.
For the analysis, two conservative (temperature and salinity) and four semi-conservative (oxygen, phosphate, nitrate, and silicate) properties were used to define SWT (Poole and Tomczak, 1999; Budillon et al., 2003; de Carvalho Ferreira and Kerr, 2017). However, as the water masses evolve, the concentrations of these parameters are modified by biogeochemical processes, such as assimilation, remineralization, and respiration processes in the CEECS. The impact of biogeochemical processes can no longer be disregarded and have to be included in the analysis. The extended OMP analysis was applied to minimize these effects by adding the Redfield ratio item supplied by OMP files (a detailed description is available in Supplementary Information Text S2). The SWT parameter values (a detailed description is available in Supplementary Information Text S3 and Supplementary Information Text S4) used are summarized in Table 1.
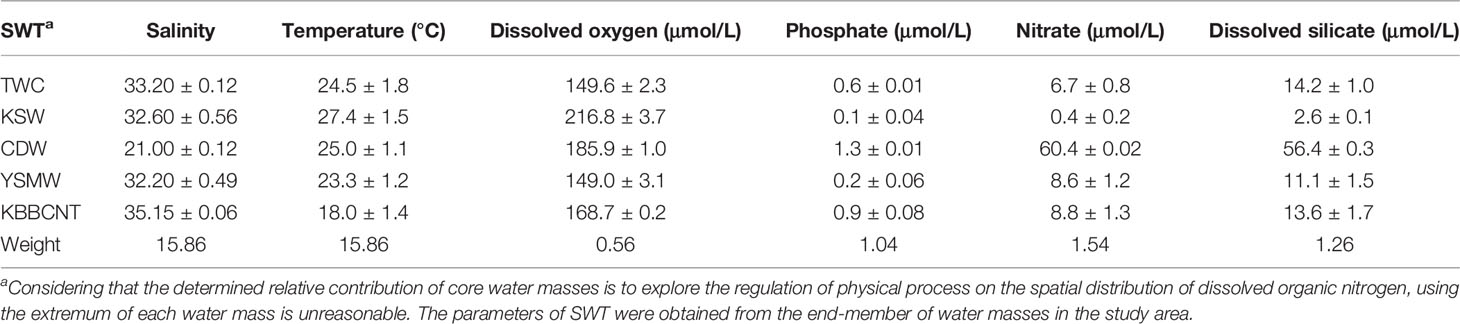
Table 1 Source water type (SWT) definitions for the Taiwan Warm Current (TWC), Kuroshio Surface Water (KSW), Changjiang Diluted Water (CDW), Yellow Sea Mixed Water (YSMW), Kuroshio Bottom Branch Current North of Taiwan (KBBCNT), and parameter weights used in the optimum multiparameter analysis for this study.
Sensitivity tests were performed to test the impact of uncertainties on the results. First, we simply changed the weights. The weights were from literature (de Carvalho Ferreira and Kerr, 2017; Zhou et al., 2018), experience, OMP files, and calculation (a detailed description is available in Supplementary Information Text S2). The best results were obtained by using the calculated weights (Table 1), which not only effectively represent the varieties in the formation region but also hold the minor mass balance residuals. All mass balance residuals were lower than 8%, only four residuals were higher than 5%, and 74% of the residuals were lower than 1% (Supplementary Figure S2). According to the mass balance residuals, the results of the OMP analysis were reliable (Tomczak and Large, 1989). Furthermore, we analyzed the same dataset by adding and subtracting the standard deviation based on the observed variability (Table 1) from the properties of the SWT (matrix G) to assess the robustness of the solution. Most of the standard deviations of the solutions were <10%. Thus, the uncertainties in the OMP runs were considered acceptable (Gasparin et al., 2014; Zhou et al., 2018).
Based on the relative abundances of different SWT, the expected DON concentration and δ15N–DON affected only by the physical mixing can be calculated as follows:
We further calculated the deviation of observed values from calculated values. The deviation is defined in terms of Error-DON.
The steady-state model is frequently used to interpret the N isotope data from the ocean (Sigman et al., 2009).
For the reactant N pool:
For the product N pool:
where f is the fraction of the reactant remaining.
The distributions of temperature and salinity are shown in Figure 2. The seawater temperature, ranging from 18.3 to 28.8°C with an average of 23.3 ± 2.9°C for the entire water column, showed significant variations from surface to bottom. The salinity varied from 20.7 to 34.6, with an average of 32.1 ± 2.9, showing an increasing trend from surface to bottom. In general, the distributions of seawater temperature and salinity demonstrated that the areas of coastal low-salinity water (<31) became much larger at the surface than in the bottom layer and that cold and salty seawater (>34) moved northward on the East China Sea shelf areas at the bottom. A cold and salty belt (>34) along the south study area was observed in the middle layer, indicating an upwelling of the northward-moving subsurface waters (Figures 2B, E). Based on this investigation and previous studies (Mao, 1964; Su and Weng, 1994; Chen, 2009; Yang et al., 2011), five major water masses were identified in the CEECS (Supplementary Figure S1): (i) the high-temperature (23–29°C) and high-salinity (33.2–34.2) Taiwan Warm Current (TWC), (ii) the low-temperature (18–21°C) and salty (>34.3) Kuroshio Bottom Branch Current North of Taiwan (KBBCNT), (iii) the high-temperature (23–29°C) and high-salinity (S >34.2) but nutrient-depleted Kuroshio Surface Water (KSW), (iv) the relatively low-temperature (<23°C) Yellow Sea Mixed Water (YSMW), and (v) the low-salinity (<31) Changjiang Diluted Water (CDW) in coastal areas. Shelf Mixed Water (SMW) was recognized in the study area during the cruise period. To specify the expansion form of CDW, the isohaline of 26 (Hou et al., 2021) was defined as the core area of CDW, and the isohaline of 31 was defined as the boundary of CDW.
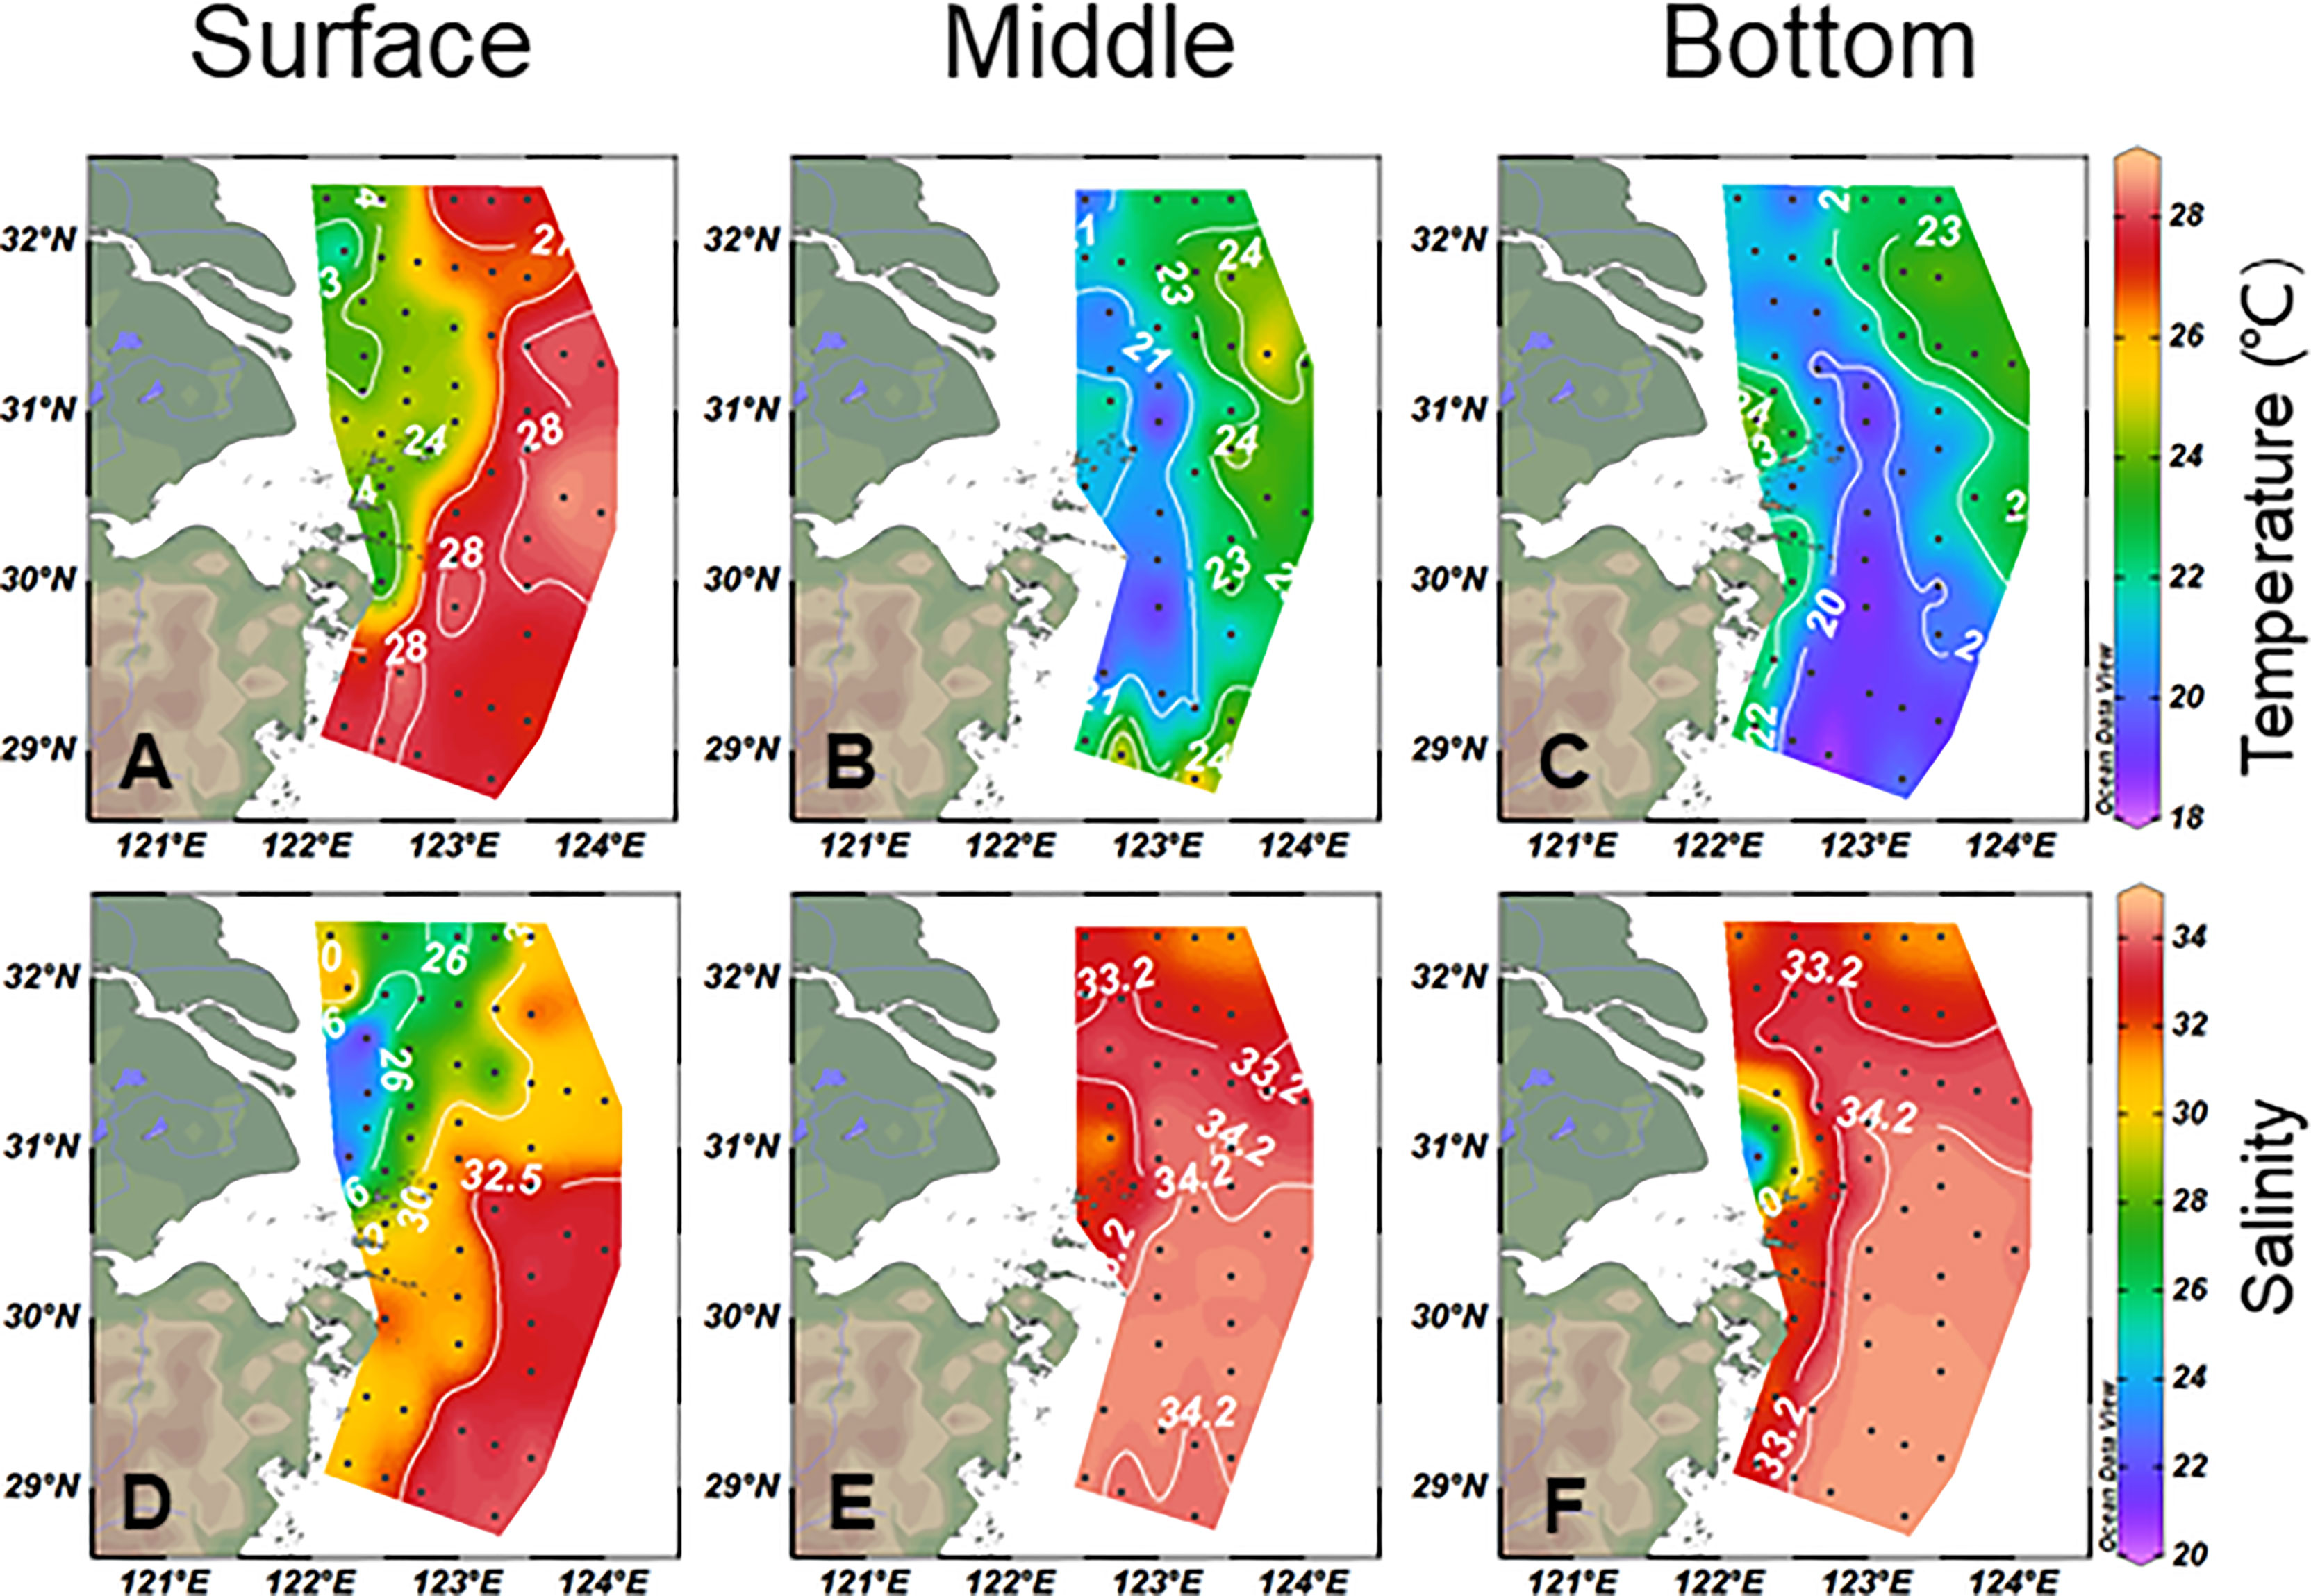
Figure 2 Horizontal temperature (A–C) and salinity (D–F) distributions for surface, middle, and bottom water in the study area.
In the core area of CDW, the was rich (16.4–63.8 μmol/L) and relatively uniform in vertical distribution (Figures 3A–C). Both and were relatively light (Figures 3D–I). In the flow direction of CDW, the concentration decreased rapidly and became heavier in and . Along with the offshore increase of salinity >31, the concentration was comparatively lower in the surface layer than in the bottom layer and decreased to exhausted in surface water (Figure 3A). Thus, no credible , data were obtained. In the bottom layer, the KBBCNT had relatively homogeneous values of 5.5 ± 0.44 and 2.5 ± 0.29‰, respectively (Figures 3F, I).
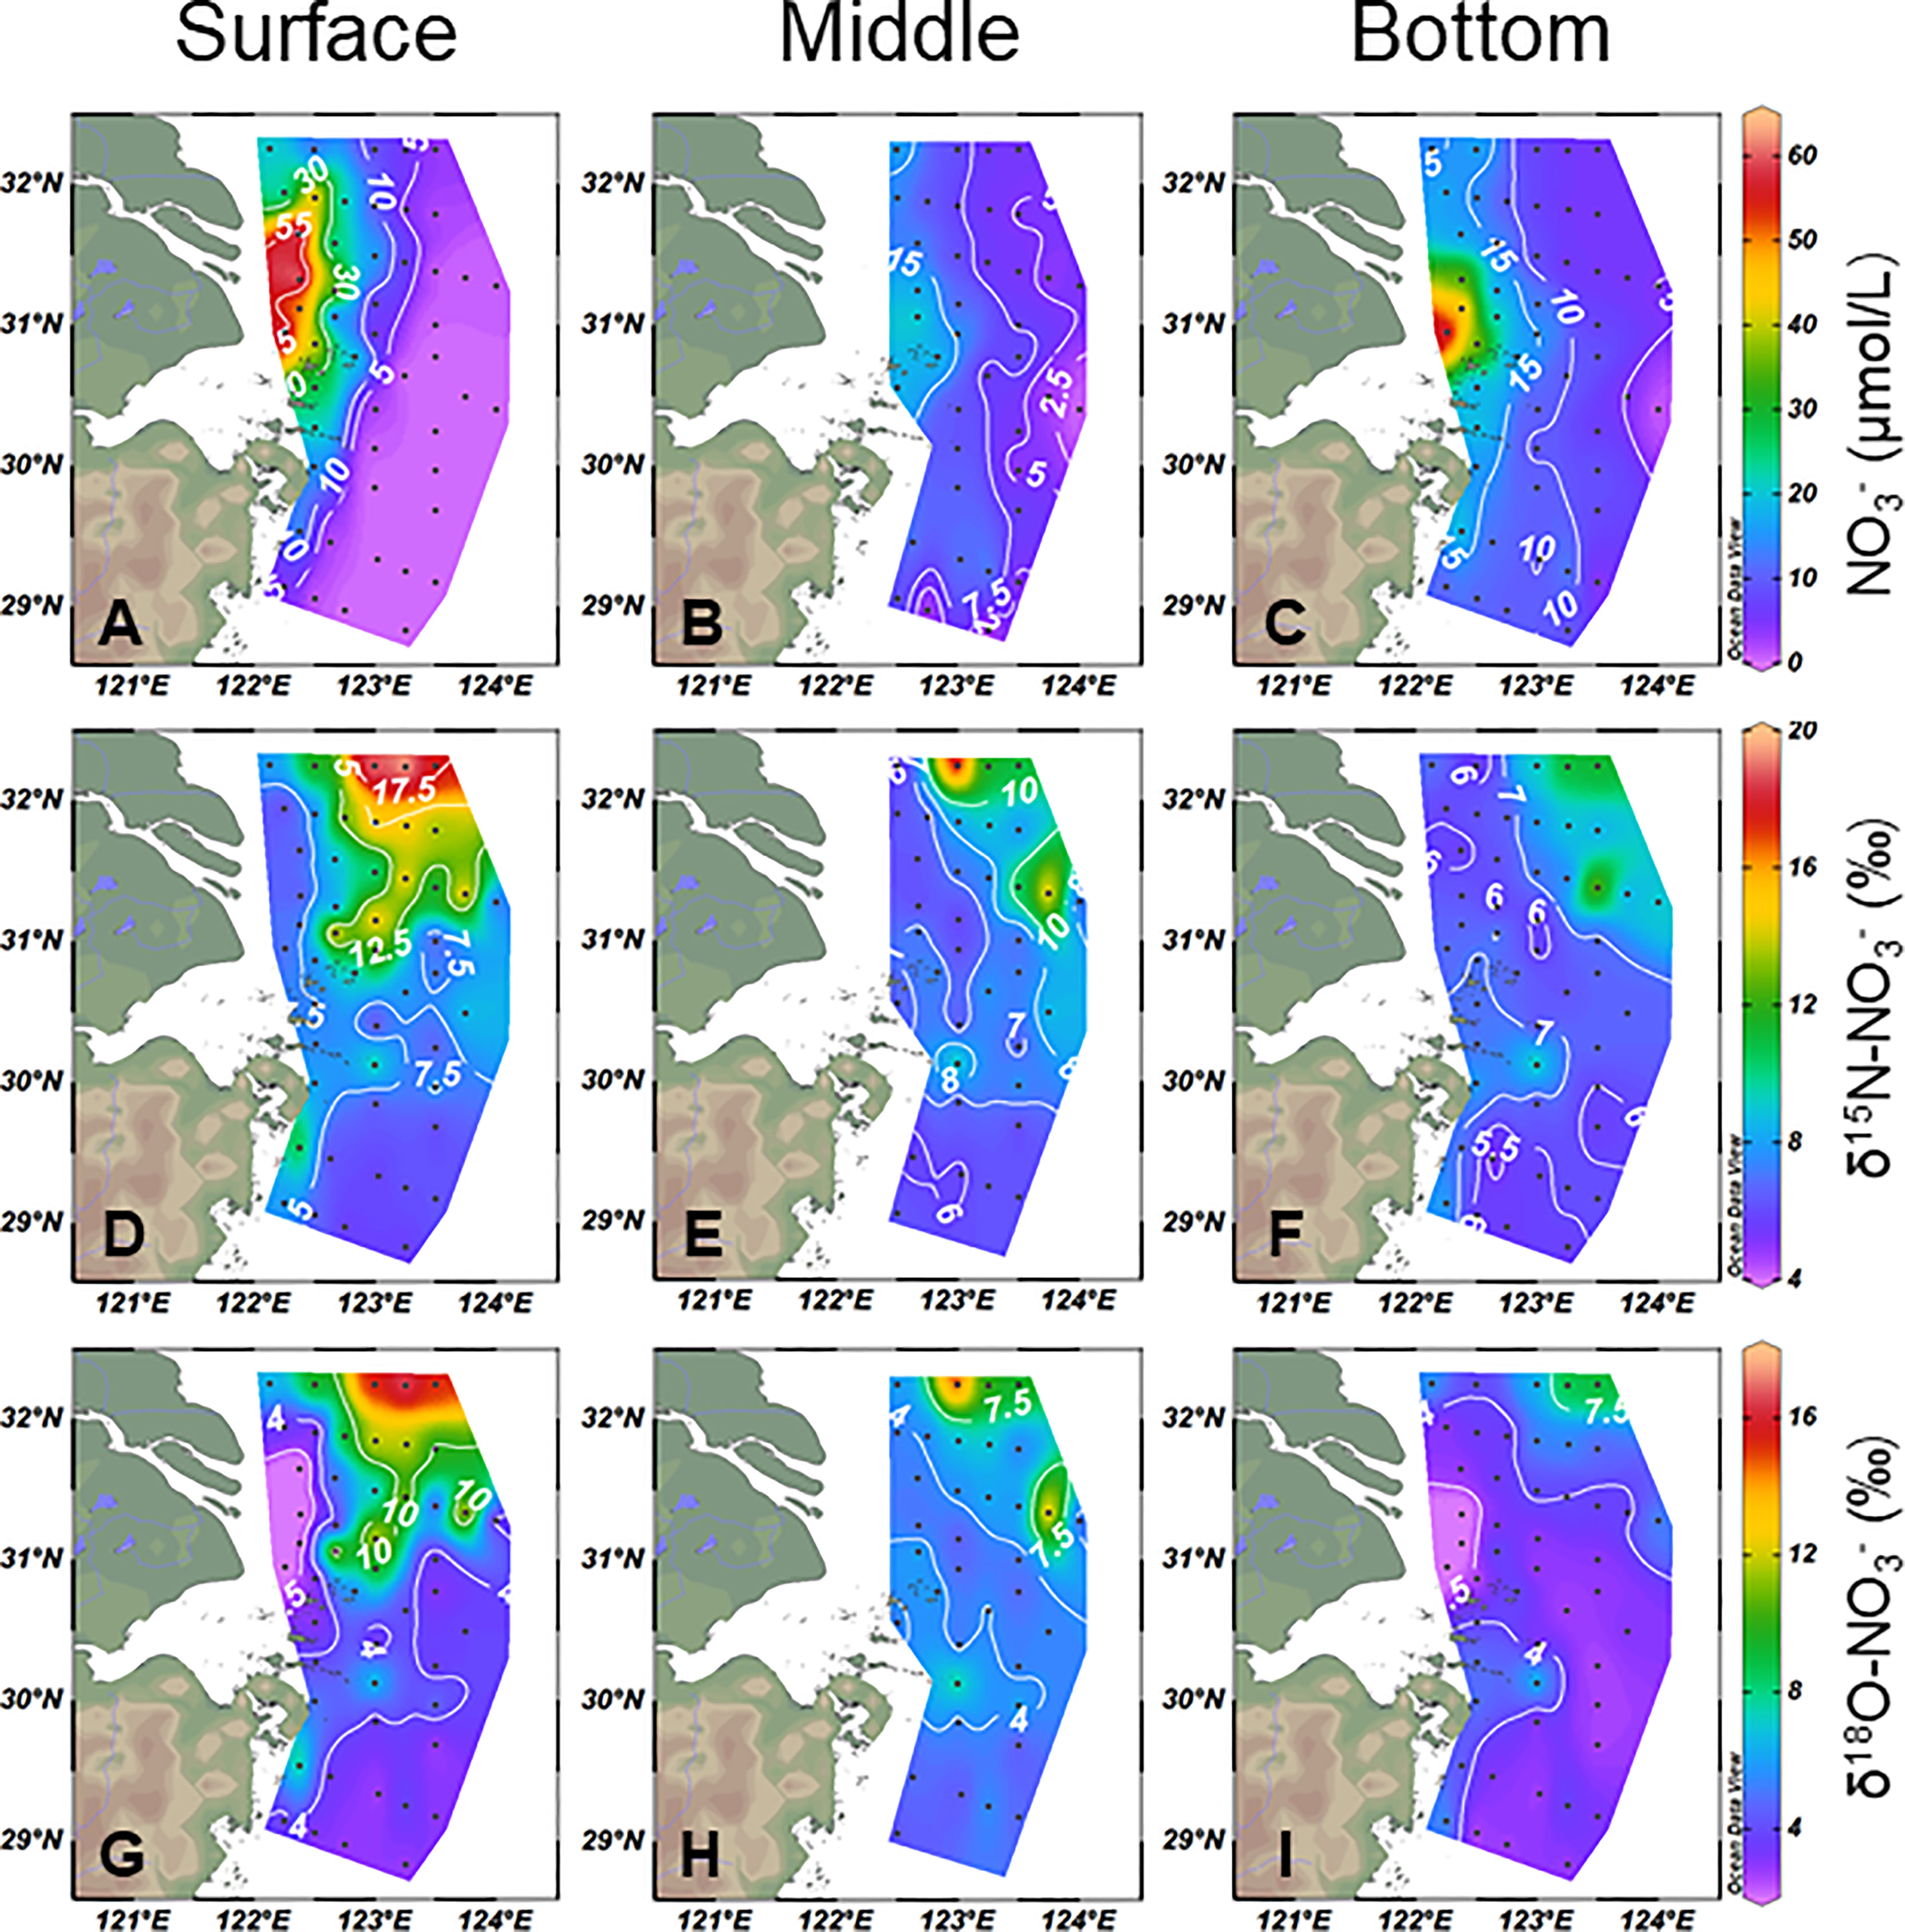
Figure 3 Horizontal (A–C), (D–F), and (G–I) distributions at the surface, middle, and bottom water in the study area.
In the study area, accounted for 52 ± 27% of TDN and DON accounted for 45 ± 26%. Therefore, DON was equally important as in local N cycling. The DON concentration ranged from 3.6 to 9.2 μmol/L in the study area. It was 6.8 ± 1.3 μmol/L at the surface, 5.3 ± 0.86 μmol/L at the middle, and 5.2 ± 0.91 μmol/L at the bottom (Figures 4A–C). The δ15N–DON was varied from −1.4 to 7.4‰, with an average of 3.7 ± 1.6‰. Generally, the high DON concentration corresponded to a lower δ15N–DON and vice versa.

Figure 4 Horizontal dissolved organic nitrogen (DON) (A–C) and δ15N–DON (D–F) distributions from the surface, middle, and bottom water in the study area.
The concentration of PN averaged 7.2 ± 8.3 μmol/L. In the core area of CDW, the PN concentration exceeded 20 μmol/L but decreased to 5 μmol/L at ~50 m isobath. In the offshore stations, the PN concentration was low and decreased toward the southeast with a small gradient (Figures 5A–C). In general, the δ15N–PN increased from coastal areas to offshore (Figures 5D–F). The δ15N–PN in the surface layer had a comparatively broader range (−0.99 to 7.6‰, 4.0 ± 2.2‰) than in the middle (0.1 to 5.9‰, 3.9 ± 1.4‰) and bottom layers (0.39 to 6.1‰, 3.0 ± 1.3 ‰).
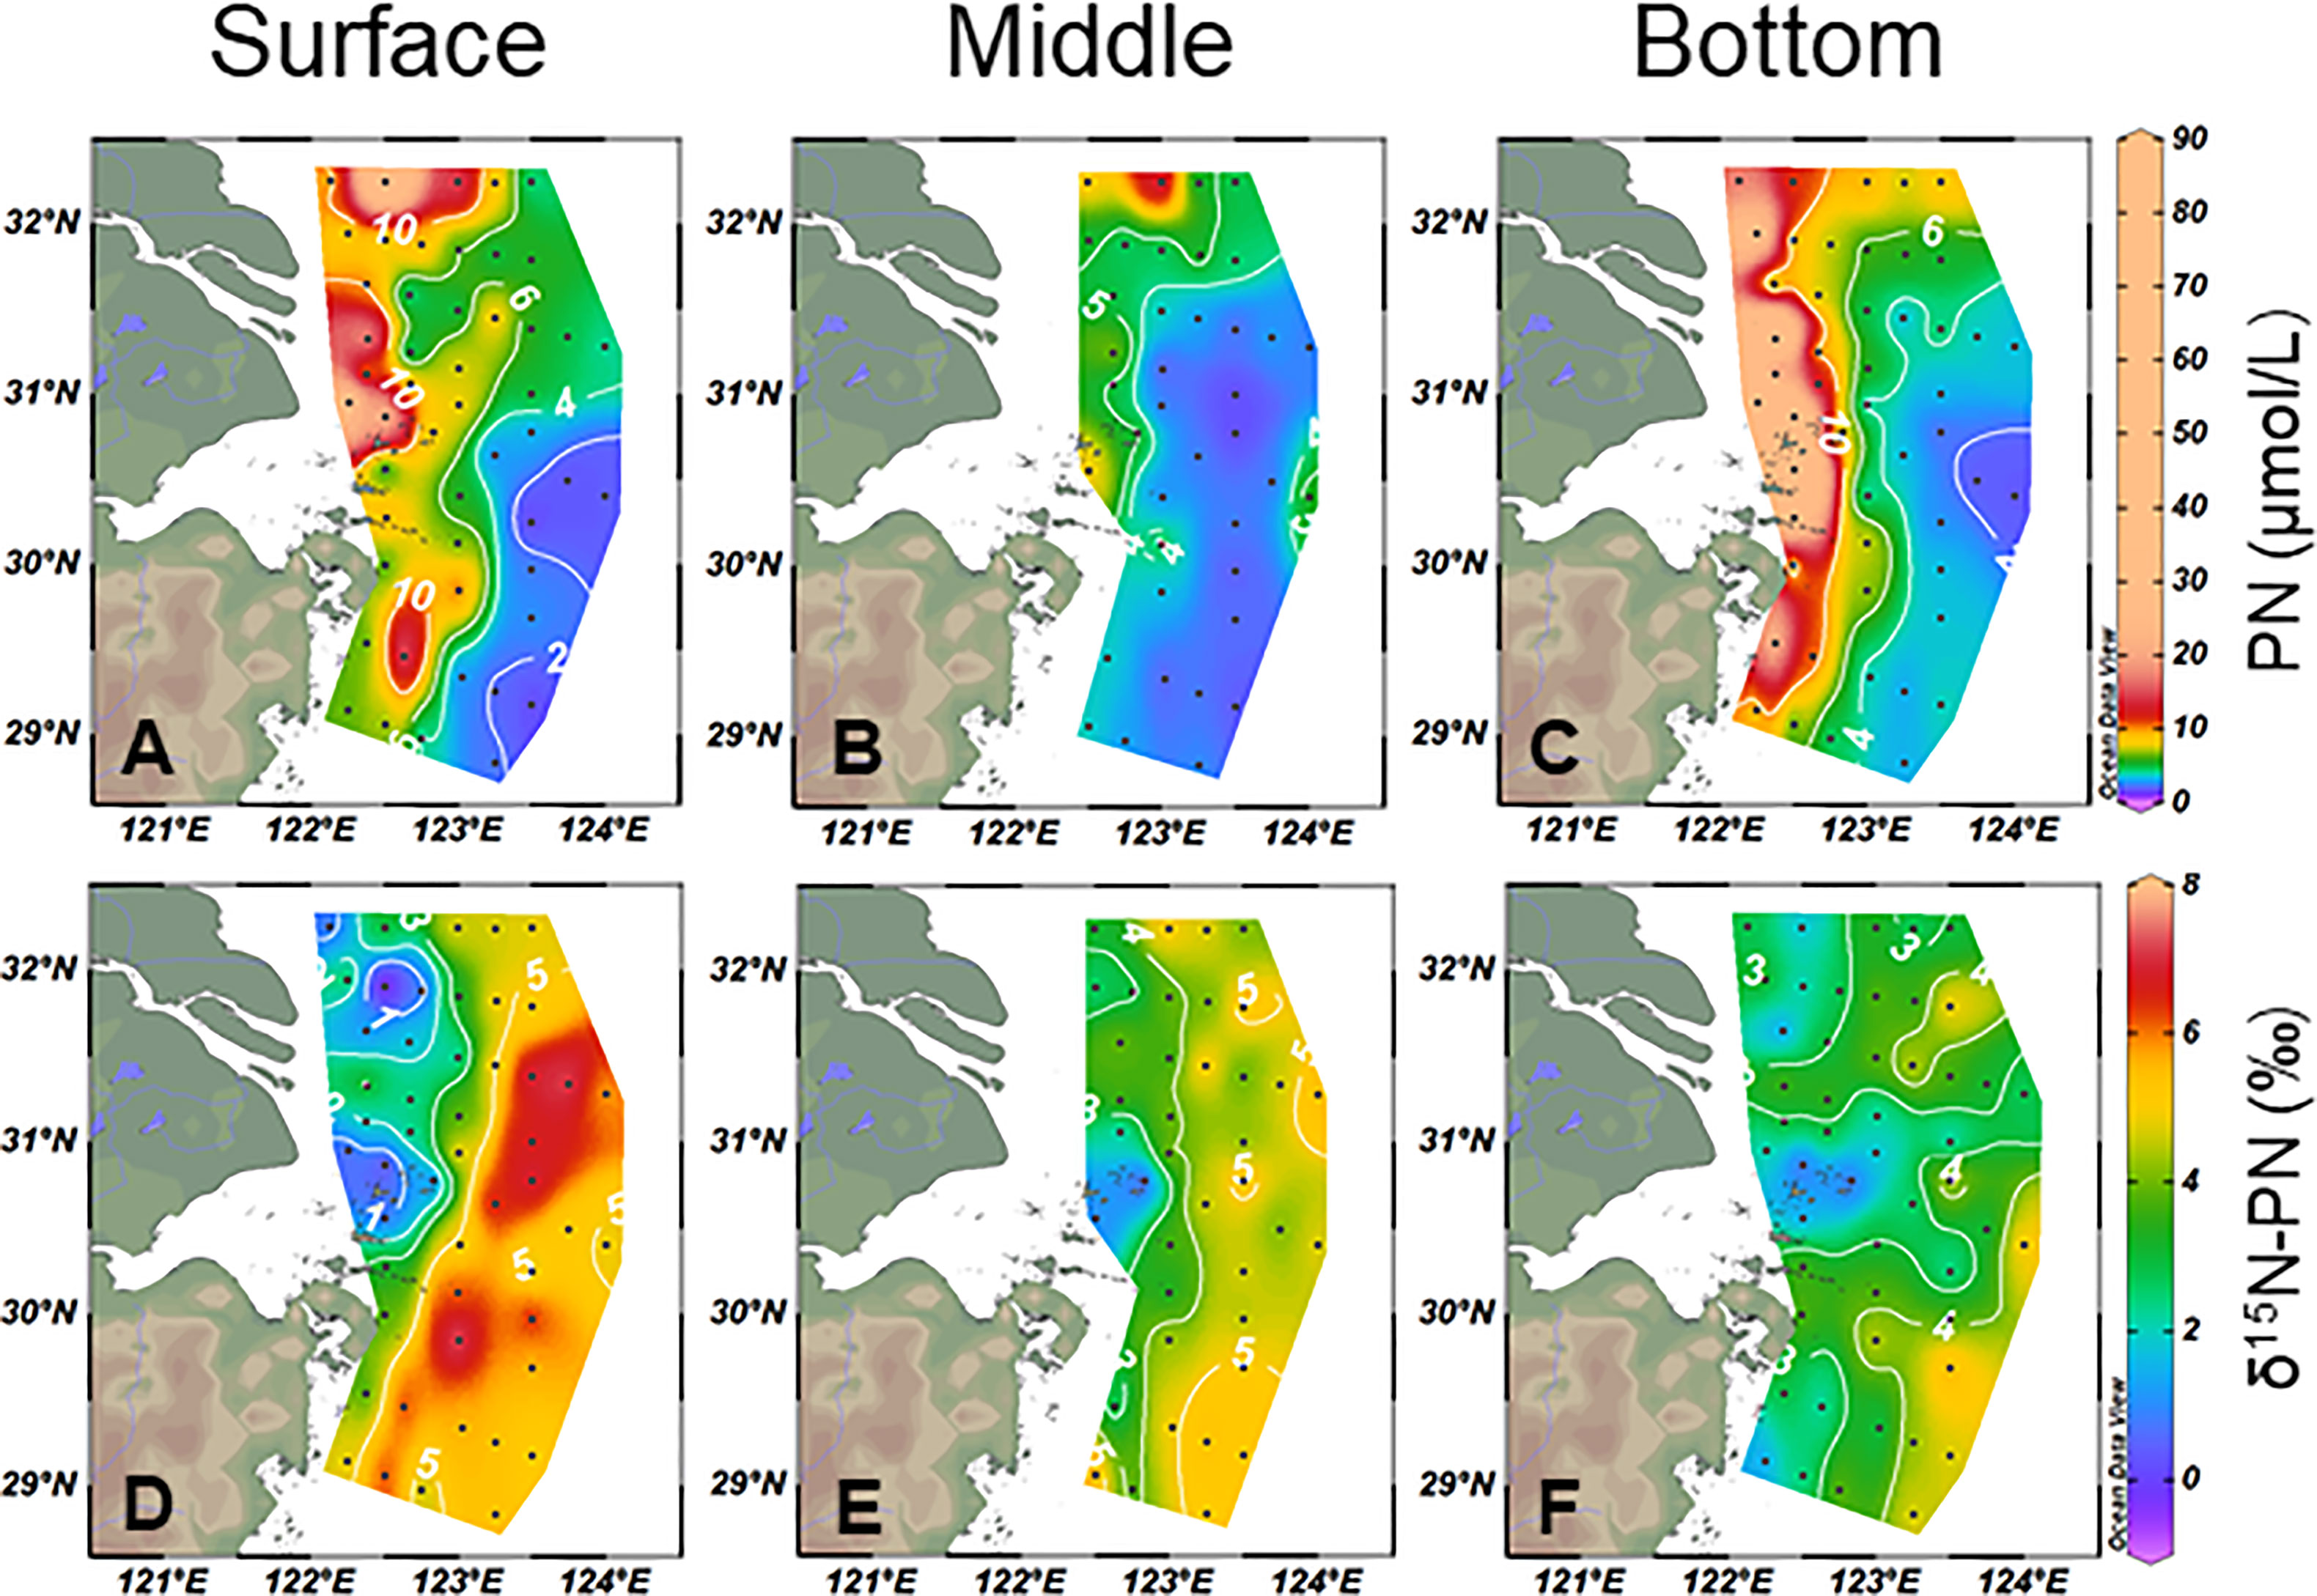
Figure 5 Horizontal particulate nitrogen (PN) (A–C) and δ15N–PN (D–F) distributions from the surface, middle, and bottom water in the study area.
The OMP analysis was used to determine the relative contribution of the core water masses in the CEECS (Supplementary Figure S3). CDW flowed in the east, southeast, and especially northeast directions in the surface layer, which is consistent with previous studies (Liu et al., 2021). In the surface water of the northern study area (transect A1–A4), there is a weak bidirectional northwestward extrusion of CDW over Subei Shoal. From there, the contribution of CDW gradually decreases with increasing distance from the coastal area. YSMW and KSW are present as high contributions in the northern nearshore area and offshore area, respectively. In the southern study area, KSW contributes more than 50% of the total water in the entire surface layer. The remaining contribution comes mainly from TWC and CDW in the nearshore area. The bottom water in the study region is a mixture of TWC, KBBCNT, and YSMW. KBBCNT contributes the most. YSMW is confined to the northern part of the study area.
The difference between measured values and calculated values (Eq. 4) based on OMP results was defined as Error-DON. When the measured values are equal to the calculated values, it means that the physical mixing of the water masses is the dominant factor controlling the spatial distribution of DON. A positive Error-DON corresponds to the net production of DON, and a negative Error-DON corresponds to the net consumption. To identify the DON dynamics in different water masses, Error-DON versus measured DON was plotted (Figure 6A). We found that both net production and net consumption of DON occurred in every water mass. In the study area, the Error-DON averaged 10.7 ± 8.6% for DON net production and −9.0 ± 7.0% for net consumption. Interestingly, in all the sampling sites (n = 138), there were equal numbers of DON net production (n = 69) and consumption sites (n = 69). This result could explain why there is a misleading impression that DON exhibited a conservative behavior in general over the CEECS (from the river mouth to the offshore area up to 800 km; Kwon et al., 2018). In actuality, we captured the non-conservative behavior (active biochemical cycling) of DON via the OMP analysis.
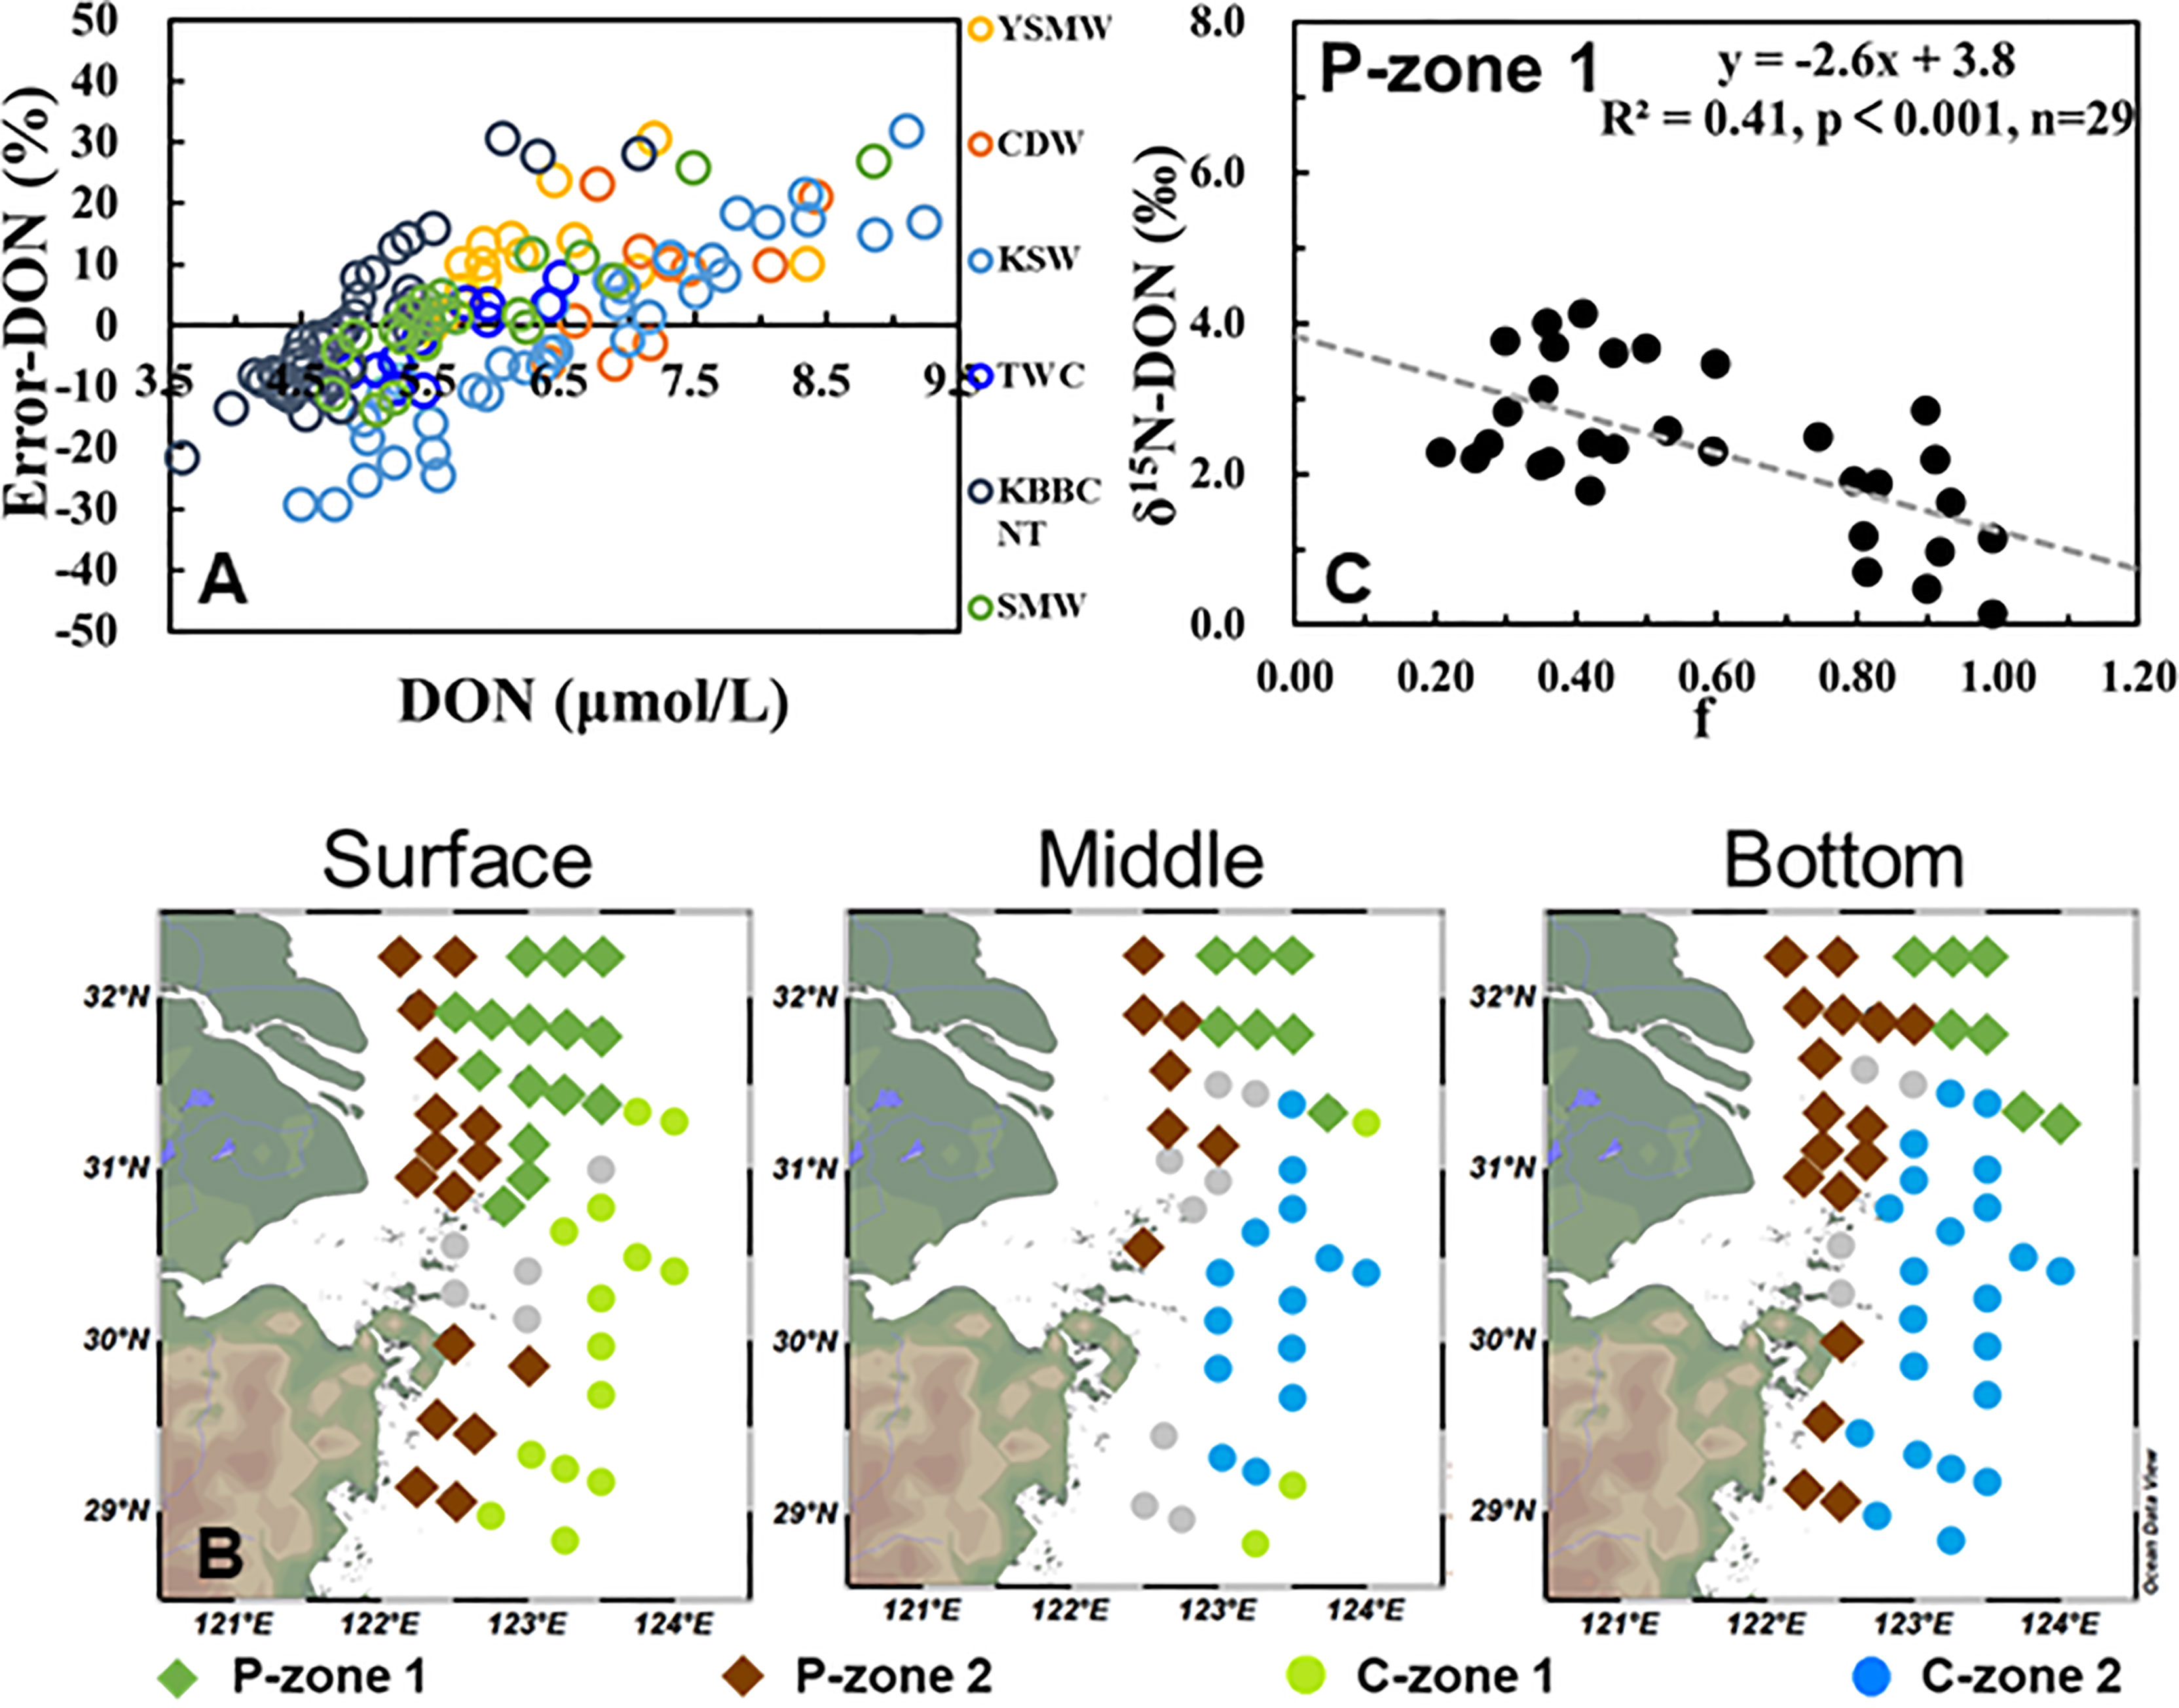
Figure 6 (A) Scatter plots showing the difference (in percentage) between the observed and calculated values of dissolved organic nitrogen (DON) vs. the observed DON concentration. Different colors are used to distinguish stations where Yellow Sea Mixed Water, Changjiang Diluted Water, Taiwan Warm Current, Kuroshio Surface Water, or Kuroshio Bottom Branch Current North of Taiwan dominate by more than 50%. (B) The distributions of DON net production (diamond) and consumption (dot) site zones are noted. (C) Correlation between δ15N–DON and the fraction of the remaining (marked as f).
The positive Error-DON values were distributed mainly in the southern coastal areas and northern part of the study area (see the diamonds in Figure 6B). In these DON net production sites, the relationship between δ15N–DON and DON concentration was categorized into two patterns. In the rich euphotic layer (9.1 ± 9.2 μmol/L, P-zone 1), the DON correlated negatively with δ15N–DON (R2 = 0.57, p ≤ 0.001, n = 29, Figure 7A), while in the coastal middle and bottom waters where the SPM was high (64.0 ± 90.1 mg/L, P-zone 2), the DON correlated positively with δ15N–DON (R2 = 0.29, p ≤ 0.001, n = 37, Figure 7B). The two patterns indicated that there were two different mechanisms of DON production in the two zones. In P-zone 1, the δ15N of the produced DON decreased the δ15N–DON in the water column. Conversely, the δ15N of the produced DON elevated the δ15N–DON in the water column in P-zone 2. A detailed explanation is provided in Section 4.2.
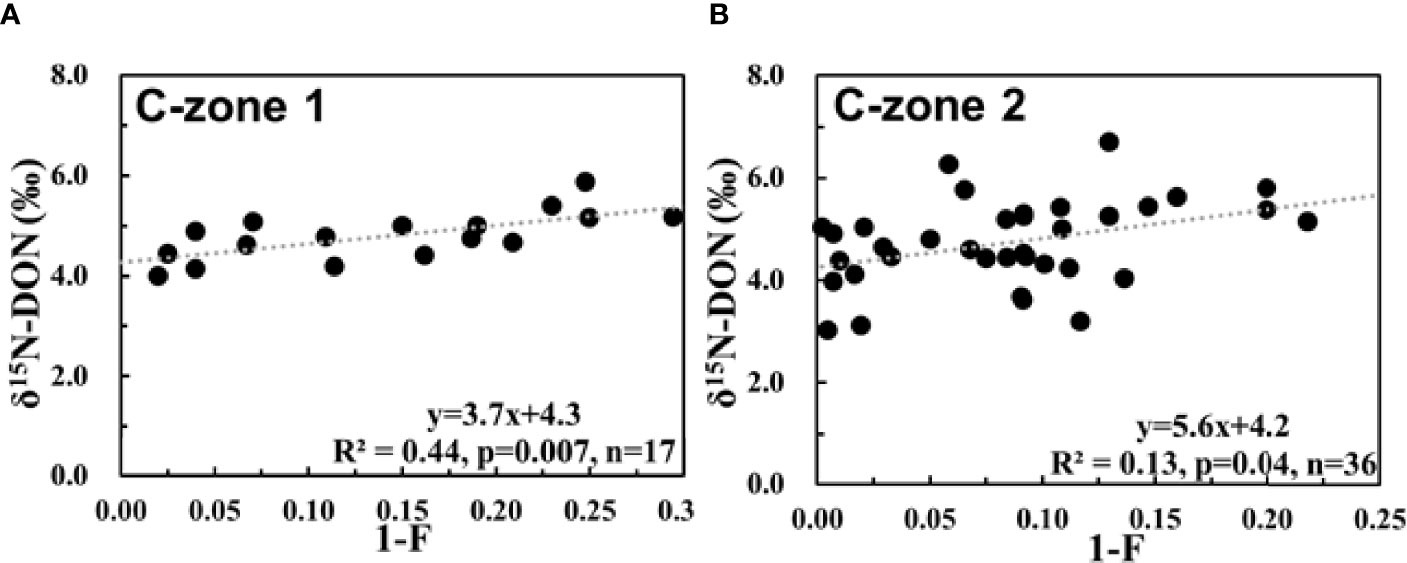
Figure 7 (A) Relationship between δ15N-dissolved organic nitrogen (DON) and 1-F in C zone 1. (B) Relationship between δ15N-DON and 1-F in C zone 2. The variable “F” is the fraction of the DON remaining.
The negative Error-DON values were concentrated mainly in the southern part of the study area and part of the northern bottom layer (see dots in Figure 6B). Based on the distribution of net consumption sites and the apparent oxygen utilization (AOU), we classified the net consumption sites into two zones: (i) C-zone 1, where the AOU values were negative (AOU = −0.12 ± 0.68 mg/L, n = 17), and (i) C-zone 2, where the AOU values were positive (AOU = 3.17 ± 0.69 mg/L, n = 36). A negative correlation was observed between the AOU and DON concentration (R2 = 0.28, p = 0.001, n = 36, Supplementary Figure S5A). With the assistance of multiple N-isotopic signatures, we determined the most plausible turnover processes for DON in each zone.
DON can be released through the autochthonous biological process of extracellular exudate production by phytoplankton (Bronk, 2002). The surface photosynthetic sources for DON in the Eastern Tropical South Pacific euphotic zone (Knapp et al., 2018) and the South China Sea surface waters (Zhang et al., 2020) were suggested through a positive correlation between the DON stock and chlorophyll-a at these sites. Unfortunately, we lack chlorophyll-a data. However, the dual-isotope variation pattern in P-zone 1 is capable of characterizing the phytoplankton activity. In P-zone 1, the observed concentrations (9.1 ± 9.2 μmol/L) were lower than the expected values (15.7 ± 10.7 μmol/L), while both and were heavier than the expected isotope ratios and In other words, was partially consumed accompanied by the enrichment of and in P-zone 1. This suggests the dominance of assimilation by phytoplankton (Zhong et al., 2020). The co-variation of dual isotopes fits a 1:1 line (R2 = 0.96, p ≤ 0.001, n = 29, Supplementary Figure S6A), as also expected for assimilation by phytoplankton (Granger et al., 2004). A positive correlation between consumption and DON concentration (R2 = 0.58, p ≤ 0.001, n = 29, Supplementary Figure S6B) suggested the net DON production at these sites as well. In rich surface waters like P-zone 1, phytoplankton preferentially consume 14N relative to 15N (Sigman and Fripiat, 2019). The isotope effect for assimilation produces photosynthetic biomass (which, in turn, produces DON) with a relatively low δ15N (Knapp et al., 2018). Thus, the phytoplankton-sourced DON may hold a relatively low δ15N value in P-zone 1.
The isotope effect is a key parameter that associates assimilation to the 15N/14N of and DON. Given the fact that (the reactant) can be continuously replenished by nitrification (Zhong et al., 2020), a steady-state model (Eq. 7, applied to the product N pool) is more appropriate to estimate the isotope effect (15ϵphy) during DON production in P-zone 1. The slope of the linear regression between the δ15N–DON and the fraction of remaining in the water column after assimilation yielded an estimate for 15ϵphy of 2.6 ± 0.6‰ (Figure 6C). The δ15Ninitial (y-intercept) was 3.8 ± 0.4‰, which was consistent with the average value (3.8 ± 1.0‰) of the expected δ15N values (theoretical value under physical mixing; Eq. 5) for DON in P-zone 1. This result validated the application of the steady-state model, and the addition of phytoplankton-sourced δ15N–DON decreased the δ15N–DON in the water column.
Approximately 87% of the annual particulate load from Changjiang River is discharged in summer (Zhu et al., 2011). The P-zone 2 is a high-SPM (64.0 ± 90.1 mg/L) region. High SPM reduces light penetration in the water column and suppresses the photosynthesis process and primary production (He et al., 2017). From the perspective of , the (average of 6.6 ± 0.9‰) exhibited a homogeneous behavior in P-zone 2, suggesting that it was unlikely to be an occurrence of intensive phytoplankton assimilation. Thus, the phytoplankton-sourced autochthonous DON was not the dominating source of DON in P-zone 2, even though nutrients were rich in this area. PN and DON are the two main organic N species in the water column. In CEECS, PN was significantly controlled by SPM transport (R2 = 0.98, p ≤ 0.001, n = 40, Supplementary Figure S7). SPM (PN) transport and estuarine physical mixing are two independent processes (Gao et al., 2020). More than half of the fine‐grained particles are temporarily deposited near the estuary in P-zone 2 (Chen et al., 2017). Thus, there are possibilities that PN and DON pools interacted during transportation in P-zone 2. An inter-transformation between the two most important organic N pools may have occurred (Gebhardt et al., 2005) and altered the distribution and variation of DON observed in this area.
PN produces DON mainly through cell lysis, exudation, and particle solubilization (Bronk and Steinberg, 2008). These processes are more likely to occur with the rupture of the C–C bond but are much less likely to occur with the rupture of the C–N bond. Thus, the process of producing DON from PN would not cause a significant isotope fractionation, and the produced δ15N–DON should be similar to the δ15N of PN from which DON is derived (Knapp et al., 2011). The δ15N–PN ranged from 0.7 to 7.1‰, with an average of 3.2 ± 1.8 ‰. This was slightly higher than that of δ15N–DON (0.1 to 5.5‰, average 2.9 ± 1.6 ‰) in P-zone 2. The mean values of the δ15N–PN and δ15N-DON in P-zone 2 showed a statistically significant difference (ANOVA, p < 0.01). This difference explains why the DON in P-zone 2 correlates positively with δ15N–DON (R2 = 0.29, p ≤ 0.001, n = 40, Supplementary Figure S4B). The addition of PN-sourced DON elevated the δ15N–DON in the water column.
DON is known as a potential source of N-nutrient for phytoplankton (Knapp et al., 2018). Hu et al. (2012) demonstrated the ability of Prorocentrum donghaiense, which frequently occurs in CEECS, to assimilate DON. Moreover, Zhang et al. (2015) suggested that DON is bioavailable during the diatom to dinoflagellate bloom succession. Thus, in C-zone 1 where is completely consumed, DON may play an important role in fueling phytoplankton growth. The bio-active N released from DON in C-zone 1 likely occurs with isotope fractionation when hydrolysis reactions break common C–N bonds (Knapp et al., 2011). Since DON can be continuously supplied by water mixing in the horizontal direction, a steady-state model (Eq. 6 applied to the reactant N pool) would fit the continuous DON supply and removal. The isotope effect (15ϵass-DON) during DON consumption in C-zone 1 was estimated to be 3.7 ± 1.2‰ (Figure 7A), which is in accordance with the isotope effect (3–10‰) of the conversion of amide to amine and amine to ammonia (O′Leary and Kluetz, 1972; Macko et al., 1986; Silfer et al., 1992). The result was slightly lower than the isotope effect of 4.9 ± 0.4‰ during DON consumption in the upper layers of South China Sea (Zhang et al., 2020) and 5.5 ± 1.2‰ in the upper 50 m of Eastern Tropical South Pacific (Knapp et al., 2018). This could result from the residence time of DON that determines the extent of DON consumption. Previous studies suggested that the residence time ranged from days to months in C-zone 1 (Gu et al., 2012; Tan et al., 2018; Wang et al., 2018). In other words, DON has a shorter residence time in this area than in the upper layers of South China Sea (∼3 years; Liu and Gan, 2017) or the upper ocean of Eastern Tropical South Pacific (months to years; Knapp et al., 2011). Hopkinson et al. (2002) showed that the average half-lives of very labile and labile DON are 12 and 113 days, respectively. We infer that the labile DON is not completely consumed due to the short residence time in C-zone 1. Therefore, the isotope fractionation of labile DON consumption in C-zone 1 is weaker than that of refractory DON consumption.
In C-zone 2, the enrichment ratio of 18O and 15N from the potential sources deviated from the slope of 1.0, spreading over the range from 1.0 to 2.0 (Supplementary Figure S8A, Granger et al., 2004). This suggests that continuous nitrification occurred in this area (Umezawa et al., 2014; Wang et al., 2016). The negative correlation between the AOU and DON concentrations (R2 = 0.28, p = 0.001, n = 36, Supplementary Figure S5A) and the significantly positive correlation between AOU and concentrations (R2 = 0.64, p < 0.001, n = 36, Supplementary Figure S5B) suggest the aerobic microbial degradation of DON to be associated with regeneration and a coupling between the consumption of DON pools and the production of in C-zone 2. The DON remineralization and nitrification elevate the NO3− concentration (Liu et al., 2020).
We use the steady-state model (Eq. 6 applied to the reactant N pool) to estimate the isotope effect during DON consumption. The slope of the linear regression yielded an estimate for 15ϵntr-DON of 5.6 ± 2.6‰ (Figure 7B). The 15ϵntr-DON was consistent with the isotope effect of 5.5 ± 1.2‰ for the DON degradation estimated from data for the upper 50 m of Eastern Tropical South Pacific, where the residence time was many months to years (Knapp et al., 2018). In C-zone 2, KBBCNT makes the highest contribution (>50%, Supplementary Figure S3). The shelf water exchange with Kuroshio Current is 1–2.3 years [summarized in Chen (1996)], which indicates that DON in C-zone 2 undergoes a longer period of degradation than in C-zone 1. As a result, DON degrades more thoroughly, and the remaining DON is more refractory. The δ15Ninitial (y-intercept) was 4.2 ± 0.3‰, which is slightly lower than the average value (4.7 ± 0.2‰) of the expected δ15N values (theoretical value derived from physical mixing; Eq. 5) for DON in C-zone 2. The 0.5‰ difference may result from DON originating from “fresh” PN in C-zone 2. The isotope δ13C is a useful proxy to discriminate the sources of POC. In C-zone 2, δ13C averaged −21.9 ± 1.1‰, suggesting that marine phytoplankton was the predominant origin of POC (−22 to −18‰; Middelburg and Nieuwenhuize, 1998). The linear relationship between POC and PN (R2 = 0.91, p ≤ 0.001, n = 36, Supplementary Figure S8B) suggests that PN was strongly associated with POC. The C/N molar ratio between POC and PN was 5.5 ± 0.3, which is lower than the Redfield ratio of 6.6 (Redfield, 1960), suggesting that the PN was “fresh” (Liu et al., 2019). The solubilization of PN is an important source of DON (Benner and Amon, 2015). The δ15N–PN ranged from 0.6 to 6.1‰, with an average of 3.3 ± 1.6 ‰, which was lighter than that of δ15N–DON (3.0 to 6.7‰, averaged 4.7 ± 0.9 ‰) in the C-zone 2. The mean values of δ15N–PN and δ15N-DON in the C-zone 2 showed a statistically significant difference (ANOVA, p < 0.01). As mentioned in Section 4.2.2, the δ15N of DON produced was similar to the δ15N–PN. Thus, the addition of DON from PN would decrease the expected δ15N–DON in C-zone 2. Therefore, we suggested that the expected δ15N–DON had already been substantially modified by DON originating from “fresh” PN. In this section, we estimated the isotope effect during DON consumption and clarified the confounding coupling of , DON, and PN in the N cycling in C-zone 2.
The remaining sites not included in these four zones are concentrated in coastal surface waters (n = 17, Figure 6B, gray dots), where the Error-DON was relatively low (−3.3 ± 3.5%). Substantial challenges still exist for studying DON cycling in this zone. On the one hand, it is still uncertain whether this deviation is caused by biological processes or uncertainties for calculation. On the other hand, both the and PN concentrations were high in this zone, and the variation caused by DON consumption was relatively small. Understanding of the particularly complex and overlapping interactions between , PN, and DON remains elusive. Further studies are required to investigate this issue.
DON is a dominant dynamic component in N cycling, significantly contributing to the hypoxia and eutrophication burden in CEECS. The biochemical cycling of DON, such as mineralization and nitrification, is often accompanied by oxygen consumption and regeneration (Liu et al., 2020). The produced by DON mineralization participates in the next cycle of photosynthesis in Redfield stoichiometry. In this manner, DON mineralization plays an important role in stimulating carbon fixation. Nitrification is often accompanied by the side-production of nitrous oxide, a very powerful greenhouse gas (Yang et al., 2020). To summarize, DON cycling is closely associated with local nutrient biogeochemistry, primary productivity, and ecosystem health. A clear model of the DON cycling processes in estuaries and marginal seas is urgently needed in current marine science.
We integrated the above-mentioned results to construct the first diagram of DON cycling in the CEECS (Figure 8). The riverine terrestrial-derived DON input into the coastal zone undergoes substantial modifications by shelf-offshore autochthonous biological processes and degradation processes. In the CE coastal areas (P-zone 2), an area of high SPM provides the ideal location for the inter-transformation between DON and PN. The δ15N–PN is higher than δ15N–DON in this area. The DON of the PN source mixes with the local DON inventory and results in an elevation of the δ15N-DON in the water column. In DON P-zone 1, phytoplankton-originating DON has a low δ15N and offsets the δ15N-DON in the water column. In the depleted surface seawater (C-zone 1), DON serves as a potential N source for phytoplankton assimilation or heterotrophic microbial processes. In KBBCNT (C-zone 2), continuous DON mineralization and nitrification not only replenish the pool but also consume oxygen. This oxygen consumption in the water column probably contributes to coastal hypoxia. In C-zone 1 or C-zone 2, incomplete DON consumption (N released from DON) elevates the δ15N of residual DON relative to the original δ15N. The isotope effect was estimated to be 3.7 ± 1.2‰ and 5.6 ± 2.6‰. Based on these results, we suggest that the longer the residence time is, the more completely the DON degrades and the stronger is the isotope effect. This DON cycling diagram (Figure 8) not only fits the CEECS but also is appropriate to be used to describe DON cycling in many other estuarine and marginal marine systems, even though the relative intensities of DON cycling processes may vary.
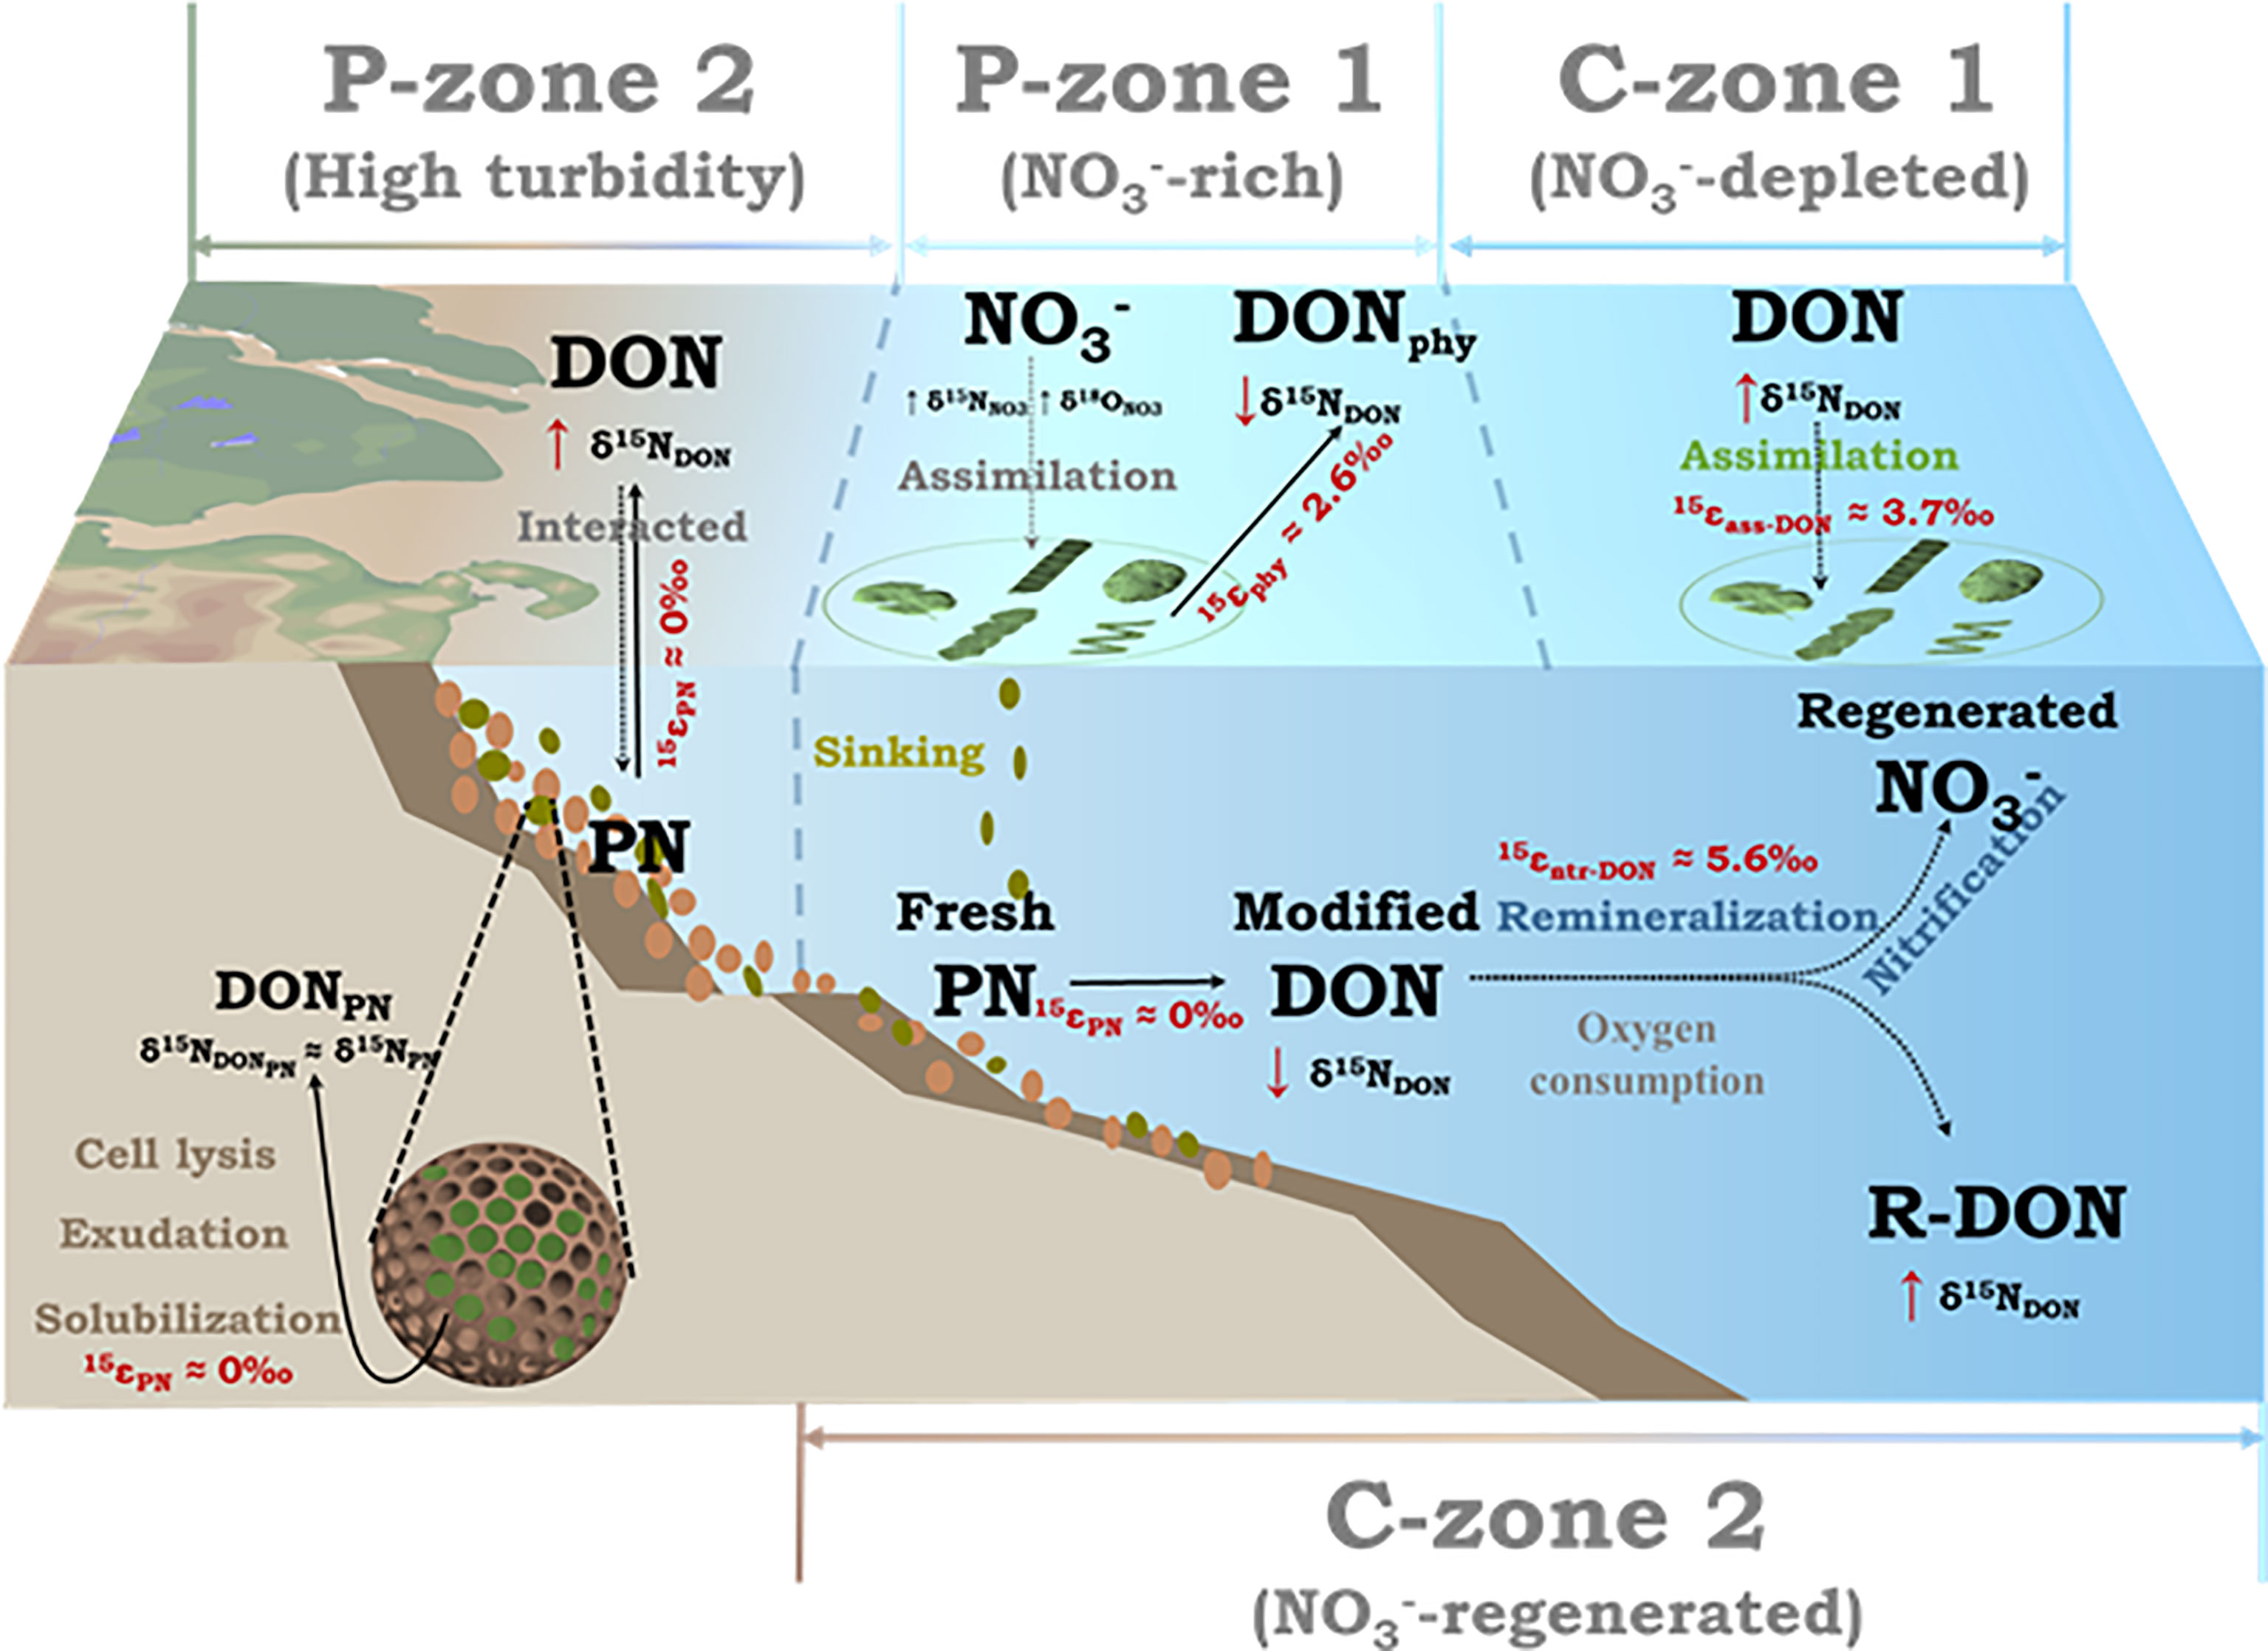
Figure 8 Diagram of dissolved organic nitrogen production and consumption in the Changjiang Estuary and the adjacent East China Sea shelf areas with a description of the reaction pathways. The dotted arrow represents the consumption process, and the solid arrow represents the production process.
This study proved that DON is an active component in N cycling in estuaries and global marginal seas. Intensive physical processes are among the major drivers controlling the distribution of DON, but the active biotic processes as well play an important role, as revealed and evidenced by the results of the OMP analysis combined with information on the δ15N of DON and other associated N species. There exists dynamic zoning in DON production and consumption in the direction from the estuary to the offshore marginal sea. The combination of OMP analysis and multiple N isotopic proxies has proven to be a useful means of studying DON cycling and may help to improve understanding of the complicated DON dynamics in perturbed estuaries and adjacent marginal seas on a global scale.
The datasets presented in this study can be found in an online repository. The name of the repository and accession number can be found below: https://doi.org/10.6084/m9.figshare.17170967.v1.
XZ: conceptualization, methodology, Investigation, data curation, visualization, and writing—original draft. MY, WX, ZY, FX, and SD: investigation and data curation. YX: conceptualization, methodology, writing—review and editing, supervision, and funding acquisition. XS: conceptualization and supervision. All authors contributed to the article and approved the submitted version.
This work was financially supported by the National Natural Science Foundation of China (41576082), the National Key Research and Development Program (2018YFC0309803), and the National Natural Science Foundation of China (92051115).
The authors declare that the research was conducted in the absence of any commercial or financial relationships that could be construed as a potential conflict of interest.
All claims expressed in this article are solely those of the authors and do not necessarily represent those of their affiliated organizations, or those of the publisher, the editors and the reviewers. Any product that may be evaluated in this article, or claim that may be made by its manufacturer, is not guaranteed or endorsed by the publisher.
We appreciate the captain and the crew of R/V “Science III” for their assistance and cooperation during the cruise. We thank Wentao Wang (Institute of Oceanology Chinese Academy of Sciences) and Peng Zhou (East China Normal University) for their guidance on optimum multiparameter analysis. We thank LetPub (www.letpub.com) for its linguistic assistance during the preparation of this manuscript.
The Supplementary Material for this article can be found online at: https://www.frontiersin.org/articles/10.3389/fmars.2022.855479/full#supplementary-material
Benner R., Amon R. M. W. (2015). The Size-Reactivity Continuum of Major Bioelements in the Ocean. Annu. Rev. Mar. Sci. 7 (1), 185–205. doi: 10.1146/annurev-marine-010213-135126
Berman T., Bronk D. A. (2003). Dissolved Organic Nitrogen: A Dynamic Participant in Aquatic Ecosystems. Aquat. Microbial Ecol. 31 (3), 279–305. doi: 10.3354/ame031279
Braman R. S., Hendrix S. A. (1989). Nanogram Nitrite and Nitrate Determination in Environmental and Biological Materials by Vanadium(III) Reduction With Chemiluminescence Detection. Anal. Chem. 61 (24), 2715–2718. doi: 10.1021/ac00199a007
Bronk D. A. (2002). “Dynamics of DON,” in Biogeochemistry of Marine Dissolved Organic Matter (New York: Academic Press) pp. 153–247. doi: 10.1016/b978-012323841-2/50007-5
Bronk D. A., See J. H., Bradley P., Killberg L. (2007). DON as a Source of Bioavailable Nitrogen for Phytoplankton. Biogeosciences 4 (3), 283–296. doi: 10.5194/bg-4-283-2007
Bronk D. A., Steinberg D. K. (2008). “Nitrogen Regeneration,” in Nitrogen in the Marine Environment (New York: Academic Press) pp. 385–467. doi: 10.1016/B978-0-12-372522-6.00008-6
Budillon G., Pacciaroni M., Cozzi S., Rivaro P., Catalano G., Ianni C., et al. (2003). An Optimum Multiparameter Mixing Analysis of the Shelf Waters in the Ross Sea. Antar. Sci. 15 (1), 105–118. doi: 10.1017/S095410200300110X
Chen T. (1996). The Kuroshio Intermediate Water Is the Major Source of Nutrients on the East China Sea Continental Shelf. Oceanolog Acta 19 (5), 523–527.
Chen C. T. A. (2009). Chemical and Physical Fronts in the Bohai, Yellow and East China Seas. J. Mar. Syst. 78 (3), 394–410. doi: 10.1016/j.jmarsys.2008.11.016
Chen C. T. A., Kandasamy S., Chang Y. P., Bai Y., He X., Lu J. T., et al. (2017). Geochemical Evidence of the Indirect Pathway of Terrestrial Particulate Material Transport to the Okinawa Trough. Quater. Int. 441 (Part A), 51–61. doi: 10.1016/j.quaint.2016.08.006
Dai Z., Du J., Zhang X., Su N., Li J. (2011). Variation of Riverine Material Loads and Environmental Consequences on the Changjiang (Yangtze) Estuary in Recent Decades, (1955-2008). Environ. Sci. Technol. 45 (1), 223–227. doi: 10.1021/es103026a
de Carvalho Ferreira M. L., Kerr R. (2017). Source Water Distribution and Quantification of North Atlantic Deep Water and Antarctic Bottom Water in the Atlantic Ocean. Prog. Oceanog. 153, 66–83. doi: 10.1016/j.pocean.2017.04.003
Gao L., Gao Y., Song S., Zhang F. (2020). Non-Conservative Behavior of Dissolved Organic Carbon in the Changjiang (Yangtze River) Estuary and the Adjacent East China Sea. Continent. Shelf. Res. 197, 104084. doi: 10.1016/j.csr.2020.104084
Gasparin F., Maes C., Sudre J., Garcon V., Ganachaud A. (2014). Water Mass Analysis of the Coral Sea Through an Optimum Multiparameter Method. J. Geophys. Res.: Ocean. 119 (10), 7229–7244. doi: 10.1002/2014JC010246
Gebhardt A. C., Schoster F., Gaye-Haake B., Beeskow B., Rachold V., Unger D., et al. (2005). The Turbidity Maximum Zone of the Yenisei River (Siberia) and its Impact on Organic and Inorganic Proxies. Estuarine Coast. Shelf. Sci. 65 (1–2), 61–73. doi: 10.1016/j.ecss.2005.05.007
Granger J., Sigman D. M. (2009). Removal of Nitrite With Sulfamic Acid for Nitrate N and O Isotope Analysis With the Denitrifier Method. Rapid Commun. Mass. Spectromet. 23 (23), 3753–3762. doi: 10.1002/rcm.4307
Granger J., Sigman D. M., Needoba J. A., Harrison P. J. (2004). Coupled Nitrogen and Oxygen Isotope Fractionation of Nitrate During Assimilation by Cultures of Marine Phytoplankton. Limnol. Oceanog. 49 (5), 1763–1773. doi: 10.4319/lo.2004.49.5.1763
Gu H., Moore W. S., Zhang L., Du J., Zhang J. (2012). Using Radium Isotopes to Estimate the Residence Time and the Contribution of Submarine Groundwater Discharge (SGD) in the Changjiang Effluent Plume, East China Sea. Continent. Shelf. Res. 35, 95–107. doi: 10.1016/J.CSR.2012.01.002
Hansen H. P., Koroleff F. (2007). “Determination of Nutrients,” in Methods of Seawater Analysis: Third, Completely Revised and Extended Edition. Eds. Grasshoff K., Kremling K., Ehrhardt M. (Weinheim: John Wiley & Sons), (pp. 159–228). doi: 10.1002/9783527613984.ch10
He Q., Qiu Y., Liu H., Sun X., Kang L., Cao L., et al. (2017). New Insights Into the Impacts of Suspended Particulate Matter on Phytoplankton Density in a Tributary of the Three Gorges Reservoir, China. Sci. Rep. 7 (1), 13518. doi: 10.1038/s41598-017-13235-0
Holmes R. M., Aminot A., Kérouel R., Hooker B. A., Peterson B. J. (1999). A Simple and Precise Method for Measuring Ammonium in Marine and Freshwater Ecosystems. Can. J. Fish. Aquat. Sci. 56 (10), 1801–1808. doi: 10.1139/f99-128
Hopkinson C. S., Vallino J. J., Nolin A. (2002). Decomposition of Dissolved Organic Matter From the Continental Margin. Deep-Sea Research Part Ii. Top. Stud. Oceanog. 49 (20), 4461–4478. doi: 10.1016/S0967-0645(02)00125-X
Hou W., Ba M., Bai J., Yu J. (2021). Numerical Study on the Expansion and Variation of Changjiang Diluted Water in Summer and Autumn. J. Mar. Sci. Eng. 9 (3), 317. doi: 10.3390/jmse9030317
Hu Z., Mulholland M. R., Duan S., Xu N. (2012). Effects of Nitrogen Supply and its Composition on the Growth of Prorocentrum Donghaiense. Harm. Algae. 13, 72–82. doi: 10.1016/j.hal.2011.10.004
Jani J., Toor G. S. (2018). Composition, Sources, and Bioavailability of Nitrogen in a Longitudinal Gradient From Freshwater to Estuarine Waters. Water Res. 137, 344–354. doi: 10.1016/j.watres.2018.02.042
Kim J., Kim T. H., Park S. R., Lee H. J., Kim J. K. (2020). Factors Controlling the Distributions of Dissolved Organic Matter in the East China Sea During Summer. Sci. Rep. 10 (1), 11854. doi: 10.1038/s41598-020-68863-w
Knapp A. N., Casciotti K. L., Prokopenko M. G. (2018). Dissolved Organic Nitrogen Production and Consumption in Eastern Tropical South Pacific Surface Waters. Global Biogeochem. Cycle. 32 (5), 769–783. doi: 10.1029/2017GB005875
Knapp A. N., Sigman D. M., Lipschultz F. (2005). N Isotopic Composition of Dissolved Organic Nitrogen and Nitrate at the Bermuda Atlantic Time-Series Study Site. Global Biogeochem. Cycle. 19 (1), 1–15. doi: 10.1029/2004GB002320
Knapp A. N., Sigman D. M., Lipschultz F., Kustka A. B., Capone D. G. (2011). Interbasin Isotopic Correspondence Between Upper-Ocean Bulk DON and Subsurface Nitrate and its Implications for Marine Nitrogen Cycling. Global Biogeochem. Cycle. 25 (4), GB4004. doi: 10.1029/2010GB003878
Kwon H. K., Kim G., Hwang J., Lim W. A., Park J. W., Kim T. H. (2018). Significant and Conservative Long-Range Transport of Dissolved Organic Nutrients in the Changjiang Diluted Water. Sci. Rep. 8 (1), 12768. doi: 10.1038/s41598-018-31105-1
Letscher R. T., Hansell D. A., Carlson C. A., Lumpkin R., Knapp A. N. (2013). Dissolved Organic Nitrogen in the Global Surface Ocean: Distribution and Fate. Global Biogeochem. Cycle. 27 (1), 141–153. doi: 10.1029/2012GB004449
Lim J. H., Wong Y. Y., Lee C. W., Bong C. W., Kudo I. (2019). Long-Term Comparison of Dissolved Nitrogen Species in Tropical Estuarine and Coastal Water Systems. Estuarine Coast. Shelf. Sci. 222, 103–111. doi: 10.1016/j.ecss.2019.04.008
Liu X., Beusen A. H. W., Van Beek L. P. H., Mogollón J. M., Ran X., Bouwman A. F. (2018). Exploring Spatiotemporal Changes of the Yangtze River (Changjiang) Nitrogen and Phosphorus Sources, Retention and Export to the East China Sea and Yellow Sea. Water Res. 142 (1), 246–255. doi: 10.1016/j.watres.2018.06.006
Liu Z., Gan J. (2017). Three-Dimensional Pathways of Water Masses in the South China Sea: A Modeling Study. J. Geophys. Res.: Ocean. 122 (7), 6039–6054. doi: 10.1002/2016JC012511
Liu Z., Gan J., Wu H., Hu J., Cai Z., Deng Y. (2021). Advances on Coastal and Estuarine Circulations Around the Changjiang Estuary in the Recent Decades, (2000–2020). Front. Mar. Sci. 8. doi: 10.3389/fmars.2021.615929
Liu Q., Kandasamy S., Wang H., Wang L., Lin B., Gao A., et al. (2019). Impact of Hydrological Conditions on the Biogeochemical Dynamics of Suspended Particulate Organic Matter in the Upper Mixed Layer of the Southern East China Sea. J. Geophys. Res. Ocean. 124 (8), 6120–6140. doi: 10.1029/2019JC015193
Liu S. M., Ning X., Dong S., Song G., Wang L., Altabet M. A., et al. (2020). Source Versus Recycling Influences on the Isotopic Composition of Nitrate and Nitrite in the East China Sea. J. Geophys. Res.: Ocean. 125 (8), e2020JC016061. doi: 10.1029/2020JC016061
Liu S. M., Qi X. H., Li X., Ye H. R., Wu Y., Ren J. L., et al. (2016). Nutrient Dynamics From the Changjiang (Yangtze River) Estuary to the East China Sea. J. Mar. Syst. 154, 15–27. doi: 10.1016/j.jmarsys.2015.05.010
Liu X., Yu Z., Song X., Cao X. (2009). The Nitrogen Isotopic Composition of Dissolved Nitrate in the Yangtze River (Changjiang) Estuary, China. Estuarine Coast. Shelf. Sci. 85 (4), 641–650. doi: 10.1016/j.ecss.2009.09.017
Macko S. A., Estep M. L. F., Engel M. H., Hare P. E. (1986). Kinetic Fractionation of Stable Nitrogen Isotopes During Amino Acid Transamination. Geochim. Cosmochim. Acta 50 (10), 2143–2146. doi: 10.1016/0016-7037(86)90068-2
Mao H. (1964). A Preliminary Investigation on the Application of Using T-S Diagram for a Quantitative Analysis of the Water Masses in the Shallow Water Area. Oceanolog. Limnol. Sin. 6 (1–22), 1–22.
Middelburg J. J., Nieuwenhuize J. (1998). Carbon and Nitrogen Stable Isotopes in Suspended Matter and Sediments From the Schelde Estuary. Mar. Chem. 60 (3–4), 217–225. doi: 10.1016/S0304-4203(97)00104-7
Moon J. Y., Lee K., Lim W. A., Lee E., Dai M., Choi Y. H., et al. (2021). Anthropogenic Nitrogen is Changing the East China and Yellow Seas From Being N Deficient to Being P Deficient. Limnol. Oceanog. 66 (3), 914–924. doi: 10.1002/lno.11651
O′Leary M. H., Kluetz M. D. (1972). Nitrogen Isotope Effects on the Chymotrypsin-Catalyzed Hydrolysis of jV-Acetyl-L-Tryptophanamide. J. Am. Chem. Soc. 94 (10), 3585–3589. doi: 10.1021/ja00765a055
Poole R., Tomczak M. (1999). Optimum Multiparameter Analysis of the Water Mass Structure in the Atlantic Ocean Thermocline. Deep-Sea Research Part I. Oceanog. Res. Pap. 46 (11), 1895–1921. doi: 10.1016/S0967-0637(99)00025-4
Redfield A. C. (1960). The Biological Control of Chemical Factors in the Environment. Sci. Prog. 11 (3), 150–170.
Sigman D. M., Casciotti K. L., Andreani M., Barford C., Galanter M., Böhlke J. K. (2001). A Bacterial Method for the Nitrogen Isotopic Analysis of Nitrate in Seawater and Freshwater. Anal. Chem. 73 (17), 4145–4153. doi: 10.1021/ac010088e
Sigman D. M., Fripiat F. (2019). “Nitrogen Isotopes in the Ocean,” in Encyclopedia of Ocean Sciences (New York: Academic Press) pp. 263–278. doi: 10.1016/B978-0-12-409548-9.11605-7
Sigman D. M., Karsh K. L., Casciotti K. L. (2009). “Nitrogen Isotopes in the Ocean,” in Encyclopedia of Ocean Sciences (New York: Academic Press) pp. 40–54. doi: 10.1016/B978-012374473-9.00632-9
Silfer J. A., Engel M. H., Macko S. A. (1992). Kinetic Fractionation of Stable Carbon and Nitrogen Isotopes During Peptide Bond Hydrolysis: Experimental Evidence and Geochemical Implications. Chem. Geol. 101 (3–4), 211–221. doi: 10.1016/0009-2541(92)90003-N
Sipler R. E., Bronk D. A. (2015). “Dynamics of Dissolved Organic Nitrogen,” in Biogeochemistry of Marine Dissolved Organic Matter: Second Edition, (New York: Academic Press) pp. 127–232). doi: 10.1016/B978-0-12-405940-5.00004-2
Su Y., Weng X. (1994). “Water Masses in China Seas,” in Oceanology of China Seas (Dordrecht: Springer) pp. 3–16. doi: 10.1007/978-94-011-0862-1_2
Tan E., Wang G., Moore W. S., Li Q., Dai M. (2018). Shelf-Scale Submarine Groundwater Discharge in the Northern South China Sea and East China Sea and its Geochemical Impacts. J. Geophys. Res.: Ocean. 123 (4), 2997–3013. doi: 10.1029/2017JC013405
Tomczak M., Large D. G. B. (1989). Optimum Multiparameter Analysis of Mixing in the Thermocline of the Eastern Indian Ocean. J. Geophys. Res. 94 (C11), 16141. doi: 10.1029/jc094ic11p16141
Umezawa Y., Yamaguchi A., Ishizaka J., Hasegawa T., Yoshimizu C., Tayasu I., et al. (2014). Seasonal Shifts in the Contributions of the Changjiang River and the Kuroshio Current to Nitrate Dynamics in the Continental Shelf of the Northern East China Sea Based on a Nitrate Dual Isotopic Composition Approach. Biogeosciences 11 (4), 1297–1317. doi: 10.5194/bg-11-1297-2014
Wang X., Baskaran M., Su K., Du J. (2018). The Important Role of Submarine Groundwater Discharge (SGD) to Derive Nutrient Fluxes Into River Dominated Ocean Margins – The East China Sea. Mar. Chem. 204, 121–132. doi: 10.1016/J.MARCHEM.2018.05.010
Wang H., Dai M., Liu J., Kao S. J., Zhang C., Cai W. J., et al. (2016). Eutrophication-Driven Hypoxia in the East China Sea Off the Changjiang Estuary. Environ. Sci. Technol. 50 (5), 2255–2263. doi: 10.1021/acs.est.5b06211
Wang W., Yu Z., Song X., Wu Z., Yuan Y., Zhou P., et al. (2016). The Effect of Kuroshio Current on Nitrate Dynamics in the Southern East China Sea Revealed by Nitrate Isotopic Composition. J. Geophys. Res.: Ocean. 121 (9), 7073–7087. doi: 10.1002/2016JC011882
Weigand M. A., Foriel J., Barnett B., Oleynik S., Sigman D. M. (2016). Updates to Instrumentation and Protocols for Isotopic Analysis of Nitrate by the Denitrifier Method. Rapid Commun. Mass. Spectromet. 30 (12), 1365–1383. doi: 10.1002/rcm.7570
Yang S., Chang B. X., Warner M. J., Weber T. S., Bourbonnais A. M., Santoro A. E., et al. (2020). Global Reconstruction Reduces the Uncertainty of Oceanic Nitrous Oxide Emissions and Reveals a Vigorous Seasonal Cycle. Proc. Natl. Acad. Sci. U. S. A. 117 (22), 11954. doi: 10.1073/pnas.1921914117
Yang D., Yin B., Liu Z., Feng X. (2011). Numerical Study of the Ocean Circulation on the East China Sea Shelf and a Kuroshio Bottom Branch Northeast of Taiwan in Summer. J. Geophys. Res.: Ocean. 116 (5), C05015. doi: 10.1029/2010JC006777
Zhang J., Du Y. N., Zhang G. S., Chang Y., Zhou Y. C., Zhang Z. F., et al. (2021). Increases in the Seaward River Flux of Nutrients Driven by Human Migration and Land-Use Changes in the Tide-Influenced Delta. Sci. Total Environ. 761 (20), 144501. doi: 10.1016/j.scitotenv.2020.144501
Zhang S., Ji H., Yan W., Duan S. (2003). Composition and Flux of Nutrients Transport to the Changjiang Estuary. J. Geogr. Sci. 13 (1), 3–12. doi: 10.1007/bf02873141
Zhang G., Liang S., Shi X., Han X. (2015). Dissolved Organic Nitrogen Bioavailability Indicated by Amino Acids During a Diatom to Dinoflagellate Bloom Succession in the Changjiang River Estuary and its Adjacent Shelf. Mar. Chem. 176 (20), 83–95. doi: 10.1016/j.marchem.2015.08.001
Zhang R., Wang X. T., Ren H., Huang J., Chen M., Sigman D. M. (2020). Dissolved Organic Nitrogen Cycling in the South China Sea From an Isotopic Perspective. Global Biogeochem. Cycle. 34 (12), e2020GB006551. doi: 10.1029/2020GB006551
Zhong X., Yan M., Ning X., Yan Z., Xin Y. (2020). Nitrate Processing Traced by Nitrate Dual Isotopic Composition in the Early Spring in the Changjiang (Yangtze River) Estuary and Adjacent Shelf Areas. Mar. Pollution Bull. 161 (Part A), 111699. doi: 10.1016/j.marpolbul.2020.111699
Zhou P., Song X., Yuan Y., Cao X., Wang W., Chi L., et al. (2018). Water Mass Analysis of the East China Sea and Interannual Variation of Kuroshio Subsurface Water Intrusion Through an Optimum Multiparameter Method. J. Geophys. Res.: Ocean. 123 (5), 3723–3738. doi: 10.1029/2018JC013882
Keywords: dissolved organic nitrogen, N-isotopes, marginal sea, Changjiang Estuary, OMP analysis, nutrient biogeochemistry
Citation: Zhong X, Yan M, Xu W, Yan Z, Xu F, Dong S, Xin Y and Shi X (2022) Multiple Lenses of N-Isotopes Reveal Active Dissolved Organic Nitrogen Cycling in a Subtropical Estuary and Marginal Sea. Front. Mar. Sci. 9:855479. doi: 10.3389/fmars.2022.855479
Received: 15 January 2022; Accepted: 11 April 2022;
Published: 10 May 2022.
Edited by:
Jianfang Chen, Ministry of Natural Resources, ChinaReviewed by:
Kyung-Hoon Shin, Hanyang University, South KoreaCopyright © 2022 Zhong, Yan, Xu, Yan, Xu, Dong, Xin and Shi. This is an open-access article distributed under the terms of the Creative Commons Attribution License (CC BY). The use, distribution or reproduction in other forums is permitted, provided the original author(s) and the copyright owner(s) are credited and that the original publication in this journal is cited, in accordance with accepted academic practice. No use, distribution or reproduction is permitted which does not comply with these terms.
*Correspondence: Yu Xin, eGlueXUzMTJAb3VjLmVkdS5jbg==; Xiaoyong Shi, c2hpeHlAb3VjLmVkdS5jbg==
Disclaimer: All claims expressed in this article are solely those of the authors and do not necessarily represent those of their affiliated organizations, or those of the publisher, the editors and the reviewers. Any product that may be evaluated in this article or claim that may be made by its manufacturer is not guaranteed or endorsed by the publisher.
Research integrity at Frontiers
Learn more about the work of our research integrity team to safeguard the quality of each article we publish.