 Eoghan A. Aston
 Stephanie Duce2
 Renata Ferrari
- 1Australian Research Council (ARC) Centre of Excellence for Coral Reef Studies, James Cook University, Townsville, QLD, Australia
- 2College of Science and Engineering, James Cook University, Townsville, QLD, Australia
- 3Healthy and Resilient Reefs, Australian Institute of Marine Science, Townsville, QLD, Australia
The 3D structure of individual coral colonies provides insights into their ecological functioning. While structure from motion techniques make it possible to reconstruct 3D models of coral colonies based on overlapping images, the extraction of relevant metrics of complexity in a reproducible way remains challenging. We present a method and associated scripts for the 3D reconstruction of coral colonies from in-situ images and the automatic extraction of eleven structural complexity metrics, designed to be run in widely-used software packages. The metrics are designed to capture aspects of complexity relating to the colony’s size and shape that are related to their ecological function. We explored the potential ecological applications of some of these metrics using linear models, comparing aspects of complexity among colonies of different size and morphotaxa (combined information on morphology and taxa). Our results showed that a metric as simple as colony diameter explained 95% of the variation in shelter provisioning capability when paired with information on colony morphotaxa. Further, the habitat provisioning of colonies of comparable size was similar among the six of the seven morphotaxa examined. During the current period of rapid uptake of photogrammetry among ecologists, the results of our study provide a basis to use data derived from 3D models to further explore the nuances of the relationship between structure and function of corals at the colony scale in a replicable and standardised way.
Introduction
Structural complexity is an important component in the functioning of ecosystems, with the abundance and diversity of species generally being positively related to structural complexity of the habitat, especially at low levels of complexity (MacArthur, 1958). The presence of structure creates protected environments that moderate environmental conditions and creates a wide breadth of ecological niches for animals to exploit (Bruno et al., 2003; Alvarez-Filip et al., 2011; Tokeshi and Arakaki, 2012). As the abundance and diversity of complex physical structures in an ecosystem increases, so does the ability of that ecosystem to support animals with different microhabitat needs (Willis et al., 2005). Whilst the effects of structural complexity are often confounded by differences in the taxonomic composition of habitat-forming organisms, its importance transcends any particular ecosystem and is applicable in almost every natural habitat, from terrestrial coniferous forests (Franklin and Van Pelt, 2004) and savannahs (Gigliotti et al., 2020) to freshwater rivers (Warfe and Barmuta, 2006) and coral reefs (Graham and Nash, 2013).
On coral reefs, one of the world’s most biodiverse ecosystems, the importance of structural complexity has long been recognized (Risk, 1972; Vine, 1974). The availability of complex structure provides refugia from predators (Ménard et al., 2012; Rogers et al., 2014; González-Rivero et al., 2017), reduces competition for habitat space through the formation of diverse and abundant ecological niches or microhabitats (Graham and Nash, 2013) and increases the surface area available for foraging (Vine, 1974). Whilst the abundance, density and spatial arrangement of habitat-providing structures are important in shaping fish communities (Pygas et al., 2020), the structural characteristics of individual coral colonies can also play an important role for many small-bodied, site-attached fishes (Quadros et al., 2019). For example, structurally complex colonies are good providers of habitat because they generally supply a large amount of physical refugia from larger bodied predators (Hixon and Beets, 1993; Noonan et al., 2012). As such, fish-habitat relationships vary according to the species of coral and fish, and also change over time according to colony growth and/or erosion (Graham and Nash, 2013; Ferrari et al., 2017). The physical structure provided by individual coral colonies has been related to differences among coral species and/or growth forms (Komyakova et al., 2013; Richardson et al., 2017; Urbina-barreto et al., 2020), among colony sizes (Noonan et al., 2012; Agudo-Adriani et al., 2016; Urbina-barreto et al., 2020), and with environmental setting (Todd, 2008; Ow and Todd, 2010; Doszpot et al., 2019). Despite the importance of the structural complexity of coral colonies, accurately quantifying the physical structure of individual colonies is challenging.
At the scale of individual coral colonies, technical limitations have led to simplified measurements of structural complexity, including the manual measurement of the space between colony branches (Noonan et al., 2012), measurements of colony morphometrics such as height and diameter (Harborne et al., 2011; Harborne et al., 2012), as well as estimates of surface area from foil-wrapping or wax-dipping branches (Veal et al., 2010). However, these methods are generally imprecise, cannot be easily repeated in situ, and often damage the colonies (Naumann et al., 2009; Ferrari et al., 2016). Recent advances in computer vision and processing have allowed the full dimensionality of objects to be recorded and analyzed through 3D reconstructions of high-resolution imagery (i.e., close-range photogrammetry; Lavy et al., 2015; Bayley and Mogg, 2020), which is becoming popular among ecologists.
Underwater close-range photogrammetry offers enormous potential to investigate the physical structure of coral colonies, however there is a need to explore and develop new, ecologically relevant metrics that can be compared among and within coral taxa. The process of analyzing reconstructed objects is now readily accessible and the structure of coral colonies can be analyzed in numerous ways (Figueira et al., 2015; Ferrari et al., 2016). Several metrics offer valuable insights into the structure of colonies including 3D surface area, colony volume, and a variety of ratios, including surface area to volume ratio, and colony rugosity (a ratio of the 3D to 2D surface area) (Bythell et al., 2001; Agudo-Adriani et al., 2016; Ferrari et al., 2016; Doszpot et al., 2019; Zawada et al., 2019a). However, metrics that focus on the delivery of an ecological function, such as shelter provisioning, are somewhat rare (but see Madin et al., 2016; Urbina-barreto et al., 2020). Given the rapidly changing ecological composition of global reef communities due to the combined effects of climate change (Hughes et al., 2017b; Hughes et al., 2018; Richardson et al., 2018; Dietzel et al., 2021) and local anthropogenic stressors (Cheal et al., 2017; Suchley and Alvarez-Filip, 2018), metrics that reflect the ecological functions of corals are required (Madin et al., 2016; Doszpot et al., 2019; Streit et al., 2019). Progress has been made to this end recently, as ecologists are exploring the structural traits of coral colonies in more detail. Quantification of the shelter provisioning capability and size structure of available refuge spaces have been discussed in specific types of coral (Urbina-barreto et al., 2020), as well as how this metric changes over time with coral growth (Million et al., 2021). Underwater close-range photogrammetric reconstructions have also revealed complex, non-linear relationships between simple coral growth measurements, such as linear extension rates, and higher order traits, such as shelter provisioning (Million et al., 2021).
Several aspects of the process of underwater photogrammetry have been assessed to date, including the effects of various parameters such as photograph density and resolution (Marre et al., 2019), camera systems (Guo et al., 2016), lenses and housings (Menna et al., 2016), water turbidity (Bryson et al., 2017) and flying elevation (Marre et al., 2019). Whilst it is of critical importance to understand how models may be affected by user-decisions, comparability between studies could and should be improved by the adoption of standardised workflow procedures. Given that there exist multiple studies based on photogrammetry and deriving estimates of complexity from corals (Agudo-Adriani et al., 2016; Reichert et al., 2016; Doszpot et al., 2019; Vivian et al., 2019; Million et al., 2021), there is great incentive to adopt reproducible methods via the use of standardised workflows at key parts in the processing pipeline. This applies both to the reconstruction of coral models (Lange and Perry, 2020) and the extraction of structural complexity metrics.
The aim of this study is to ensure repeatability among users by using a python script to serially process 3D reconstructions of coral colonies and extract a suite of three-dimensional complexity metrics. Following manual isolation of colonies from the surrounding benthos in the models, we developed a second python script that automatically extracts a suite of three-dimensional structural complexity metrics from each model, saving time and increasing repeatability among users. To investigate the utility of these metrics as ecological indicators, we compared two of these key metrics among 69 colonies of varying size and morphotaxa using Bayesian linear regression models.
Methods
Data Collection and Classification of Corals
Images of 69 colonies were collected from seven reefs on the Great Barrier Reef (GBR) and in the Coral Sea during February 2020 (GBR: Hickson, and Tiger Reefs; Coral Sea: Saumarez, Cato, Wreck, Frederick, and Marion Reefs). The imaged colonies were located at depths between 3 to 13m in sheltered, back reef environments on each reef. Colonies with partial mortality, disease or algal overgrowth were avoided, as this may have affected structural characteristics.
Given the difficulties in identifying coral colonies to species in the field, we used morphotaxa to allow relevant comparisons. Individual colonies from each of the following seven morphotaxa were haphazardly selected and imaged: corymbose Acropora, digitate Acropora, tabular Acropora, branching Isopora, branching Pocillopora, branching Porites and ‘massive’ corals (Figure 1). Massive and submassive corals from different genera (mainly Porites and Favia) were aggregated into a single category (i.e., ‘massive’ corals) due to their structurally comparable morphologies and because none of the massive coral colonies imaged had overhangs contributing to their refuge space. To classify coral morphology, we followed the CATAMI scheme (Althaus et al., 2015), which includes visual guides to broad-level morphologies.
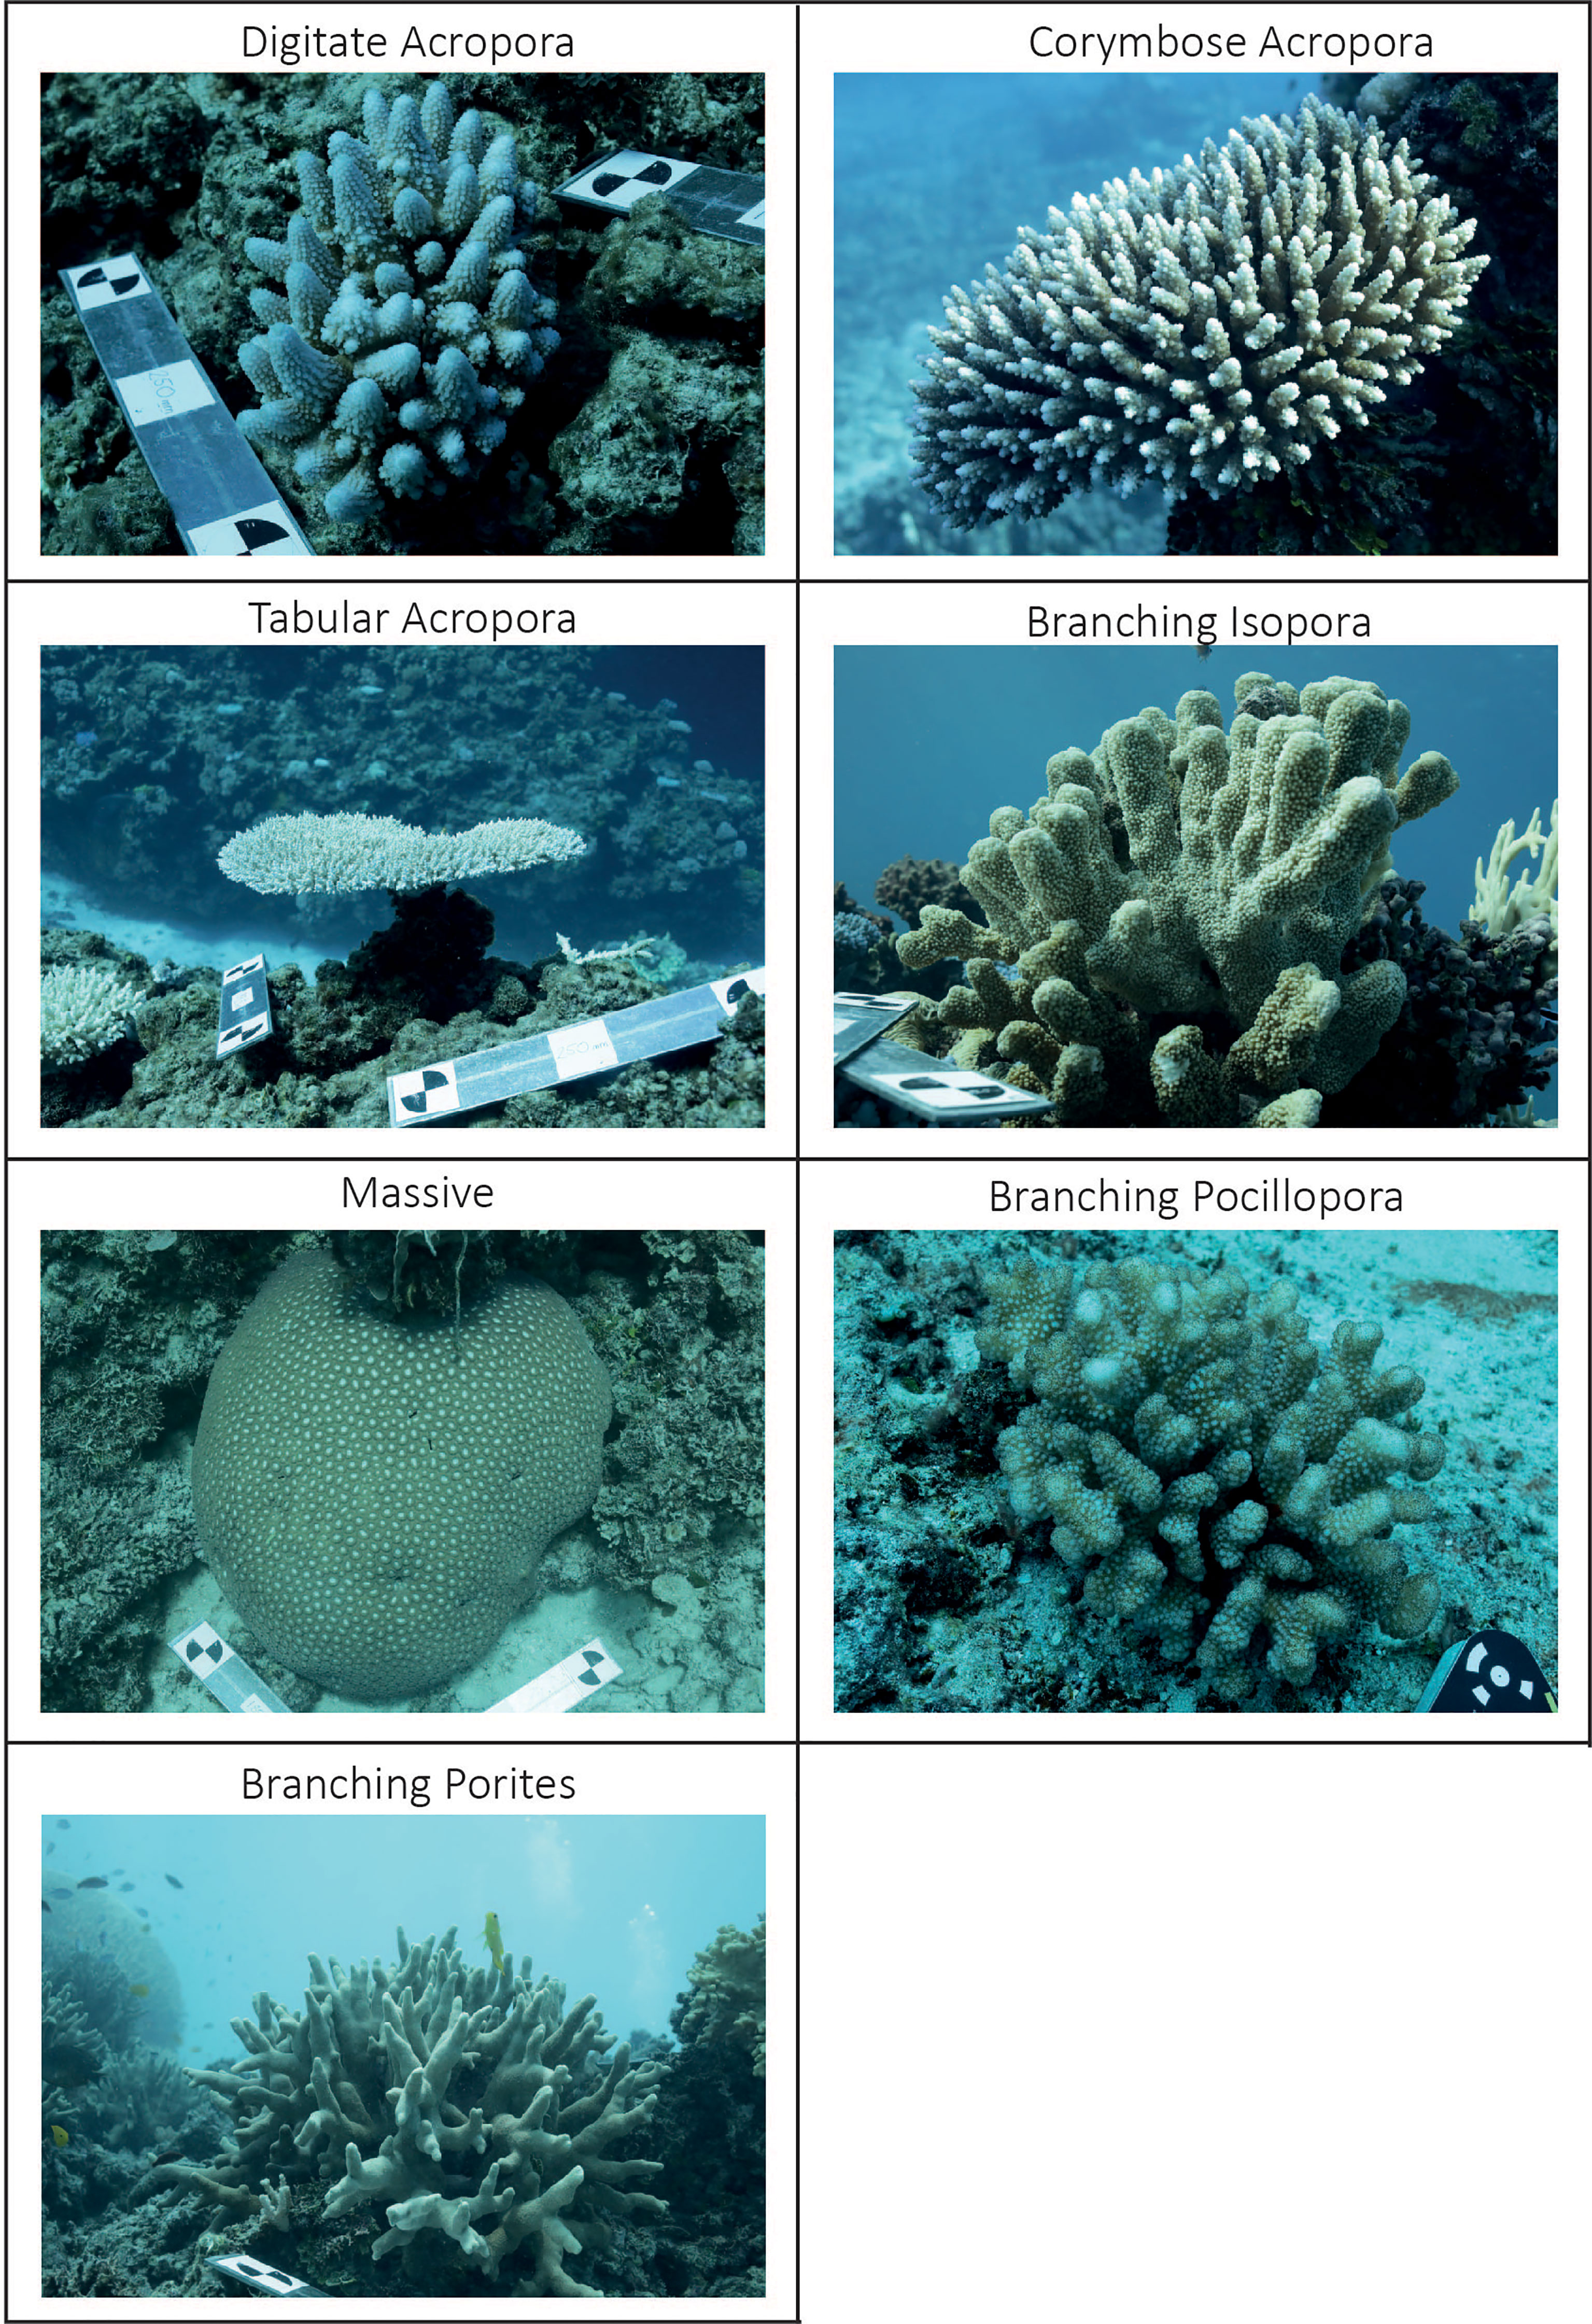
Figure 1 In situ examples of the seven distinct modelled morphotaxa. Note the galvanised scale bars present in several panels used to scale the reconstructions.
Field and Laboratory Equipment
Camera system choice has been shown to play an important role in the quality of the final model (Marre et al., 2019). Resultant models from different camera/computer systems can be of comparable quality, however these should always be reported since the resolution (i.e., the smallest resolvable details) can be affected. All images used in this study were taken using a Canon 5D MK IV body (Canon USA Inc.) Ikelite housing (Ikelite Underwater Systems), fitted with an 8” dry lock dome port. A Canon 35mm f/2 IS USM prime lens was used to minimize perspective distortion in photographs while a dome port was chosen to reduce barrel distortion near the edges of images (Menna et al., 2018). Each photograph was a 30.2 Megapixel JPEG image. Relevant PC system specifications were as follows: Intel Core i9 9900K 3.6GHz CPU, 64GB RAM, 1x NVIDIA GeForce RTX 2080Ti Graphics card. High resolution 3D models are possible using cheaper, more compact cameras and off-the-shelf laptops (Lange and Perry, 2020). However, changes in model resolution and processing times associated with different cameras and processing settings affect surface measurements and may hinder comparisons if not given appropriate consideration. At the colony scale, flying elevation is low (i.e., the sensor is very close to the object of interest), so sufficient overlap is likely to result in comparable model qualities regardless of sensor size (see Menna et al., 2016; Marre et al., 2019 for discussions of camera systems and flying elevation).
Agisoft recommends the use of coded targets for model scaling purposes. We mounted these in pairs (12-bit, printed on waterproof paper) on to two galvanized steel bars at known measured distances apart, ready for automatic detection by the software.
Data Collection Protocols
The two scale bars were first placed adjacent to the coral colony prior to taking images and were included in a minimum of 20 photographs per colony. For each colony, 100-250 images (depending on colony size and morphotaxa) were taken. The goal was to collect a set of overlapping images taken from multiple angles such that the entire colony was imaged (Bythell et al., 2001; Million et al., 2021). We used an orbital swimming motion – three to four 360 degree passes around the colony at different heights. Imaging for a colony generally took 3-5 minutes (based on 100-250 images plus time before for testing camera settings). It is not critical that swimming motion is identical to generate comparable data, only that the entire colony is imaged with sufficient overlap to resolve all required details in the resultant model.
Camera settings were chosen based on local light conditions, but aperture was fixed at f/10 to ensure the entire colony was in focus during imaging.
Model Reconstructions and Extraction of Structural Complexity Metrics
A variety of paid and free options are available to generate structure from motion models. The choice of software has been shown to lead to differences in the measured characteristics, affecting repeatability and potentially comparability between model data from different studies (Forsmoo et al., 2019). Agisoft Metashape (formerly Photoscan) is the most popular choice of software among ecologists for generating coral reconstructions (Agisoft LLC, St. Petersburg, Russia). 3D models were constructed using Agisoft Metashape Professional Ver 1.7. Total processing time for models varied; massive morphologies with ~150 images per colony took approximately 10-20 minutes to process, whereas larger and complex colonies with image sets numbering over 200 required several hours of processing. Steps for model generation have been discussed extensively, including error reduction, photograph selection, model scaling and accuracy metrics (Green et al., 2014; Forsmoo et al., 2019; Lange and Perry, 2020).
A single python script to reconstruct colonies using the same processing workflow is available (https://github.com/E-Aston/CoralGeometry). This script comes with detailed instructions and is interactive within Metashape, designed to be run from within the graphical user interface using the “Run Script” command. These instructions are also provided as Supplementary Material. For the use of this script, no knowledge or installation of python is required, only installation of Metashape Professional. On execution of the script, a series of dialogue boxes prompt users to input the settings to be used in serial processing of the models, including the quality threshold for the disabling of photographs, photo alignment accuracy, and dense cloud quality. We provide the settings used to reconstruct the colonies used in this study (Table 1), and strongly recommend that others use the same settings when following this reconstruction protocol, since processing settings affect model resolution and thus final measured characteristics.

Table 1 Beginning to end of reconstruction pipeline in Metashape.
Following the reconstruction of models, some manual preparation is needed for metrics extraction. Given the in-situ nature of our data collection, some of the benthos to which corals are attached is also reconstructed and needs to be removed manually. This includes “isolating”, i.e., removing any benthos from the reconstruction using metashape such that they are ready for automatic metric extraction (Table 1). The only measure of colony geometry to be extracted from metashape is planar area, which is automatically calculated using a top-down view upon generation of the model report (Table 1; Step 9).
Extraction of Structural Complexity Metrics
Ten further metrics of the surface geometry or structural complexity were extracted from each colony, using a custom-coded python script utilizing the package pymeshlab (Muntoni and Cignoni, 2021), which integrates with the open source 3D software MeshLab v2016.12 (Cignoni et al., 2008). This package contains the full capability of MeshLab without the need to manually obtain surface measurements for each mesh. Our script ‘cleans’ the mesh (i.e., removes any unwanted faces that are not attached to the colony itself, which are often still present following the export of the model), then applies a series of scripts to measure and calculate several geometric complexity metrics automatically. These higher order complexity metrics were: 3D surface area, colony volume, convex hull volume (the simplest polygon that fully encloses the colony), absolute spatial refuge (a volumetric measurement of the space generated by the interstices of each colony), surface area to volume ratio, shelter size factor (fragmentation of shelter volume), proportion occupied (the ratio of the convex hull volume occupied by the colony), colony maximum diameter and colony height. A detailed summary of these metrics is presented below as well as how each is calculated (Table 2), in addition to a graphical representation of metrics (Figure S1).
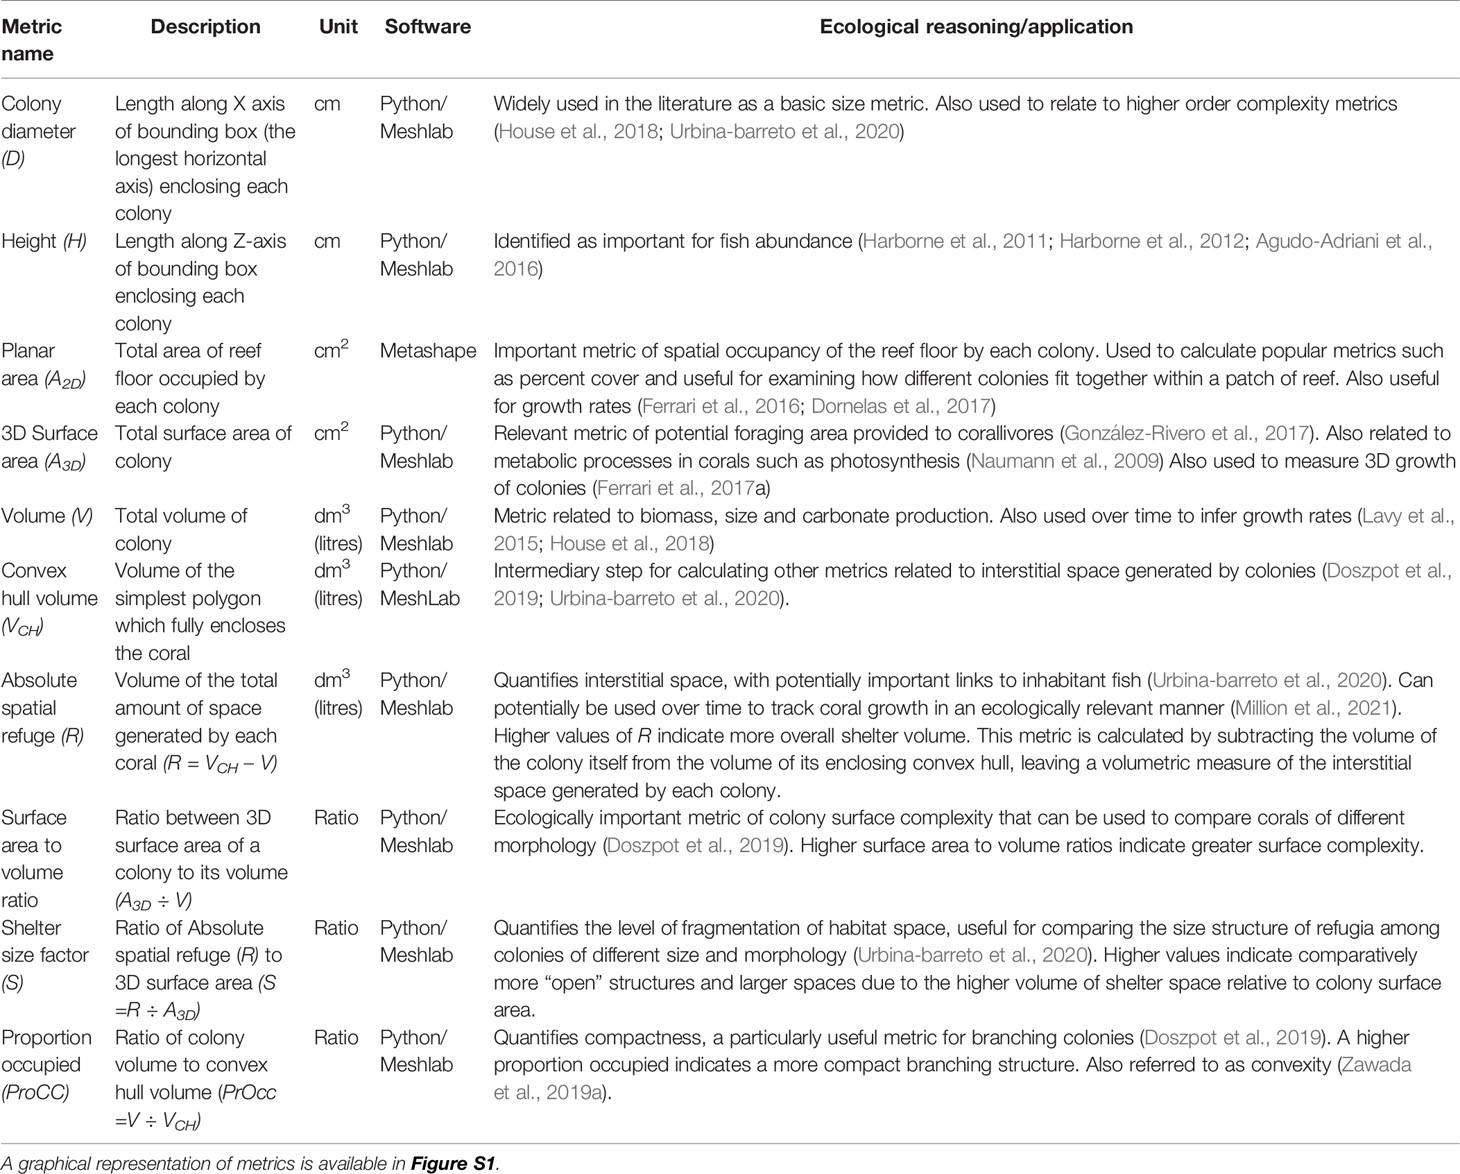
Table 2 Summary of metrics calculated for each colony using a combination of Metashape and MeshLab.
Given a set of reconstructions in the form of .obj files (the standard output from Metashape), the code returns a .csv file populated with the value of each metric for every coral, saving up to several hours of manual calculations. The use of the metrics extraction script assumes zero knowledge of python programming on the part of the user. All that is required is installation of python and the ability to run scripts from an interpreter. We provide detailed instructions on how to do this in Supplementary Material. For further analysis, we investigated a small subset of these (diameter, absolute spatial refuge and shelter size factor), however depending on the research questions, any of the described metrics are extracted and available for analysis.
Statistical Models for Methods Validation
To assess the validity of the calculated complexity metrics extracted using our python script we selected two of the higher order and popularly used metrics and compared them among colonies of different size and morphotaxa. We chose absolute spatial refuge and shelter size factor. Although any of the 3D metrics presented in this study may be ecologically informative depending on the research question, quantifying the shelter capacity of corals and how this shelter is delivered (i.e. the fragmentation of the shelter) is broadly applicable for ecological purposes, including measuring the functional capacity of corals to provide habitat (Urbina-barreto et al., 2020) and tracking how this changes over time with colony growth (Million et al., 2021). We hypothesized that due to differences in the physical structure of colonies of different morphotaxa, the rate of increase in absolute spatial refuge volume with colony size would vary among morphotaxa. We also hypothesized that the differences in physical structure would result in variation in the size-structure of spatial refuges among colonies of different size, again with parameters specific to each morphotaxa considered.
To determine whether 3D metrics of complexity (in this case spatial refuge) could be predicted by simpler linear metrics (i.e., colony diameter) we fitted two Bayesian linear regression models using the package ‘brms’ (Bürkner, 2017), both using colony diameter to predict the value of a 3D complexity metric. The first was absolute spatial refuge and the second was shelter size factor. For each of these models, morphotaxa was included as a predictor, so we could also infer how the scaling relationships between these variables differed among morphotaxa. Appropriately informative Gaussian priors were used to inform the model and restrict to a reasonable outcome space (Banner et al., 2020). Assumptions about the underlying data distribution and prior predictive distributions were chosen based on visual exploration of the data following transformations as well as previous studies that have used similar data in the same way (Urbina-Barreto et al., 2020). Priors for all models were assessed visually using randomly sampled lines from the prior probability distribution (Figure S2). Posterior distributions were obtained using four Markov Chain Monte Carlo (MCMC), with 20,000 iterations and a warmup period of 10,000 samples. Inferences about the strength of the relationships between variables in both models were based on 95% highest density probability intervals around means predicted from the posterior distribution of the models. Analyses were carried out using R 4.0.1 (https://r-project.org). Initial data exploration of 2D and 3D variables was carried out using a scatterplot matrix on raw data generated using the ‘Ggally’ package (Figure S2) (Schloerke et al., 2020, https://cran.r-project.org/package=GGally). Plotting was carried out using the package ggplot2 (Wickham, 2015). Bayesian R2 values were obtained to assess how well the regression models fitted the data in each case.
Model 1: Absolute Spatial Refuge (R) vs. Diameter (D)
Prior predictive distributions were set using the results of regression models previously fit to this data type (Urbina-Barreto et al., 2020). Our data encompassed a similar size range of colonies; the main difference was that we chose to classify based on morphotaxa, a combination of taxonomic identity (genus) and morphology, rather than just morphology. We used log colony diameter Dlogi and an indicator variable for morphotaxa (colony ID = CID) to predict log absolute spatial refuge for each colony Rlogi, with the following model structure:
We assumed a normal distribution with mean μi and standard deviation σ. The prior values for the intercept α was the same for each morphotaxa, as was the slope value β, reflective of Urbina-Barreto et al. (2020). An intercept of -9 on the log scale is close to 0 on the natural scale, so scientifically this prior made sense. This subverted the need to attach uninformative priors to the slope and intercept values or to rescale the data in a way that would result in a loss of information in the posterior distribution. These priors were relaxed enough to allow data to drive any differences in the posterior predictions between morphotaxa. An exponential prior with mean 1 was assigned to the standard deviation σ, given that we knew little about this parameter beforehand.
This model was compared to one without the morphotaxa variable using pareto-smoothed importance sampling leave-one-out (PSIS-LOO), to determine whether splitting colonies into morphotaxa resulted in an improved fit to the data (Yao et al., 2018).
Model 2: Shelter Size Factor (S) vs. Diameter (D)
Because shelter size factor is a new metric, we used less informative priors to allow the data to drive the model fit. We used colony diameter to predict shelter size factor for each morphotaxa. The model structure was:
Where Si is the shelter size factor of each colony i, normally distributed with mean μi and standard deviation σ. Di is the diameter of each colony i, and this model. The morphotaxa indicator CID was the same as the previous model. Since shelter size factor is dimensionless, we did not log-transform any of the variables for this model. The same exponential prior was assigned to the standard deviation σ as in the previous regression model. To see whether morphotaxa and colony diameter were useful predictors of shelter size factor, and to check for overfitting, models with and without morphotype were compared, again using PSIS-LOO (Yao et al., 2018).
Results of Statistical Models
Sixty-nine colonies across the seven morphotaxa (range: 4-17 colonies per morphotaxa) were used for morphometric analysis (Table 3). Colonies ranged in diameter from 6.8 to 97.1 cm [mean diameter: 29.6 ± 2.0cm (s.e)] though size distribution was skewed towards smaller colony sizes with 44 of the 69 colonies being < 30cm in diameter. Measurement error was very low across the dataset, with a maximum scaling error of 0.5mm across the entire sample. Most were considerably lower and fell in the range of 0.1-0.3mm scaling error.
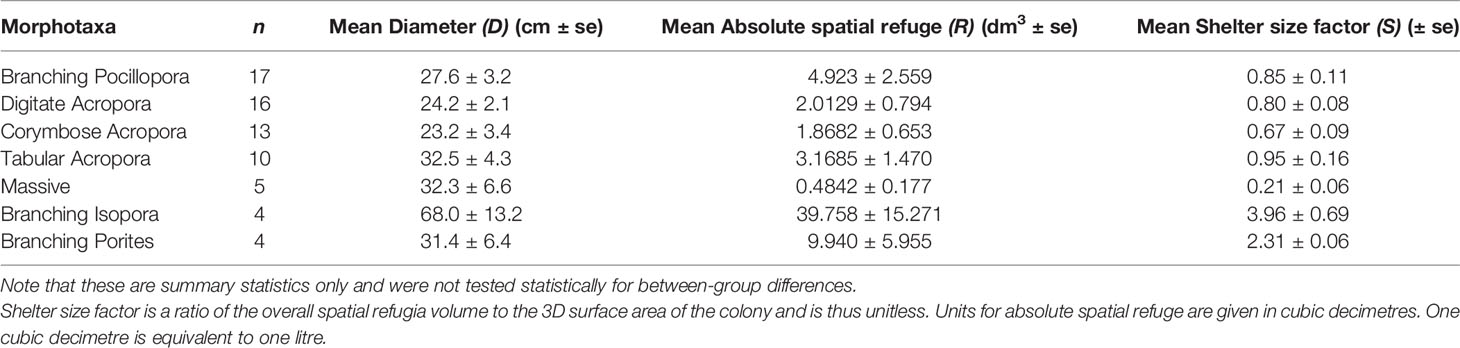
Table 3 Summary of representation and dimensions among the seven unique morphotaxa used for colony reconstructions.
Model 1 Predictions: Log-Absolute Spatial Refuge (R) vs. Log-Diameter (D)
The best model for predicting absolute spatial refuge included the interaction between morphotaxa and colony diameter (PSIS-LOO model weighting = 1, Bayes R2 = 0.95) (Table S2). Most morphotaxa appeared to fall within a somewhat similar range of increasing spatial refuge with increasing colony diameter (Figures 2A, C and Table S1). For most morphotaxa, posterior credible intervals were narrow and most colonies fell near the mean prediction slope (Figure 2B). The linear model determined that the scaling of absolute spatial refuge with colony diameter was broadly similar among almost most of the morphotaxa included in this study (95% credible intervals for the posterior estimates of slope overlapped between morphotaxa in most cases, Table S2), but there were some differences in the scaling relationships among morphotaxa. The exception was ‘massive’ corals, where the increase in spatial refuge was considerably lower than the six other morphotaxa with increasing colony diameter.
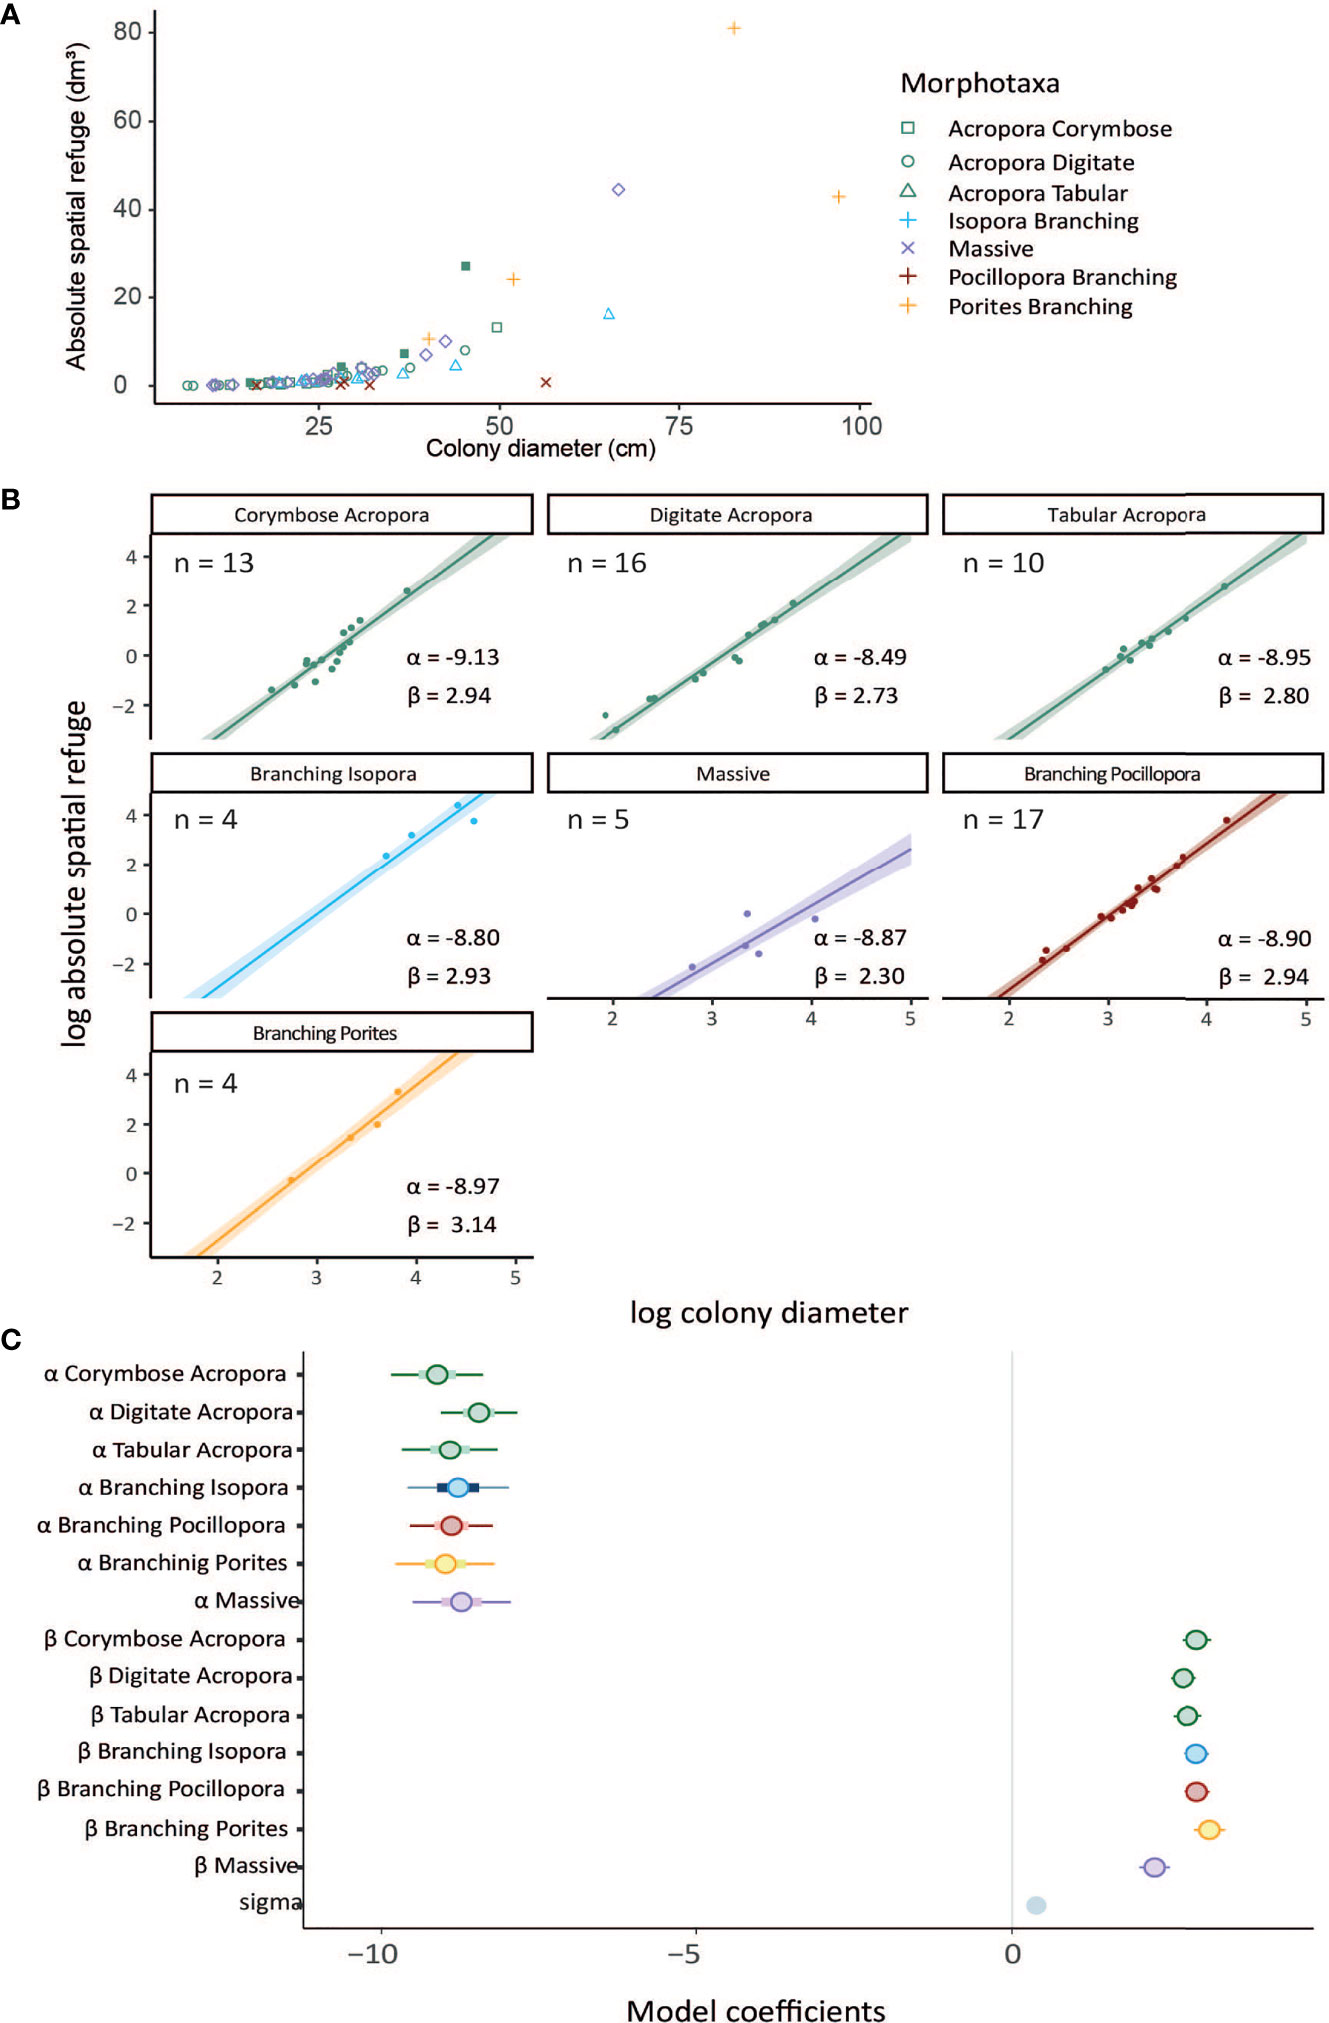
Figure 2 (A) Scaling of absolute spartial refuge with increasing colony diameter across all morphotaxa. (B) Plotted posteriors from log-log linear model of absolute spatial refuge (mean centred) from the interaction model containing colony diameter as a predictor for each of the seven coral morphotaxa as well as intercept (α) and slope (β) estimates. Shaded regions are 95% highest density probability distribution. (C) Posterior predictions for intercept α and β parameters in the model. Straight line slope parameters indicate the existence of power-law relationships, with steeper slopes corresponding to higher power-scaling. Points indicate means, thick bars are 50% credible intervals, thin blue lines are 95% credible intervals. Numerical values off all model coefficients including posterior uncertainty are included in Table S1.
The relationships in the models indicate that there is a power-law relationship between colony diameter and spatial refuge provisioning such that as colonies grow and increase in size, the rate of increase of spatial refuge rises exponentially. Thus, subtle differences in slope gradients on the log-scale become larger when converted back to the natural scale, particularly in larger colonies (Figure 2A). For example, absolute spatial refuge in digitate and corymbose Acropora scaled to the power of 2.73 and 2.94 respectively (maximum likelihood estimate). For a colony of diameter 25cm, the expected spatial refuge volume would be 1.34 and 1.39dm3 (1dm3 = 1000cm3 or 1 litre) for digitate and corymbose Acropora respectively. Following the same scaling law, by the time colonies reach a diameter of 50cm, the expected values of refuge volume would be approximately 8.85dm3 and 10.59dm3, a difference of approximately 20%. For large colonies of diameter 75cm for example, a digitate Acropora colony would provide an estimated 27 dm3 (27 litres equivalent) whilst a comparable corymbose Acropora colony would provide an estimated 35.5 dm3, a comparatively large difference (36% larger). By contrast, at this large colony size, a branching Pocillopora colony, which was also captured well in this study, would have an expected absolute spatial refuge of 44.7dm3, scaling at a greater rate with increasing diameter than any of the Acropora morphotaxa.
For ‘massive’ colonies, the increase in spatial refuge with increasing colony diameter was the lowest, this group consistently providing the lowest volumes of absolute spatial refuge. A colony with diameter 50cm would have an expected spatial refuge of just 1.13dm3, or just over 1.1 litres. Whilst there was relatively little data for this morphotaxa, massive corals clearly provide the least spatial refuge among all morphologies considered in this study.
Model 2 Predictions: Shelter Size Factor (S) vs. Diameter (D)
The best model was again the interaction model containing morphotaxa (PSIS-LOO model weighting = 1, Bayes R2 = 0.84) (Table S4). Whilst shelter size factor was predicted well by the combination of colony diameter and morphotaxa, (branching Acropora, Pocillopora, digitate Acropora and tabular Acropora, there were no strong differences in the rate of increase of shelter size factor with increasing colony diameter in the posterior predictive distributions (Figure 3 and Table S3), with the rate of increase estimates (β) overlapping in all cases. For all morphotaxa except ‘Massive’ corals, shelter size factor (S) and colony diameter (D) were positively correlated (Figure 3). ‘Massive’ corals had the lowest values of shelter size factor across all colony sizes and a very small increase in shelter size factor with colony diameter. For branching Isopora and Porites, which respectively had high values for α and β, we could not make and valid statistical inferences since the sample sizes were too low.
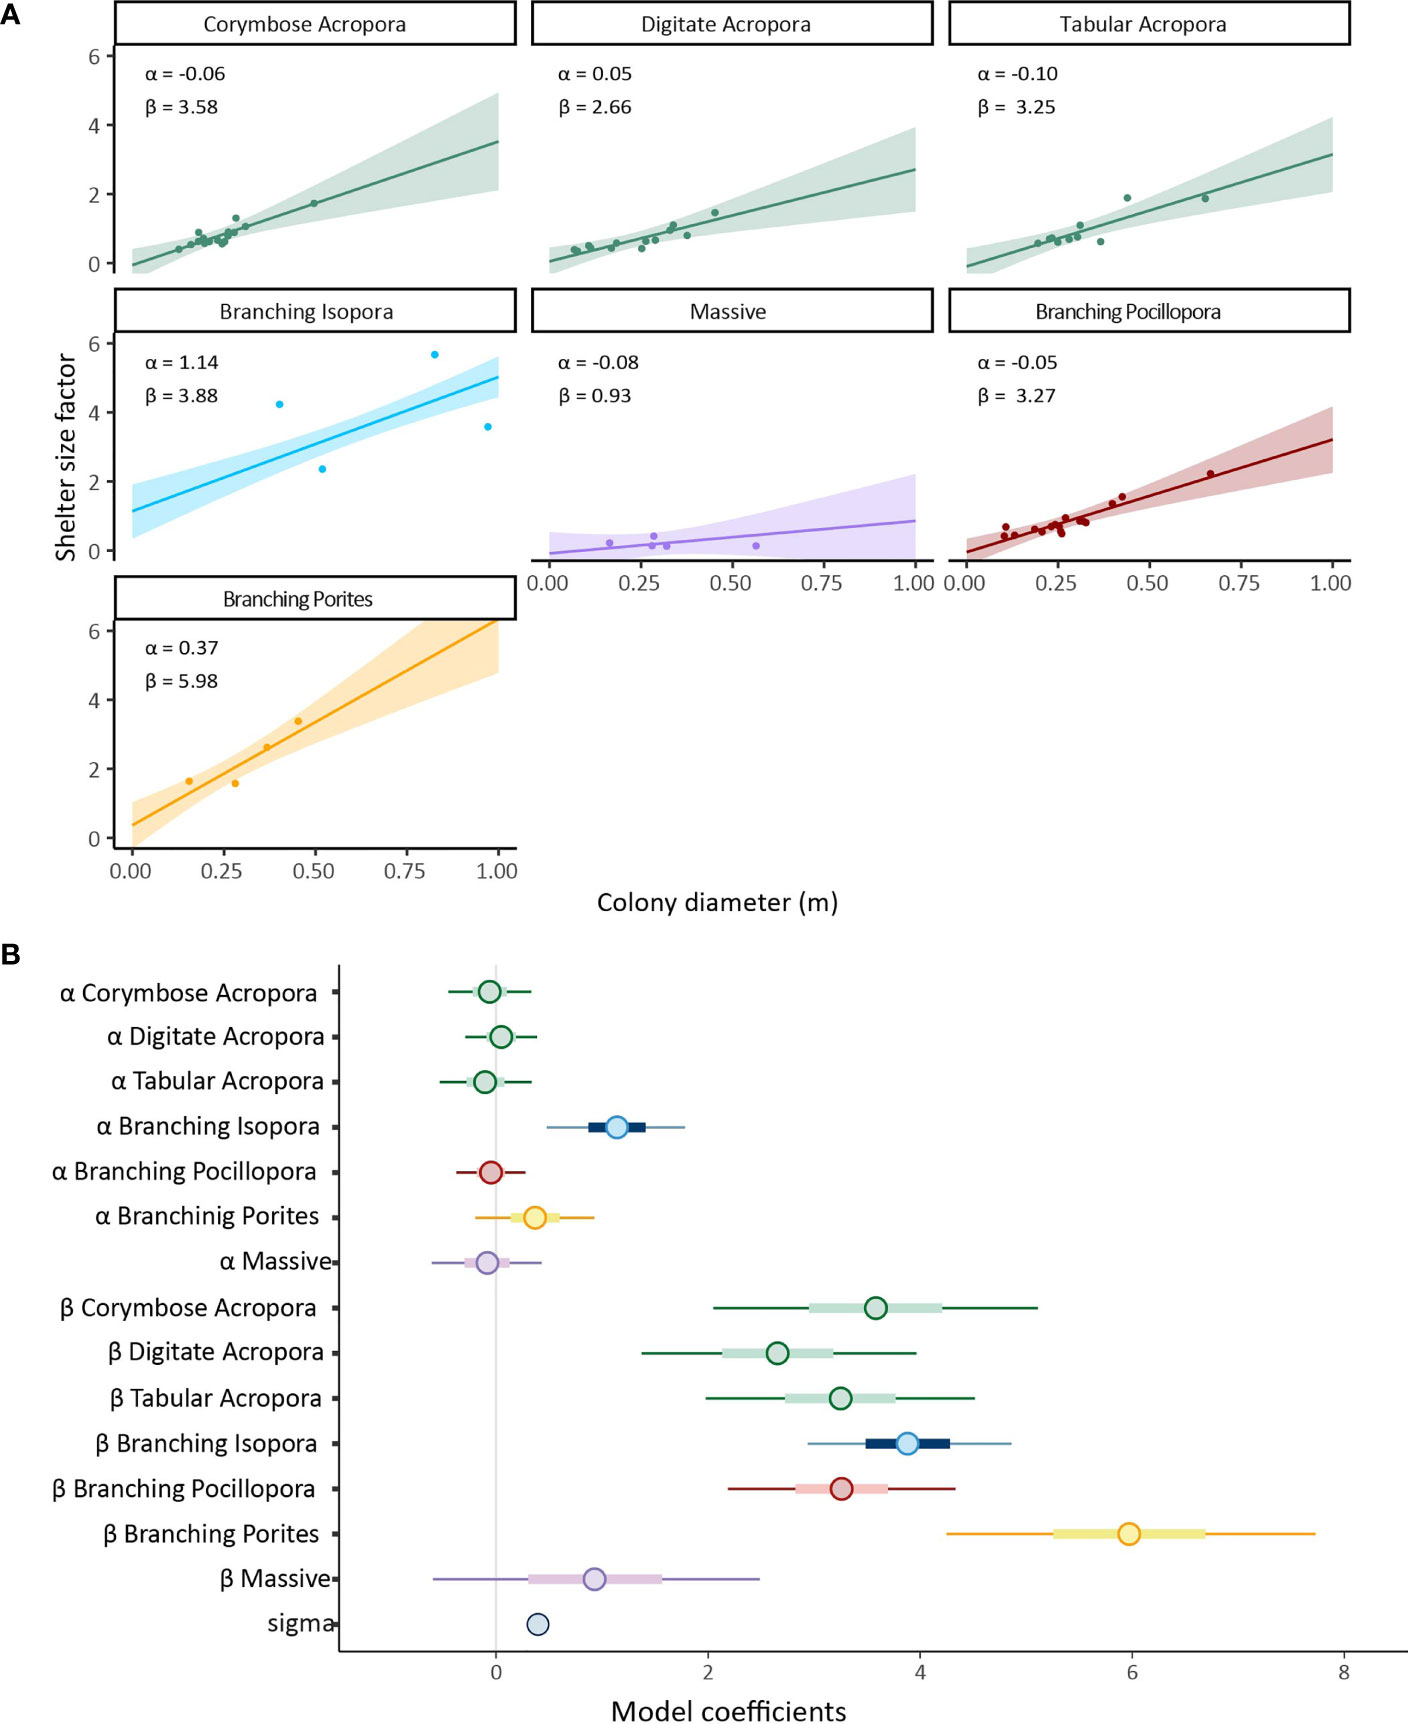
Figure 3 (A) Plotted posteriors from linear model of shelter size factor from the interaction model containing colony diameter as a predictor for each of the seven mophotaxa. Shaded regions are 95% highest density probability intervals and solid lines are mean slopes of the mean from the posterior probability distribution. (B) Posterior predictions for intercept (α) and slope (β) parameters in the same model. Circles indicate means, thick blue bars are 50% credible intervals, thin blue line are 95% credible intervals. All model coeficients including posterior uncertainty are avilable numerically in Table S3.
Discussion
Metrics Extraction From Reconstructed 3D Models
The methods developed in this study allow for the automated extraction of a suite of informative structural complexity metrics from digital reconstructions of coral colonies (or other objects). Applying novel technologies to create 3D reconstructions is accessible, accurate and requires little training. Yet, there is limited guidance on how to apply these technologies for ecological studies. Much of the recent literature deals with the accuracy, precision and repeatability of the resultant models, as well as how to make the reconstructions themselves, laying a critical foundation for the broad uptake of this method (Figueira et al., 2015; Shortis, 2015; Bryson et al., 2017; Raoult et al., 2017; Bayley et al., 2019; Marre et al., 2019). Ecological applications of photogrammetry, whilst rare, show that the accuracy and information-richness of resultant metrics affords more explanatory power of associated biotic communities than comparable manual methods such as chain-and-tape rugosity (Ferrari et al., 2017; González-Rivero et al., 2017; Urbina-barreto et al., 2020; Million et al., 2021). Therefore, it is an ideal time to establish practices of transparency of processing methods as well as standardization. Our routines are designed extract metrics simply and quickly minimizing manual input and decision-making on the part of the user.
Whilst we did not statistically analyze all the calculated metrics, the utility of each of these has been documented in the literature. Thus, researchers can select the most appropriate metrics for research questions from the suite provided by our code (see Table 3).
Establishing the Ecological Utility of Structural Metrics
The metrics presented in this study can be used to compare various aspects of reef functionality by relating aspects of the shape of colonies to their size among different categorical growth forms simultaneously. Such approaches have been shown to be effective in estimating the functional capacity of reefs at the assemblage-scale (Urbina-barreto et al., 2020), predicting higher-order traits of corals using simple morphometrics (House et al., 2018), tracking reef responses to disturbance events (Zawada et al., 2019b), and measuring functional changes associated with colony growth (Million et al., 2021).
Comparison of two metrics of refuge provisioning among our sampled colonies revealed subtle differences in spatial refuge provisioning among a range of morphotaxa (Figure 3). We found that absolute spatial refuge could be predicted as a function of colony diameter and morphotaxa, despite a relatively small sample size for some coral groups. The power-law scaling relationships present among colonies are in agreement with other studies of 3D geometry at the colony scale (Dornelas et al., 2017; Urbina-barreto et al., 2020). It is promising that historical data, collected when only 2D metrics were available, may be usefully compared with modern data to document changes overtime. It also suggests that where resource and time limitations prevent the gathering and processing of comprehensive suites of 3D data, for example in small-scale community reef management or citizen science scenarios, ecologically meaningful inferences could be drawn from the measurement of colony diameter and morphotaxa alone. However, whilst we found evidence here for strong scaling relationships between two and three-dimensional elements of colony geometry, our dataset was relatively small, and many more colonies will be needed to solidify these relationships. Given enough data, a combination of the metrics presented here could be used as a platform to relate colony geometry not only to morphotaxa (as we did here) but also to environmental variables such as depth or exposure. This is arguably necessary as such variables have been shown to influence the phenotype of different coral taxa in the past (Todd, 2008; Ow and Todd, 2010; Doszpot et al., 2019).
Our results indicated that, contrary to Urbina-Barreto et al. (2020), tabular colonies did not provide greater volumes of spatial refuge among colonies of similar size from other morphotaxa. Further, the high surface area created by the finely branching structure of the canopy itself depresses slightly the estimate of shelter size factor. Their generation of a single, large and continuous overhanging space below the ‘canopy’ has been shown to be a keystone reef structure, capable of supporting high biomass of a range of sizes of fish and other biota (Kerry and Bellwood, 2015). Whilst our generation of estimates for absolute spatial refuge and shelter size factor do capture in part the shaded overhang generated by tabular colonies (Figure S1), it is a conservative estimate of the space they generate. Depending on the growth orientation, vertical distance between the canopy and the benthos and canopy size, the refuge space generated by such morphotaxa can be considered highly variable, which should be a consideration when applying these metrics extraction routines in the future.
Future Uses of Structural Complexity Metrics
Coral reefs are undergoing substantial change due to a combination of global (Hoegh-Guldberg et al., 2007; Hughes et al., 2017a; Hughes et al., 2017b; Williams and Graham, 2019), and local stressors (Suchley and Alvarez-Filip, 2018). Temperature-induced bleaching events cause differential mortality among coral taxa, with structurally complex taxa such as tabular and branching Acropora often being the most adversely affected (Wilson et al., 2006; Madin et al., 2014; Álvarez-Noriega et al., 2016; Hughes et al., 2019). It is expected that as shifts in community composition occur and the relative abundance of stress-tolerant, structurally simple species such as massive and submassive corals increases, reefs may have a reduced capacity to provide shelter spaces for fishes (Karkarey et al., 2017). Our hope is that others will generate data using the routines presented in this study to begin to build a repository of data containing information on many aspects of 3D colony geometry so that such contemporary questions as these can be answered effectively.
Some of the most practical future uses of the photogrammetry derived metrics presented here will be to measure colony growth and to relate aspects of their structure and size to the inhabitant fish species assemblages. Previous studies have found larger colonies support larger and more diverse fish assemblages even at these fine spatial scales, but these relationships are nuanced (Noonan et al., 2012; Agudo-Adriani et al., 2016). The use of photogrammetry scans to relate the full 3D structure of colonies to inhabitant fish is lacking (but see Agudo-Adriani et al., 2016) and establishing reliable relationships across the diverse suite of corals and fish will require large amounts of data from different study groups. Such information will be valuable to management and restoration efforts, where it is useful to know which specific combination of structural parameters leads to maximal biomass of the inhabitant fauna. Selection of coral species in restoration efforts should be tailored to include species that balance hardiness and survivorship with the ability to support fish through the provision of quality refugia (e.g. Shaish et al., 2010). There is a paucity of data across the literature on the 3D nature of growth among different colony morphotypes (but see Million et al., 2021). Reimaging the same colonies at different time points and extracting a full suite of metrics such as those in this study could provide good insights into how various elements of coral structure changes over time when paired with suitable structural complexity metrics beyond simple linear extension.
Considerations and Limitations of Photogrammetry-Based Metrics
Photogrammetry scans are, at present, the only way to obtain estimates of surface measurements of corals and the volume of generated habitat refuge at sub-centimetric resolution without disturbing/killing colonies. We were not able to compare underwater scans to control references due to the in-situ nature of this study, and thus could not empirically validate the accuracy of our surface measurements. However, studies validating the method using laser and/or computerized tomography (CT) scans of dead coral skeletons have found highly realistic representations (>90% similarity to laser scans) can be obtained even when scanning complex branching corals (McKinnon et al., 2011).
Most of the colonies in this study were <50cm maximum diameter, which does not capture the full range of sizes able to be obtained by all the included morphotaxa, so more data is needed these larger sized colonies. However, the larger reconstructed colonies (~1m diameter) that had associated photosets of >250 photographs were still well modelled in a few hours. The main constraint on the reliability of estimates of the generated in this study is the likely to be the complexity of the branching structures of complex colony shapes (Figueira et al., 2015). Photogrammetry scans are unable to model what is not seen by the camera lens, so occlusions caused by excessively complex/fine branching structures lead to incorrect representations of the 3D structure. The addition of more photographs overcomes this to an extent as excessive overlap between photographs leads to more detail in the surfaces of models, but as colonies become larger and more structurally complex, the model representations are susceptible to a reduction in accuracy (Bythell et al., 2001; Figueira et al., 2015; Zawada et al., 2019a).
Conclusions
Photogrammetry is a suitable tool for assessing structural complexity at the colony scale. We show here the information richness and wide utility of photogrammetry by extracting 11 metrics of surface geometry and structural complexity using a single method. The semi-automated workflow presented in this study provides both new and experienced photogrammetry users with a tool to reconstruct corals at the colony scale, then extract an extensive suite of 3D structural complexity metrics. By automating processing at key steps, we aim to facilitate replicability and thus comparisons between studies, boosting the predictive power of statistical models over time and building a repository of shareable 3D data. As more studies incorporate such routines into their 3D processing workflow, the potential to uncover the nature of how structure relates to function among coral morphotaxa to aid ecological interpretation is immense.
Data Availability Statement
The raw data supporting the conclusions of this article will be made available by the authors, without undue reservation.
Author Contributions
EA designed the study under the supervision of SD and AH. Fieldwork was carried out by EA. EA performed statistical analyses, coded processing scripts and wrote the manuscript. All authors provided feedback and contributed to the editing of the manuscript, and approved the final submitted version.
Funding
Funding for field work was provided by the Director of National Parks.
Conflict of Interest
The authors declare that the research was conducted in the absence of any commercial or financial relationships that could be construed as a potential conflict of interest.
Publisher’s Note
All claims expressed in this article are solely those of the authors and do not necessarily represent those of their affiliated organizations, or those of the publisher, the editors and the reviewers. Any product that may be evaluated in this article, or claim that may be made by its manufacturer, is not guaranteed or endorsed by the publisher.
Acknowledgments
We would like to thank the relevant staff at Parks Australia, particularly Andy Warmbrunn, Mitchell Baskys and Martin Russell, and Rob Benn and the crew of the MV Iron Joy for logistical support. RF was funded through the Reef Restoration and Adaptation Program and other internal projects within the Australian Institute of Marine Science.
Supplementary Material
The Supplementary Material for this article can be found online at: https://www.frontiersin.org/articles/10.3389/fmars.2022.854395/full#supplementary-material
References
Agudo-Adriani E. A., Cappelletto J., Cavada-Blanco F., Croquer A. (2016). Colony Geometry and Structural Complexity of the Endangered Species Acropora Cervicornis Partly Explains the Structure of Their Associated Fish Assemblage. PeerJ 4, e1861. doi: 10.7717/peerj.1861
Althaus F., Hill N., Ferrari R., Edwards L., Przeslawski R., Schönberg C. H. L., et al. (2015). A Standardised Vocabulary for Identifying Benthic Biota and Substrata From Underwater Imagery: The CATAMI Classification Scheme. PloS One 10, 1–18. doi: 10.1371/journal.pone.0141039
Alvarez-Filip L., Gill J. A., Dulvy N. K. (2011). Complex Reef Architecture Supports More Small-Bodied Fishes and Longer Food Chains on Caribbean Reefs. Ecosphere 2, art118. doi: 10.1890/ES11-00185.1
Álvarez-Noriega M., Baird A. H., Dornelas M., Madin J. S., Cumbo V. R., Connolly S. R. (2016). Fecundity and the Demographic Strategies of Coral Morphologies. Ecology 97, 3485–3493. doi: 10.1002/ecy.1588
Banner K. M., Irvine K. M., Rodhouse T. J. (2020). The Use of Bayesian Priors in Ecology : The Good , the Bad and the Not Great. Methods Ecol. Evol. 11, 882–889. doi: 10.1111/2041-210X.13407
Bayley D. T. I., Mogg A. O. M. (2020). A Protocol for the Large-Scale Analysis of Reefs Using Structure From Motion Photogrammetry. Methods Ecol. Evol. 11, 1410–1420. doi: 10.1111/2041-210X.13476
Bayley D. T. I., Mogg A. O. M., Koldewey H., Purvis A. (2019). Capturing Complexity: Field-Testing the Use of ‘Structure From Motion’ Derived Virtual Models to Replicate Standard Measures of Reef Physical Structure. PeerJ 7, e6540. doi: 10.7717/peerj.6540
Bruno J. F., Stachowicz J. J., Bertness M. D. (2003). Inclusion of Facilitation Into Ecological Theory. Trends Ecol. Evol. 18, 119–125. doi: 10.1016/S0169-5347(02)00045-9
Bryson M., Ferrari R., Figueira W., Pizarro O., Madin J., Williams S., et al. (2017). Characterization of Measurement Errors Using Structure-From-Motion and Photogrammetry to Measure Marine Habitat Structural Complexity. Ecol. Evol. 7, 5669–5681. doi: 10.1002/ece3.3127
Bürkner P. C. (2017). brms: An R Package for Bayesian Multilevel Models Using Stan. J. Stat. Softw. 80, 1–28. doi: 10.18637/jss.v080.i01
Bythell J., Pan P., Lee J. (2001). Three-Dimensional Morphometric Measurements of Reef Corals Using Underwater Photogrammetry Techniques. Coral Reefs 20, 193–199. doi: 10.1007/s003380100157
Cheal A. J., MacNeil M. A., Emslie M. J., Sweatman H. (2017). The Threat to Coral Reefs From More Intense Cyclones Under Climate Change. Glob. Chang. Biol. 23, 1511–1524. doi: 10.1111/gcb.13593
Cignoni P., Callieri M., Corsini M., Dellepiane M., Ganovelli F., Ranzuglia G. (2008). MeshLab: An Open-Source Mesh Processing Tool. 6th Eurographics Ital Chapter Conf 2008 - Proc. 129–136.
Dietzel A., Bode M., Connolly S. R., Hughes T. P. (2021). The Population Sizes and Global Extinction Risk of Reef-Building Coral Species at Biogeographic Scales. Nat. Ecol. Evol 5, 663–669.. doi: 10.1038/s41559-021-01393-4
Dornelas M., Madin J. S., Baird A. H., Connolly S. R. (2017). Allometric Growth in Reef-Building Corals. Proc. R Soc. B Biol. Sci. 284, 1–7. doi: 10.1098/rspb.2017.0053
Doszpot N., McWilliam M., Pratchett M., Hoey A., Figueira W. (2019). Plasticity in Three-Dimensional Geometry of Branching Corals Along a Cross-Shelf Gradient. Diversity 11, 44. doi: 10.3390/d11030044
Ferrari R., Malcolm H. A., Byrne M., Friedman A., Williams S. B., Schultz A., et al. (2017). Habitat Structural Complexity Metrics Improve Predictions of Fish Abundance and Distribution. Ecography (Cop) 41, 1077–1091. doi: 10.1111/ecog.02580
Ferrari R., McKinnon D., He H., Smith R. N., Corke P., González-Rivero M., et al. (2016). Quantifying Multiscale Habitat Structural Complexity: A Cost-Effective Framework for Underwater 3D Modelling. Remote Sens 8, rs8020113. doi: 10.3390/rs8020113
Figueira W., Ferrari R., Weatherby E., Porter A., Hawes S., Byrne M. (2015). Accuracy and Precision of Habitat Structural Complexity Metrics Derived From Underwater Photogrammetry. Remote Sens 7, 16883–16900. doi: 10.3390/rs71215859
Forsmoo J., Anderson K., Macleod C. J. A., Wilkinson M. E., DeBell L., Brazier R. E. (2019). Structure From Motion Photogrammetry in Ecology: Does the Choice of Software Matter? Ecol. Evol. 9, 12964–12979. doi: 10.1002/ece3.5443
Franklin J. F., Van Pelt R. (2004). Spatial Apects of Structural Complexity in Old-Growth Forests. J. For 102, 22–28. doi: 10.1093/jof/102.3.22
Gigliotti L. C., Slotow R., Hunter L. T. B., Fattebert J., Sholto-Douglas C., Jachowski D. S. (2020). Habitat Complexity and Lifetime Predation Risk Influence Mesopredator Survival in a Multi-Predator System. Sci. Rep. 10, 1–10. doi: 10.1038/s41598-020-73318-3
González-Rivero M., Harborne A. R., Herrera-Reveles A., Bozec Y. M., Rogers A., Friedman A., et al. (2017). Linking Fishes to Multiple Metrics of Coral Reef Structural Complexity Using Three-Dimensional Technology. Sci. Rep. 7, 1–15. doi: 10.1038/s41598-017-14272-5
Graham N. A. J., Nash K. L. (2013). The Importance of Structural Complexity in Coral Reef Ecosystems. Coral Reefs 32, 315–326. doi: 10.1007/s00338-012-0984-y
Green S., Bevan A., Shapland M. (2014). A Comparative Assessment of Structure From Motion Methods for Archaeological Research. J. Archaeol Sci. 46, 173–181. doi: 10.1016/j.jas.2014.02.030
Guo T., Capra A., Troyer M., Gruen A., Brooks A. J., Hench J. L., et al. (2016). Accuracy Assessment of Underwater Photogrammetric Three Dimensional Modelling for Coral Reefs. Int. Arch. Photogramm Remote Sens Spat Inf Sci. - ISPRS Arch. 41, 821–828. doi: 10.3929/ethz-b-000118990
Harborne A. R., Mumby P. J., Ferrari R. (2012). The Effectiveness of Different Meso-Scale Rugosity Metrics for Predicting Intra-Habitat Variation in Coral-Reef Fish Assemblages. Environ. Biol. Fishes 94, 431–442. doi: 10.1007/s10641-011-9956-2
Harborne A. R., Mumby P. J., Kennedy E. V., Ferrari R. (2011). Biotic and Multi-Scale Abiotic Controls of Habitat Quality: Their Effect on Coral-Reef Fishes. Mar Ecol. Prog. Ser. 437, 201–214. doi: 10.3354/meps09280
Hixon M., Beets J. (1993). Predation, Prey Refuges, and the Structure of Coral-Reef Fish Assemblages. Ecol. Monogr. 63, 77–101. doi: 10.2307/2937124
Hoegh-Guldberg O., Mumby P. J., Hooten A. J., Steneck R. S., Greenfield P., Gomez E., et al. (2007). Coral Reefs Under Rapid Climate Change and Ocean Acidification. Science 318, 1737–1742. doi: 10.1126/science.1152509
House J. E., Brambilla V., Bidaut L. M., Christie A. P., Pizarro O., Madin J. S., et al. (2018). Moving to 3D: Relationships Between Coral Planar Area, Surface Area and Volume. PeerJ 6, e4280. doi: 10.7717/peerj.4280
Hughes T., Barnes M., Bellwood D. R., Cinner J., Cumming G., Jackson J. B., et al. (2017a). Coral Reefs in the Anthropocene. Nature 546, 82–90. doi: 10.1038/nature22901
Hughes T. P., Kerry J. T., Álvarez-Noriega M., Álvarez-Romero J. G., Anderson K. D., Baird A. H., et al. (2017b). Global Warming and Recurrent Mass Bleaching of Corals. Nature 543, 373–377. doi: 10.1038/nature21707
Hughes T. P., Kerry J. T., Baird A. H., Connolly S. R., Dietzel A., Eakin C. M., et al. (2018). Global Warming Transforms Coral Reef Assemblages. Nature 556, 492–496. doi: 10.1038/s41586-018-0041-2
Hughes T. P., Kerry J. T., Connolly S. R., Baird A. H., Eakin C. M., Heron S. F., et al. (2019). Ecological Memory Modifies the Cumulative Impact of Recurrent Climate Extremes. Nat. Clim Chang 9, 40–43. doi: 10.1038/s41558-018-0351-2
Karkarey R., Alcoverro T., Kumar S., Arthur R. (2017). Coping With Catastrophe: Foraging Plasticity Enables a Benthic Predator to Survive in Rapidly Degrading Coral Reefs. Anim. Behav. 131, 13–22. doi: 10.1016/j.anbehav.2017.07.010
Kerry J. T., Bellwood D. R. (2015). Do Tabular Corals Constitute Keystone Structures for Fishes on Coral Reefs? Coral Reefs 34, 41–50. doi: 10.1007/s00338-014-1232-4
Komyakova V., Munday P. L., Jones G. P. (2013). Relative Importance of Coral Cover, Habitat Complexity and Diversity in Determining the Structure of Reef Fish Communities. PloS One 8, 1–12. doi: 10.1371/journal.pone.0083178
Lange I. D., Perry C. T. (2020). A Quick, Easy and non-Invasive Method to Quantify Coral Growth Rates Using Photogrammetry and 3D Model Comparisons. Methods Ecol. Evol. 11, 714–726. doi: 10.1111/2041-210X.13388
Lavy A., Eyal G., Neal B., Keren R., Loya Y., Ilan M. (2015). A Quick, Easy and Non-Intrusive Method for Underwater Volume and Surface Area Evaluation of Benthic Organisms by 3D Computer Modelling. Methods Ecol. Evol. 6, 521–531. doi: 10.1111/2041-210X.12331
MacArthur R. (1958). Population Ecology of Some Warblers of Northeastern Coniferous Forests. Ecology 39, 599–619. doi: 10.2307/1931600
Madin J. S., Baird A. H., Dornelas M., Connolly S. R. (2014). Mechanical Vulnerability Explains Size-Dependent Mortality of Reef Corals. Ecol. Lett. 17, 1008–1015. doi: 10.1111/ele.12306
Madin J. S., Hoogenboom M. O., Connolly S. R., Darling E. S., Falster D. S., Huang D., et al. (2016). A Trait-Based Approach to Advance Coral Reef Science. Trends Ecol. Evol. 31, 419–428. doi: 10.1016/j.tree.2016.02.012
Marre G., Holon F., Luque S., Boissery P., Deter J. (2019). Monitoring Marine Habitats With Photogrammetry: A Cost-Effective, Accurate, Precise and High-Resolution Reconstruction Method. Front. Mar Sci. 6, 1–15. doi: 10.3389/fmars.2019.00276
McKinnon D., He H., Upcroft B., Smith R. N. (2011). Towards Automated and in-Situ, Near-Real Time 3-D Reconstruction of Coral Reef Environments. Ocean - MTS/IEEE Kona Progr. B. doi: 10.23919/OCEANS.2011.6106982
Ménard A., Turgeon K., Roche D. G., Binning S. A., Kramer D. L. (2012). Shelters and Their Use by Fishes on Fringing Coral Reefs. PloS One 7, e38450. doi: 10.1371/journal.pone.0038450
Menna F., Nocerino E., Drap P., Remondino F., Murtiyoso A., Grussenmeyer P., et al. (2018). Improving Underwater Accuracy by Empirical Weighting of Image Observations. Int. Arch. Photogramm Remote Sens Spat Inf Sci. XLII– 2, 699–705. doi: 10.3929/ethz-b-000271676
Menna F., Nocerino E., Fassi F., Remondino F. (2016). Geometric and Optic Characterization of a Hemispherical Dome Port for Underwater Photogrammetry. Sensors 16, 1–21. doi: 10.3390/s16010048
Million W. C., O’Donnell S., Bartels E., Kenkel C. D. (2021). Colony-Level 3d Photogrammetry Reveals That Total Linear Extension and Initial Growth Do Not Scale With Complex Morphological Growth in the Branching Coral, Acropora Cervicornis. Front. Mar Sci. 8, 1–12. doi: 10.3389/fmars.2021.646475
Naumann M. S., Niggl W., Laforsch C., Glaser C., Wild C. (2009). Coral Surface Area Quantification-Evaluation of Established Techniques by Comparison With Computer Tomography. Coral Reefs 28, 109–117. doi: 10.1007/s00338-008-0459-3
Noonan S. H. C., Jones G. P., Pratchett M. S. (2012). Coral Size, Health and Structural Complexity: Effects on the Ecology of a Coral Reef Damselfish. Mar. Ecol. Prog. Ser. 456, 127–137. doi: 10.3354/meps09687
Ow Y. X., Todd P. A. (2010). Light-Induced Morphological Plasticity in the Scleractinian Coral Goniastrea Pectinata and Its Functional Significance. Coral Reefs 29, 797–808. doi: 10.1007/s00338-010-0631-4
Pygas D. R., Ferrari R., Figueira W. F. (2020). Review and Meta-Analysis of the Importance of Remotely Sensed Habitat Structural Complexity in Marine Ecology. Estuar. Coast Shelf Sci. 235, 106468. doi: 10.1016/j.ecss.2019.106468
Quadros A. L. S., Barros F., Blumstein D. T., Meira V. H., Nunes J. A. C. C. (2019). Structural Complexity But Not Territory Sizes Influences Flight Initiation Distance in a Damselfish. Mar. Biol. 166, 65. doi: 10.1007/s00227-019-3508-2
Raoult V., Reid-Anderson S., Ferri A., Williamson J. (2017). How Reliable Is Structure From Motion (SfM) Over Time and Between Observers? A case study using coral reef bommies. Remote Sens 9, 740. doi: 10.3390/rs9070740
Reichert J., Schellenberg J., Schubert P., Wilke T. (2016). 3D Scanning as a Highly Precise, Reproducible, and Minimally Invasive Method for Surface Area and Volume Measurements of Scleractinian Corals. Limnol. Oceanogr. Methods 14, 518–526. doi: 10.1002/lom3.10109
Richardson L. E., Graham N. A. J., Hoey A. S. (2017). Cross-Scale Habitat Structure Driven by Coral Species Composition on Tropical Reefs. Sci. Rep. 7, 7557. doi: 10.1038/s41598-017-08109-4
Richardson L. E., Graham N. A. J., Pratchett M. S., Eurich J. G., Hoey A. S. (2018). Mass Coral Bleaching Causes Biotic Homogenization of Reef Fish Assemblages. Glob. Chang. Biol. 24, 3117–3129. doi: 10.1111/gcb.14119
Risk M. (1972). Fish Diversity on a Coral Reef in the Virgin Islands. Atoll Res. Bull. 153, 1–5. doi: 10.5479/si.00775630.153.1
Rogers A., Blanchard J. L., Mumby P. J. (2014). Vulnerability of Coral Reef Fisheries to a Loss of Structural Complexity. Curr. Biol. 24, 1000–1005. doi: 10.1016/j.cub.2014.03.026
Schloerke B., Cook D., Larmarange J., Briatte F., Marbach M., Thoen E, et al. (2020). Package: GGally ver 2.1.2. Available at: https://cran.r-project.org/web/packages/GGally.
Shaish L., Levy G., Katzir G., Rinkevich B. (2010). Employing a Highly Fragmented, Weedy Coral Species in Reef Restoration. Ecol. Eng. 36, 1424–1432. doi: 10.1016/j.ecoleng.2010.06.022
Shortis M. (2015). Calibration Techniques for Accurate Measurements by Underwater Camera Systems. Sensors 15, 30810–30826. doi: 10.3390/s151229831
Streit R. P., Cumming G. S., Bellwood D. R. (2019). Patchy Delivery of Functions Undermines Functional Redundancy in a High Diversity System. Funct. Ecol. 33, 1144–1155. doi: 10.1111/1365-2435.13322
Suchley A., Alvarez-Filip L. (2018). Local Human Activities Limit Marine Protection Efficacy on Caribbean Coral Reefs. Conserv. Lett. 11, 1–9. doi: 10.1111/conl.12571
Todd P. A. (2008). Morphological Plasticity in Scleractinian Corals. Biol. Rev. 83, 315–337. doi: 10.1111/j.1469-185X.2008.00045.x
Tokeshi M., Arakaki S. (2012). Habitat Complexity in Aquatic Systems: Fractals and Beyond. Hydrobiologia 685, 27–47. doi: 10.1007/s10750-011-0832-z
Urbina-barreto I., Pinel R., Fr L., Mahamadaly V., Elise S., Kulbicki M., et al. (2020). Quantifying the Shelter Capacity of Coral Reefs Using Photogrammetric 3D Modeling : From Colonies to Reefscapes. Ecol. Indic. 121, 107151. doi: 10.1016/j.ecolind.2020.107151
Veal C. J., Holmes G., Nunez M., Hoegh-Guldberg O., Osborn J. (2010). A Comparative Study of Methods for Surface Area and Three Dimensional Shape Measurement of Coral Skeletons. Limnol. Oceanogr. Methods 8, 241–253. doi: 10.4319/lom.2010.8.241
Vine P. (1974). Effects of Algal Grazing and Aggressive Behaviour of the Fishes Pomacentrus Lividus and Acanthurus Sohal on Coral-Reef Ecology. Mar Biol. 24, 131–136. doi: 10.1007/BF00389347
Vivian D. N., Yee S. H., Courtney L. A., Fisher W. S. (2019). Estimating 3-Dimensional Surface Areas of Small Scleractinian Corals. Caribb J. Sci. 49, 192. doi: 10.18475/cjos.v49i2.a8
Warfe D. M., Barmuta L. A. (2006). Habitat Structural Complexity Mediates Food Web Dynamics in a Freshwater Macrophyte Community. Oecologia 150, 141–154. doi: 10.1007/s00442-006-0505-1
Wickham H. (2015). Ggplot2: Create Elegant Data Visualisations Using the Grammar of Graphics. Version 2 (New York: Springer-V), 1–189.
Williams G. J., Graham N. A. J. (2019). Rethinking Coral Reef Functional Futures. Funct. Ecol. 33, 942–947. doi: 10.1111/1365-2435.13374
Willis S. C., Winemiller K. O., Lopez-Fernandez H. (2005). Habitat Structural Complexity and Morphological Diversity of Fish Assemblages in a Neotropical Floodplain River. Oecologia 142, 284–295. doi: 10.1007/s00442-004-1723-z
Wilson S. K., Graham N. A. J., Pratchett M. S., Jones G. P., Polunin N. V. C. (2006). Multiple Disturbances and the Global Degradation of Coral Reefs: Are Reef Fishes at Risk or Resilient? Glob Chang Biol. 12, 2220–2234. doi: 10.1111/j.1365-2486.2006.01252.x
Yao Y., Vehtari A., Simpson D., Gelman A. (2018). Using Stacking to Average Bayesian Predictive Distributions (With Discussion). Bayesian Anal. 13, 917–1007. doi: 10.1214/17-BA1091
Zawada K. J., Dornelas M., Madin J.S. (2019a). Quantifying Coral Morphology. Coral Reefs 38, 1281–1292. doi: 10.1101/553453
Keywords: photogrammetry, structural complexity, spatial refuge, automation, structure-from-motion
Citation: Aston EA, Duce S, Hoey AS and Ferrari R (2022) A Protocol for Extracting Structural Metrics From 3D Reconstructions of Corals. Front. Mar. Sci. 9:854395. doi: 10.3389/fmars.2022.854395
Received: 13 January 2022; Accepted: 02 March 2022;
Published: 07 April 2022.
Edited by:
Shashank Keshavmurthy, Academia Sinica, TaiwanReviewed by:
Christopher Goatley, University of New England, AustraliaNadav Shashar, Ben-Gurion University of the Negev, Israel
Copyright © 2022 Aston, Duce, Hoey and Ferrari. This is an open-access article distributed under the terms of the Creative Commons Attribution License (CC BY). The use, distribution or reproduction in other forums is permitted, provided the original author(s) and the copyright owner(s) are credited and that the original publication in this journal is cited, in accordance with accepted academic practice. No use, distribution or reproduction is permitted which does not comply with these terms.
*Correspondence: Eoghan A. Aston, ZW9naGFuLmFzdG9uQG15LmpjdS5lZHUuYXU=