
94% of researchers rate our articles as excellent or good
Learn more about the work of our research integrity team to safeguard the quality of each article we publish.
Find out more
ORIGINAL RESEARCH article
Front. Mar. Sci., 25 April 2022
Sec. Global Change and the Future Ocean
Volume 9 - 2022 | https://doi.org/10.3389/fmars.2022.849739
 Huichao Jiang1,2
 Dongyan Liu3
 Yuanqing Ma1*
 Bo Su1Ning Liu1Juan Zhang1Jianlong He1Huawei Qin1Xiukai Song1Shan Sun1Hongyan Xing1
Reducing nutrient loads from catchments is an important strategy to mitigate coastal eutrophication. The decadal responses of ecosystems to nutrient load reductions can help us understand the effectiveness of environmental restoration. Here, the cascading trophic interactions of mesozooplankton and phytoplankton in Laizhou Bay were analyzed to examine the effects of nutrient load reductions from rivers during 2004–2014. The results showed that the diversity of the mesozooplankton assemblages and the proportion of higher trophic species increased after nutrient load reductions, and mesozooplankton abundance showed an obviously decreasing annual trend. A significantly positive correlation between mesozooplankton and phytoplankton abundance was identified for August. Mesozooplankton abundance was mainly influenced by phytoplankton abundance in August, but by microzooplankton prey or jellyfish predators in May when phytoplankton abundance was low. This result indicates that the recovery of mesozooplankton assemblages in Laizhou Bay is a slow process after nutrient load reductions and might have cascading trophic interactions with phytoplankton recovery.
Eutrophication resulting from nutrient over enrichment has distinctly impacted the function and stability of coastal ecosystems by decreasing biodiversity, changing community structure, and increasing the risk of harmful algal blooms (HABs) and hypoxia (Field et al., 1998; Conley, 2000; Glibert and Burford, 2017). Over the last two decades, nutrient load reduction has been considered one of the most effective pathways to mitigate eutrophication, and has been widely implemented for the rehabilitation of many inland and coastal aquatic ecosystems (Soetaert et al., 2006; Elser et al., 2007; Lewis et al., 2011; Paerl et al., 2016). Traditionally, reducing phosphorus (P) inputs was the prescribed solution and was successful in some but not all aquatic regions (Elser et al., 2007; Lewis et al., 2011). In recent years, increasing evidence has indicated that the paradigm of controlling both P and nitrogen (N) is more beneficial to mitigate eutrophication and promote the rehabilitation of aquatic ecosystems (Soetaert et al., 2006; Paerl et al., 2016). For example, 60% nitrogen reduction from wastewater treatment, fertilizer-use reduction and stormwater diversion in Tampa Bay, United States, mitigated HABs and hypoxia, and increased seagrass coverage and Secchi depth (Greening et al., 2011; Morrison et al., 2011). Combined reductions in both N by ∼50% and P by ∼56% from load inputs resulted in significant declines in nutrient concentrations, primary production and phytoplankton biomass and increased deep water macroalgae cover in Danish coastal area (Riemann et al., 2016). The decline in phytoplankton resulting from nutrient load reduction has distinctly impacted zooplankton abundance, community composition, zooplankton:phytoplankton abundance ratio, and individual size, via cascading trophic interactions (Hardy et al., 1986; Jeppesen et al., 2007; Chen et al., 2012). The long-term variation in zooplankton assemblages is an effective and comprehensive indicator to reflect and assess the recovery and health of coastal ecosystems in response to eutrophication management, such as nutrient load reduction. However, it should be noted that ecosystem recovery differs from the degradation process due to the different nonlinear pressure-response pathways and the interaction of multiple pressures leading to shifts in baseline conditions (Duarte et al., 2008, 2013; Riemann et al., 2016). Additionally, the zooplankton, playing the key role in the pelagic food web, are vulnerable to the joint influence of both “Bottom up” and “Top down” effects (Granéli and Turner, 2002; Taylor et al., 2002; Strom et al., 2007; Chust et al., 2014), which complicates the direct effect of nutrient load reduction on zooplankton assemblages (Hardy et al., 1986; Chen et al., 2012).
Laizhou Bay is an important spawning, nursing, and feeding ground for many species in the Bohai Sea (Jin et al., 2013). There are more than 10 continental rivers around the catchment, among which the Yellow River and the Xiaoqing River are the two major rivers located in the western region and contributing more than 98% of runoff (Ma et al., 2004). These rivers bring abundant nutrients and lead to serious eutrophication and consequent ecological degradation, such as an increase in HABs, a shrinkage of spawning and feeding areas, and a decline in fishery resources (Tang et al., 2003; Jin et al., 2013). To mitigate coastal eutrophication and recover the health of coastal ecosystems, the Shandong provincial government launched riverine nutrient reduction policies in 2000. By 2014, the ammonia loadings from the two major rivers (Xiaoqing River and Yellow River) entering Laizhou Bay decreased 86.4% and 57.5% (Ma et al., 2004; Jiang et al., 2018a), respectively. Combined with the long-term effect of the phosphorus restriction policy conducted in Shandong Province, the nutrient concentration in Laizhou Bay decreased by 26.2–42.9% for dissolved inorganic nitrogen (DIN) and 50.5–51.2% for dissolved inorganic phosphorus (DIP) in 2004–2014 (Jiang et al., 2018b). Consequently, the phytoplankton assemblages showed some positive recovery, such as total abundance decrease, decline in HABs, and dominant species shift with increases in large diatoms and decreases in small diatoms, which have been reported in our previous research (Jiang et al., 2018a). Whether these positive changes in phytoplankton have produced effects on zooplankton assemblages via cascading trophic interactions and how zooplankton assemblages respond to nutrient load reductions and phytoplankton assemblage variations remain unknown.
Here, we analyze long-term mesozooplankton data, synchronous cruises according to nutrient and phytoplankton surveys conducted in Laizhou Bay in 2004–2014, focusing on the long-term recovery of mesozooplankton assemblages, and aim to (1) describe whether and how the mesozooplankton assemblages changed under the influence of nutrient load reductions, (2) illustrate how the mesozooplankton assemblages responded to phytoplankton assemblage variations via cascading trophic interactions, and (3) assess the recovery of pelagic ecosystems in response to nutrient load reductions and discuss the possible influencing factors delaying the recovery process.
Laizhou Bay is a temperate and semi-enclosed water body located in the southern Bohai Sea, China, with an area of approximately 7,000 km2 and a mean depth of 9 m. A weak anticlockwise circulation caused by a northwestern coastal current is mainly responsible for water exchange, combined with tidal action. In summer, increased Yellow River runoff can generate an eastward plume at the river mouth and influence the adjacent region (Liu, 2015). The shallow topography and a large amount of river inputs significantly influence the nutrient spatial distribution with higher values and serious eutrophication in the sea region near the Xiaoqing River (Wang et al., 2017; Jiang et al., 2018b).
In 2004–2014, a total of 17 ecological cruises in May (spring) and August (summer) were carried out at 24 stations in Laizhou Bay (Figure 1), with the purpose of monitoring interannual variations in mesozooplankton assemblages. The survey was interrupted in 2007 (August), 2009, 2010 (May), and 2013 (May) (Table 1). Mesozooplankton samples were collected using vertical tows of Plankton Net II (opening diameter 0.316 m and mesh aperture 156 μm) from 1 m above the bottom to the surface with a speed of 0.5 m/s. The filtered seawater volumes varied with seawater depth with a range of 0.06–1.48 m3, The collected samples were transferred to polyethylene bottles, and immediately fixed with 5% formalin seawater solution and transported to the laboratory for species identification and enumeration.

Figure 1. Map of Laizhou Bay showing sampling sites and isobaths.
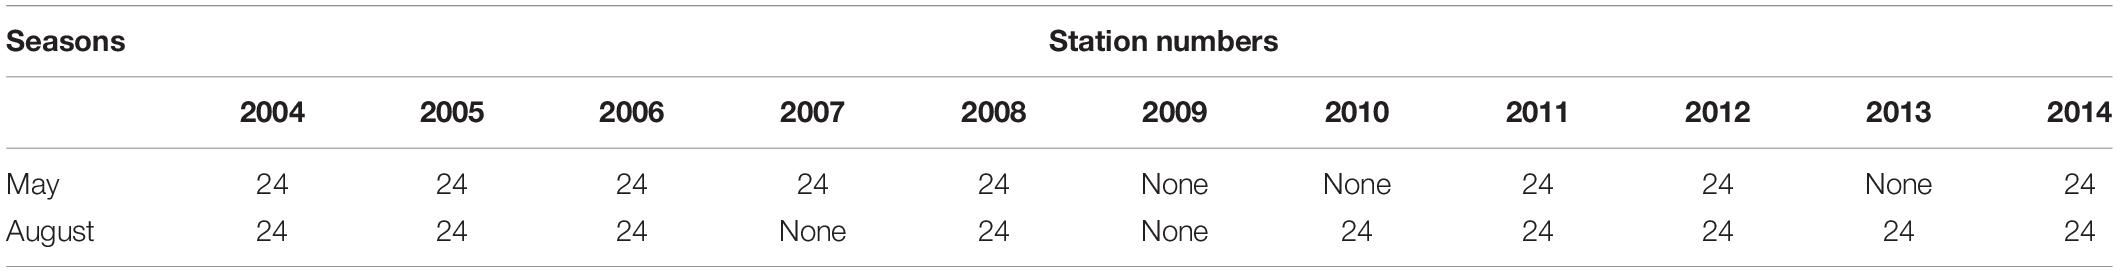
Table 1. The number of stations collected in different years and seasons.
The mesozooplankton taxa were identified to the species or lowest taxonomic level and enumerated under a stereomicroscope. A whole sample or a representative subsample by Folsom Plankton Splitter was determined according to the density of organisms in the original sample to ensure that each sample included at least 500 adult individuals.
Mesozooplankton species diversity was evaluated using the Shannon-Wiener diversity index (H’,).
where Pi is the proportion of individuals in a sample unit belonging to species i, and S is the number of species identified in the sample.
The importance of dominant species was evaluated using the dominance degree (Y), which was calculated as:
where ni is the individual number of species i; N is the total individual number in the sample, and fi is the occurrence frequency of species i among the stations of each cruise. The species with Y > 0.02 were identified for the analysis of the dominant species.
The inter-annual variability of mesozooplankton abundance and H’, index in Laizhou Bay were displayed with Box plot using Origin 2019b software. The abundance and H’, index were averaged by station (data in one station collected in different years were averaged) to exhibit the whole spatial distribution during 2004–2014. The coefficient of variation (CV) (standard deviation divided by the average) was calculated to show the spatial variability. The spatial distributions were mapped using Surfer 11 software. Multivariate statistical analyses were performed to examine variations in the annual community structure through nonmetric multidimensional scaling (MDS) plots. The key species contributing the main difference between different community groups were identified by Simper analysis. The MDS and Simper analyses were carried out with the PRIMER 6.0 software package (Clarke and Gorley, 2006), based on triangular matrices of the Bray-Curtis similarities, by performing the fourth-root transform. The stress value of the MDS representation of < 0.2 indicated a fairly accurate and useful two-dimensional representation (Clarke and Warwick, 2001).
The phytoplankton and environmental factor data were published in our previous studies (Jiang et al., 2018a,b). Here, we cited these data, including total phytoplankton abundance, diatoms, dinoflagellates, water temperature (WT), salinity, NO2-N, NO3-N, NH4-N, DIN, PO4-P, and N/P, to analyze the correlations of mesozooplankton abundance and phytoplankton abundance and environmental factors.
To better understand the cascading trophic interactions between mesozooplankton and phytoplankton assemblages, the spatiotemporal variations in phytoplankton abundance in 2004–2014 were cited from Jiang et al. (2018a) (Figure 2). In general, the phytoplankton assemblages in Laizhou Bay were dominated by diatoms with abundance contributions above 80% and showed different annual trends of phytoplankton abundance in May and August, with a trend of increasing first then decreasing in May and a total decreasing trend in August. Phytoplankton abundance in August, with a range of 2.2 × 10⁵−134.4 × 10⁵ cells m–3, was much higher than that in May, with a range of 0.1 × 10⁵−14.2 × 10⁵ cells m–3. Phytoplankton abundance in the sea region near the Xiaoqing River showed high values, especially in August, corresponding to nutrient distribution (Jiang et al., 2018b). The spatial variability of abundance (CV) in the sea region near the Xiaoqing River in both May and August displayed high variability.
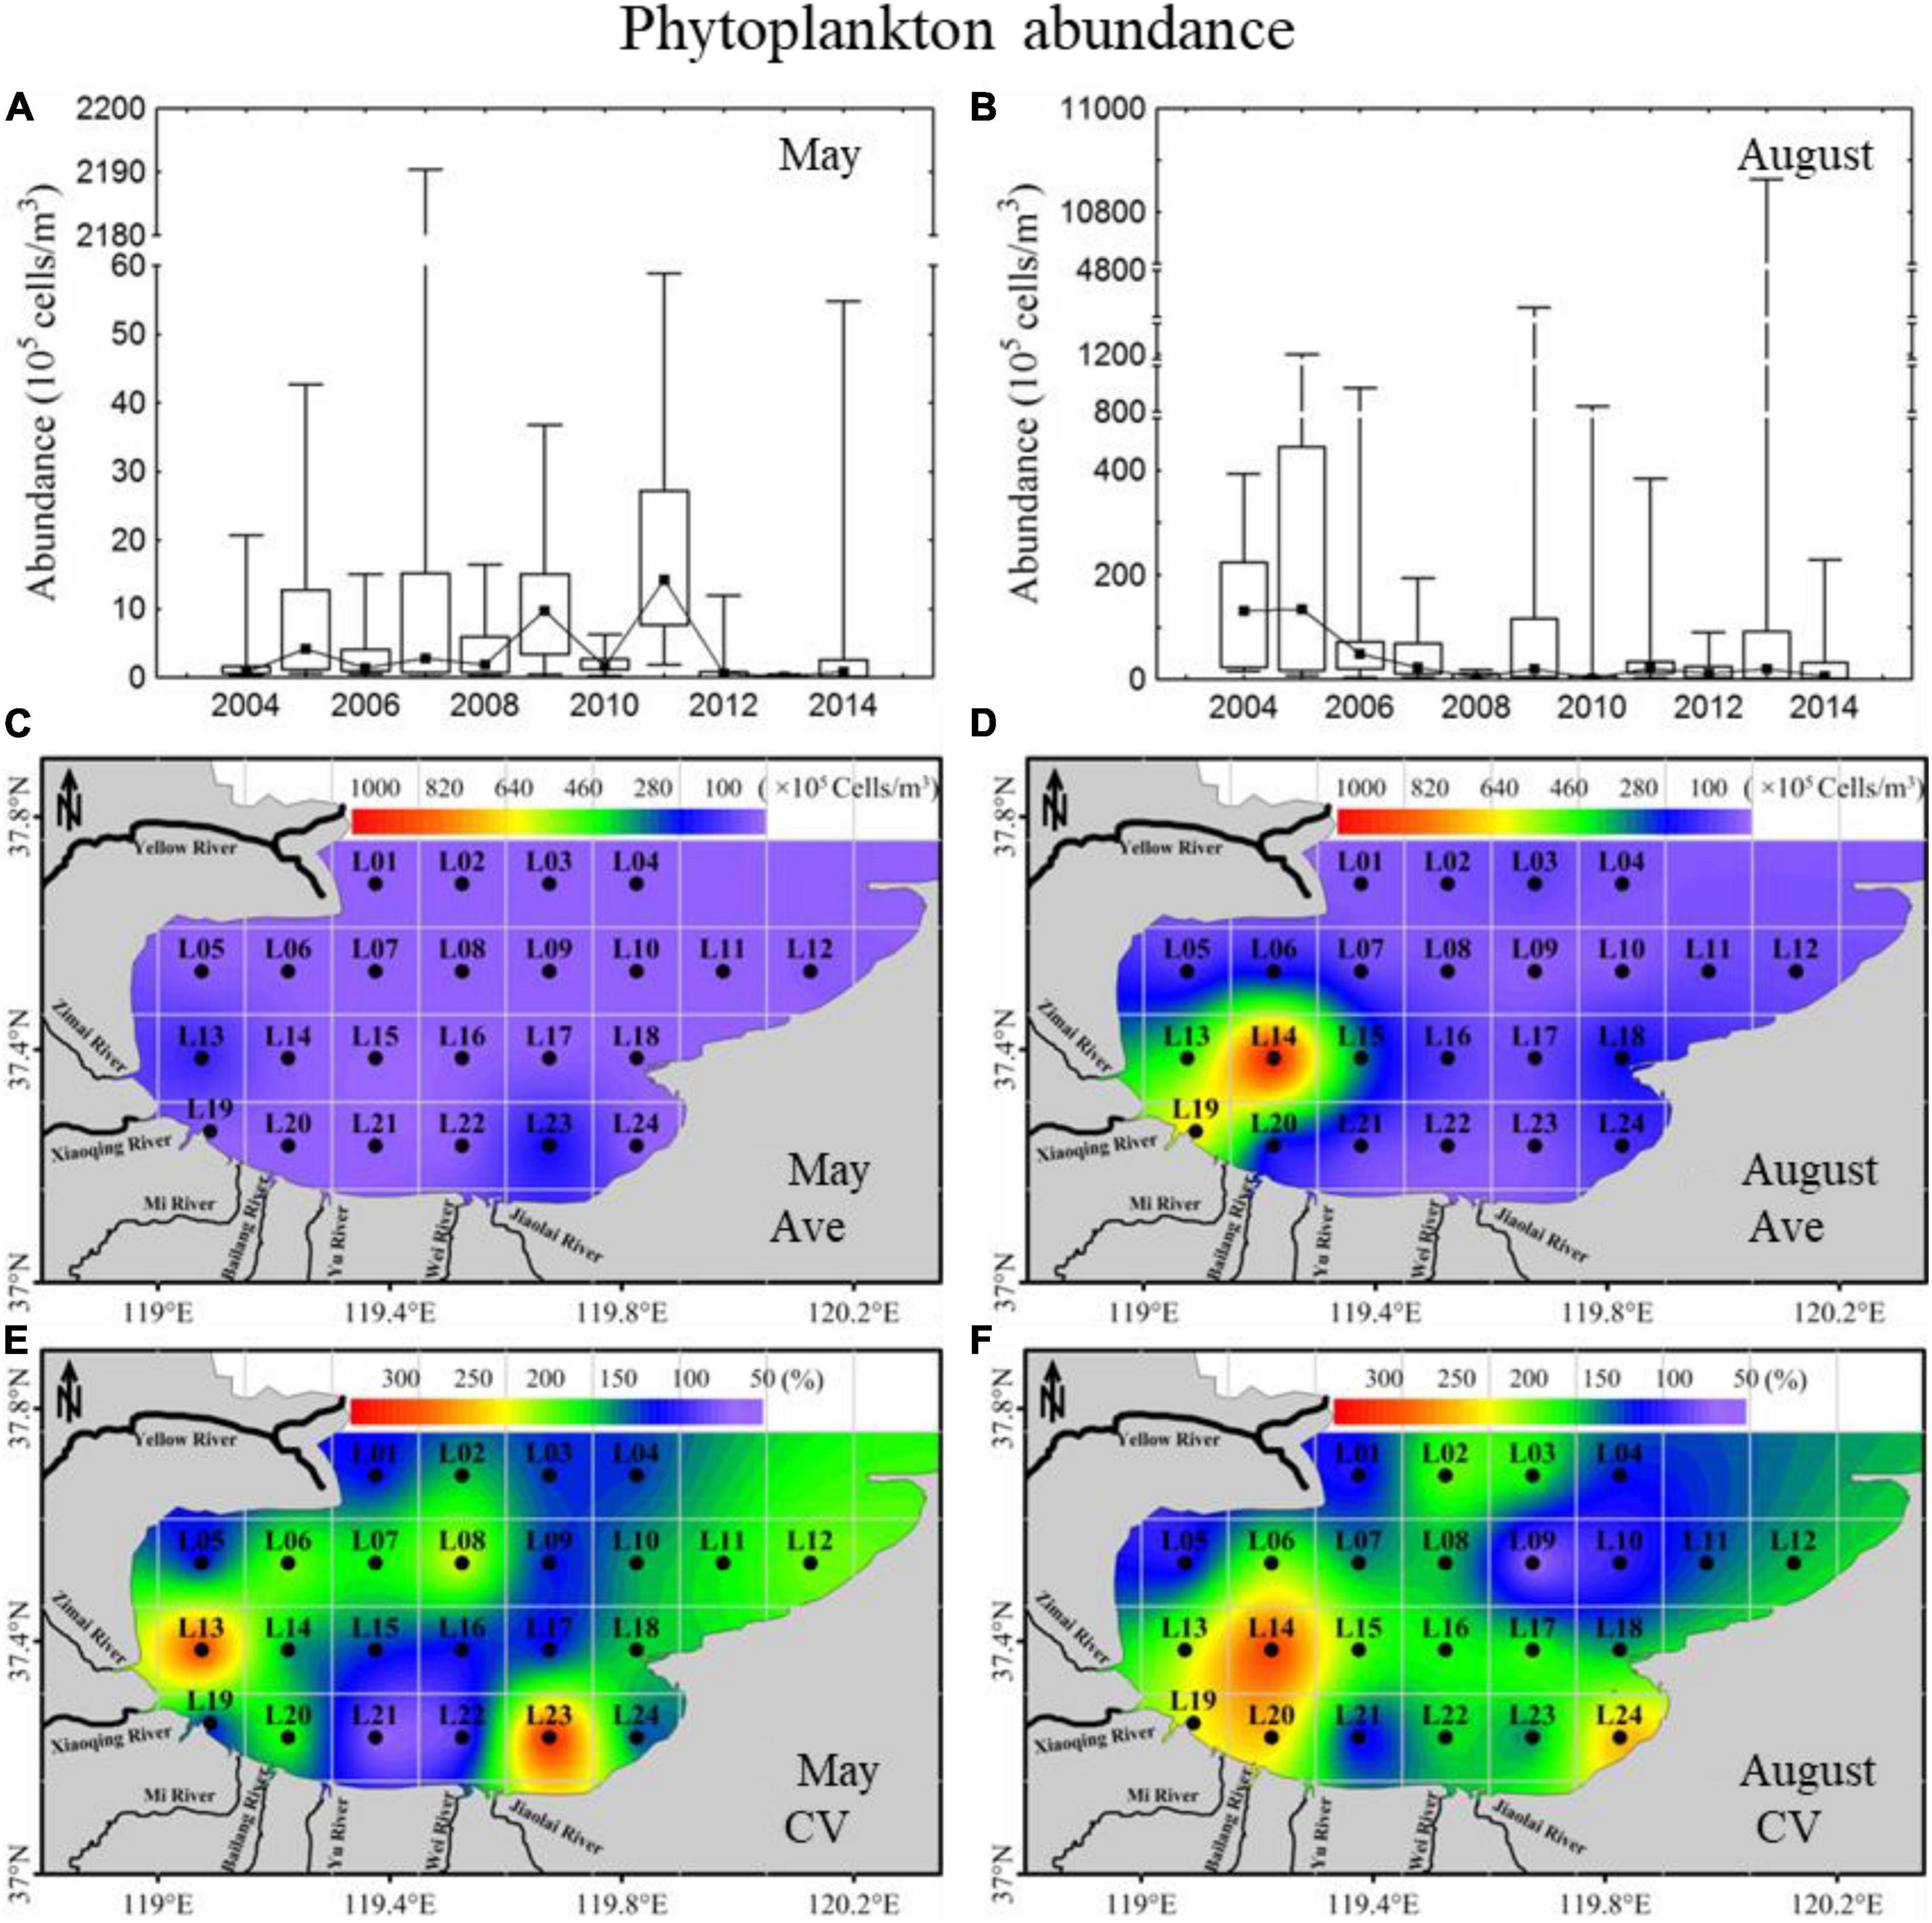
Figure 2. Inter-annual variability and spatial distributions of phytoplankton abundance in 2004–2014 in Laizhou Bay. (A,B) The lines with dark spots showing medians of cell abundance in May and August; bar charts showing the interquartile ranges of cell abundance in May and August. (C–F) Ave and CV showing the average and coefficient of variation of cell abundance in May and August, respectively.
A total of 85 different taxa were identified from the 283 mesozooplankton samples from the whole bay. The mesozooplankton community was characterized by 15 taxonomic entities, mainly represented by 26 species of copepods (82.1% of the total abundance), followed by pelagic larvae (15.2%), chaetognatha (1.3%), tunicate (0.6%), protozoa (0.4%), cladocera (0.2%) and 9 other taxonomic entities with mean contributions to abundance less than 0.1%, composed of hydromedusae, decapoda, pelagic molluska, mysidacea, cumacea, ostracoda, amphipoda, rotatoria, and euphausiacea. These species had all been reported in other studies of the Laizhou Bay and other temperate estuaries and coastal waters.
In May, the mesozooplankton H’, index showed a significant increasing annual trend, with high interannual variation ranging from 0.17 to 1.17 (Figure 3A). The 11-year average H’, index was relatively low, with an average of 0.77, and showed minor gradient differences in spatial distribution, with relatively high values in the northeast areas (Figure 3C). The CV displayed clear spatial distribution differences, with high CVs located in the southern coastal areas (Figure 3E). In August, the H’, index displayed an annual trend of decreasing first and then increasing, with interannual variation ranging from 1.28 to 2.40 (Figure 3B). The 11-year average H’, index was higher in August (average: 2.02) than in May (average: 0.77) (Figures 3C,D) and presented some gradient difference with high H’, in the northern mouth of the bay and low values on the southern coast (Figure 3D). In total, the CV was lower in August than in May, with relatively high values mainly located in the southern coastal areas (Figures 3E,F).
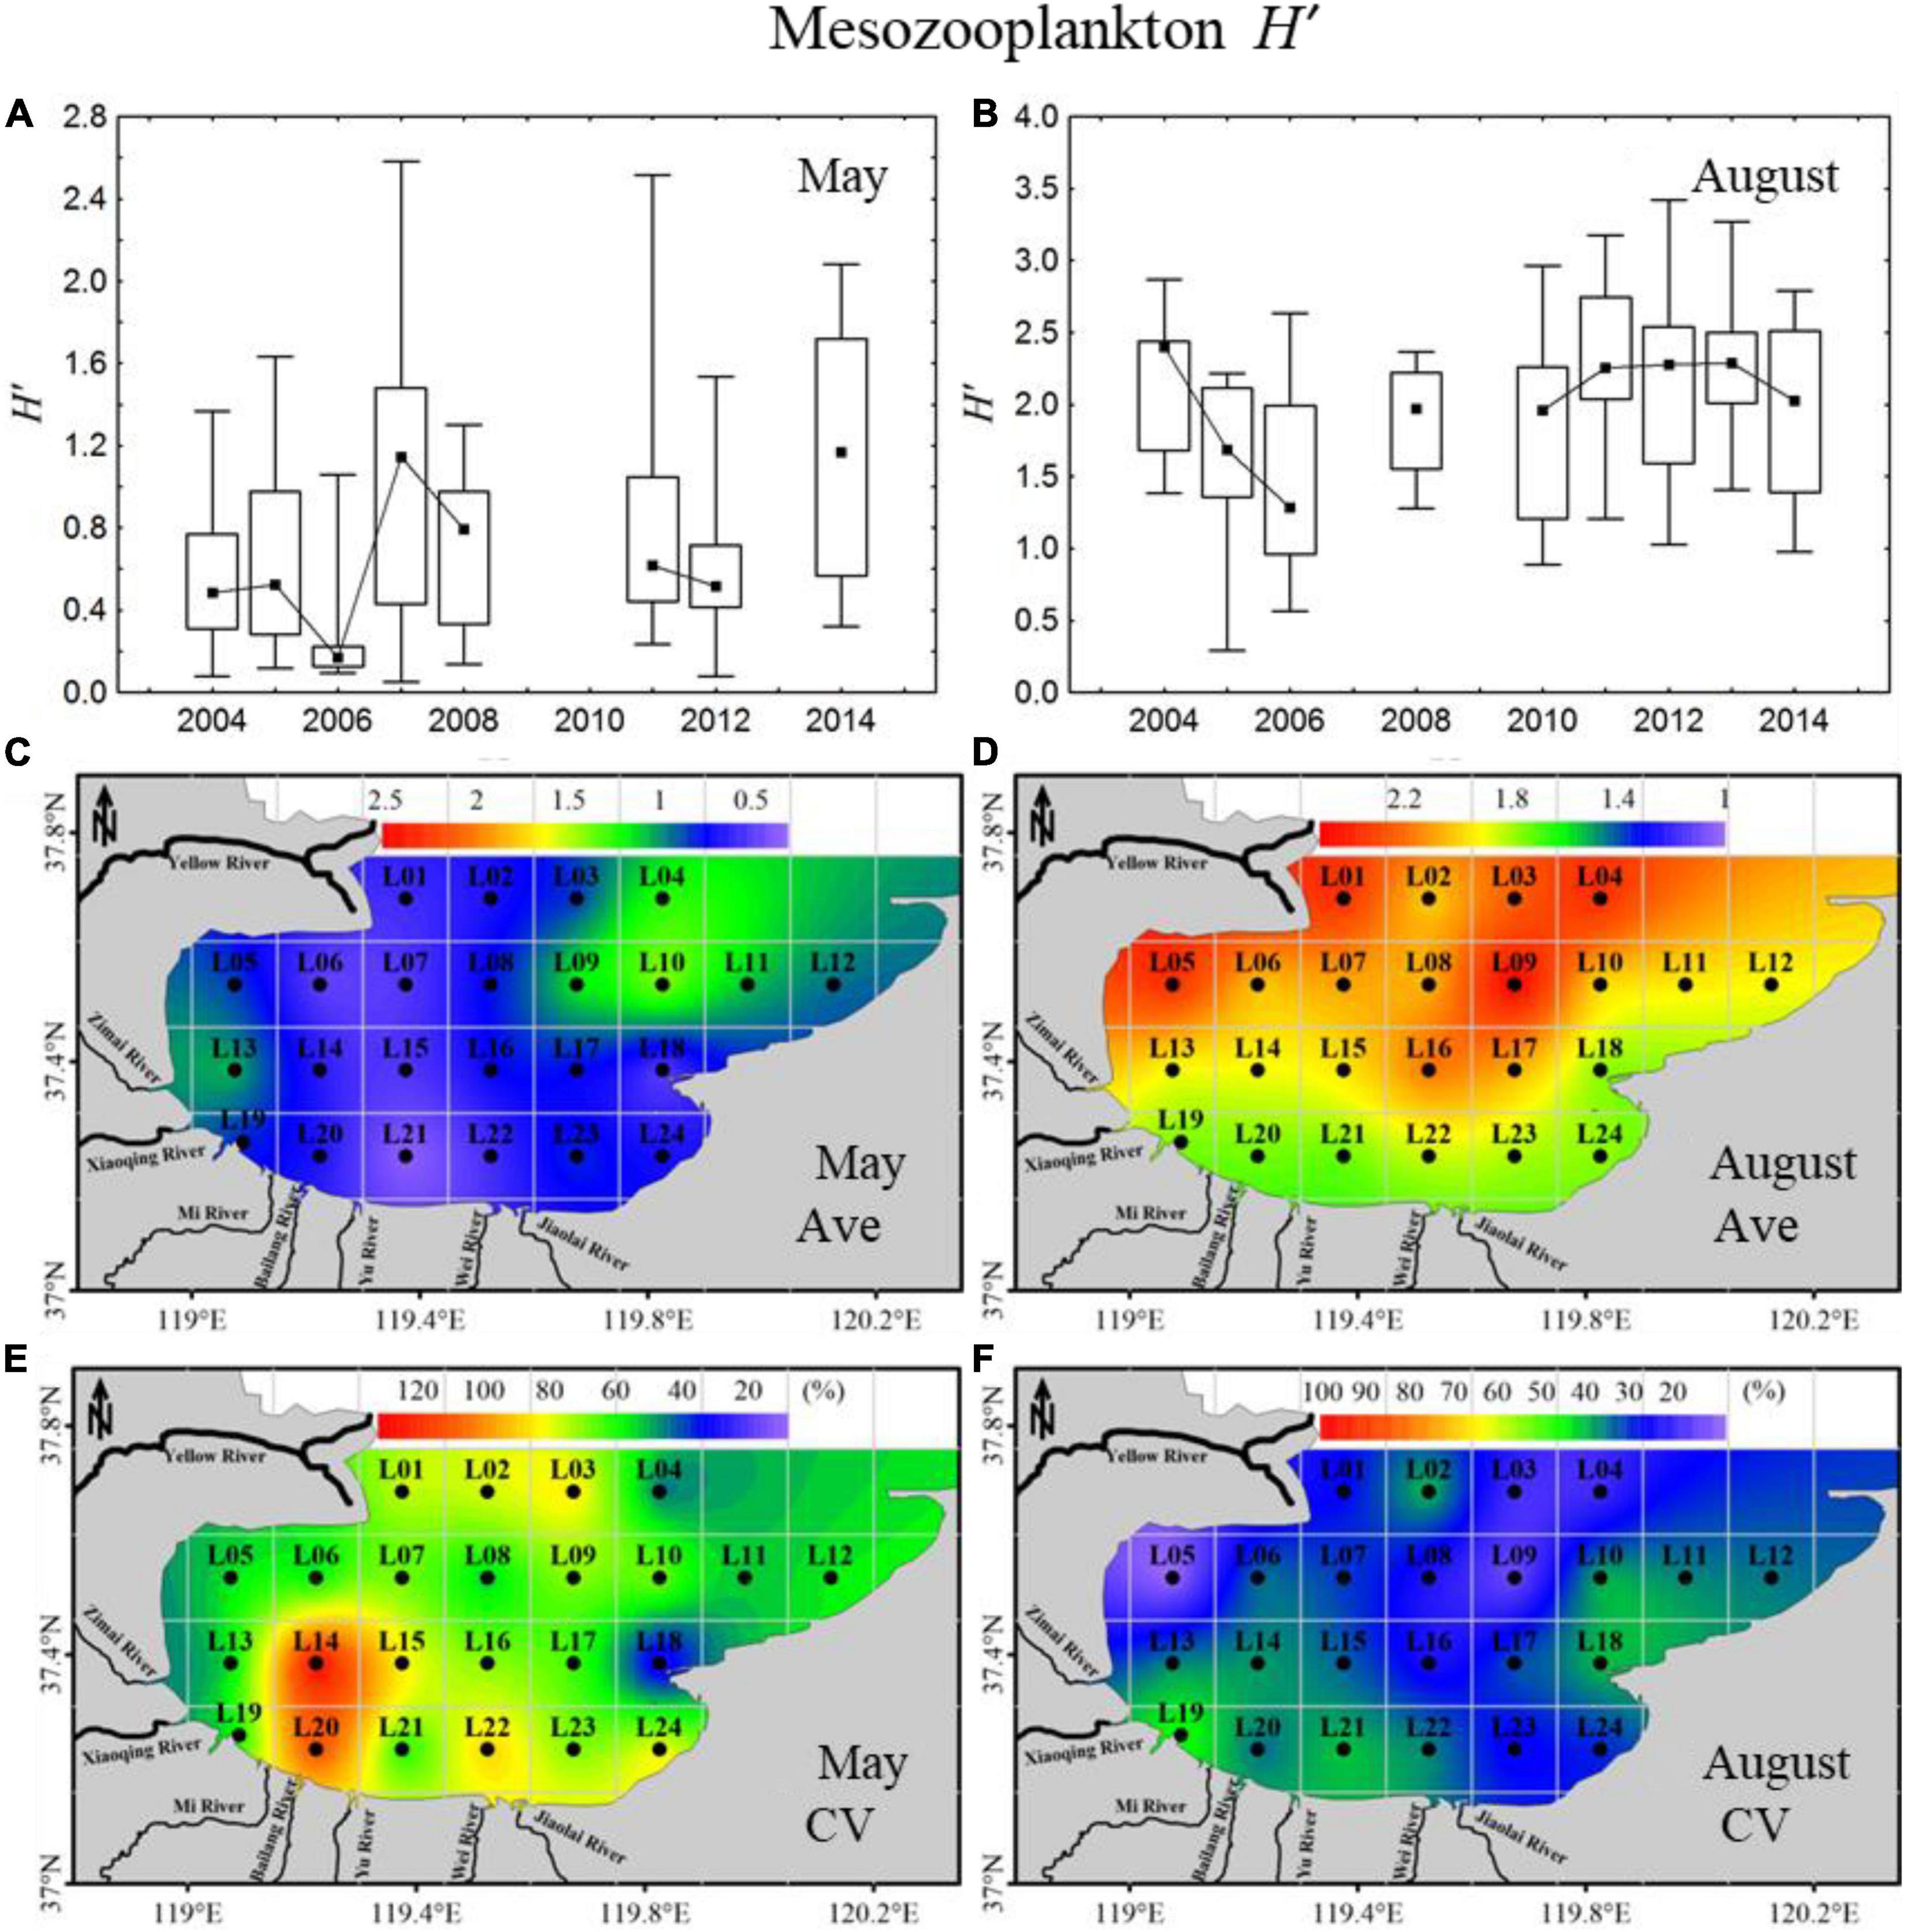
Figure 3. Inter-annual variability and spatial distributions of mesozooplankton diversity (H’,) in 2004–2014 in Laizhou Bay. (A,B) The lines with dark spots showing medians of H’, in May and August; bar charts showing the interquartile ranges of H’, in May and August. (C–F) Ave and CV showing the average and coefficient of variation of H’, in May and August, respectively.
In May, the mesozooplankton abundance showed annual decreasing trends, with drastic interannual variability of 6,373–39,487 ind. m–3 (Figure 4A); resented significant spatial distribution differences, with low abundance in the sea region near the Xiaoqing River and northeast bay mouth and high values near the Yellow River (Figure 4C); and displayed weak spatial variability (CV) (Figure 4E). The mesozooplankton community structures showed clear variations, and could be divided into two groups at a similarity of 65% (ANOSIM significance level of sample statistic = 3.6% and global R = 0.750), group May04-11 and group May12-14 (Figure 5A). In the process of mesozooplankton community succession, the abundance of Acartia bifilosa, Paracalanus parvus, Labidocera euchaeta, Sagitta crassa, Calanus sinicus, and Oikopleura spp. decreased, while the abundance of Oithona similis, Centropages abdominalis, Ditrichocorycaeus affinis, Rathkea octopunctata, Parvocalanus crassirostris, Parvocalanus crassirostris, Eurytemora pacifica, fish larva, Hyperacanthomysis longirostris and gammaridea significantly increased (Figure 6A). These species were the key species contributing the main dissimilarity (61.9%) between the two groups (Figure 6A). A. bifilosa was the most dominant species and dominated throughout the period. The number of dominant species showed an annual increasing trend (Figure 7A), indicating the increasing stability of the mesozooplankton community.
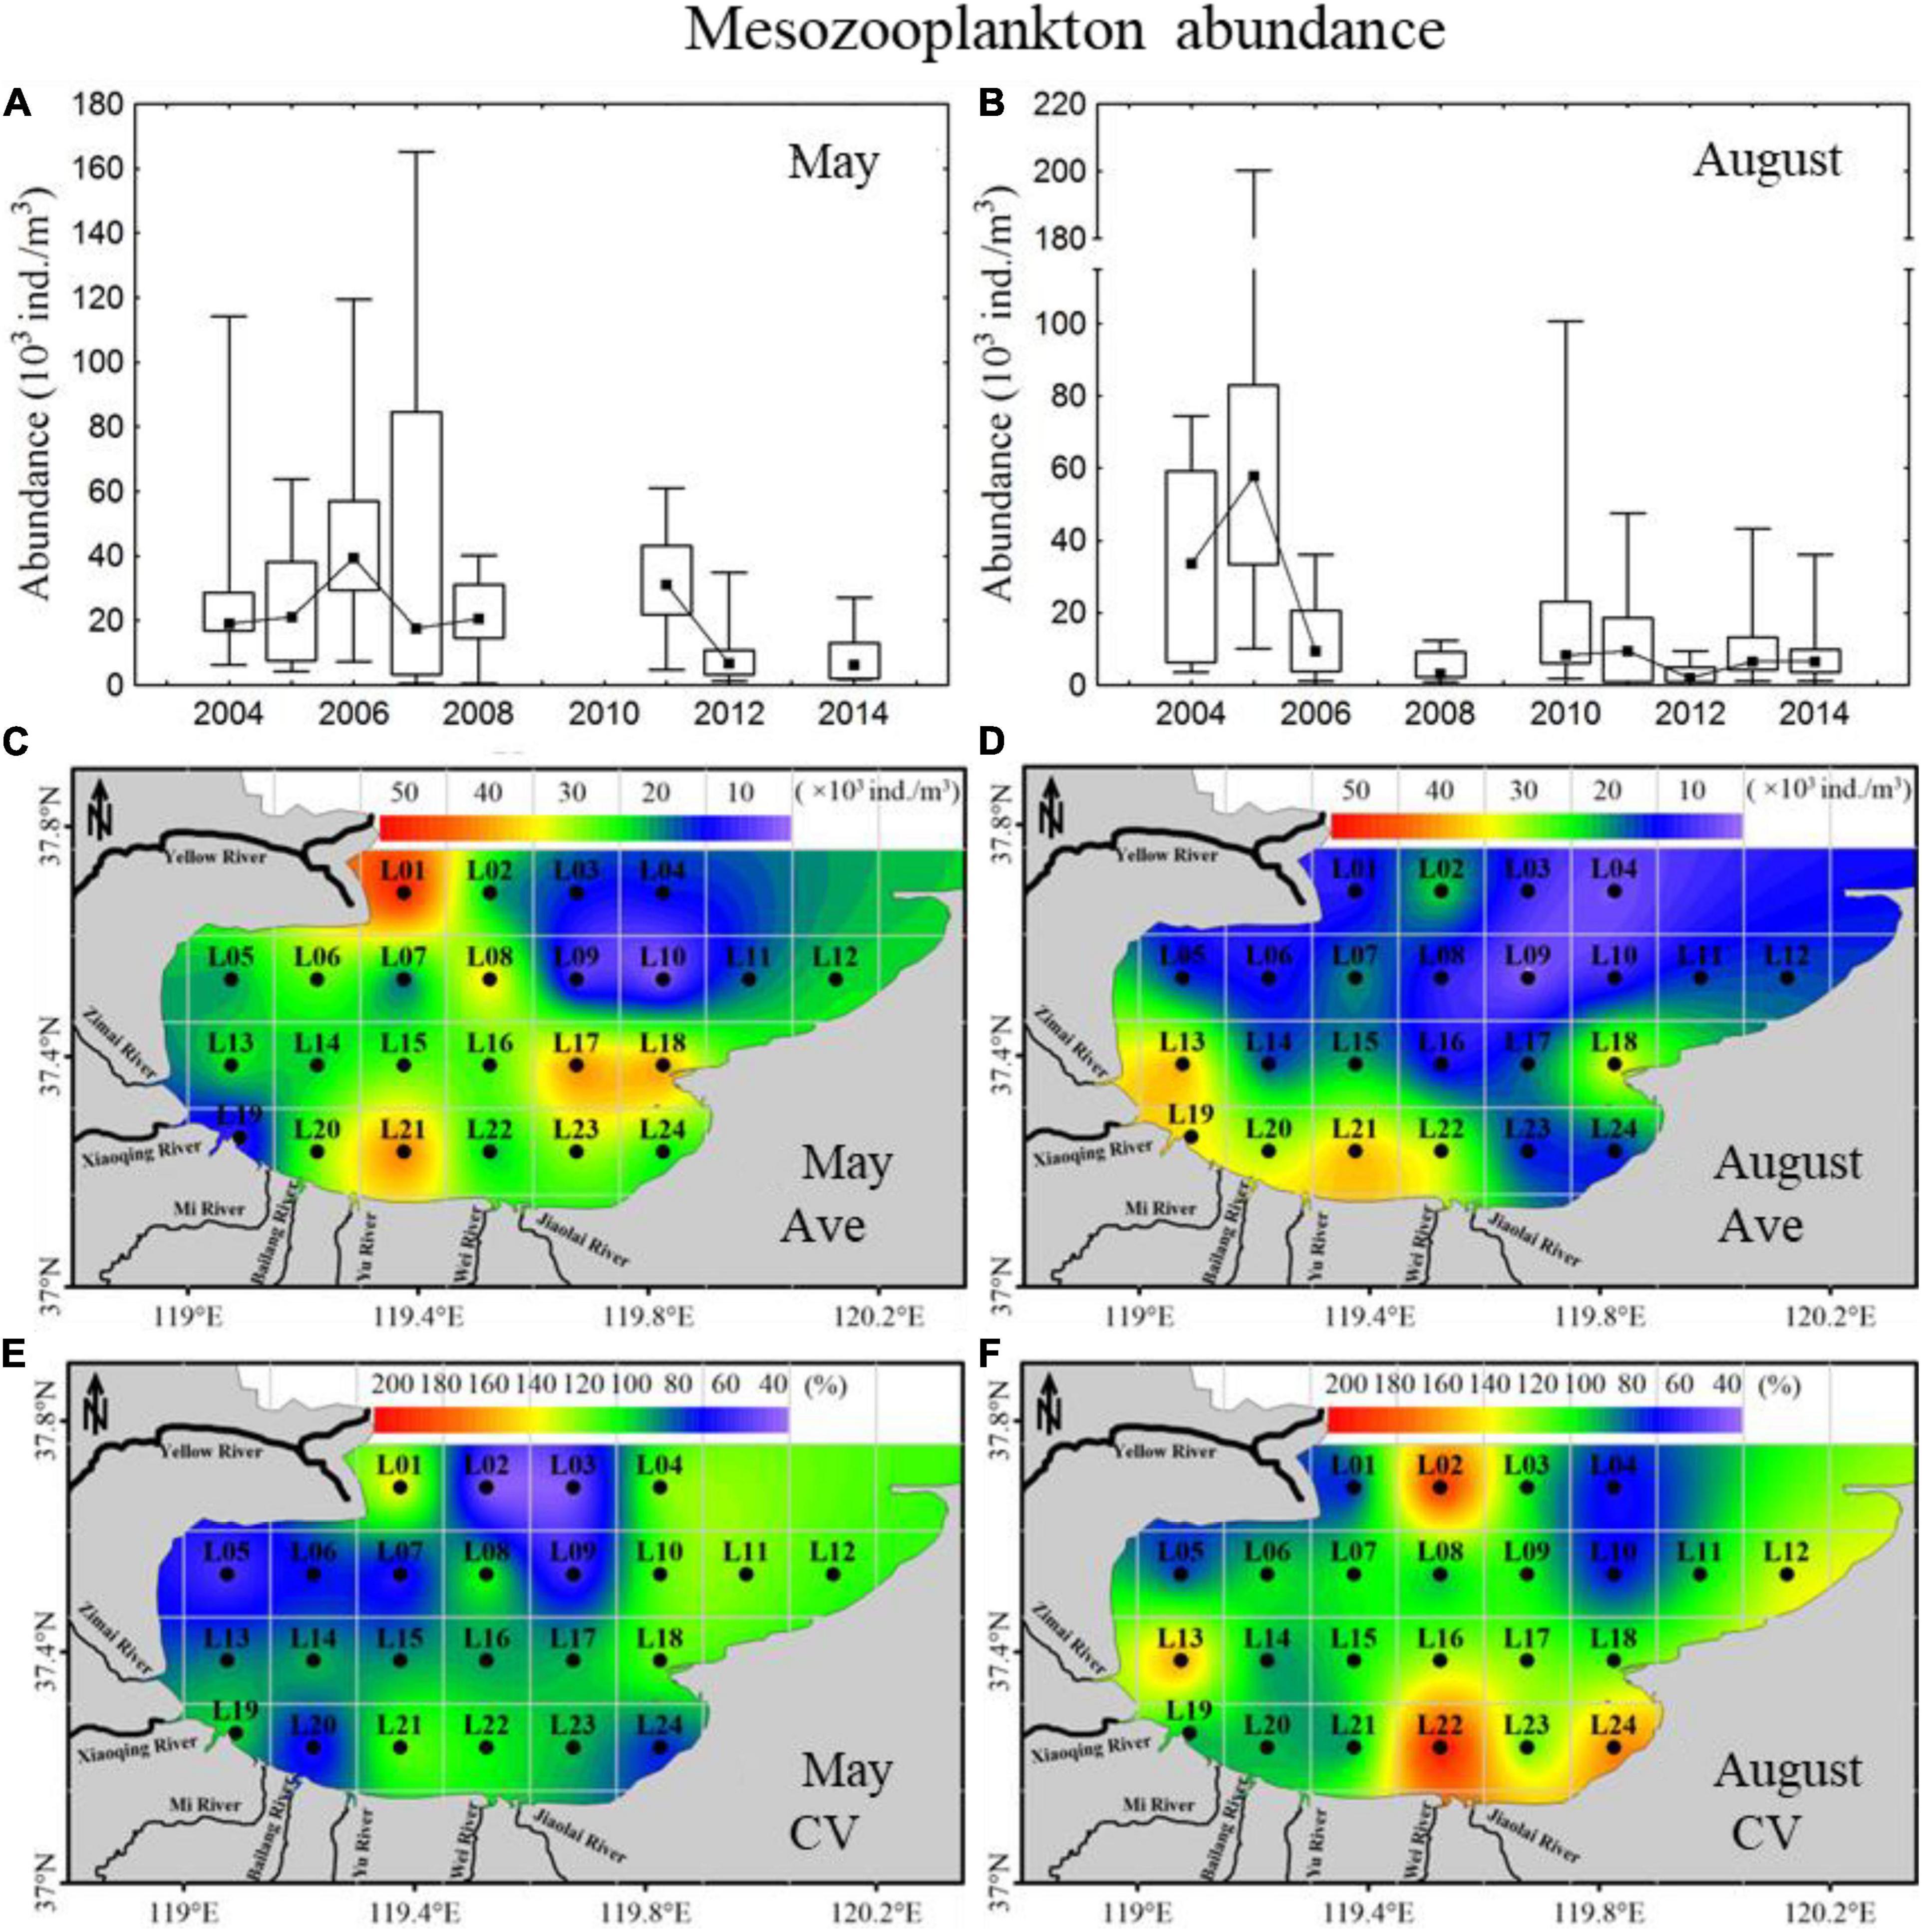
Figure 4. Inter-annual variability and spatial distributions of mesozooplankton abundance in 2004–2014 in Laizhou Bay. (A,B) The lines with dark spots showing medians of abundance in May and August; bar charts showing the interquartile ranges of abundance in May and August. (C–F) Ave and CV showing the average and coefficient of variation of abundance in May and August, respectively.

Figure 5. Results of the MDS analyses of the mesozooplankton community structure in 2004–2014 (the sample of each year is calculated by averaging all the stations in Laizhou Bay). (A) May and (B) August.
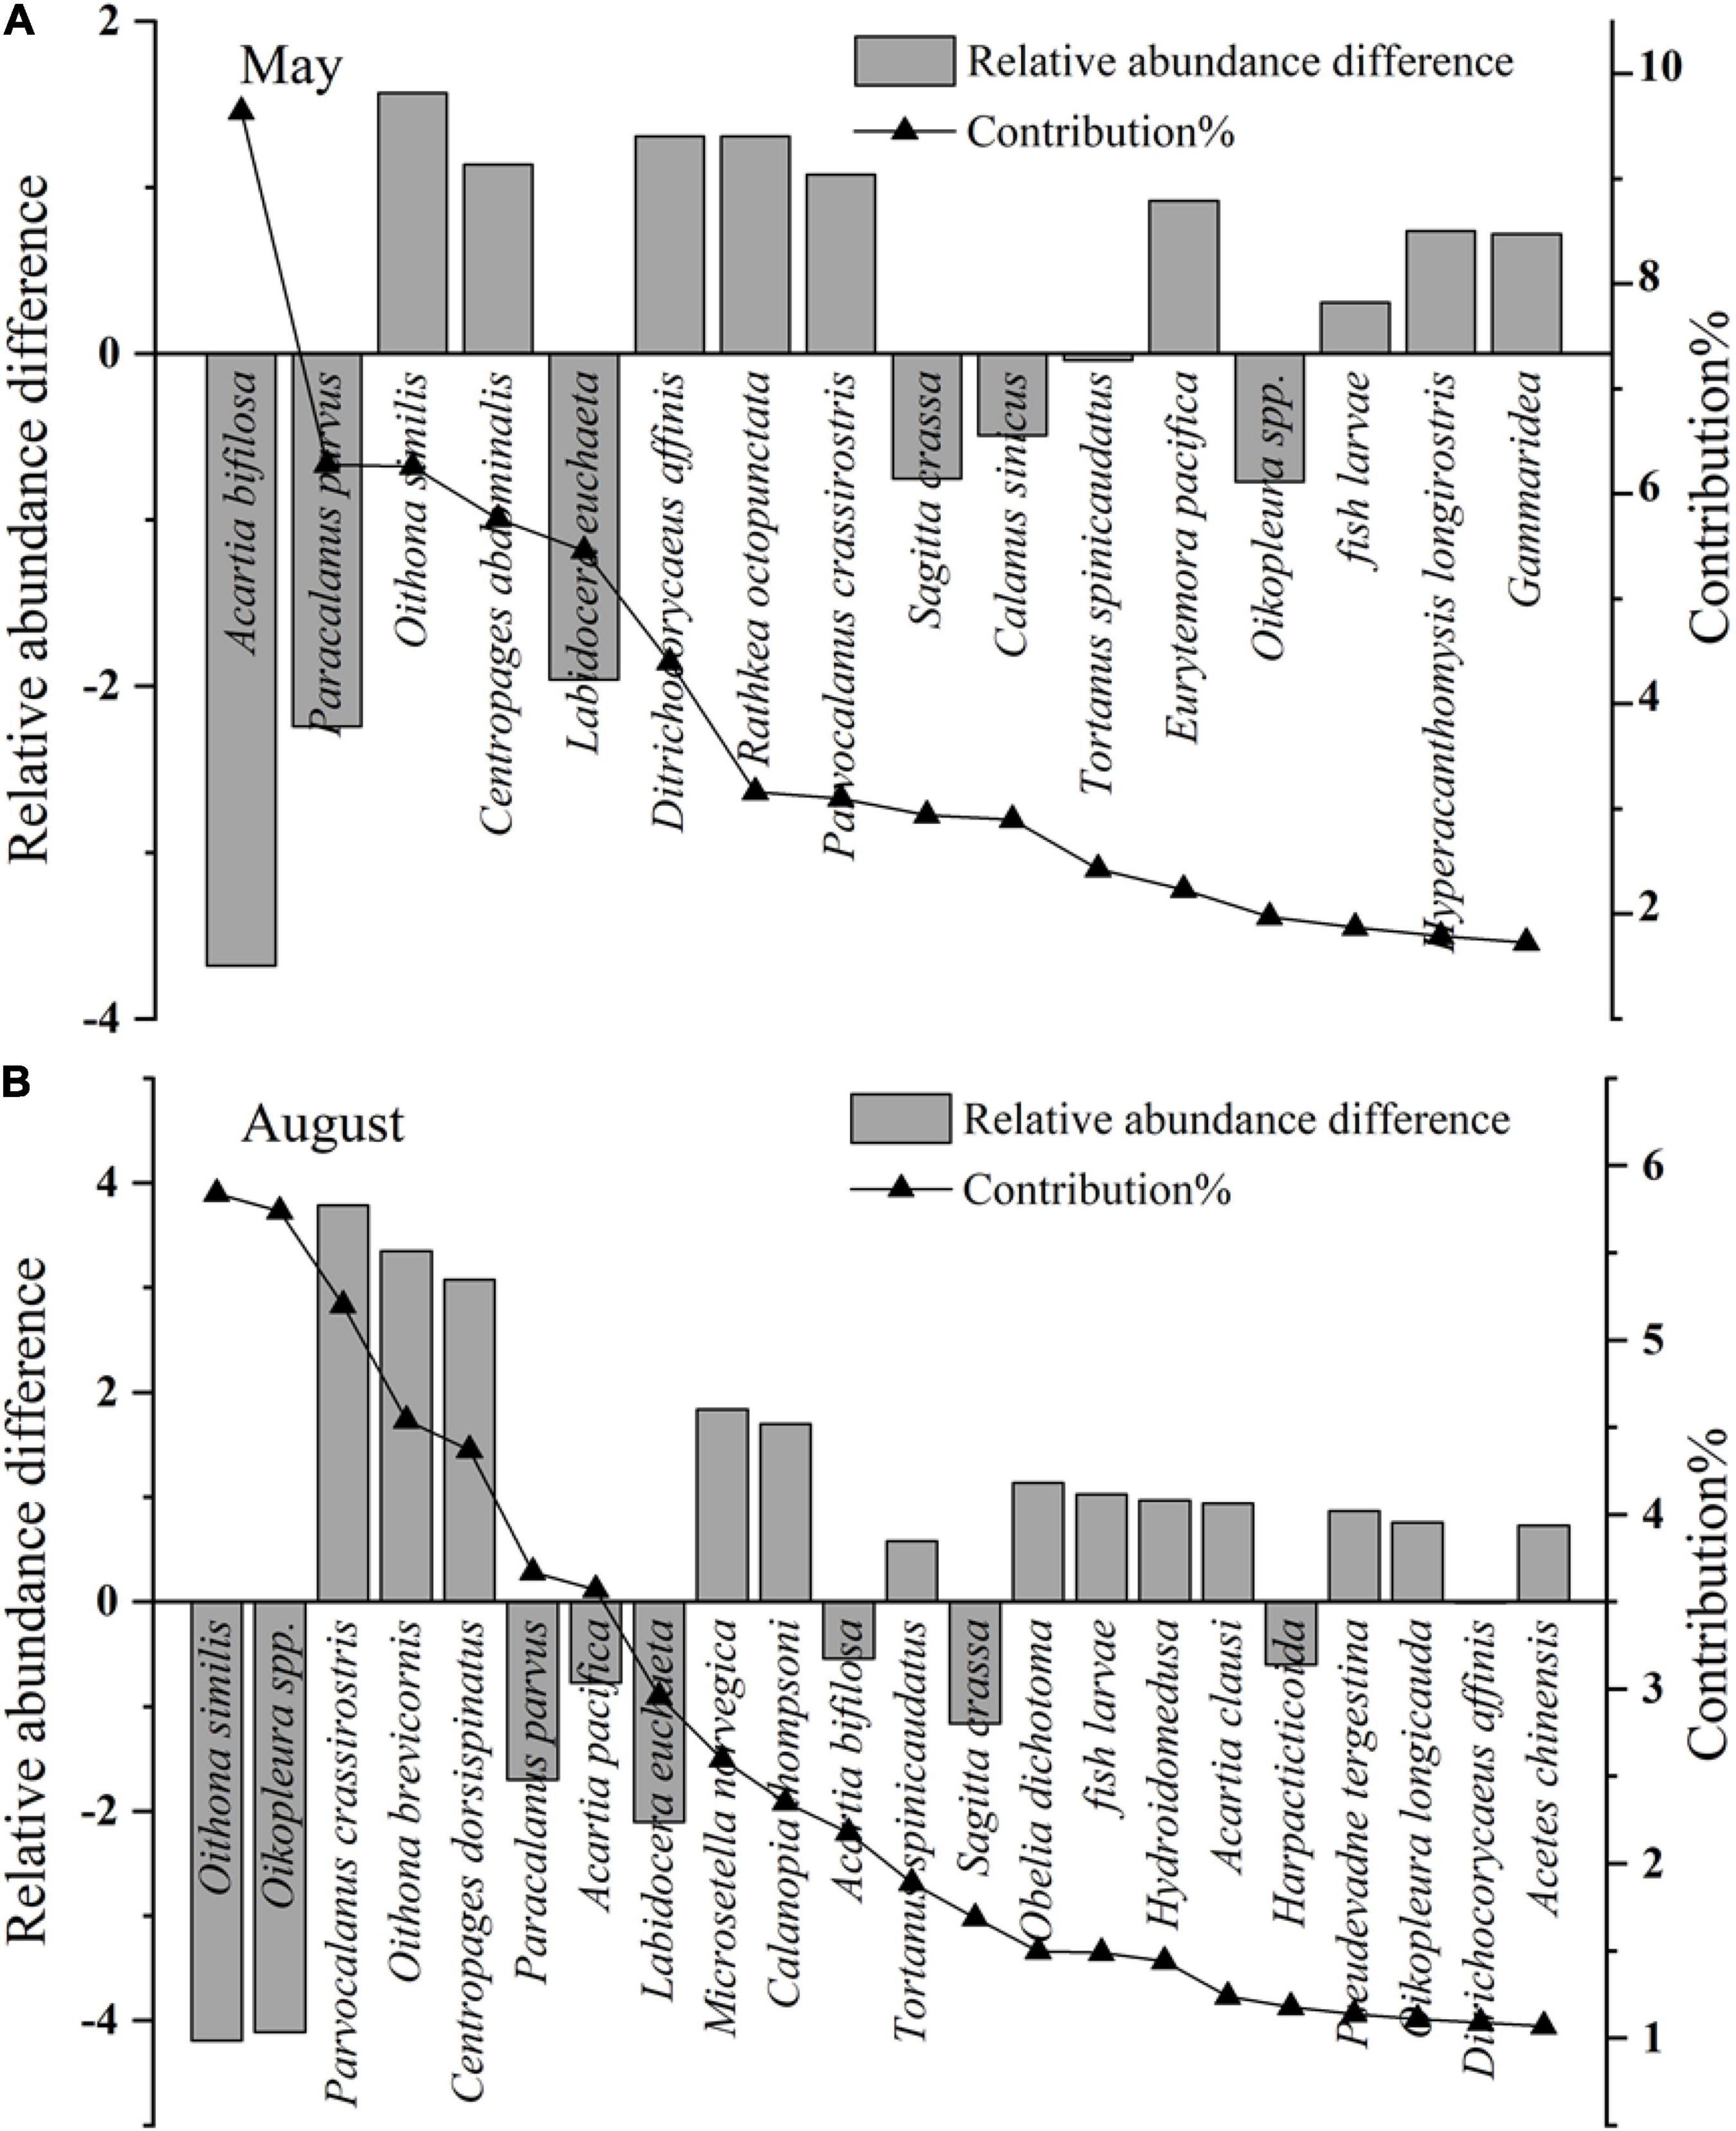
Figure 6. Relative abundance difference and contribution of key species between different mesozooplankton groups. The key species are identified by Simper analysis with species contribution > 1% of mesozooplankton community difference. The relative abundance of key species are transformed by fourth root. (A) The relative abundance difference are calculated by the average abundance of key species in group May 12–14 minus that of group May 04–11, and the positive values represent the key species abundance increase in group May 12–14, while the negative values represent the key species abundance decrease. (B) The relative abundance difference are calculated by the average abundance of key species in group Aug 10–14 minus that of group Aug 04–08, and the positive values represent the key species abundance increase in group Aug 10–14, while the negative values represent the key species abundance decrease.
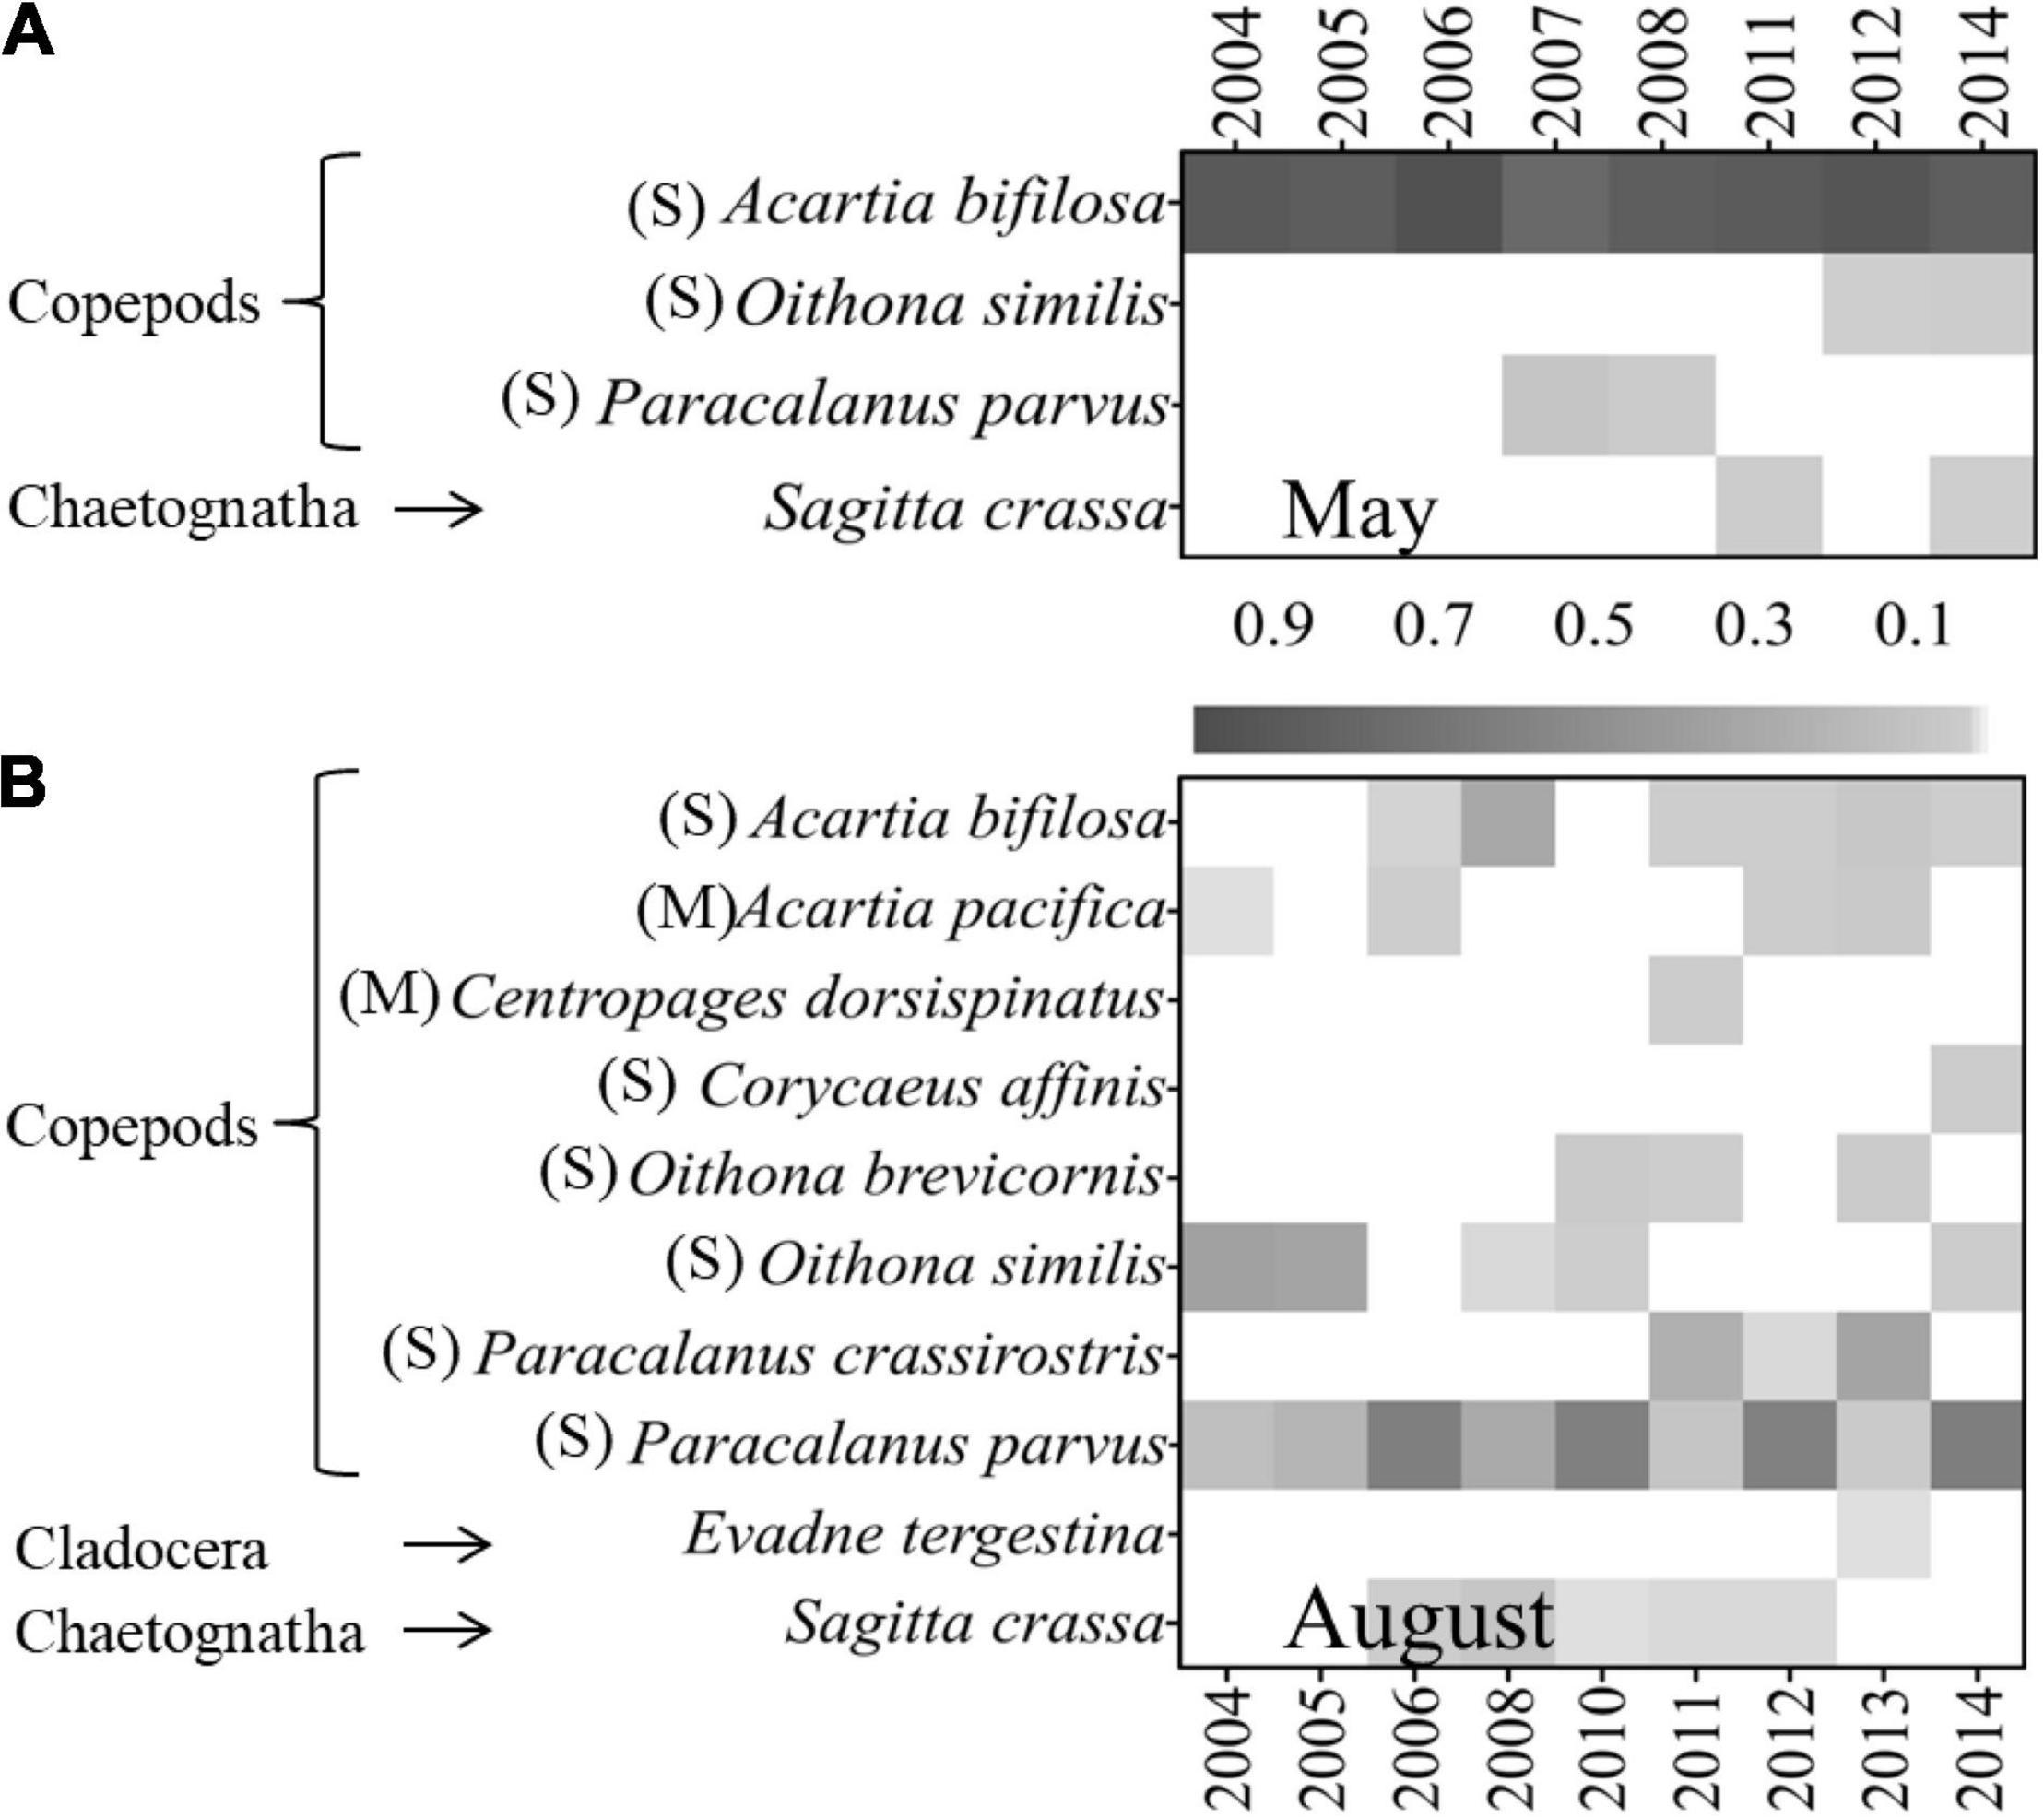
Figure 7. Annual variations of mesozooplankton dominant species and their dominance degree (Y) in (A) May and (B) August in 2004–2014 (M, medium-sized species with body length < 2 mm; S, small-sized species with body length < 1 mm).
In August, mesozooplankton abundance was lower, with an average of 17,926 ind. m–3, than that in May, with an average of 25,155 ind. m–3, and showed more clear annual trends of decrease than in May (Figures 4A,B). The mesozooplankton abundance displayed a significant spatial distribution difference, with higher abundance mainly located in the southwest coastal area, especially in the sea region near the Xiaoqing River (Figure 4D), and presented drastic spatial variability (CV) with high CV on the southern coast and near the Yellow River (Figure 4F). The mesozooplankton community showed clear variations, which could be divided into two groups at a similarity of 55% (ANOSIM significance level of sample statistic = 0.8% and global R = 0.819), group Aug04-08 and Aug10-14 (Figure 5B). In group Aug10-14, the abundance of O. similis, Oikopleura spp., P. parvus, Acartia pacifica, L. euchaeta, A. bifilosa, S. crassa, harpacticticoida and D. affinis decreased, while the abundance of P. crassirostris, Oithona brevicornis, Centropages dorsispinatus, Microsetella norvegica, Calanopia thompsoni, T. spinicaudatus, Obelia dichotoma, fish larva, hydroidomedusa, Acartia clausi, Pseudevadne tergestina, Oikopleura longicauda, and Acetes chinensis increased (Figure 6B). These species contributed 57.9% of the dissimilarity between the two groups (Figure 6B). P. parvus was the most dominant species (Figure 7B). The number of dominant mesozooplankton species in August was much greater than that in May and showed an increasing annual trend (Figure 7B).
In May, the abundance of total mesozooplankton, copepods, pelagic larvae, hydromedusae, A. bifilosa and O. similis showed no significant relationship (p > 0.05) with phytoplankton abundance and environmental factors. The S. crassa displayed a significant positive relationship (p < 0.05) with total phytoplankton, diatoms, and dinoflagellates, and P. parvus presented a significant positive relationship (p < 0.05) with WT and a negative relationship (p < 0.05) with DIN (Table 2).
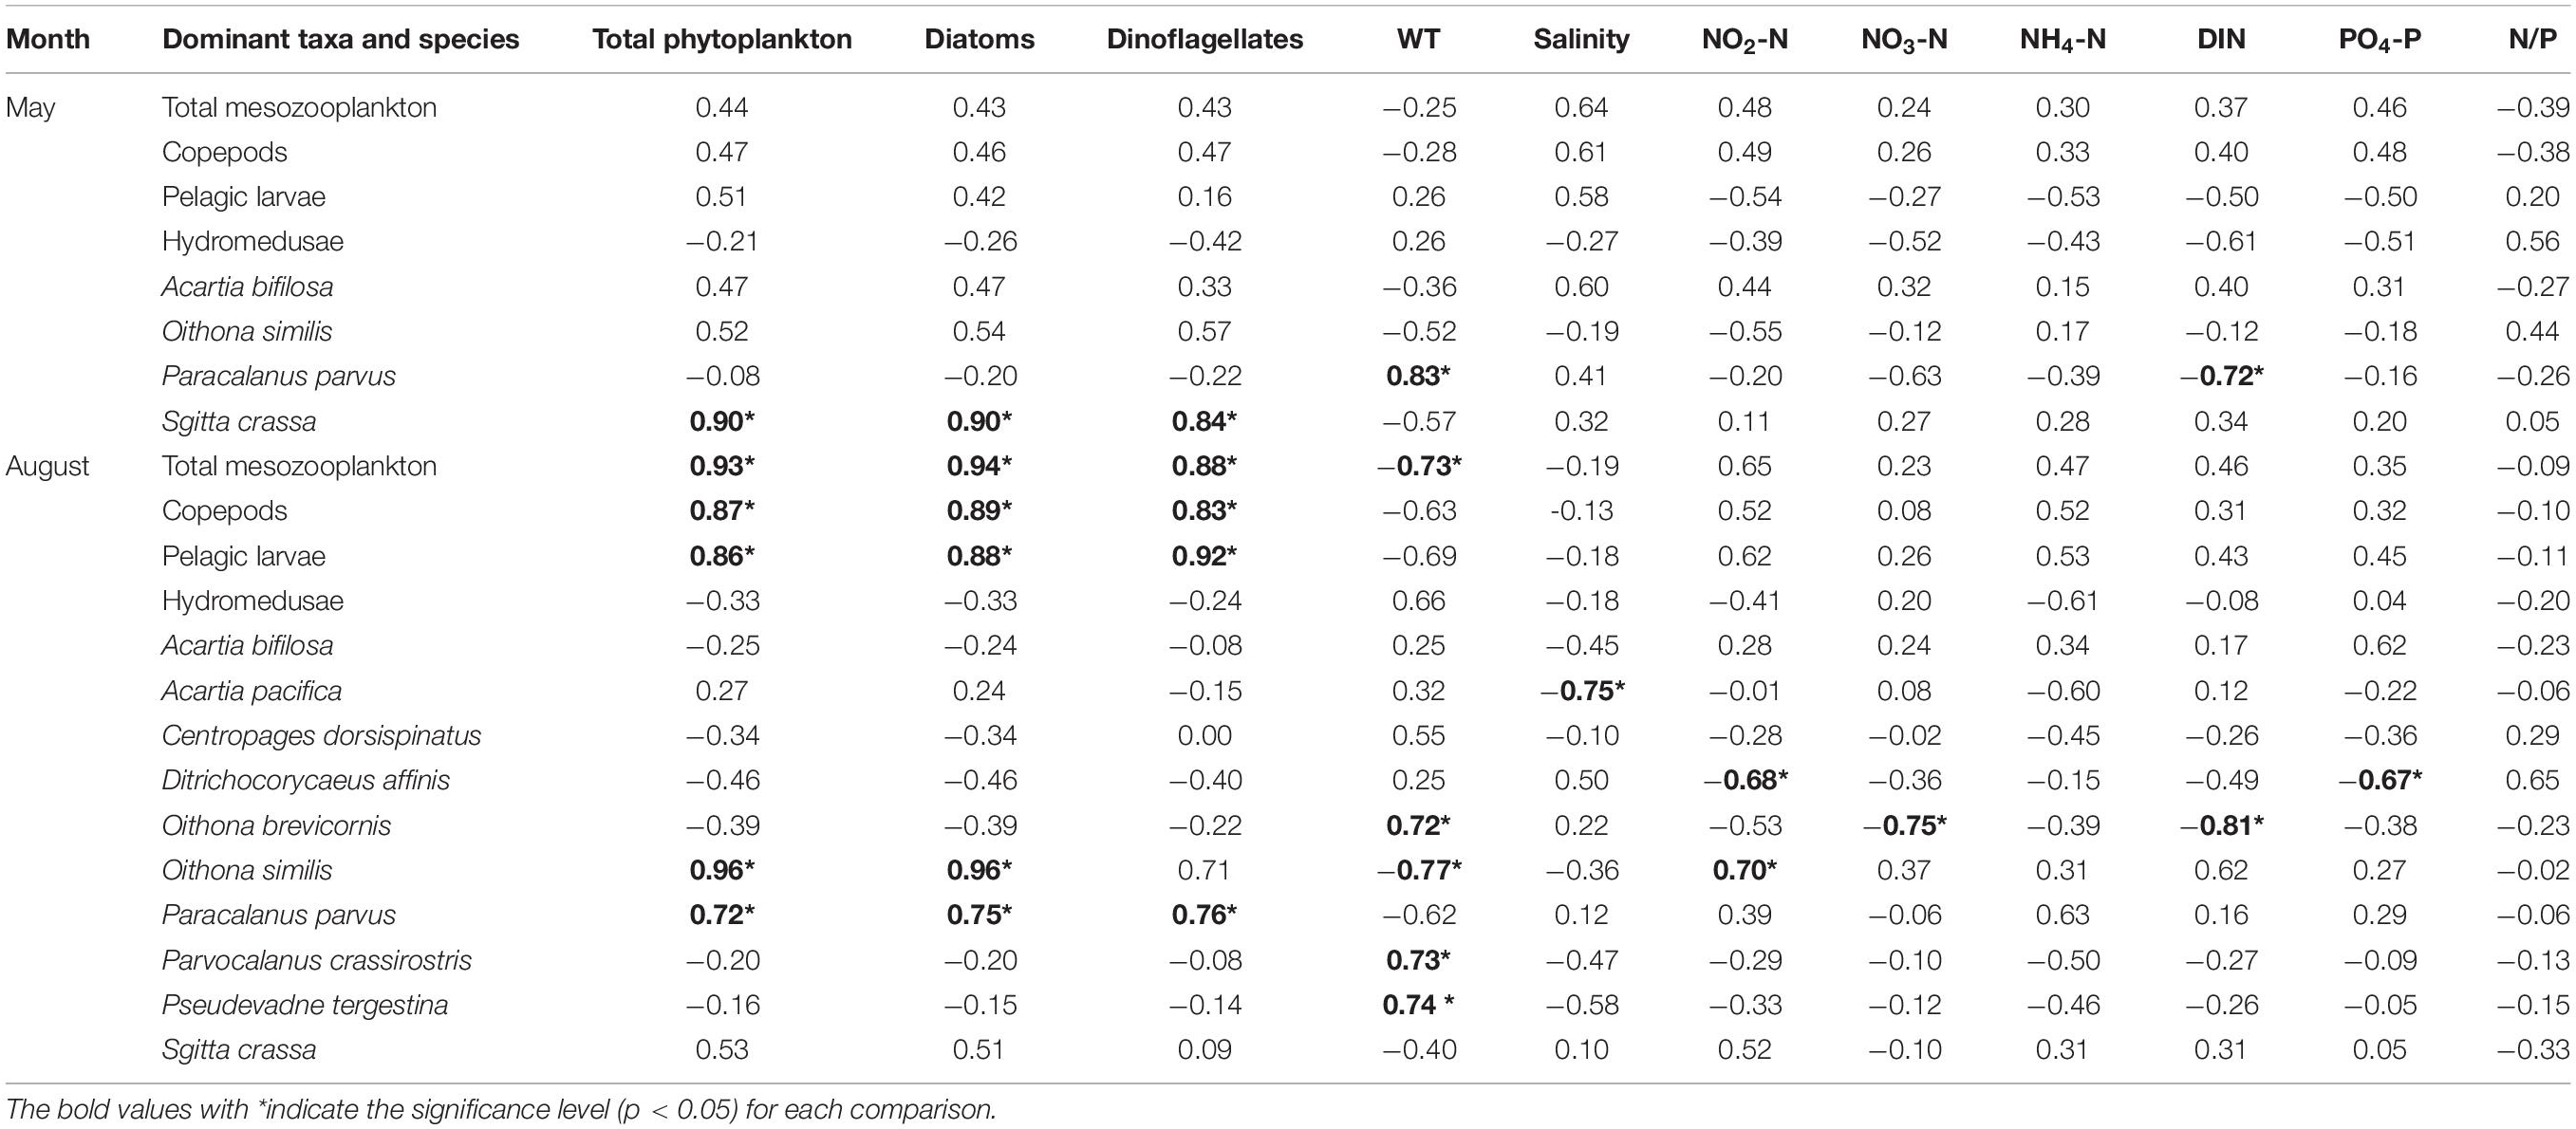
Table 2. Correlations of mesozooplankton abundance and phytoplankton abundance and environmental factors.
In August, the abundance of total mesozooplankton, copepods, pelagic larvae, O. similis and P. parvus presented significant positive relationships (p < 0.05) with total phytoplankton, diatoms and dinoflagellates, indicating cascade effects. WT showed significant negative relationships (p < 0.05) with total mesozooplankton and O. similis but negative relationships (p < 0.05) with O. brevicornis, P. crassirostris, and P. tergestina. Other environmental factors presented no significant relationships (p > 0.05) with mesozooplankton except salinity negative with A. pacifica, NO2-N negative with D. affinis and positive with O. similis, NO3-N and DIN negative with O. similis, and PO4-P negative with D. affinis (Table 2).
The zooplankton assemblage response to nutrient load reduction is mainly achieved and/or influenced by cascading trophic interactions (Jeppesen et al., 2007; Chen et al., 2012), including bottom-up effects driven by phytoplankton and/or microzooplankton (Calbet, 2008; Hart, 2011; Havens and Beaver, 2013; Zamora-Terol et al., 2020), and top-down effects predation by high-trophic-level organisms (Bergman and Bergstrand, 1999; Kornilovs et al., 2001). For example, in Taihu, China, fish predation and Microcystis blooms greatly affected the zooplankton community during the process of de-eutrophication (Chen et al., 2012). In the present study, a relatively weak correlation between environmental factors and mesozooplankton assemblages, and a significant positive correlation between mesozooplankton and phytoplankton (in August) were observed (Table 2), which indicated the influence of phytoplankton abundance on mesozooplankton abundance. We inferred there might be cascading trophic interactions between phytoplankton abundance and mesozooplankton abundance, and which presented some seasonal difference. Here, we focus on discussing the influence of cascading trophic interactions on mesozooplankton assemblage variations, and its seasonal difference.
In the present study, the mesozooplankton abundance presented clear spatial and temporal variations; however, the driving factors might be different between May and August. In August, the mesozooplankton abundance displayed a significant annual decreasing trend (Figure 4B), corresponding to the annual trend of phytoplankton abundance (Figure 2B). In addition, the spatial distributions of mesozooplankton abundance and CV corresponded to that of phytoplankton, with high abundance located in the sea region near the Xiaoqing River (Figures 2D,F, 4D,F). Significant positive relationships (p < 0.05, Table 2) between phytoplankton and mesozooplankton abundance were observed, indicating that phytoplankton abundance is the main factor influencing mesozooplankton abundance variations at both temporal and spatial scales. Our results clearly indicated that the decrease in mesozooplankton abundance in August was the direct response to nutrient load reductions via the classical food chain (nutrient-phytoplankton-mesozooplankton). We inferred the phytoplankton was the main contributor in bottom-up effects in August, which has been widely reported in many productive coastal regions, where the classic and short food chains show more efficient energy transfer toward the upper food web (Ryther, 1969; Calbet and Landry, 2004; Armengol et al., 2019).
In contrast, there was no significant relationship (p > 0.05) between mesozooplankton and phytoplankton abundance in May (Table 2). The non-corresponding spatial distribution patterns and non-correlation annual trends of phytoplankton and mesozooplankton abundance indicated that the variation in mesozooplankton abundance might be influenced by other factors, e.g., the microbial loop and top-down control, rather than phytoplankton. More than 50% of primary production is channeled through the microbial loop, among which microzooplankton play a pivotal role (Calbet and Landry, 2004; Zhang et al., 2006; Armengol et al., 2019). Mesozooplankton, especially copepods, present trophic plasticity by changing their feeding strategies and selective predation to meet their growth demands (Zamora-Terol et al., 2020). The cascading trophic pathways that mesozooplankton adopt might switch between classic food chains and microbial pathways according to the seawater regime trophic status and present different material and energy transfer efficiencies (Armengol et al., 2019). In productive regions, classic and short food chains show more efficient energy transfer toward the upper food web (Ryther, 1969; Armengol et al., 2019), while in oligotrophic regions, microbial pathways present more advantages in compensating for nutrition shortages (Calbet and Landry, 2004; Armengol et al., 2019; Faithfull and Goetze, 2019; Zamora-Terol et al., 2020). Zamora-Terol et al. (2020) found that Temora longicornis, Pseudocalanus spp., Acartia spp. and Centropages hamatus could switched their trophic modes from diatom and dinoflagellate dominated during the spring phytoplankton bloom, to cyanobacteria and heterotrophic prey dominated during the summer period when phytoplankton abundance was relative low. Although in the present study we did not obtain microzooplankton data due to the net mesh, some evidence indicated that the ciliate abundance near the Yellow River was approximately 9 times as high as that in the southern coastal region of Laizhou Bay (Zhang et al., 2002). In the present study, the mesozooplankton abundance in May (average: 25,155 ind m–3) was higher than that in August (average: 17,926 ind m–3), while the phytoplankton abundance presented a low value compared to August (Figures 2C,D). In the shortage of phytoplankton availability, microzooplankton played important contributors to the mesozooplankton diet (Calbet, 2008), supporting the growth and influencing the variation of mesozooplankton on spatial and temporal scales. We speculated that the response of the long-term decrease in mesozooplankton abundance to nutrient load reductions might be related to variations in microzooplankton via microbial pathways.
Additionally, mesozooplankton abundance is controlled by high-trophic-level organisms, such as jellyfish, which mainly prey on mesozooplankton, via the top-down effect pathway. To recover and replenish fishery resources, a jellyfish stock enhancement project was conducted in Shandong Province in recent decades (Jiao et al., 2021). The annual release abundance of jellyfish, mainly Rhopilema esculentum, in Laizhou Bay significantly increased from 0.5 billion in 2004 to 3.5 billion in 2014 (Figure 8). Jellyfish larvae with bell diameters of 5–30 mm were abundantly released in Laizhou Bay in May but intensively recaptured in July, which caused enormous predation pressure on mesozooplankton in May but not in August. In addition, other jellyfish, such as Cyanea nozqkii, Aurelia aurita, and Nemopilema nomurai, which are major mesozooplankton feeders, also displayed increasing trends and bloomed in the Bohai Sea (Dong et al., 2010). Based on these results, we conclude that the increase in jellyfish contributed to some degree to the decrease in mesozooplankton abundance in May by strengthening the top-down effects.
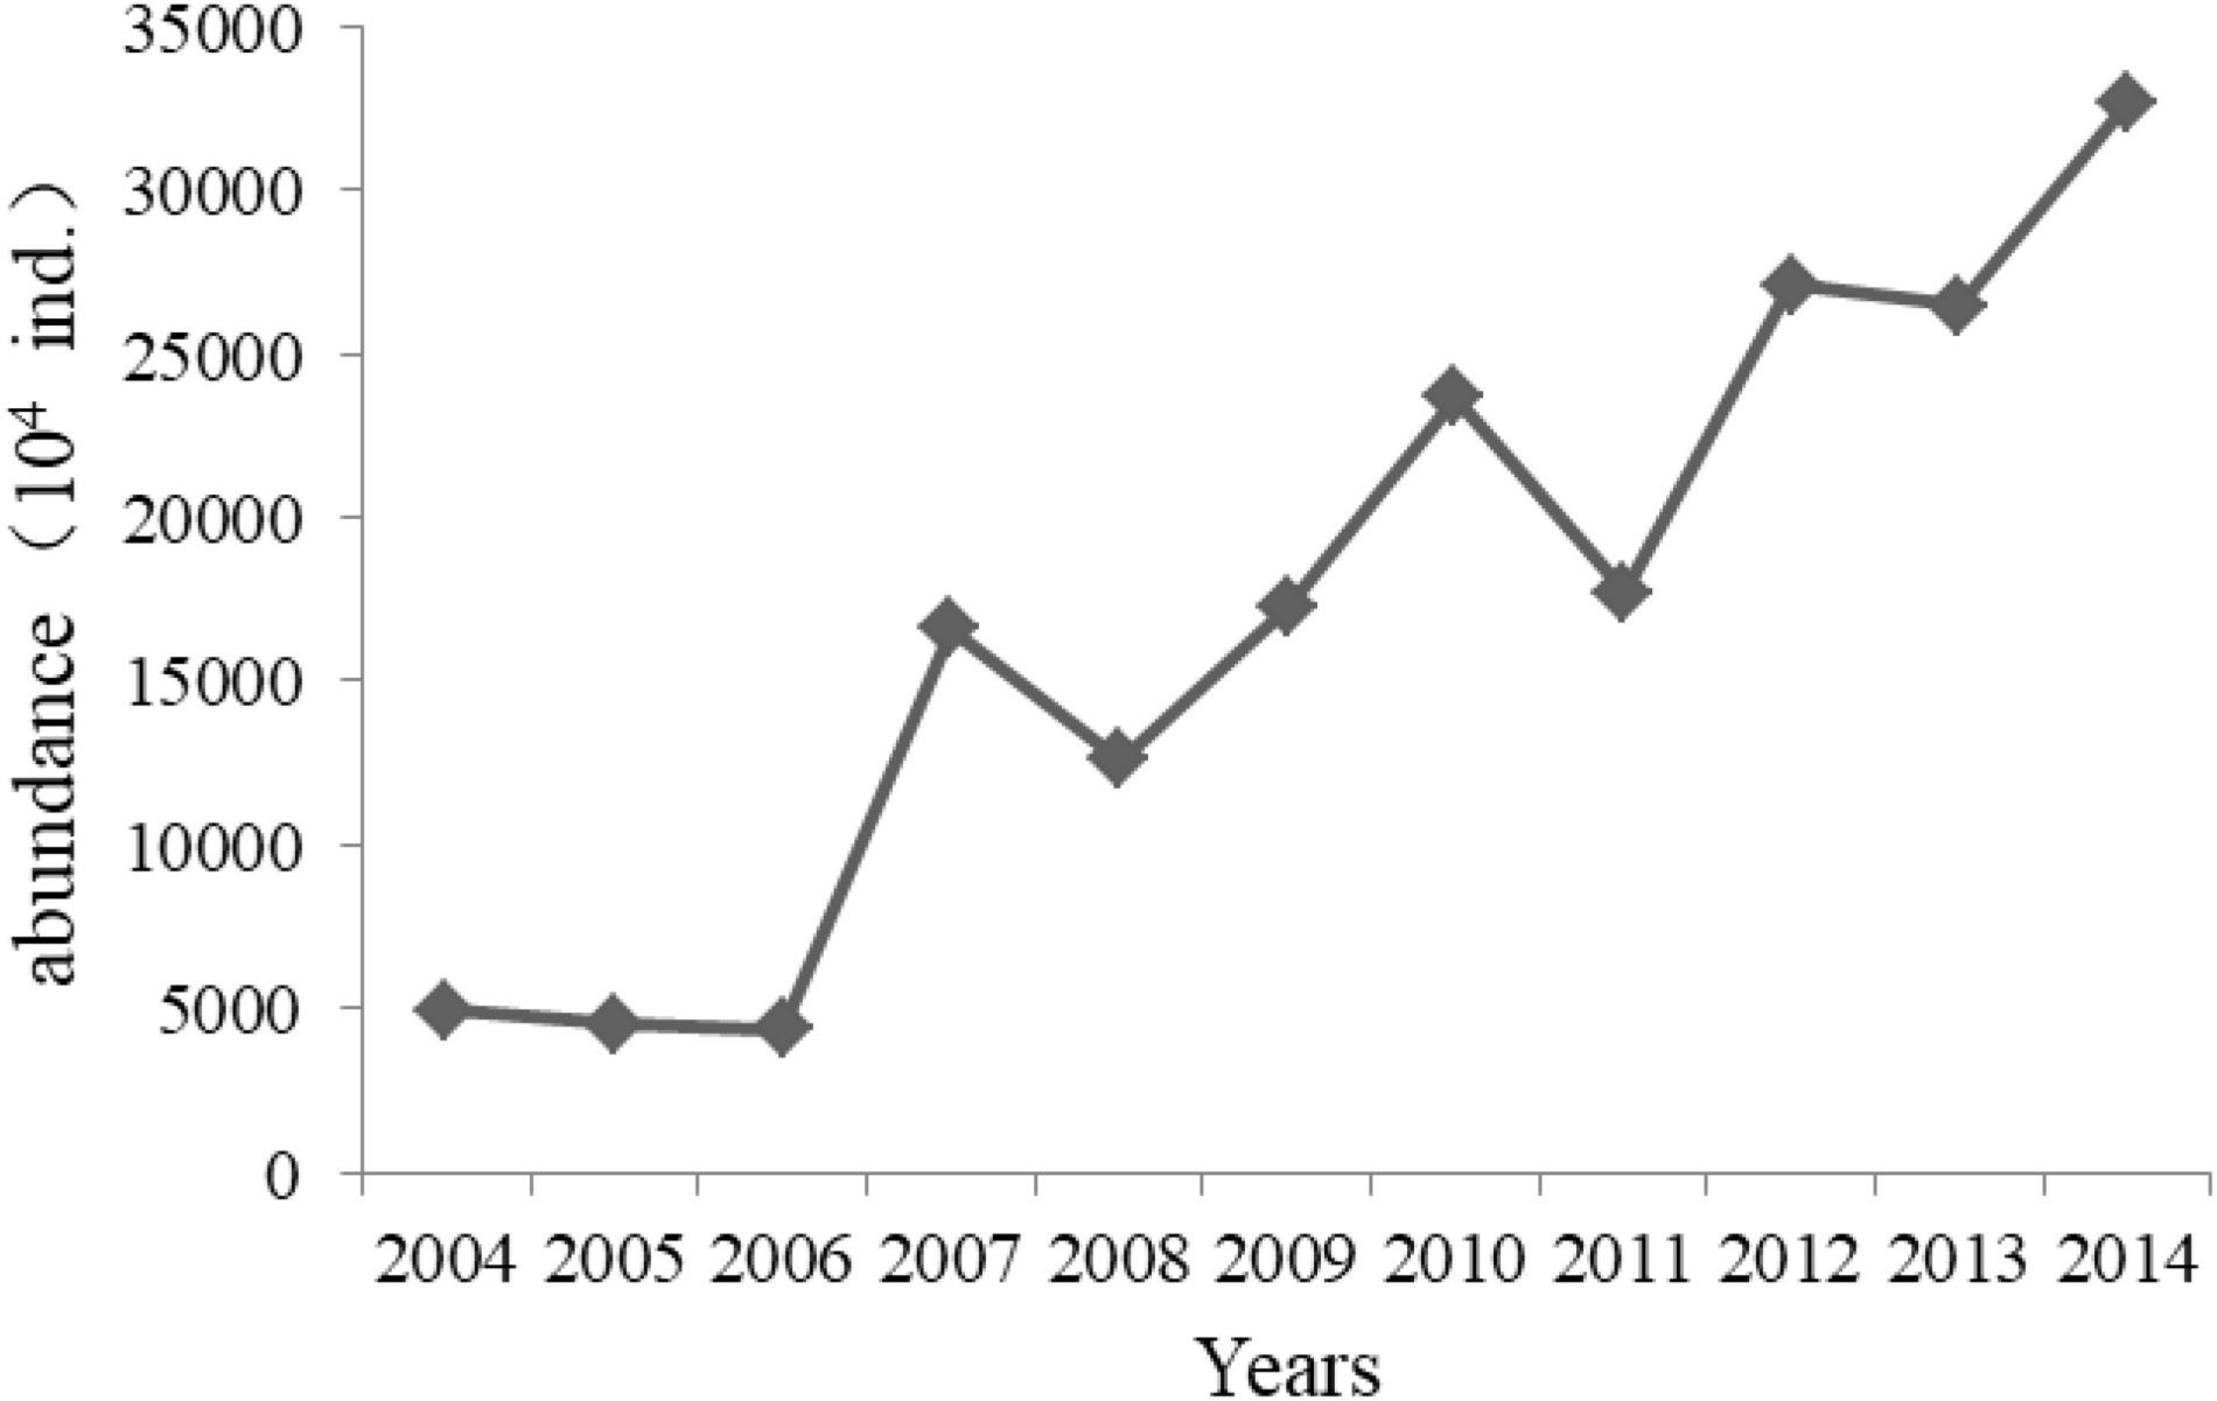
Figure 8. Annual releasing abundance of jellyfish with bell diameter of 5–30 mm in Laizhou Bay 2004–2014 (Data from Aquatic Biological Resources Conservation and Management Center, Shandong Province, China).
An increasing number of studies indicate that ecosystem recovery differs from the degradation process due to the different nonlinear pressure-response trajectories and the interaction of multiple pressures leading to shifts in baseline conditions (Duarte et al., 2008; Riemann et al., 2016). The trajectories of ecosystem recovery may be characterized by hysteresis, reciprocation, and even deviation, and the expectation of reverting ecosystems back to historical reference values by nutrient reduction alone may be unrealistic (Duarte et al., 2008; Taylor et al., 2010). In the present study, some positive recovery of mesozooplankton assemblages in response to nutrient load reductions was observed, e.g., the mesozooplankton diversity and dominant species number showed significant increasing annual trends (Figures 3A,B, 7A,B); in addition, some higher trophic-level animals, such as fish larvae, H. longirostris, gammaridea, and A. chinensis, displayed increasing trends (Figures 6A,B). However, it was also observed that the mesozooplankton community was still dominated by small individual and eutrophication indicator species such as A. bifilosa, P. parvus and O. similis (Figures 7A,B; Zaitsev, 1992; Uye, 1994), and gelatinous zooplankton, e.g., R. octopunctata, O. dichotoma and other hydroidomedusa, showed clear increasing trends (Figures 6A,B). The increase in gelatinous zooplankton and the dominance of small-size and eutrophication indicator species illustrated that the recovery of mesozooplankton assemblages in response to nutrient load reductions in Laizhou Bay was only partial and preliminary.
Although nutrient load reductions in Laizhou Bay mitigate eutrophication to some extent, the DIN concentration is still high, and the alteration in the balance and stoichiometry of different nutrients is serious (Jiang et al., 2018b). The N/P ratio in 2014 was higher than that in 2004, especially in May, which reached 1112.4 due to disproportionate reductions in different nutrients (Jiang et al., 2018b). The growth and development of pelagic organisms are closely associated with the nutrient status and stoichiometry of different nutrients in the water regime, e.g., a high N/P ratio inhibits the growth of Calanus sinicus, Moina mongolica, and Brachionus plicatilis and suppresses the spawning rates and hatching rates of C. sinicus (Chen and Li, 2014). The long-term increases in N/P ratios was associated with compositional shifts in phytoplankton assemblages and HABs (Anderson et al., 2002; Glibert and Burford, 2017), which could influence the mesozooplankton communities. Eutrophication is widely considered one of the most important factors leading to the individual miniaturization trend of plankton. The median zooplankton weight in Tokyo Bay, which is characterized by serious eutrophication, was significantly lower than that in Osaka Bay, which has less eutrophication; within these bays, the median body weight of the zooplankton community was lowest at the innermost eutrophication station and increased gradually offshore (Uye, 1994). In the present study, the still high DIN concentration and seriously skewed N/P balance in Laizhou Bay interfered with or delayed the recovery of mesozooplankton assemblages in response to nutrient load reductions and indicated the need for continuous and improved nutrient reductions; e.g., more attention should be given to the changes in nutrient structure.
Although jellyfish blooms may be a consequence of global oscillations (Condon et al., 2013), the increase in gelatinous zooplankton in coastal regions is widely considered a response to anthropogenic disturbance and climate change (Richardson et al., 2009; Dong et al., 2010; Uye, 2011; Balqis et al., 2019). In the present study, the serious eutrophication parallel to mesozooplankton individual miniaturization in Laizhou Bay favors the growth of gelatinous zooplankton due to their competitive edge of high adaptation capacity, tolerance to hypoxia, and nonvisual predation (Richardson et al., 2009; Uye, 2011). Additionally, the overfishing conducted in Laizhou Bay during the past decades may be another important factor contributing to the increase in gelatinous zooplankton. With the full exploitation and utilization of fishery resources in the Laizhou Bay, the fishery resources in the bay have significantly declined under intensive exploitation, with the biomass of fishery resources declining continuously from 423.6 kg haul–1 h–1 in 1959 to 4.7 kg haul–1 h–1 in 1998, and only 0.5 kg haul–1 h–1 in 2008 (Jin et al., 2013). Such a steep reduction in fishery resources may result in an open ecological niche for gelatinous competitors such as hydromedusa to expand to fill (Uye, 2011). In addition, aquaculture and other marine structures, providing favorable habitat for the benthic stages of jellyfish, may play important roles in contributing to the increase in jellyfish. Purcell et al. (2007) reported the culture structures in Tapong Bay, Taiwan, providing additional substrate for more jellyfish to live and produce and promoting jellyfish blooms, while no jellyfish were observed after the removal of the culture rafts. The shellfish culture areas in the sea region of Laizhou city, located in the southeast coastal region of Laizhou Bay, increased by approximately 32 times from 874 ha. in 2002 to 27 853 ha. in 2011 (Li, 2013), which may provide shaded substrates for polyps and contribute to gelatinous organism growth in Laizhou Bay.
In summary, against the background of a decrease in phytoplankton abundance and partial recovery in phytoplankton community structure due to nutrient load reductions conducted in Laizhou Bay, clear variations in mesozooplankton assemblages were observed in the present study. The response of mesozooplankton abundance to nutrient load reductions varied with the difference of food availability in different season, and likely associated with different cascading trophic interactions. In total, under the influence of nutrient load reductions, some positive recovery signals of the mesozooplankton community were observed. While it should be noted that the recovery of mesozooplankton assemblages in Laizhou Bay is partial and preliminary, and persistent nutrient load reductions combined with other restoration measures, e.g., balancing different nutrients, reducing overfishing, controlling aquaculture scales and human activities, are necessary for eutrophication management and ecosystem recovery.
The raw data supporting the conclusions of this article will be made available by the authors, without undue reservation.
HJ: conceptualization, methodology, and writing. DL: data analysis and writing-reviewing. YM and HX: project administration and funding acquisition. NL and JZ: figure plotting and data analysis. BS, JH, HQ, XS, and SS: sampling and analysis. All authors contributed critically to the drafts and gave final approval for publication.
The research was supported by the Shandong Key Laboratory of Marine Ecological Restoration (Grant No. 201901), the National Key Research and Development Plan of China (Grant Nos. 2018YFC1407601 and 2018YFC1407605), and the Marine Ecological Environment Monitoring and Evaluation Project in Shandong Province, China.
The authors declare that the research was conducted in the absence of any commercial or financial relationships that could be construed as a potential conflict of interest.
All claims expressed in this article are solely those of the authors and do not necessarily represent those of their affiliated organizations, or those of the publisher, the editors and the reviewers. Any product that may be evaluated in this article, or claim that may be made by its manufacturer, is not guaranteed or endorsed by the publisher.
We appreciate the colleagues working on the cruises in Laizhou Bay in 2004–2014.
Anderson, D. M., Glibert, P. M., Burkholder, J. M., Rabalais, N. N., and Nixon, S. W. (2002). Harmful algal blooms and eutrophication: nutrient sources, composition, and consequences. Estuaries 25, 704–726. doi: 10.1016/j.hal.2021.102058
Armengol, L., Calbet, A., Franchy, G., Rodríguez-santos, A., and Hernández-León, S. (2019). Planktonic food web structure and trophic transfer efficiency along a productivity gradient in the tropical and subtropical Atlantic Ocean. Sci. Rep. 9:2044. doi: 10.1038/s41598-019-38507-9
Balqis, S. A. R., Yusoff, F. M., Nishikawa, J., Lindsay, D. J., and Nishida, S. (2019). Influence of environmental parameters on habitat preference of gelatinous zooplankton in various coastal ecosystems, the Straits of Malacca. Reg. Stud. Mar. Sci. 30:100712. doi: 10.1016/j.rsma.2019.100712
Bergman, E., and Bergstrand, E. (1999). Lack of a top-down effect on the zooplankton community after a cyprinid reduction. Hydrobiologia 404, 77–87. doi: 10.1007/978-94-017-2462-3_9
Calbet, A. (2008). The trophic roles of microzooplankton in marine systems. ICES J. Mar. Sci. 65, 325–331. doi: 10.1093/icesjms/fsn013
Calbet, A., and Landry, M. R. (2004). Phytoplankton growth, microzooplankton grazing, and carbon cycling in marine systems. Limnol. Oceanogr. 49, 51–57. doi: 10.4319/lo.2004.49.1.0051
Chen, F., Ye, J., Shu, T., Sun, Y., and Li, J. (2012). Zooplankton response to the lake restoration in the drinking-water source in Meiliang Bay of subtropical eutrophic Lake Taihu, China. Limnologica 42, 189–196. doi: 10.1016/j.limno.2011.11.001
Chen, L., and Li, C. L. (2014). Research advances in ecological stoichiometry of marine plankton. Chin. J. Appl. Ecol. 25, 3047–3055. (in Chinese, with English abstracts)
Chust, G., Allen, J. I., Bopp, L., Schrum, C., Holt, J., Tsiaras, K., et al. (2014). Biomass changes and trophic amplification of plankton in a warmer ocean. Glob. Change Biol. 20, 2124–2139. doi: 10.1111/gcb.12562
Clarke, K. R., and Warwick, R. M. (2001). Change in Marine Communities: An Approach to Statistical Analysis and Interpretation, 2nd Edn. Plymouth: Primer-E Ltd.
Condon, R. H., Duarte, C. M., Pitt, K. A., Robinson, K. L., Lucas, C. H., Sutherland, K. R., et al. (2013). Recurrent jellyfish blooms are a consequence of global oscillations. Proc. Natl. Acad. Sci. U.S.A. 110, 1000–1005. doi: 10.1073/pnas.1210920110
Conley, D. J. (2000). Biochemical nutrient cycles and nutrient management strategies. Hydrobiologia 410, 87–96. doi: 10.1007/978-94-017-2163-9_10
Dong, Z. J., Liu, D. Y., and Keesing, J. K. (2010). Jellyfish blooms in China: dominant species, causes and consequences. Mar. Pollut. Bull. 60, 954–963. doi: 10.1016/j.marpolbul.2010.04.022
Duarte, C. M., Borja, A., Carstensen, J., Elliott, M., Krause-Jensen, D., and Marbà, N. (2013). Paradigms in the recovery of estuarine and coastal ecosystems. Estuar. Coast. 38, 1202–1212. doi: 10.1007/s00442-016-3652-z
Duarte, C. M., Conley, D. J., Carstensen, J., and Sánchez-Camacho, M. (2008). Return to neverland: shifting baselines affect eutrophication restoration targets. Estuaries Coast. 32, 29–36. doi: 10.1007/s12237-008-9111-2
Elser, J. J., Bracken, M. E. S., Cleland, E. E., Gruner, D. S., Harpole, W. S., Hillebrand, H., et al. (2007). Global analysis of nitrogen and phosphorus limitation of primary producers in freshwater, marine and terrestrial ecosystems. Ecol. Lett. 10, 1124–1134. doi: 10.1111/j.1461-0248.2007.01113.x
Faithfull, C., and Goetze, E. (2019). Copepod nauplii use phosphorus from bacteria, creating a short circuit in the microbial loop. Ecol. Lett. 22, 1462–1471. doi: 10.1111/ele.13332
Field, C. B., Behrenfeld, M. J., Randerson, J. T., and Falkowski, P. (1998). Primary production of the biosphere: integrating terrestrial and oceanic components. Science 281, 237–240. doi: 10.1126/science.281.5374.237
Glibert, P. M., and Burford, M. A. (2017). Globally changing nutrient loads and harmful algal blooms: recent advances, new paradigms, and continuing challenges. Oceanography 30, 58–69. doi: 10.5670/oceanog.2017.110
Granéli, E., and Turner, J. T. (2002). Top-down regulation in ctenophore-copepod- ciliate-diatom-phytoflagellate communities in coastal waters: a mesocosm study. Mar. Ecol. Progr. Ser. 239, 57–68. doi: 10.3354/meps239057
Greening, H. S., Cross, L. M., and Sherwood, E. T. (2011). A multiscale approach to seagrass recovery in Tampa Bay, Florida. Ecol. Restor. 29, 82–93. doi: 10.3368/er.29.1-2.82
Hardy, F. J., Shortreed, K. S., and Stockner, J. G. (1986). Bacterioplankton, phytoplankton, and zooplankton communities in a British Columbia coastal lake before and after nutrient reduction. Can. J. Fish. Aquat. Sci. 43, 1504–1514. doi: 10.1139/f86-188
Hart, R. C. (2011). Zooplankton biomass to chlorophyll ratios in relation to trophic status within and between ten South African reservoirs: causal inferences, and implications for biomanipulation. WaterSA 37, 513–522.
Havens, K. E., and Beaver, J. R. (2013). Zooplankton to phytoplankton biomass ratios in shallow Florida lakes: an evaluation of seasonality and hypotheses about factors controlling variability. Hydrobiologia 703, 177–187. doi: 10.1007/s10750-012-1357-9
Jeppesen, E., Meerhoff, M., Jacobsen, B. A., Hansen, R. S., Sondergaard, M., Jensen, J. P., et al. (2007). Restoration of shallow lakes by nutrient control and biomanipulation-the successful strategy varies with lake size and climate. Hydrobiologia 581, 269–285. doi: 10.1007/978-1-4020-6158-5_28
Jiang, H. C., Liu, D. Y., Song, X. K., Ma, Y. Q., Wang, Y. J., Liu, A. Y., et al. (2018a). Response of phytoplankton assemblages to nitrogen reduction in the Laizhou Bay, China. Mar. Pollut. Bull. 136, 524–532. doi: 10.1016/j.marpolbul.2018.09.042
Jiang, H. C., Wang, Y. J., Li, J. H., Tao, H. M., Bai, Y. Y., Su, B., et al. (2018b). Annual variation and spatial distribution of nutrients in Laizhou Bay. Mar. Sci. Bull. 37, 411–423. (in Chinese, with English abstracts),
Jiao, J., Zhang, Y., Zhang, J., Li, L., and Qiu, S. (2021). Jellyfish Rhopilema esculentum stock enhancement in coastal Shangdong Province: review and thinking. Fish. Sci. 40, 141–150. (in Chinese, with English abstracts),
Jin, X. S., Shan, X. J., Li, X. S., Wang, J., Cui, Y., and Zuo, T. (2013). Long-term changes in the fishery ecosystem structure of Laizhou Bay, China. Sci. China (Earth Sci.) 56, 366–374. doi: 10.1007/s11430-012-4528-7
Kornilovs, G., Sidrevics, L., and Dippner, J. W. (2001). Fish and zooplankton interaction in the Central Baltic Sea. ICES J. Mar. Sci. 58, 579–588. doi: 10.1006/jmsc.2001.1062
Lewis, W. M., Wurtsbaugh, W. A., and Paerl, H. W. (2011). Rationale for control of anthropogenic nitrogen and phosphorus in inland waters. Environ. Sci. Technol. 45, 10030–10035. doi: 10.1021/es202401p
Li, C. M. (2013). Preliminary Study on Structure and Characteristics of Bay Scallop Aquaculture Industry in Laizhou Bay. Master dissertation. Qingdao: Ocean University of China, 17–20. (in Chinese, with English abstracts).
Liu, S. M. (2015). Response of nutrient transports to water-sediment regulation events in the Huanghe basin and its impact on the biogeochemistry of the Bohai. J. Mar. Syst. 141, 59–70. doi: 10.1016/j.jmarsys.2014.08.008
Ma, S. S., Xin, F. Y., Cui, Y., and Qiao, X. Y. (2004). Assessment of main pollution matter volume into the sea from Yellow River and Xiaoqing River. Mar. Fish. Res. 25, 47–51. (in Chinese, with English abstracts),
Morrison, G., Greening, H. S., and Yates, K. K. (2011). “Management case study: Tampa Bay, Florida,” in Treatise on Estuarine and Coastal Science, Vol. 11, eds E. Wolanski and D. S. McLusky (Waltham, MA: Academic Press), 31–76.
Paerl, H. W., Scott, J. T., Mccarthy, M. J., Newell, S. E., Gardner, W., Havens, K. E., et al. (2016). It takes two to tango: when and where dual nutrient (N & P) reductions are needed to protect lakes and downstream ecosystems. Environ. Sci. Technol. 50, 10805–10813. doi: 10.1021/acs.est.6b02575
Purcell, J. E., Uye, S., and Lo, W. T. (2007). Anthropogenic causes of jellyfish blooms and their direct consequences for humans: a review. Mar. Ecol. Progr. Ser. 350, 153–174. doi: 10.3354/meps07093
Richardson, A. J., Bakun, A., Hays, G. C., and Gibbons, M. J. (2009). The jellyfish joyride: causes, consequences and management responses to a more gelatinous future. Trends Ecol. Evol. 24, 312–320. doi: 10.1016/j.tree.2009.01.010
Riemann, B., Carstensen, J., Dahl, K., Fossing, H., Hansen, J. W., Jakobsen, H. H., et al. (2016). Recovery of Danish coastal ecosystems after reductions in nutrient loading: a holistic ecosystem approach. Estuar. Coast. 39, 82–97. doi: 10.1007/s12237-015-9980-0
Ryther, J. H. (1969). Photosynthesis and fish production in the sea. The production of organic matter and its conversion to higher forms of life vary throughout the world ocean. Science 166, 72–76. doi: 10.1126/science.166.3901.72
Soetaert, K., Middelburg, J. J., Heip, C., Meire, P., Van Damme, S., and Maris, T. (2006). Long-term change in dissolved inorganic nutrients in the heterotrophic Scheldt estuary (Belgium, The Netherlands). Limnol. Oceanogr. 51, 409–423. doi: 10.4319/lo.2006.51.1_part_2.0409
Strom, S. L., Macri, E. L., and Olson, M. B. (2007). Microzooplankton grazing in the coastal Gulf of Alaska: variations in top-down control of phytoplankton. Limnol. Oceanogr. 52, 1480–1494. doi: 10.4319/lo.2007.52.4.1480
Tang, Q. S., Jin, X. S., Wang, J., Zhuang, Z. M., Cui, Y., and Meng, T. X. (2003). Decadal-scale variations of ecosystem productivity and control mechanisms in the Bohai Sea. Fish. Oceanogr. 12, 223–233. doi: 10.1046/j.1365-2419.2003.00251.x
Taylor, A. H., Allen, J. I., and Clark, P. A. (2002). Extraction of a weak climatic signal by an ecosystem. Nature 387, 253–260. doi: 10.1038/416629a
Taylor, D. I., Oviatt, C. A., and Borkman, D. G. (2010). Non-linear responses of a coastal aquatic ecosystem to large decreases in nutrient and organic loadings. Estuar. Coast. 34, 745–757. doi: 10.1007/s12237-010-9312-3
Uye, S. (1994). Replacement of large copepods by small ones with eutrophication of embayments: cause and consequence. Hydrobiologia 292, 513–519. doi: 10.1007/978-94-017-1347-4_64
Uye, S. (2011). Human forcing of the copepod-fish-jellyfish triangular trophic relationship. Hydrobiologia 666, 71–83. doi: 10.1007/s10750-010-0208-9
Wang, Y. J., Liu, D. Y., Lee, K., Dong, Z. J., Di, B. P., Wang, Y. Q., et al. (2017). Impact of water-sediment regulation scheme on seasonal and spatial variations of biogeochemical factors in the yellow river estuary. Estuar. Coast. Shelf Sci. 198, 92–105. doi: 10.1016/j.ecss.2017.09.005
Zaitsev, Y. P. (1992). Recent changes in the trophic structure of the black sea. Fish. Oceanogr. 1, 180–189. doi: 10.1111/j.1365-2419.1992.tb00036.x
Zamora-Terol, S., Novotny, A., and Winder, A. (2020). Reconstructing marine plankton food web interactions using DNA metabarcoding. Mol. Ecol. 29, 3380–3395. doi: 10.1111/mec.15555
Zhang, W. C., Li, H. B., Xiao, T., Zhang, J., Li, C. L., and Sun, S. (2006). Impact of microzooplankton and copepods on the growth of phytoplankton in the Yellow Sea and East China Sea. Hydrobiologia 553, 357–366. doi: 10.1007/s10750-005-0857-2
Keywords: mesozooplankton, cascading trophic interactions, nutrient reductions, Laizhou Bay, recovery
Citation: Jiang H, Liu D, Ma Y, Su B, Liu N, Zhang J, He J, Qin H, Song X, Sun S and Xing H (2022) Decadal Response of Mesozooplankton Assemblages to Nutrient Load Reductions in Laizhou Bay, China. Front. Mar. Sci. 9:849739. doi: 10.3389/fmars.2022.849739
Received: 06 January 2022; Accepted: 22 February 2022;
Published: 25 April 2022.
Edited by:
Donald F. Boesch, University of Maryland Center for Environmental Science (UMCES), United StatesReviewed by:
Meilin Wu, South China Sea Institute of Oceanology (CAS), ChinaCopyright © 2022 Jiang, Liu, Ma, Su, Liu, Zhang, He, Qin, Song, Sun and Xing. This is an open-access article distributed under the terms of the Creative Commons Attribution License (CC BY). The use, distribution or reproduction in other forums is permitted, provided the original author(s) and the copyright owner(s) are credited and that the original publication in this journal is cited, in accordance with accepted academic practice. No use, distribution or reproduction is permitted which does not comply with these terms.
*Correspondence: Yuanqing Ma, ZXJtYTA0MDJAMTYzLmNvbQ==
Disclaimer: All claims expressed in this article are solely those of the authors and do not necessarily represent those of their affiliated organizations, or those of the publisher, the editors and the reviewers. Any product that may be evaluated in this article or claim that may be made by its manufacturer is not guaranteed or endorsed by the publisher.
Research integrity at Frontiers
Learn more about the work of our research integrity team to safeguard the quality of each article we publish.