 Dake Chen
 Jinhai Zheng
 Chi Zhang
 Dawei Guan3
 Yuan Li
- 1Nanjing Hydraulic Research Institute, Nanjing, China
- 2State Key Laboratory of Hydrology-Water Resources and Hydraulic Engineering, Nanjing, China
- 3College of Harbour, Coastal and Offshore Engineering, Hohai University, Nanjing, China
Cohesive sediment is ubiquitous in aquatic systems, which often forms fractal aggregates due to cohesive and adhesive forces between particles and is generally eroded as aggregates at low bed shear stresses. The erosion of aggregates plays a significant role in cohesive sediment dynamics. However, the effects of fractal bed aggregation on the erosion threshold of sediment have not been well understood. The incipient motion condition of cohesive sediment is investigated, in which particle aggregation is taken into account by employing the fractal theory and the van der Waals force between particles. A formula for the critical shear stress for surface erosion of cohesive sediments composed of fractal aggregates is developed based on the balance analysis of momentums acting on an aggregate in the bed surface. The developed formula has been successfully applied to different kinds of cohesive sediment. The fractal dimension is found as a function of the solid volume fraction and the diameter of primary particles. The contribution rate of the effective weight of aggregate to the erosion threshold of cohesive sediment is quantified.
Introduction
Cohesive sediments are composed primarily of clay- and silt-sized particles usually mixed with organic matters, microorganisms, etc. They are ubiquitous in aquatic systems and have significant ecological functions, including habitats for benthic organisms, stores for organic carbon, and sites of biogeochemical cycling (Grabowski et al., 2011). Therefore, the transport of cohesive sediments plays an essential role in water quality, aquatic ecosystem, and morphological evolution (Hua et al., 2019; Yuan et al., 2021). Erosion of the sedimentary bed is one of the controlling processes of sediment dynamics (Winterwerp et al., 2012; Li et al., 2021; Li, Zhang, Dai, et al., 2022). It has been attracting numerous interests and studied extensively.
The erodibility of bed sediment is usually measured by an erosion threshold and an erosion rate (Forsberg et al., 2018; Li et al., 2022). The erosion threshold describes the critical hydrodynamic condition that initiates sediment erosion, while the erosion rate specifies the mass of sediment eroded per unit time once the threshold is exceeded. The erosion rate is often a function of the erosion threshold (Mehta et al., 1989; Sanford & Maa, 2001). Therefore, accurately determining the erosion threshold is one of the most crucially important steps in modeling the erosion process of cohesive sediments and solving those erosion-related problems.
There are mainly two approaches to the threshold of cohesive sediments. One adopts an empirical method, which relates the erosion threshold of cohesive sediments to their physicomechanical properties, usually based on experimental results. Relations have been proposed between the critical shear stress or critical velocity and dry (wet) bulk density (Owen, 1970; Thorn & Parsons, 1980; Ockenden & Delo, 1988; Amos et al., 2004; Xu et al., 2015), total water content (Jacobs et al., 2011), water content of the mud matrix (Dickhudt et al., 2011); solid volume fraction (Kusuda et al., 1984), solid/void volume ratio (Wu et al., 2017), plasticity index (Smerdon & Beasley, 1959; Jacobs et al., 2011), yield stress (Zhang & Yu, 2017; Zhang et al., 2017), etc. Some have been widely used, e.g., Smerdon and Beasley (1959) and Wu et al. (2017). The other approach attempts to quantify the cohesive force between particles and study the erosion threshold of cohesive sediment by analyzing the balance between hydrodynamic forces that cause erosion and the forces within the sediment that resist it. Several formulae for the critical shear stress or velocity have been developed by this approach. A few threshold curves have been also proposed for cohesive sediment based on those formulae, which are similar to the Shields curve but sort according to the consolidation degree. Detailed introductions of this approach and the formulae for the critical shear stress and critical velocity based on this approach have been given by Chen et al. (2018).
According to current studies, cohesive sediment usually forms aggregates due to cohesive and adhesive forces between particles. Field and laboratory observations have indicated that cohesive sediment in unidirectional flow is generally eroded aggregate-by-aggregate at low bed shear stresses and in form of large chunks of sediment masses being removed from the bed at high bed shear stresses (Thomsen & Gust, 2000; Amos et al., 2003; Sharif, 2003; Righetti & Lucarelli, 2007; Grabowski et al., 2011; Forsberg et al., 2018; Perkey et al., 2020). The former mode of erosion is referred to as surface erosion or aggregate erosion, and the latter is called mass erosion or bulk erosion (Winterwerp & Van Kesteren, 2004; Mehta, 2014).
Experimental studies have verified that the eroded aggregates from the bed surface are an important component of the flocs typically observed in water bodies in aquatic systems (Righetti & Lucarelli, 2007; Forsberg et al., 2018). The eroded aggregates can transport in suspension or bedload on the order of tens of meters to many kilometers under the right conditions (Schieber et al., 2010; Perkey et al., 2020). Therefore, erosion of bed aggregates plays a significant role in cohesive sediment dynamics as it affects not only the water-bed boundary but also the subsequent transport and settling of the eroded materials (McAnally & Mehta, 2000; McAnally & Mehta, 2002; Amos et al., 2003; Chang et al., 2006; Forsberg et al., 2018). The characteristics of erosion, transport and settling of bed aggregates are considerably different from that of the fine particles composing the aggregates (Amos et al., 2003; Roberts et al., 2003; Forsberg et al., 2018; Perkey et al., 2020). This could significantly alter the fate of fine sediments in the aquatic systems and further influence the geomorphology and aquatic ecosystem. However, the examination of the erosion and transport processes for bed aggregates remains largely unknown, which limits the progress of elaborate simulation of cohesive sediment transport processes.
Besides, the strength resisting erosion in cohesive sediment has been believed principally coming from the cohesive and adhesive forces, and the effective gravity of cohesive sediment is often considered negligible (Yang & Wang, 1995; Righetti & Lucarelli, 2007; Debnath & Chaudhuri, 2010; Chen et al., 2021). However, for aggregate erosion of cohesive sediment, how much the effective gravity contributes to the erosion threshold has been a mystery, and no one has quantified it.
The present study investigates the erosion threshold of cohesive sediment composed of fractal aggregates in which fractal bed aggregation is taken into account. The fractal theory is employed to describe the sediment aggregates, and the van der Waals attraction is introduced to quantify the cohesive force. The contribution of the effective weight of aggregate to the erosion threshold of cohesive sediment is quantified. The theoretical consideration, formula application, and discussion are described in the following sections.
Theoretical consideration
Fractal aggregates of cohesive sediment
Fine-grained cohesive particles often form complex structures called aggregates due to cohesive and adhesive forces among the sediment. Such aggregates are of much larger size and smaller density than that of primary particles. Krone (1963, 1986) and Partheniades (1965) were the pioneers of studying the structure of cohesive sediment aggregates. They found the primary particles of cohesive sediment form small aggregates and the small aggregates join together to form large aggregates, which would further combine to form larger aggregates, etc. Krone introduced the order of aggregation concept to describe the structure of aggregates and showed experimentally that aggregate density, yield strength, and viscosity depend on the order of aggregation. The findings of the two pioneers and many subsequent studies have suggested the structure of cohesive sediment aggregates can be often approximately described in terms of self-similarity (Kranenburg, 1994; Chen & Eisma, 1995; Winterwerp, 1998).
The fractal theory initially proposed by Mandelbrot (1967, 1975) provides a useful mathematical framework for describing those structures of self-similarity. According to the fractal theory, the number of primary particles in an aggregate is related to its size and the fractal dimension:
where Np is the number of primary particles in the aggregate; da is the aggregate size; dp is the diameter of the primary particles; and F is the fractal dimension characterizing the space-filling ability of the aggregates (Logan & Kilps, 1995; Serra & Casamitjana, 1998). The value of F varies from 1 to 3, with F=1 meaning linear self-similarity; F=2 meaning area self-similarity; and F=3 meaning volumetric self-similarity. Aggregates with a low fractal dimension close to 1 are tenuous and stringy. The pure coalescence of particles is of a fractal dimension F equaling 3 (Kranenburg, 1994). Suspended macroflocs in the estuary and coastal environments usually have a fractal dimension around 2 (Khelifa & Hill, 2006; Son & Hsu, 2009; Fall et al., 2021).
Following the fractal theory, the effective density of an aggregate is given as a function of the size of the aggregate, the size and density of the primary particles (Kranenburg, 1994):
where ρa is the density of the aggregate; ρs and ρ are the densities of primary particles and water, respectively.
By analyzing the conservation of mass of a captured bed, the average density of aggregates could be estimated by:
where φs is the volume fraction of primary particles in the bed (i.e., the solid volume fraction or the solid volumetric concentration) and φa is the volume fraction of aggregates in the bed (i.e., the volumetric concentration of aggregates). Considering equations (2) and (3), the representative aggregate size of a cohesive bed is given by:
Cohesion force
Interparticle attraction is the defining characteristic of cohesive sediment. There are two principal forms of attraction, cohesion and adhesion, which are essential to the discussion of erodibility. According to the definition by Israelachvili (1985), cohesion describes attraction between chemically similar particles, while adhesion is used to describe the attraction between particles of dissimilar media. In terms of soil and sediment erosion research, cohesion usually refers to the bonding between fine-grained particles by electrochemical forces, and adhesion refers to the binding of sediment components by an additional inter-particle substance, such as organic polymers or iron oxides, via cation bridging or polymerization (Grabowski et al., 2011). In this study, we particularly focus on cohesive force between particles induced by electrochemical actions. The adhesive force due to the presence of additional media, e.g., organic matters and biofilms, is not taken into account.
Deriagin and Malkin (1950) confirmed the existence of cohesive forces between quartz particles by the experiment of cross-quartz fibers. They found the cohesive force between two particles scales with the particle diameter. After Deriagin and Malkin, numerous researchers found that the cohesive force not only scales with particle diameter but also is enhanced by the increasing compactness degree of sediment. Researchers including Tang (1963); Yang and Wang (1995); Li et al. (1995); Dou (2000); Zuo et al. (2017); Chen et al. (2018), etc., used a power function of the ratio of the dry bulk density of cohesive sediment to its stable dry bulk density (i.e., the dry bulk density of the sediment when it gets fully consolidated) to reflect the effect of the compactness of sediment. However, this method has two defects, limiting the application of the formulae for the erosion threshold based on those empirical functions for the cohesive force. One defect is although the stable dry bulk density is clear in the physical meaning, it is difficult to determine its value in practice accurately. A minor mistake of the stable dry bulk density would induce a massive error in the erosion threshold. The second defect is according to those studies mentioned above, the exponent of the power function seems not a constant but varies between 2 and 10.
The van der Waals attraction has been believed to be the fundamental source of cohesion caused by electrochemical actions (Han, 1982; Lick et al., 2004; Righetti & Lucarelli, 2007; Ternat et al., 2008). The van der Waals forces are intermolecular forces arising from the instantaneous dipole-induced dipole interactions among adjacent apolar atoms and molecules. Independently but similarly, Han (1982) and Israelachvili (1985) proposed the expression for the van der Waals force between two spherical particles by integrating the van der Waals forces between molecules in the two particles:
where dp is the diameter of cohesive particles; lΔ is the separation distance between the two particles (i.e., the smallest distance between the surfaces of the particles); Ah is the Hamaker constant which reflects the strength of the van der Waals force.
Some researchers also considered the additional water pressure induced by the overlapping of the bound water layers as a fake cohesive force (Dou, 1962; Han, 1982; Dou, 2000; Zhang, 2012; Zuo et al., 2017). The fine-grained particles usually carry a negative electric charge on their surfaces. The electric charge on a particle surface attracts the surrounding water molecules to form a so-called bound water layer coating the particle. The bound water does not transmit hydrostatic pressure. Therefore, when two bound water layers overlap, the water pressure would induce an additional force acting on the overlapping area. This kind of additional force has been verified by the experiment with cross-quartz fibers (Dou, 1962; Dou, 2000). However, the relative magnitude between the additional force and the cohesive force induced by electrochemical actions has not been quantified. Besides, most of the existing erosion tests of cohesive sediments were conducted in small-depth water flumes. Therefore, the additional force induced by water pressure is not taken into account in this study.
Back to the van der Waals force between particles, studies have shown it is a short-range force with the effective acting range typically around 0.1 µm, being on the same order of magnitude as the thickness of the bound water layer (Han, 1982; Chien & Wan, 1999; Mehta, 2014; Hoath, 2016). Han (1982) pointed out that the van der Waals force is negligible when the separation distance between the two particles is beyond twice the thickness of the bound water layer. Accordingly, the van der Waals force is only significant between two contacted particles with the bound water layer overlapping. The average separation distance between contacted particles decreases with the increasing compactness degree of cohesive sediment, with the average van der Waals forces between contacted particles increasing with the increasing compactness degree. However, it is difficult to determine the average separation distance between two contacted particles accurately. This makes it impossible to apply Eq. (5) in cohesive sediment directly.
Although the average separation distance between two contacted particles is difficult to determine, the average separation distance between neighboring particles could be obtained. From a geometrical consideration, the average center-to-center distance between neighboring particles, s, in cohesive sediment could be computed by (Yang & Wang, 1995; Chauchat et al., 2013):
According to Eq. (6), the average separation distance between neighboring particles is given by s−dp=dp(φs−1/3−1) , showing its value decreases with increasing compactness degree of cohesive sediment. Considering the solid volume fraction is in the range of 0.05 - 0.35 (a typical range for cohesive sediment), the average separation distance between neighboring particles, (s−dp ), is on the same order of magnitude as the particle diameter, far beyond the effective acting range of the van der Waals force. This means the van der Waals force is not always effective between neighboring particles, which is expectable as not all the neighboring particles are contacted with each other because of the structure of aggregates, especially in a newly deposited sediment.
According to the above analysis, the dimensionless average separation distance between two contacted particles, lΔ/δ (where δ is the thickness of the bound water layer), and the dimensionless average separation distance between neighboring particles, (s−dp)/dp=φs−1/3−1 , are two measures of the compactness degree of sediment. As a first approximation, the two dimensionless average separation distances are assumed proportional:
where η is a coefficient. By substituting Eqs. (6) and (7) into Eq. (5), the average van der Waals force between two contacted particles in cohesive sediment is obtained:
Analysis of incipient motion of aggregates
Consider a horizontal cohesive sediment bed exposed to unidirectional flow and an aggregate located at the water-bed interface as presented in Figure 1. The stability of the aggregate depends on the balance of the hydrodynamic forces (i.e., the drag and lift forces of the overlying flow) and the erosion-resisting forces (i.e., the submerged weight of the aggregate and the cohesive forces). The aggregate is assumed a rigid body to possess a physically recognizable identity considering the entrainment of aggregates into flow is usually completed instantaneously. The movement initiation of aggregates usually comes from a rotation around a pivot. The momentum balance for the critical condition of the incipient motion of the aggregate leads to the following equation:
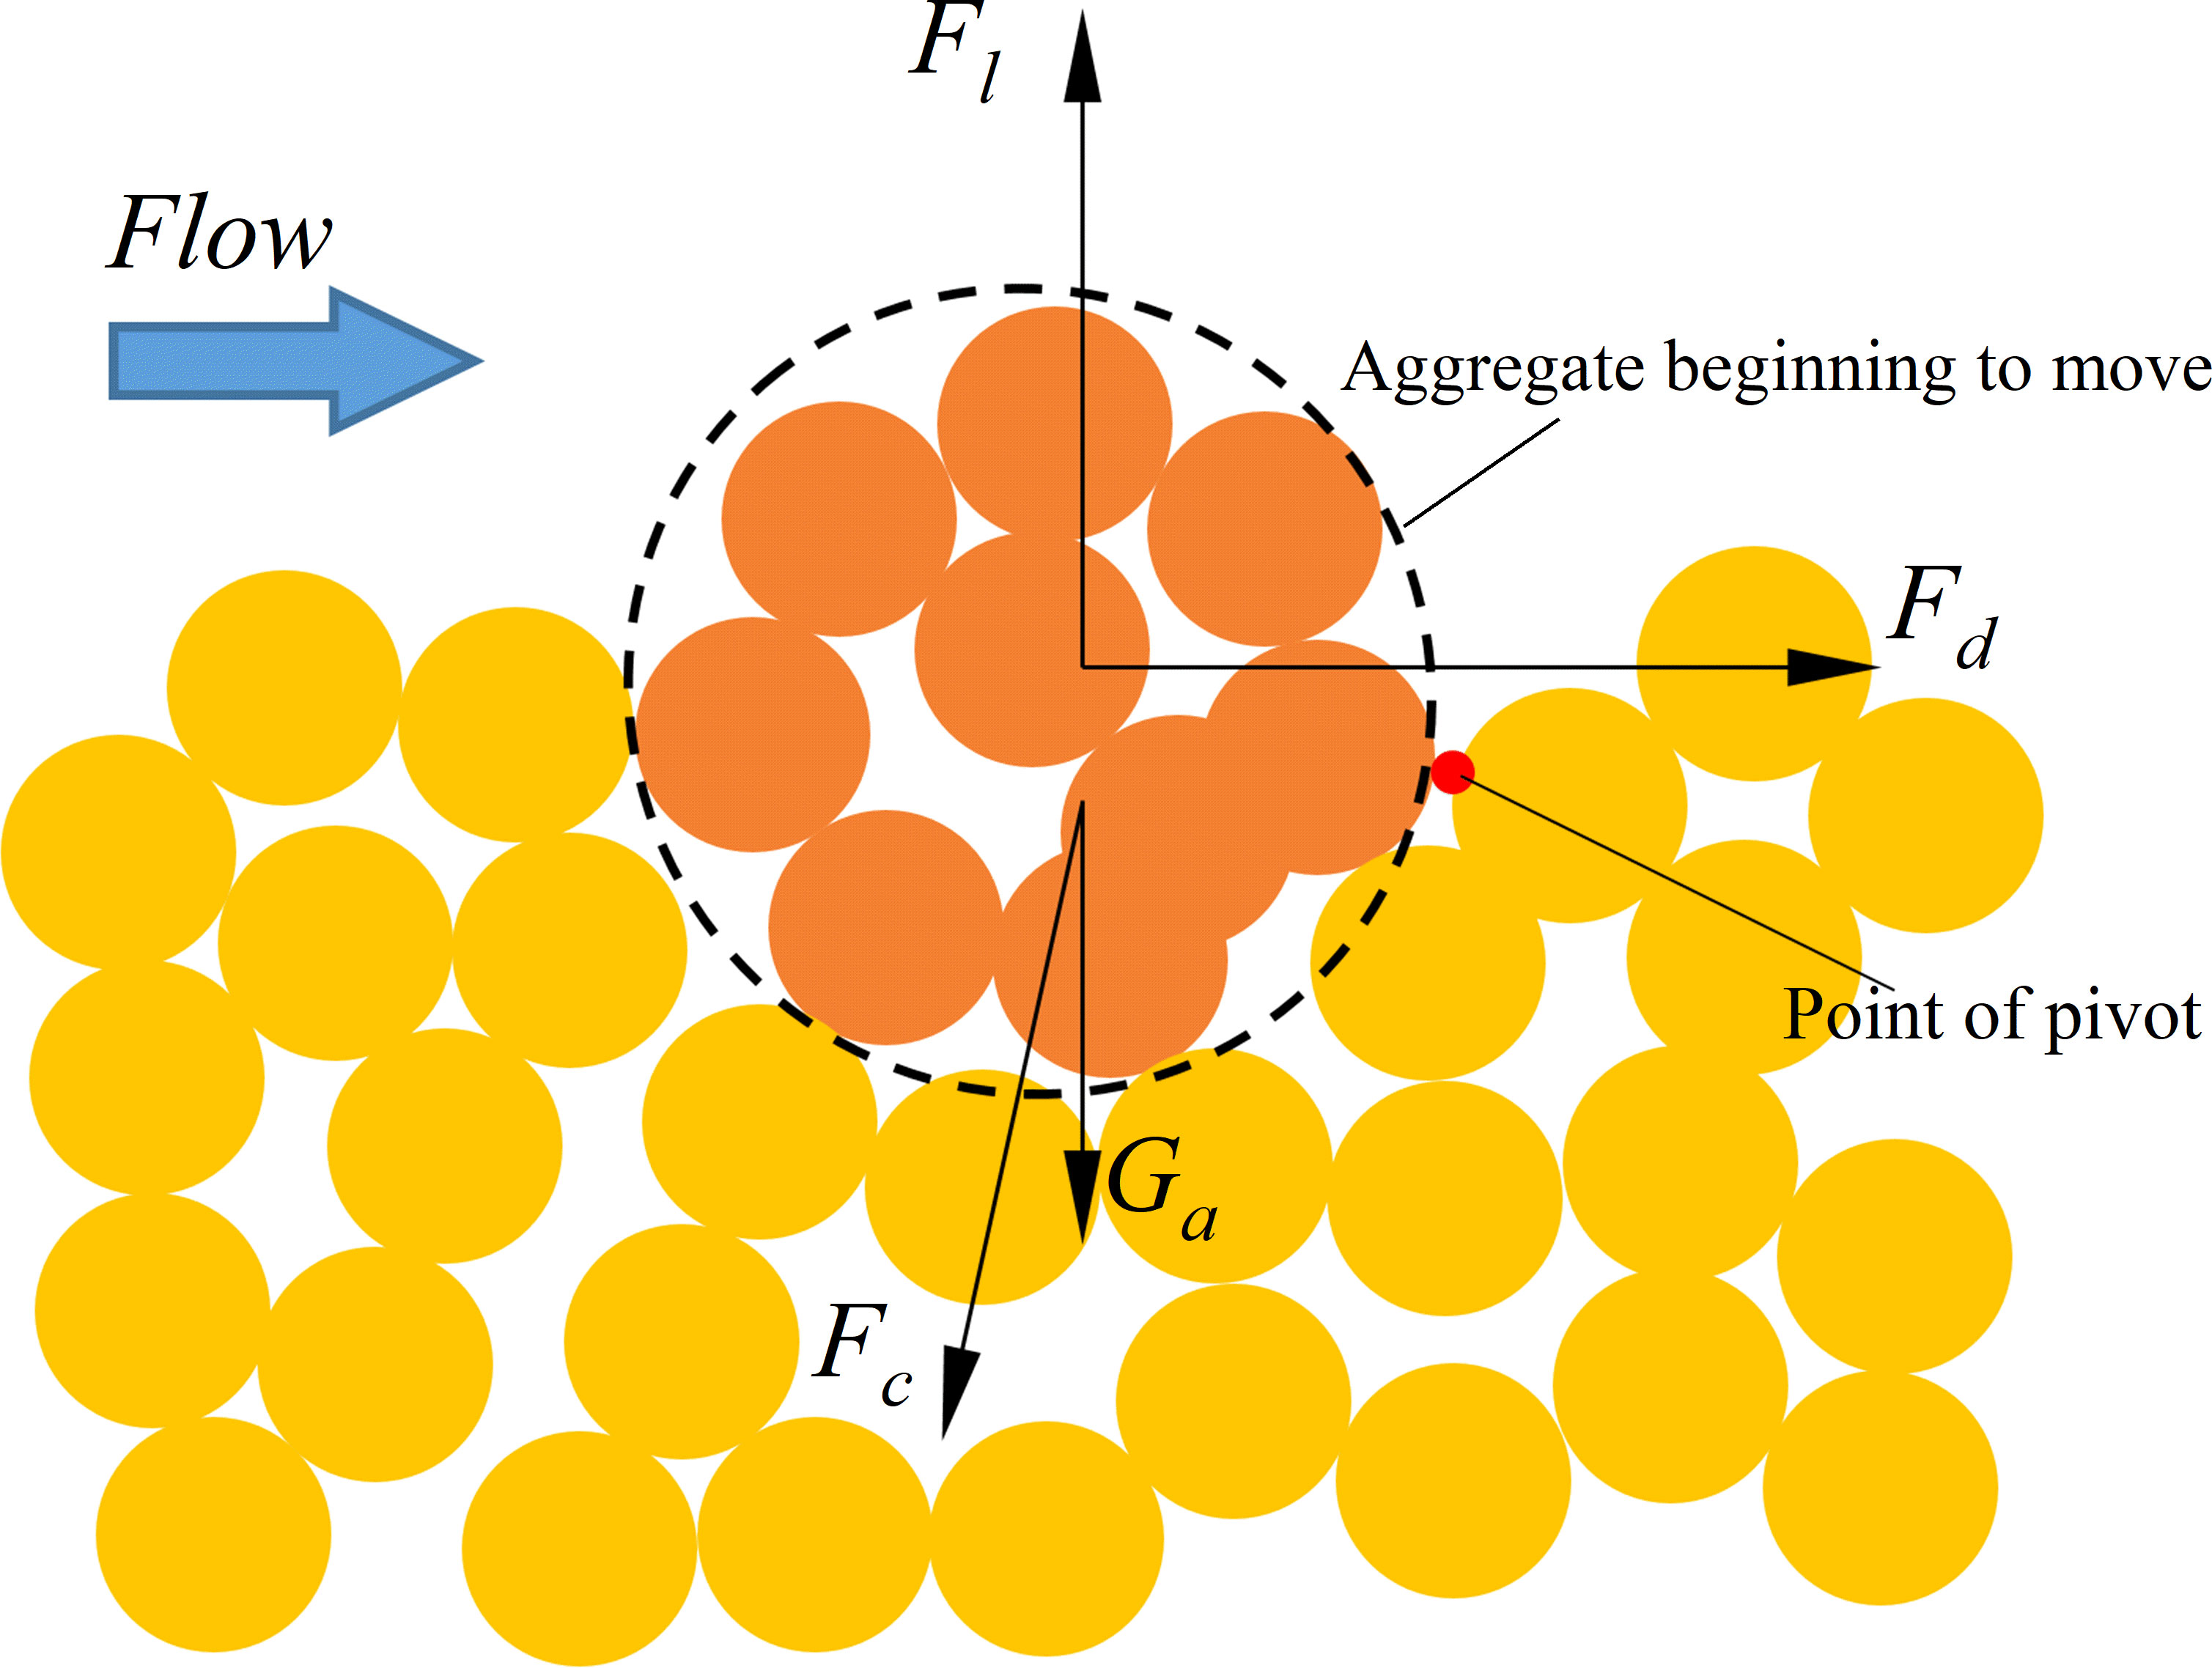
Figure 1 Aggregate at the water-sediment interface and force balance.
where Fd and Fl are the drag and lift forces, respectively; Ga is the submerged weight of the aggregate; Fc is the resultant of the cohesive forces acting on the aggregate; k1da ,k2da , k3da and k4da are the moment arms of the drag force Fd , lift force Fl , submerged weight Ga , and resultant cohesive force Fc , respectively, with k1 , k2 , k3 and k4 being the proportionality coefficients.
The drag and lift forces acting on the aggregate are given by Fd=Cdρu*2α1da2 and Fl=Clρu*2α1da2 , respectively (Torfs et al., 2000; Righetti & Lucarelli, 2007; Vollmer & Kleinhans, 2007), where Cd and Cl are drag and lift coefficients, respectively; ρ is the density of water; u* is the shear velocity and α1 is the area shape factor of the aggregate.
The submerged weight of the aggregate is given by Ga=α2(ρa−ρ)gda3 , where α2 is a volumetric shape coefficient of the aggregate and g is the gravitational acceleration.
The resultant Fc could be obtained by integrating the van der Waals forces between the particles in the surface of the aggregate and those particles surrounding the aggregate: Fc=k5ncnfc, where fc is the van der Waals force between two contacted particles; n is the number of cohesive particles in the buried surface of the aggregate; cn is the coordination number, i.e. the average number of the contacted particles of a cohesive particle; and k5 is a coefficient.
The coordination number cn is dependent on the solid volume fraction. According to the study of Meissner et al. (1964), cn can be calculated by:
The number of cohesive particles in the buried surface of the aggregate, n , could be computed by: n=(1−ηΔ)πda2Npa , where (1−ηΔ)πda2 denotes the buried surface area of the aggregate with ηΔ being the relative protruding fractal height of the aggregate (i.e., the ratio of the protruding fractal height to the diameter of the aggregate); and Npa is the number of cohesive particles per unit area of the aggregate surface. It is assumed that the number of cohesive particles per unit area of the aggregate surface is proportional to the number of cohesive particles per unit area of the bed surface (Npb ):
where k6 is a coefficient. Npb could be estimated by:
where 1 denotes a unit area of the bed surface and denotes the volume of the primary particle. Considering Eqs. (11) and (12), n is given by n=6(1−ηΔ)k6φs2/3(da/dp)2 . Further considering Eqs. (10) and (8), the resultant cohesive force Fc is obtained:
Substituting the expressions for Fd , Fl , Ga and Fc into Eq. (9) and considering in which τb is the bed shear stress, the critical shear stress for surface erosion of cohesive sediment, τcr , is given by:
Eq. (14) shows the erosion threshold of cohesive sediment comes from two parts respectively contributed by the effective gravity of the aggregate [corresponding to the first term in the square brackets in Eq. (14)] and the cohesive strength of the sediment (corresponding to the second term). If ignoring the cohesive forces acting on the aggregate, Eq. (14) would be reduced to:
Eq. (15) denotes the critical shear stress of a cohesionless particle of a density of ρa and a diameter of da . This yields
where θcr0(da*) is the critical Shields parameter of noncohesive sediment of a dimensionless diameter da* , which is defined as da*=da[(ρa/ρ-1)g/υ2]1/3 with υ being the kinematic viscosity of water. Considering Eqs. (3) and (4), da* could be calculated by:
where dp* is the dimensionless particle diameter, defined as dp*=dp[(ρs/ρ-1)g/υ2]1/3 . θcr0(da*) could be calculated by the Shields diagram or the formula of Soulsby and Whitehouse (1997).
Substituting Eq. (16) into Eq. (14), the critical shear stress for surface erosion of cohesive sediment is obtained:
where C=0.5Ah(1−ηΔ)k4k5k6α2−1k3−1η−2δ−2. The dimensionless form of Eq. (18) is given by:
where θcr is the critical Shields parameter, θcr=τcr/[(ρs−ρ)gdp] .
Eq. (19) is the formula we developed for predicting the threshold of surface erosion of cohesive sediment in which particle aggregation has been taken into account. Eq. (19) shows the critical Shields parameter of a cohesive sediment bed is a function of the diameter of the primary particles, the volume fraction of solid and the volume fraction of aggregates.
The volume fraction of aggregates φa of suspended cohesive sediment in a water body is usually lower than 1.0 (Winterwerp, 2002). However, when a cohesive sediment bed is formed from the deposition of flocs, the structure of the sediment changes from that of a high concentration of suspended sediment in the water to a flocculated matrix with a space-filling network (Kranenburg, 1994; Whitehouse, 2000; Winterwerp & Van Kesteren, 2004). Therefore, for cohesive sediment beds, φa=1.0 . However, we prefer to keep φa in Eq. (19) as keeping it in the formula makes the formula consistent with the existing theory for noncohesive sediments. For noncohesive sediment that is eroded particle-by-particle, the primary particles could be treated the same as the aggregates here. For such condition, the aggregate volume fraction equals the solid volume fraction, i.e. φa=φs , and Eq. (19) is therefore changed into:
If ignoring the cohesion between particles, i.e., ignoring the second term in the square brackets, Eq. (20) is simplified to the general formula for the critical Shields parameter of noncohesive sediment: θcr=θcr0(dp*) . In fact, the second term in the square brackets in Eq. (20) tends to vanish with the increase of the particle diameter as it is inversely proportional to the square of the particle diameter provided a low value of C. This makes that Eq. (20) also applies for coarse-grained noncohesive sediment. The values of C will be discussed in a later section.
There are two coefficients in Eq. (19): F and C . The fractal dimension F is a fundamental parameter of the aggregate structure, whose value reflects the space-filling ability of the aggregates. Structures with a high fractal dimension are usually compact and dense, whereas those with a low fractal dimension are more open. As the aggregate structure is formed by primary particles mainly characterized by the particle diameter, and changes during the consolidation process of the sediment, the fractal dimension of cohesive sediment is supposed to be a function of the particle diameter and the consolidation degree. Measurements of the fractal dimension of macroflocs of cohesive sediment in the water column reveal values from about 1.6 to 2.4, with a median value of 2 (Dyer & Manning, 1999; Khelifa & Hill, 2006; Son & Hsu, 2009; Fall et al., 2021). The fractal dimension of cohesive bed is often reported in the range of 2.0 to 2.8 (Kranenburg, 1994; Winterwerp & Van Kesteren, 2004; Sharif & Atkinson, 2012). Hasmy et al. (1997) reported a type of transition into a gelation stage takes place when the solid volume fraction exceeds the gel point resulting in a high value of the fractal dimension larger than 2.0. Therefore, the fractal dimension of cohesive sediment beds is considered between 2 and 3 in this study. The coefficient C mainly reflects the cohesive strength of the sediment. Currently, determination of its value is unavailable as coefficients involved in the expression for C, e.g., Ah , η , and δ , are usually unknown. The fractal dimension F and the coefficient C are treated as empirical coefficients that will be determined by the measured erosion thresholds of sediments.
In some research areas and practices, the bulk density is the more common variable than the solid volume fraction. By assuming the average dry and wet bulk densities of aggregates to be the same as the dry and wet bulk densities of the bed, respectively, the solid volume fraction has the following relations with the dry and wet bulk densities of a cohesive bed according to Eq. (3):
where ρb is the wet bulk density and ρd is the dry bulk density. Equivalent forms of Eq. (19) which express the Shields parameter of cohesive sediment as a function of the wet or dry bulk density of sediment are given below:
where
Formula application
In this section, the developed formula for the threshold for surface erosion of cohesive sediment, i.e., Eq. (19), is applied to a series of experimental data with two approaches. One is treating the fractal dimension F as a constant and the other is regarding the fractal dimension F as a function of the diameter of primary particles and the compactness degree of sediment. The two approaches are employed to seek a complete solution to predicting the threshold of surface erosion of cohesive sediment.
Experimental data of different cohesive sediments are collected from previous studies. Those sediments include three groups of kaolinite, two groups of quartz, nine groups of lake and pond mud, and nine groups of coastal mud. In each of the collected experiments, the sediments prepared of different bulk densities were tested and the critical shear stresses of those sediments are measured. The adequacy of the experimental data has been carefully checked. The synopsis of the collected experimental data and data sources are presented in Table 1. It is noted that quartz also exhibits significant cohesion when the particle size is small enough despite that quartz is one of the common minerals in noncohesive sediment. According to Roberts et al. (1998) and Roberts et al. (2003), the sediment consisting of quartz particles behaves in a cohesive manner when the particle diameter is smaller than 40 microns and is eroded as aggregates when the particle diameter is smaller than 19 microns.
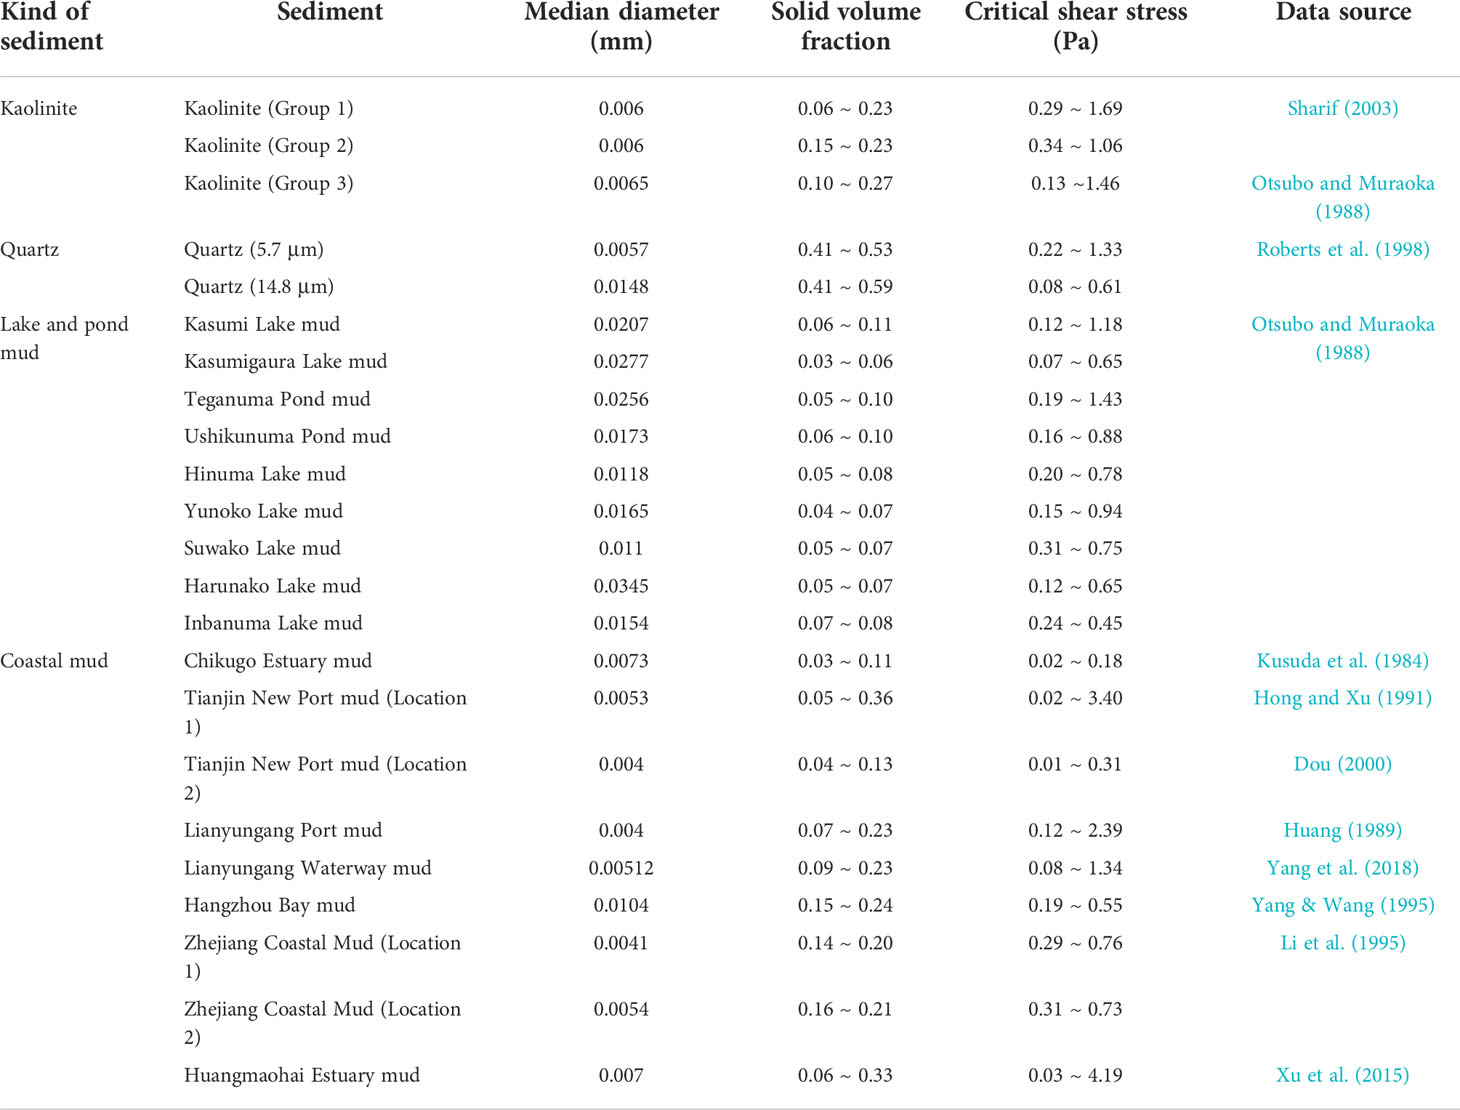
Table 1 Summary of collected experimental data of and data sources.
The fractal dimension F being constant
Figures 2–4 show the applications of Eq. (19) in kaolinite, quartz, lake and pond mud and coastal mud with the fractal dimension F being treated as a constant in each application. The best-match values of F and C are used in each application, which are obtained by performing the nonlinear regressions. The figures show although constant values of F are used, the calculated critical Shields parameters agree well with the measured values. This would be because the contribution rate of the effective weight of aggregates to the erosion threshold is relatively low for most of the sediments (i.e., the first term in the square brackets in Eq. (19) is much lower than the second term). Therefore, Eq. (19) could match the data well when a suitable value of C is provided. The contribution rate of the effective weight of aggregates to the erosion threshold of cohesive sediment will be further analyzed in a later section after the function for F is formulated.
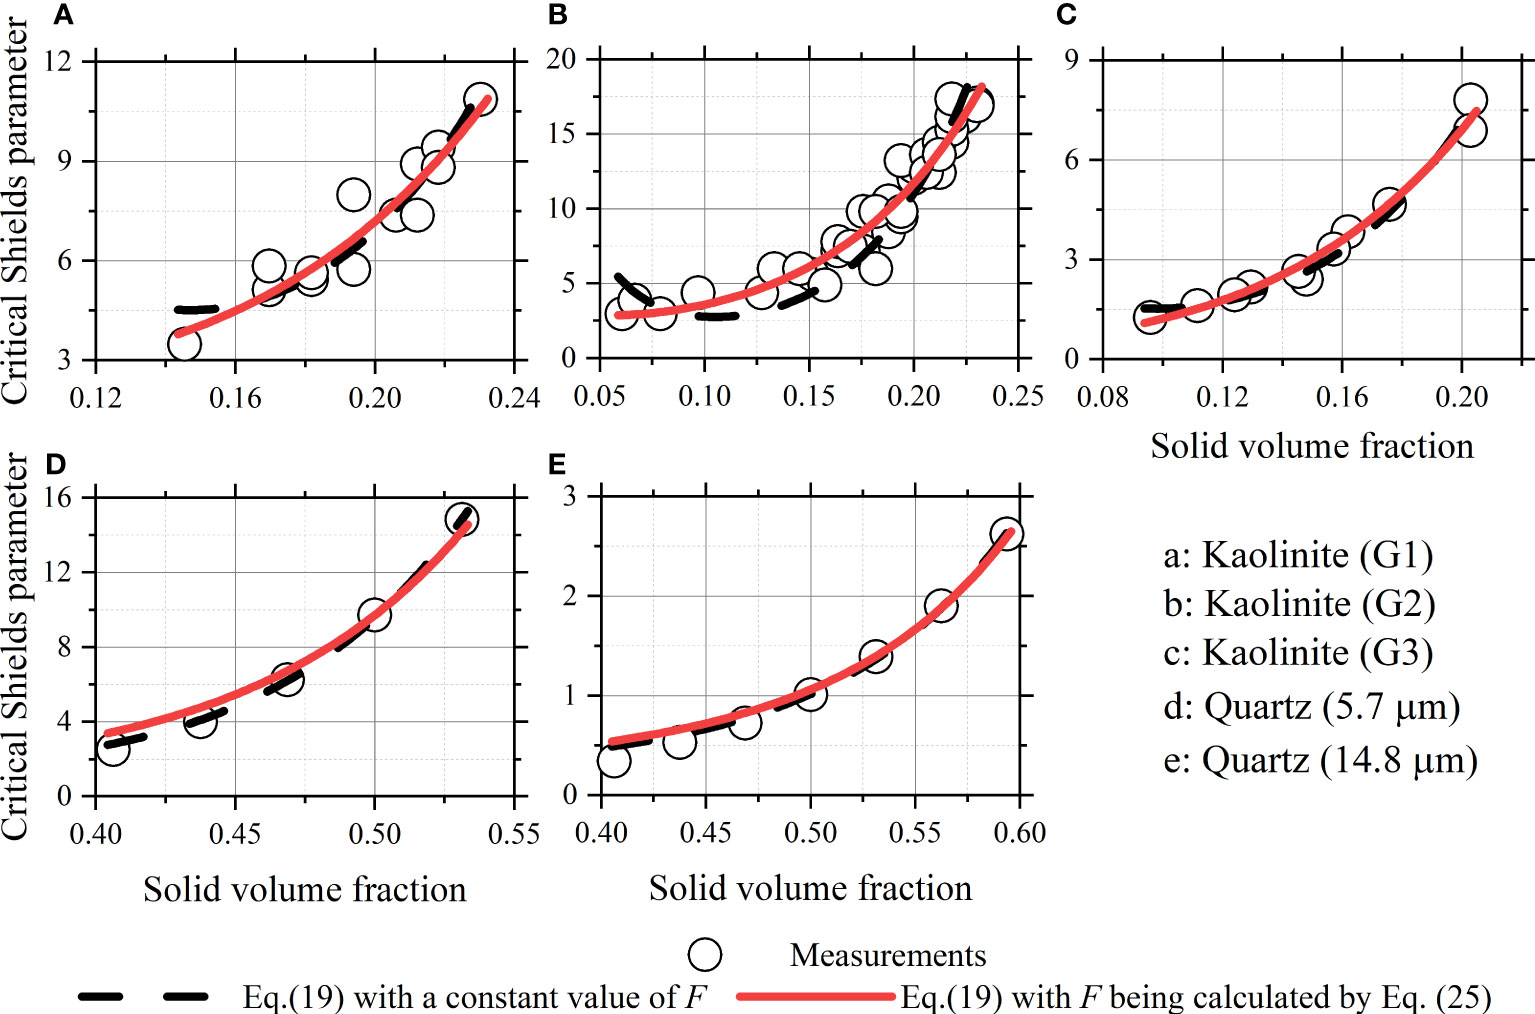
Figure 2 Applications of the developed formula in kaolinite and quartz.
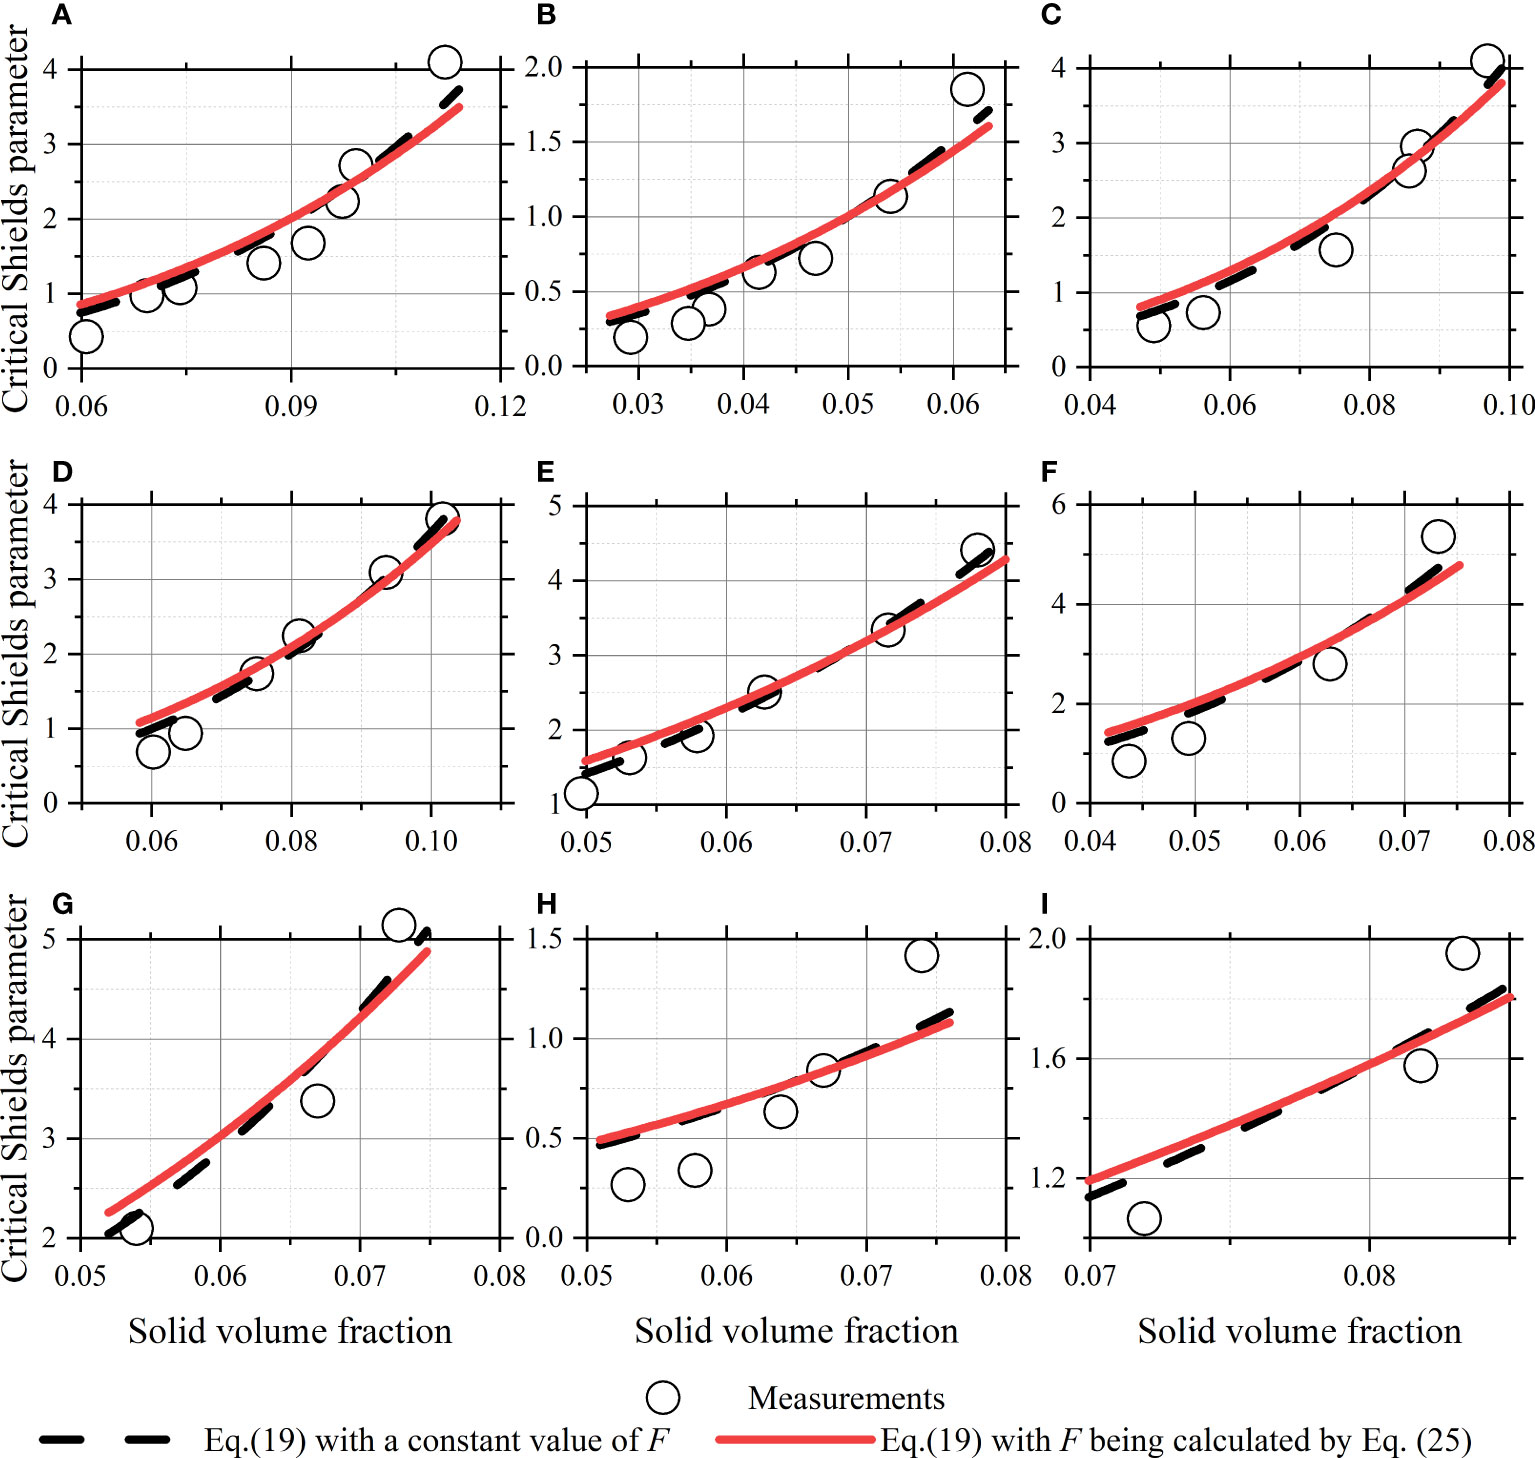
Figure 3 Applications of the developed formula in lake and pond mud. (A) Kasumi Lake mud; (B) Kasumigaura Lake mud; (C) Teganuma Pond mud; (D) Ushikunuma Pond mud; (E) Hinuma Lake mud; (F) Yunoko Lake mud; (G) Suwako Lake mud; (H) Harunako Lake mud; (I) Inbanuma Lake mud.
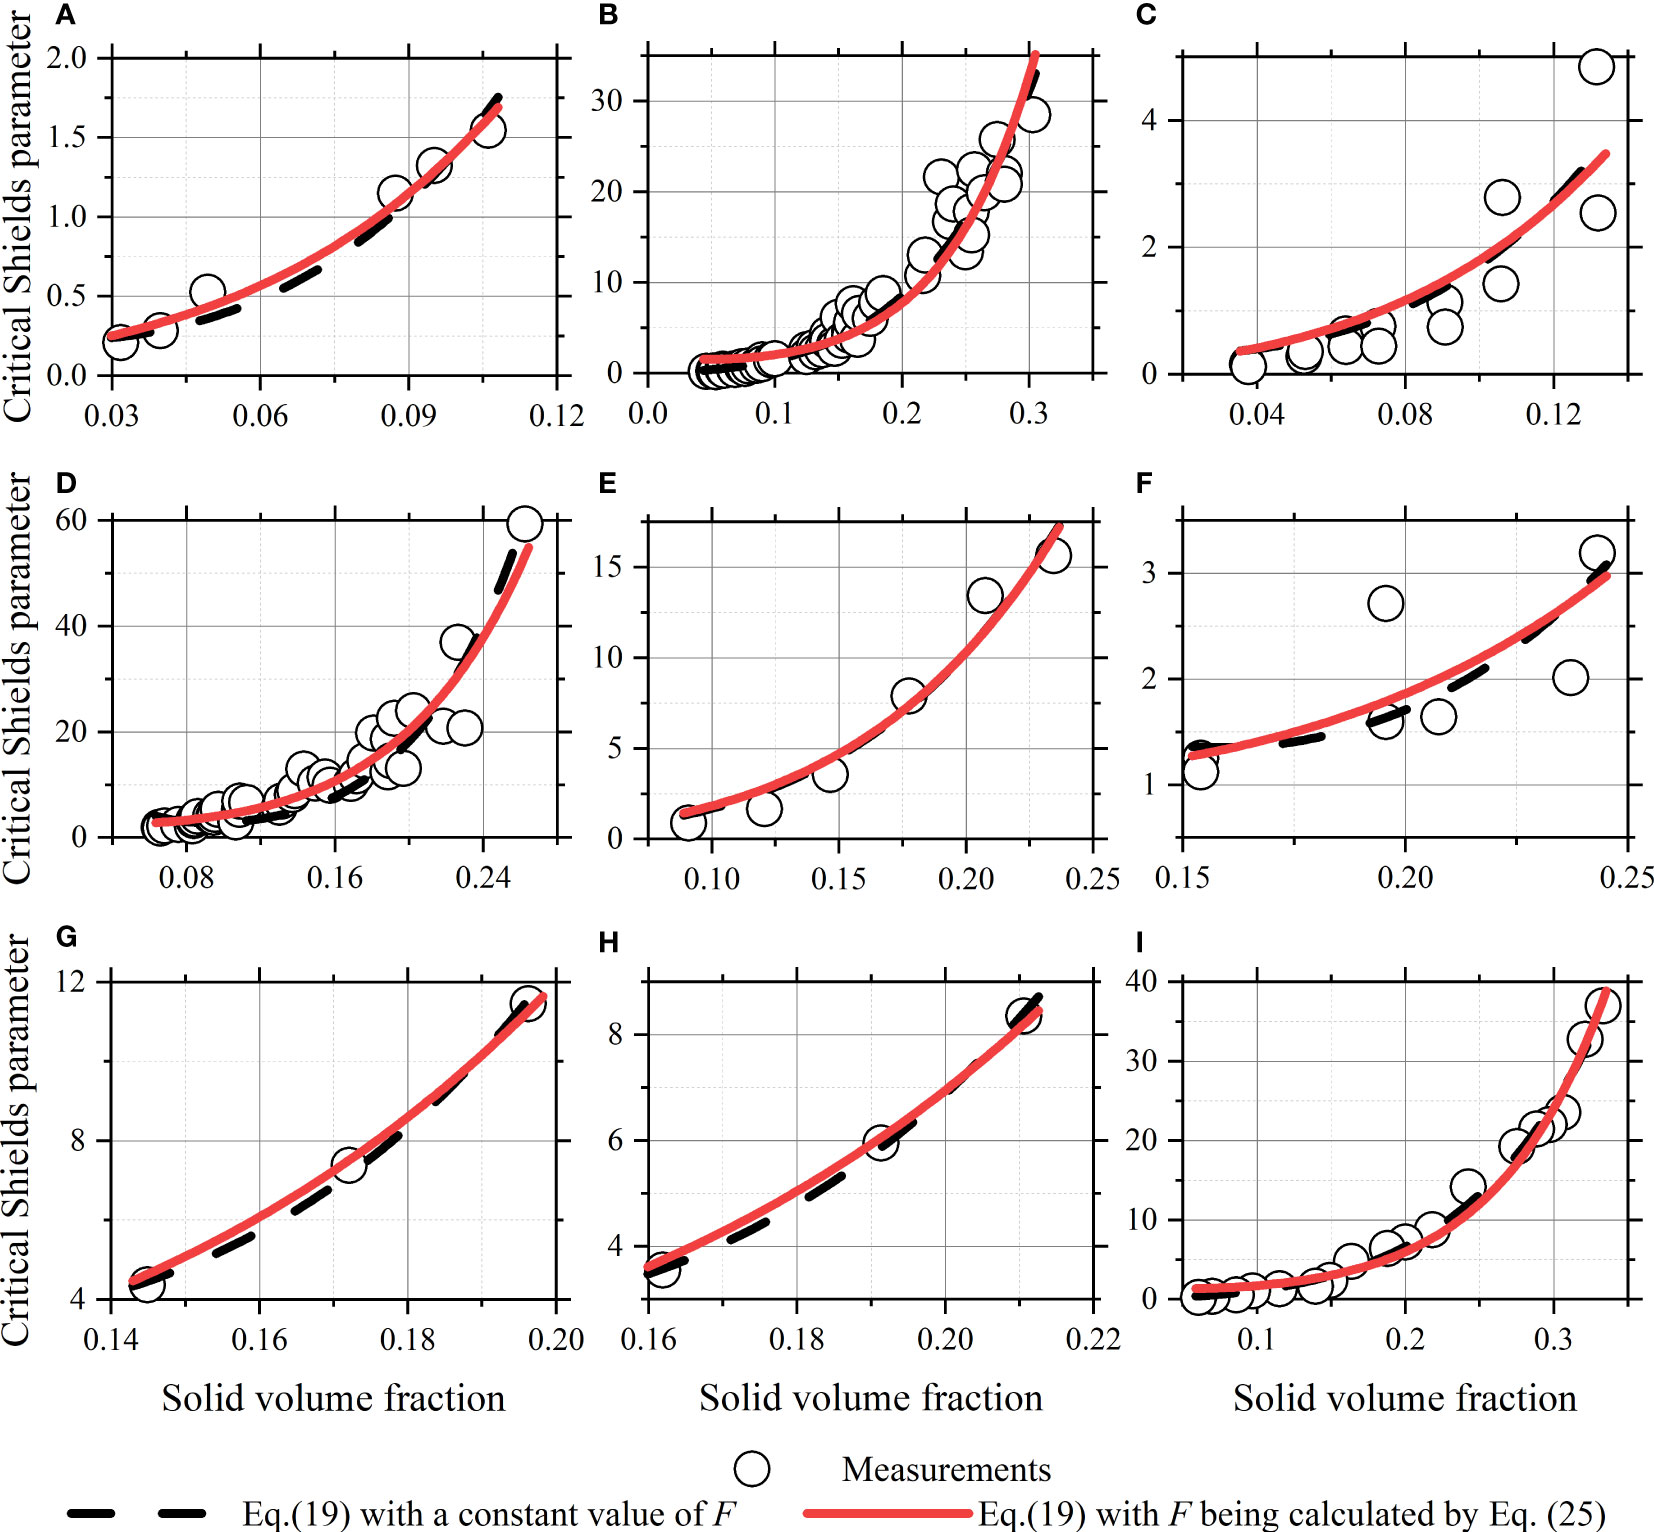
Figure 4 Applications of the developed formula in coastal mud. (A) Chikugo Estuary mud; (B) Tianjin New Port mud; (C) Tianjin New Port Waterway mud; (D) Lianyungang Port mud (L1); (E) Lianyungang Port mud (L2); (F) Hangzhou Bay mud; (G) Zhejiang coastal mud (L1); (H) Zhejiang coastal mud (L2); (I) Huangmaohai Estuary mud.
The obtained fractal dimension F and coefficient C are listed in Table 2. As shown in Table 2, the obtained fractal dimension F varies between 2.0 to 2.76, with an average value being 2.36 and a standard deviation being 0.25. The covariance between the obtained fractal dimension F and the obtained coefficient C is nearly zero, which shows there are not any clear relations between the two variables. It is emphasized here that although Eq. (19) could reproduce the critical Shields parameters provided a constant F and C, the obtained values of F and C cannot reflect the property of the sediment aggregates accurately as F is insufficiently constrained in this approach.
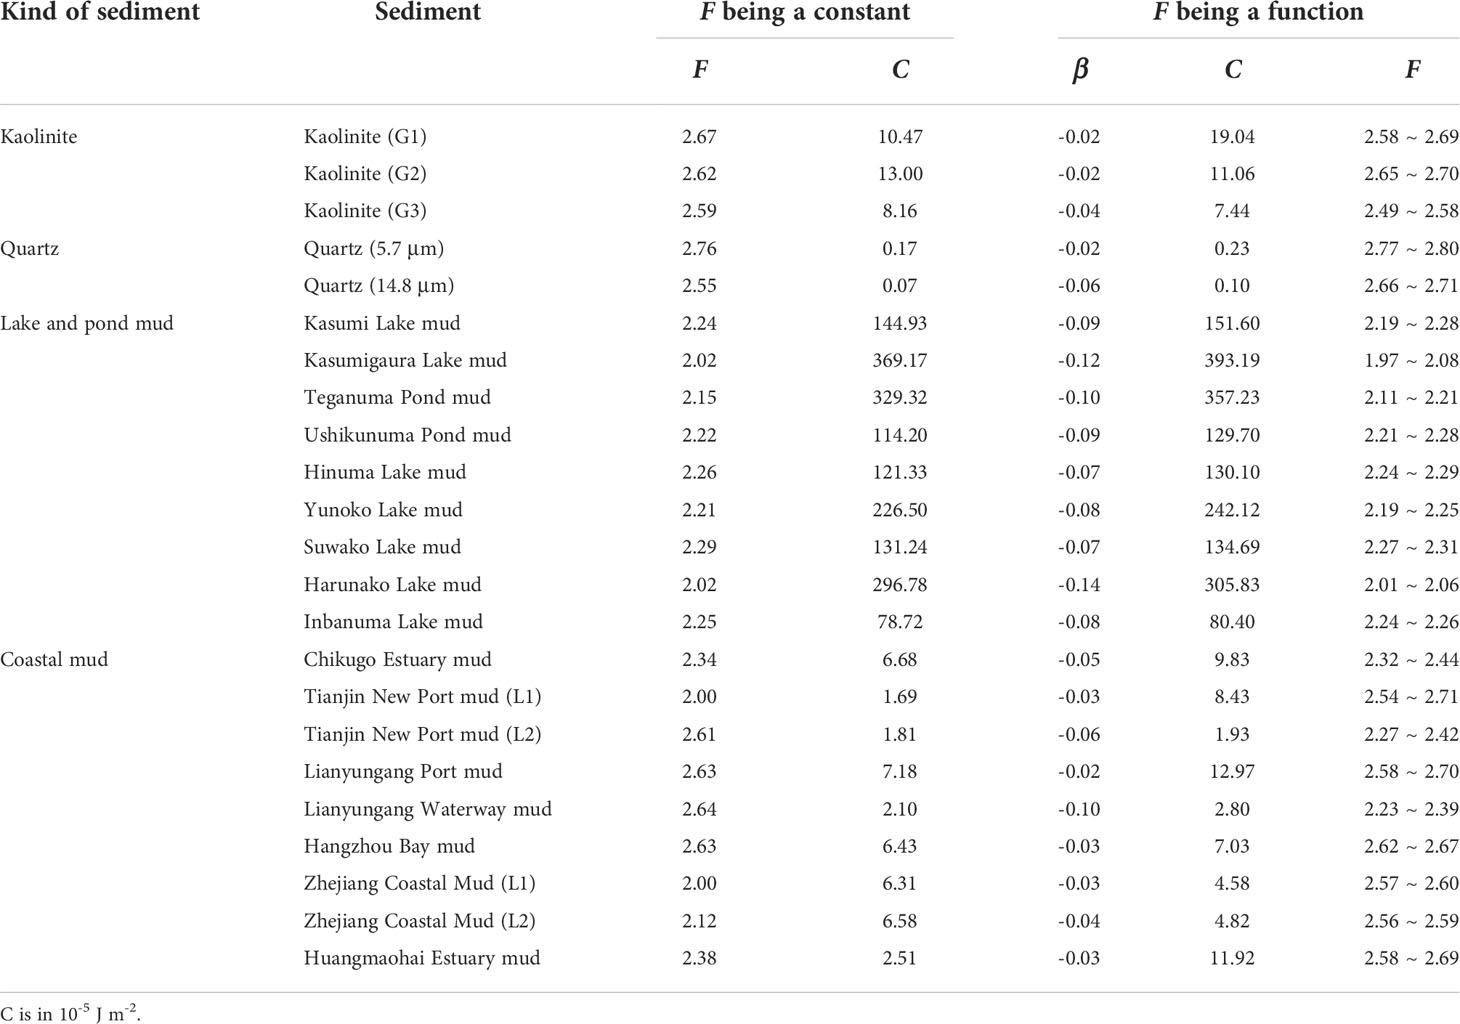
Table 2 Application results of the developed formula in different cohesive sediments.
The fractal dimension F being a function
The fractal dimension of an aggregate with a diameter closer to the size of the primary particles should approach the value of 3, which applies to coalescence of particles. By reference to Khelifa and Hill (2006) and Maggi et al. (2007), the following power law would present the reasonable approximation for F:
where β is a coefficient. Maggi et al. (2007) found Eq. (24) matches well with the floc size for flocculated kaolinite minerals in their experiments when β is taken a value of -0.1. Khelifa and Hill (2006) considered β is a function of the primary particle diameter of flocs. They proposed two models for the settling velocity and effective density of flocs under this consideration, which reproduce well the experimental data. By reference to Khelifa and Hill (2006), we also assume that the value of β is a function of the primary particle diameter of cohesive sediment beds in this study. As the critical shear stresses of the sediments prepared of the same primary particles and different bulk densities are measured in each collected experiment, the value of β will be constant in each dataset.
Substituting Eq. (4) into Eq. (24), the fractal dimension F of aggregates of cohesive sediment can be computed by:
Eq. (19) is then applied to the experimental data of kaolinite, quartz, lake and pond mud and coastal mud with the fractal dimension F being calculated by Eq. (25). The applications are shown in Figures 2-4, which show good agreements between the calculated and measured values. The best-match values of β and C for each dataset are used in the applications, which are obtained by the nonlinear regressions. They are also listed in Table 2 along with the ranges of the fractal dimension calculated by Eq. (25).
Discussion
Function for the fractal dimension
As presented in Table 2, the fractal dimension of cohesive sediment aggregates predicted by Eq. (25) is in the range of 2.01 to 2.80, being consistent with the reported ranges in cohesive beds by Kranenburg (1994); Sharif and Atkinson (2012) and Xu et al. (2014). The value of β is in the range of -0.02 to -0.14, being also consistent with the study of Maggi et al. (2007), in which a value of -0.1 was reported for flocculated kaolinite minerals. Figure 5 shows the obtained values of β decreases with increasing primary particle diameter and could be predicted by a linear function:
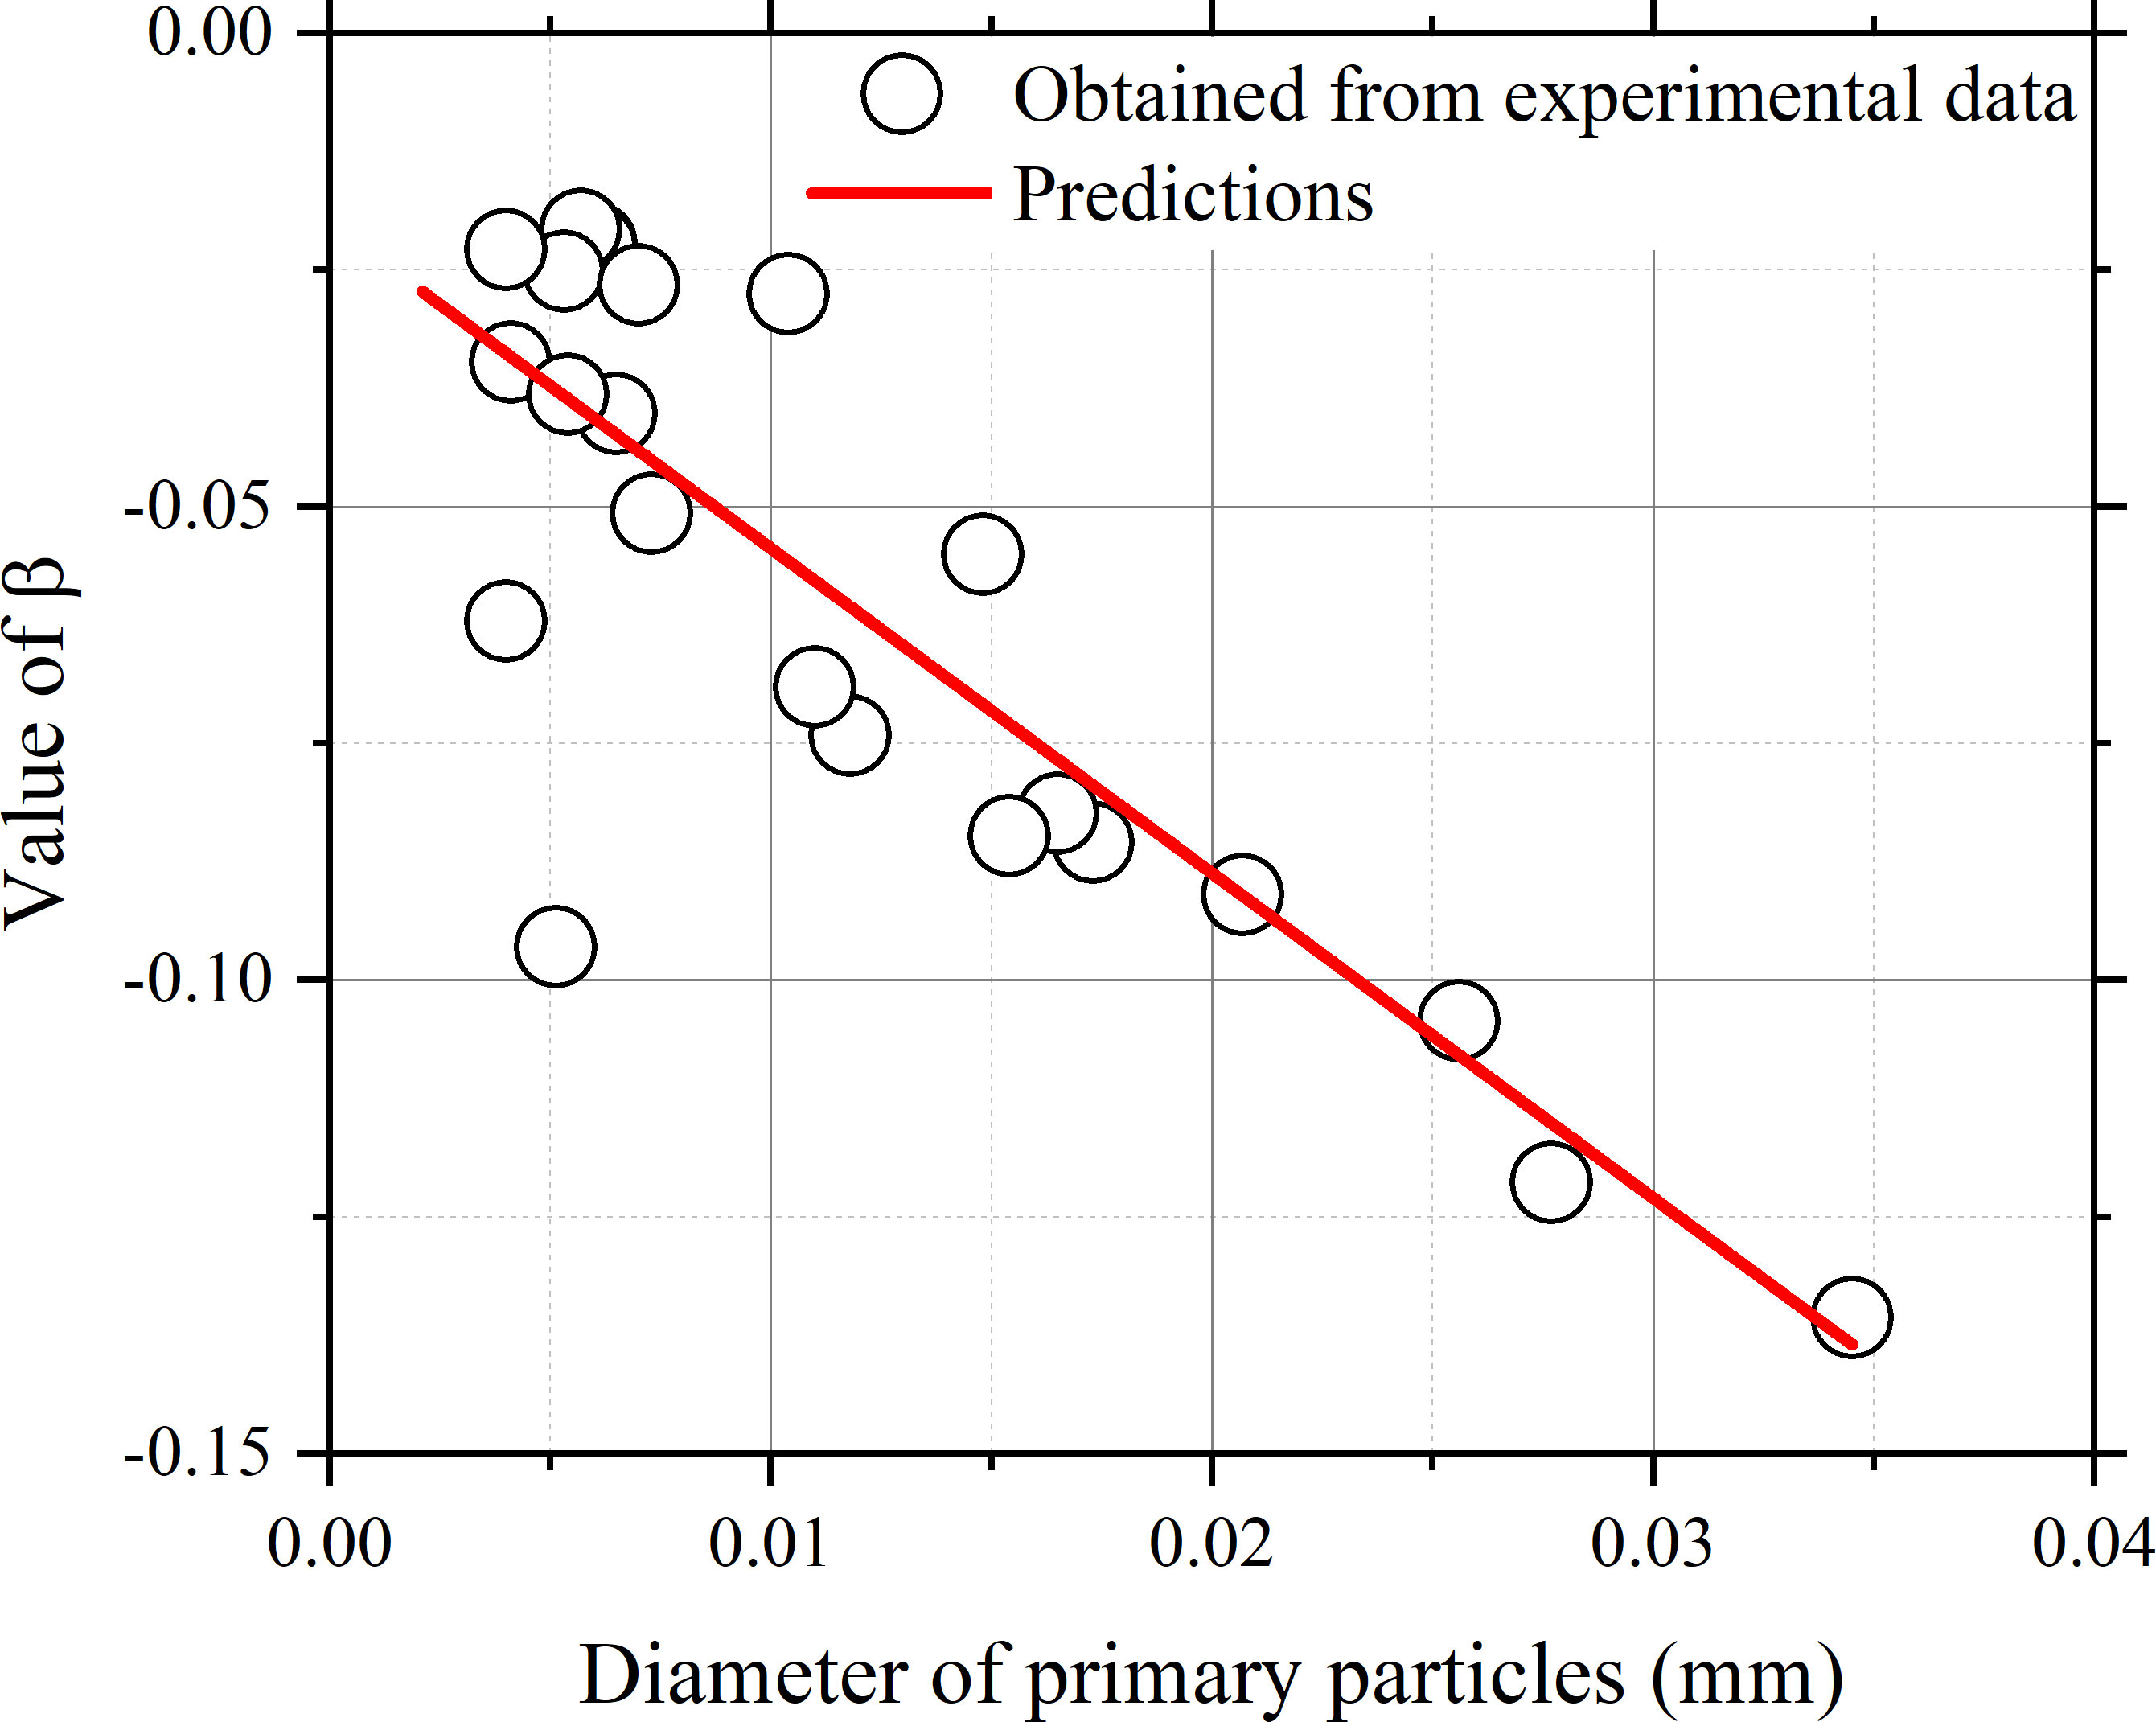
Figure 5 The value of β varying with the diameter of primary particles.
where dpr is a reference primary particle diameter, dpr=0.000290 m. Since here, Eqs. (19), (25) & (26) constitute a complete solution to predicting the threshold of surface erosion of cohesive sediment.
Figure 6 shows the fractal dimension calculated by Eqs. (25) & (26) varying with the solid volume fraction and the primary particle diameter. It shows the fractal dimension increases with increasing solid volume fraction for sediments of the same primary particle diameter, and decreases with increasing primary particle diameter for sediments of the same solid volume fraction. The aggregate structure in the sediment of a high solid volume fraction is usually tightly packed, leading to a high value of the fractal dimension. The effect of the solid volume fraction on the fractal dimension has also been observed by other researchers, e.g., Sharif and Atkinson (2012), who reported that the fractal dimension of a cohesive sediment bed increases with increasing consolidation time. This effect is also consistent with the observations of suspended flocs in water bodies and colloids. Aubert and Cannell (1986) reported the fractal dimension of silica aggregates increases from 1.75 to 2.05 with the increase of silica concentration. Monte Carlo studies showed the rather compact clusters formed in the DLCA range exhibit the fractal dimension ranging between 1.8 (φs→0 ) and 2.5 (φs≈0.5 ), significantly larger than the typically reported values, of about 1.8 (Lazzari et al., 2016). The increase in the fractal dimension is ascribed to cluster collisions occurring close to the cluster centers rather than at their tips. Bowers et al. (2017) reported that the lowest mean value of the fractal dimension of marine flocs is observed off the west coast of Scotland, a region of relatively clearwater, and the highest values of the fractal dimension are observed in areas of fast tidal currents and high turbidity.
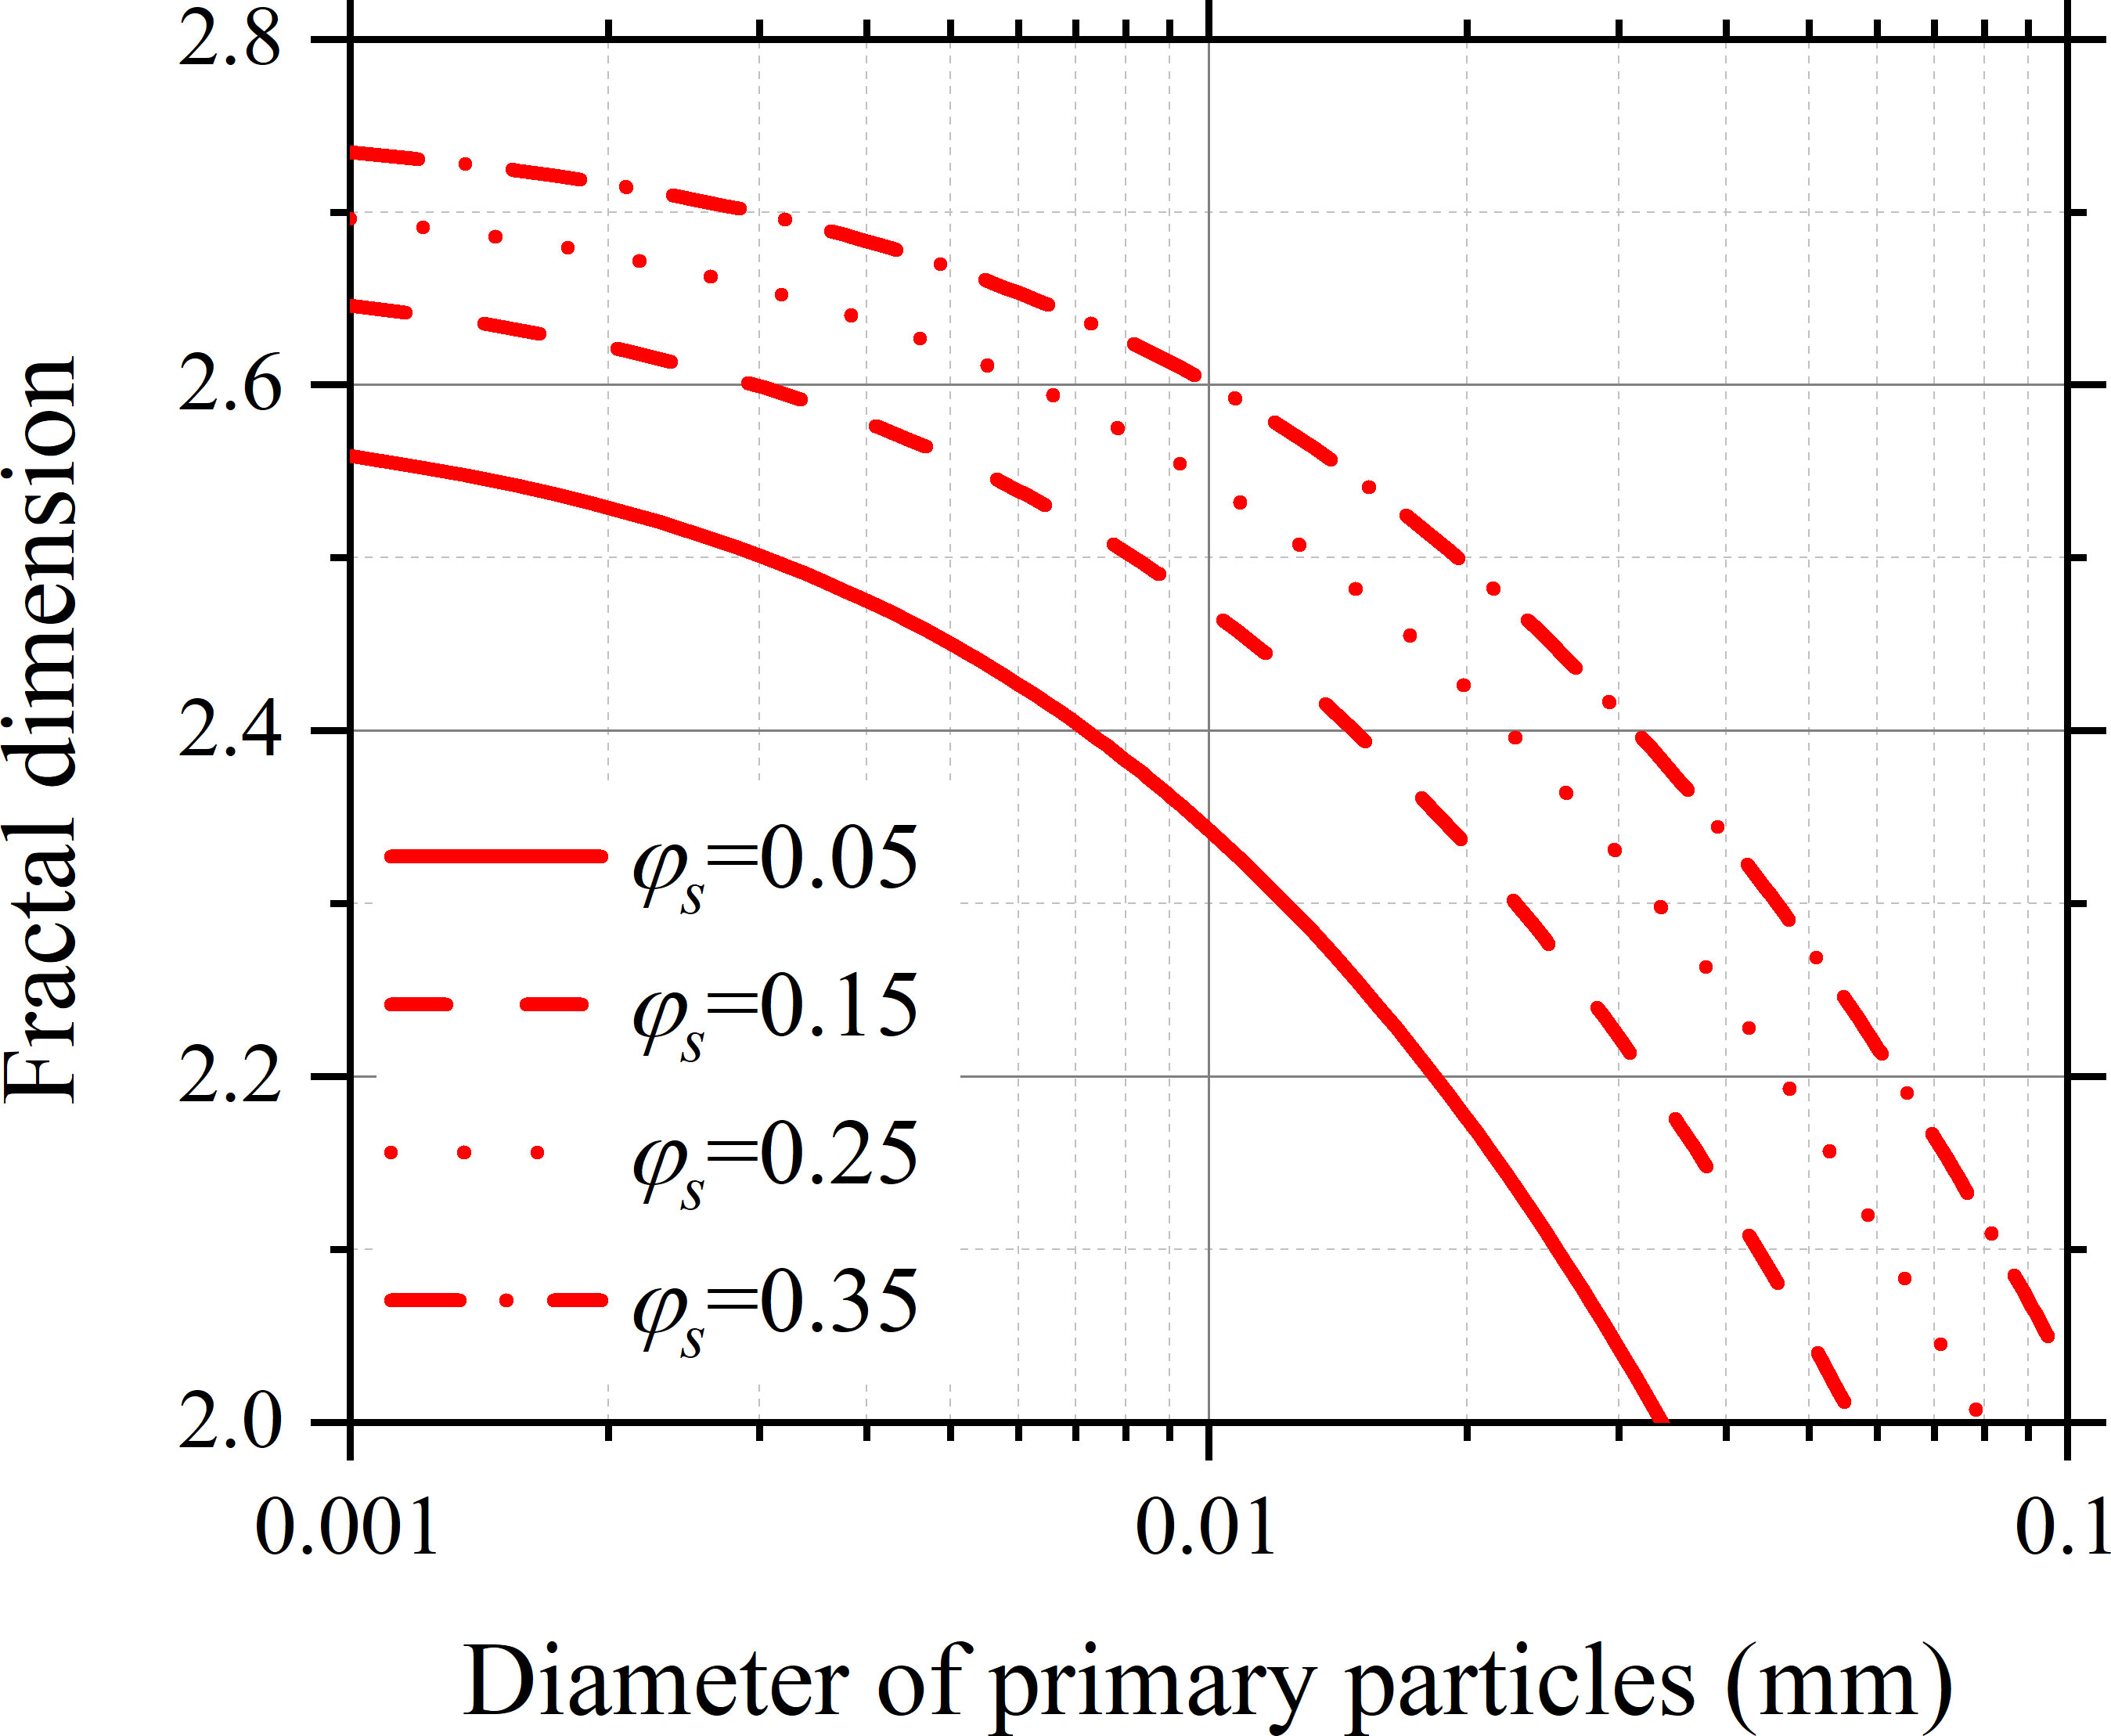
Figure 6 The fractal dimension varying with the diameter of primary particles and the solid volume fraction.
The finding of the fractal dimension decreasing with increasing particle diameter has seldom been reported in cohesive sediment research. It is consistent with a recent study on colloidal aggregation conducted by Wu et al. (2013). By analyses of a significant amount of data involving colloidal suspension of various types (e.g., polystyrene, silica, hematite) and performing adhoc experiments with differently sized polystyrene particles, they found the value of the fractal dimension decreases significantly as the primary particle size increases. Currently, there is an absence of a theoretical explanation for the effect of the particle diameter. Lazzari et al. (2016) suggested that small dipolar interactions could be at the root of the effect.
Cohesion coefficient C
The coefficient C denotes the cohesion strength of cohesive sediment, whose value is related to the Hamaker constant, the thickness of the bound water layer, the volumetric shape coefficient of the aggregates, the microstructure of aggregates in the bed surface, etc. Since the Hamaker constant and the thickness of the double water layer are usually a function of both the sediment material and the intervening medium, the coefficient C would be affected by the mineral composition of particles, the shape and roughness of the particles, the sort and concentration of cations in pore waters, the pH value and temperature of the pore water, etc. As those data were often missing in research on the erosion of cohesive sediment, the relationship between the value of C and those affecters is unavailable.
As the mineral composition of sediment, the particle shape, and the pore water environment often vary from site to site, the value of C is supposed to be site- or sediment- specific. This property makes it futile to develop a universal formula with constant parameters for all sediments. A database of the value of C corresponding to the kind (or site) of sediment, like Table 2, would be necessary and valuable for practical applications.
As presented in Table 2, the value of C is generally on the order of magnitude of 10-6 to 10-3 J m-2. Specifically, the value of C is the range of 7.44×10⁻⁵ ~ 19.04×10⁻⁵ J m-2 for kaolinite; 1.02×10⁻⁶ ~ 2.28×10⁻⁶ J m-2 for quartz; 0.80×10⁻³ ~ 3.93×10⁻³ J m-2 for lake and pond mud; and 1.93×10⁻⁵ ~ 12.97×10⁻⁵ J m-2 for coastal mud. The value of C for coastal mud is near to that of kaolinite. This may be because kaolinite is one of the common clay minerals of coastal mud. The value of C for quartz is one or two magnitudes lower than the value of C for kaolinite, which is consistent with the general recognition: kaolinite, as one of the common clay minerals, is much more cohesive than quartz, as one of the common minerals in noncohesive sediments. The value of C for the lake and pond mud is one or two magnitudes higher than the values of C for kaolinite and coastal mud. The reason may lie in that the lake and pond muds used in the experiments contain 11 ~ 19% organic matters that greatly enhance the adhesion of mud. Since adhesion is not considered in this study, the adhesive force brought by organic matter is regarded as part of the cohesive force, leading to a high value of C for the lake and pond mud.
Although the coefficient C is site- and sediment- specific, one expects a guideline or reference value of C, with which Eq. (19) can give a reasonable estimate of critical shear stress of a certain kind of cohesive sediment. The guideline value, 9.12×10⁻⁵ J m-2, is suggested for pure kaolinite; 1.05×10⁻⁶ J m-2 for pure quartz; 1.60×10⁻³ J m-2 for natural mud of 11 ~ 19% organic matters; 6.49×10⁻⁵ J m-2 for natural mud with almost no organic matter. These guideline values are respectively obtained based on the experimental data of kaolinite, quartz, lake and pond mud, and coastal mud by the following approach. For each kind of sediment, the value of C is allowed to increase step by step from 1.00×10⁻⁷ J m-2 to 1.00×10⁻² J m-2 with an increment of each step 1.00×10⁻⁷ J m-2. For each step, Eq. (19) is applied to the sediments and the logarithmic root-mean-square error of the predicted critical shear stress is calculated. The logarithmic root-mean-square error, defined as , is used as an indicator to evaluate the performance of Eq. (19) as the measured erosion threshold varies in several orders of magnitude. The fractal dimension in Eq. (19) is calculated by Eqs. (25) & (26). The guideline value of C is gained when the logarithmic root-mean-square error reaches its minimum value.
The comparisons of Eq. (19) with the experimental data of kaolinite, quartz, lake and pond mud, and coastal mud are shown in Figure 7. In the calculations of Eq. (19), the guideline values of C are used and the fractal dimension F is computed by Eqs. (25) & (26). As shown in the figure, Eq. (19) can give acceptable predictions when the guideline values of C are used and the fractal dimension is calculated by Eqs. (25) & (26).
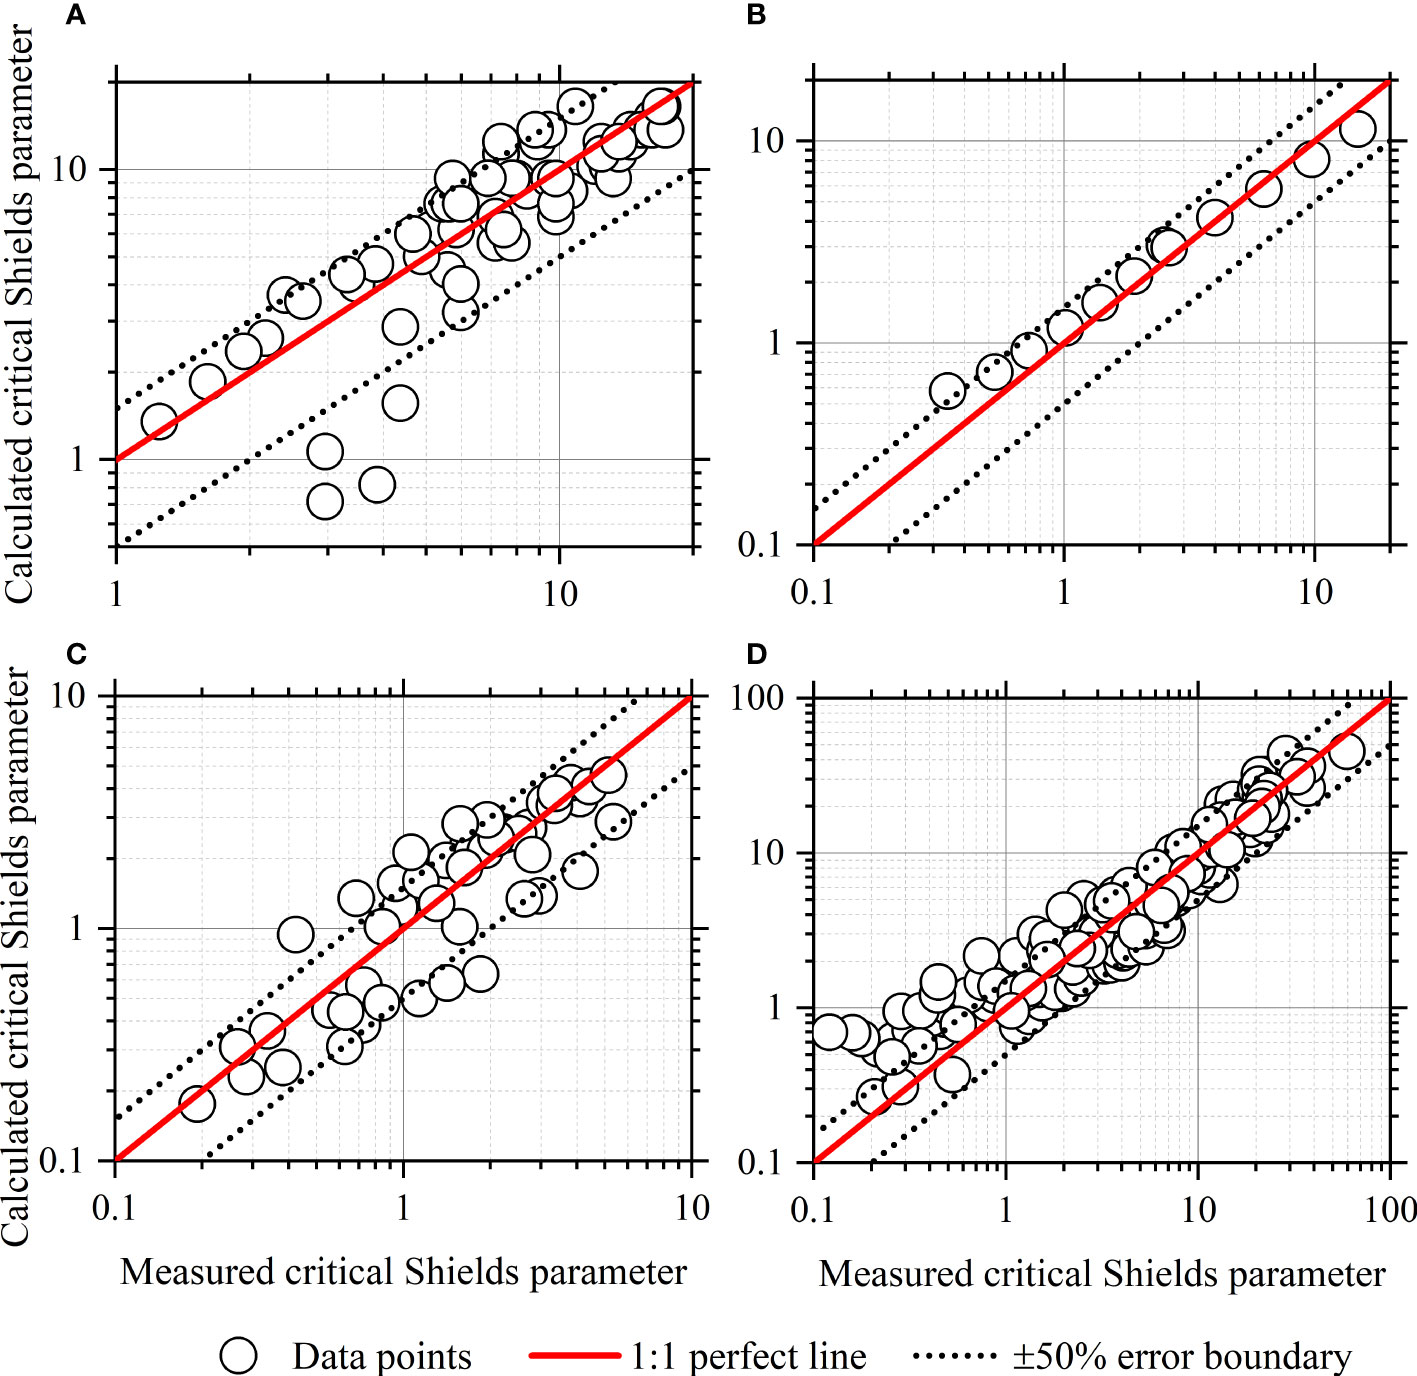
Figure 7 The calculated versus measured critical Shields parameters in the datasets of (A) kaolinite, (B) quartz, (C) lake and pond mud and (D) coastal mud.
Although some guideline or reference values of C are given here, it is emphasized that these values can be optimized when Eq. (19) is applied to a specific site. The accurate value of C for a specific site can be obtained by applying Eq. (19) to a sediment sample of known critical shear stress collected in the site.
Effects of particle aggregation
Figure 8 shows the predicted diameter of aggregates and the average number of primary particles in an aggregate varying with the particle diameter and the solid volume fraction. The predicted diameter of aggregates is calculated by Eq. (4) and the average number of primary particles in an aggregate is calculated by Eq. (1), with the fractal dimension F being computed by Eqs. (25) & (26). The figure shows both the predicted aggregate diameter and the average number of primary particles in an aggregate decrease with increasing solid volume fraction, which indicates reshuffling of particles occurs during the consolidation process of cohesive sediment. The predicted aggregate diameter behaves with the primary particle diameter in a relatively complicated manner. For a relatively high value of solid volume fraction, the predicted aggregate diameter increases monotonously with increasing primary particle diameter. While for a relatively low value of solid volume fraction, the predicted aggregate diameter increases with the primary particle diameter first, but decreases with increasing primary particle diameter at the diameter around 0.01 mm, and then converts to increase again.
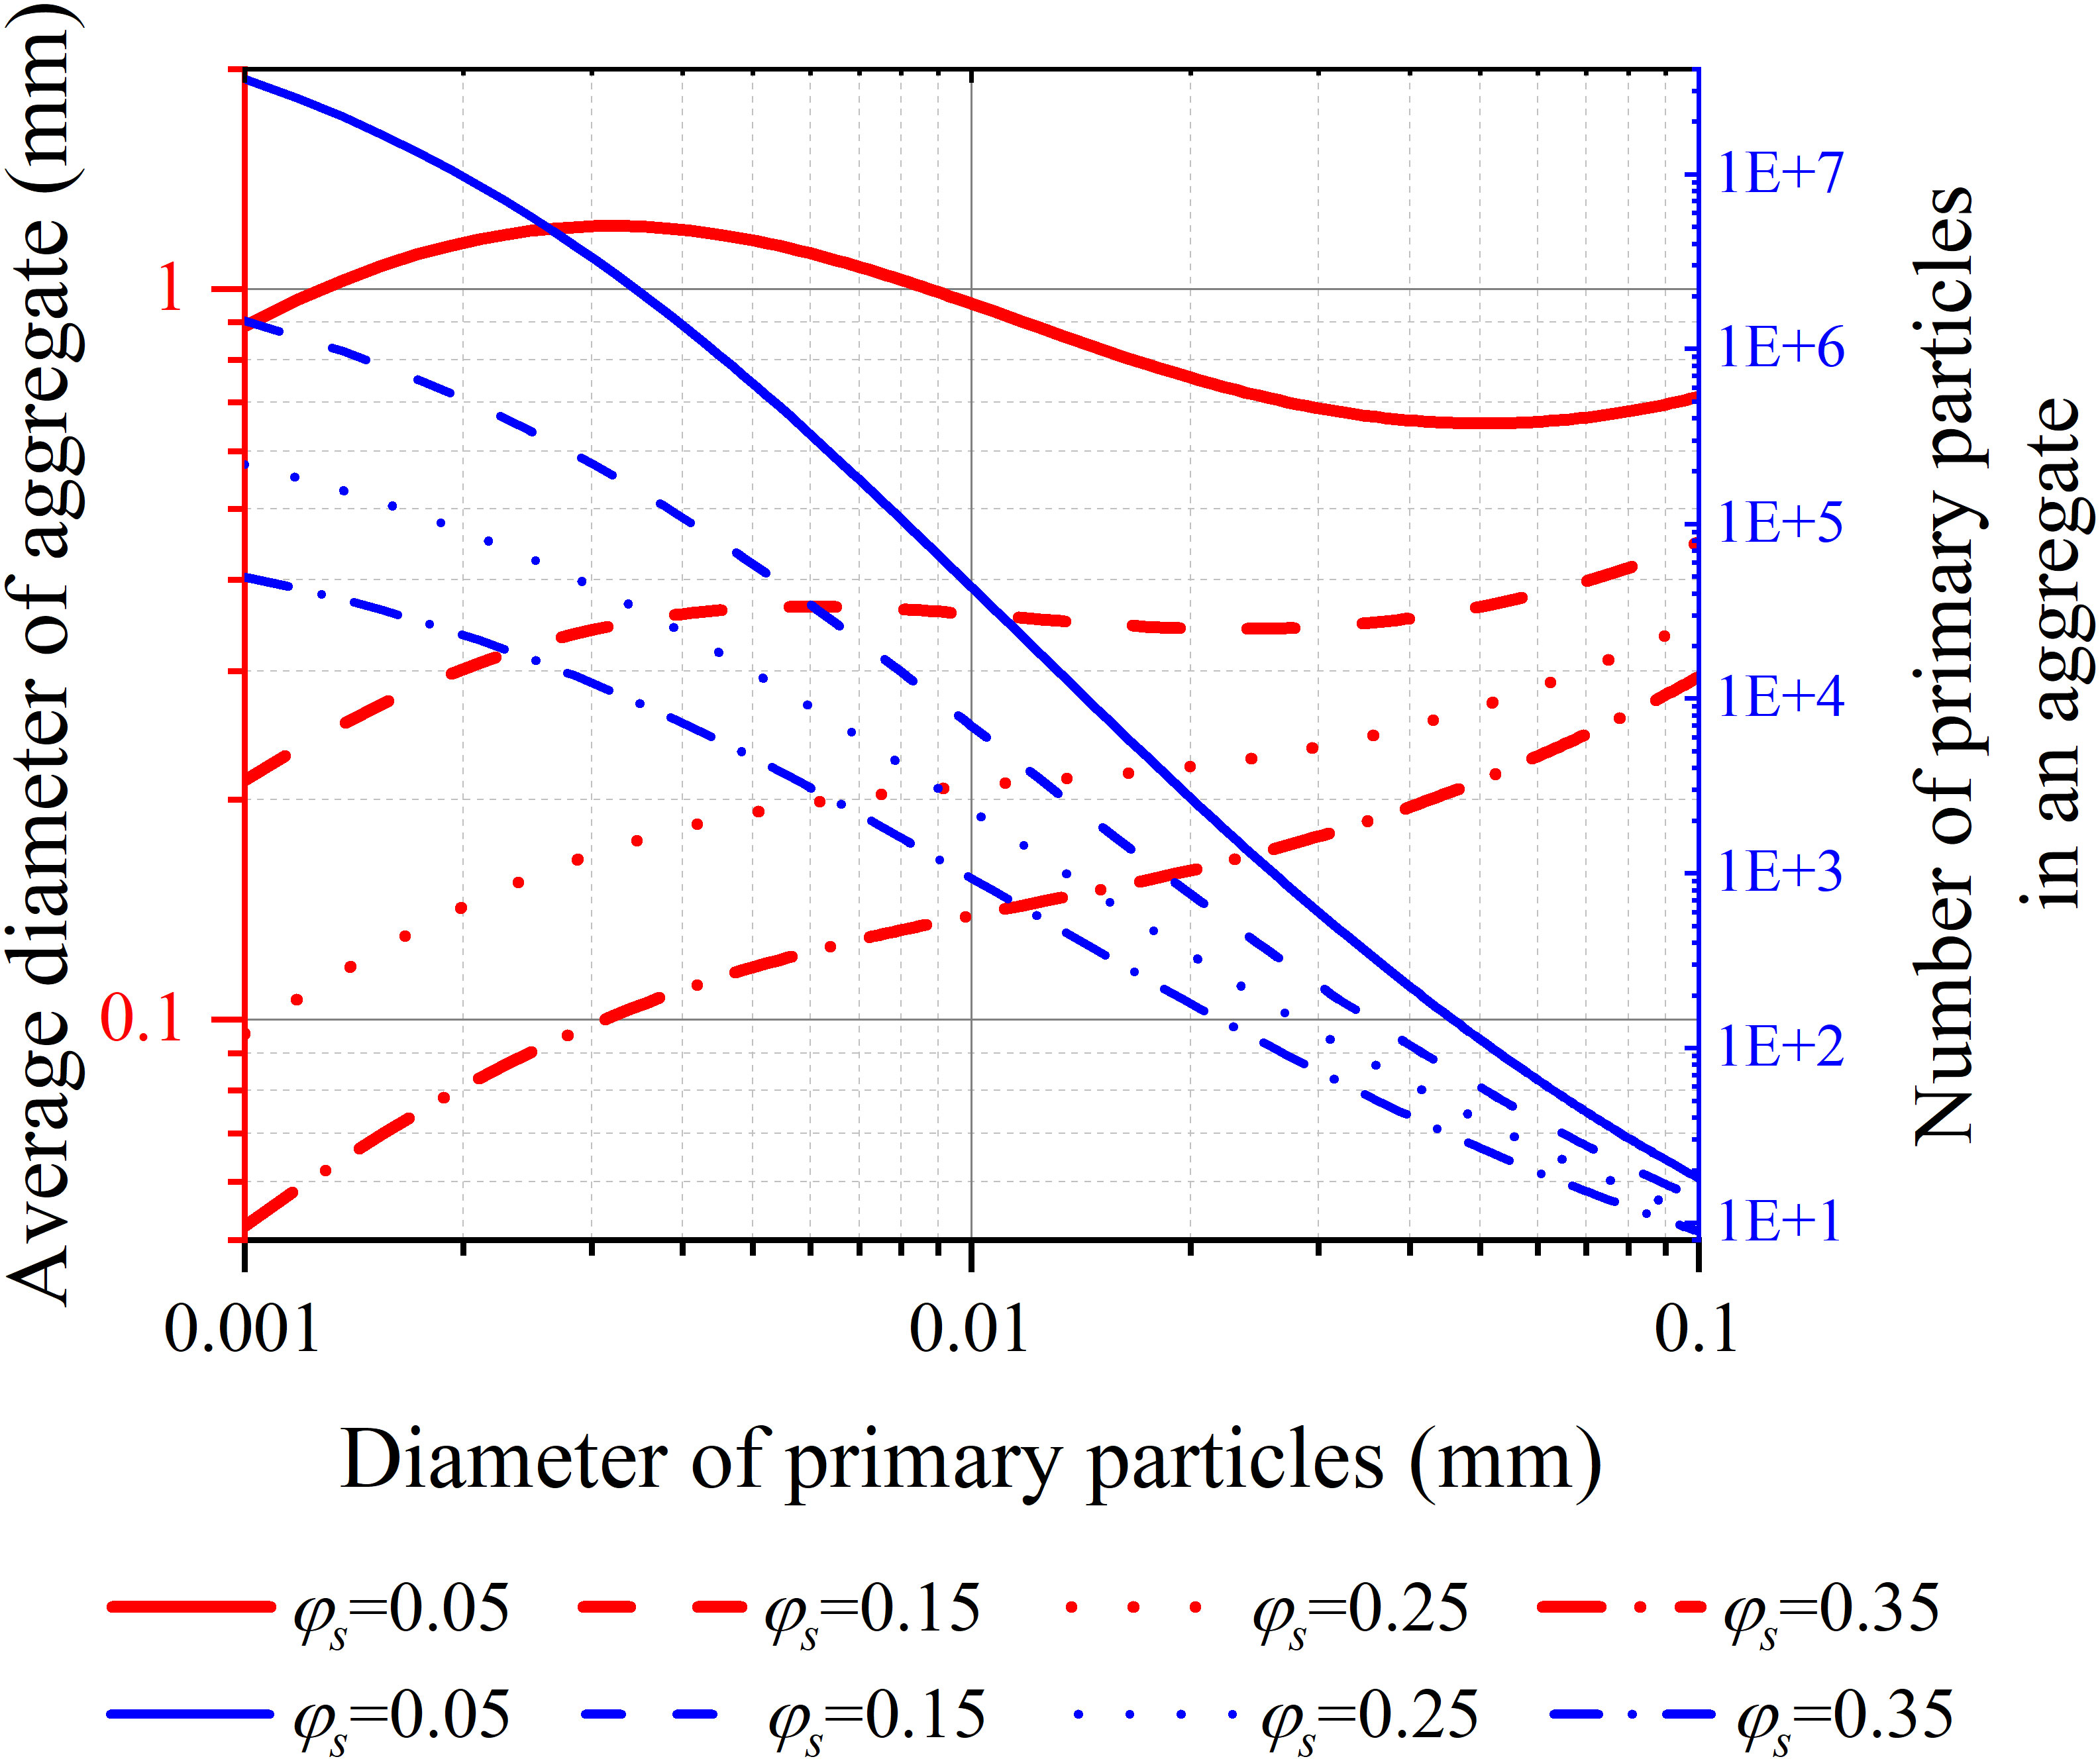
Figure 8 The predicted aggregate diameter and the average number of primary particles in an aggregate varying with the primary particle diameter and the solid volume fraction.
The predicted diameter of aggregates is mainly on the order of magnitude of tens of microns to hundreds of microns for cohesive sediment of a solid volume fraction in the range of 0.05 ~ 0.35 (a typical range for cohesive sediment). The range of the predicted diameter of aggregates is consistent with the observations of the surface erosion of cohesive fractal aggregates by Thomsen and Gust (2000); Righetti and Lucarelli (2007) and Forsberg et al. (2018). However, some researchers observed the eroded aggregates from cohesive bed surfaces could be up to 2 ~ 4 mm, e.g., Amos et al. (2003); Sharif (2003); Mostafa et al. (2008). This would be because the aggregates are usually of a broad size distribution range, which has been observed by Thomsen and Gust (2000); Righetti and Lucarelli (2007) and Forsberg et al. (2018). While the diameter of aggregates calculated by Eq. (4) is only the average diameter.
Eq. (19) suggests the erosion threshold of cohesive sediment comes from two parts, respectively contributed by the submerged weight of the aggregate (which corresponds to the product of θcr0(da*) and the first term in the square brackets) and the cohesive strength (corresponding to the product of θcr0(da*) and the second term). The contribution rate of the submerged aggregate weight to the erosion threshold equals the ratio of the first term in the square brackets in Eq. (19) to the sum of the first term and the second term. Figure 9 shows the critical Shields parameter of cohesive sediment and the contribution rate of the submerged aggregate weight varying with the particle diameter and the solid volume fraction. In the calculations, the coefficient C is taken the guideline value for natural mud of no organic matter, i.e., 6.49×10⁻⁵ J m-2. The threshold band and the mean threshold curve for noncohesive sediment are also plotted in the figure. The upper and lower boundaries of the threshold band are calculated by the formulae of Paphitis (2001). The mean threshold curve is calculated by the formula of Soulsby and Whitehouse (1997). As shown in Figure 9, the calculated critical Shields parameter increases with increasing solid volume fraction for the same particle diameter and decreases with increasing particle diameter for the same solid volume fraction. It is found that for those sediments of large particle diameters and low solid volume fractions, the calculated critical Shields parameters could be lower than the threshold values of noncohesive sediments. In fact, this would not happen in practical circumstances as a sediment bed consisting of relatively large particles is only formed with enough high solid volume fraction. From this point of view, the applicable range for Eq. (19) in natural mud of no organic matter is given by:
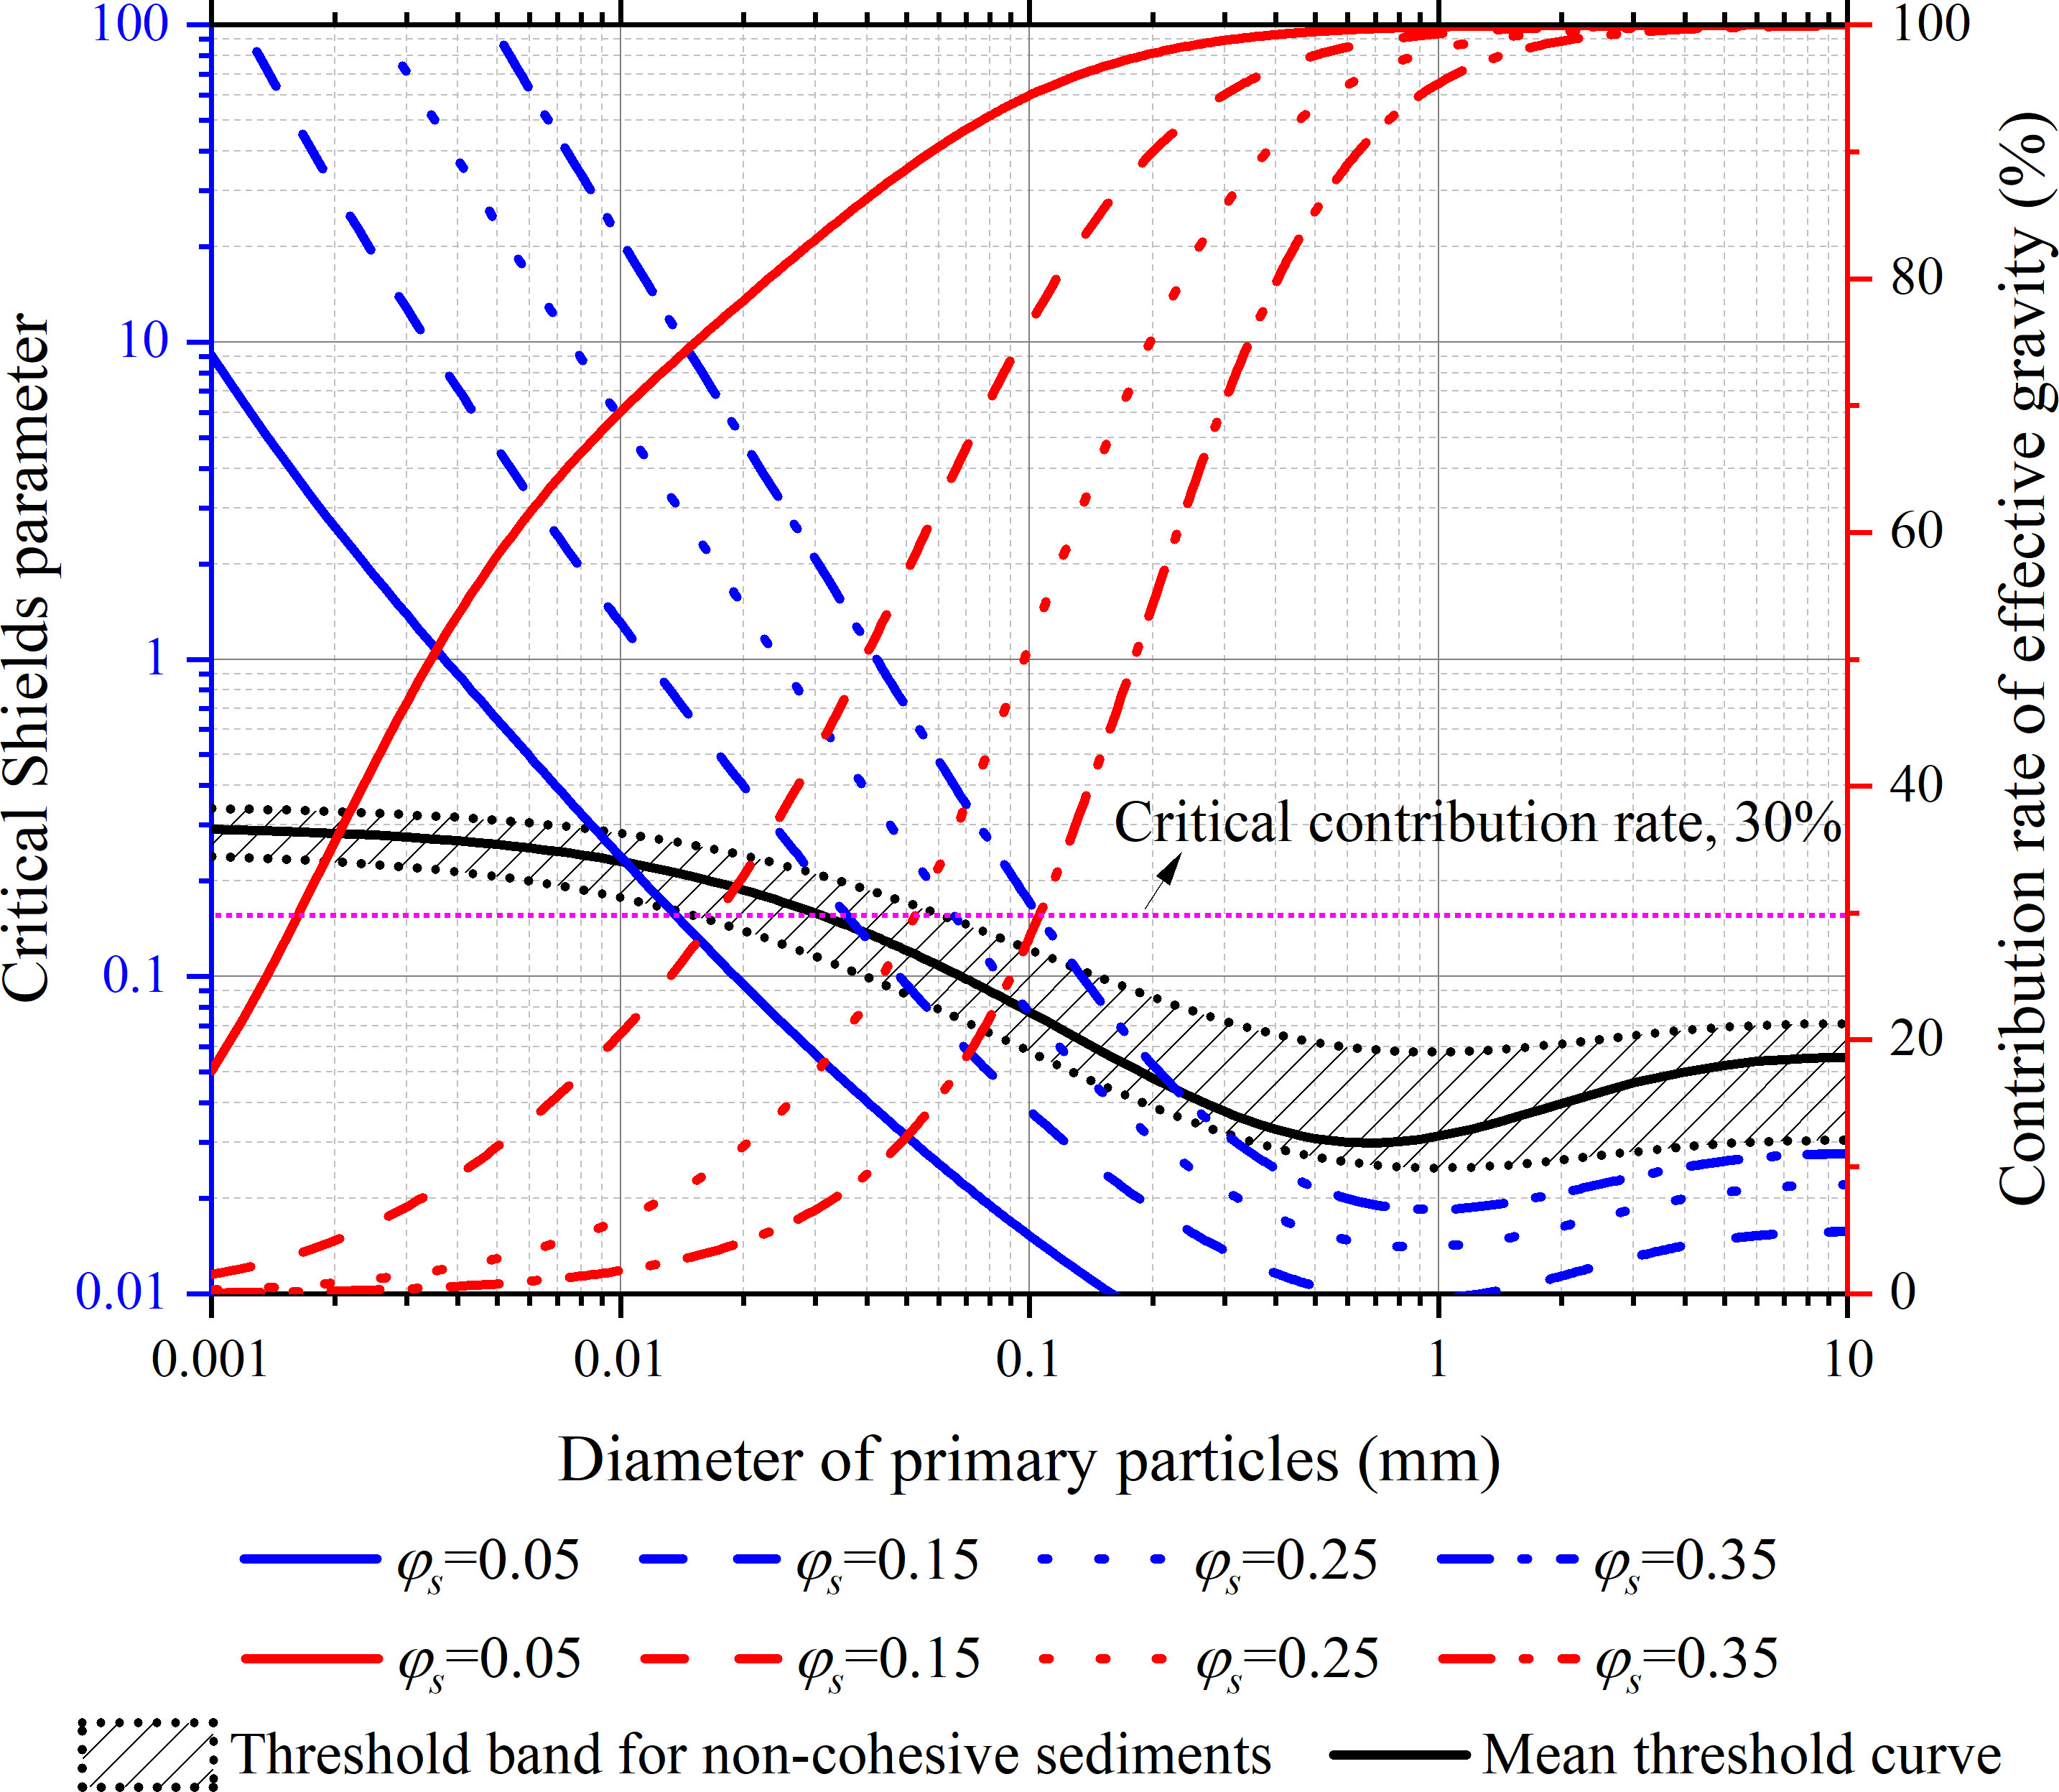
Figure 9 The critical Shields parameter and contribution rate of effective gravity of aggregate versus diameter of primary particles and solid volume fraction.
where dp0 is a reference diameter, being 0.001 m.
As shown in Figure 9, the contribution rate of the effective weight of aggregate decreases with increasing solid volume fraction for the same particle diameter and increases with increasing particle diameter for the same solid volume fraction. It is found that the contribution rate of the effective weight of aggregate is sufficiently low to be negligible for the sediment of relatively small particle diameter and high solid volume fraction, e.g., the contribution rate is approximately 0.6 ~ 2.1% for the sediment of the particle diameter 0.004 mm and the solid volume fraction in the range of 0.25-0.35. However, for those sediments of relatively large particle diameters and low solid volume fractions, the contribution rate of the effective weight of aggregate could be high that cannot be ignored. For example, for the sediment of the particle diameter 0.02 mm with the solid volume fraction in the range of 0.10~ 0.15, the contribution rate of the effective weight is between 33 and 53%.
Here a critical contribution rate is further proposed, being 30%, below which the contribution rate of the effective gravity of cohesive sediment to the erosion threshold is considered negligible, while beyond which the contribution rate of the effective gravity is significant that should be taken into account. According to the calculations of Eq. (19), for natural mud of no organic matter, the contribution rate of the effective gravity of cohesive sediment is higher than the critical contribution rate when
While for the sediments of φs>(dp/dp0)0.47, the contribution rate of the effective gravity of sediment is lower than the critical contribution rate. For those sediments, Eq. (19) can be simplified to the following form:
where A=θcr0(da*)C . The value of θcr0(da*) varies in a narrow range for the sediments of φs>(dp/dp0)0.47 .Therefore, the value of A could be approximately constant.
Eq. (29) shows the critical Shields parameter approaches zero with the increase of the particle diameter provided a low value of A as it is inversely proportional to the square of the particle diameter. Since the critical Shields parameter of non-cohesive sediment, i.e., θcr=θcr0(dp*) , is generally far lower than the critical Shields parameter of the cohesive sediment for fine particles, Eq. (29) is further revised into the following form to make it applicable for both cohesive sediment and non-cohesive sediment:
According to the collected experimental data, the guideline or reference values of A obtained by the same approach of the reference values of C are given as: 5.24×10⁻⁶ J m-2 for kaolinite; 1.00×10⁻⁷ J m-2 for quartz and noncohesive sediments; 6.54×10⁻⁵ J m-2 for natural mud of 11 ~ 19% organic matters; and 3.71×10⁻⁶ J m-2 for natural mud of no organic matter. Figure 10 shows the comparison of Eq. (30) and the measured critical Shields parameters of those sediments of solid volume fractions higher than (dp/dp0)0.47 in the series of coastal mud. The agreement is generally good.
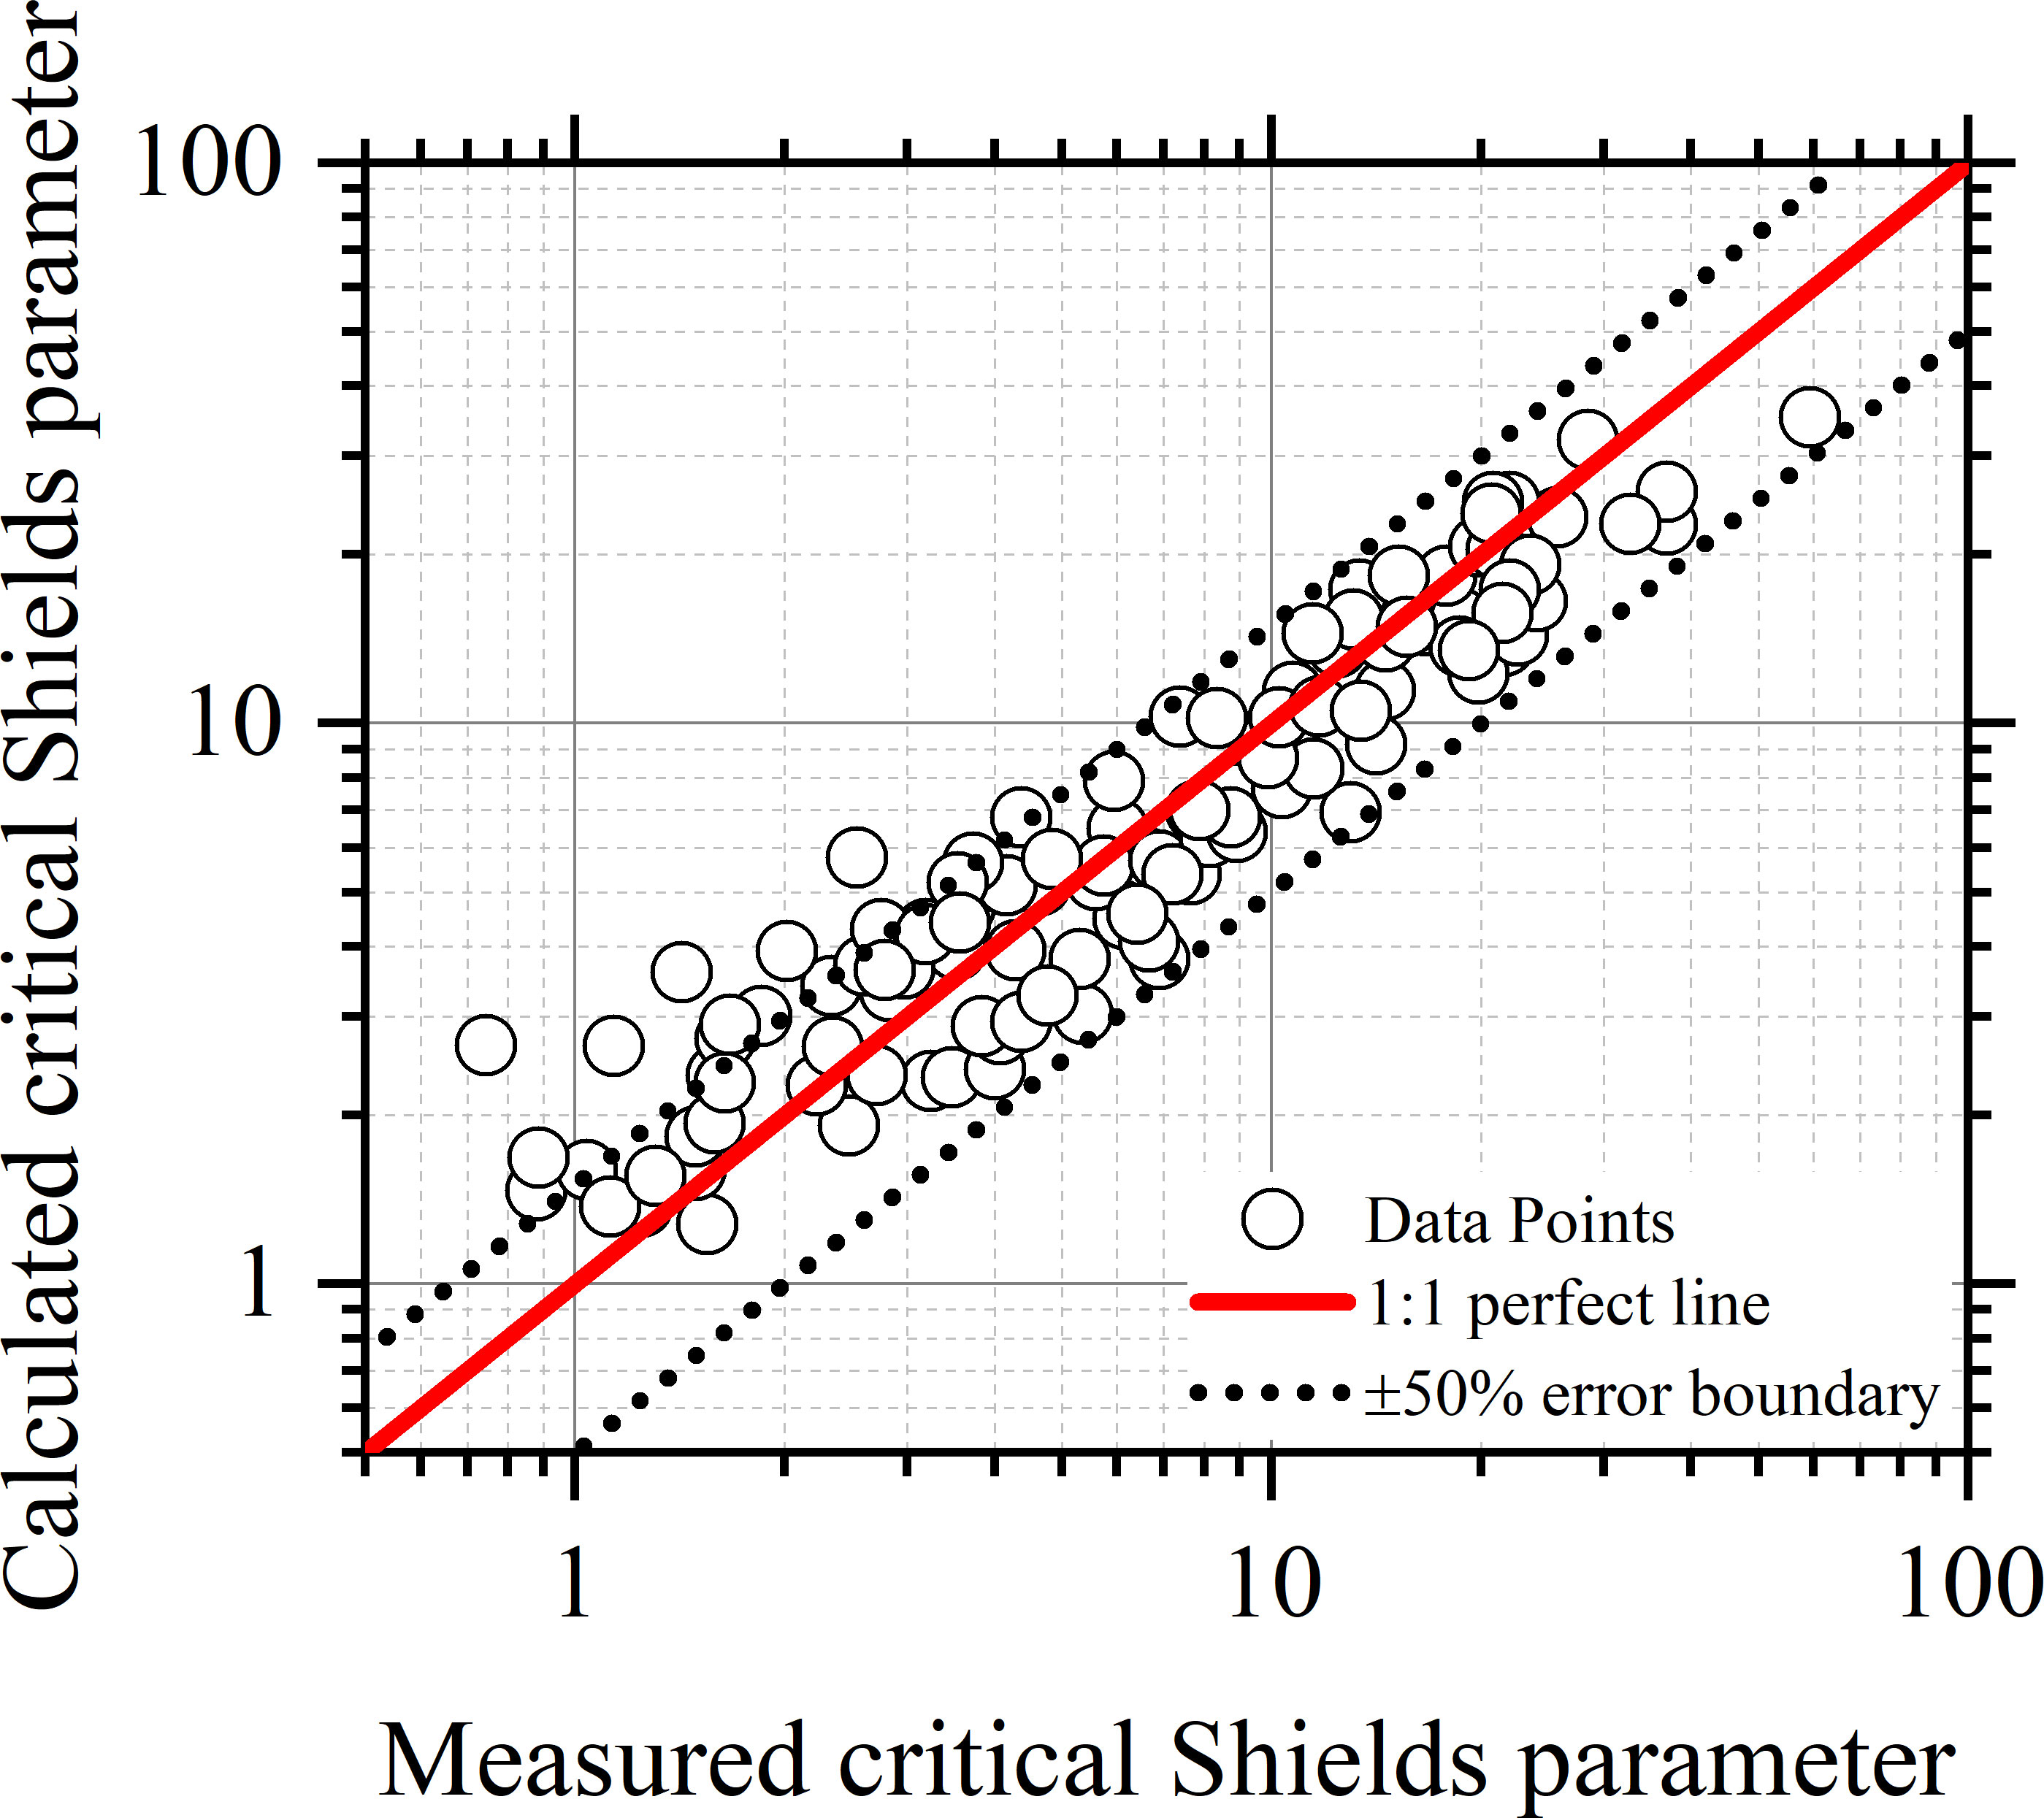
Figure 10 Comparison of the calculated critical Shields parameters by Eq. (30) and measured critical Shields parameters for sediments of the contribution rate of effective gravity lower than 30% in the datasets of coastal mud.
Figure 11 shows the critical Shields parameter predicted by Eq. (30) varying with the particle diameter and the solid volume fraction for A = 1.00×10⁻⁷ J m-2. The critical Shields parameters of quartz of different particle diameters measured by Roberts et al. (1998) are also plotted in the figure. It shows that Eq. (30) could reproduce well the critical Shields parameter of both fine cohesive quartz and coarse non-cohesive quartz, demonstrating the capacity of Eq. (30). It is emphasized here that A in Eq. (30) is an empirical coefficient. Its value not only reflects the cohesion strength of cohesive sediment but also covers part of the effect of particle aggregation and accounts for part of the compensation of the neglected aggregate weight. Compared with Eqs. (19), (25) & (26), Eq. (30) is simpler that could be used where the characteristics of aggregate erosion are not necessary to be considered. While Eqs. (19), (25) & (26) provide a complete solution to the threshold of surface erosion of cohesive sediment, in which the fractal bed aggregation is appropriately taken into account.
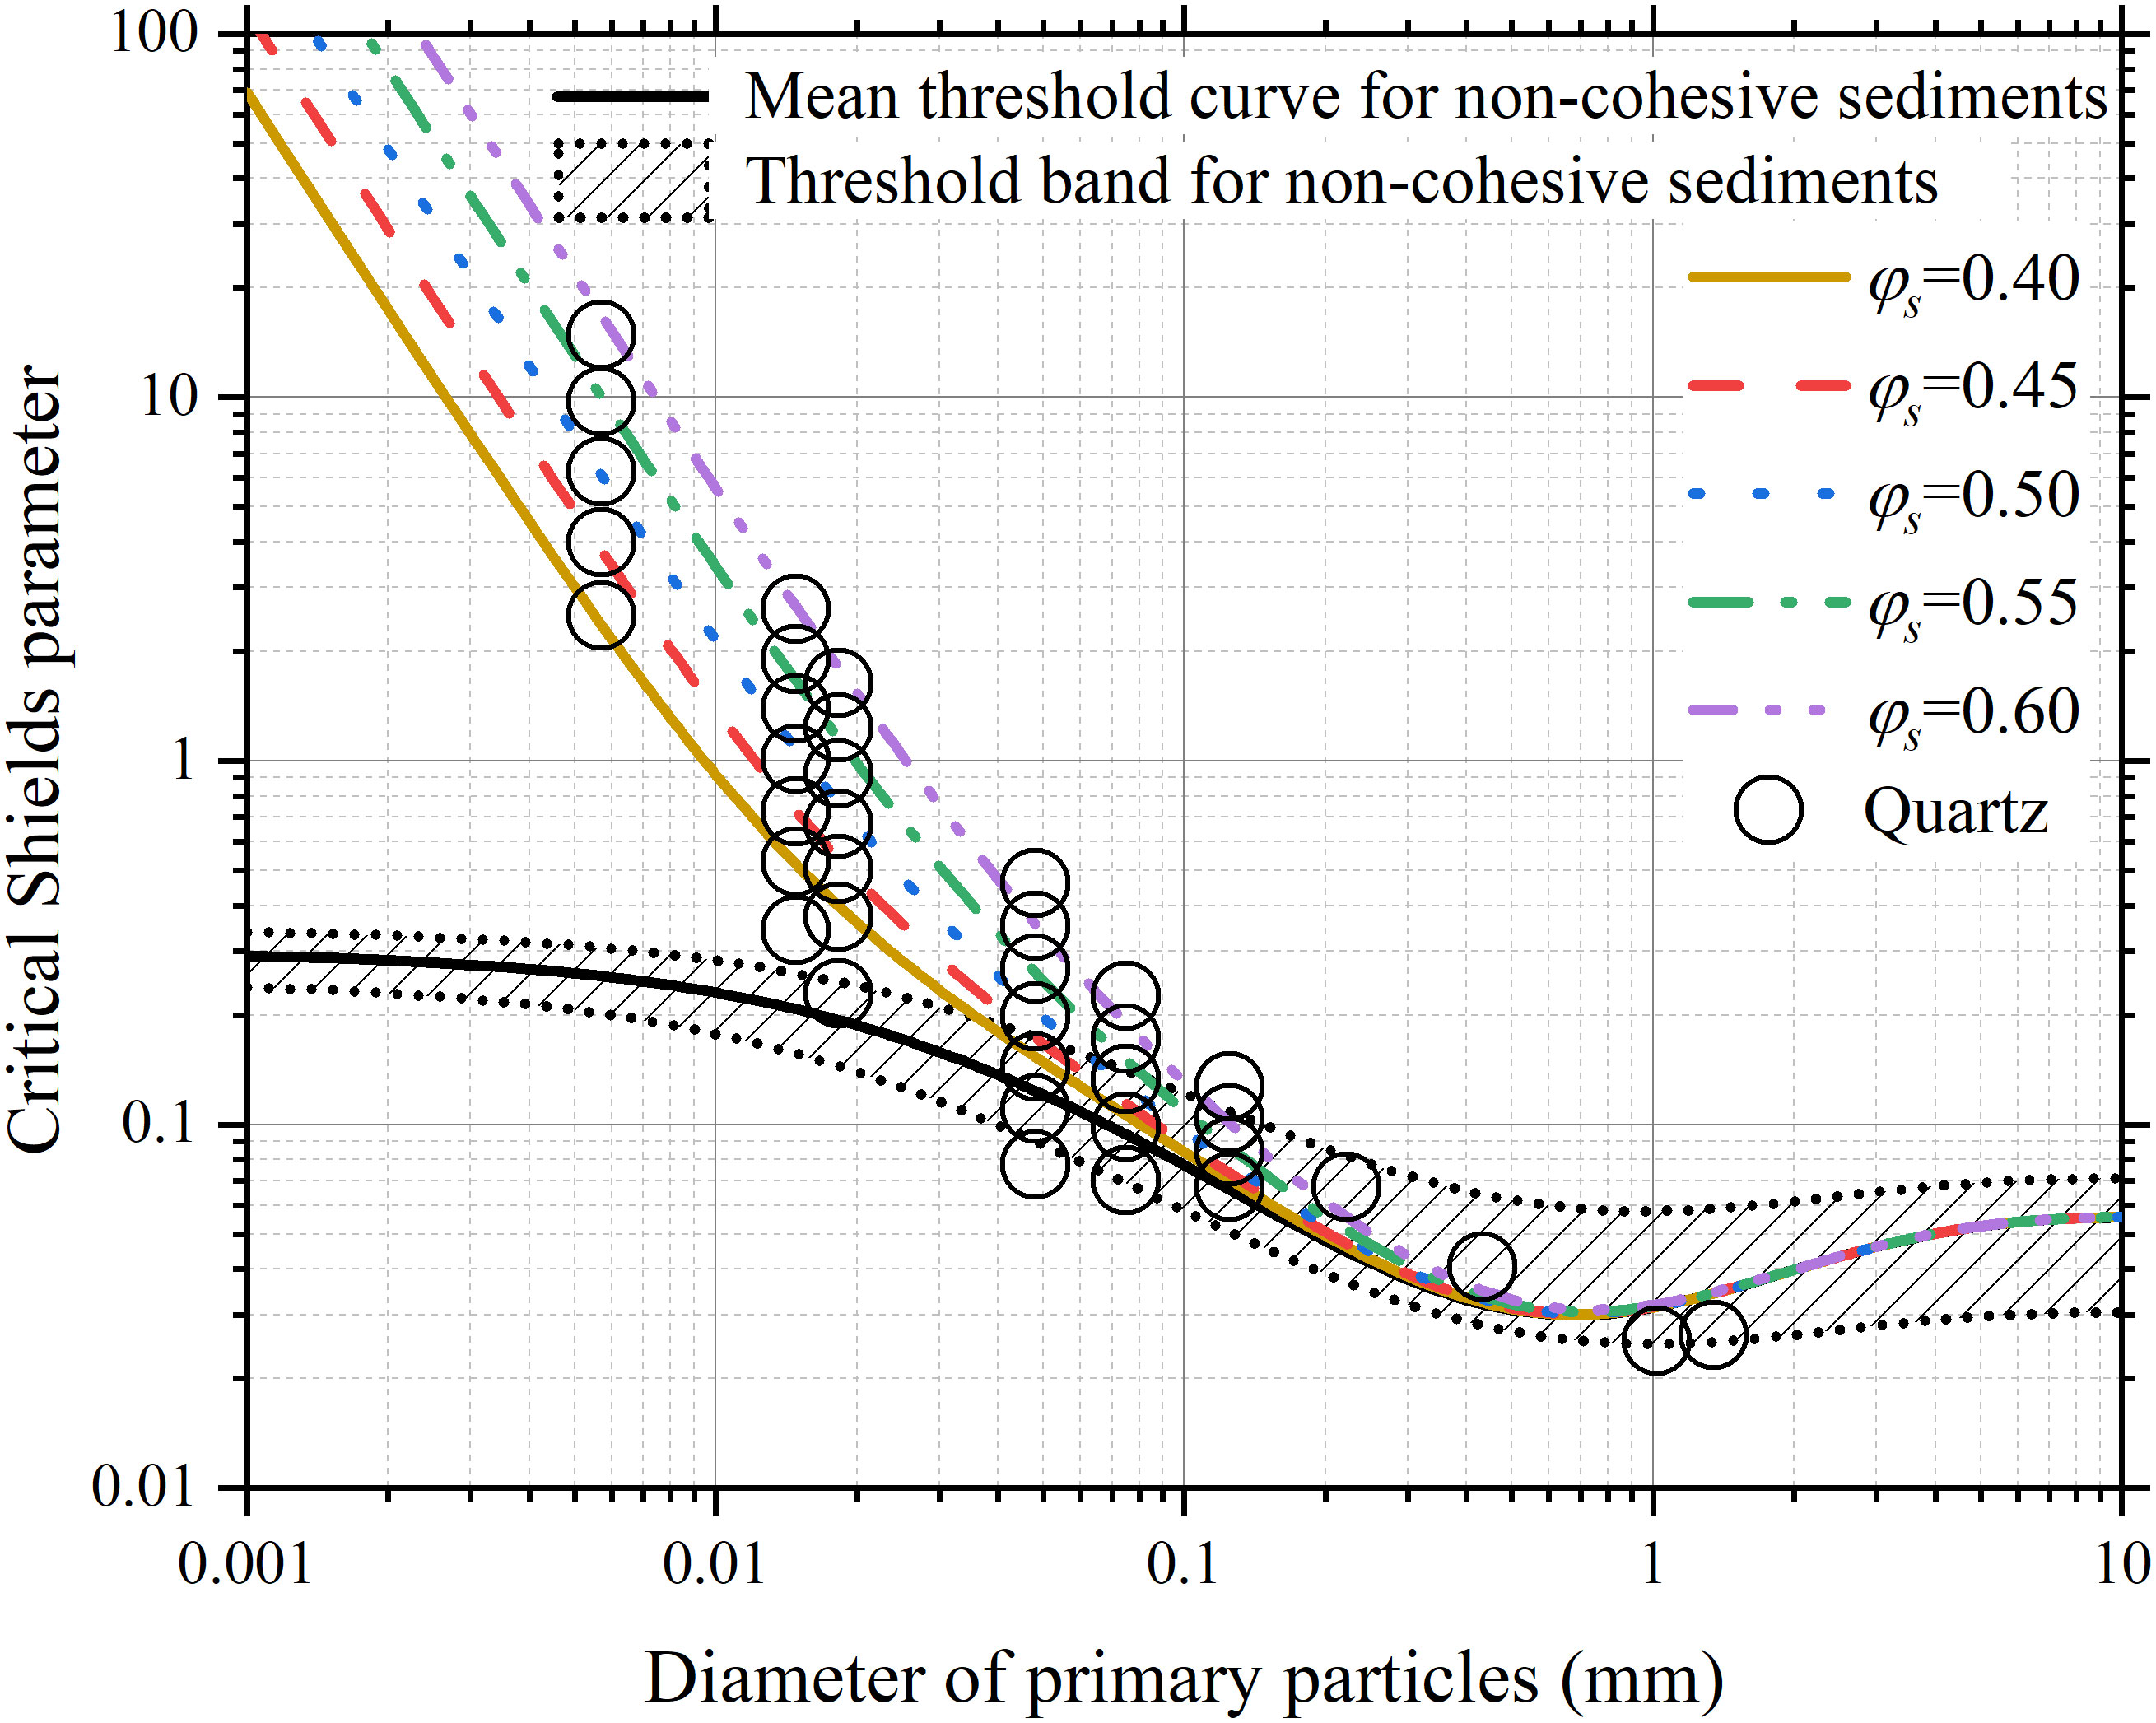
Figure 11 The critical Shields parameter predicted by Eq. (30) varying with the diameter of primary particles and solid volume fraction and being compared with the critical Shields parameters of quartz of different particle diameters measured by Roberts et al. (1998).
Conclusion
The threshold of surface erosion of cohesive sediments composed of fractal aggregates is investigated in this study. The fractal theory is employed to describe the size and density of cohesive sediment aggregates and the van der Waals force is introduced to quantify the cohesive force between particles. A formula for the critical shear stress for erosion of cohesive sediment aggregates is obtained by analyzing the momentum balance of an aggregate at the bed surface under the critical condition of initial motion. It is expressed as a function of the diameter of primary particles and the solid volume fraction, and has two coefficients: the fractal dimension F and the cohesion coefficient C.
The developed formula, i.e., Eq. (19), has been successfully applied to three groups of kaolinite, two groups of quartz, nine groups of lake and pond mud, and nine groups of coastal mud with two approaches. One is treating the fractal dimension F as a constant and the other is regarding the fractal dimension F as a function of the diameter of primary particles and the compactness degree of sediment. The first approach is not recommended as the fractal dimension F is insufficiently constrained to give any meaningful value. Formulae [i.e., Eqs. (25) & (26)] are developed for predicting the fractal dimension F based on the application results of the developed formula. The two formulae for predicting F constitute a complete solution to the threshold of surface erosion of cohesive sediment along with Eq. (19).
The cohesion coefficient C denotes the cohesion strength of sediment, with its value usually being site- or sediment- specific. Guideline or reference values of C are given based on the collected experimental data.
According to the function for the fractal dimension and the fractal theory, the average diameter of aggregates is mainly on the order of magnitude of hundreds of microns. The contribution rate of the submerged aggregate weight could be high and cannot be ignored for the sediments of relatively large particle diameters and low solid volume fractions. While for the sediments of relatively small particle diameter and high solid volume fraction, the contribution rate of the submerged aggregate weight is sufficiently low that could be negligible. For those sediments, the developed formula could further be simplified into a simple formula with only one coefficient.
Notation
A = coefficient (J m-2)
Ah = Hamaker constant (J)
C = coefficient (J m-2)
Cd, CI= drag and lift coefficients (-)
Cn = coordination number (-)
dɑ = aggregate diameter (m)
dp = diameter of primary particles (m)
dpr = reference particle diameter (m)
dp0 = reference particle diameter (m)
dɑ* = dimensionless diameter of aggregates (-)
dp* = dimensionless diameter of primary particles (-)
Er = relative error (-)
F = fractal dimension (-)
Fc = resultant cohesive force (kg m s-2)
Fd = drag force (kg m s-2)
FI = lift force (kg m s-2)
fc = van der Waals force (kg m s-2)
Gɑ = submerged weight of the aggregate (kg m s-2)
ɡ = gravitational acceleration (m s-2)
K1, K2, K3, K4, K5, K6, = coefficients (-)
̸∆ = separation distance between two particles (m)
log Erms = logarithmic root-mean-square error (-)
N = total number of the data (-)
n = number of particles in the buried surface of the aggregate (-)
Np = number of primary particles in the aggregate of a diameter dɑ (-)
Npɑ= number of cohesive particles per unit area of the aggregate surface (-)
Npb = number of cohesive particles per unit area of the bed surface (-)
s = average center-to-center distance between neighboring particles (m)
u͙ = shear velocity (m s-1)
ɑ1 = area shape factor of aggregate (-)
ɑ2 = volumetric shape coefficient of aggregate (-)
β = coefficient (-)
δ = thickness of the water film coating particles (m)
ƞ = coefficient (-)
ƞ∆ = relative protruding height of an aggregate (-)
Ɵcr0 = critical Shields parameter of noncohesive sediment (-)
ʋ = kinematic viscosity of water (m2 s)
ρ = density of water (kg m-3)
ρ ɑ = density of aggregate (kg m-3)
ρ b = bulk density of sediment (kg m-3)
ρ s = density of primary particles (kg m-3)
τb = bed shear stress (Pa)
τcr = critical shear stress (Pa)
τcr,c = calculated critical shear stress (Pa)
τcr ,m = measured critical shear stress (Pa)
φ ɑ = volume fraction of aggregates (-)
φ s = volume fraction of primary particles (-)
Data availability statement
The original contributions presented in the study are included in the article/supplementary material. Further inquiries can be directed to the corresponding author.
Author contributions
DC and CZ contributed to the conception of the study, the theory development, and manuscript preparation. JZ and DG contributed significantly to constructive discussions. YL and HH contributed to the analysis of the data for the work. All authors contributed to the article and approved the submitted version.
Funding
This work was supported by the National Natural Science Foundation of China [52101310]; the National Natural Science Foundation of China [51879096, 51979096]; the Major International (Regional) Joint Research Project of National Natural Science Foundation of China [51920105013] and the Key Project of NSFC-Shangdong Joint Research Funding POW3C [U1906230].
Conflict of interest
The authors declare that the research was conducted in the absence of any commercial or financial relationships that could be construed as a potential conflict of interest.
Publisher’s note
All claims expressed in this article are solely those of the authors and do not necessarily represent those of their affiliated organizations, or those of the publisher, the editors and the reviewers. Any product that may be evaluated in this article, or claim that may be made by its manufacturer, is not guaranteed or endorsed by the publisher.
References
Amos C., Bergamasco A., Umgiesser G., Cappucci S., Cloutier D., DeNat L., et al. (2004). The stability of tidal flats in Venice lagoon–the results of in-situ measurements using two benthic, annular flumes. J. Mar. Syst. 51 (1), 211–241. doi: 10.1016/j.jmarsys.2004.05.013
Amos C. L., Droppo I. G., Gomez E. A., Murphy T. P. (2003). The stability of a remediated bed in Hamilton harbour, lake Ontario, Canada. Sedimentology 50 (1), 149–168. doi: 10.1046/j.1365-3091.2003.00542.x
Aubert C., Cannell D. S. (1986). Restructuring of colloidal silica aggregates. Phys. Rev. Lett. 56 (7), 738. doi: 10.1103/PhysRevLett.56.738
Bowers D., McKee D., Jago C., Nimmo-Smith W. (2017). The area-to-mass ratio and fractal dimension of marine flocs. Estuarine Coast. Shelf Sci. 189, 224–234. doi: 10.1016/j.ecss.2017.03.026
Chang T. S., Joerdel O., Flemming B. W., Bartholomä A. (2006). The role of particle aggregation/disaggregation in muddy sediment dynamics and seasonal sediment turnover in a back-barrier tidal basin, East Frisian wadden Sea, southern north Sea. Mar. Geology 235 (1-4), 49–61. doi: 10.1016/j.margeo.2006.10.004
Chauchat J., Guillou S., Pham Van Bang D., Dan Nguyen K. (2013). Modelling sedimentation–consolidation in the framework of a one-dimensional two-phase flow model. J. Hydraulic Res. 51 (3), 293–305. doi: 10.1080/00221686.2013.768798
Chen S., Eisma D. (1995). Fractal geometry of in situ flocs in the estuarine and coastal environments. Netherlands J. Sea Res. 33 (2), 173–182. doi: 10.1016/0077-7579(95)90004-7
Chen D., Wang Y., Melville B., Huang H., Zhang W. (2018). Unified formula for critical shear stress for erosion of sand, mud, and sand-mud mixtures. J. Hydraulic Eng. 144 (8), 04018046. doi: 10.1061/(Asce)Hy.1943-7900.0001489
Chen D., Zheng J., Zhang C., Guan D., Li Y., Wang Y. (2021). Critical shear stress for erosion of sand-mud mixtures and pure mud [Original research]. Front. Mar. Sci. 8 (1502). doi: 10.3389/fmars.2021.713039
Chien N., Wan Z. (1999). Mechanics of sediment transport. Ed. McNown J. S. (Reston, VA: ASCE Press). Trans.; ASCEOriginal in Chinese published by China Science Press, Beijing. ed. doi: 10.1061/9780784404003
Debnath K., Chaudhuri S. (2010). Cohesive sediment erosion threshold: A review. ISH J. Hydraulic Eng. 16 (1), 36–56. doi: 10.1080/09715010.2010.10514987
Deriagin B. I., Malkin A. D. (1950). Cohesive forces between quartz fibers in water environments. Colloid J. 12 (6), 431–447. (in Russian)
Dickhudt P. J., Friedrichs C. T., Sanford L. P. (2011). Mud matrix solids fraction and bed erodibility in the York river estuary, USA, and other muddy environments. Continental Shelf Res. 31 (10, Supplement), S3–S13. doi: 10.1016/j.csr.2010.02.008
Dou G. (1962). Theory for incipient motion of sediment. Scientia Sin. 11 (7), 999–1032. (in Russian)
Dyer K., Manning A. (1999). Observation of the size, settling velocity and effective density of flocs, and their fractal dimensions. J. Sea Res. 41 (1-2), 87–95. doi: 10.1016/S1385-1101(98)00036-7
Fall K. A., Friedrichs C. T., Massey G. M., Bowers D. G., Smith S. J. (2021). The importance of organic content to fractal floc properties in estuarine surface. Waters: Insights From Video LISST Pump Sampling 126 (1), e2020JC016787. doi: 10.1029/2020JC016787
Forsberg P. L., Skinnebach K. H., Becker M., Ernstsen V. B., Kroon A., Andersen T. J. (2018). The influence of aggregation on cohesive sediment erosion and settling. Continent. Shelf Res. 171, 52–62. doi: 10.1016/j.csr.2018.10.005
Grabowski R. C., Ppo I. G., Wharton G. (2011). Erodibility of cohesive sediment: The importance of sediment properties. Earth-Science Rev. 105 (3), 101–120. doi: 10.1016/j.earscirev.2011.01.008
Han Q. (1982). Characteristics of incipient sediment motion and incipient velocity. J. Sediment Res. 2, 11–26. (in Chinese).
Hasmy A., Anglaret É., Thouy R., Jullien R. (1997). Fluctuating bond aggregation: a numerical simulation of neutrally-reacted silica gels. J. Physique I 7 (3), 521–542. doi: 10.1051/jp1:1997173
Hoath S. D. (2016). Fundamentals of inkjet printing: the science of inkjet and droplets. Weingeim, Germany: Wiley‐VCH.
Hong R., Xu S. (1991). Experimental study on incipient of mud in a fluid. J. Tianjin. Univ.(S2), 79–85. (in Chinese).
Hua X., Huang H., Wang Y., Lan Y., Zhao K., Chen D. (2019). Abnormal ETM in the North Passage of the Changjiang River Estuary: Observations in the wet and dry seasons of 2016. Estuarine Coast. Shelf Sci. 227, 12. doi: 10.1016/j.ecss.2019.106334
Huang J. (1989). An experimental study of the scouring and settling properties of cohesive sediment. Ocean Eng. 7(1), 61–70. (in Chinese).
Jacobs W., Le Hir P., Van Kesteren W., Cann P. (2011). Erosion threshold of sand-mud mixtures. Continental Shelf Res. 31 (10), 514–525. doi: 10.1016/j.csr.2010.05.012
Khelifa A., Hill P. S. (2006). Models for effective density and settling velocity of flocs. J. Hydraulic Res. 44 (3), 390–401. doi: 10.1080/00221686.2006.9521690
Kranenburg C. (1994). The fractal structure of cohesive sediment aggregates. Estuarine Coast. Shelf Sci. 39 (5), 451–460. doi: 10.1006/ecss.1994.1075
Krone R. B. (1963). A study of rheologic properties of estuarial sediments (Technical bulletin no. 7). (California Univ Berkeley Sanitary Engineering Research Lab. Vicksburg, MS).
Krone R. B. (1986). “The significance of aggregate properties to transport processes,” in Estuarine cohesive sediment dynamics, Tampa, Florida: Springer 1986, 66–84.
Kusuda T., Umita T., Koga K., Futawatari T., Awaya Y. (1984). Erosional process of cohesive sediments. Water Sci. Technol. 17 (6-7), 891–901.
Lazzari S., Nicoud L., Jaquet B., Lattuada M., Morbidelli M. (2016). Fractal-like structures in colloid science. Adv. colloid Interface Sci. 235, 1–13. doi: 10.1016/j.cis.2016.05.002
Lick W., Jin L., Gailani J. (2004). Initiation of movement of quartz particles. J. Hydraulic Eng. 130 (8), 755–761. doi: 10.1061/(ASCE)0733-9429(2004)130:8(755)
Li H., Yuan M., Zhang X. (1995). Study on critical motion and erosion of cohesive sediment. J. Waterway Harbor 3), 20–26. (in Chinese).
Li Y., Zhang C., Chen D., Zheng J., Sun J., Wang P. (2021). Barred beach profile equilibrium investigated with a process-based numerical model. Continent. Shelf Res. 222, 104432. doi: 10.1016/j.csr.2021.104432
Li Y., Zhang C., Dai W., Chen D., Sui T., Xie M., Chen S. (2022). Laboratory investigation on morphology response of submerged artificial sandbar and its impact on beach evolution under storm wave condition. Mar. Geo. 443, 106668. doi: 10.1016/j.margeo.2021.106668
Logan B. E., Kilps J. R. (1995). Fractal dimensions of aggregates formed in different fluid mechanical environments. Water Res. 29 (2), 443–453. doi: 10.1016/0043-1354(94)00186-B
Maggi F., Mietta F., Winterwerp J. (2007). Effect of variable fractal dimension on the floc size distribution of suspended cohesive sediment. J. Hydrology 343 (1-2), 43–55. doi: 10.1016/j.jhydrol.2007.05.035
Mandelbrot B. (1967). How long is the coast of Britain? statistical self-similarity and fractional dimension. Science 156 (3775), 636–638.
McAnally W. H., Mehta A. J. (2000). Aggregation rate of fine sediment. J. Hydraulic Eng. 126 (12), 883–892. doi: 10.1061/(ASCE)0733-9429(2000)126:12(883)
McAnally W. H., Mehta A. J. (2002). Significance of aggregation of fine sediment particles in their deposition. Estuarine Coast. Shelf Sci. 54 (4), 643–653. doi: 10.1006/ecss.2001.0847
Mehta A. J. (2014). An introduction to hydraulics of fine sediment transport. (Vol. 38) Hackensack: World Scientific Publishing Company.
Mehta A. J., Hayter E. J., Parker W. R., Krone R. B., Teeter A. M. (1989). Cohesive sediment transport. I: Process description. J. Hydraulic Eng. 115 (8), 1076–1093.
Meissner H., Michaels A., Kaiser R., Development (1964). Crushing strength of zinc oxide agglomerates. Ind. Eng. Chem. Process Design 3 (3), 202–205. doi: 10.1021/i260011a003
Mostafa T. S., Imran J., Chaudhry M. H., Kahn I. B. (2008). Erosion resistance of cohesive soils. J. Hydraulic Res. 46 (6), 777–787. doi: 10.1080/00221686.2008.9521922
Ockenden M., Delo E. (1988). Consolidation and erosion of estuarine mud and sand mixtures-an experimental study (Report no SR 149). H. R. Limited. Wallingford (UK).
Otsubo K., Muraoka K. (1988). Critical shear stress of cohesive bottom sediments. J. Hydraul. Eng. 114 (10), 1241–1256.
Owen M. (1970). A detailed study of the settling velocities of an estuary mud (INT 78). Ed. Station H. R. (Wallingford, HK).
Paphitis D. (2001). Sediment movement under unidirectional flows: an assessment of empirical threshold curves. Coast. Eng. 43 (3), 227–245. doi: 10.1016/S0378-3839(01)00015-1
Partheniades E. (1965). Erosion and deposition of cohesive soils. J. Hydraulics Division 91 (1), 105–139. doi: 10.1061/JYCEAJ.0001165
Perkey D. W., Smith S. J., Fall K. A., Massey G. M., Friedrichs C. T., Hicks E. M. (2020). Impacts of muddy bed aggregates on sediment transport and management in the tidal James river, VA. J. Waterway Port Coastal Ocean Eng. 146, 5, 04020028. doi: 10.1061/(ASCE)WW.1943-5460.0000578
Righetti M., Lucarelli C. (2007). May the shields theory be extended to cohesive and adhesive benthic sediments? J. Geophysical Research: Oceans 112, C05039. doi: 10.1029/2006JC003669
Roberts J., Jepsen R., Gotthard D., Lick W. (1998). Effects of particle size and bulk density on erosion of quartz particles. J. Hydraulic Eng. 124 (12), 1261–1267. doi: 10.1061/(ASCE)0733-9429(1998)124:12(1261)
Roberts J. D., Jepsen R. A., James S. C. (2003). Measurements of sediment erosion and transport with the adjustable shear stress erosion and transport flume. J. Hydraulic Eng. 129 (11), 862–871. doi: 10.1061/(ASCE)0733-9429(2003)129:11(862)
Sanford L. P., Maa J. P.-Y. (2001). A unified erosion formulation for fine sediments. Mar. Geology 179 (1), 9–23. doi: 10.1016/S0025-3227(01)00201-8
Schieber J., Southard J. B., Schimmelmann A.J.J.o. (2010). Lenticular shale fabrics resulting from intermittent erosion of water-rich muds–interpreting the rock record in the light of recent flume experiments J. Sediment. Res. 80, 1, 119–128. doi: 10.2110/jsr.2010.005
Serra T., Casamitjana X. (1998). Structure of the aggregates during the process of aggregation and breakup under a shear flow. J. colloid Interface Sci. 206 (2), 505–511. doi: 10.1006/jcis.1998.5714
Sharif A. R. (2003). Critical shear stress and erosion of cohesive soils (Buffalo, New York: State University of New York at Buffalo). PhD thesis.
Sharif A. R., Atkinson J. F. (2012). Model for surface erosion of cohesive soils. J. Hydraulic Eng. 138 (7), 581–590. doi: 10.1061/(ASCE)HY.1943-7900.0000551
Smerdon E. T., Beasley R. P. (1959). Tractive force theory applied to stability of open channels in cohesive soils (University of Missouri, College of Agriculture, Agricultural Experiment Station. Columbia, MO). Research Bulletin No. 715.
Son M., Hsu T.-J. (2009). The effect of variable yield strength and variable fractal dimension on flocculation of cohesive sediment. Water Res. 43 (14), 3582–3592. doi: 10.1016/j.watres.2009.05.016
Soulsby R., Whitehouse R. (1997). “Threshold of sediment motion in coastal environments pacific coasts and ports' 97,” in Proceedings of the 13th Australasian Coastal and Ocean Engineering Conference and the 6th Australasian Port and Harbour Conference, Christchurch, New Zealand.
Ternat F., Boyer P., Anselmet F., Amielh M. (2008). Erosion threshold of saturated natural cohesive sediments: Modeling and experiments. Water Resour. Res. 44 (11), W11434. doi: 10.1029/2007WR006537
Thomsen L., Gust G. (2000). Sediment erosion thresholds and characteristics of resuspended aggregates on the western European continental margin. Deep Sea Res. Part I: Oceanographic Res. Papers 47 (10), 1881–1897. doi: 10.1016/S0967-0637(00)00003-0
Thorn M., Parsons J. (1980). “Erosion of cohesive sediments in estuaries: an engineering guide,” in Proc. of the 3rd Int. Symp. on Dredging Technol, BHRA, Cranfield, UK.
Torfs H., Jiang J., Mehta A. (2000). Assessment of the erodibility of fine/coarse sediment mixtures. Proc. Mar. Sci. 3, 109–123. doi: 10.1016/S1568-2692(00)80116-3
Vollmer S., Kleinhans M. G. (2007). Predicting incipient motion, including the effect of turbulent pressure fluctuations in the bed. Water Resour. Res. 43 (5), W05410. doi: 10.1029/2006WR004919
Whitehouse R. (2000). Dynamics of estuarine muds: A manual for practical applications. Thomas Telford, London
Winterwerp J. C. (1998). A simple model for turbulence induced flocculation of cohesive sediment. J. Hydraulic Res. 36 (3), 309–326. doi: 10.1080/00221689809498621
Winterwerp J. (2002). On the flocculation and settling velocity of estuarine mud. Continental Shelf Res. 22 (9), 1339–1360. doi: 10.1016/S0278-4343(02)00010-9
Winterwerp J. C., Van Kesteren W. G. (2004). Introduction to the physics of cohesive sediment dynamics in the marine environment. Vol. Vol. 56) (Amsterdam: Elsevier).
Winterwerp J., Kesteren W., Prooijen B., and Jacobs W. (2012). A conceptual framework for shear flow–induced erosion of soft cohesive sediment beds. J. Geophys. Res. Ocean 117 (C10), C10020. doi: 10.1029/2012JC008072
Wu H., Lattuada M., Morbidelli M. (2013). Dependence of fractal dimension of DLCA clusters on size of primary particles. Adv. colloid Interface Sci. 195, 41–49. doi: 10.1016/j.cis.2013.04.001
Wu W., Perera C., Smith J., Sanchez A. (2017). Critical shear stress for erosion of sand and mud mixtures. J. Hydraulic Res. 56 (1), 1–15. doi: 10.1080/00221686.2017.1300195
Xu D., Bai Y., Ji C., Williams J. (2015). Experimental study of the density influence on the incipient motion and erosion modes of muds in unidirectional flows: the case of huangmaohai estuary. Ocean Dynamics 65 (2), 187–201. doi: 10.1007/s10236-014-0803-9
Xu Y., Jiang H., Chu F., Liu C. (2014). Fractal model for surface erosion of cohesive sediments. Fractals 22 (03), 1440006. doi: 10.1142/S0218348X14400064
Yang M., Wang G. (1995). The incipient motion formulas for cohesive fine sediments. J. Basic Sci. Eng. 3 (1), 99–109. (in Chinese)
Yang B., Luo Y., Jeng D., Feng J., Huhe A. (2018). Experimental studies on initiation of current-induced movement of mud. Applied Ocean Res. 80, 220–227. doi: 10.1016/j.apor.2018.09.006.
Yuan S., Tang H., Li K., Xu L., Xiao Y., Gualtieri C., et al (2021). Hydrodynamics, sediment transport and morphological features at the confluence between the Yangtze River and the Poyang Lake. Water Resource. Res. 57 (3), e2020WR028284. doi: 10.1029/2020WR028284.
Zhang H. (2012). A unified formula for incipient velocity of sediment. J. Hydraulic Eng. 43 (12), 1387–1396. (in Chinese).
Zhang M., Yu G. (2017). Critical conditions of incipient motion of cohesive sediments. Water Resour. Res. 53 (9), 7798–7815. doi: 10.1002/2017WR021066
Zhang M., Yu G., La Rovere A., Ranzi R. (2017). Erodibility of fluidized cohesive sediments in unidirectional open flows. Ocean Eng. 130, 523–530. doi: 10.1016/j.oceaneng.2016.12.021
Keywords: erosion threshold, critical shear stress, surface erosion, cohesive sediment, sediment transport, fractal aggregates, coastal erosion
Citation: Chen D, Zheng J, Zhang C, Guan D, Li Y and Huang H (2022) Threshold of surface erosion of cohesive sediments. Front. Mar. Sci. 9:847985. doi: 10.3389/fmars.2022.847985
Received: 03 January 2022; Accepted: 23 August 2022;
Published: 15 September 2022.
Edited by:
Mouncef Sedrati, Université Bretagne Sud, FranceReviewed by:
Peter M.J. Herman, Delft University of Technology, NetherlandsLiqin Zuo, Nanjing Hydraulic Research Institute, China
Copyright © 2022 Chen, Zheng, Zhang, Guan, Li and Huang. This is an open-access article distributed under the terms of the Creative Commons Attribution License (CC BY). The use, distribution or reproduction in other forums is permitted, provided the original author(s) and the copyright owner(s) are credited and that the original publication in this journal is cited, in accordance with accepted academic practice. No use, distribution or reproduction is permitted which does not comply with these terms.
*Correspondence: Chi Zhang, emhhbmdjaGlAaGh1LmVkdS5jbg==
†Orcid: Dake Chen, orcid.org/0000-0002-5160-589X
Chi Zhang, orcid.org/0000-0003-2708-4286