 Peng Sun
 Jie Yu
 Runlong Sun
 Guankui Liu
 Xiaoyu Xi
 Yongjun Tian
- 1Ministry of Agriculture and Key Laboratory of Mariculture, Ministry of Education, College of Fisheries, Ocean University of China, Qingdao, China
- 2Laboratory for Marine Fisheries Science and Food Production Processes, Pilot National Laboratory for Marine Science and Technology, Qingdao, China
The composition of catch is affected by exploited fishing gear and its selectivity, and long-term selective harvest induces the change in biological characters and economic value of exploited population. Stow net is the main fishing gear to capture commercially important fish species small yellow croaker (Larimichthys polyactis) in Haizhou Bay, China. Long-term stow net selective harvest affects both the biological characters and economic benefits of small yellow croaker. Therefore, an appropriate harvest scenario that can achieve the high economic benefits and the sustainable use of resource needs to be explored. In this study, we develop a bio-economic model for small yellow croaker and focus on different harvest scenarios for obtaining maximum economic benefit and sustainable utilization of resource. Our results indicate that the increase in mesh size has positive effects on the protection of small yellow croaker population, and optimal harvest scenario achieves the short- or long-term economic benefits to different stakeholders. Fishing with small mesh size gets high economic value in short-term, while fishing with large mesh size achieves better economic value and effectively protect small yellow croaker resource under long-term fishing pressure. This study provides evidence to balance the long-term economic benefits and sustainable utilization of fishery resource, and it also offers a basis for the scientific formulation of fishery policy.
Introduction
Fishing is an economic activity and its basic purpose is to obtain profit (Quaas et al., 2016; Voss et al., 2017; Lima et al., 2020). The value of catch is significantly affected by multiple factors, such as climate change, consumer preference, and quantity and quality of catch (George et al., 2005; Reddy et al., 2013; Can et al., 2015; Suh and Pomeroy, 2020; Sogn-Grundvåg et al., 2021). Generally, the quantity and quality of catch are the common factors that affect the economic benefits of fisheries. The individual size of catch is closely related to its quality, and larger individual often means the greater value. For example, the unit price of Baltic cod (Gadus morhua) of different lengths can vary by more than 200%. Additionally, the price of red swimming crab (Monomia haanii) can range from 2 to 23 RMB/kg (Tahvonen et al., 2018; Boenish et al., 2021). The exploitation methods have significant effects on the quantity and quality of catch. High landings and large individual size generate high profits to fishermen, hence exploring the evolution of economic value and biological dynamics under different exploitation methods becomes an important issue in fisheries.
Selective harvest measures the ability to capture specific types of marine organisms, and it directly affects the catch composition and population dynamic (Hamley, 1975; Fonteyne et al., 1996; Breen et al., 2016; Fauconnet and Rochet, 2016). Mesh size is an important factor to consider in selective harvest. Change in mesh size alters the probability of captured individuals and results in the differences in catch, such as the change of species, numbers, and size (Sary et al., 1997; Macbeth et al., 2005; Sun et al., 2006; Huang et al., 2016). Meanwhile, selective harvest affects the dynamics of population and community, since different selectivities prefer to capture particular individuals and species (Hamilton et al., 2007; Fenberg and Roy, 2008). Recent single- and multi-species modeling works suggest that selective harvest alters age, number, and sex structures of exploited population. The selective harvest of high trophic level individuals reduces the numbers of predators, which decreases the capture probability of prey and may lead to the improvement of productivity in ecosystem (Kolding and van Zwieten, 2011; Garcia et al., 2012; Law et al., 2012; Moullec et al., 2019). Here, an appropriate selective harvest management policy requires to ensure yield stability and fishermen’s income.
Fishery management aims at satisfying human needs for food and economic benefits (FAO, 2003). With the reduction in various commercial fish species resources, several governments have introduced stricter fishery management rules to promote the sustainable utilization of fishery resources. Harvest control rules are implemented for northeast Arctic cod (Gadus morhua) fishery in Norway and Russian, and a minimum landing size is set for brown crab (Cancer pagurus) fishery in England (Eikeset et al., 2013; Kvamsdal et al., 2016; Öndes et al., 2017). In China, the minimum mesh size regulation based on the selective harvest has been applied to a variety of fishing gears, such as trawl and stow net. Meanwhile, the Ministry of Agriculture (MOA, now the Ministry of Agriculture and Rural Affairs, MARA) has also strengthened the control of the domestic fishing vessels, which aims to reduce the fishing pressure on marine fishery resources (MOA, 2017). While the protection of fishery resources has been well studied, the economic benefits of fisheries have received less attention in the field of fishery management. Conflicts between economic efficiency and the conservation of fishery resources may lead to the ineffective implementation of fishery policies (Sun et al., 2012). Therefore, there is an urgent need to compare the long-term dynamics and the economic benefits of fish population under different fishery management policies, especially for some key commercial species.
Small yellow croaker (Larimichthys polyactis) is an important commercial fish species in Haizhou Bay, China, and stow net is the main fishing gear in small yellow croaker fishery (Huang et al., 2016; Xu et al., 2020). In the recent years, the annual yield of small yellow croaker captured by stow net has exceeded 4,000 tons, which also becomes an important income for fishermen (Department of Ocean and Fishery of Shandong Province, 2011). At the same time, several studies show that overfishing has occurred in small yellow croaker population, the population characteristics have changed, and the stock is characterized by early maturation, small size, and biomass decline (Lin et al., 2011; Liu et al., 2012; Yan et al., 2014). Meanwhile, some fishermen prefer to use stow net with small mesh size to increase the yield in short-term fishing. However, such behavior almost reaches the red line of the minimum mesh size for marine fishing gears, which results in poor selectivity and endangering fishery resource (Sun et al., 2012; Tang et al., 2014). Nowadays, several studies suggested that the mesh size of stow net should increase to more than 40 mm, which can release the juveniles of small yellow croaker and decrease the bycatch of other non-commercial species, but it also decreases the yield and benefits of fishing (Huang et al., 2016; Zhang et al., 2017; Xu et al., 2020). Therefore, there exists divergences among different stakeholders to capture small yellow croaker, and the deviation exists between the current fishing and sustainable utilization of small yellow croaker fishery in Haizhou Bay. Therefore, defining the optimal harvest scenario can not only obtain economic benefits, but also protect small yellow croaker resource.
In this study, we develop a bio-economic model for small yellow croaker in Haizhou Bay, China. We simulate a series of stow net selective harvest scenarios and compare the differences of results in biological dynamics and economic benefits. The purposes of this study are (1) to explore the population dynamics of small yellow croaker in different stow net harvest scenarios and (2) to obtain the optimal harvest scenario that achieves maximum economic benefits and sustainable utilization of resources. Our study aims to provide a scientific basis for the protection and rational exploitation of small yellow croaker.
Materials and Methods
Data Source of Small Yellow Croaker
The biological traits data of small yellow croaker and selective harvest parameters of stow net used in this study depend on the surveys and size-selective harvest experiments (Liu et al., 2013; Huang et al., 2016; Xu et al., 2020). The size-based price data were collected from fish markets in Rizhao, 2014. All these data are used to parameterize the model and are listed in Table 1.
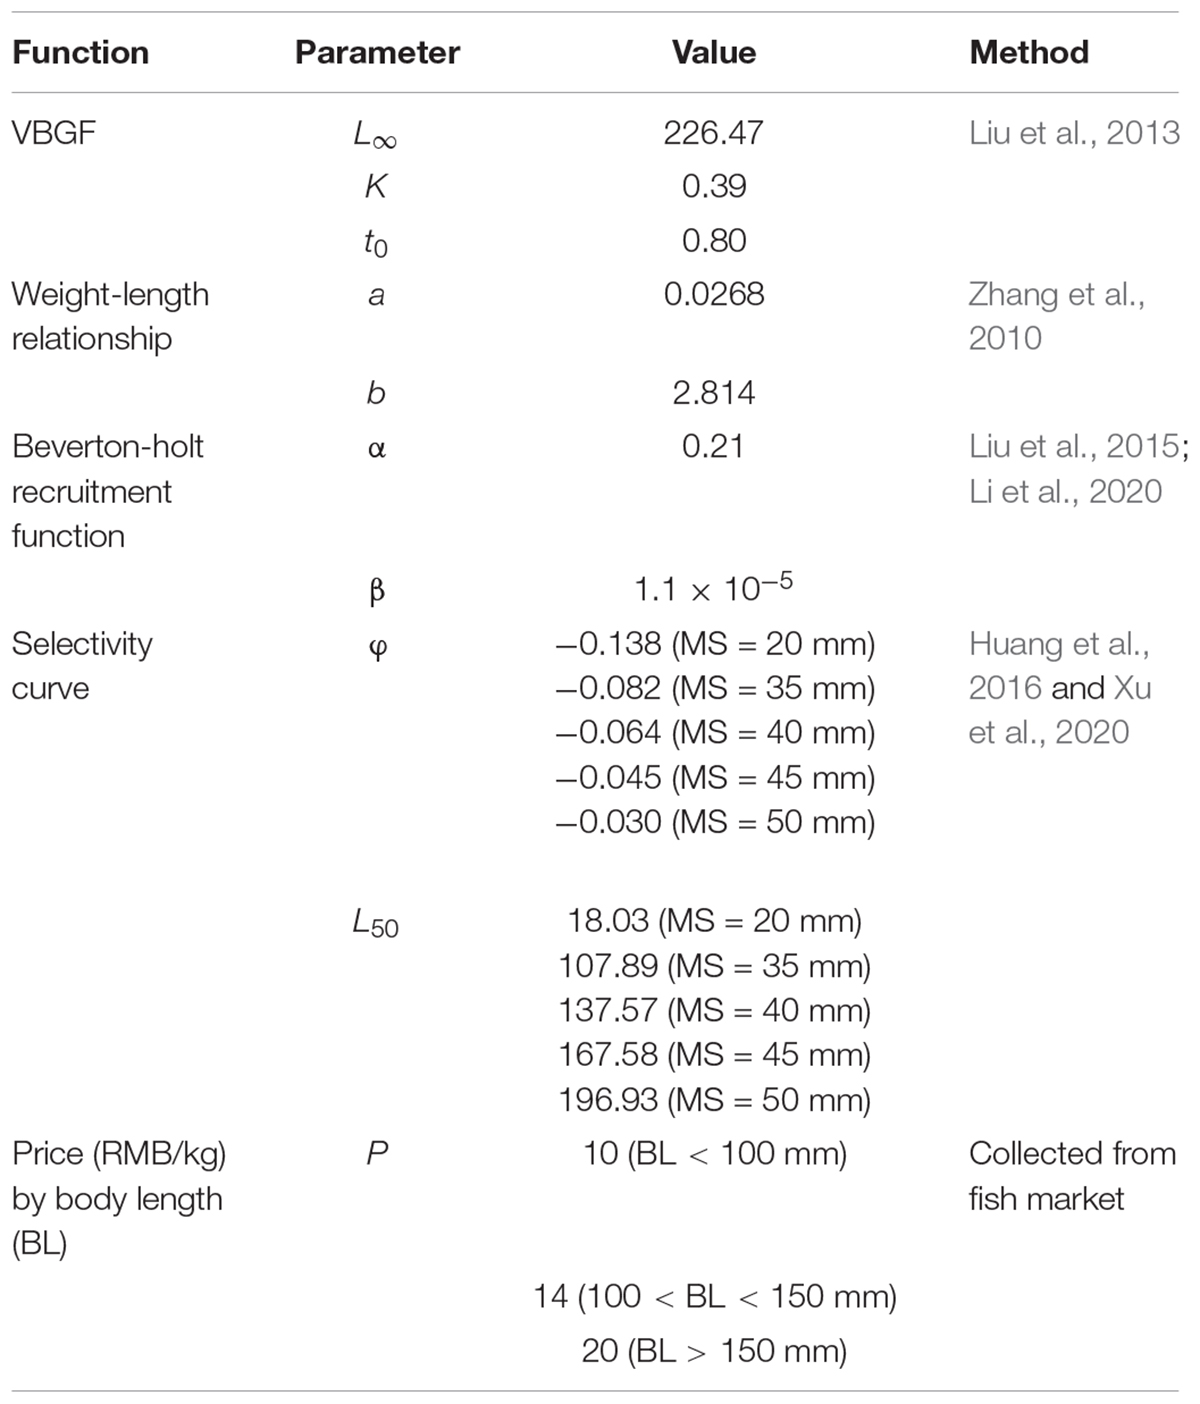
Table 1. Parameters for the small yellow croaker in bio-economic model.
The Bio-Economic Model for Size-Selective Harvest
We construct a bio-economic model to study the influences of stow net-selective harvest on small yellow croaker. This framework combines the processes of life history, fishing, and the size-dependent price of catch. In this framework, it is possible to explore how mesh size, fishing pressure, and price affect population during a long-term period. The simulation program is written in R (R Core Team, 2020).
The processes of primary life history include the growth, maturity, reproduction, and mortality of natural or fishing causes. The growth of small yellow croaker is based on the von Bertalanffy growth function (VBGF):
where Lt is the average length at age t, Linf is the asymptotic length (mm), K is the growth coefficient (year–1), and t0 is the theoretical age at length of zero. The VBGF is the average growth parameter of the population, but the growth of individual is different from the mean curve. To reduce the deviation between actual growth of individual and VBGF, Lt times the coefficient of variation ε to represent the individual growth (Liu et al., 2021). The ε follows normal distribution with N (0, 0.1). Therefore, the length of individual i at age t is described as follows:
The weight of individual i is calculated from the weight-length relationship:
where a is the intercept and b is the allometry coefficient.
The total number of recruitments is density-dependent and determined by a Beverton–Holt recruitment function (van Poorten et al., 2018; Li et al., 2020):
where Rt indicates the abundance of recruits at time step t. St–1 denotes spawning biomass at time step t-1. Additionally, σ refers to the variability of spawner–recruitment relationship, which follows the log normal distribution of LN (0, 0.1). We assume all individuals reach sexual maturity at age 1. Parameter α is a density-independent parameter proportional to fecundity, and β is a density-dependent parameter proportional to both fecundity and density-dependent mortality.
The total mortality for individual i at age t can described as follows:
where Mi,t is nature mortality rate of individual i at age t (Gislason et al., 2010; Charnov et al., 2013):
where Linf and K are the VBGF parameters and Li,t is the length of individual i at age t. The fishing mortality rate of individual is as follows:
where f is the fishing mortality and Si,t is selectivity rate of individual i at age t. Here, we choose the logistic curve as the selectivity for stow net (Figure 1):
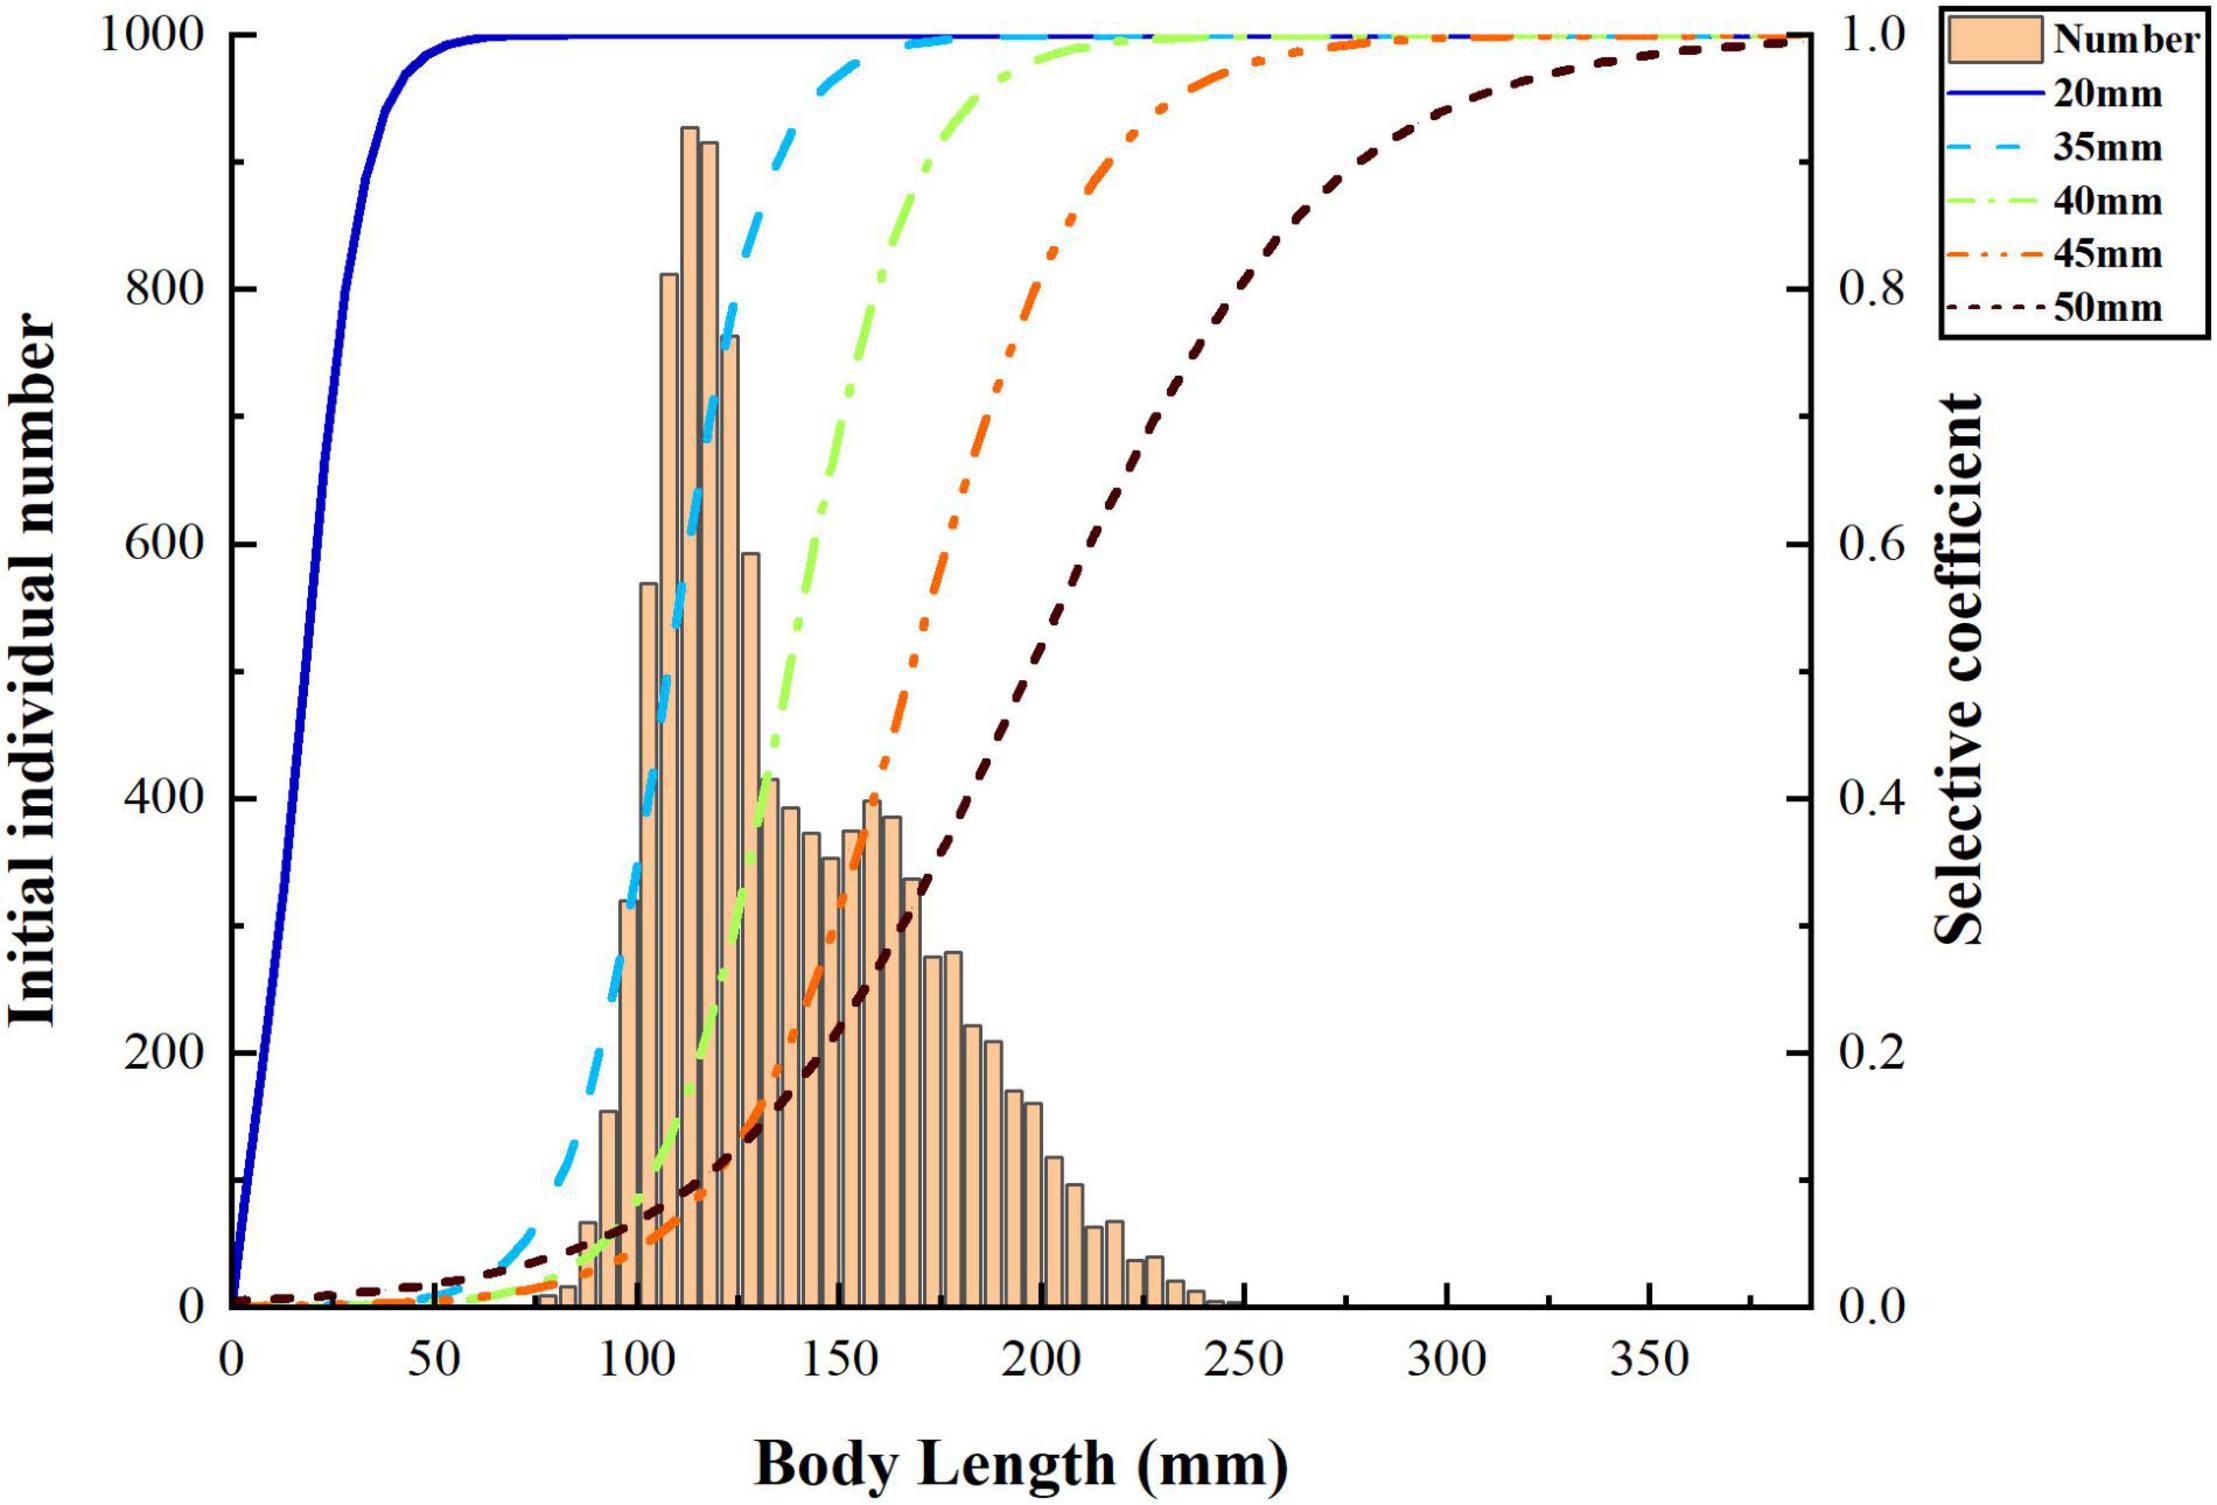
Figure 1. Initial body length distribution of small yellow croaker and different selective curves of stow net.
where L50 is the capture length at 50% selectivity and φ is the slope of selectivity curve, the parameter of L50 and φ determined by stow net mesh size.
The survival rate for individual i at age t is follows:
where individual mortality is modeled as a stochastic process of Bernoulli trials and occurs if a number randomly drawn from a uniform distribution between 0 and 1 is lower than 1- SRi,t (Marty et al., 2015).
Based on the fishing mortality and natural mortality, we use the Baranov catch equation to calculate the number of catches at each time step (Baranov, 1918):
where Ni,t is the number of individuals with length Li at year t. Therefore, the yield is given by:
As for the economic value of catch, we use size-based price to show the market dynamic, and the total value is as follows:
where Pi is the unit price of length Li,t.
Generalized Additive Model Analysis
As a passive fishing gear, the catch and economic value of stow net can be affected by several independent indicators, such as mesh size (MS), capture date (CD), and environmental variables (sea surface temperature SST, tide range TR, northward velocity NV, eastward velocity EV, salinity S, and mixed layer depth MLD). To determine the importance of mesh size on economic benefits of small yellow croaker, we use generalized additive model (GAM) to indicate the specific relationships between the indicators above and economic value (Hastie and Tibshirani, 1986):
where value is the response variable representing economic value, which is based on the result of stow net-selective harvest experiment of small yellow croaker (Huang et al., 2016). Predictor variable Ind refers to an independent indicator, s() is the smoothing function, and ξ is the random error. Daily environmental variables, which include SST, MLD, NV, EV, and S, are derived from GLORYS12V1 product with a horizontal resolution of 1/12° (published by CMEMS).1 TR data are collected from National Marine Data and Information Service (NMDIS).2
Harvest Scenarios
We simulate the mesh size with 20, 35, 40, 45, and 50 mm to explore the differences on population biological characters and economic benefits of catch. The 20-mm mesh size is defined as “non-selective harvest,” and the mesh sizes from 35 to 50 mm are defined as “selective harvest.” The selective coefficient of selective harvest varies with mesh size (Figure 1). For each mesh size, we consider three fishing mortality f = 0.2, 0.4 and 0.6 to find out the optimal fishing mortality (Li et al., 2020). Therefore, 15 harvest scenarios are defined in our study: S1 (20 mm, f = 0.2), S2 (35 mm, f = 0.2), S3 (40 mm, f = 0.2), S4 (45 mm, f = 0.2), S5 (50 mm, f = 0.2), S6 (20 mm, f = 0.4), S7 (35 mm, f = 0.4), S8 (40 mm, f = 0.4), S9 (45 mm, f = 0.4), S10 (50 mm, f = 0.4), S11 (20 mm, f = 0.6), S12 (35 mm, f = 0.6), S13 (40 mm, f = 0.6), S14 (45 mm, f = 0.6), S15 (50 mm, f = 0.6) (Figure 2).
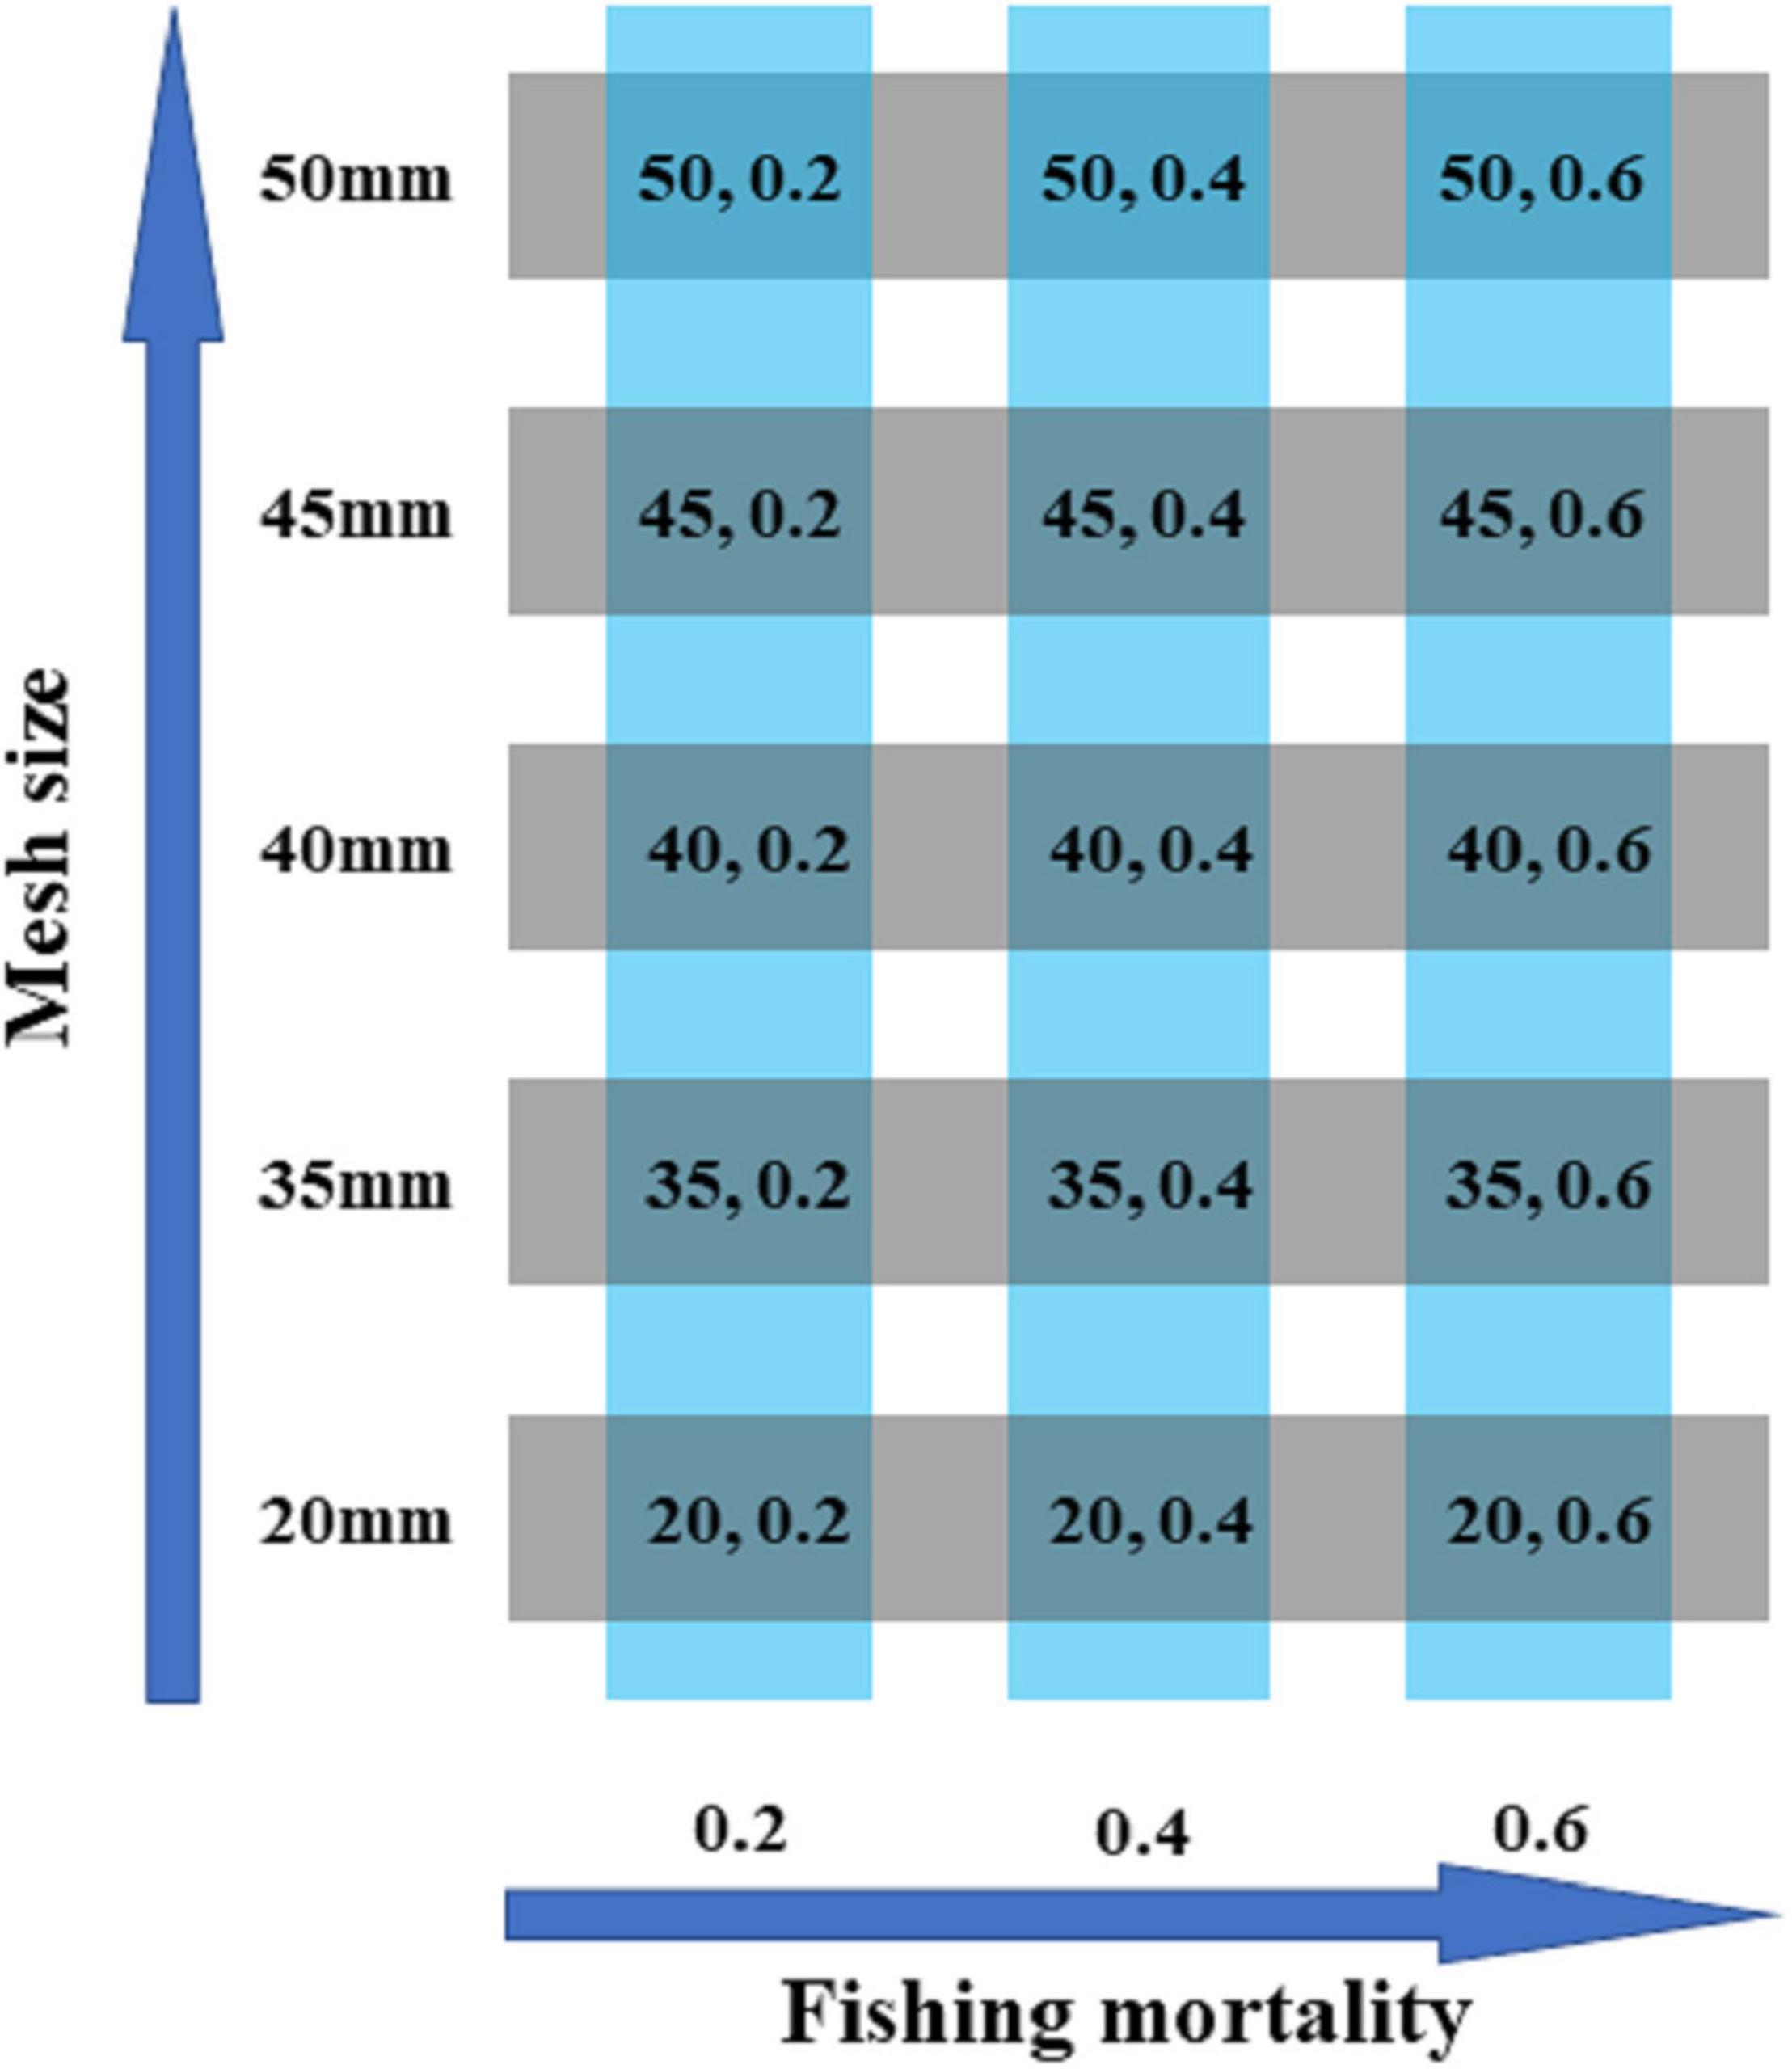
Figure 2. A total of 15 harvest scenarios set with mesh size and fishing mortality.
The Simulation of Bio-Economic Model
All parameter values used in our model are shown in Table 1. Here, the original size of population is 10,000 individuals. We first run for 100 years without harvesting to ensure that the population keeps equilibrium. All results are displayed from this time onward. After then, selective harvest starts and lasts for 20 years. To test the model and the robustness of the 15 harvest scenarios, all results presented are repeated ten times.
Results
The Effects of Different Indicators on the Economic Value
The importance of different indicators is shown in Table 2. GAM results show that mesh size is the most important variable among 8 factors that depend on the AIC and R2. The rank of variables is TR, S, and SST, which have significant effects on economic value with the p-value varied from 0.01 to 0.018. MLD, NV, EV, and the capture date have insignificant effects on economic value. Therefore, we can select mesh size as the key indicator in our study.
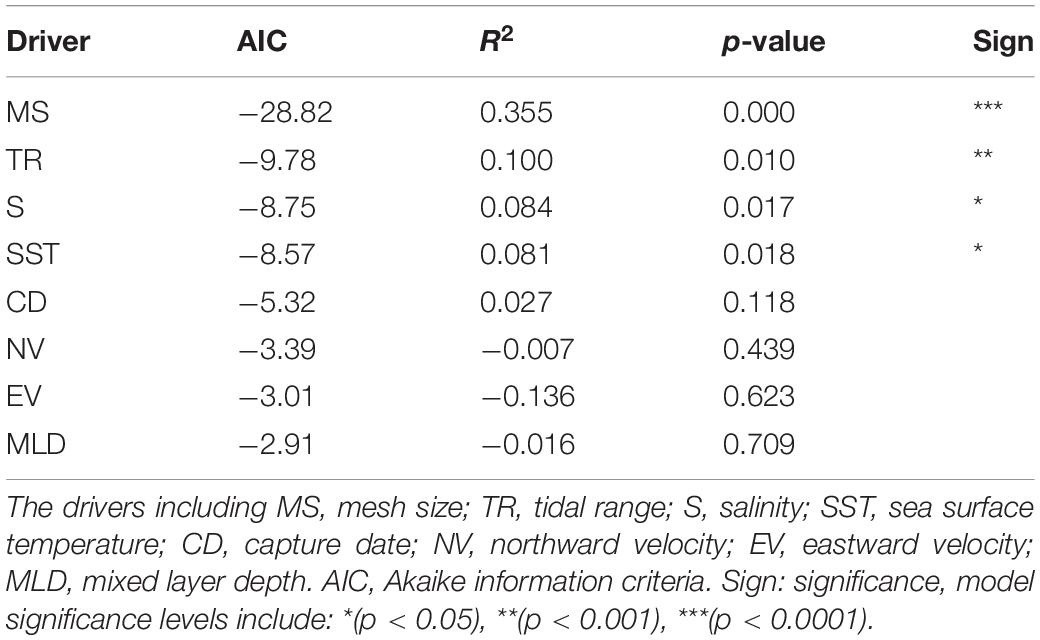
Table 2. The effects of different variables on the economic value of small yellow croaker.
Dynamics of Population Traits in Different Harvest Scenarios
The biomass and average body length decline drastically at the first 5–10 years of fishing and then show a relatively stable trend (Figures 3, 4). The biomass shows a significant increase with larger mesh size and lower fishing mortality. Among all the scenarios, the highest biomass and lowest biomass are observed in scenarios S5 and S11, respectively (Figures 3A,C). Compared with the initial population, the biomass declines more than 95% in S11, whereas the biomass in S15 remained stable at about 350 kg after 10 years fishing under the high fishing mortality (Figure 3C).
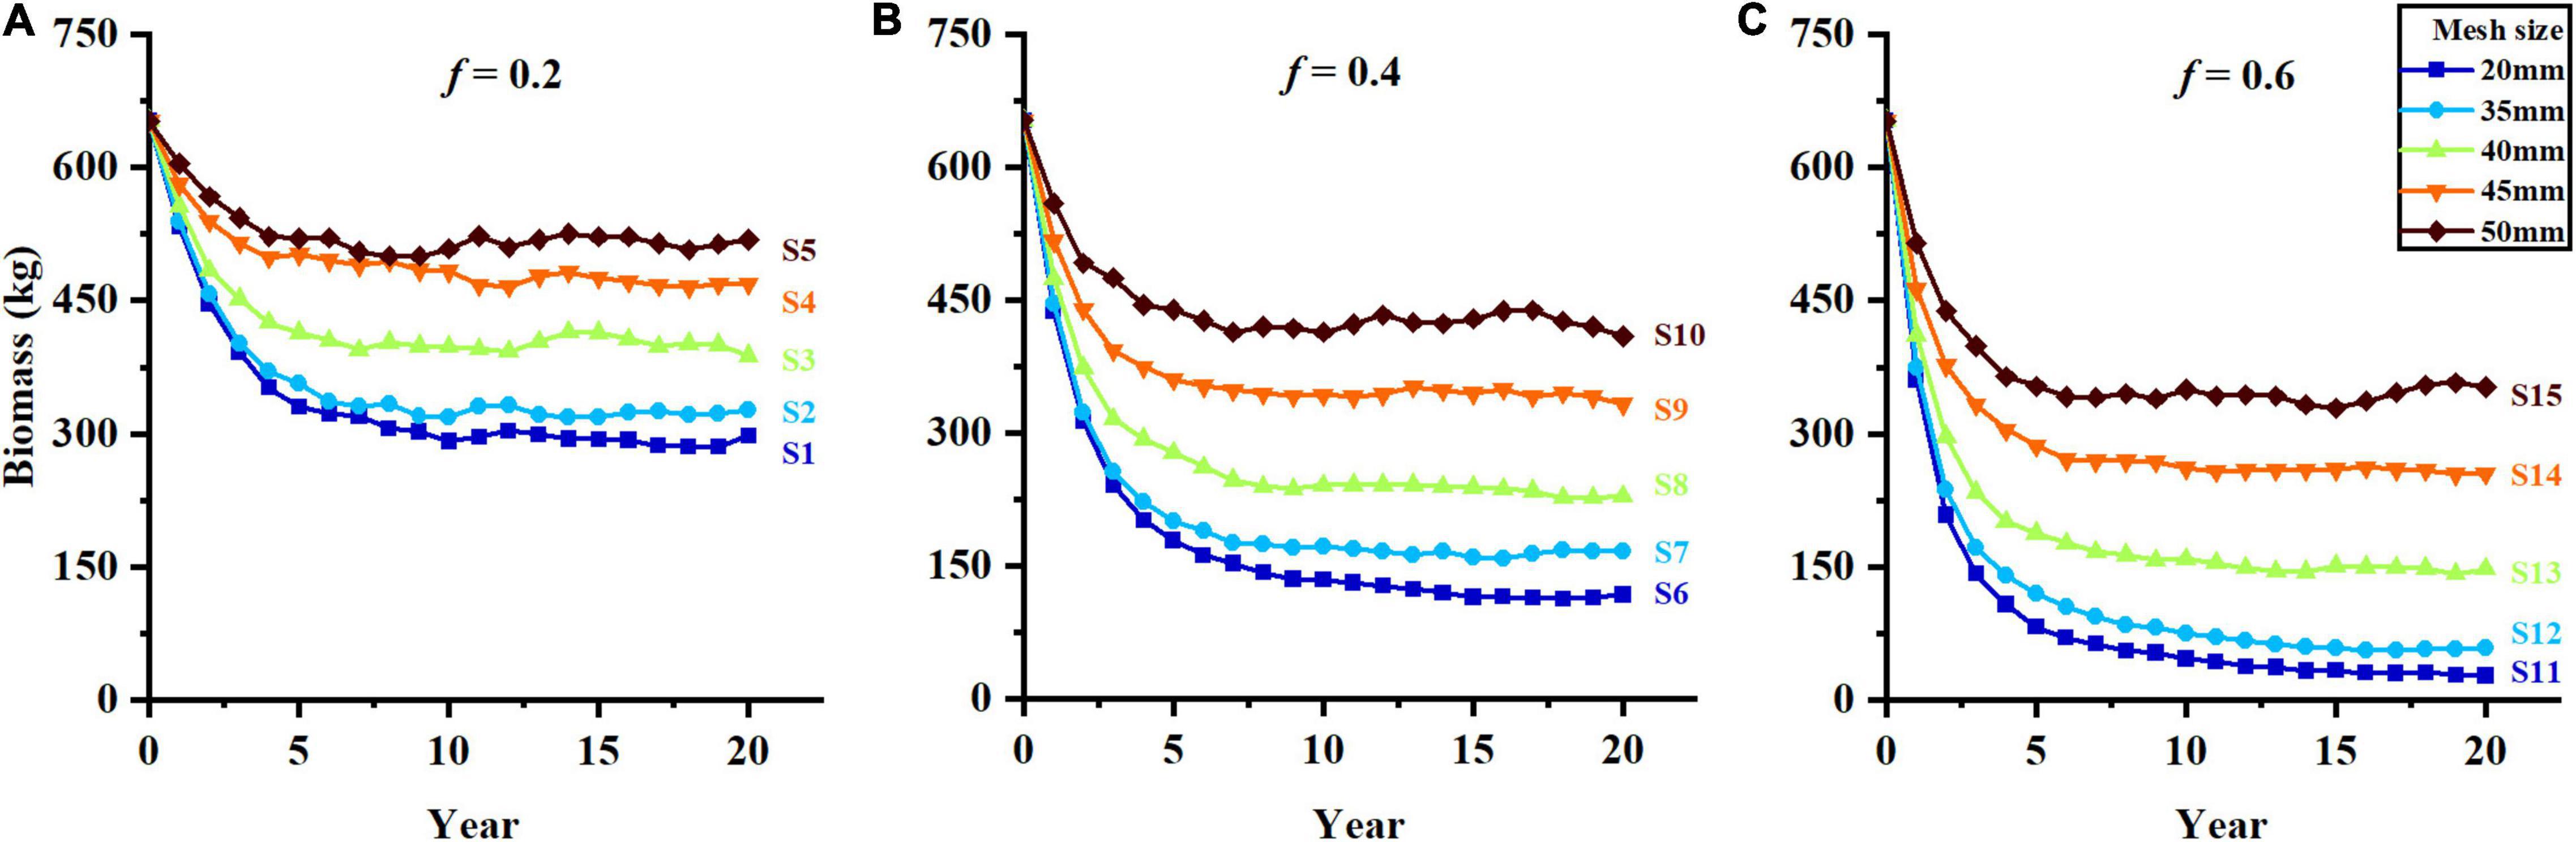
Figure 3. The change of biomass in different harvest scenarios, (A–C) represent f = 0.2, f = 0.4, and f = 0.6.
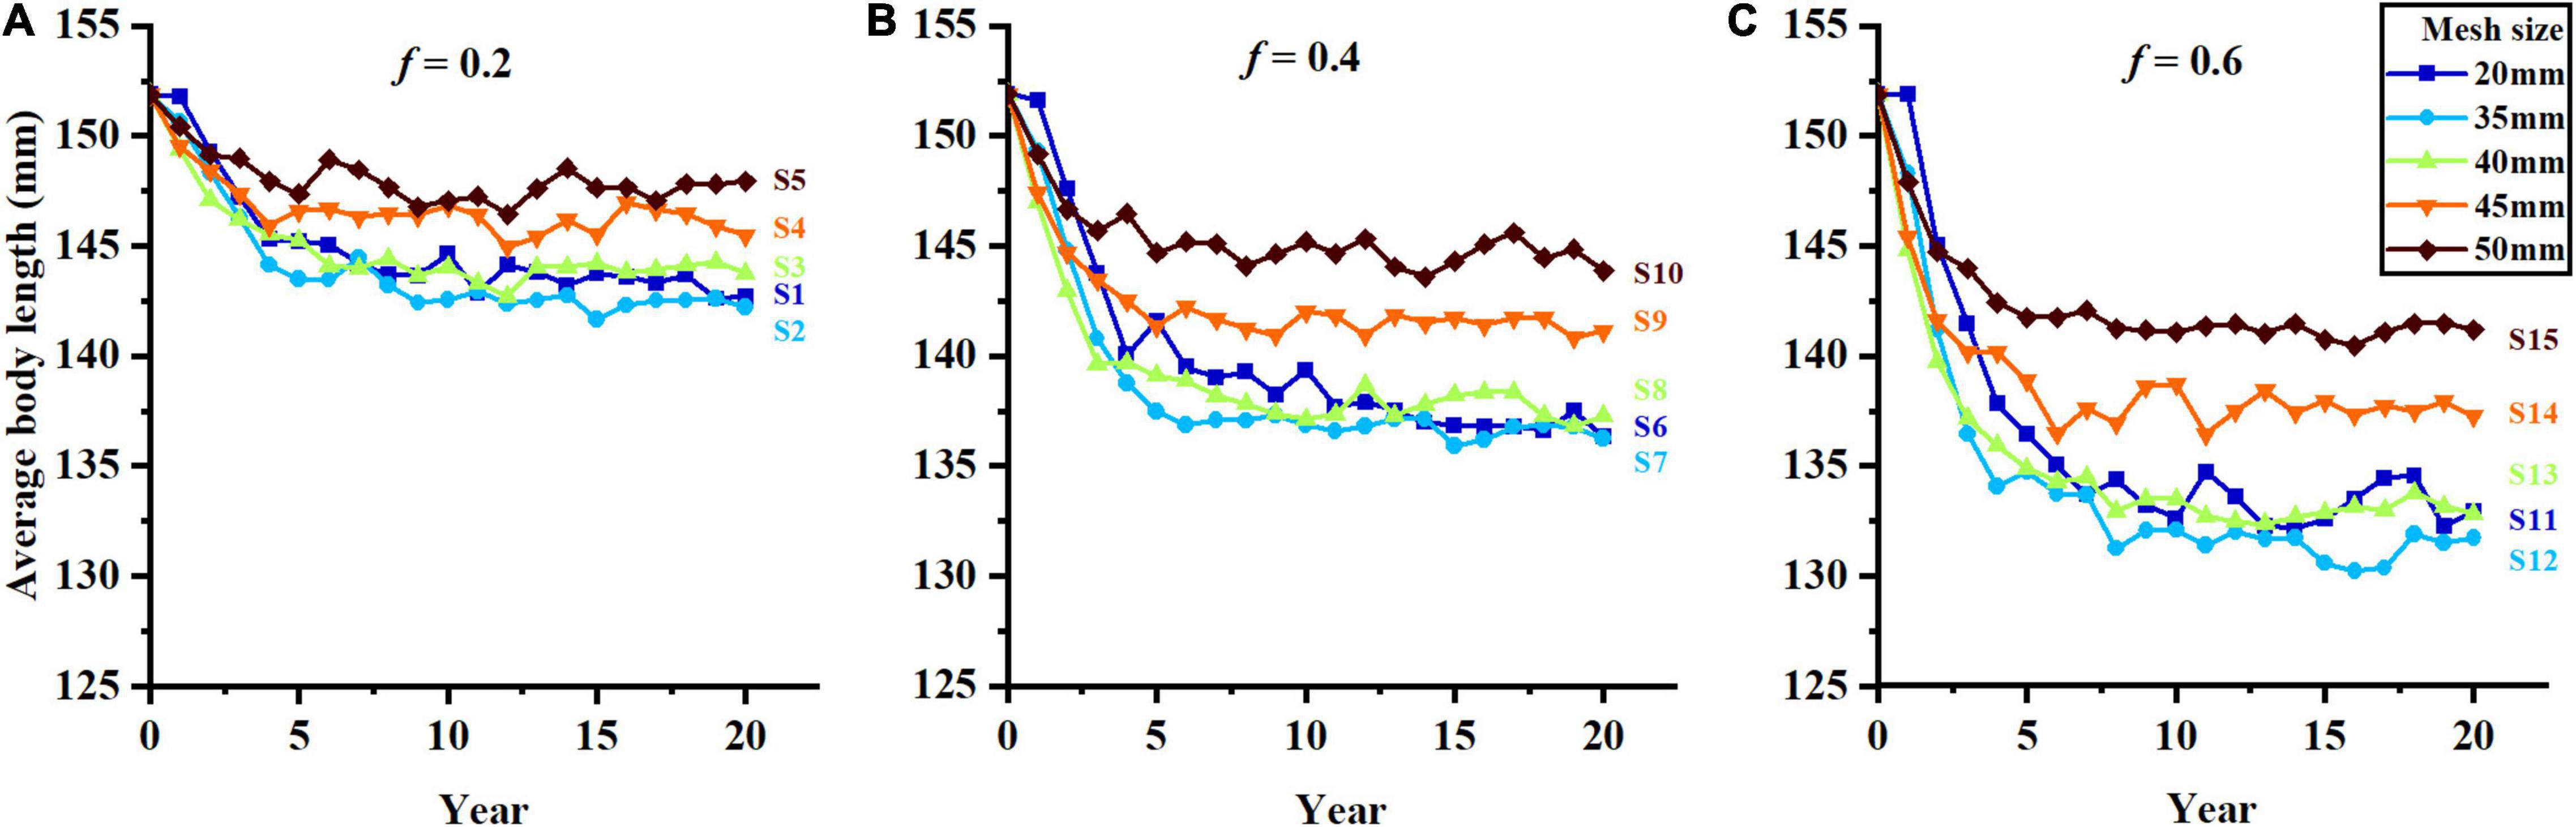
Figure 4. The change of average body length in different harvest scenarios, (A–C) represent f = 0.2, f = 0.4, and f = 0.6.
The average body length decreases significantly with the increase of fishing mortality (Figure 4). Meanwhile, the average body length also shows an increasing trend with the increase in mesh size, but the trend is insignificant when mesh size is smaller than 40 mm, and significant when mesh size is 45 and 50 mm. Harvest scenario S5 shows the high average body length because of its low fishing mortality and large mesh size, and S12 tends to the low average body length during the whole fishing period (Figures 4A,C).
Trends of Catch Traits in Different Harvest Scenarios
The trends of average length of catch, catch and yield in different harvest scenarios are shown in Figures 5–7. Owing to the characteristics of sigmoid-shaped selective curve, the proportion of large individuals in catch increases based on larger mesh size and lower fishing mortality. Harvest scenario S5 shows the highest average length of catch among all harvest scenarios and S11 is the opposite (Figure 5). The trends of catch are different among 15 harvest scenarios (Figure 6). As the value of mesh size increases, the catch decreases significantly when fishing mortality is 0.2 and 0.4 (S1–S5, S6–S10). As the fishing mortality is 0.6 (S11 to S15), the catch decreases with the increase in mesh size in the first 8 years, but after then, more individuals get captured in S13 than in the other four scenarios. With the increase in fishing mortality, the trends of catch are opposite with different mesh sizes: (1) With the small mesh size (e.g., 20 mm), the catch of S11 is significantly higher than that of S1 in the initial stage of fishing, but lower than S1 after long-term fishing pressure; (2) with large mesh size (e.g., 50 mm), the catch number of S5 is lower than that of S15 during the whole fishing period (Figure 6).
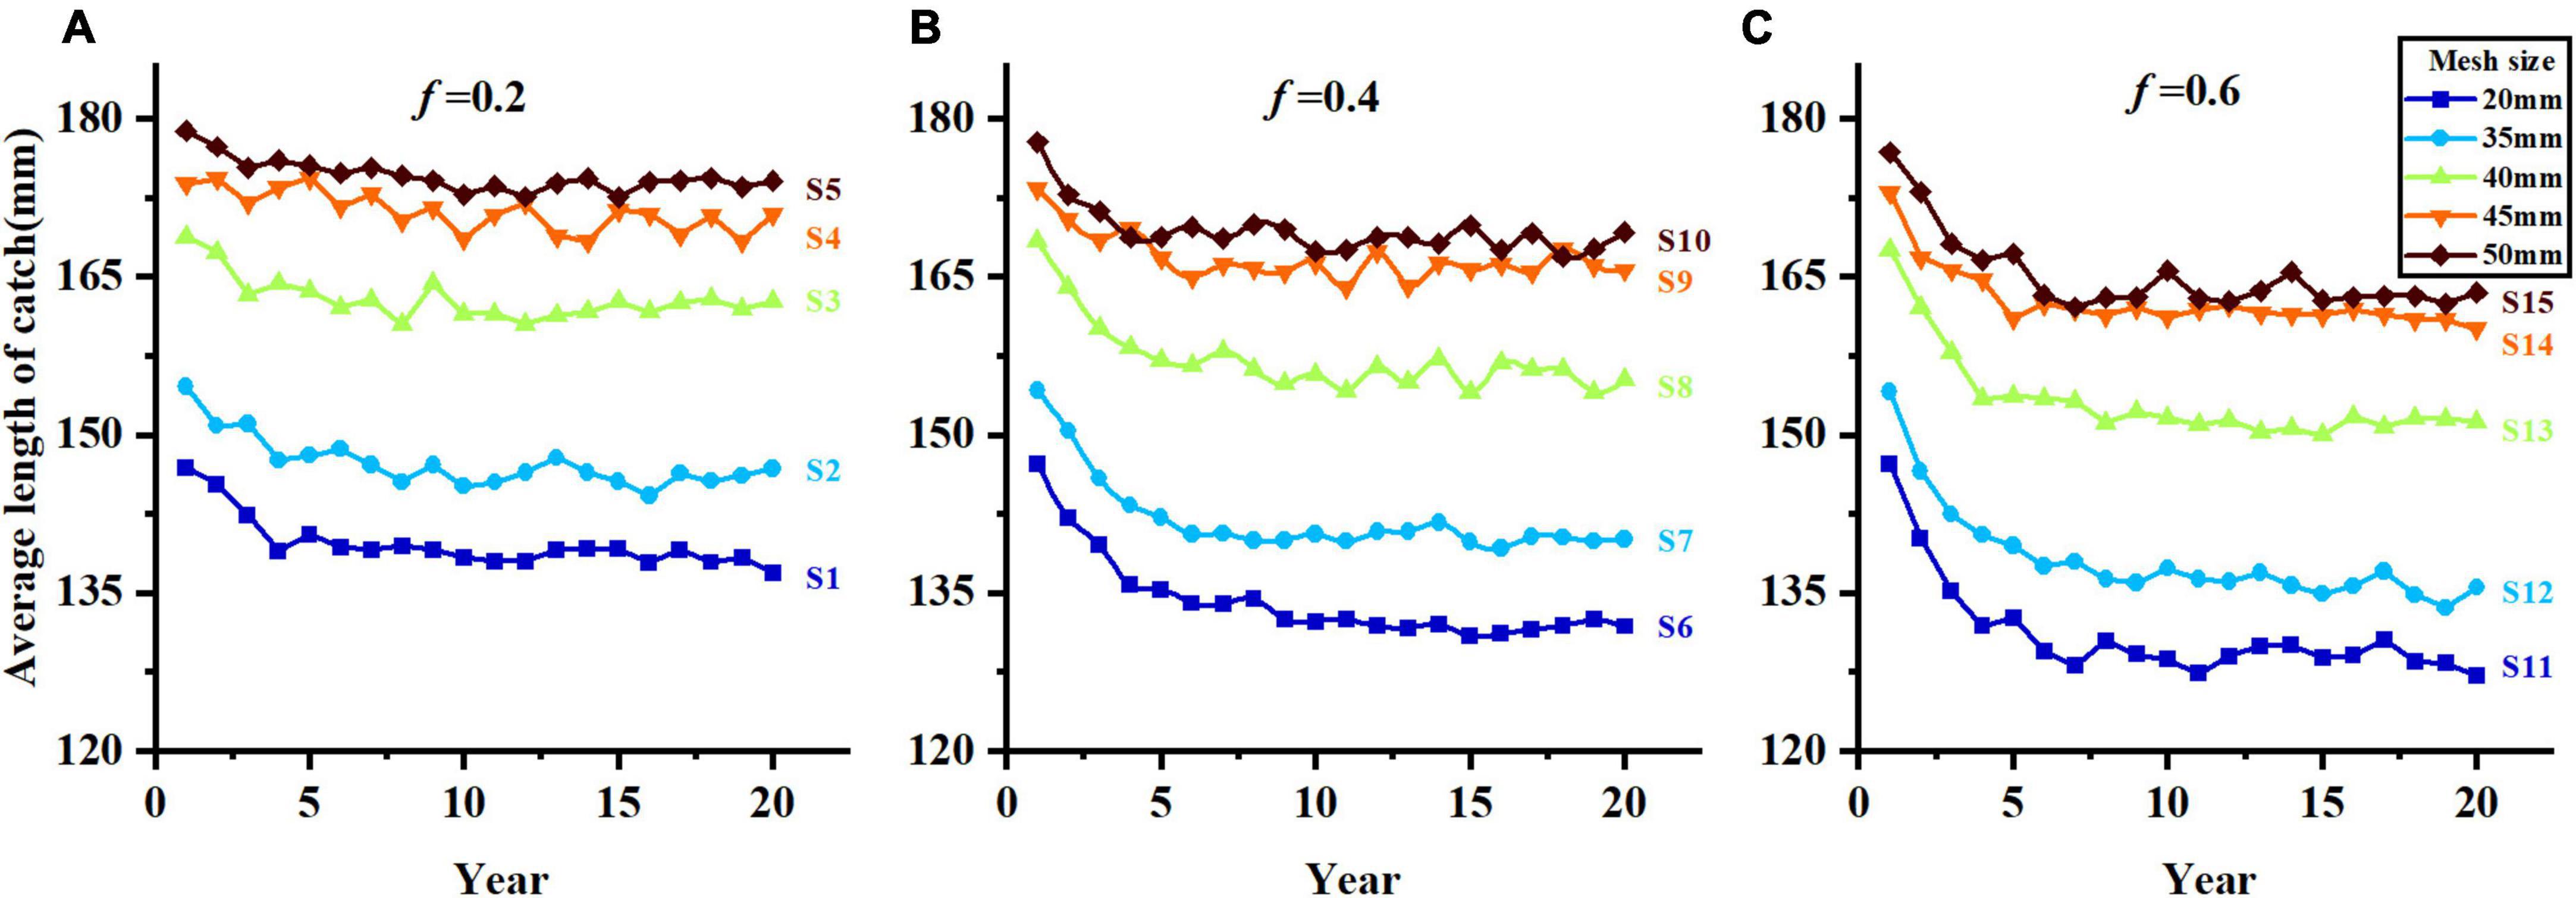
Figure 5. Average length of catch in different harvest scenarios, (A–C) represent f = 0.2, f = 0.4, and f = 0.6.
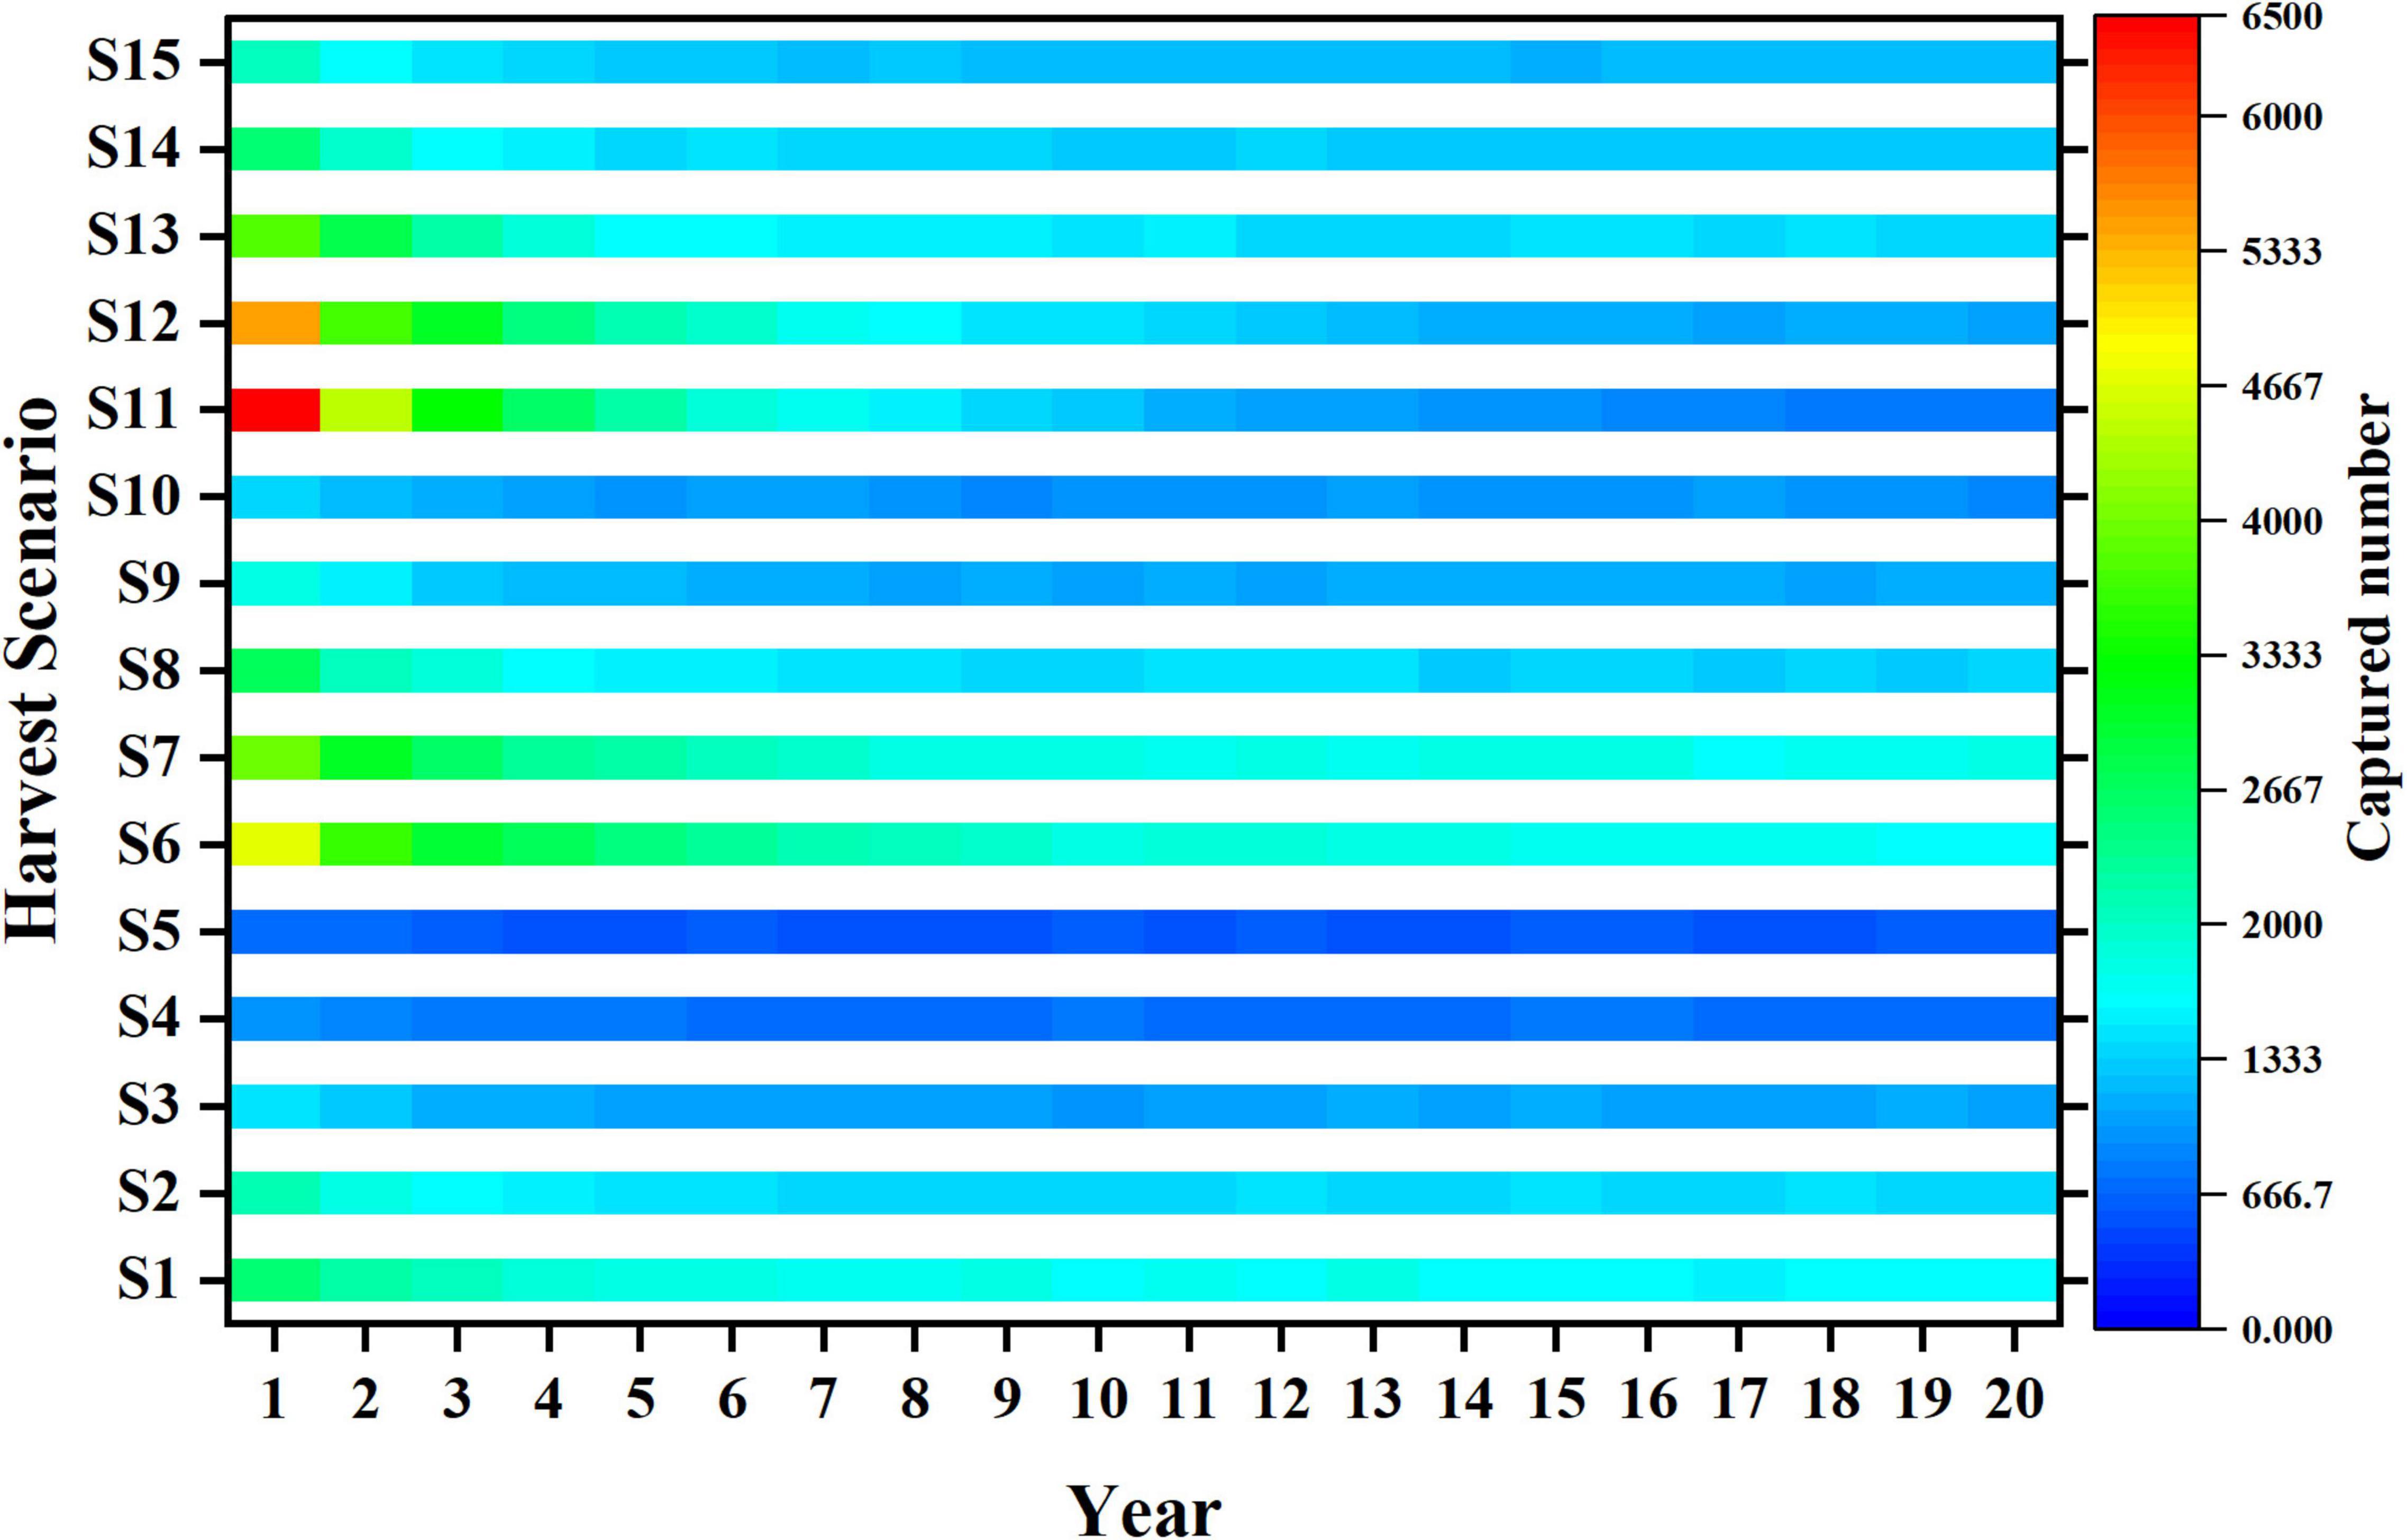
Figure 6. Trends of captured number in different harvest scenarios.
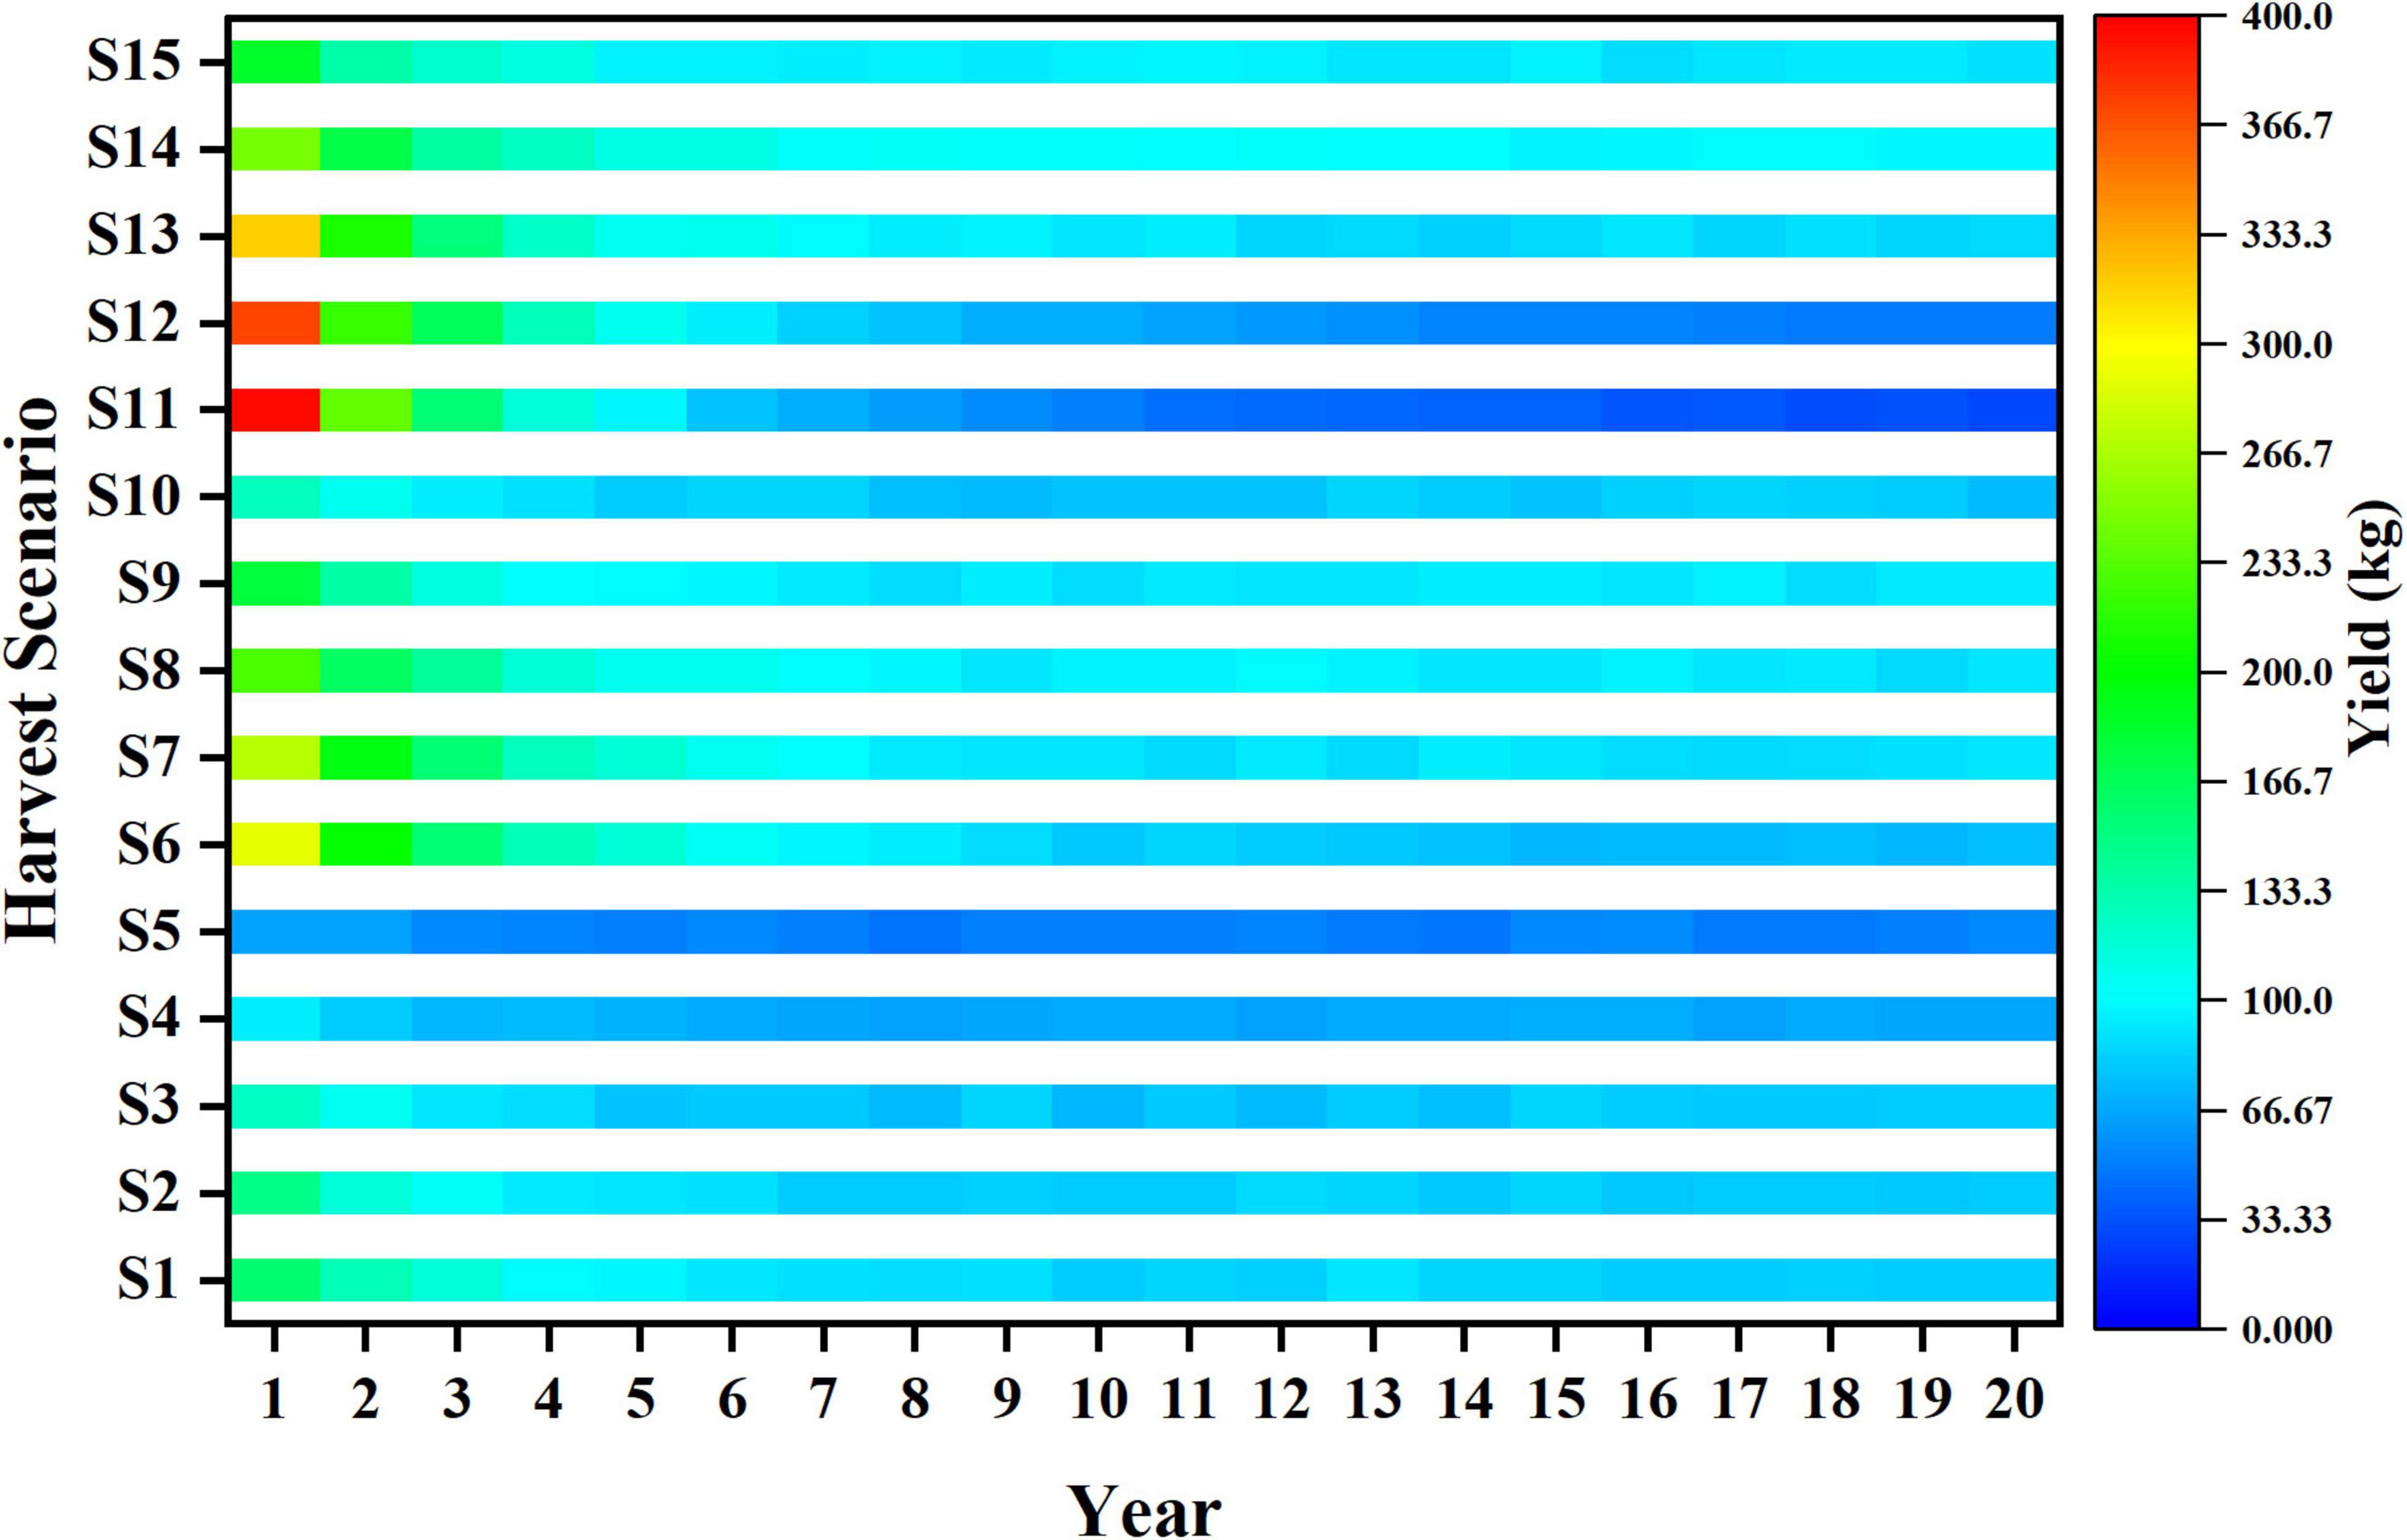
Figure 7. Trends of yield in different harvest scenarios.
The result of yield correlates with quantity and quality of catch, and the trends of yield in different harvest scenarios are basically consistent with that of catch (Figure 7). However, the larger average length of catch can better make up its deficiency in number, which induces S1 gets higher yield than S6 under long-term fishing, and S14 is higher than S13.
Treads of Economic Value in Different Harvest Scenarios
The trends of economic value in different harvest scenarios are shown in Figure 8. Generally, the trends of economic value are basically consistent with yield, and the best strategy to achieve high value varies with fishing time. S11 obtains a high economic value in the first 3-year fishing, and the highest value of all harvest scenarios also appears in its first year of fishing. After then, S14 gets the top rank of value under the long-term fishing, which shows that larger mesh size and higher fishing mortality are beneficial to economic value.
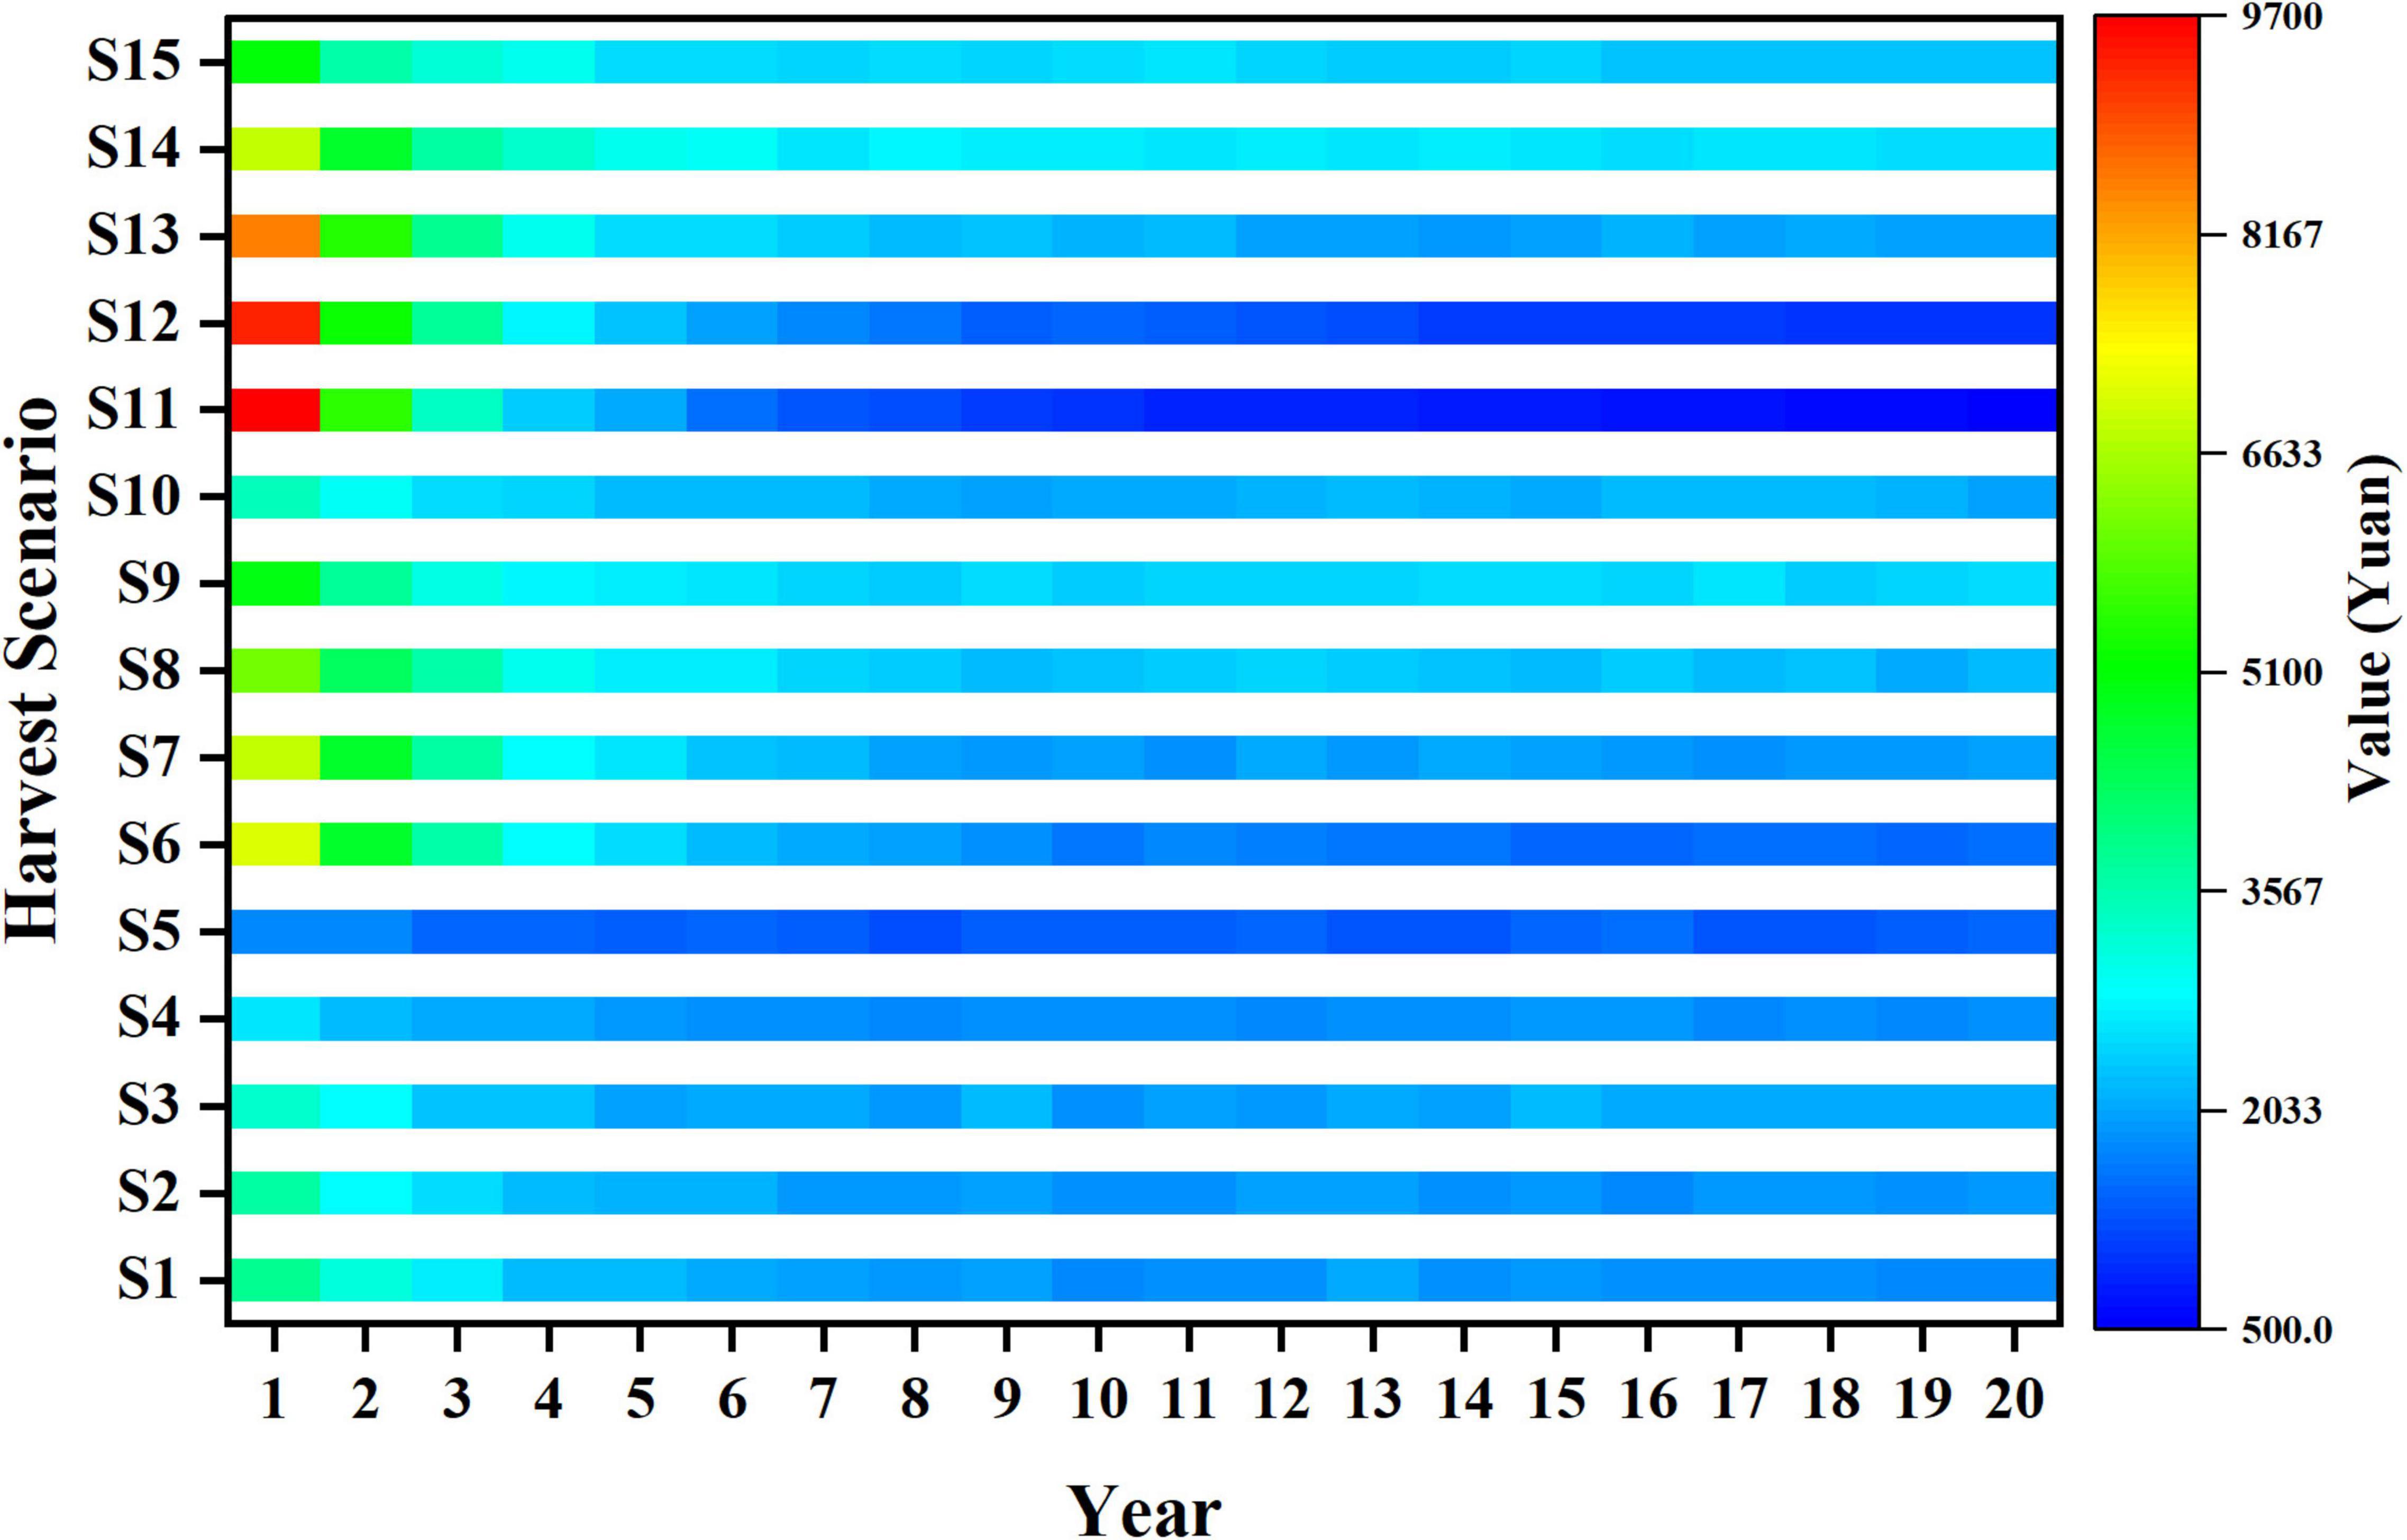
Figure 8. Trends of value in different harvest scenarios.
The economic value of different harvest scenarios keeps stable from the year 15 to 20 during the whole fishing period. To explore the relationships between the long-term economic value and harvest scenarios, contour map is used to illustrate the average economic value in different harvest scenarios (Figure 9). Different harvest scenarios affect the economic value variously under long-term fishing. With the increase in fishing mortality, the trends of economic value show difference with different mesh sizes. The value of small mesh size harvest scenarios significantly decreases with the increase in mesh size (e.g., S1, S6, and S11), whereas the value of large mesh size harvest scenarios is the opposite (e.g., S5, S10, and S15). Meanwhile, the change of value in 0.6 fishing mortality harvest scenarios (S11–S15) is more dramatic than those in 0.2 fishing mortality (S1–S5). Also, we can find the appropriate mesh size that achieves high economic value in different harvest scenarios (S1 to S15). In addition, with the fishing mortality increases, S14 gets the peak economic value among all harvest scenarios under long-term fishing. Therefore, harvest scenario S14 is better than other scenarios in terms of achieving long-term economic benefits.
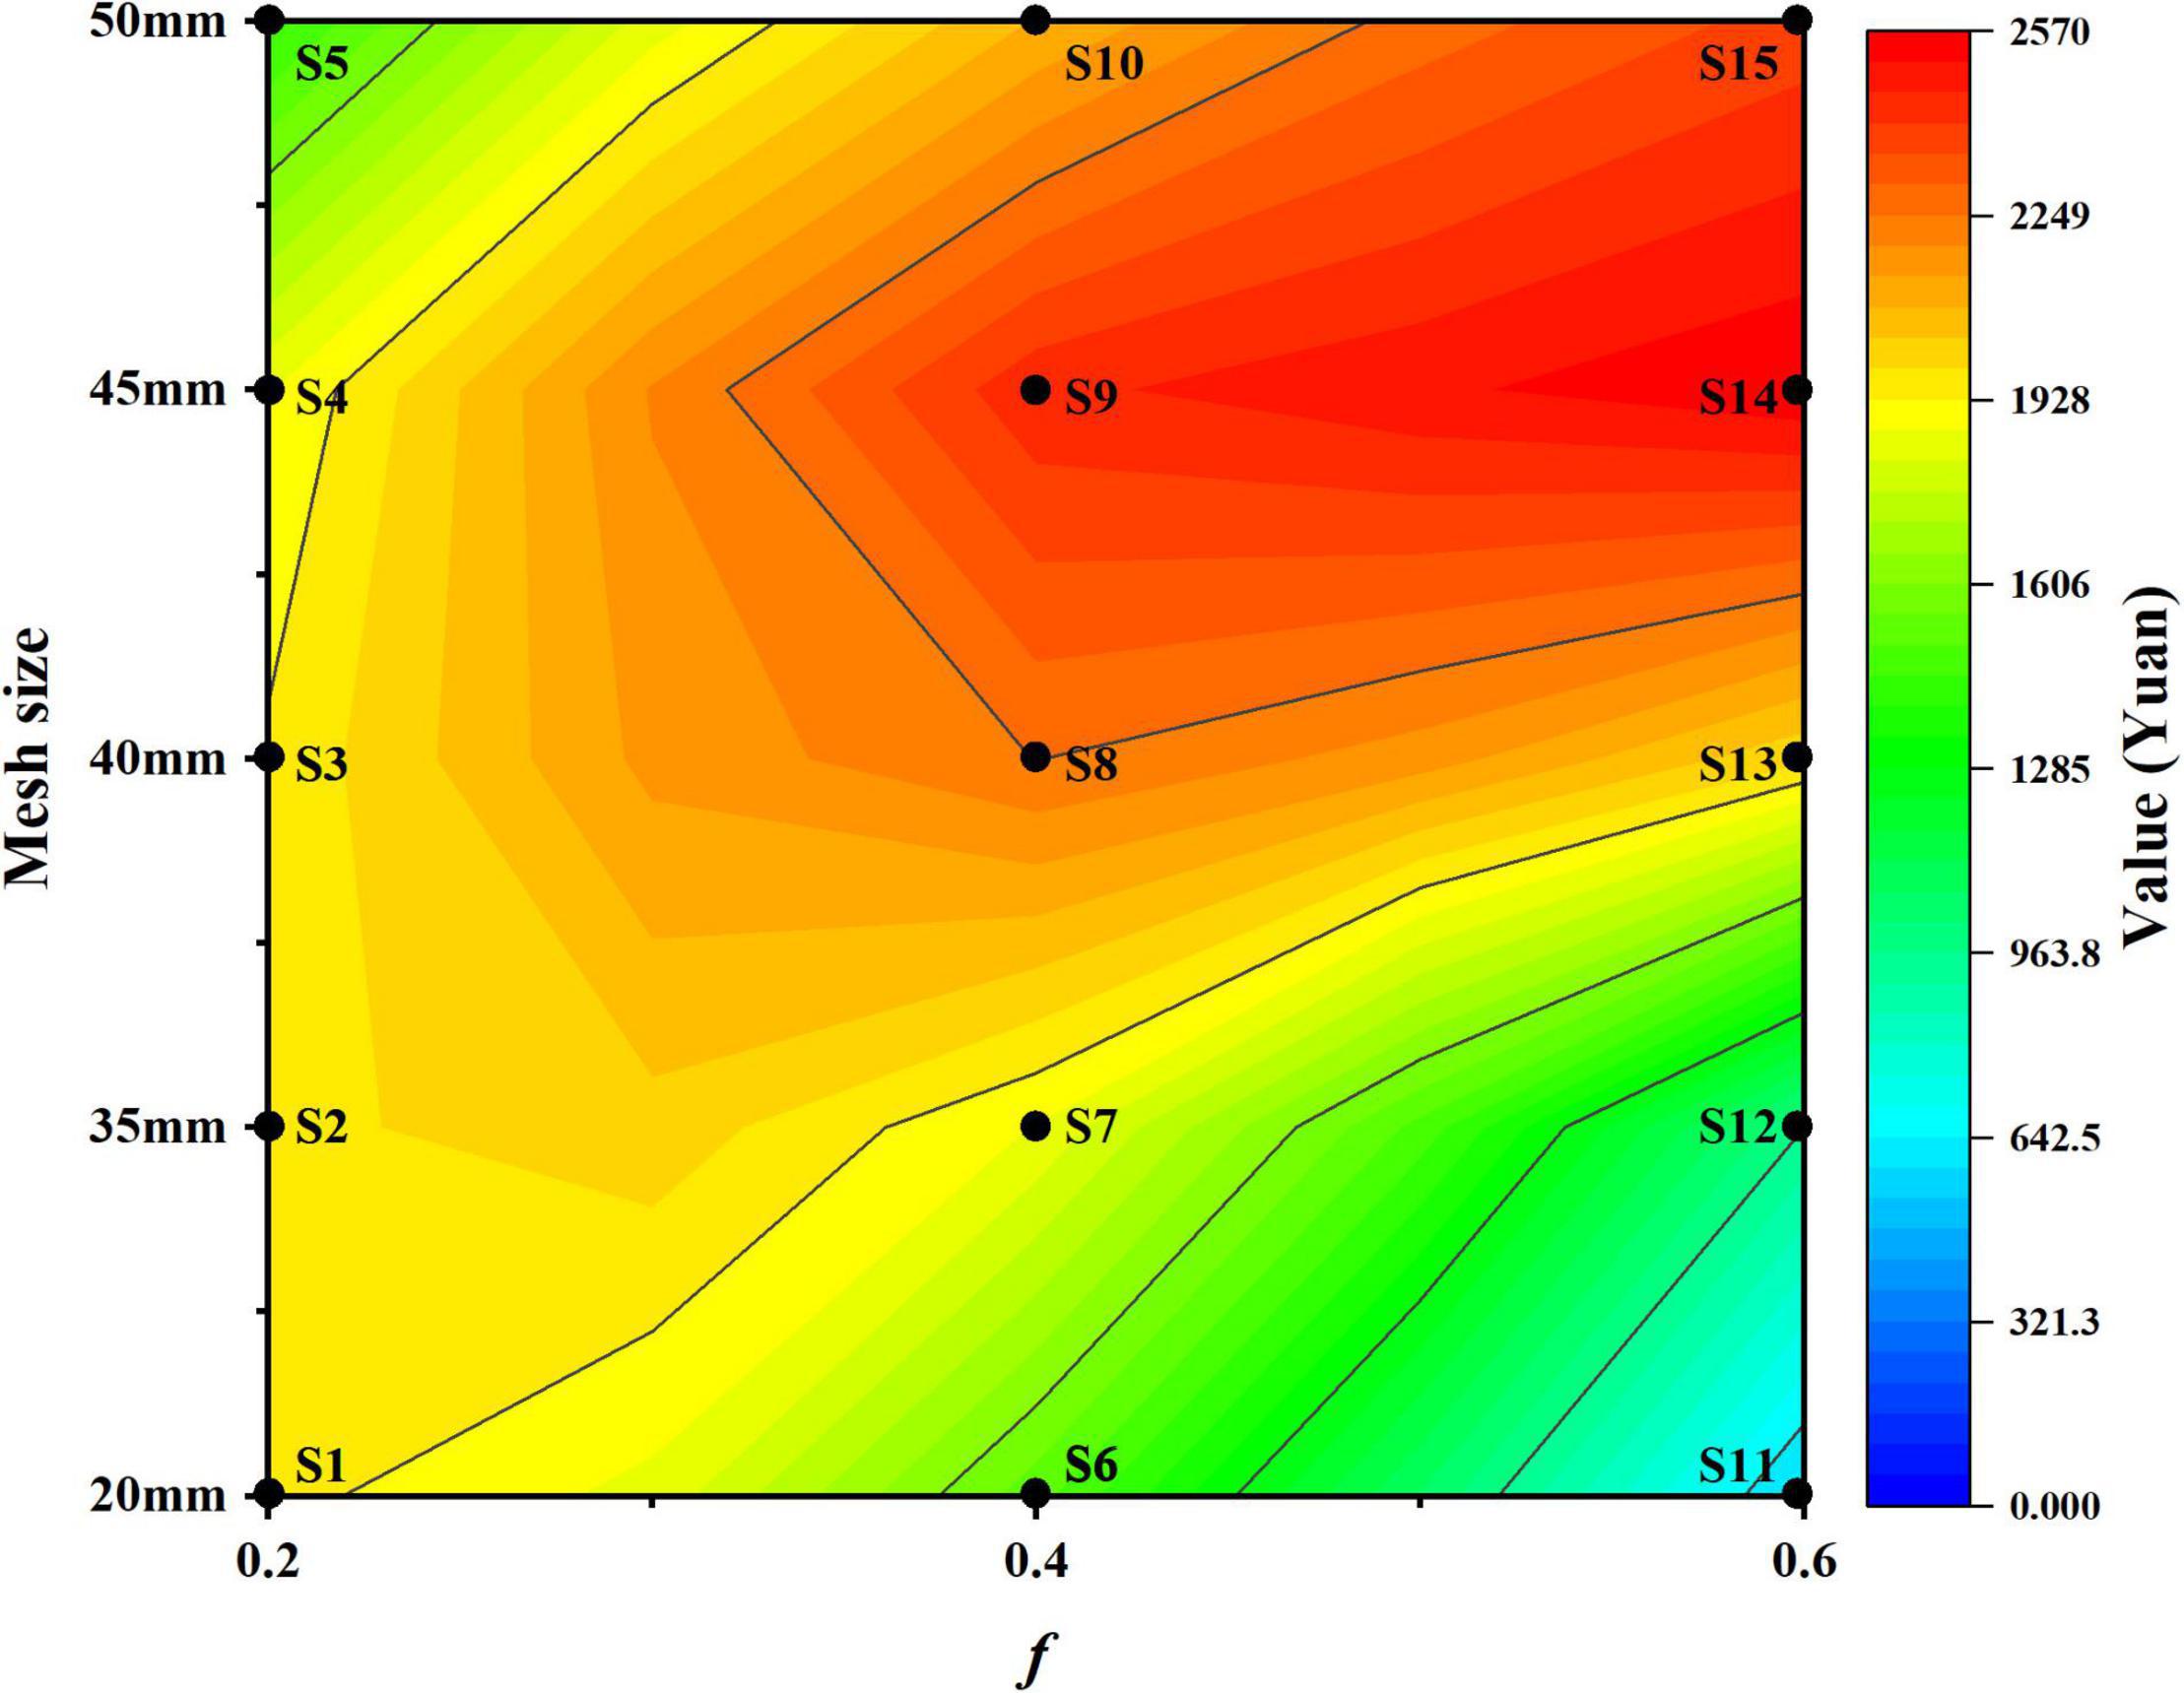
Figure 9. The contour map of economic value in different harvest scenarios.
Discussion
In this study, we develop a bio-economic model for small yellow croaker and focus on the effects of different selective harvest scenarios on population dynamics and economic value. Our results indicate that increasing mesh size has positive effects on population, and the selective curve of fishing gears determines the captured probability of target fish species. The selective curve of stow net and trawl is sigmoid-shaped, which means that large individuals own the high probability to be retained in the cod-end, and with the increase in mesh size, more small individuals can escape from fishing (Stepputtis et al., 2016). Hence, the ratio of non-commercial conger pike (Muraenesox cinereus) individuals decreases more than 30% with the increase in trawl mesh size, which protect juveniles in South China Sea (Yang et al., 2021). Additionally, the escape rate of largehead hairtail (Trichiurus lepturus) in stow net increases from 0 to 46% whereas the mesh size increases from 35 to 65 mm (Xu et al., 2019). The release of small individuals increases the population biomass, and the biomass of brown shrimp (Crangon crangon L.) in North Sea increases 13% whereas mesh size gets increased from 20 to 26 mm (Günther et al., 2021). Similarly, in this study, the biomass and average body length of small yellow croaker both keep low in non-selective harvest scenarios S1, S6, and S11 and keep high in harvest scenario S5, S10, and S15 (Figures 3, 4). Specifically, compared with initial population, the biomass in S1 declines for more than 95%, which is almost collapsed, but the biomass in S15 still keeps high. These results show that fishing with large mesh size is beneficial to protect population, even with high fishing mortality. Using large mesh size can alleviate the overfishing of small yellow croaker, and in the consideration of its positive effects, some studies suggested that the mesh size of stow net should increase from 35 to 51 mm to avoid capturing small yellow croaker juveniles, which is consistent with our study (Huang et al., 2016; Xu et al., 2020).
Quantity and quality change of catch depends on selective harvest, and different harvest scenarios also affect population dynamics and economic benefits. Larger mesh size and lower fishing mortality accompany the capture of fewer fish individuals, which usually lead to the loss of yield in short-term fishing. For example, the increase in mesh size from 105 to 120 mm declines the catch of marketable size of Baltic cod (Gadus morhua) between 36 and 49% during the first month of fishing (Tschernij et al., 2004). In this study, due to small mesh size and high fishing mortality, harvest scenario S11 gets the highest catch number in the first year of fishing (Figures 5–8). However, large-scale capture in short-term declines the biomass sharply, and low biomass cannot support high yield, which makes the yield and economic of S11 decrease and cannot recover under long-term fishing (Figures 3, 5, 8). Meanwhile, more individuals escape from fishing because of larger mesh size and lower fishing mortality. The growth of escape individuals facilitates the growth of population biomass and creates space for high value in future. Therefore, in other harvest scenarios, such as S1 and S14, more individuals can be captured than in S11 under long-term selective fishing. Moreover, the individual size in these scenarios is higher than S11. These advantages are beneficial to create higher yield and economic value under long-term fishing (Figures 5–8). Our results suggest that short-term losses can bring long-term benefits in fishery (Cardinale and Hjelm, 2012). Several studies have also proved this opinion. For example, increasing the mesh size of gill net from 43 to 50 mm reduces the yield of pikeperch (Sander lucioperca) by 50% in the first year of fishing, but it would stabilize at about 20% higher level than initial yield under long-term fishing (Heikinheimo et al., 2006). Reducing small Norway lobster (Nephrops norvegicus) catch decreases the landings in first several years, but lays positive effects on long-term landings and average gross surplus (Macher et al., 2008). Meanwhile, our results indicate that increasing mesh size is more beneficial than decreasing fishing mortality in small yellow croaker fishery. High fishing mortality can get high catch, but captured individuals with large mesh size decreases the numbers of small individual in catch, which makes harvest scenario S14 receive the top rank of value among all harvest scenarios under long-term fishing (Figure 9). However, the positive effects of increasing mesh size in achieving long-term economic benefit are limited. If the mesh size further gets increased to 50 mm, the loss of captured number reduces the economic value, which makes the value of S15 lower than S14 (Figures 8, 9). At the same time, we notice that the long-term biomass of S14 keeps well and only lower than S15 while f is 0.6. Considering the advantages of high economic value and biomass, S14 is the optimal harvest scenario to achieve long-term economic benefit, which also promotes sustainable utilization of small yellow croaker resources. Nevertheless, fishing is a trade-off between short- and long-term benefits. Various needs of different stakeholders must be taken into account in decision-making of fishery management. Although S14 achieves the long-term economic benefit, it cannot be ignored that S11 provides high yield and value in the first several years of fishing, which satisfies the immediate interests of some stakeholders. Therefore, how to guarantee the short-term economic benefits while realizing long-term economic benefits is a key problem that must be considered. Taking cost–benefit analysis is an effective method, which can help to get different economic metrics of fishery, such as surplus, and the response of the stock under different scenarios (Sola et al., 2020; Maynou et al., 2021). In this study, we mainly focus on selective harvest impacts on the difference in economic benefits; therefore, we did not consider the cost of fishery. But the cost–benefit analysis is an important question, and it will be considered in our further study.
Economic indicator is an important composition of the exploitation and protection of fish population, which is closely related to the formulation of management policy (Hanna, 1998; Sumaila and Munro, 2018; Fay et al., 2019). Bio-economic method provides a framework to integrate the economic and biological process. It can explore the implications of alternative scientific assumptions and evaluate the potential performance of alternative management strategies (Ulrich et al., 2007; Prellezo et al., 2012; Lee et al., 2017). Different fishery management objectives, such as high yield or high product quality, and short- or long-term benefits, can be set as harvest scenarios and compared within the bio-economic framework (Boenish et al., 2021; Maynou et al., 2021). The change in mesh size alters the quantity and quality of catch, which affects the biological and economical traits of exploitation species. To promote the sustainable utilization of fishery resources, the minimum mesh size standard is formulated in several fishery practices (Dean et al., 2021; Nguyen and Morris, 2021). In China, the minimum mesh size of stow net is formulated as 35 mm, which is conducive to the release of the sustainable utilization of fishery resources (MOA, 2014). This study uses bio-economic method and provides evidence that the mesh size of stow net can be further increased to 45 mm, which will still be beneficial to improve long-term economic benefits and protect resources. However, the catch of stow net also includes other species, and the size of some bycatch (e.g., largehead hairtail) will also increase with mesh size (Xu et al., 2020). The long-term economic effect of mesh size on the multiple species is a meaningful issue and it still needs to be explored in future. Whatever, our study takes the first step and prove a better way to balance the economic benefits and population protection on exploiting small yellow croaker resource in Haizhou Bay, China.
Conclusion
This study simulates different stow net harvest scenarios to compare the biological dynamics and economic benefits of small yellow croaker. Our results indicate that mesh size is an important factor in small yellow croaker fishery. Increase in mesh size has positive effects on the protection of small yellow croaker population, and optimal harvest scenario achieves the short- or long-term economic benefits to different stakeholders. Fishing with small mesh size gets high economic value in short term, whereas while fishing with large mesh size achieves better economic value under long-term fishing. Therefore, appropriate use of mesh size achieves a balance between economic value and protection of small yellow croaker resource. This study provides a scientific basis for improving the economic benefits and the sustainable utilization of small yellow croaker resources. It also provides support for the fishery managements in Haizhou Bay, China.
Data Availability Statement
The original contributions presented in the study are included in the article/supplementary material, further inquiries can be directed to the corresponding author/s.
Author Contributions
PS designed and conducted model structure. JY and GL conducted the model building and data analysis. RS collected samples and data. PS, XX, and YT wrote and edited the manuscript, while all other authors have reviewed and revised it. All authors listed have made a direct and substantial contribution to this work, and gave final approval for publication.
Funding
This work was supported by the National Natural Science Foundation of China, grant nos. 41861134037 and 32073027.
Conflict of Interest
The authors declare that the research was conducted in the absence of any commercial or financial relationships that could be construed as a potential conflict of interest.
Publisher’s Note
All claims expressed in this article are solely those of the authors and do not necessarily represent those of their affiliated organizations, or those of the publisher, the editors and the reviewers. Any product that may be evaluated in this article, or claim that may be made by its manufacturer, is not guaranteed or endorsed by the publisher.
Acknowledgments
We acknowledge the Copernicus Marine Environment Monitoring Service and National Marine Data and Information Service for providing free and open marine data.
Footnotes
References
Baranov, F. I. (1918). K voprosu o biologicheskikh osnovaniyakh rylmogo khozyaistva (On the question of the biological basis of fisheries). Nauchn. Issled. Ikhtiologicheskii Inst. Izv. 1, 81–128.
Boenish, R., Lin, B., Kritzer, J. P., Wilberg, M. J., Shen, C., Jiang, Y., et al. (2021). A bioeconomic approach towards improved fishery management of Monomia haanii in the southern Taiwan Strait, China. Fish. Res. 240:105969. doi: 10.1016/j.fishres.2021.105969
Breen, M., Graham, N., Pol, M., He, P., Reid, D., and Suuronen, P. (2016). Selective fishing and balanced harvesting. Fish. Res. 184, 2–8. doi: 10.1016/j.fishres.2016.03.014
Can, M. F., Günlü, A., and Can, H. Y. (2015). Fish consumption preferences and factors influencing it. Food Sci. Technol. 35, 339–346.
Cardinale, M., and Hjelm, J. (2012). Size matters: short term loss and long term gain in a size-selective fishery. Mar. Pol. 36, 903–906. doi: 10.1016/j.marpol.2012.01.001
Charnov, E. L., Gislason, H., and Pope, J. G. (2013). Evolutionary assembly rules for fish life histories. Fish Fish. 14, 213–224. doi: 10.1111/j.1467-2979.2012.00467.x
R Core Team (2020). R: A Language and Environment for Statistical Computing. Vienna: R Foundation for Statistical Computing.
Dean, M. J., Hoffman, W. S., Buchan, N. C., Cadrin, S. X., and Grabowski, J. H. (2021). Deconstructing size selectivity to evaluate the influence of fishery management. Fish. Res. 234:105782. doi: 10.1016/j.fishres.2020.105782
Department of Ocean and Fishery of Shandong Province (2011). Fishery Statistical Yearbook of Shandong Province, 2010. Jinan city: Department of Ocean and Fishery of Shandong Province.
Eikeset, A. M., Richter, A. P., Dankel, D. J., Dunlop, E. S., Heino, M., Dieckmann, U., et al. (2013). A bio-economic analysis of harvest control rules for the Northeast Arctic cod fishery. Mar. Pol. 39, 172–181. doi: 10.1016/j.marpol.2012.10.020
FAO (2003). The Ecosystem Approach to Fisheries. FAO Technical Guidelines for Responsible Fisheries, No.4, (Suppl. 2). Rome: FAO.
Fauconnet, L., and Rochet, M.-J. (2016). Fishing selectivity as an instrument to reach management objectives in an ecosystem approach to fisheries. Mar. Pol. 64, 46–54. doi: 10.1016/j.marpol.2015.11.004
Fay, G., DePiper, G., Steinback, S., Gamble, R. J., and Link, J. S. (2019). Economic and Ecosystem Effects of Fishing on the Northeast US Shelf. Front. Mar. Sci. 6:133. doi: 10.3389/fmars.2019.00133
Fenberg, P. B., and Roy, K. (2008). Ecological and evolutionary consequences of size-selective harvesting: how much do we know? Mol. Ecol. 17, 209–220. doi: 10.1111/j.1365-294x.2007.03522.x
Fonteyne, R., Zeevisserji, R. V., and Oostende, B. (1996). Manual of methods of measuring the selectivity of towed fishing gears. ICES Cooper. Res. Rep. 215, 38–99.
Garcia, S. M., Kolding, J., Rice, J., Rochet, M.-J., Zhou, S., Arimoto, T., et al. (2012). Reconsidering the Consequences of Selective Fisheries. Science 335, 1045–1047. doi: 10.1126/science.1214594
George, M., Yoshikazu, W., and Naruhito, T. (2005). Factors Influencing the Prices of Fish in Central Region of Malawi and its Implications on the Development of Aquaculture in Malawi. J. Appl. Sci. 5, 1424–1429.
Gislason, H., Daan, N., Rice, J. C., and Pope, J. G. (2010). Size, growth, temperature and the natural mortality of marine fish. Fish Fish. 11, 149–158. doi: 10.1111/j.1467-2979.2009.00350.x
Günther, C., Temming, A., Santos, J., Berkenhagen, J., Stepputtis, D., Schultz, S., et al. (2021). Small steps high leaps: bio-economical effects of changing codend mesh size in the North Sea Brown shrimp fishery. Fish. Res. 234:105797. doi: 10.1016/j.fishres.2020.105797
Hamilton, S. L., Caselle, J. E., Standish, J. D., Schroeder, D. M., Love, M. S., Rosales-Casian, J. A., et al. (2007). Size-selective harvesting alters life histories of a temperate sex-changing fish. Ecol. Appl. 17, 2268–2280. doi: 10.1890/06-1930.1
Hamley, J. M. (1975). Review of Gillnet Selectivity. J. Fish. Res Board Can. 32, 1943–1969. doi: 10.1139/f75-233
Hanna, S. S. (1998). Institutions for marine ecosystems: economic incentives and fishery management. Ecol. Appl. 8, S170–S174.
Heikinheimo, O., Setälä, J., Saarni, K., and Raitaniemi, J. (2006). Impacts of mesh-size regulation of gillnets on the pikeperch fisheries in the Archipelago Sea, Finland. Fish. Res. 77, 192–199. doi: 10.1016/j.fishres.2005.11.005
Huang, L., Gao, H., Tang, Y., Liu, C., Xu, Q., and Sun, P. (2016). Study on the Selectivity of Codend Mesh of Tanzi Net in Haizhou Bay. J. Ocean Univ. CHIN. 46, 143–150.
Kolding, J., and van Zwieten, P. A. M. (2011). The Tragedy of Our Legacy: how do Global Management Discourses Affect Small Scale Fisheries in the South? Forum Dev. Stud. 38, 267–297. doi: 10.1080/08039410.2011.577798
Kvamsdal, S. F., Eide, A., Ekerhovd, N., Enberg, K., Gudmundsdottir, A., Hoel, A. H., et al. (2016). Harvest control rules in modern fisheries management. Elementa 4:000114. doi: 10.12952/journal.elementa.000114
Law, R., Plank, M. J., and Kolding, J. (2012). On balanced exploitation of marine ecosystems: results from dynamic size spectra. ICES J. Mar. Sci. 69, 602–614. doi: 10.1093/icesjms/fss031
Lee, M. Y., Steinback, S., and Wallmo, K. (2017). Applying a bioeconomic model to recreational fisheries management: groundfish in the northeast united states. Mar. Resour. Econ. 32, 191–216. doi: 10.1086/690676
Li, Y., Sun, M., Zhang, C., Zhang, Y., Xu, B., Ren, Y., et al. (2020). Evaluating fisheries conservation strategies in the socio-ecological system: a grid-based dynamic model to link spatial conservation prioritization tools with tactical fisheries management. PLoS One 15:e230946. doi: 10.1371/journal.pone.0230946
Lima, M., Canales, T. M., Wiff, R., and Montero, J. (2020). The Interaction Between Stock Dynamics, Fishing and Climate Caused the Collapse of the Jack Mackerel Stock at Humboldt Current Ecosystem. Front. Mar. Sci. 7:123. doi: 10.3389/fmars.2020.00123
Lin, L., Liu, Z., Jiang, Y., Huang, W., and Gao, T. (2011). Current status of small yellow croaker resources in the southern Yellow Sea and the East China Sea. CHIN. J. Oceanol. Limnol. 29, 547–555. doi: 10.1007/s00343-011-0182-8
Liu, Q., Xu, B., Ye, Z., and Ren, Y. (2012). Growth and mortality of small yellow croaker (Larimichthys polyactis) inhabiting Haizhou bay of China. J. Ocean Univ. CHIN. 11, 557–561. doi: 10.1007/s11802-012-2099-z
Liu, Y., Zhang, C., Xu, B., Xue, Y., Ren, Y., and Chen, Y. (2021). Accounting for Seasonal Growth in Per-Recruit Analyses: a Case Study of Four Commercial Fish in Coastal China Seas. Front. Mar. Sci. 8:567240. doi: 10.3389/fmars.2021.567240
Liu, Z., Xie, H., Yan, L., Yuan, X., Yang, L., Li, Y., et al. (2013). Comparative population dynamics of small yellow croaker Larimichthys polyactis in Southern Yellow Sea and East China Sea. J. Dalian Ocean Univ. 28, 627–632.
Liu, Z., Yuan, X., Yang, L., Yan, L., Zhang, H., and Cheng, J. (2015). Effect of stock abundance and environmental factors on the recruitment success of small yellow croaker in the East China Sea. CHIN. J. Appl. Ecol. 26, 588–600.
Macbeth, W. G., Broadhurst, M. K., and Millar, R. B. (2005). Improving selectivity in an Australian penaeid stow-net fishery. Bull. Mar. Sci. 76, 647–660.
Macher, C., Guyader, O., Talidec, C., and Bertignac, M. (2008). A cost–benefit analysis of improving trawl selectivity in the case of discards: the nephrops norvegicus fishery in the bay of biscay. Fish. Res. 92, 76–89. doi: 10.1016/j.fishres.2007.12.021
Marty, L., Dieckmann, U., and Ernande, B. (2015). Fisheries-induced neutral and adaptive evolution in exploited fish populations and consequences for their adaptive potential. Evol. Appl. 8, 47–63. doi: 10.1111/eva.12220
Maynou, F., García-de-Vinuesa, A., Sánchez, P., and Demestre, M. (2021). Bioeconomic impacts of two simple modifications to trawl nets in the NW Mediterranean. Ocean Coastal Manag. 213:105853. doi: 10.1016/j.ocecoaman.2021.10585
MOA (2014). Circular of the Ministry of Agriculture on the implementation of the Minimum Mesh Size system for Marine Fishing Gear and transition Gear. Available online at: http://www.yyj.moa.gov.cn/tzgg/201404/t20140402_6300664.htm (Accessed on Apr 02, 2014)
MOA (2017). Circular of the Ministry of Agriculture on further strengthening the control of domestic Fishing Vessels and Implementing the Total Management of Marine Fisheries Resources. Available online at: http://www.moa.gov.cn/nybgb/2017/derq/201712/t20171227_6130861.htm (Accessed Feb 20, 2017)
Moullec, F., Barrier, N., Drira, S., Guilhaumon, F., Marsaleix, P., Somot, S., et al. (2019). An End-to-End Model Reveals Losers and Winners in a Warming Mediterranean Sea. Front. Mar. Sci. 6:345. doi: 10.3389/fmars.2019.00345
Nguyen, K. Q., and Morris, C. J. (2021). Fishing for Atlantic cod (Gadus morhua) with pots and gillnets: a catch comparison study along the southeast coast of Labrador. Aquac. Fish. (in press). doi: 10.1016/j.aaf.2021.05.006
Öndes, F., Kaiser, M. J., and Murray, L. G. (2017). Relative growth and size at onset of sexual maturity of the brown crab, Cancer pagurus in the Isle of Man, Irish Sea. Mar. Biol. Res. 13, 237–245. doi: 10.1080/17451000.2016.1248849
Prellezo, R., Accadia, P., Andersen, J. L., Andersen, B. S., Buisman, E., Little, A., et al. (2012). A review of EU bio-economic models for fisheries: the value of a diversity of models. Mar. Pol. 36, 423–431. doi: 10.1016/j.marpol.2011.08.003
Quaas, M. F., Reusch, T. B. H., Schmidt, J. O., Tahvonen, O., and Voss, R. (2016). It is the economy, stupid! Projecting the fate of fish populations using ecological-economic modeling. Glob. Chang. Biol. 22, 264–270. doi: 10.1111/gcb.13060
Reddy, S. M. W., Wentz, A., Aburto-Oropeza, O., Maxey, M., and Leslie, N. H. M. (2013). Evidence of market-driven size-selective fishing and the mediating effects of biological and institutional factors. Ecol. Appl. 23, 726–741. doi: 10.1890/12-1196.1
Sary, Z., Oxenford, H. A., and Woodley, J. D. (1997). Effects of an increase in trap mesh size on an overexploited coral reef fishery at Discovery Bay, Jamaica. Mar. Ecol. Prog. 154, 107–120. doi: 10.3354/meps154107
Sogn-Grundvåg, G., Zhang, D., and Dreyer, B. (2021). Competition in a fish auction: the case of Atlantic cod in Northern Norway. Fish. Res. 235:105826. doi: 10.1016/j.fishres.2020.105826
Sola, I., Maynou, F., and Sánchez-Lizaso, J. L. (2020). Bioeconomic Analysis of the EU Multiannual Management Plan for Demersal Fisheries in the Western Mediterranean. Spanish Fisheries as a Case Study. Front. Mar. Sci. 7:459. doi: 10.3389/fmars.2020.00459
Stepputtis, D., Santos, J., Herrmann, B., and Mieske, B. (2016). Broadening the horizon of size selectivity in trawl gears. Fish. Res. 184, 18–25. doi: 10.1016/j.fishres.2015.08.030
Suh, D., and Pomeroy, R. (2020). Projected Economic Impact of Climate Change on Marine Capture Fisheries in the Philippines. Front. Mar. Sci. 7:232. doi: 10.3389/fmars.2020.00232
Sumaila, U. R., and Munro, G. R. (2018). “Fisheries Economics” in Encyclopedia of Ocean Sciences eds., K. C. Kirk, J. B. Henry, and L. Y. Pattricia (Cambridge: Academic press).
Sun, M., Zhang, J., and Xu, L. (2006). Size selectivity of diamond and square mesh codends for hairfin anchovy Setipinna taty in Chinese stow net fisheries. Fish. Sci. 72, 530–539. doi: 10.1111/j.1444-2906.2006.01181.x
Sun, Z., Zhou, J., Wang, J., Zhao, Z., Zhuang, S., Chen, B., et al. (2012). Stow net fishery in the Yellow Sea and Bohai Sea. Prog. Fish. Sci. 33, 94–101.3.
Tahvonen, O., Quaas, M. F., and Voss, R. (2018). Harvesting selectivity and stochastic recruitment in economic models of age-structured fisheries. J. Environ. Econ. Manag. 92, 659–676. doi: 10.1016/j.jeem.2017.08.011
Tang, Y., Qi, G., Wang, X., Tian, F., and Wan, R. (2014). Catch Composition of the Set-Net Along the Coastal Water and Resource Utilization Analysis of Haizhou Bay. J. Ocean Univ. CHIN. 44, 29–38.
Tschernij, V., Suuronen, P., and Jounela, P. (2004). A modelling approach for assessing short-term catch losses as a consequence of a mesh size increase. Fish. Res. 69, 399–406. doi: 10.1016/j.fishres.2004.05.011
Ulrich, C., Andersen, B. S., Sparre, P. J., and Nielsen, J. R. (2007). TEMAS: fleet-based bio-economic simulation software to evaluate management strategies accounting for fleet behaviour. ICES J. Mar. Sci. 64, 647–651. doi: 10.1093/icesjms/fsm044
van Poorten, B., Korman, J., and Walters, C. (2018). Revisiting Beverton–Holt recruitment in the presence of variation in food availability. Rev. Fish Biol. Fish. 28, 607–624. doi: 10.1007/s11160-018-9521-6
Voss, R., Quaas, M. F., Stoeven, M. T., Schmidt, J. O., Tomczak, M. T., and Möllmann, C. (2017). Ecological-Economic Fisheries Management Advice—Quantification of Potential Benefit for the Case of the Eastern Baltic COD Fishery. Front. Mar. Sci. 4:209. doi: 10.3389/fmars.2017.00209
Xu, G., Zhang, H., Yu, B., Chen, F., and Zhu, W. (2019). Selectivity of different mesh size codends of canvas stow net for Larimichthys polyactis. J. Fish. CHIN. 43, 1539–1548.
Xu, Q., Li, X., Sun, S., and Fan, G. (2020). Selectivity of Codend Mesh of Stow Nets with Double Pile Vertical Holein Haizhou Bay in Autumn. Fish. Sci. 39, 388–393.
Yan, L., Liu, Z., Zhang, H., Lin, J., Yuan, X., and Li, S. (2014). On the evolution of biological characteristic and resources of small yellow croaker. Mar. Fish. 36, 481–488, doi: 10.1111/age.13000
Yang, B., Herrmann, B., Yan, L., Li, J., and Wang, T. (2021). Size selectivity and catch efficiency of diamond-mesh codends in demersal trawl fishery for conger pike (Muraenesox cinereus) of the South China Sea. Ocean Coastal Manag. 211:105777. doi: 10.1016/j.ocecoaman.2021.10577
Zhang, G., Li, X., Jin, X., Zhu, J., and Dai, F. (2010). Growth, mortality and optimum catchable size of small yellow croaker (Larimichthys polyactis Bleeker) in the Southern Yellow Sea. J. Fish. Sci. China 17, 839–846.
Keywords: bioeconomic model, Larimichthys polyactis, stow net, selective harvest, harvest scenario
Citation: Sun P, Yu J, Sun R, Liu G, Xi X and Tian Y (2022) The Effects of Selective Harvest on Exploited Population and Economic Benefits. Front. Mar. Sci. 9:847840. doi: 10.3389/fmars.2022.847840
Received: 03 January 2022; Accepted: 28 February 2022;
Published: 30 March 2022.
Edited by:
Lyne Morissette, M – Expertise Marine, CanadaReviewed by:
Isabella Bitetto, COISPA, ItalyHiroki Wakamatsu, Ministry of Agriculture, Forestry and Fisheries, Japan
Copyright © 2022 Sun, Yu, Sun, Liu, Xi and Tian. This is an open-access article distributed under the terms of the Creative Commons Attribution License (CC BY). The use, distribution or reproduction in other forums is permitted, provided the original author(s) and the copyright owner(s) are credited and that the original publication in this journal is cited, in accordance with accepted academic practice. No use, distribution or reproduction is permitted which does not comply with these terms.
*Correspondence: Peng Sun, sunpeng@ouc.edu.cn