
94% of researchers rate our articles as excellent or good
Learn more about the work of our research integrity team to safeguard the quality of each article we publish.
Find out more
ORIGINAL RESEARCH article
Front. Mar. Sci., 25 March 2022
Sec. Coastal Ocean Processes
Volume 9 - 2022 | https://doi.org/10.3389/fmars.2022.847655
This article is part of the Research TopicInnovations in Coastal Erosion Risk Assessment and MitigationView all 12 articles
 Chao Cao1,2,3,4,5,6*†
 Kai Zhu2†Feng Cai1,3,4,5,6*Hongshuai Qi1,3,4,5,6Jianhui Liu1,3,4,5,6Gang Lei1,3,4,6
 Zijian Mao2Shaohua Zhao1,3,4Gen Liu1,3,4,6Yan Su2
Under the dual effects of global climate change and intensive human development activities, vulnerability to coastal erosion in bay areas is becoming increasingly serious. This study focuses on 15 counties and districts along the coast of the Pearl River Estuary (PRE) Great Bay Area and selects 12 evaluation indices from five perspectives for analysis, including coastal characteristics, hydrodynamic forces, economics, population and coastal reconstruction. The analytic hierarchy process (AHP) method, Technique for Order Preference by Similarity to an Ideal Solution (TOPSIS) method, independent weight method, Jenks natural breaks method (Jenks), exposure-sensitivity-adaptation (ESA) model and obstacle degree method are used in conjunction with the above indices to construct a coastal erosion vulnerability evaluation system for the PRE. The results show that coastal erosion vulnerability in the PRE is low in the eastern hilly area and high in the central and western delta areas. Coastal characteristics, coastal lowlands and protection capability are the main controlling elements of erosion. The PRE experienced an era of rapid economic development from 1980 to 2010, and coastal erosion vulnerability gradually increased, with a cost of ecological environment destruction. Then, an era of coastal zone ecological restoration supported by policy protection occurred from 2010 to 2020. Compared with three major bay areas with similar developed economies worldwide, the PRE is characterized by comparatively late but rapid economic development. Notably, the development and utilization efficiency of coastal zones is very high, the duration of damage to the ecological environment is short, and the effects of ecological repair and restoration are obvious. The results of this study provide a reference for economic development and ecological restoration in the bay areas of China and provide scientific guidance for coastal zone development, management and planning.
Coastal erosion is a common phenomenon associated with geological hazards, coastline migration and subbed erosion in intertidal and subtidal zones (Cai et al., 2009). This phenomenon is accelerated by sea level rise issues caused by global warming, frequent storm surges and human activities (Li et al., 2015; Phong et al., 2017; Flor-Blanco et al., 2021). The number of coastal cities worldwide increased from 472 to 2,129 between 1950 and 2015 (Stronkhorst et al., 2018). At the same time, coastal areas are densely populated areas that are home to high-economic-value activities, such as those in the industrial, transportation, and tourism sectors (Rangel-Buitrago et al., 2018). Many cities, people and businesses are being threatened by coastal erosion, and immeasurable losses could occur. Since China’s reform and expansion in 1978, the study area has experienced rapid urbanization, rapid population growth, frequent shoreline reconstruction, and frequent reclamation activities, and the low-lying Pearl River Delta has been severely affected by marine disasters. Frequent natural disasters have influenced many residents, and coastal areas with many high-value buildings are threatened by erosion. The erosion of sandy shorelines is prevalent in the study area. The Guangdong Provincial Government has selected some shore sections of Huidong County, Huiyang District, Longgang District, and Nansha District as coastal erosion priorities, among which the gold coast of Huiyang District is seriously eroded. Additionally, historical data indicate that hard artificial revetments, mainly seawalls, have been eroded by storm surges, and outburst events have regularly occurred (Chen et al., 2010). The threat of coastal erosion in the PRE coastal zone system is high, and the current coastal erosion situation is bleak.
Therefore, the vulnerability of coastal zones to coastal erosion disasters needs to be effectively evaluated to quantify the potential amount of loss and the degree of damage. Like most studies in the twentieth century, early evaluations of coastal erosion vulnerability based on factors such as sea level rise, coastal geomorphology, elevation, coastal slope, coastline change, land use, tidal range and wave height (Pendleton et al., 2010; Yin et al., 2012; Jana and Bhattacharya, 2013), focused too much on the effects of natural or climatic conditions on coastal zone systems, leading to exaggerated effects of natural factors. As social factors, such as gross domestic product (GDP), fiscal expenditure, population density, value of coastal buildings, proportion of artificial shoreline, and reclamation area were considered in studies of coastal erosion vulnerability (Cai et al., 2019; Zhu, 2019; Wang X. T. et al., 2021), vulnerability evaluation systems have been improved, and vulnerability hazards can now be comprehensively assessed. However, the number of evaluation factors is not directly related to the accuracy of the evaluation system because the evaluation factors will be highly correlated (McLaughlin and Cooper, 2010). With the optimization of index systems, mathematical methods for coastal vulnerability assessment have evolved from the simple place vulnerability index (PVI), coastal social vulnerability index (SVI) and coastal vulnerability index (CVI) models (Boruff et al., 2005; Duriyapong and Nakhapakorn, 2011) into the analytic hierarchy process (AHP) (Hoque et al., 2018), fuzzy mathematical (Luo et al., 2013) and cloud model methods (Zhu et al., 2018; Cai et al., 2019) for assessing vulnerability. The AHP is a reliable method to deal with multicriteria analysis (Roy et al., 2021), and most coastal erosion vulnerability assessments are based on this method. With the introduction of geographic information system (GIS) technology, the results of coastal erosion vulnerability assessments can be effectively visualized (Li et al., 2015). Jenks is a map classification method in GISs, that can group similar values most appropriately and maximize the differences among various classes. This method has achieved good results in vulnerability zoning of the Chittagong District and Bangladesh coast (Miah et al., 2020). System vulnerability includes three main factors: exposure, sensitivity and adaptation (ESA). Exposure refers to the degree of interference in the system caused by natural and human-made external factors. Sensitivity refers to the inherent vulnerability within a system, and adaptability is the ability of a system to return to its original state under the effects of external disturbances (Swami and Parthasarathy, 2021). The ESA concept has been coupled with coastal vulnerability in studies of coastal areas in South East Queensland, Australia, and the Korean coast (Sano et al., 2015; Kang et al., 2018). However, few scholars have coupled ESA models with coastal erosion vulnerability. The TOPSIS method can comprehensively and objectively reflect the dynamic change trend of the research object (Li and Damen, 2010), which has been verified and applied by many experts from various fields (Yang et al., 2018). The obstacle degree model can obtain the main influencing factors restricting the development of the research object, and is widely used in the study of ecology, environmental carrying capacity and vulnerability (Wu and Hu, 2020; Wang X. Y. et al., 2021; Yang and Shuai, 2021). TOPSIS method and obstacle degree model can well explain the temporal and spatial variation laws and main influencing factors of China’s delta urban agglomeration in the fields of sustainable development and air quality (Gao et al., 2019; Liang et al., 2021; Xu et al., 2021); however, few scholars apply them to the evaluation of coastal erosion vulnerability. The Pearl River Delta, where the Pearl River Estuary (PRE) Bay Area is located, has been studied in detail; specifically, the spatiotemporal evolution of urbanization, coastlines, and wetland types has been considered (Li and Damen, 2010; Yang et al., 2020, 2021; Guo et al., 2021), but few studies have examined the temporal and spatial changes in coastal erosion vulnerability and quantitatively evaluated vulnerability.
In this study, 15 coastal counties and districts in the Great Bay Area of the PRE were used as evaluation units, and each decade between 1980 and 2020 was divided into an evaluation period, with a total of 5 periods. According to previous studies and regional characteristics, the impact of natural and socioeconomic conditions on the coastal zone is considered at the same time, and 12 evaluation indices were selected from 5 perspectives: coastal characteristics, hydrodynamic forces, economics, population and coastline reconstruction. The AHP, independent weight, TOPSIS, Jenks, ESA and obstacle degree methods were applied to comprehensively calculate the erosion vulnerability indices and grades for each coastal evaluation unit. Additionally, an obstacle degree model was used to evaluate the temporal and spatial distributions of the ESA characteristics in the coastal zone of the PRE, and analyses of the main controlling elements and indices affecting the spatial and temporal distributions of coastal erosion vulnerability in the Great Bay Area were performed.
Through weight, vulnerability calculation and factor analysis method, we hope to find out the temporal and spatial variation law and main influencing factors of coastal erosion vulnerability in the Pearl River Estuary Bay area since the reform and opening up. The assessment results can provide a scientific basis and practical experience for coastal zone protection and vulnerability assessment and contribute to government decision-making.
The PRE is located in the southeast coast of Guangdong Province, China (111. 35°∼115.47° E, 21.45°∼24.40°N). It is a bay area composed of 9 cities in Guangdong Province, China, including Guangzhou, Shenzhen, Foshan, Zhuhai, Dongguan, Zhongshan, Jiangmen and Zhaoqing (except Hong Kong and Macao special administrative regions). The evaluation units of this study are 15 coastal counties and districts in the PRE (Both Dongguan City and Zhongshan City have only district along the coast, Figure 1).
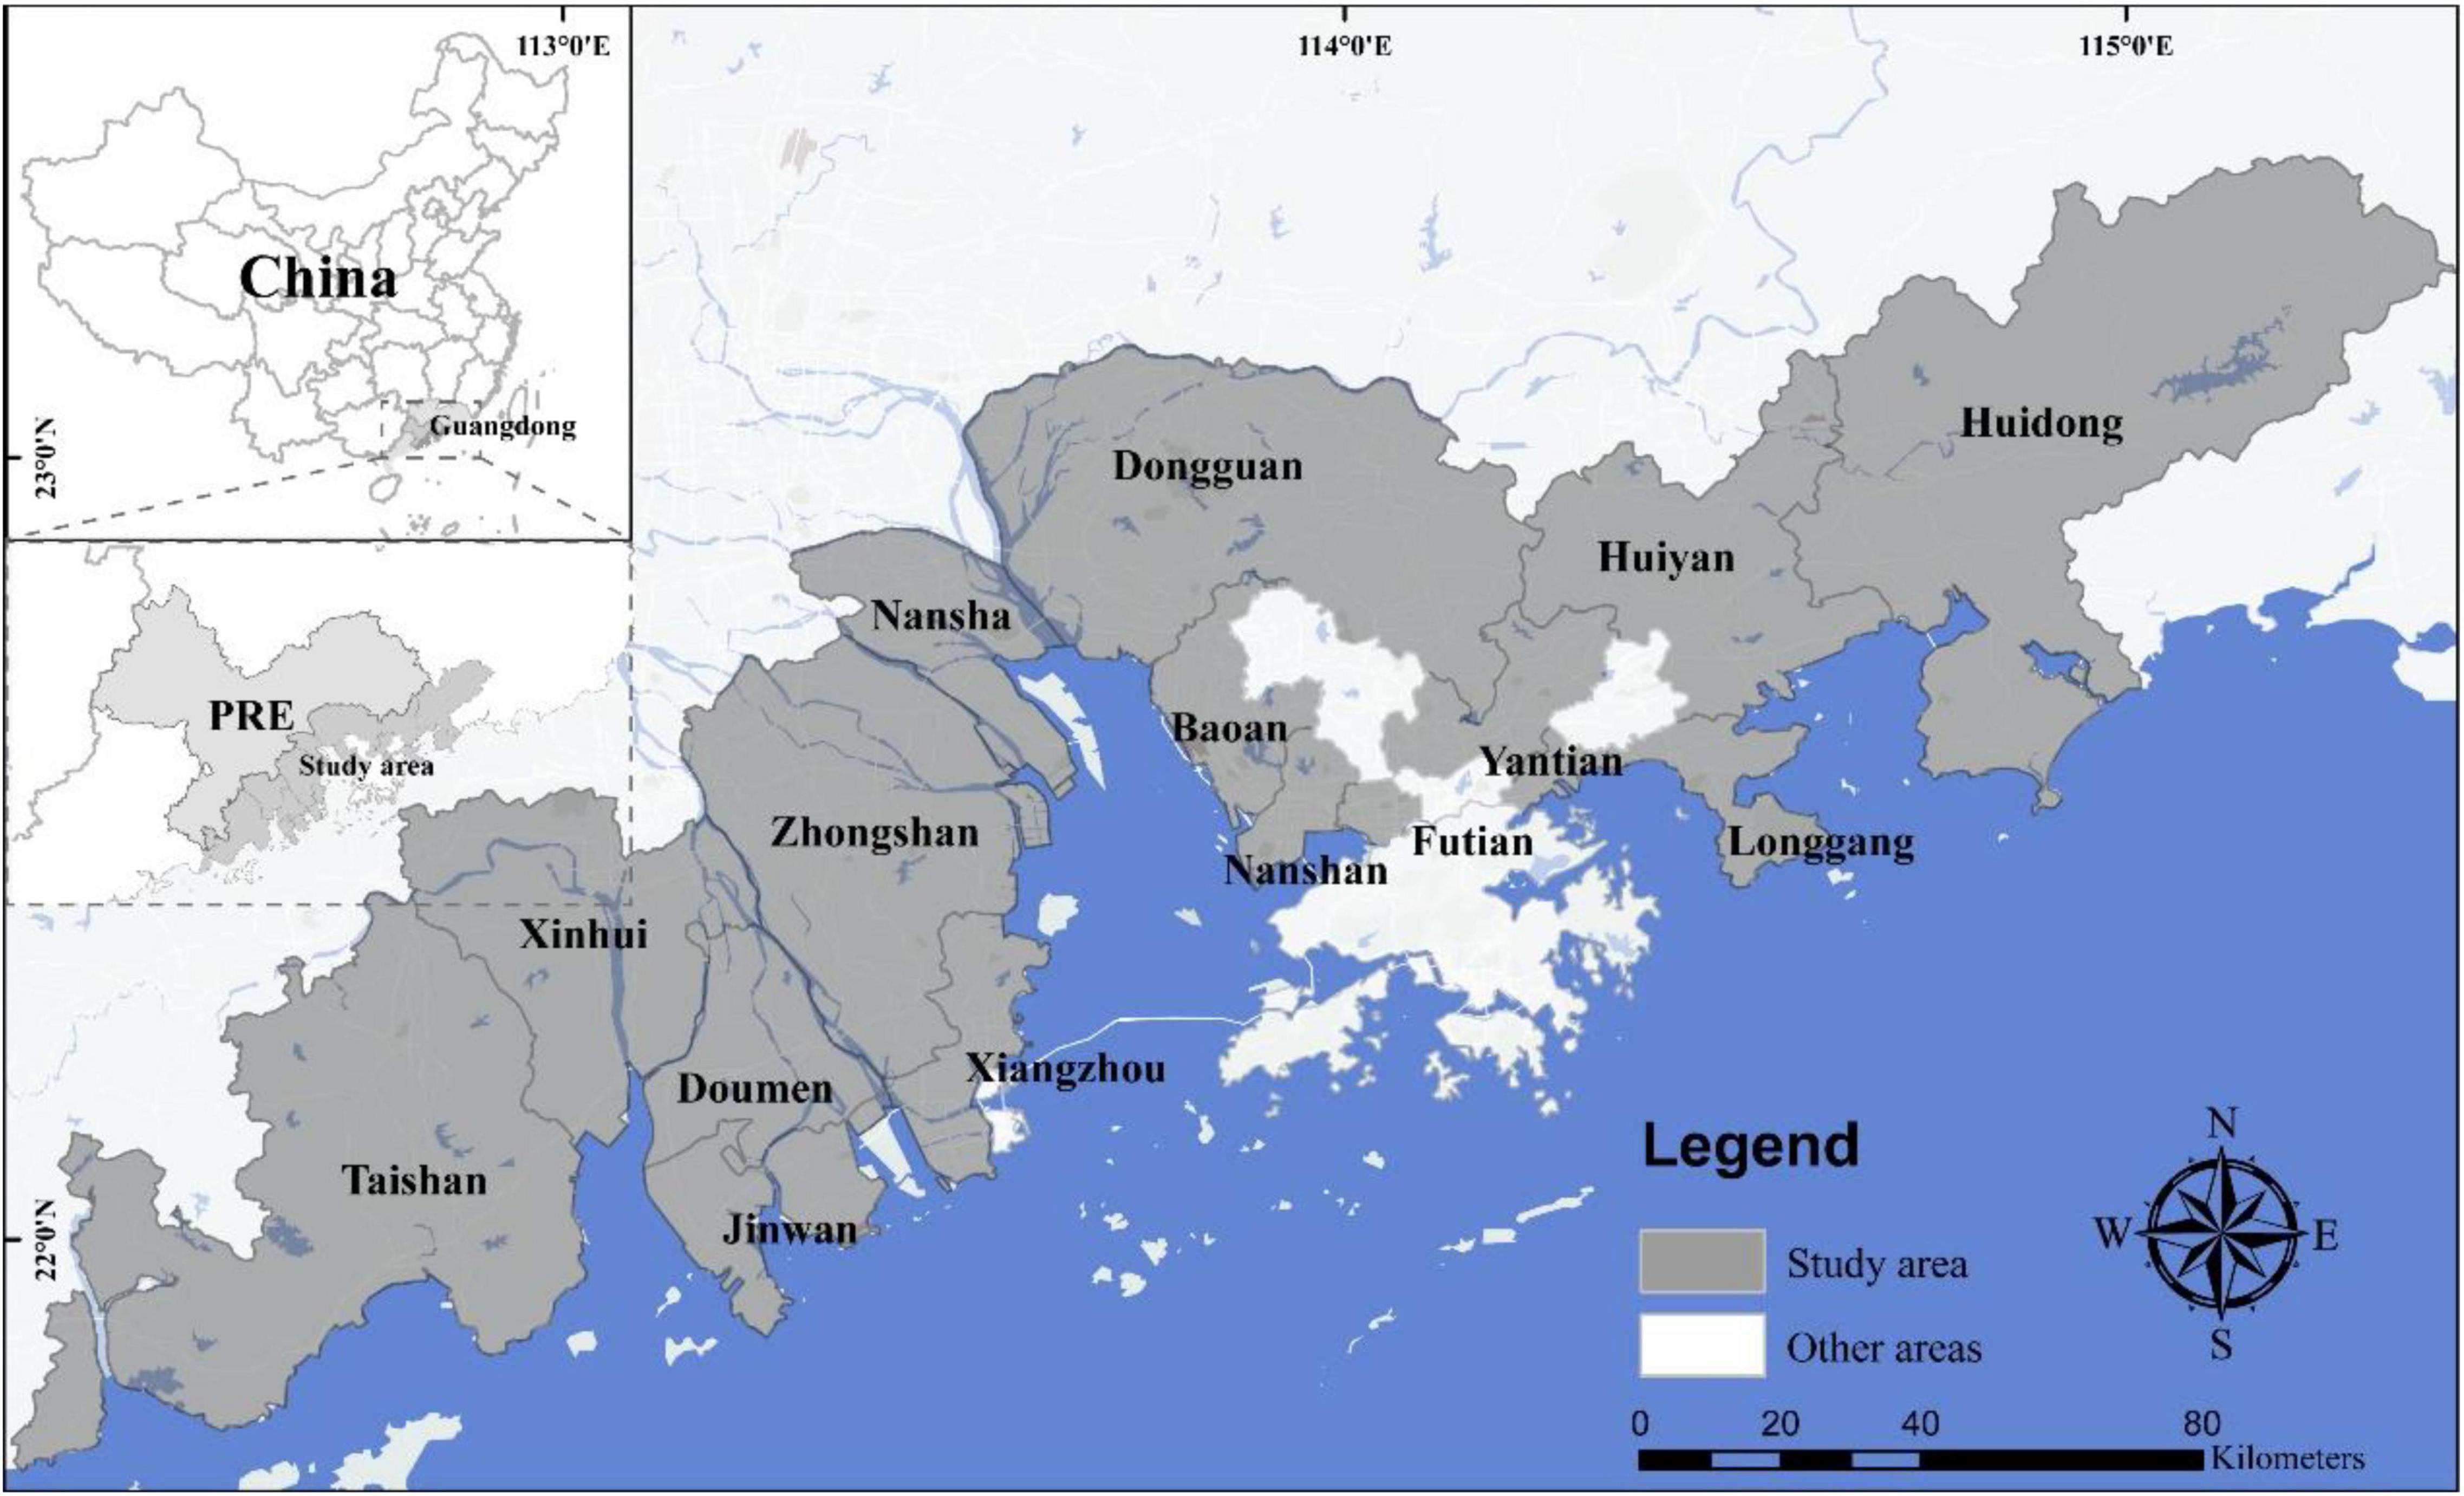
Figure 1. ThePRE is located in the southeast coast of Guangdong Province, China. The study area encompasses 15 counties and districts along the PRE coast (study areas are gray, and other areas are white).
The study area covers a land region of approximately 17,915 km2, of which nearly one-third of the area is low, flat and vulnerable to coastal erosion caused by sea level rise. Approximately 63.1% of hard artificial shorelines in the PRE are resistant to natural erosion over long-term periods. The study area is located in the PRE, which is severely affected by marine hazards. Since 1970, 277 tropical cyclones have affected the PRE (Ye et al., 2020), accompanied by strong winds, large waves, and rainstorms, which have considerably increased the vulnerability of the area to coastal erosion (Han et al., 2010). The permanent population of the study area is approximately 33.6 million (according to statistics from China’s seventh census), and the population density is as high as 1,874 people/km2. Thus, this region is one of the most densely populated and urbanized areas in China, and the coastal zone system is under enormous pressure. As of 2020, 87.6% (944 km) of the coastline in the study area was disturbed by human activities, and approximately 597 km2 of sea area has been reclaimed. Frequent and intense human activities have changed the morphology and length of the coastline, causing irreversible changes to the coastal zone (Manuel et al., 2015). From the initial low-production-value economic structure based on farming and breeding to the current high-value industries with coastal tourism, business districts, ports and docks, the losses caused by coastal erosion were immeasurable.
The AHP method decomposes complex problems into various constituent factors and then groups these factors according to the dominant relationship to form a hierarchical evaluation system. A top-down evaluation hierarchy was constructed using the AHP method, with natural and socioeconomic conditions used to establish the element layer. Five factors, namely, coastal characteristics, hydrodynamic conditions, economic conditions, demographic conditions and shoreline modifications, were used to establish the index layer, and 12 indicators, among which include coastal lowlands, storm surges and GDP, were used to construct the factor layer (Figure 2, P1). Table 1 lists the indices used for coastal erosion vulnerability evaluation in the study area and the corresponding data sources.
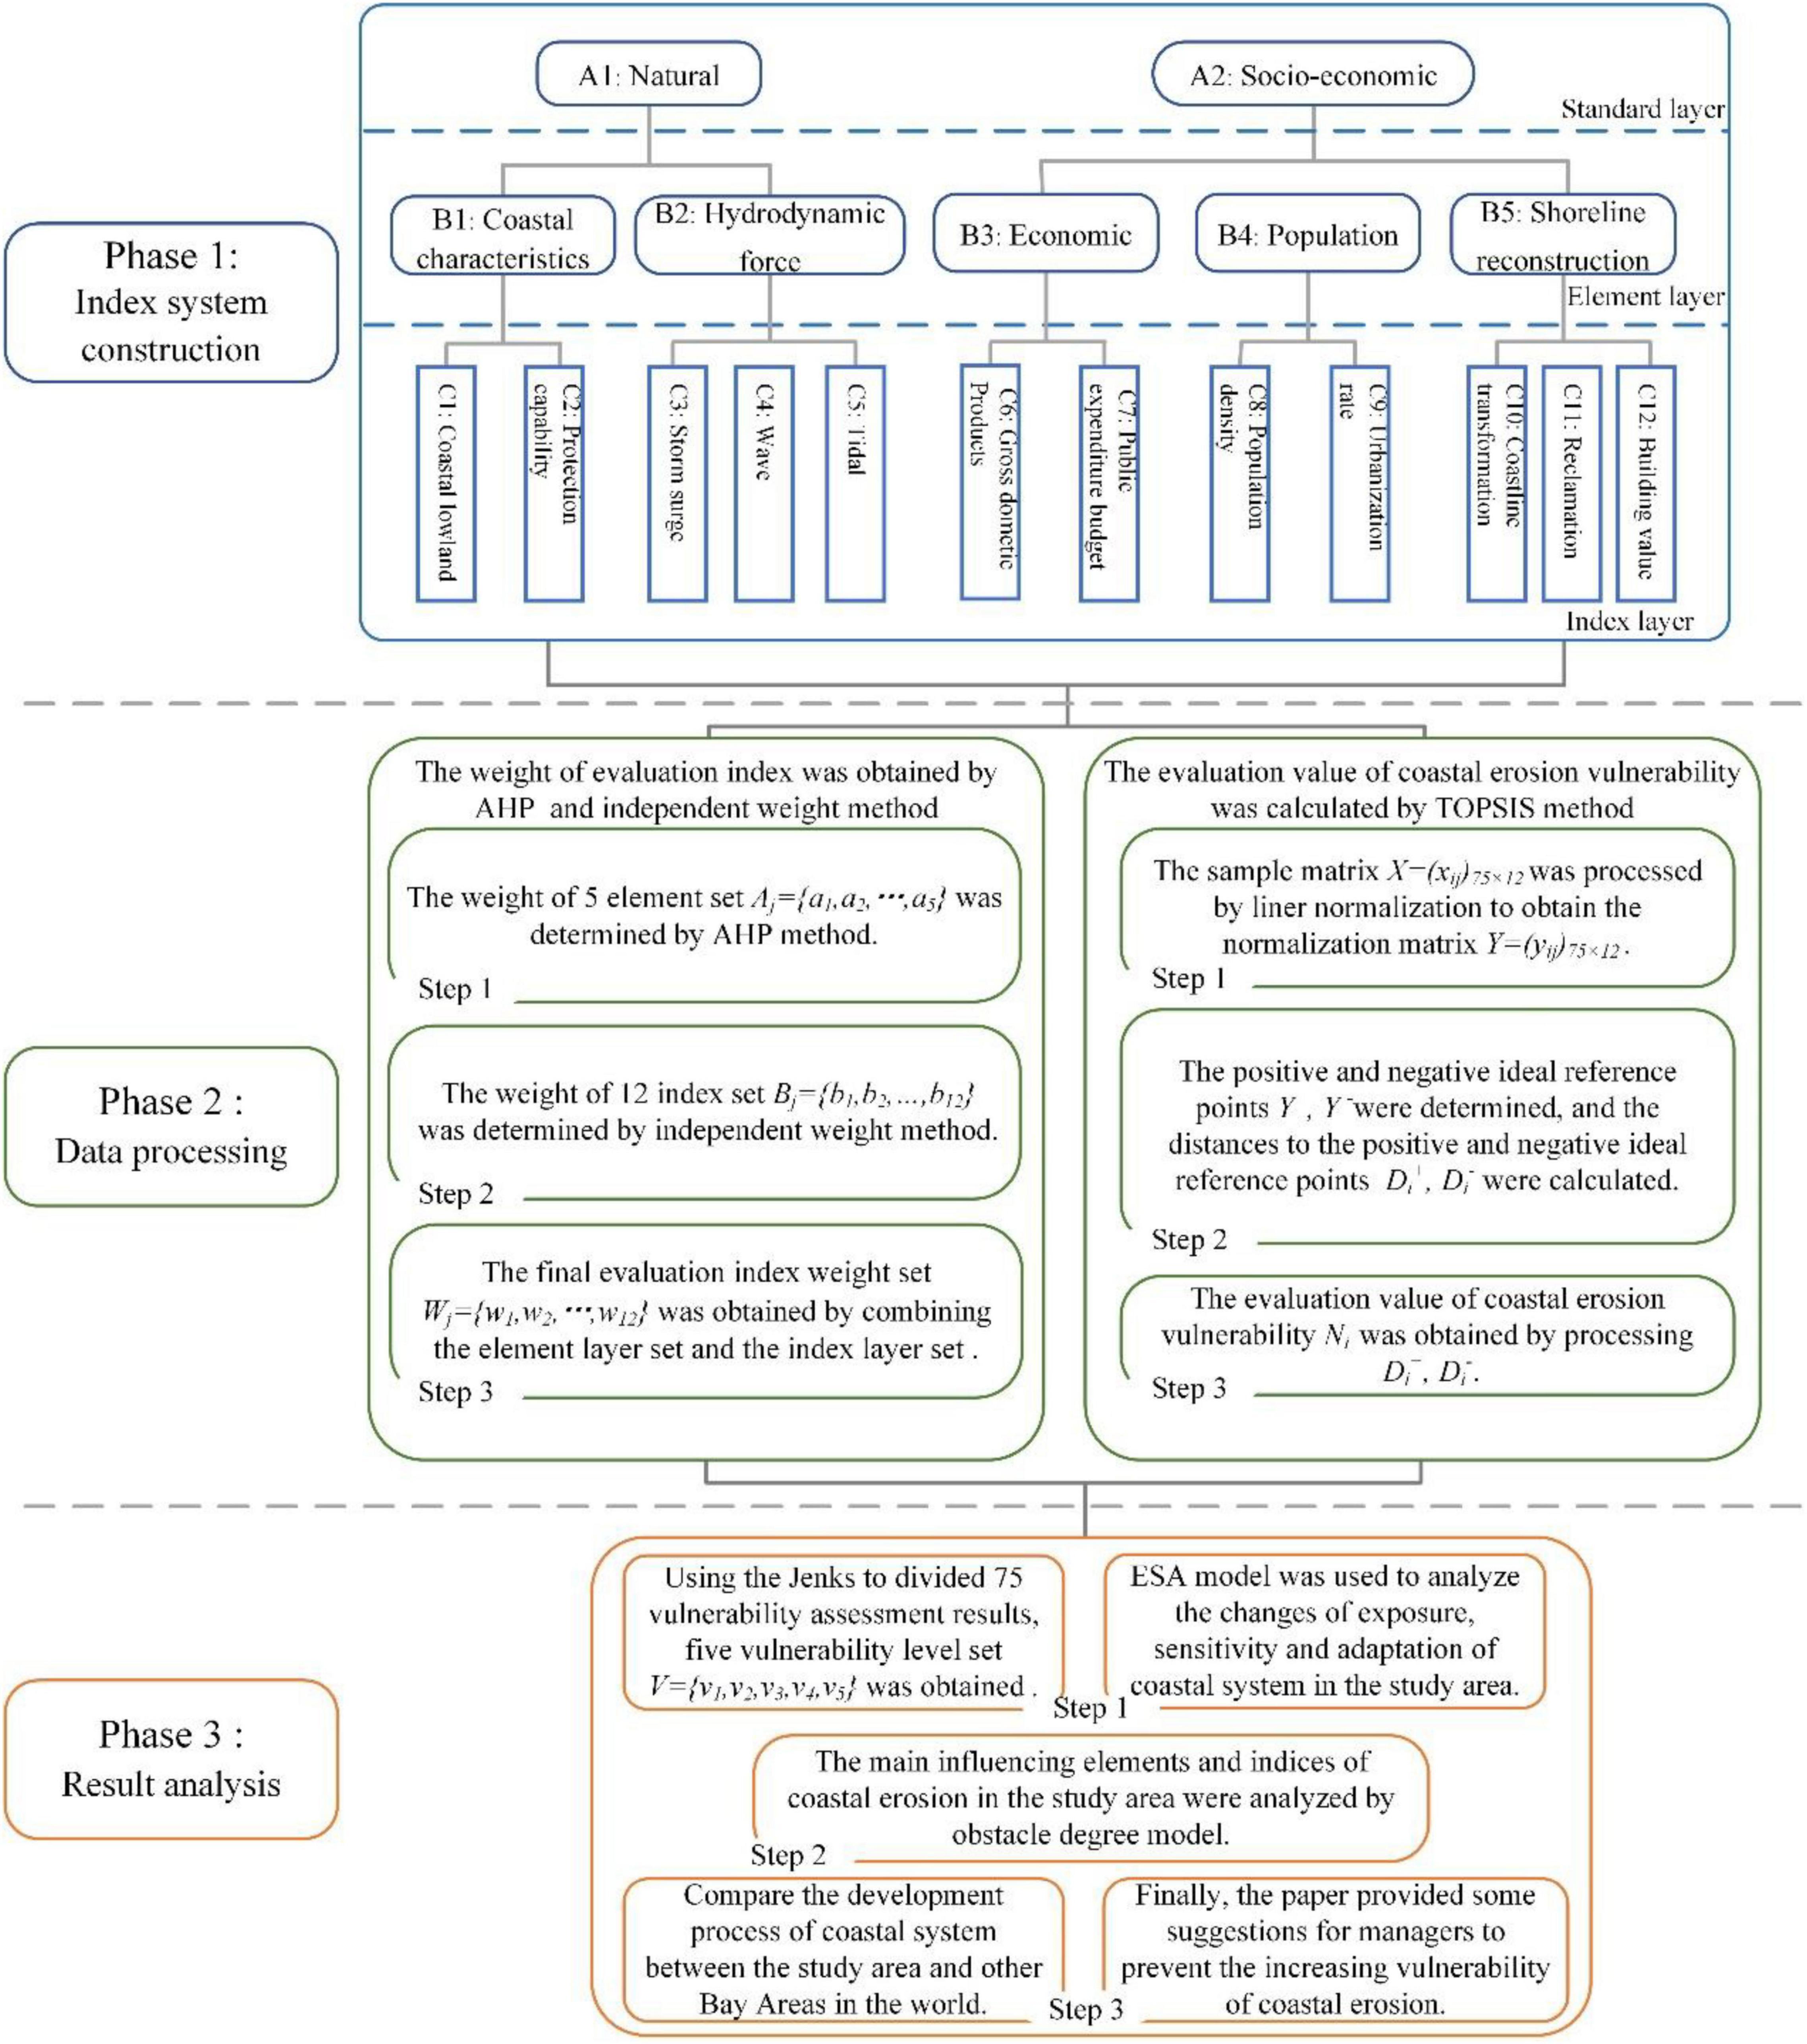
Figure 2. Flow chart of the technical methods used in this study. This study consists of three phases: Index system construction, data processing and analysis of the results. The corresponding tables of numerical symbols and acronyms in this paper are described in Supplementary Table 1.

Table 1. Indicators used in the integrated coastal erosion vulnerability assessment.
The data processing method in this study consists of weight calculation and the TOPSIS method. The weight is composed of the subjective weight AHP method and objective weight independent weight method (Figure 2, P2).
Jenks is used to classify the vulnerability evaluation results. The changes in exposure, sensitivity and adaptability in the study area over the past 40 years were analyzed by the ESA model. The obstacle degree model is used to analyze the main vulnerability factors. Then, the results of this study are compared with other regions, and the similarities and differences in coastal zone system development in the study area are obtained. Finally, this study puts forward some suggestions to provide a reference for management decision-making (Figure 2, P3).
The AHP method determines the relative importance of each factor through pairwise comparison between elements, and then obtains the weight value of each element by synthesizing the judgment of decision-makers. The independence weight method is an objective weight method. The idea of this method is to use the collinearity between indicators to determine the weight. The method was used to establish the top-down evaluation hierarchy between the element layer and factor layer in the evaluation system for coastal erosion vulnerability, and the AHP method was used to calculate the weight set Aj = {a1, a2, ⋯, a5} for the five factors in the element layer. The 12 evaluation factors were first determined by the independent weight method, and the weight set Bj = {b1, b2, ⋯, b12} was obtained. Then, the weight set Wj = {w1, w2, ⋯, w12} was obtained for the 12 evaluation indices by the joint weighting of sets Aj and Bj (Supplementary Table 3).
The TOPSIS method is a comprehensive evaluation method with distance as the evaluation standard. This method combines the size of data to determine the positive and negative ideal solutions and the distance between positive and negative ideal solutions, and finally obtains the proximity value. The set of weights Wj = {w1, w2, ⋯, w12} was substituted into the weighted TOPSIS method for calculation.
(i) Dimensionless index processing. The sample matrix X = (xij)75×12 (Supplementary Table 4), consisting of 75 evaluation units and 12 evaluation indices, was processed by linear normalization to obtain the normalization matrix Y = (yij)75×12 (Supplementary Table 5).
Positive indices:
Negative indices:
The purpose of adding 0.001 to formula 1 and 2 is to prevent the divisor from being 0 in subsequent calculations.
(ii) The positive and negative ideal reference points were determined, and the distances to the positive and negative ideal reference points (Supplementary Tables 6A,B) were calculated.
(iii) The coastal erosion vulnerability assessment values were obtained.
The greater the assessment value is, the more severe the level of coastal erosion vulnerability is.
The Jenks method will set its boundary where the difference in data values is relatively large. The method was used for the 75 evaluation units to classify the calculated coastal erosion vulnerability values Ni = {n1, n2, ⋯, n75}T into a set of 5 levels with the smallest standard deviation within groups and the largest standard deviation between groups: low vulnerability, moderately low vulnerability, medium vulnerability, moderately high vulnerability, and high vulnerability V = {v1, v2, ⋯, v5}, and the results are presented in the map.
The ESA model consists of three elements: exposure, sensitivity and adaptation. Exposure represents the extent to which a coastal zone system is disturbed by external conditions, sensitivity represents the degree of inherent vulnerability in a coastal zone system, and adaptation represents the ability of a coastal zone to resist coastal erosion. Storm surges, waves, coastline transformation and reclamation were used as exposure evaluation indicators. Additionally, coastal lowlands, population density, urbanization rate and building value were used as sensitivity evaluation indicators. Finally, tides, GDP and the public expenditure budget were used as adaptation evaluation indicators. The 12 evaluation indices were regrouped according to the ESA model, and the above calculation steps (Section “Coastal Erosion Vulnerability Assessment” steps i–iii) were repeated. Then, the weighted TOPSIS method was applied to obtain the exposure, sensitivity and adaptation values for the 75 evaluation units in the studied coastal zone system. Exposure and sensitivity evaluation values are positively correlated with coastal erosion vulnerability, with large values reflecting large contributions to coastal erosion vulnerability. The opposite trend was observed for the adaptation indicators.
The obstacle degree model obtains the obstacle degree of each factor vulnerability of the evaluation unit by analyzing the weight of the evaluation index and its specific value. To explain the spatial variation in the vulnerability to coastal erosion in the study area, the normalization matrix and the weight matrix were processed using the obstacle degree model to obtain the contributions (Supplementary Tables 7A,B) of the factors that influence coastal erosion vulnerability in each of the evaluation units in the PRE. The formula is given as follows:
where TO represents the obstacle degree of the element layer, with a value equal to the sum of the evaluation indices for the prior factor layer; the larger the value of the obstacle degree of an evaluation index is, the larger the contribution of this index is to coastal erosion vulnerability.
This study used the weighted TOPSIS method to calculate values of coastal erosion vulnerability, and presented them on a map, which intuitively reflects the spatial and temporal changes in vulnerability in each county in the PRE region. The results are consistent with the physical process of coastal erosion. Because the span of the data used in this study is as long as 40 years, the quantitative differences among indicators are large in some cases, and the regional and temporal differences are eliminated by using data normalization to obtain comparable evaluation results. The accuracy of the sample data is appropriate, which can effectively distinguish the differences between counties and districts, and the vulnerability calculation results will not lose the sample data information. The independent weight method can eliminate the weight of high correlation factors and prevent the influence of high correlation between factors on the correctness of the evaluation system, which is not the case for other objective weight assignment methods. The Jenks method was used to classify the evaluation results, and the data were divided into five groups of results with the smallest standard deviation within groups and the largest standard deviation between groups. Overall, the vulnerability levels of 75 evaluation units were effectively classified. The ESA model and the obstacle degree model were used to calculate the main factors that influence ESA changes in each county and district for each period in relation to coastal erosion vulnerability, and the results provide effective guidance for shoreline protection in the study area.
The coastal erosion vulnerability in the 75 evaluation units in the study area was comprehensively evaluated using the improved TOPSIS method and the obstacle degree model, and the evaluation results (Ni values) for the vulnerability of districts and counties in each period were averaged to obtain the overall vulnerability i of the study area in each period (Table 2).
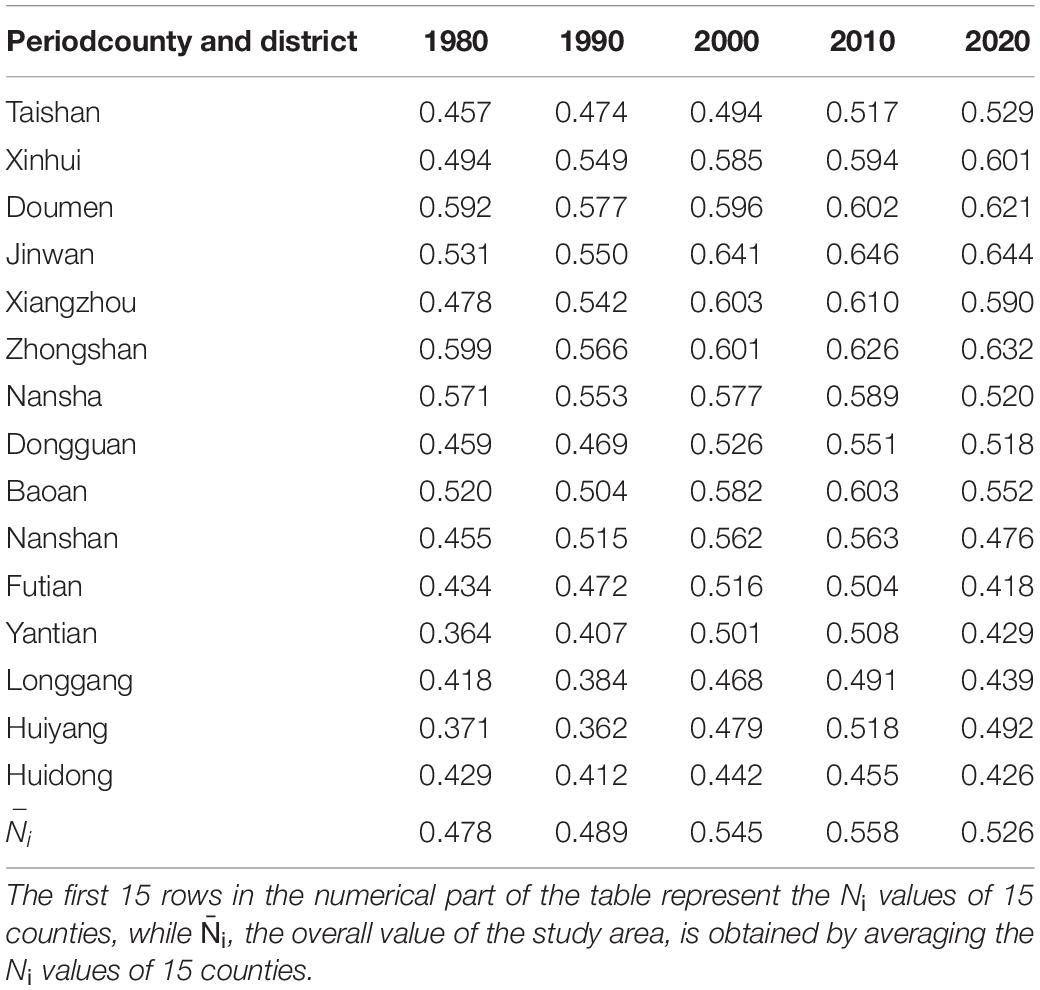
Table 2. Evaluation results for coastal erosion vulnerability in each county, district and study area in each period.
The overall coastal erosion vulnerability value in the study area ranged from 0.478 to 0.526 during the four decades from 1980 to 2020, reaching a maximum value of 0.558 in 2010 and falling back to 0.526 in 2020; overall, coastal erosion vulnerability increased in the first three decades and has gradually decreased in the past decade. The vulnerability of coastal erosion in Futian District started to decline in 2000, and this region displayed the earliest decline in the PRE area (Table 2).
The spatial and temporal variations in coastal erosion vulnerability zones, numbers of evaluation units and the vulnerability of each zone in the study area are shown in Figure 3. The coastal erosion vulnerability levels in the Futian, Yantian, Longgang, Huiyang, and Huidong Districts, which are located in the eastern part of the study area, are comparatively low, and these districts form an overall low-vulnerability area. Most of the moderately high- and high-vulnerability areas are concentrated in the central and western parts of the PRE, such as the Nansha, Zhongshan, Doumen, Jinwan, Xiangzhou, and Xinhui Districts. During the three decades from 1980 to 2010, the PRE area exhibited a trend of increased vulnerability to coastal erosion, and the overall vulnerability of the PRE area has considerably recovered since 2010, with notably decreasing vulnerability levels in the Nansha District, Dongguan District, Nanshan District, Futian District, and other regions.
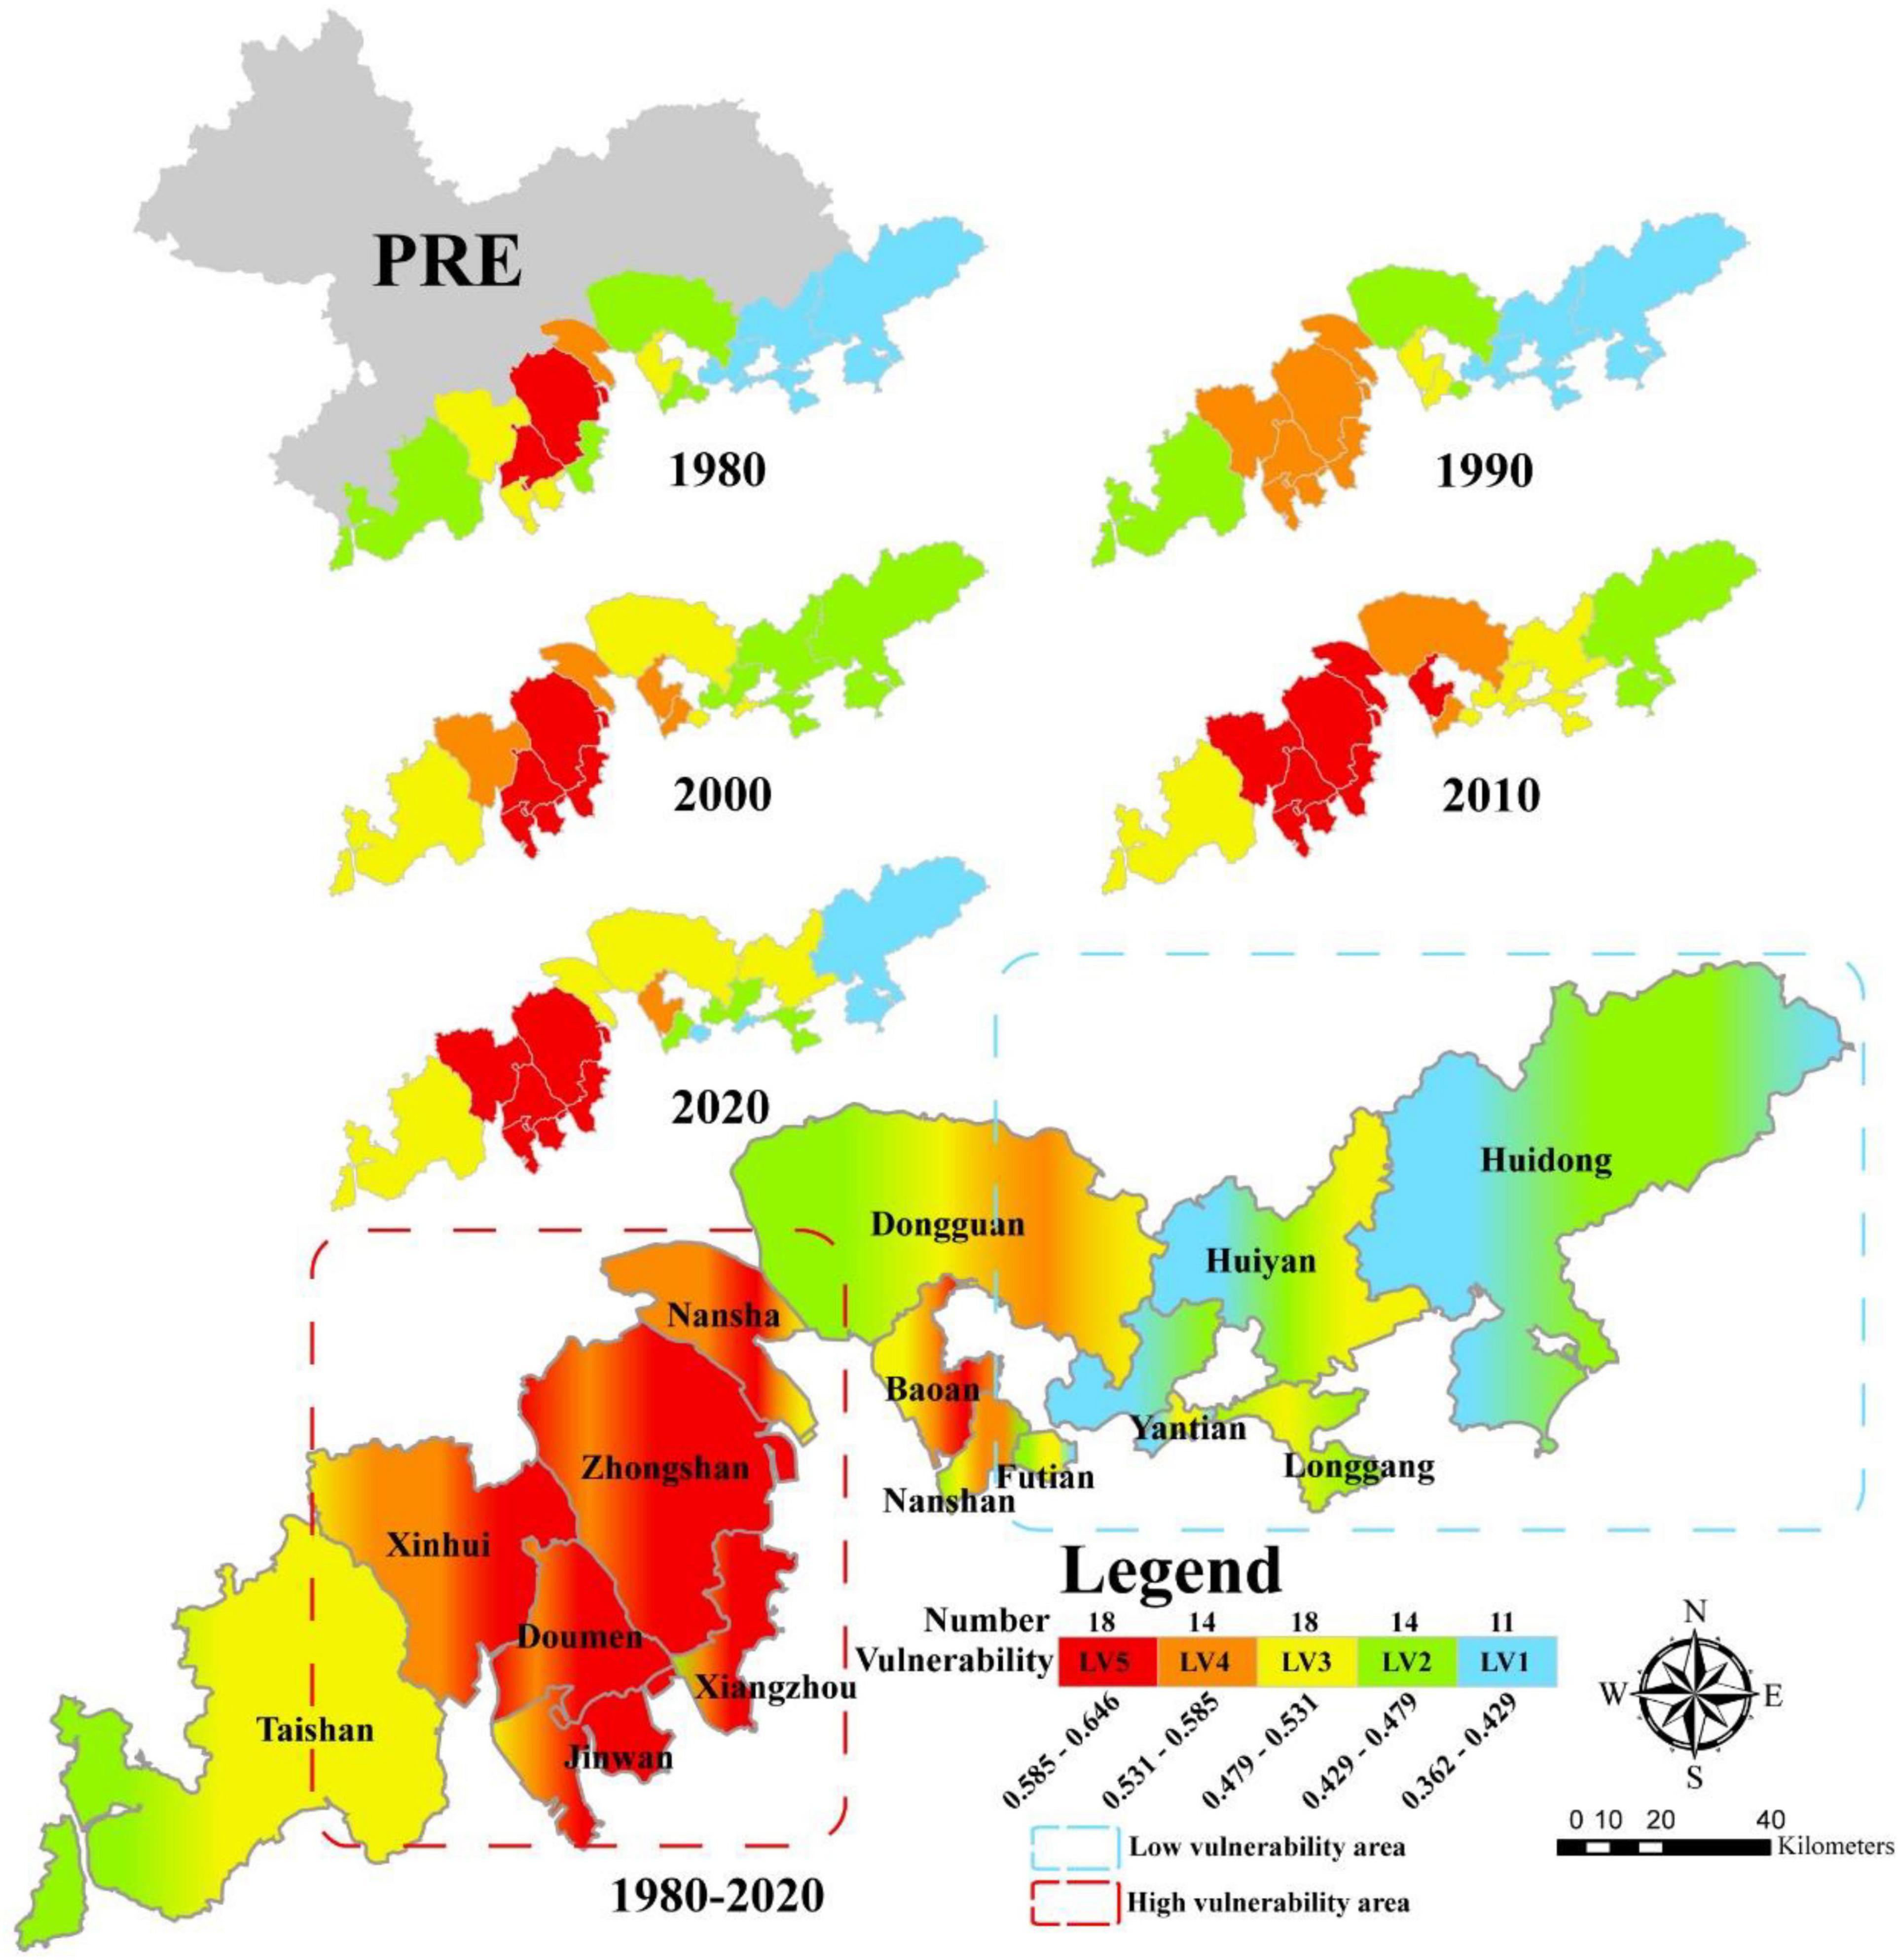
Figure 3. The classification map of coastal erosion vulnerability in each era and the distributions of low-vulnerability and high-vulnerability areas in 15 counties and regions of the study area. Different colors in the color chart represent different vulnerability levels. From left to right, the colors represent high vulnerability (a total of 18 evaluation units in this interval), moderately high vulnerability (14), medium vulnerability (18), moderately low vulnerability (14) and low vulnerability (11). Finally, the evaluation unit is filled with gradient color to reflect the change of their vulnerability level from 1980 to 2020.
The ESA evaluation results for 75 evaluation units in the study area (Supplementary Tables 8A–C) are plotted in Figures 4, 5. Since 1980 and 1990, the sensitivity and exposure of the coastal zone in the study area have increased period by period, and the adaptation level decreased from 1990 to 2010. The level of coastal erosion vulnerability has also increased period by period since 1980. From 2000 to 2020, exposure and sensitivity slowly increased, and adaptation has increased rapidly since 2000, resulting in a reduction in the rate of increase in vulnerability in the study area since 2000. Exposure also decreased in 2020, and adaptation levels significantly improved in the coastal zone, eventually resulting in a decrease in the coastal erosion vulnerability value to 0.526 at the end of 2020, which represented a return to the pre-2000 level (Table 2 and Figure 5).
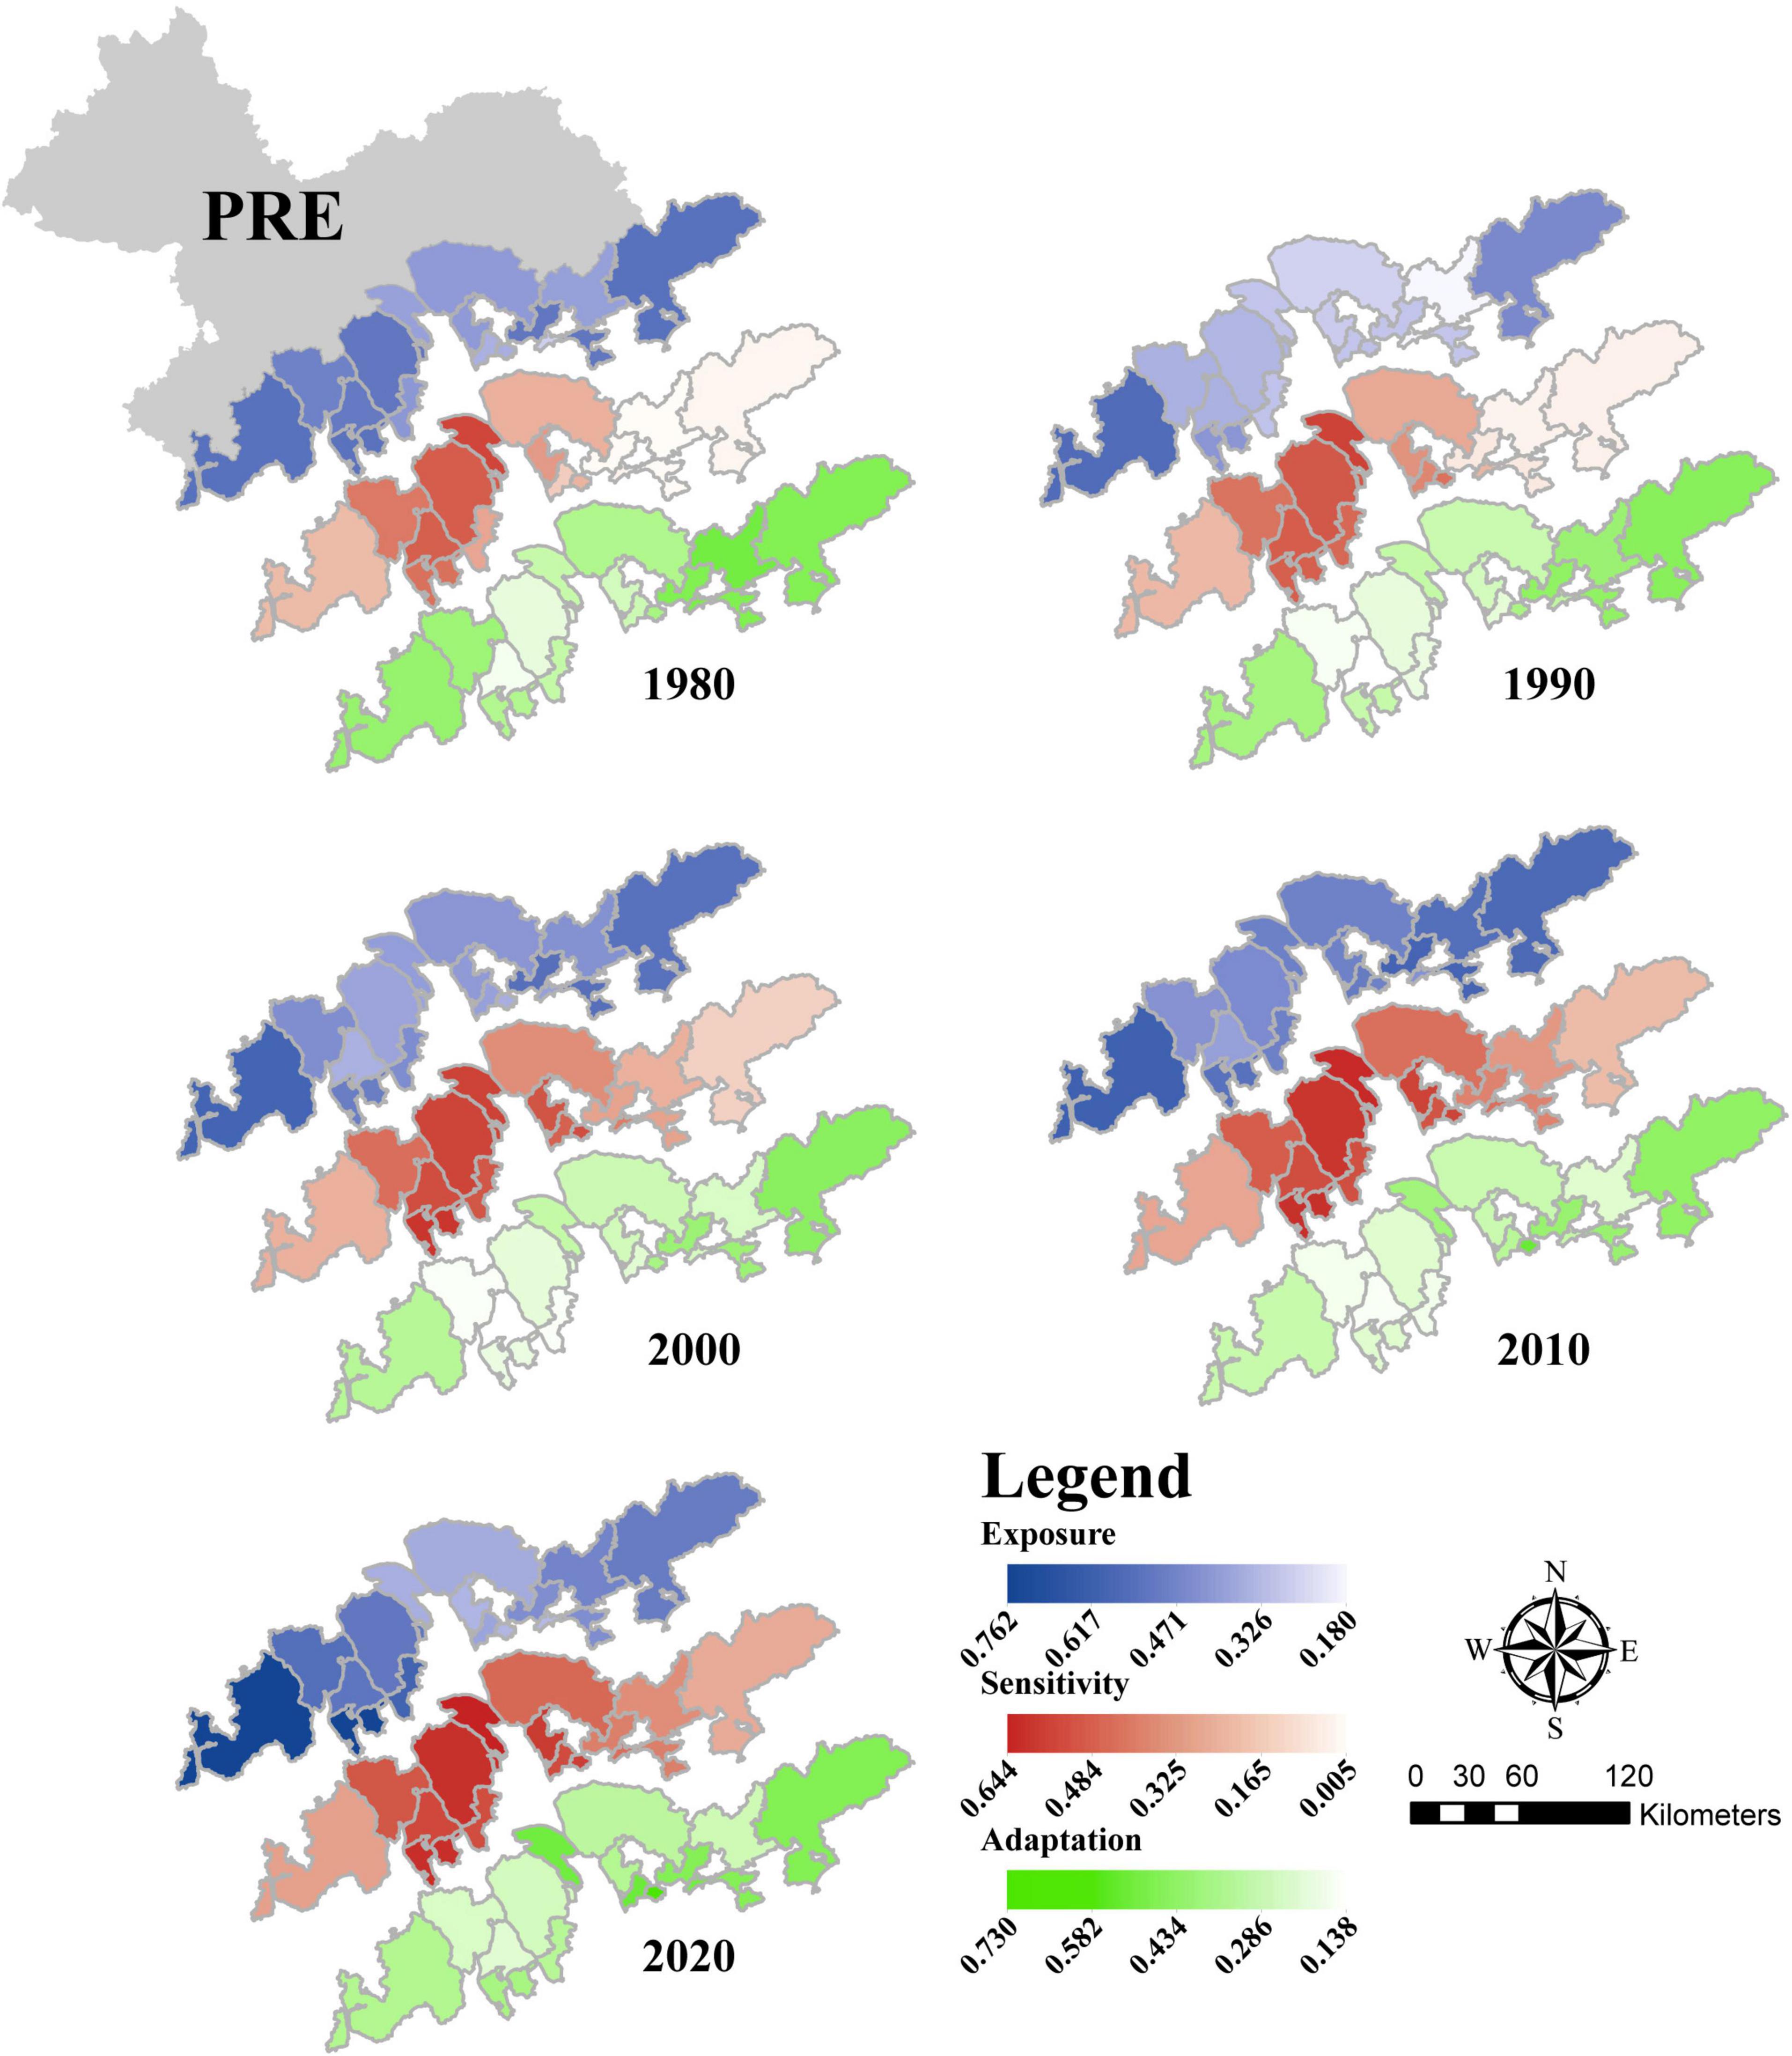
Figure 4. Differences in exposure, sensitivity and adaptation in the coastal zone systems in 15 counties and districts in the study area. The depth and gradient of the three colors in the plots show the differences in ESA values in each county and district.
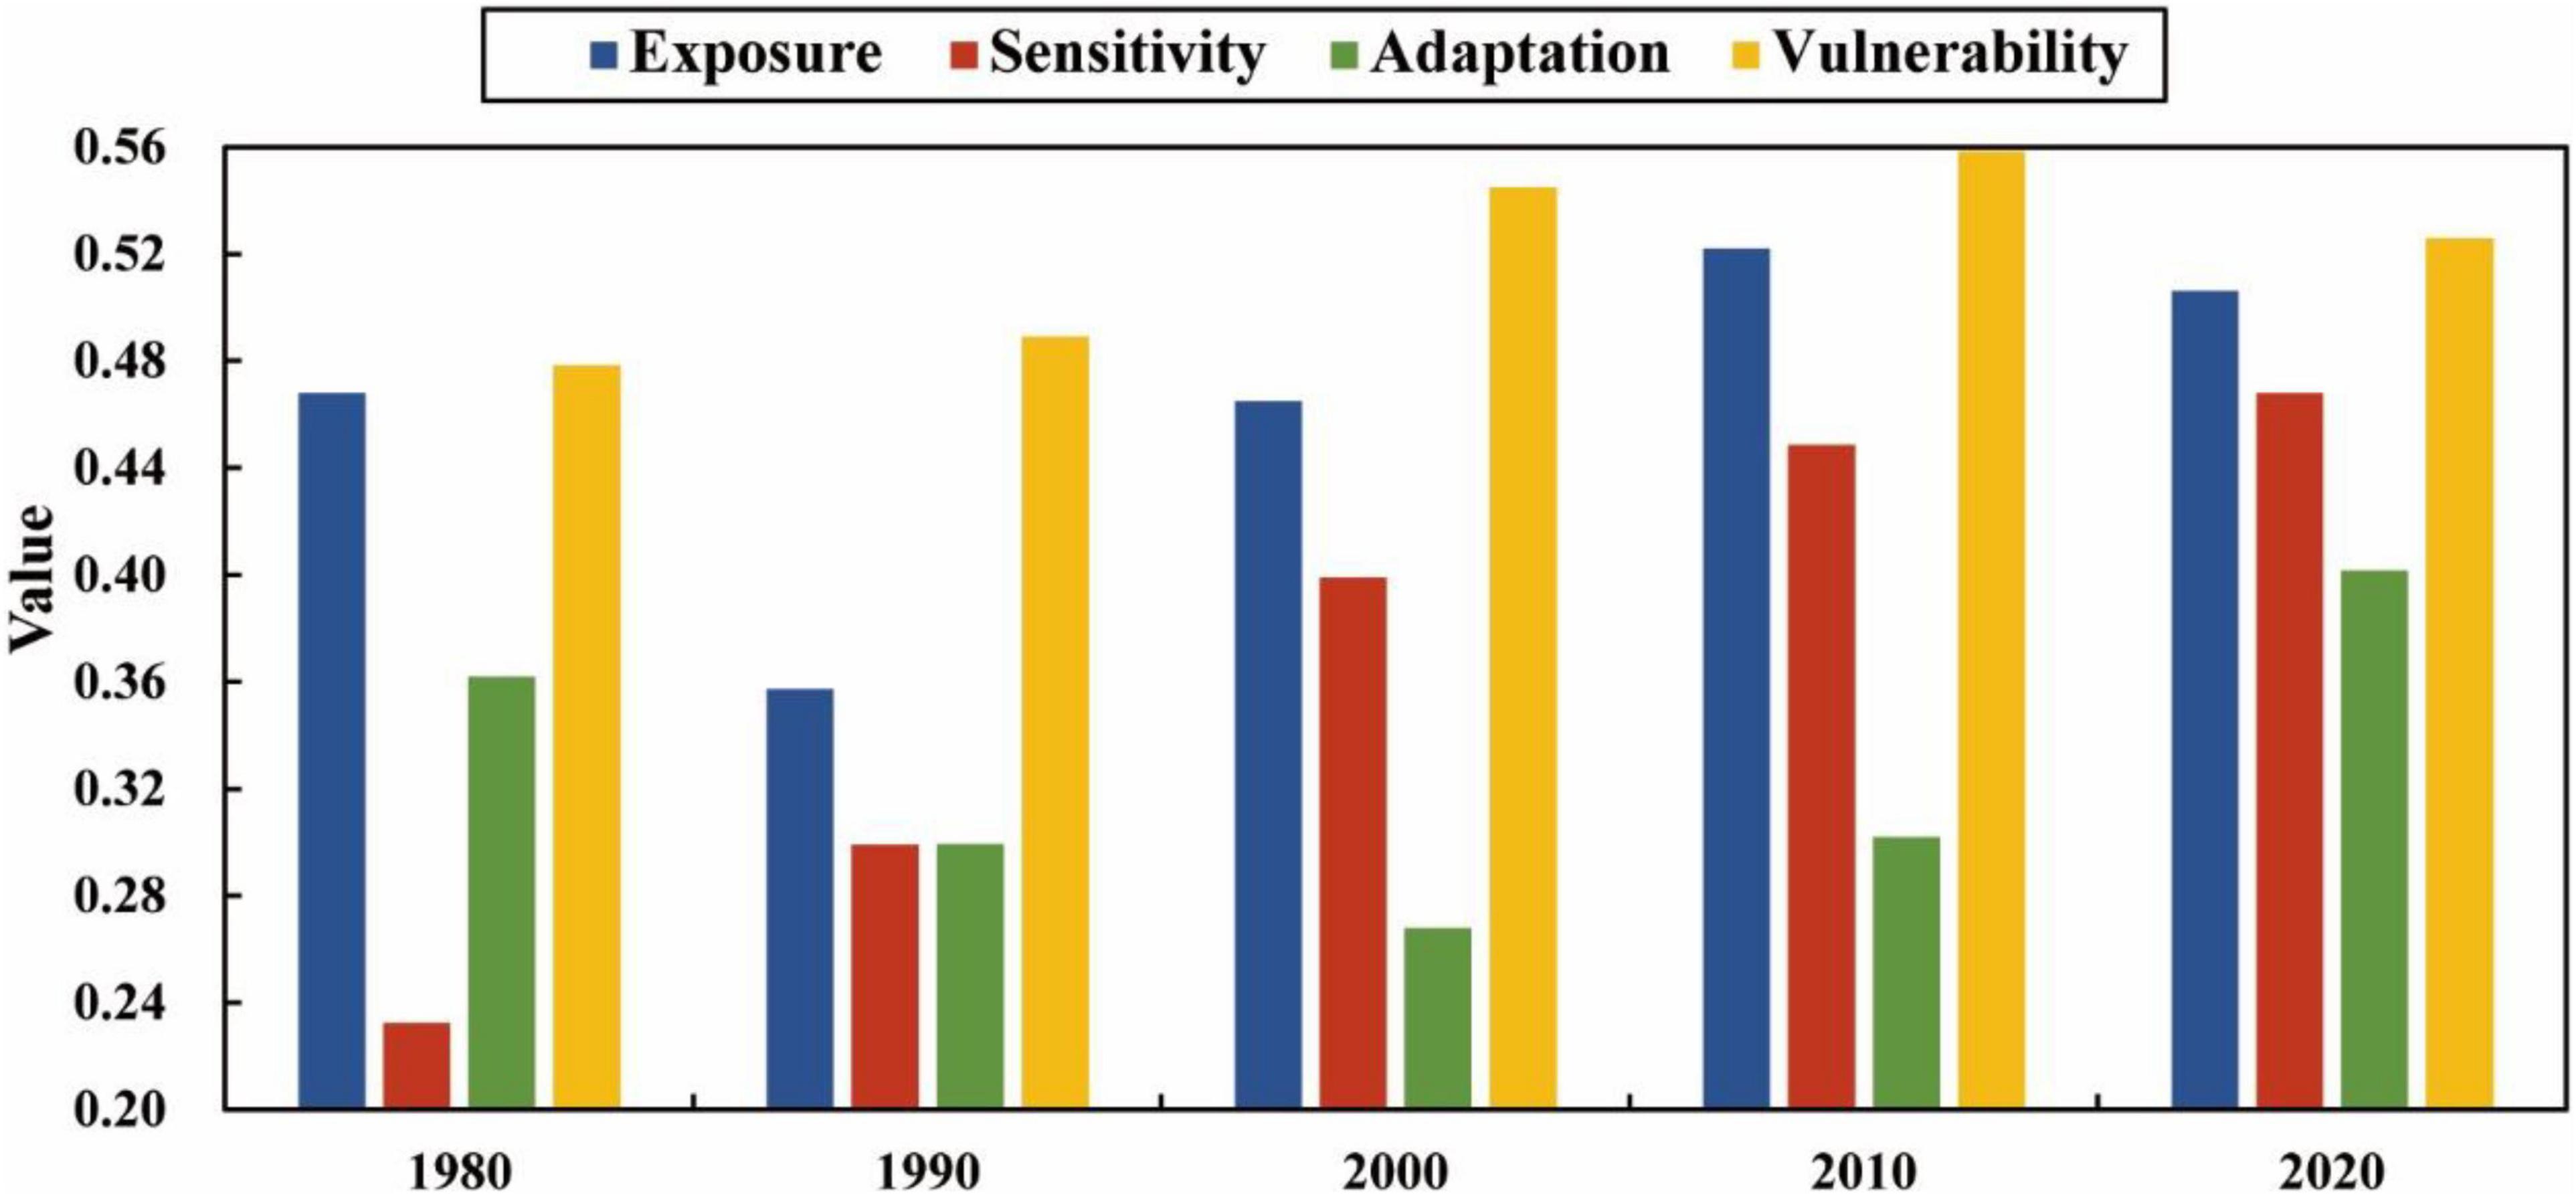
Figure 5. Bar chart showing the changes in exposure, sensitivity, adaptation and erosion vulnerability in the overall coastal zone system in the study area over time.
Coastal characteristics, coastal lowlands and protection capability are the main elements and indices influencing coastal erosion vulnerability in the study area. At the same time, the impact of these factors on the high vulnerability area is significantly higher than that on the low vulnerability area. The impact of economic coastal erosion vulnerability in Xiangzhou, Jinwan, Nanshan and other areas near the middle of the study area is lower than that in the areas to the east and west of the study area. Finally, hydrodynamic conditions have a weaker impact on vulnerability to coastal erosion in the central part of the study area than in the areas to the east and west (Figures 6A,B).
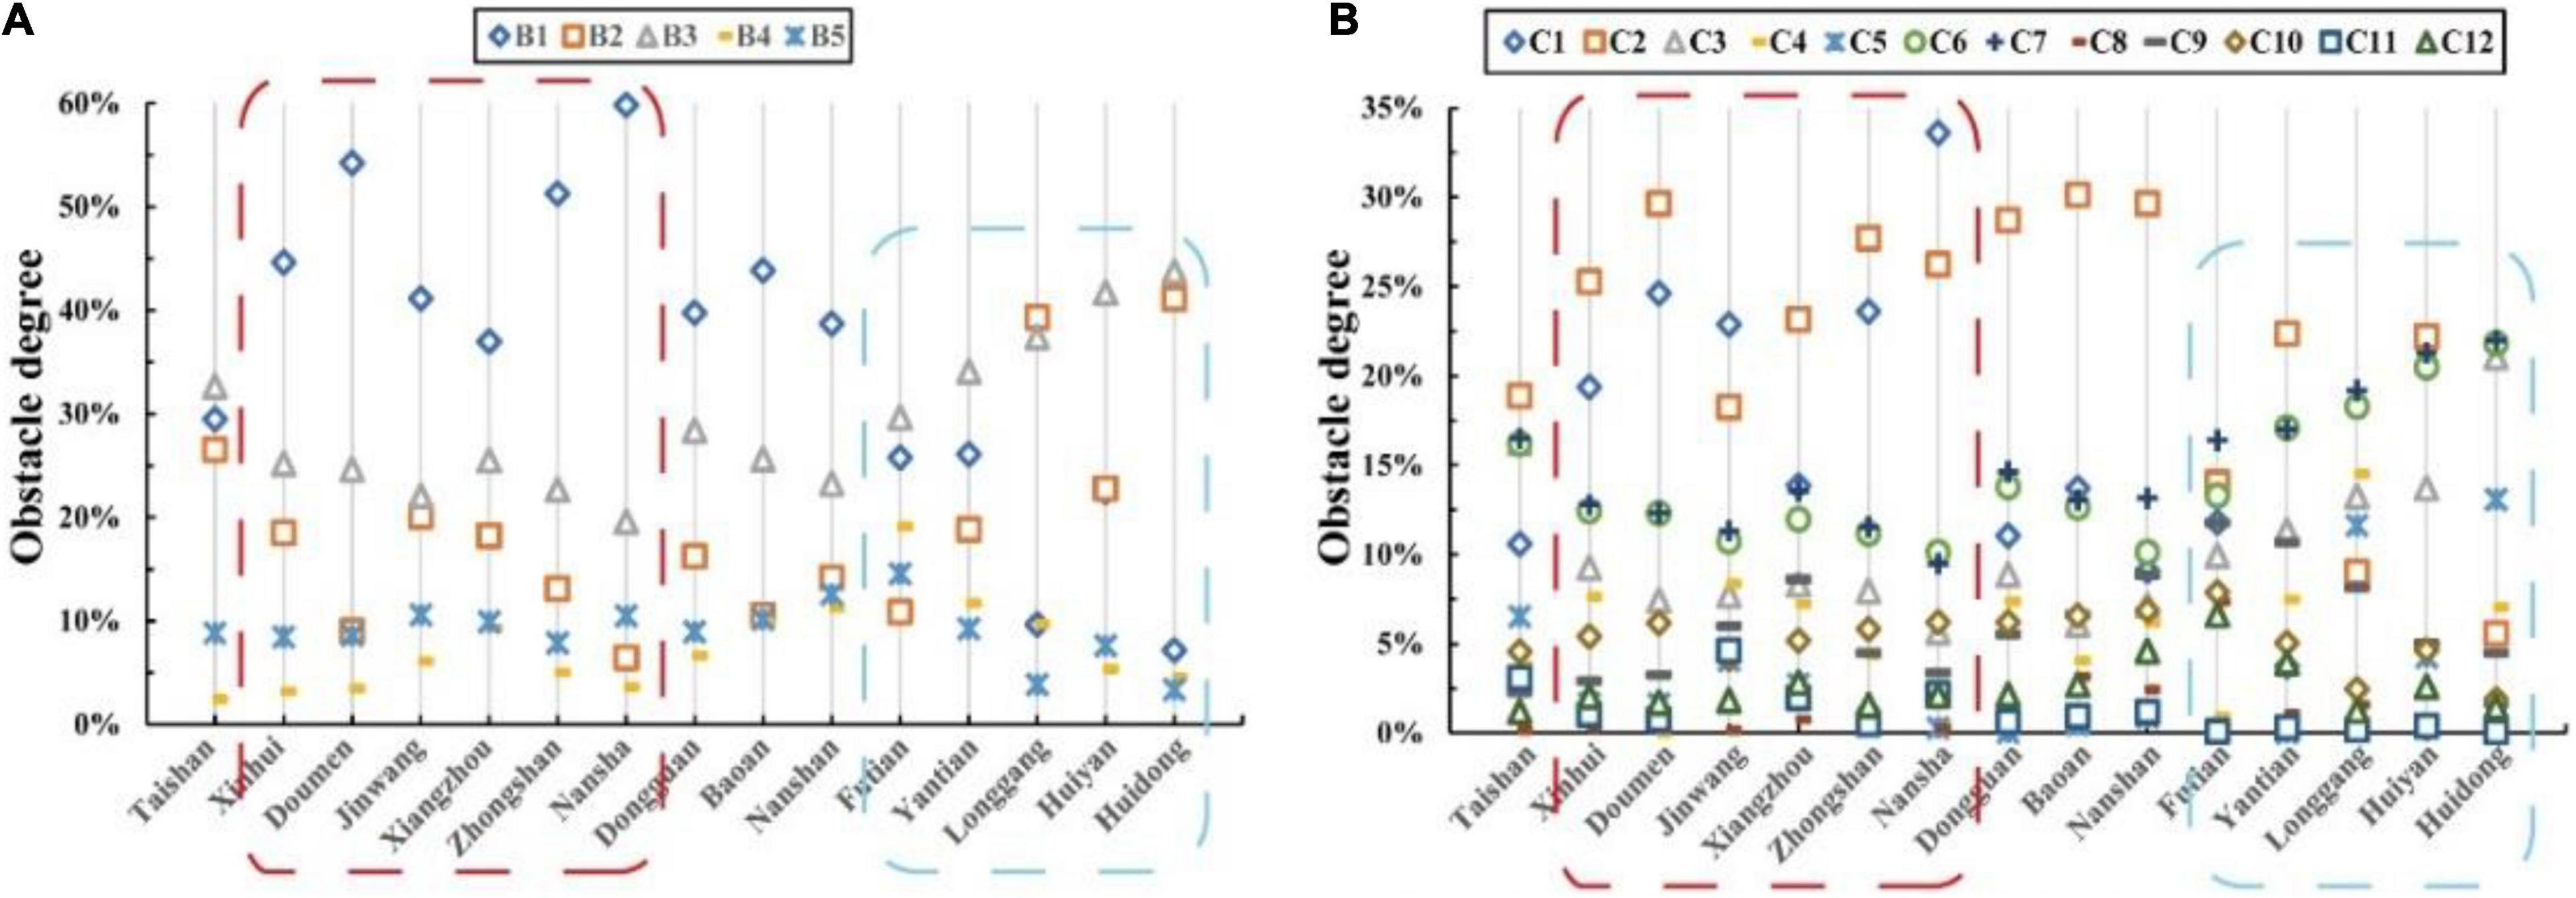
Figure 6. Obstacle degree model analysis of the main elements (A) and indices (B) that influence coastal erosion in 15 counties and districts and the distribution of coastal characteristic differences in the study area (average of 5 periods). The scope of the high vulnerability area and low vulnerability area is the same as that in Figure 3. The specific meaning of the characters in the figure and the corresponding relationship between factors are shown in phase 1 of Figure 2.
In 1980, the main factor that increased vulnerability in the study area was the weak economic conditions in China, followed by coastal characteristics and hydrodynamic conditions. From 1980 to 2010, economic conditions contributed increasingly less to the vulnerability of the study area; in contrast, the effects of population conditions and shoreline reconstruction increased. Therefore, the overall vulnerability of the PRE increased, and a 30-year erosion stage began (Figure 7A). The Futian District shows a different development process from the entire study area. Since 1980, the impact of element coastal characteristics in Futian on coastal erosion vulnerability has evidently decreased, while the population conditions are the opposite (Figure 7B).
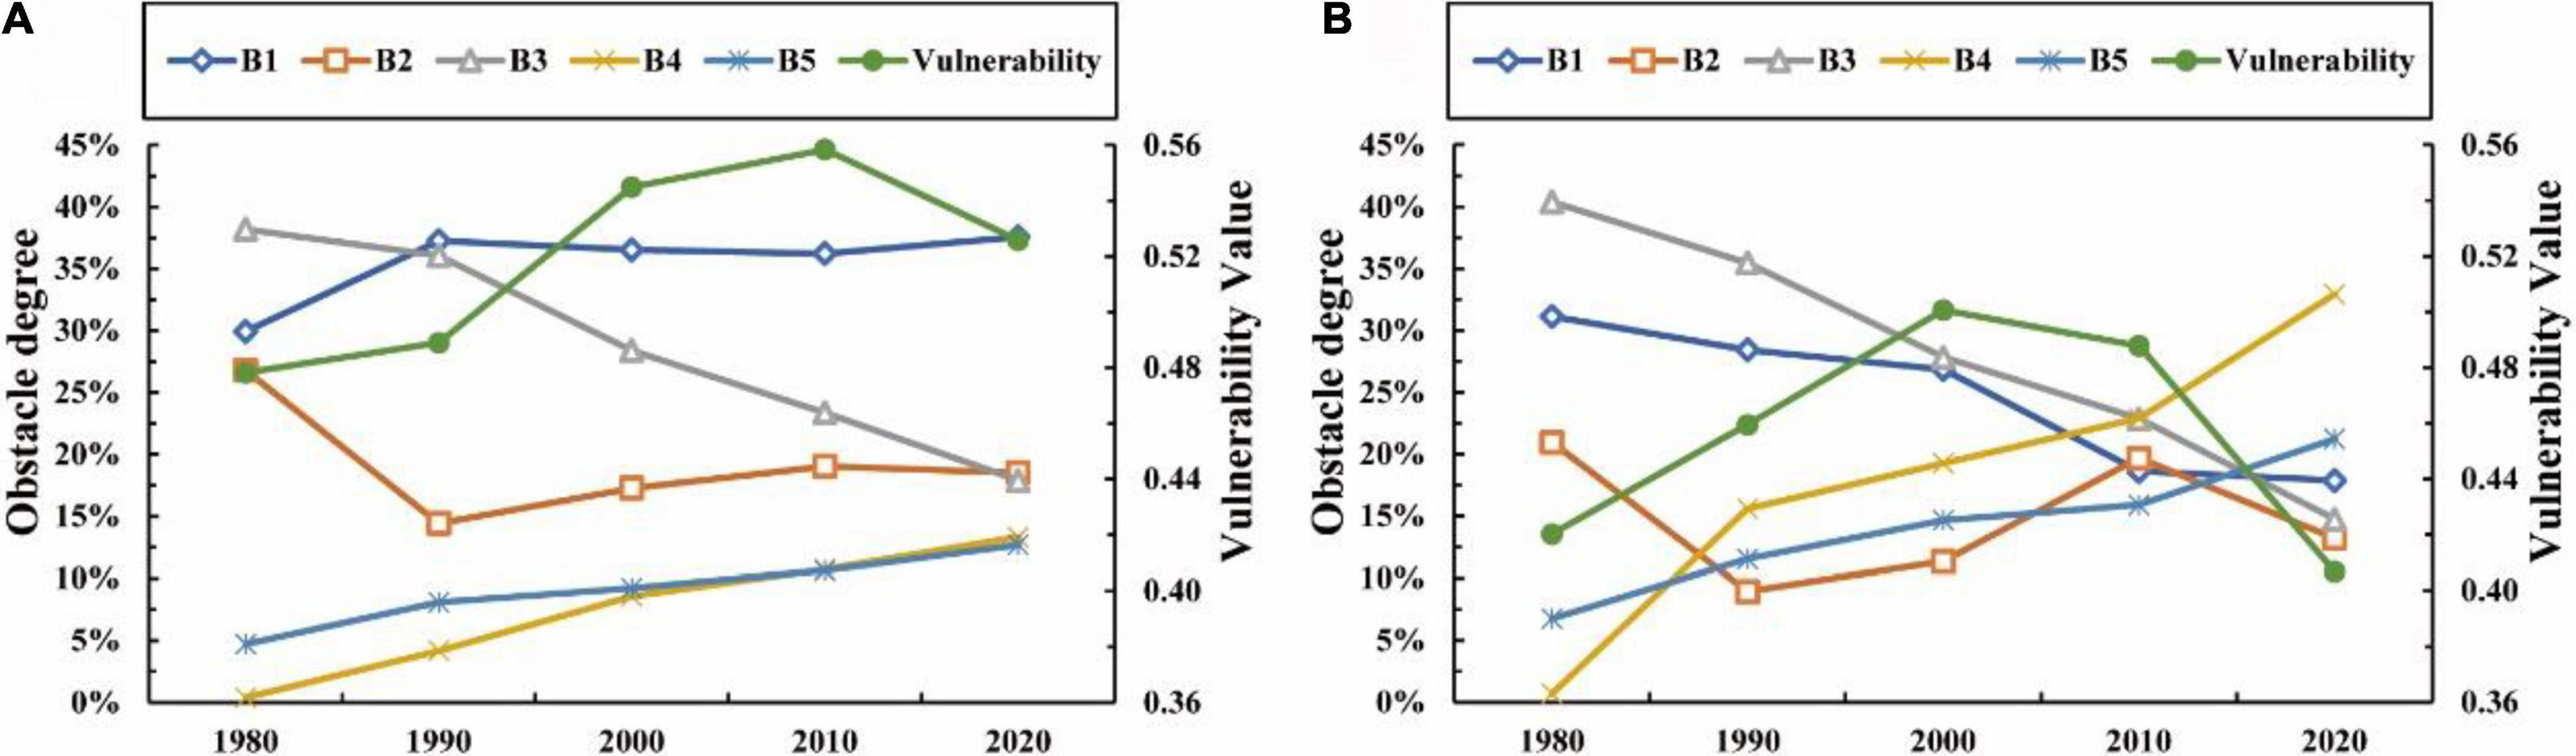
Figure 7. Temporal variations in the main influential elements and vulnerability to coastal erosion in the entire study area (A) and Futian District (B). The specific meaning of the characters in the figure and the corresponding relationship between factors are shown in phase 1 of Figure 2.
Coastal zone related vulnerability is affected by both natural and economic conditions, in which natural conditions affect the spatial differences in vulnerability, while social conditions affect the temporal changes in vulnerability (Boruff et al., 2005; Mani Murali et al., 2013; Bukvic et al., 2020; Wu and Hu, 2020; Yang et al., 2020; Feng et al., 2021). Under natural conditions, slope, regional altitude and shoreline geomorphic type are the main influencing factors. Economic development, urbanization, population growth and policy implementation are the main driving factors affecting vulnerability in social conditions. This finding is consistent with the obstacle analysis results of this study.
The high vulnerability and low vulnerability areas exhibit obvious spatial differences (Figure 8). The elevation in the eastern region is generally higher than 10 m, and this region has a large proportion of highly protected coastal sections. Conversely, the central and western regions include more low-elevation and non-protected sections. Since the incoming sand from the Pearl River Basin accumulates in the estuary and bays, leading to the development of complex deltas, the high-vulnerability areas are located within the low-elevation estuarine deltas, which are most affected by sea level rise and storm surges. Most of the coastline has changed from natural shoreline areas with high protective capacities to artificial shorelines dominated by farming (Zhou et al., 2019), with frequent reclamation activities and high-economic-value coastal buildings. As a result, this area is characterized by high exposure, high sensitivity and poor adaptability, and the vulnerability to regional coastal erosion is relatively high (Figure 5). However, the main low-vulnerability area is located in a hilly region with high elevations, a predominantly bedrock and sandy shoreline and few artificial revetments. Additionally, the population density in high-elevation areas is low, with sufficient resilience to the threats of climate change and sea level rise. Therefore, the coastal zone system in this region exhibits distinct spatial characteristics in terms of ESA and low vulnerability to coastal erosion.
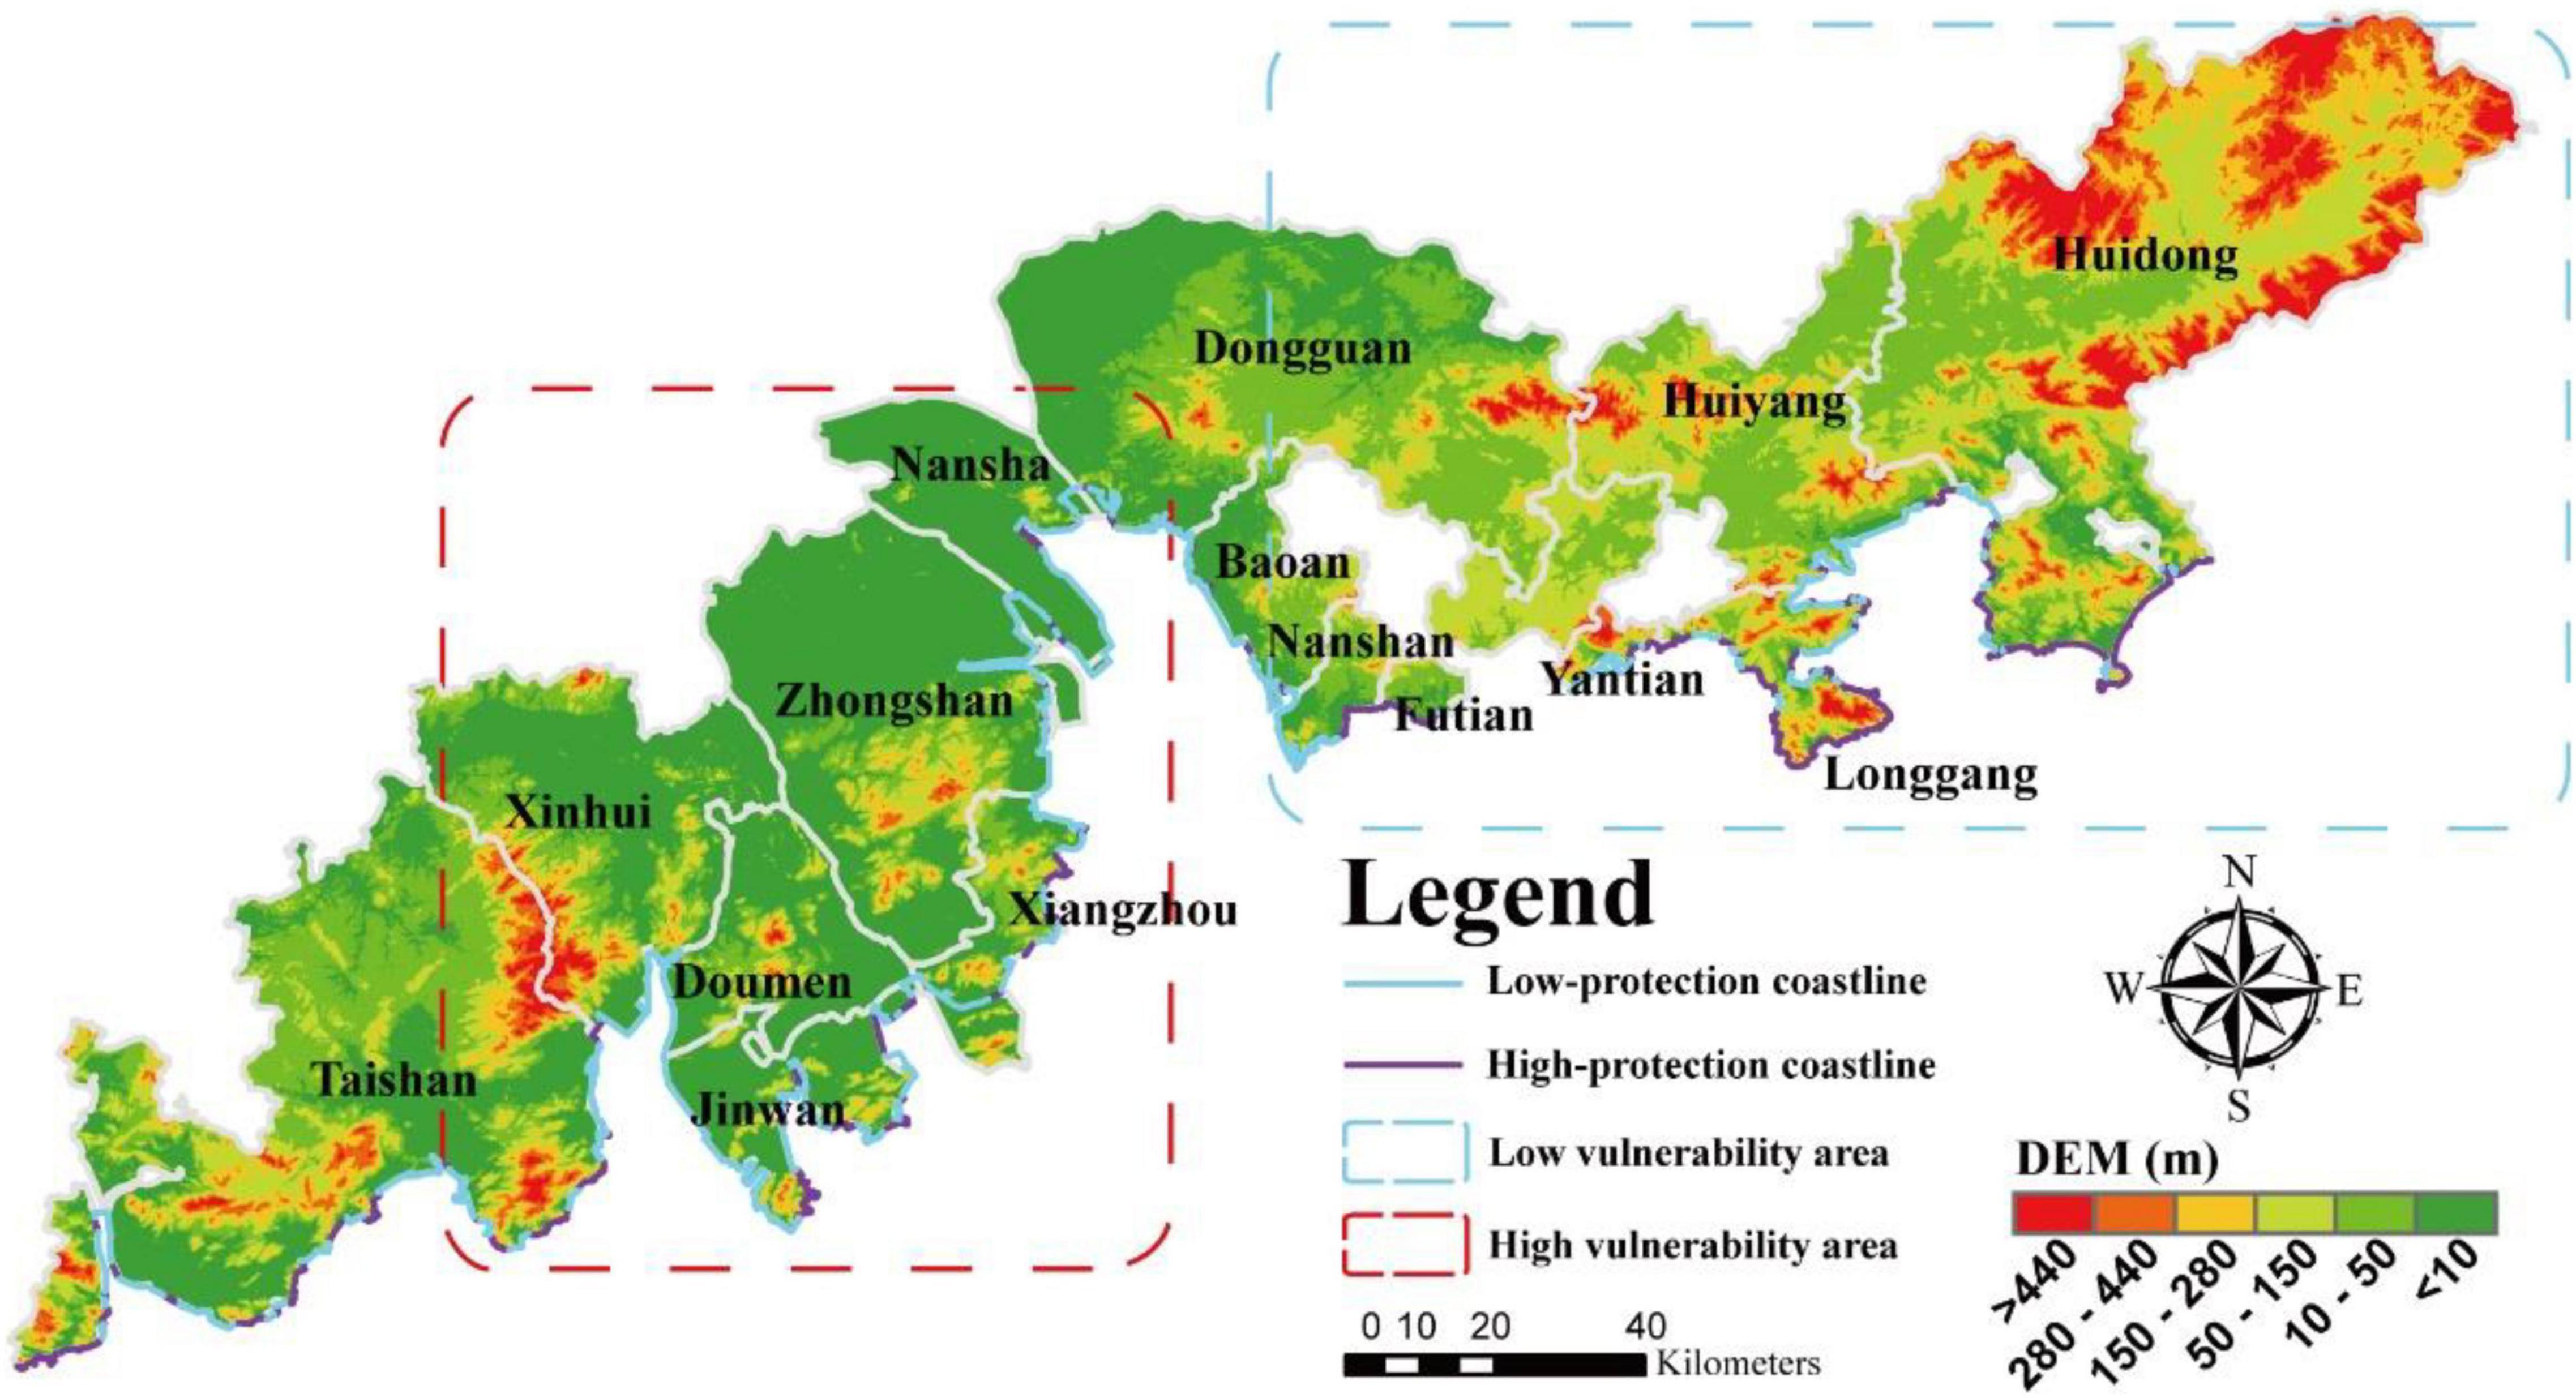
Figure 8. Distribution map of coastal characteristics differences in the study area. Coastal characteristics include coastal lowlands and protection capability, which are reflected in DEM and protection coastline in the figure.
The cities of Shenzhen and Zhuhai in the central part of the study area play key roles in the Chinese economic system and areas where foreign capital and management strategies have been introduced. Thanks to the favorable policies of reform and expansion and geographical location advantages, Shenzhen and Zhuhai, which are adjacent to Hong Kong and Macau, have healthy industrial structures and rapidly benefit from economic growth. Compared with the economic conditions in the counties on the east and west sides of the study area, the sufficient per capita GDP and public budget expenditures in the central area aid in resisting coastal erosion and restoring the ecological functions of the coastal zone.
The study area is located on the southern coast of China and is frequently affected by tropical cyclones in the Northwest Pacific, which have a long duration and strong impact on the coastal zone. The frequency and intensity of typhoons that make landfall in the PRE area in the central part of the PRE are less than those that make landfall on the east and west sides of this area (Ye et al., 2020); additionally, the wave intensity in the central region is also lower than that in the areas to the east and west regions, which are more open to the sea, and the tidal range in the central area is greater than that in the east and west (Xiao, 2003; Ma, 2005). Therefore, the downstream area of the PRE in the central part of the PRE is less disturbed by both external storm surges and waves, and with a larger tidal range, the adaptability to resist storm surges is strong; consequently, this area is more resilient to storm surges and less vulnerable to hydrodynamic influences on coastal erosion than are other areas.
The variation process of coastal erosion vulnerability in the PRE is divided into three stages. Before 1980, the first stage was a period of low coastal erosion vulnerability; then, the second stage was a period of increased vulnerability from 1980 to 2010. The third stage, starting in 2010, was a period of declining vulnerability and restoration of coastal ecosystems (Figure 9).
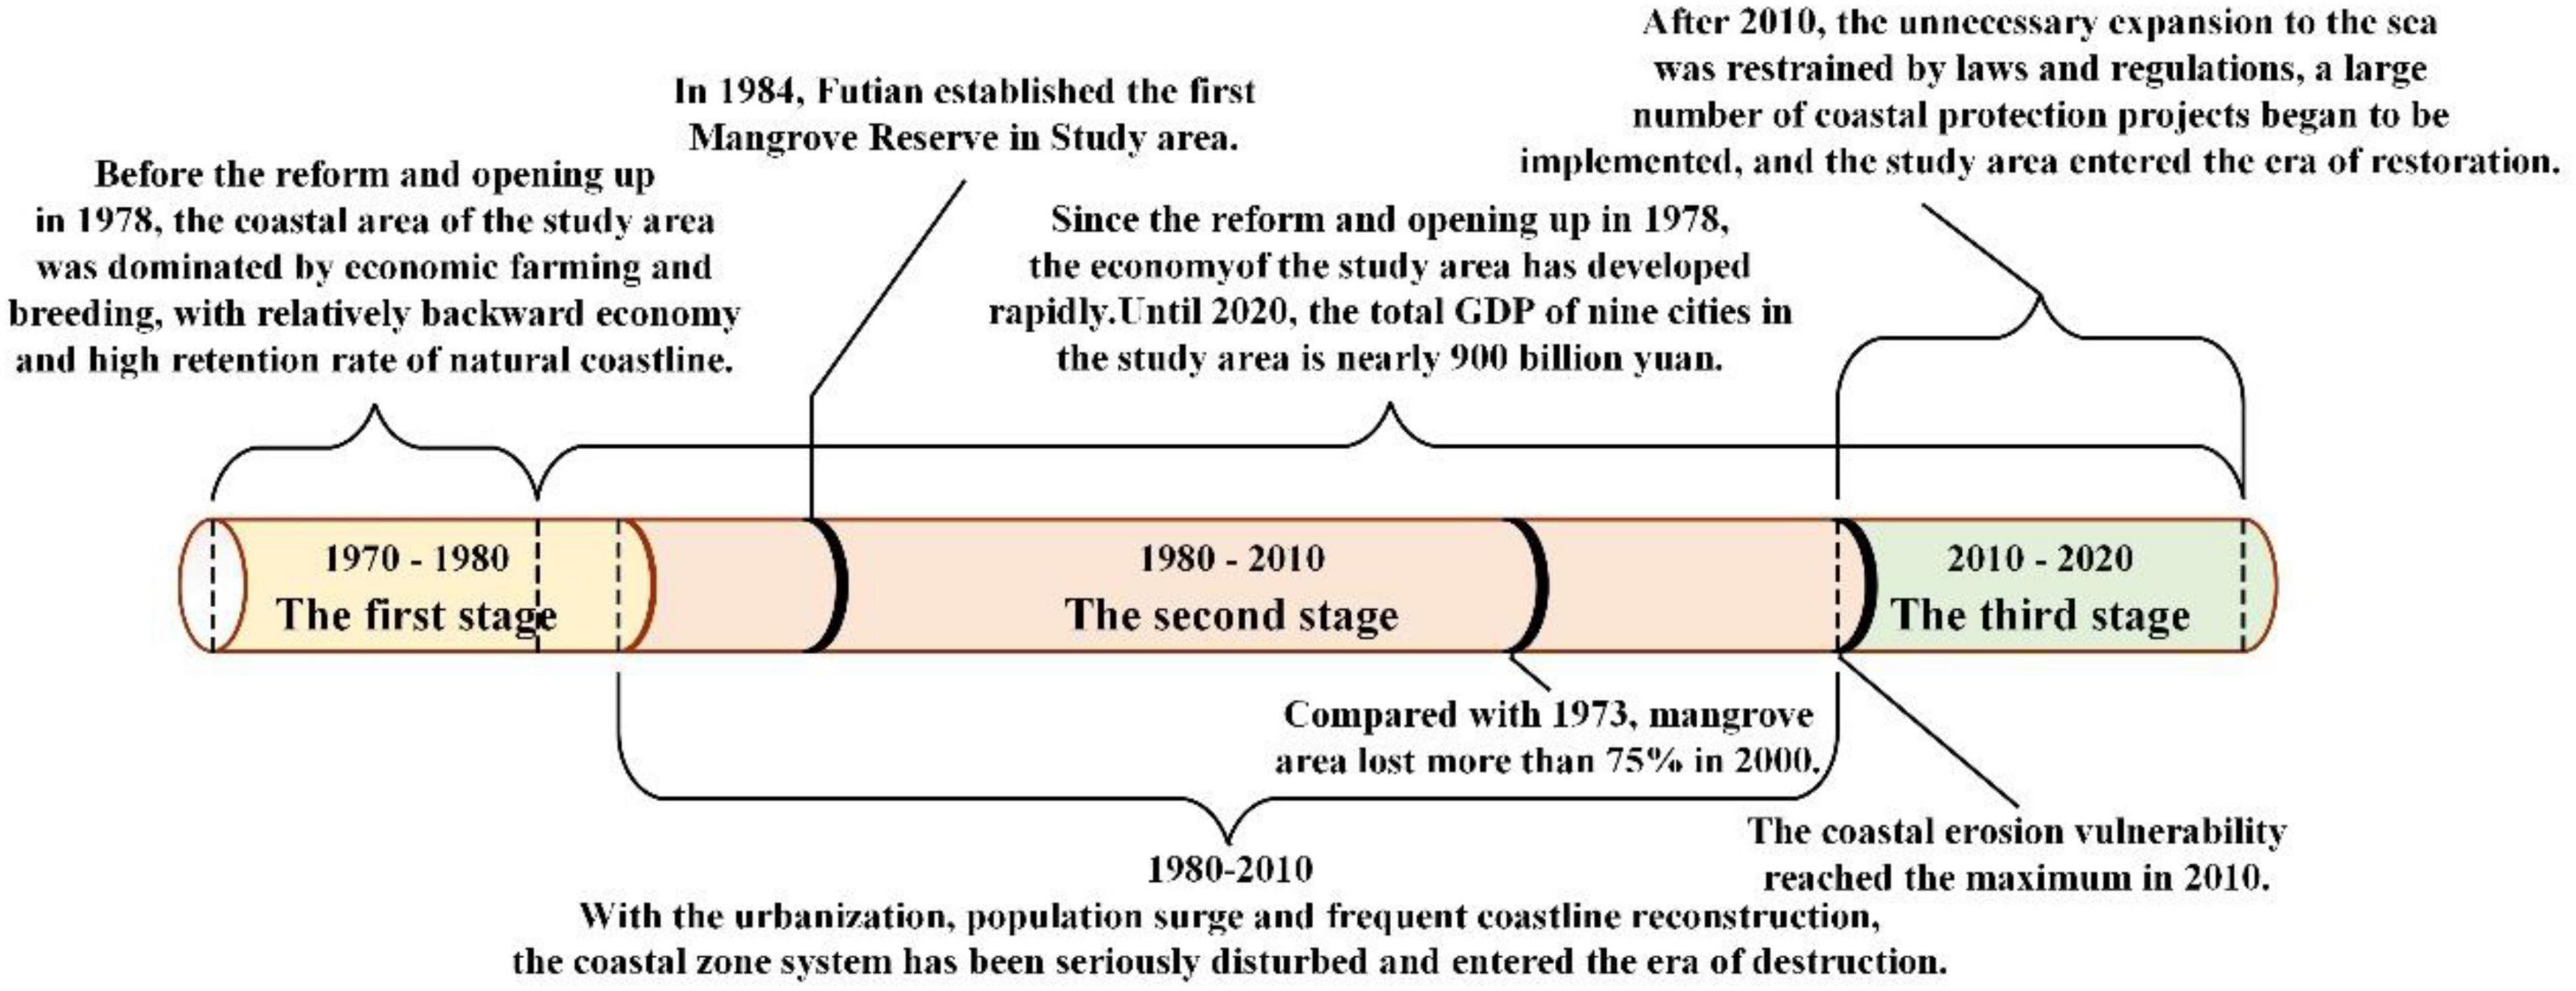
Figure 9. Timeline showing the development process in the study area, which can be divided into three stages. The first stage is the low coastal erosion vulnerability period from 1970 to 1980, the second stage is the period of coastal system damage with vulnerability growth from 1980 to 2010, and the third stage is the period of coastal ecological system recovery with vulnerability decline from 2010 to 2020.
Before the reform and expansion in 1978, the coastline of the study area was mainly used for farming and aquaculture and was relatively underdeveloped compared with coastlines in other regions around the world (Yang et al., 2021). From 1970 to 1980, many typhoons affected the PRE, and the coastal system was greatly disturbed by hydrodynamic variations. At this time, the retention rate of natural shorelines was high due to the absence of large-scale reclamation activities, and the population and urbanization indices were relatively low; thus, the inherent vulnerability of the coastal zone in the PRE was low.
Since 1978, the economy of the study area has rapidly developed, and the total GDP in the nine cities in the PRE is currently approaching ¥ 9 trillion, accounting for approximately 8.8% of China’s total GDP in 2020. The adaptability of the coastal system in the PRE has greatly improved, and the impact of economic conditions on erosion vulnerability has begun to decline. With the expansion of urbanization and reclamation (from 1990 to 2000, the land reclamation area in the PRE reached approximately 233 km2), the increased population and the increased artificial coastline length in the PRE, infrastructure components, such as airports and docks, have been constructed in traditional farming and breeding areas. Moreover, the value of coastal buildings has increased; therefore, population and coastline reconstruction have increasingly contributed to coastal vulnerability (Zhao et al., 2018; Yang et al., 2020; Guo et al., 2021). The impact of coastal hydrodynamic conditions has increased due to the increasing intensity of typhoons, although the frequency of storm events has generally decreased since 1980 (Ye et al., 2020). The overlapping effects of human activities and environmental conditions have led to a gradual increase in the exposure and sensitivity of coastal systems (Figure 4). From 1973 to 2000, the mangrove area in the PRE decreased by more than 75% (Jia et al., 2018), and the resilience of the coastal system significantly decreased (Figure 4). With rapid economic development, problems such as decreasing species diversity in coastal systems, increasing coastal erosion, population growth, the disappearance of sea areas and natural coastlines, and declines in coastal protection capabilities have become increasingly serious. Consequently (Wang et al., 2007; Li and Damen, 2010), the vulnerability of coastal erosion continues to increase in the PRE.
Mangrove nature reserves have been established in the Futian District, Dapeng Bay, and Qi’ao Island in Zhuhai since 1984 (Peng et al., 2016). Previous policies established the foundation for large-scale restoration in the PRE, although most measures were implemented after 2010. From 2000 to 2015, 34% of mangrove forests were gradually restored (Jia et al., 2018), and ecological restoration initially achieved positive results. After 2010, local governments realized the risks of massive coastline development and utilization to coastal erosion and successively established restrictive plans such as the “General Plan for the Comprehensive Coastal Protection and Utilization of Guangdong Province,” which imposed restrictions on the unnecessary utilization of sea areas and promoted beach restoration and wetland protection activities.
From 2010 to 2018, nearly 70 coastline renovation and restoration projects were established, and investments totaling more than 3 billion yuan occurred. These projects involved wetland ecological restoration, beach erosion protection, sand replenishment, and coral and mangrove restoration. Several major coastal restoration projects have occurred in the PRE, such as the Xianglu Bay Beach Restoration Project in Xiangzhou District, Nansha Shenzhen Bay Mangrove Park and Futian District Mangrove Ecological Park (Zhang et al., 2021).
The gulf area is an important base for marine economic activities and tourism. The urbanization and economic development processes in gulf areas can be divided into three periods: Slow economic development, rapid urban economic development, coastal system conflict resolution, policy intervention, and coastal recovery. Other large bay areas worldwide have experienced similar evolutionary processes.
Although these areas have experienced rapid urban and economic development, losses of natural wetlands have occurred, and vulnerability to coastal erosion has increased: more than 90% of the local wetlands have been lost in the approximately 120 years of development in the San Francisco Bay (McPhearson et al., 2013); in approximately 150 years, more than 90% of the natural Bank of Tokyo Bay has been lost, the sea area has been reduced and the shoal has been lost (Furukawa, 2013); finally, over the 160 years of development, 85% of tidal wetlands and 90% of freshwater wetlands in the New York Bay area have been destroyed (McPhearson et al., 2013).
To restore valuable natural resources and slow the irreversible consequences of excessive coastal zone development, local governments have formulated policies to effectively restrain the further deterioration of the coastal ecosystem. Coupled with effective ecological restoration measures, the harmonious coupling of natural processes and anthropogenic activities could once again occur. Over a 25 years period since 1972, 10 major wetland restoration projects have been implemented and achieved varied results (Williams and Faber, 2001). The “Tokyo Bay Restoration Plan” launched in 2003 has achieved good results (Furukawa and Okada, 2006); After 1974, the abuse and occupation of wetland resources in New York have been fundamentally curbed (Weinberg, 2010).
As a young bay area, the PRE has recently promoted wetland protection and coastal restoration concepts. Due to the high efficiency of policy implementation, the time for the PRE to develop its economy at the expense of the environment is greatly shortened. The PRE entered a period of ecological restoration faster than other bay areas.
According to the analytical results, this paper proposes some suggestions to provide information for management decision-making.
First, exposure of the coastal zone system should be reduced, its adaptability should be improved, and the implementation of policies related to coastal zone protection, restoration and reclamation should continue to be promoted. As mentioned above, the study area is located in an economically developed littoral area. The urbanization process and population density are expected to continually increase in the foreseeable future, and the increase in the sensitivity of the coastal system will be irreversible for a long period in the future. The impact of coastal policies on vulnerability has been most obvious in the Futian District (Figure 7B). After establishment of the reserve in 1984, the proportion of high-protection coastlines in the Futian District increased, and the impact of coastal characteristics on vulnerability gradually decreased; consequently, the Futian District was the first region to enter the ecological restoration period in the study area, and the advanced coastal zone protection concept achieved good results. The implementation of relevant policies and restoration projects (construction of wetland parks and beach restoration projects) has gradually naturalized the coastline and transformed artificial revetments into near-natural shores, thus avoiding direct damage to the coastal zone caused by human activities but also improving the anti-disturbance and protection capabilities of the coastal ecosystem, reducing the exposure of the coastal system and enhancing adaptability. Relevant policies and restoration projects have prevented further deterioration of coastal vulnerability in the PRE, and this stage represents the beginning of the ecological restoration period in the PRE.
The increased coastal erosion vulnerability caused by natural conditions is difficult for us to control; thus, we need to formulate disaster prevention and mitigation measures to deal with extreme weather and sea-level rise. According to the IPCC report, due to global warming, sea level will continue to rise, and the frequency and intensity of extreme weather will intensify, which will seriously threaten low-lying islands and coastal areas, increasing the threat of coastal erosion due to deterioration of the natural environment over a long time (Han et al., 2010). The study area is a low-lying delta area. Storm surge disasters are very serious. The combination of strong typhoons and spring tides causes a surge in tide level, accompanied by the overflow of sea water caused by strong winds, large waves and rainstorms, which destroys dikes and seriously aggravates the vulnerability of coastal erosion in the PRE Bay area. At the same time, the poor development of the coastline over a long-term period has led to the loss of the coastline’s ability to resist natural disasters, which urgently needs to be addressed.
The PRE is characterized by low coastal erosion vulnerability in the eastern hilly area and high vulnerability in the central and western deltas. Coastal characteristics, coastal lowlands and protection capability are the main elements and indices related to erosion vulnerability.
The development process of the PRE can be divided into three stages. Before 1980, economic development was slow, and vulnerability to coastal erosion was low. From 1980 to 2010, with the rapid development of the regional economy, the intensity of coastal zone development and coastline utilization increased; consequently, coastal erosion vulnerability increased. With the establishment of ecological restoration policies after 2010, the development and utilization processes in the coastal zone gradually shifted toward ecological repair and restoration, and the vulnerability to coastal erosion gradually decreased. Economic development and GDP inputs are important controlling factors related to coastal erosion vulnerability in each period.
Many bay areas worldwide have experienced rapid economic development at the expense of the ecological environment. With simultaneous development of the economy and utilization of natural resources, restoration to near-natural conditions has been needed in many bay areas; this case was also true in the PRE area. Due to the effectiveness of China’s economic policies, although the economy in the study area is still rapidly developing, the local environment is rapidly recovering. The ecological restoration methods used to achieve close-to-natural conditions are effective, and ecological repair and restoration measures have been successful. These cases provide scientific experience for the synergistic development of the economy and the environment in other regions of China.
The PRE is densely populated, and the sensitivity of the coastal zone system will be irreversible for a long time in the future. Therefore, managers should consider how to reduce the coastal erosion vulnerability in the study area from the aspects of exposure and adaptability of coastal zone systems to provide a scientific basis and decision-making for coastal zone protection. At the same time, due to the increased vulnerability of coastal erosion caused by natural conditions, it is difficult for us to control. It is necessary to formulate disaster prevention and mitigation measures to deal with extreme weather and sea-level rise to contribute to the sustainable development of coastal systems.
The datasets presented in this study can be found in online repositories. The names of the repository/repositories and accession number(s) can be found in the article/Supplementary Material.
CC and KZ designed the study, wrote the main manuscript, and prepared all figures. FC and HQ contributed to the improvement of the manuscript. JL, SZ, and GLe contributed to the investigate. KZ, ZM, GLi, and YS contributed to the figure and software. All authors reviewed the manuscript.
This research was funded by the National Natural Science Foundation of China (Grant Nos. 42076058, 41930538, and 42076211), the Scientific Research Foundation of Third Institute of Oceanography, MNR (Grant No. 2019006), the Special Funds for Scientific Research on Marine Public Causes (Grant Nos. 201505012, 201405037, and 200905008), and Comprehensive survey and evaluation of China’s offshore Marine resources (Grant No. 908-02-03-04).
The authors declare that the research was conducted in the absence of any commercial or financial relationships that could be construed as a potential conflict of interest.
All claims expressed in this article are solely those of the authors and do not necessarily represent those of their affiliated organizations, or those of the publisher, the editors and the reviewers. Any product that may be evaluated in this article, or claim that may be made by its manufacturer, is not guaranteed or endorsed by the publisher.
We would like to express their sincere thanks to Xiangjin Pan, Xiaojing Zhu and Yazhuang Zhao who have offered support.
The Supplementary Material for this article can be found online at: https://www.frontiersin.org/articles/10.3389/fmars.2022.847655/full#supplementary-material
Ahmed, N., Howlader, N., Hoque, M. A. A., and Pradhan, B. (2021). Coastal erosion vulnerability assessment along the eastern coast of Bangladesh using geospatial techniques. Ocean Coast. Manag. 199:105408. doi: 10.1016/j.ocecoaman.2020.105408
Armenio, E., Mossa, M., and Petrillo, A. F. (2021). Coastal vulnerability analysis to support strategies for tackling COVID-19 infection. Ocean Coast. Manag. 211:105731. doi: 10.1016/j.ocecoaman.2021.105731
Boruff, B. J., Emrich, C., and Cutter, S. L. (2005). Erosion hazard vulnerability of US coastal counties. J. Coast. Res. 21, 932–942. doi: 10.2112/04-0172.1
Bukvic, A., Rohat, G., Apotsos, A., and Sherbinin, A. D. (2020). A Systematic Review of Coastal Vulnerability Mapping. Sustde 12:2822. doi: 10.3390/su12072822
Cai, F., Su, X. Z., Cao, C., Lei, G., Liu, J. H., Yu, F., et al. (2019). Coastal Erosion Vulnerability Assessment and Demonstration in China. Beijing: China Ocean Press.
Cai, F., Su, X. Z., Liu, J. H., Li, B., and Lei, G. (2009). Coastal erosion in China under the condition of global climate change and measures for its prevention. Prog. Nat. Sci. 19, 415–426. doi: 10.1016/j.pnsc.2008.05.034
Castelle, B., Marieu, V., Bujan, S., Splinter, K. D., Robinet, A., Senechal, N., et al. (2015). Impact of the winter 2013–2014 series of severe Western Europe storms on a double-barred sandy coast: beach and dune erosion and megacusp embayments. Geomorphology 238, 135–148. doi: 10.1016/j.geomorph.2015.03.006
Chen, J. Y., Xia, D. X., Yu, Z. Y., and Cai, F. (2010). Overview Of Coastal Erosion In China. Beijing: China Ocean Press.
Duriyapong, F., and Nakhapakorn, K. (2011). Coastal vulnerability assessment: a case study of Samut Sakhon coastal zone. Songklanakarin J. Sci. Technol. 33, 469–476.
Feng, R. D., Wang, F. Y., and Wang, K. Y. (2021). Spatial-temporal patterns and influencing factors of ecological land degradation-restoration in Guangdong-Hong Kong-Macao Greater Bay Area. Sci. Total Environ. 794:148671. doi: 10.1016/j.scitotenv.2021.148671
Flor-Blanco, G., Alcántara-Carrió, J., Jackson, D., Flor, G., and Flores-Soriano, C. (2021). Coastal erosion in NW Spain: recent patterns under extreme storm wave events. Geomorphology 387:107767. doi: 10.1016/j.geomorph.2021.107767
Furukawa, K. (2013). Case studies for urban wetlands restoration and management in Japan. Ocean Coast. Manag. 81, 97–102. doi: 10.1016/j.ocecoaman.2012.07.012
Furukawa, K., and Okada, T. (2006). “Tokyo Bay: its environmental status—past, present, and future,” in The Environment in Asia Pacific Harbours, ed. E. Wolanski (Dordrecht, IL: Springer), 15–34.
Gao, H., Yang, W. X., Yang, Y. P., and Yuan, G. H. (2019). Analysis of the air quality and the effect of governance policies in China’s Pearl River Delta, 2015–2018. Atmocz 10:412. doi: 10.3390/atmos10070412
Guo, H. J., Cai, Y. P., Yang, Z. F., Zhu, Z. C., and Ouyang, Y. R. (2021). Dynamic simulation of coastal wetlands for Guangdong-Hong Kong-Macao Great Bay area based on multi-temporal Landsat images and FLUS model. Ecol. Indic. 125:107559. doi: 10.1016/j.ecolind.2021.107559
Han, X. B., Long, J. P., Li, J. B., Chu, F. Y., Zhang, P. P., Xu, D., et al. (2010). Research Progress on the Vulnerability of the Pearl River Delta. Trop. Geogr. 30, 1–7. doi: 10.3969/j.issn.1001-5221.2010.01.001
Hoque, M. A. A., Phinn, S., Roelfsema, C., and Childs, I. (2018). Assessing tropical cyclone risks using geospatial techniques. Appl. Geogr. 98, 22–33. doi: 10.1016/j.apgeog.2018.07.004
Jana, A., and Bhattacharya, A. K. (2013). Assessment of Coastal Erosion Vulnerability around Midnapur-Balasore Coast, Eastern India using Integrated Remote Sensing and GIS Techniques. J. Indian Soc. Remote Sens. 41, 675–686. doi: 10.1007/s12524-012-0251-2
Jia, M. M., Wang, Z. M., Zhang, Y. Z., Mao, D. H., and Chao, W. (2018). Monitoring loss and recovery of mangrove forests during 42 years: the achievements of mangrove conservation in China. Int. J. Appl. Earth Obs. 73, 535–545. doi: 10.1016/j.jag.2018.07.025
Kang, T. S., Oh, H. M., Lee, E. I., and Jeong, K. Y. (2018). Disaster Vulnerability Assessment in Coastal Areas of Korea. J. Coast. Res. 85, 886–890. doi: 10.2112/SI85-178.1
Li, X., and Damen, M. C. (2010). Coastline change detection with satellite remote sensing for environmental management of the Pearl River Estuary. China J. Mar. Syst. 82, S54–S61. doi: 10.1016/j.jmarsys.2010.02.005
Li, X., Zhou, Y. X., Tian, B., Kuang, R. Y., and Wang, L. H. (2015). GIS-based methodology for erosion risk assessment of the muddy coast in the Yangtze Delta. Ocean Coast. Manag. 108, 97–108. doi: 10.1016/j.ocecoaman.2014.09.028
Liang, J. Y., Tang, B., Huang, T. T., Jiang, P. P., and You, X. L. (2021). Characteristics and Influencing Factors of Urban Agglomeration Competitiveness in Pearl River Delta. Adv. Econ. Bus. Manage. Res. 203, 479–482.
Luo, S. L., Wang, H. J., and Cai, F. (2013). An integrated risk assessment of coastal erosion based on fuzzy set theory along Fujian coast, southeast China. Ocean Coast. Manag. 84, 68–76. doi: 10.1016/j.ocecoaman.2013.07.007
Ma, Y. (2005). Study of determination for the warning tidal level of Guangdong Province. (Qingdao, SD: Ocean University of China). [Ph D thesis].
Mani Murali, R., Ankita, M., Amrita, S., and Vethamony, P. (2013). Coastal vulnerability assessment of Puducherry coast, India, using the analytical hierarchical process. Nat. Hazards Earth Sys. 13, 3291–3311. doi: 10.5194/nhess-13-3291-2013
Manuel, P., Rapaport, E., Keefe, J., and Krawchenko, T. (2015). Coastal climate change and aging communities in Atlantic Canada: a methodological overview of community asset and social vulnerability mapping. Can. Geogr. Le Géogr. can. 59, 433–446. doi: 10.1111/cag.12203
Mcgranahan, G., Balk, D., and Anderson, B. (2007). The rising tide: assessing the risks of climate change and human settlements in low elevation coastal zones. Environ. Urban 19, 17–37. doi: 10.1177/0956247807076960
McLaughlin, S., and Cooper, J. A. G. (2010). A multi-scale coastal vulnerability index: a tool for coastal managers? Environ. Hazard. 9, 233–248. doi: 10.3763/ehaz.2010.0052
McPhearson, T., Maddox, D., Gunther, B., and Bragdon, D. (2013). “Local assessment of New York City: Biodiversity, green space, and ecosystem services,” in Urbanization, Biodiversity and Ecosystem Services: Challenges and Opportunities, ed. T. Elmqvist (Dordrecht, IL: Springer), 355–383.
Miah, J., Hossain, K. T., Hossain, M. A., and Najia, S. I. (2020). Assessing coastal vulnerability of Chittagong District, Bangladesh using geospatial techniques. J. Coast. Conserv. 24:66. doi: 10.1007/s11852-020-00784-2
Pendleton, E. A., Barras, J. A., Williams, S. J., and Twichell, D. C. (2010). Coastal Vulnerability Assessment of the Northern Gulf of Mexico to Sea-Level Rise and Coastal Change. U.S. Geological Survey Open-File Report 2010–1146, Reston, VA: U.S. Geological Survey, 1–2. doi: 10.3133/ofr20101146
Peng, Y. S., Zheng, M. X., Zheng, Z. X., Wu, G. C., Chen, Y. C., Xu, H. L., et al. (2016). Virtual increase or latent loss? Mar. Pollut. Bull. 109, 691–699. doi: 10.1016/j.marpolbul.2016.06.083
Phan, L. T., Slinn, D. N., and Kline, S. W. (2013). “Wave effects on hurricane storm surge simulation,” in Advances in Hurricane Engineering: Learning From Our Past, ed. C. P. Jones (New York, NY: ASCE), 753–764.
Phong, N. T., Parnell, K. E., and Cottrell, A. (2017). Human activities and coastal erosion on the Kien Giang coast. Vietnam. J. Coast. Conserv. 21, 967–979. doi: 10.1007/s11852-017-0566-9
Qi, H. S., Cai, F., Lei, G., Cao, H. M., and Shi, F. Y. (2010). The response of three main beach types to tropical storms in South China. Mar. Geol. 275, 244–254. doi: 10.1016/j.margeo.2010.06.005
Rangel-Buitrago, N., Williams, A. T., and Anfuso, G. (2018). Hard protection structures as a principal coastal erosion management strategy along the Caribbean coast of Colombia. A chronicle of pitfalls. Ocean Coast. Manag. 156, 58–75. doi: 10.1016/j.ocecoaman.2017.04.006
Roy, S., Pandit, S., Papia, M., Rahman, M. M., and Hossain, M. S. (2021). Coastal erosion risk assessment in the dynamic estuary: the Meghna estuary case of Bangladesh coast. Int. J. Disast. Risk Re. 61:102364. doi: 10.1016/j.ijdrr.2021.102364
Sano, M., Gainza, J., Baum, S., Choy, D. L., Neumann, S., and Tomlinson, R. (2015). Coastal vulnerability and progress in climate change adaptation: an Australian case study. Reg. Stud. Mar. Sci. 2, 113–123. doi: 10.1016/j.rsma.2015.08.015
Stronkhorst, J., Levering, A., Hendriksen, G., Rangel-Buitrago, N., and Appelquist, L. R. (2018). Regional coastal erosion assessment based on global open access data: a case study for Colombia. J. Coast. Conserv. 22, 787–798. doi: 10.1007/s11852-018-0609-x
Susmita, D., Benoit, L., Siobhan, M., and David, W. (2010). Exposure of developing countries to sea-level rise and storm surges. Clim. Change 106, 581–581. doi: 10.1007/s10584-010-9959-6
Swami, D., and Parthasarathy, D. (2021). Dynamics of exposure, sensitivity, adaptive capacity and agricultural vulnerability at district scale for Maharashtra. India Ecol. Indic. 121:107206. doi: 10.1016/j.ecolind.2020.107206
Wang, H., Li, Z., Han, G., Han, J., Gao, J., and Xu, T. (2007). Analysis on the ecological footprint in Yellow River Delta and Zhujiang Delta regions. Ecol. Environ. 16, 602–608. doi: 10.3969/j.issn.1674-5906.2007.02.066
Wang, X. T., Zhang, W. G., Yin, J., Wang, J., Ge, J. Z., Wu, J. P., et al. (2021). Assessment of coastal erosion vulnerability and socio-economic impact along the Yangtze River Delta. Ocean Coast. Manag. 215:105953. doi: 10.1016/j.ocecoaman.2021.105953
Wang, X. Y., Liu, L., and Zhang, S. L. (2021). Integrated model framework for the evaluation and prediction of the water environmental carrying capacity in the Guangdong-Hong Kong-Macao Greater Bay Area. Ecol. Indic. 130:108083. doi: 10.1016/j.ecolind.2021.108083
Weinberg, P. (2010). Long Island’s Wetland Laws: safeguarding an Irreplaceable Resource. Mem. Am. Math. Soc. 26, 2–5. doi: jstor.org/stable/43391917
Williams, A., Rangel-Buitrago, N. G., Pranzini, E., and Anfuso, G. (2018). The management of coastal erosion. Ocean Coast. Manag. 156, 4–20. doi: 10.1016/j.ocecoaman.2017.03.022
Williams, P., and Faber, P. (2001). Salt marsh restoration experience in San Francisco Bay. J. Coastal Res. 27, 203–211. doi: 10.2307/25736174
Wu, X. L., and Hu, F. (2020). Analysis of ecological carrying capacity using a fuzzy comprehensive evaluation method. Ecol. Indic. 113:106243. doi: 10.1016/j.ecolind.2020.106243
Xiao, Y. E. (2003). Assessment of Coastal Vulnerabliity to Sea-Level Ries: Preliminary Results for the Eoastlines Along the Pearl River Mouth. (Guangzhou, GD: South China Normal University). [Ph D thesis].
Xu, X. Y., Zhang, Z. H., Long, T., Sun, S. M., and Gao, J. (2021). Mega-city region sustainability assessment and obstacles identification with GIS–entropy–TOPSIS model: a case in Yangtze River Delta urban agglomeration. China J. Clean. Prod. 294:126147. doi: 10.1016/j.jclepro.2021.126147
Yang, C., Zhang, C. C., Li, Q. Q., Liu, H. Z., Gao, W. X., Shi, T. Z., et al. (2020). Rapid urbanization and policy variation greatly drive ecological quality evolution in Guangdong-Hong Kong-Macau Great Bay Area of China: a remote sensing perspective. Ecol. Indic. 115:106373. doi: 10.1016/j.ecolind.2020.106373
Yang, C. C., Gan, H. Y., Wan, R. S., and Zhang, Y. M. (2021). Spatiotemporal evolution and influencing factors of coastline in the Guangdong-Hong Kong-Macao Great Bay Area from 1975 to 2018. Geol. China 48, 697–707. doi: 10.12029/gc20210302
Yang, Q., and Shuai, H. (2021). Spatial and Temporal Variation of Social-Ecosystem Vulnerability and Barrier Factors in Zhangjiajie City. J. Central South University For. Technol. 15:12. doi: 10.14067/j.cnki.1673-9272.2021.05.008
Yang, W. C., Xu, K., Lian, J. J., Ma, C., and Bin, L. L. (2018). Integrated flood vulnerability assessment approach based on TOPSIS and Shannon entropy methods. Ecol. Indic. 89, 269–280. doi: 10.1016/j.ecolind.2018.02.015
Ye, R. H., Ge, J., Zhang, W. M., and Zhao, H. J. (2020). Statistical analysis on impact from tropical cyclone on Guangdong-Hong Kong-Macao Great Bay Area. Water Resour. Hydropower Eng. 51, 37–43. doi: 10.13928/j.cnki.wrahe.2020.S1.007
Yin, J., Yin, Z. E., Wang, J., and Xu, S. Y. (2012). National assessment of coastal vulnerability to sea-level rise for the Chinese coast. J. Coast. Conserv. 16, 123–133. doi: 10.1007/s11852-012-0180-9
Zhang, X. H., Wu, L. L., and Huang, H. M. (2021). Achievements, problems and countermeasures of coastline renovation and restoration in guangdong province. Trans. Oceanol. Limnol. 43, 140–146. doi: 10.13984/j.cnki.cn37-1141.2021.04.020
Zhao, J. C., Ji, G. X., Tian, Y., Chen, Y. L., and Wang, Z. (2018). Environmental vulnerability assessment for mainland China based on entropy method. Ecol. Indic. 91, 410–422. doi: 10.1016/j.ecolind.2018.04.016
Zhou, H. H., Du, J., Nan, Y., Song, K. S., Zhao, B. Y., and Xiang, X. Y. (2019). Landscape Patterns of Coastal Wetlands in Pearl River Delta and Their Changes for 5 Periods since 1980. Wetl. Sci. 17, 559–566. doi: 10.13248/j.cnki.wetlandsci.2019.05.009
Zhu, Z. T. (2019). Study on Assessment Modeling of Coastal Vulnerability to Erosion and its Application. (Shanghai, SH: East China Normal University). [Ph.D thesis].
Keywords: coastal erosion, vulnerability assessment, evolution process, impact of human activities, the Pearl River Estuary Great Bay Area
Citation: Cao C, Zhu K, Cai F, Qi HS, Liu JH, Lei G, Mao ZJ, Zhao S, Liu G and Su Y (2022) Vulnerability Evolution of Coastal Erosion in the Pearl River Estuary Great Bay Area Due to the Influence of Human Activities in the Past Forty Years. Front. Mar. Sci. 9:847655. doi: 10.3389/fmars.2022.847655
Received: 03 January 2022; Accepted: 23 February 2022;
Published: 25 March 2022.
Edited by:
Giandomenico Foti, Mediterranea University of Reggio Calabria, ItalyReviewed by:
Meilin Wu, South China Sea Institute of Oceanology (CAS), ChinaCopyright © 2022 Cao, Zhu, Cai, Qi, Liu, Lei, Mao, Zhao, Liu and Su. This is an open-access article distributed under the terms of the Creative Commons Attribution License (CC BY). The use, distribution or reproduction in other forums is permitted, provided the original author(s) and the copyright owner(s) are credited and that the original publication in this journal is cited, in accordance with accepted academic practice. No use, distribution or reproduction is permitted which does not comply with these terms.
*Correspondence: Chao Cao, Y2FvY2hhb0B0aW8ub3JnLmNu; Feng Cai, Y2FpZmVuZ0B0aW8ub3JnLmNu
†These authors have contributed equally to this work
Disclaimer: All claims expressed in this article are solely those of the authors and do not necessarily represent those of their affiliated organizations, or those of the publisher, the editors and the reviewers. Any product that may be evaluated in this article or claim that may be made by its manufacturer is not guaranteed or endorsed by the publisher.
Research integrity at Frontiers
Learn more about the work of our research integrity team to safeguard the quality of each article we publish.