- 1Key Laboratory of Ocean Circulation and Waves, Institute of Oceanology, Chinese Academy of Sciences, Qingdao, China
- 2Pilot National Laboratory for Marine Science and Technology, Qingdao, China
- 3University of Chinese Academy of Sciences, Beijing, China
- 4Center for Ocean Mega-Science, Chinese Academy of Sciences, Qingdao, China
Significant surface-intensified and subsurface-intensified intraseasonal variability (ISV) of the North Equatorial Current/Undercurrent with different periods are detected to coexist with mooring ADCP measurements at 13°N, 130°E. The ISV of the currents in the upper 200 m has a relatively shorter period of 45 days, while the period of the subsurface-intensified ISV between 400 and 800 m is around 85 days. By combining with sea surface height measurements from satellite altimeters and outputs from an eddy-resolving ocean general circulation model, the origin and dynamic mechanism of the two flavors of ISV are investigated. Eddy trajectory tracking and energy analysis indicate that both the surface-intensified and subsurface-intensified ISV are related to locally generated meso-scale eddies near the mooring sites. Stability analysis suggests the surface-intensified ISV is related to the baroclinic instability induced by the vertical velocity shear of the North Equatorial Current. While the generation of the subsurface-intensified ISV is more complex and is partly related to the enhanced barotropic instability induced by the intensified horizontal shear of the subsurface zonal background flow.
Introduction
The Western Tropical Pacific (WTP) Ocean is not only important in the modulation of the regional and global climate through strong atmospheric convection, but also essential in the material and energy cycle of the global ocean owing to its complex three-dimensional current system with intensive multiscale variability (e.g., Lukas et al., 1996; Hu et al., 2015, 2020). In the upper layer, the westward-flowing North Equatorial Current (NEC) bifurcates into a northward flow known as the Kuroshio Current (KC) and a southward flow known as the Mindanao Current (MC) after encountering the Philippine coast (e.g., Nitani, 1972; Toole et al., 1990; Qiu and Lukas, 1996; Qu and Lukas, 2003; Kim et al., 2004; Kashino et al., 2009; Chen and Wu, 2011). Beneath the upper ocean, the North Equatorial Undercurrent (NEUC), Luzon Undercurrent (LUC), and Mindanao Undercurrent (MUC) exist below the NEC, KC, and MC, respectively, and flow in the opposite direction to their upper layer counterparts (e.g., Hu et al., 2015; Qiu et al., 2015; Wang et al., 2015).
The NEC, as the boundary between the tropical and subtropical gyres and the origin of the Pacific western boundary currents, has attracted much attention and been extensively studied with multiple observational data and model outputs, especially on seasonal and interannual time scales. It is suggested that the interannual variation of NEC is strongly influenced by El Niño/ Southern Oscillation (ENSO), and the intensity of NEC transport enhances (recedes) during El Niño (La Niña) (e.g., Qiu and Joyce, 1992; Qiu and Lukas, 1996; Kim et al., 2004; Kashino et al., 2009; Zhai and Hu, 2012; Hu and Hu, 2014). On the seasonal time scale, previous studies based on different datasets reported different NEC variations, and the discrepancy is also related to the seasonal phase lag across the Pacific basin (e.g., Donguy and Meyers, 1996; Qiu and Lukas, 1996; Qu and Lukas, 2003; Kim et al., 2004; Wang et al., 2019). In general, seasonal and interannual variations of the NEC are mainly caused by remote wind forcing over the central-eastern Pacific through westward-propagating Rossby waves, and it is further modulated by the local wind forcing through Ekman pumping (e.g., Meyers, 1979; Kessler, 1990; Masumoto and Yamagata, 1991; Qiu and Lukas, 1996; Ueki et al., 2003; Kim et al., 2004; Chen and Wu, 2011; Wang et al., 2019; Liu and Zhou, 2020).
Recent satellite altimeter and mooring measurements suggest that there are intense velocity variances of the NEC and NEUC in the surface and subsurface layer on the intraseasonal time scale. In the surface layer of NEC, a prominent intraseasonal variability (ISV) with a period of 50–60 days was reported with satellite altimetry (e.g., Liu et al., 2003; Wang et al., 2016). Combining with satellite altimetry and mooring measurements, Azminuddin et al. (2019) indicated that the surface-intensified ISV in the NEC region has a period of 46 days and is modulated by the interannual variation of the background flow. In addition, the ISV of the surface zonal current (NEC) and the subsurface zonal jets (NEUC) were investigated by Zhang et al. (2017), using about 1-year time series of mooring acoustic Doppler current profiler (ADCP) measurements. The vertical modes of the ISV across the 130°E section between 10.5°N and 18°N exhibit different structures at different latitudes. The ISV at lower latitudes (10.5°N, 13°N) appears to be dominated by subthermocline-intensified signals, while the ISV at relatively higher latitudes (15.5°N, 18°N) is dominated by surface-intensified signals. Similar spatial distributions of the surface and subthermocline meso-scale eddies in the western Pacific were also confirmed by high-resolution ocean simulations (Wang, 2017).
It is worth mentioning that an interesting signal of velocity variation seems to be neglected by Zhang et al. (2017), and the surface-intensified and subsurface-intensified ISV signals with different vertical structures and different periods exist simultaneously at 13°N, 130°E (see their Figure 2). Previous studies have suggested that traveling surface and subsurface meso-scale eddies play important roles in modulating the ISV signals in the NEC/NEUC region based on diagnostic analysis (e.g., Chiang et al., 2015; Wang et al., 2016). Wang et al. (2016) showed that the ISVs of the NEC are mainly attributed to meso-scale eddies, and therefore the ISVs and eddies could be considered as the two sides of the same coin, at least in this local region. Dynamic analysis indicates that the generation of the traditional surface-intensified meso-scale eddy is highly related to the baroclinic instability of the background flow in the North Pacific Subtropical Countercurrent (STCC)/NEC region (e.g., Qiu, 1999; Qiu et al., 2014), and in the NEC region (Liu et al., 2003). Besides, Chiang et al. (2015) presumed that the formation of subthermocline eddies in the NEC/NEUC region is associated with the barotropic and baroclinic instability. However, under the circumstance of the coexisting surface-intensified and subsurface-intensified ISVs revealed by the mooring measurements, the dynamic mechanism generating these ISV signals still needs further investigation.
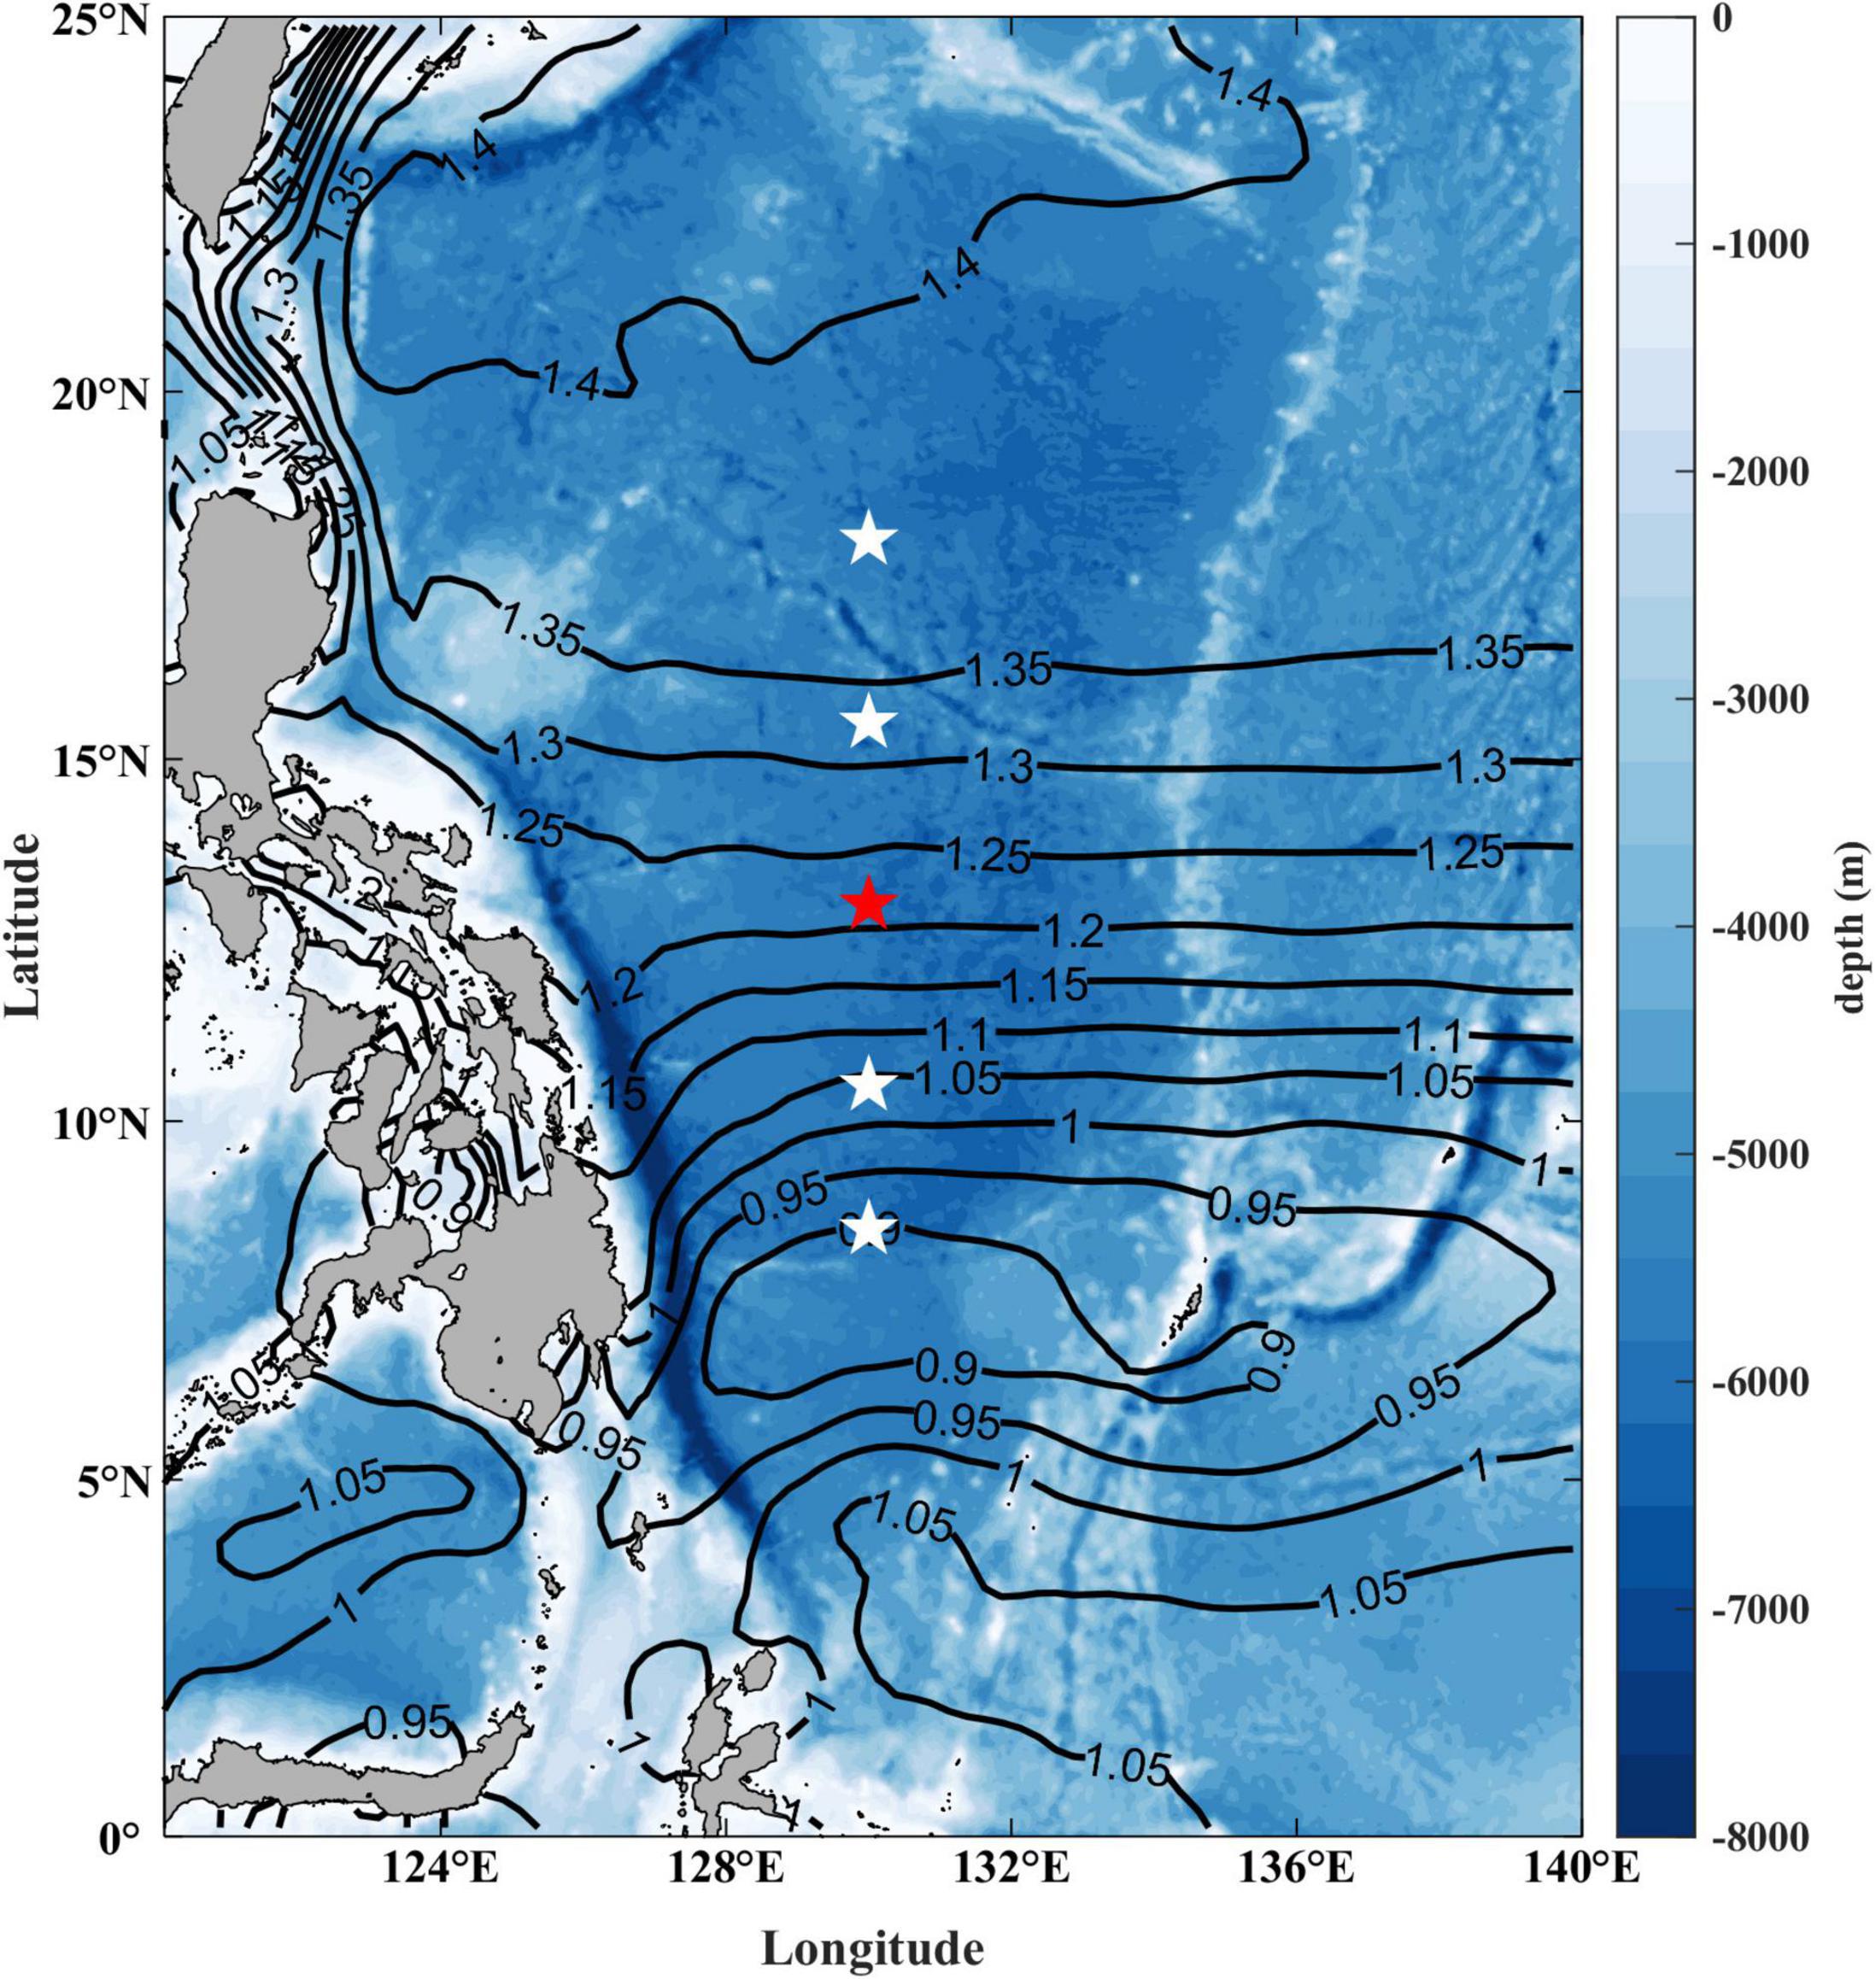
Figure 1. Locations of ADCP moorings deployed by Institute of Oceanology, Chinese Academy of Sciences at 130°E (the mooring used in this study is marked by red pentagram). The color map shows the topography of the WTP derived from the etopo2v2 dataset. Contours show the mean sea surface height from satellite altimetry (AVISO).
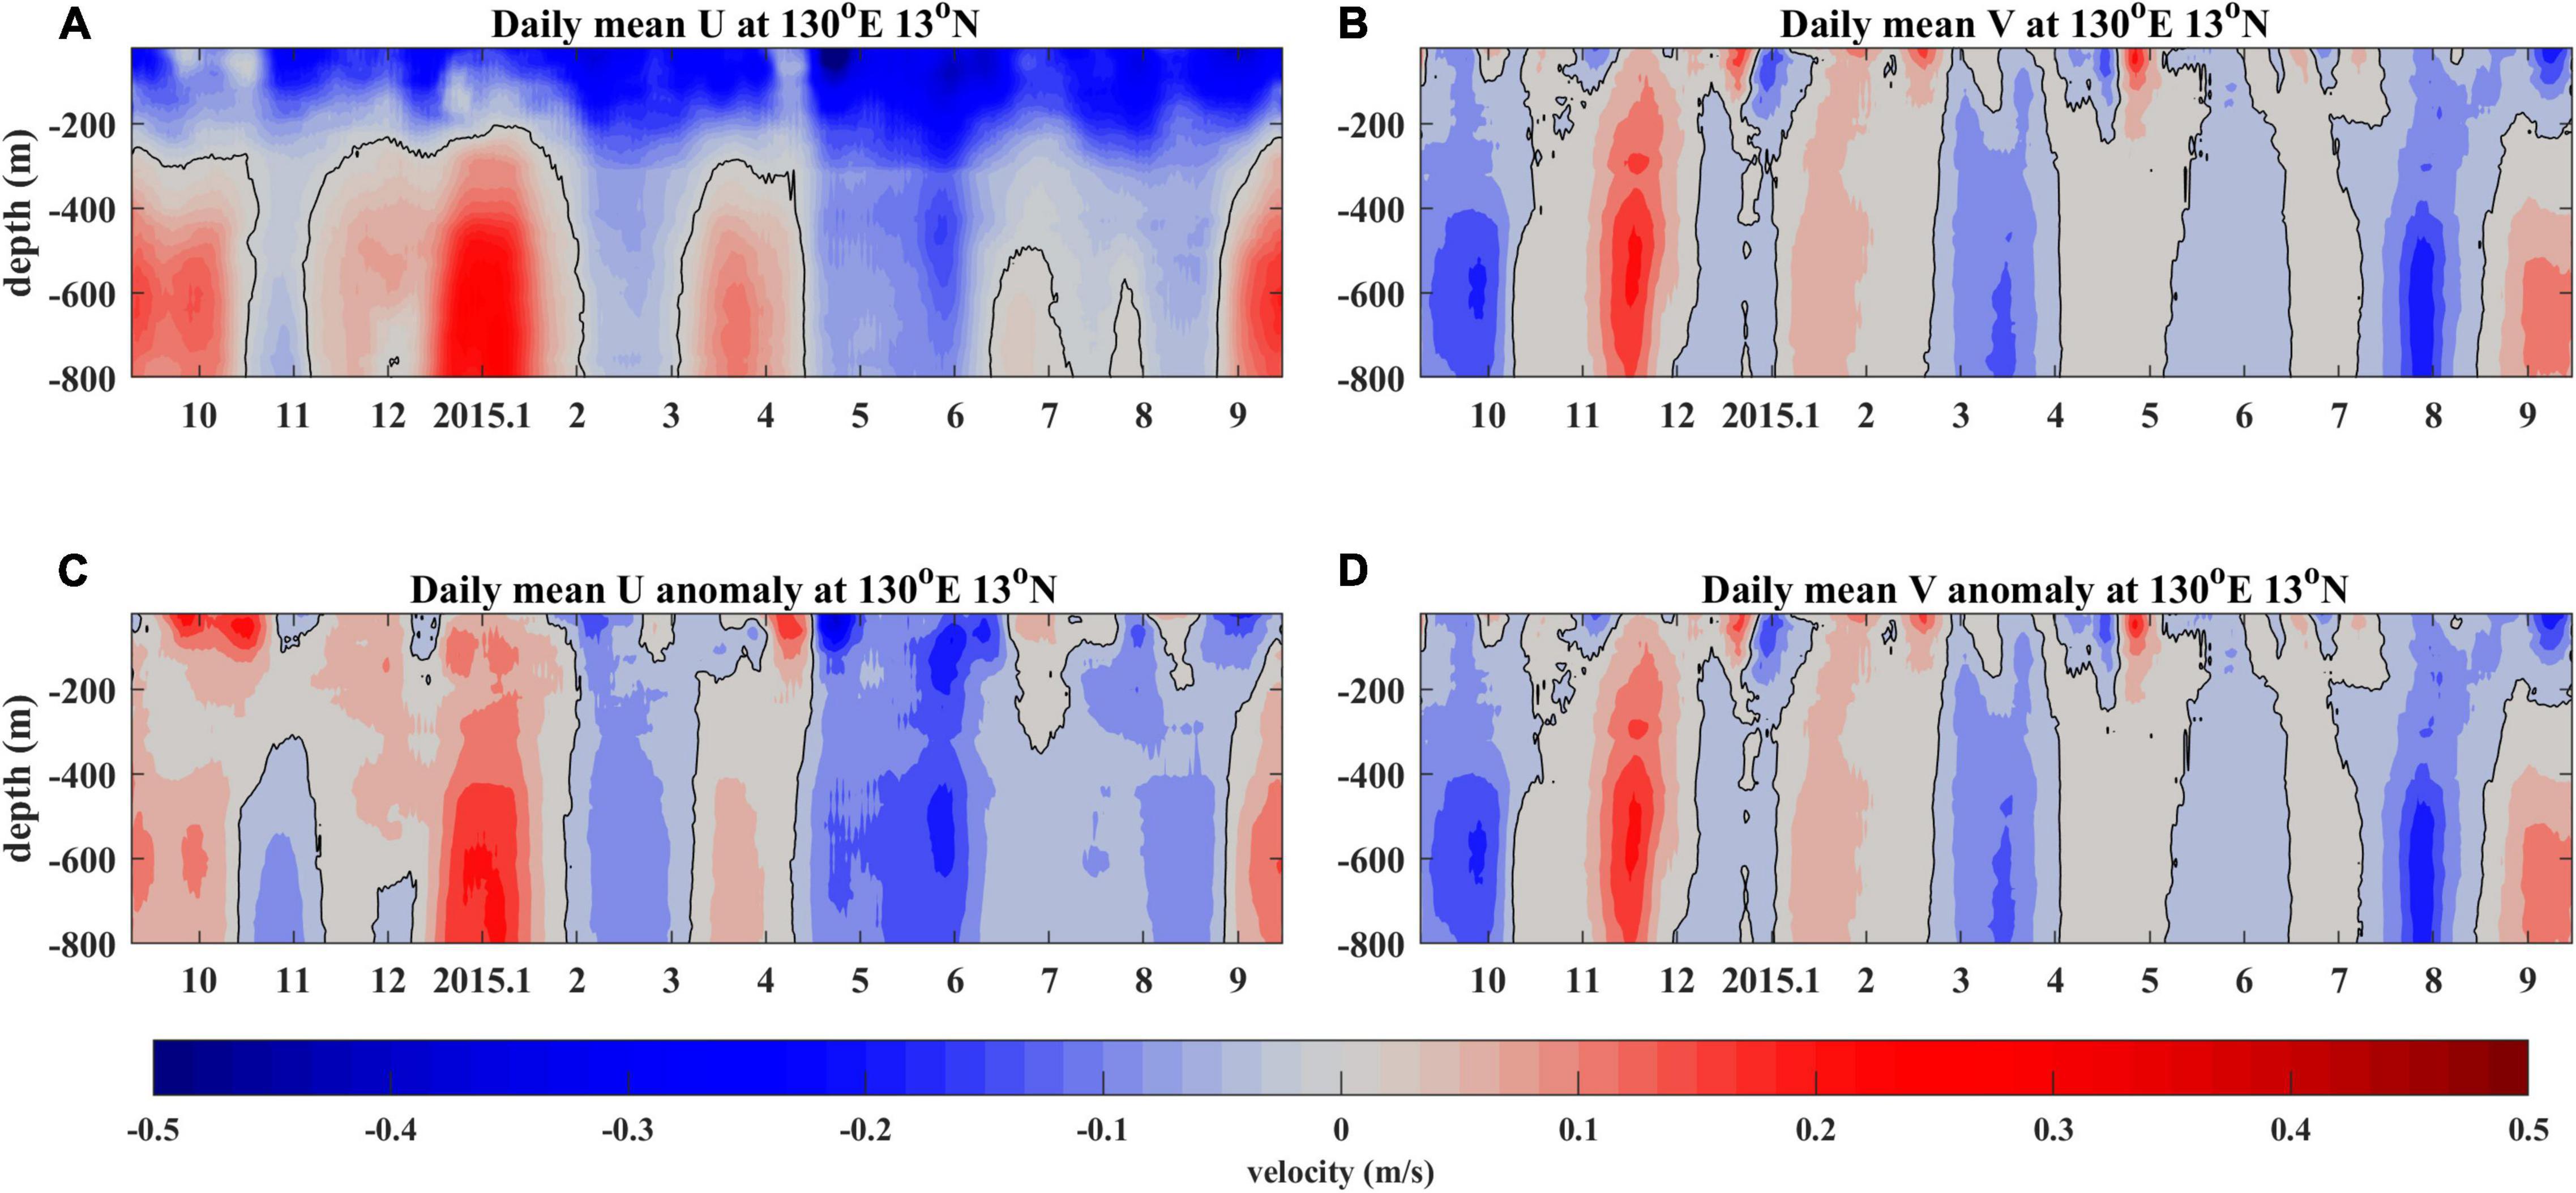
Figure 2. Daily mean velocities (A,B) and their anomalies (C,D) measured by the ADCP mooring at 13°N, 130°E.
Therefore, this study will investigate the characteristics and dynamic mechanism of the two flavors of ISV observed by mooring measurements in the NEC/NEUC region using multiple data, including mooring observation, the Archiving, Validation, and Interpretation of Satellite Oceanographic (AVISO) products, and an eddy-resolving ocean general circulation model (OGCM) for the Earth Simulator (OFES). The remainder of this paper is organized as follows. The observational data from mooring and altimeter, OFES outputs, and methods are introduced in see section “Data and Method.” In see section “Results,” the characteristics of the surface-intensified and subsurface-intensified ISV and their associated eddies are described. In see section “Generation of Two Flavors of Intraseasonal Variability,” the dynamic mechanisms of the surface-intensified and subsurface-intensified ISV signals are revealed. A summary will be given in see section “Conclusion and Discussion.”
Data and Method
Acoustic Doppler Current Profiler Mooring
In the western Pacific, several subsurface moorings were deployed along 130°E between 8° and 18°N to measure the NEC/NEUC (Figure 1). They were deployed in September 2014 and retrieved in September 2015 as the first stage of the observation. The water depth of the mooring site position is around 5,500 m. To capture the velocity profile of the upper 850 m, two 75-kHz ADCP were equipped on the main float at the depth of 400 m for each mooring, with one looking upward and another looking downward. Those mooring measurements have been used to investigate the mean velocity structure and variability of the NEC/NEUC (Zhang et al., 2017). In this study, the same mooring at the axis of the NEC (13°N) was chosen to investigate the two flavors of ISV mentioned above in the introduction. The AD were set to measure velocity every 1 h in 60 bins with a bin size of 8 m. More details can be found in Zhang et al. (2014). In this study, the raw measured data were averaged to form daily data to remove tidal signals and then was interpolated onto depth levels between 0 and 900 m every 10 m.
Archiving, Validation, and Interpretation of Satellite Oceanographic Products
Sea surface geostrophic velocities calculated from the satellite altimeter-measured sea surface height were used to further investigate the source of the surface-intensified ISV in the NEC region. These products were obtained from Archiving Validation and Interpretation of Satellite Data in Oceanography (AVISO) from the website at http://www.aviso.oceanobs.com/. The daily dataset with the resolution of 0.25°×0.25° during 2010 to 2016 was downloaded.
OFES Outputs
In order to discuss the source of the subsurface-intensified ISV in the NEC/NEUC region revealed by the mooring measurements, the OFES outputs were also used in this study. The OFES is based on the Modular Ocean Model (MOM3), which covers a near-global region extending from 75°S to 75°N with a horizontal resolution of 0.1° both in the longitude and latitude. There is a vertical resolution that varies from 5 to 5,900 m depth with a total of 54 levels. The model was first spun up for 50 years, driven by annual mean temperature and salinity fields of the World Ocean Atlas 1998 (WOA98), and then was integrated from 1,950 using the initial forcing field based on the National Centers for Environmental Prediction (NCEP) reanalysis products. More detailed descriptions of this model can be found in Masumoto et al. (2004) and Sasaki et al. (2008). The 3-day snapshot model outputs with a spatial resolution of 0.1°×0.1° from 2010 to 2016 were used in this study.
Eddy Detection and Tracking Algorithm
An eddy detection algorithm was adopted in this study to detect eddies from the satellite altimetry and model outputs, which is subject to four constraints (Nencioli et al., 2010): (a) zonal velocity u has to reverse sign across the eddy center along the meridional direction and its magnitude has to increase away from the center; (b) meridional velocity v has to reverse sign across the eddy center along the zonal direction and the magnitude has to increase away from the center; Besides, the sense of rotation has to be the same as u; (c) a local minimum of velocity magnitude has to be at the eddy center; and (d) the directions of the velocity vectors have to change with a constant sense of rotation and the directions of two neighboring velocity vectors have to lay within the same or two adjacent quadrants around the eddy center. As in Chaigneau et al. (2008), the uncertainty of the algorithm could be estimated with two parameters: the success of detection rate (SDR) and the excess of detection rate (EDR). The SDR is defined as the ratio between the number of eddies detected by the algorithm and the real number of eddies, and the EDR is defined as the ratio between the number of fake eddies detected by the algorithm and the real number of eddies. The algorithm used in this study has an SDR higher than 95% and EDR around 11%.
After eddy centers were detected for the entire period of the detection experiment, eddy trajectories were determined by comparing the centers at successive time steps from the first day following the tracking algorithm proposed by Doglioli et al. (2007) and Chaigneau et al. (2008), and a searching zone with a radius of 75 km was chosen to prevent eddy trajectory splitting in our study.
Energy Conversion Rate
To evaluate the contribution of barotropic and baroclinic instability in generating the meso-scale eddies and modulating the ISV of surface and subsurface currents, the local barotropic energy conversion rate (BTR) and baroclinic energy conversion rate (BCR) were calculated as follows (e.g., Masina et al., 1999; Zhang et al., 2013),
where and u′ ( and v′) represents velocity signals with time scales longer and shorter than 150 days, respectively. Consequently, denotes the low-frequency varying background flow, and u′ denotes the velocity fluctuations associated with meso-scale eddies, considering the ISV of the NEC and NEUC is dominated by a period of 50–120 days as revealed by previous studies (e.g., Qiu, 1999; Liu et al., 2003; Zhang et al., 2017). ρ′ and w′ represent potential density and vertical velocity related to meso-scale eddies, while g and ρ0 denote the gravity constant of 9.807m⋅s−1 and the background potential density of 1,025kg⋅m−3, respectively.
Results
Observed Intraseasonal Variability From Acoustic Doppler Current Profiler Measurements
The subsurface mooring at 13°N, 130°E was deployed to monitor the surface and subsurface current in the NEC/NEUC area. Figure 2 shows the 1-year records of the zonal current U and meridional current V and their anomalies, observed by the upward-looking and downward-looking ADCPs equipped on the mooring. The near-inertial oscillation signals have been removed by using a 10 days low-pass filter. The features of the NEC and NEUC are well captured by the ADCP records. There is a strong and stable westward-flowing NEC in the upper 300 m, as well as an intermittent eastward-flowing jet below the depth of 300 m (Figure 2A). Energetic ISV signals appear in the surface and subsurface layer of the currents (Figures 2A–D). Moreover, the ISV is incoherent in the surface and subsurface layer. There is a higher frequency ISV in the upper 200 m depth, while a lower frequency ISV exists in the subsurface layer (between 400 and 800 m).
In order to quantify the dominant time scale of the ISV, we calculated the power spectra of the zonal and meridional current in the surface and subsurface layer with the ADCP data (Figure 3). For both the zonal and meridional currents, the ISV signals are quite different in the vertical direction. As inferred from Figure 3, in the upper 100 m, the intraseasonal spectral peak has a predominant period of 25–45 days (Figures 3A,B). On the other hand, the intraseasonal spectral peak in the subsurface layer has a predominant period of 85 days (Figures 3C,D). The spectral analysis confirms that the ISV signals of the currents are incoherent in the vertical direction.
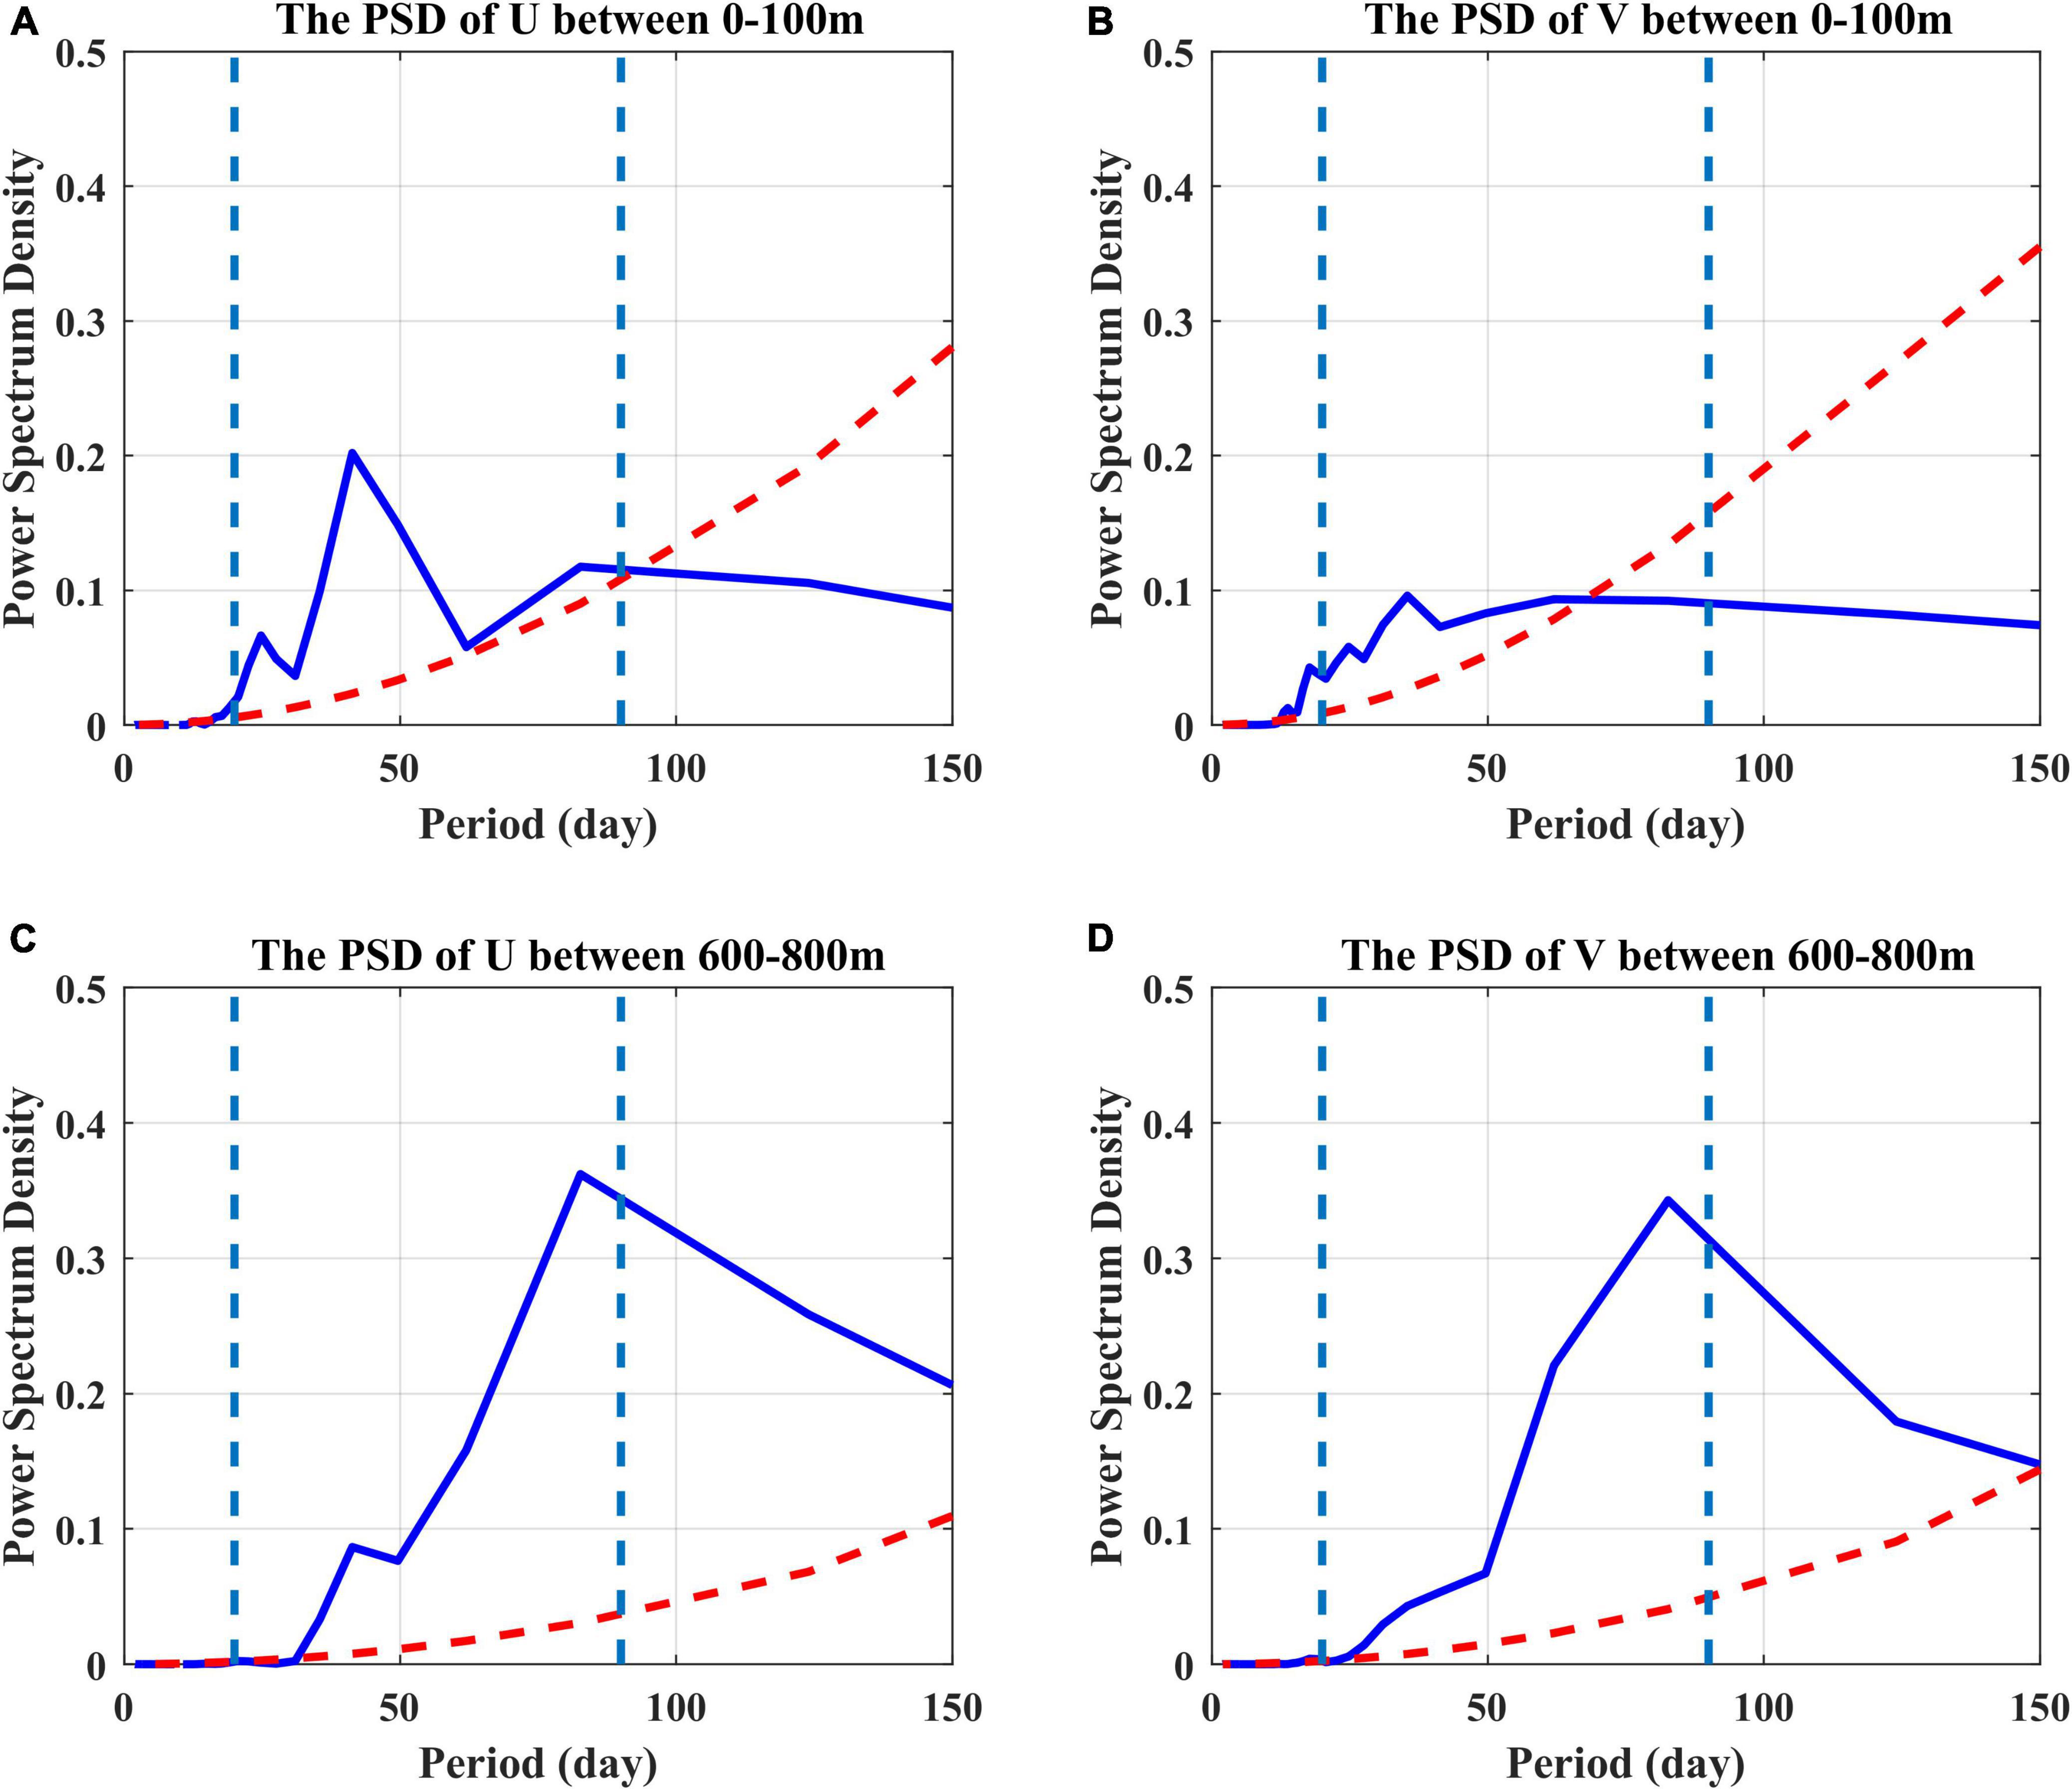
Figure 3. Power spectral density of the zonal (left) and meridional (right) velocity time series averaged between 0–100 m (A,B) and 600–800 m (C,D) derived from the mooring ADCP. The red dashed curves denote the 95% significance level, and the light blue dashed lines denote the period of 20- and 90-day.
To separate these two types of ISV with different periods, the ADCP-measured time series were filtered with a 10–60 days band-pass filter, and a 60–150 days band-pass filter, respectively. The filtered time series well demonstrates there are two flavors of ISV with different frequencies and vertical structures (Figure 4). The ISV with a relatively higher frequency appears mainly in the upper 200 m, and the peak-to-peak velocity difference is around 0.6m/s for both zonal and meridional components. The ISV with a relatively lower frequency appears below 400 m depth, and the peak-to-peak velocity difference at 600 m is around 0.4m/s. In addition, there seem to be some artificial velocity gaps around 100 m depth in Figure 4C. This is probably related to the band-pass Butterworth filter used here because this filter usually distorts the first signal of the filtered results.
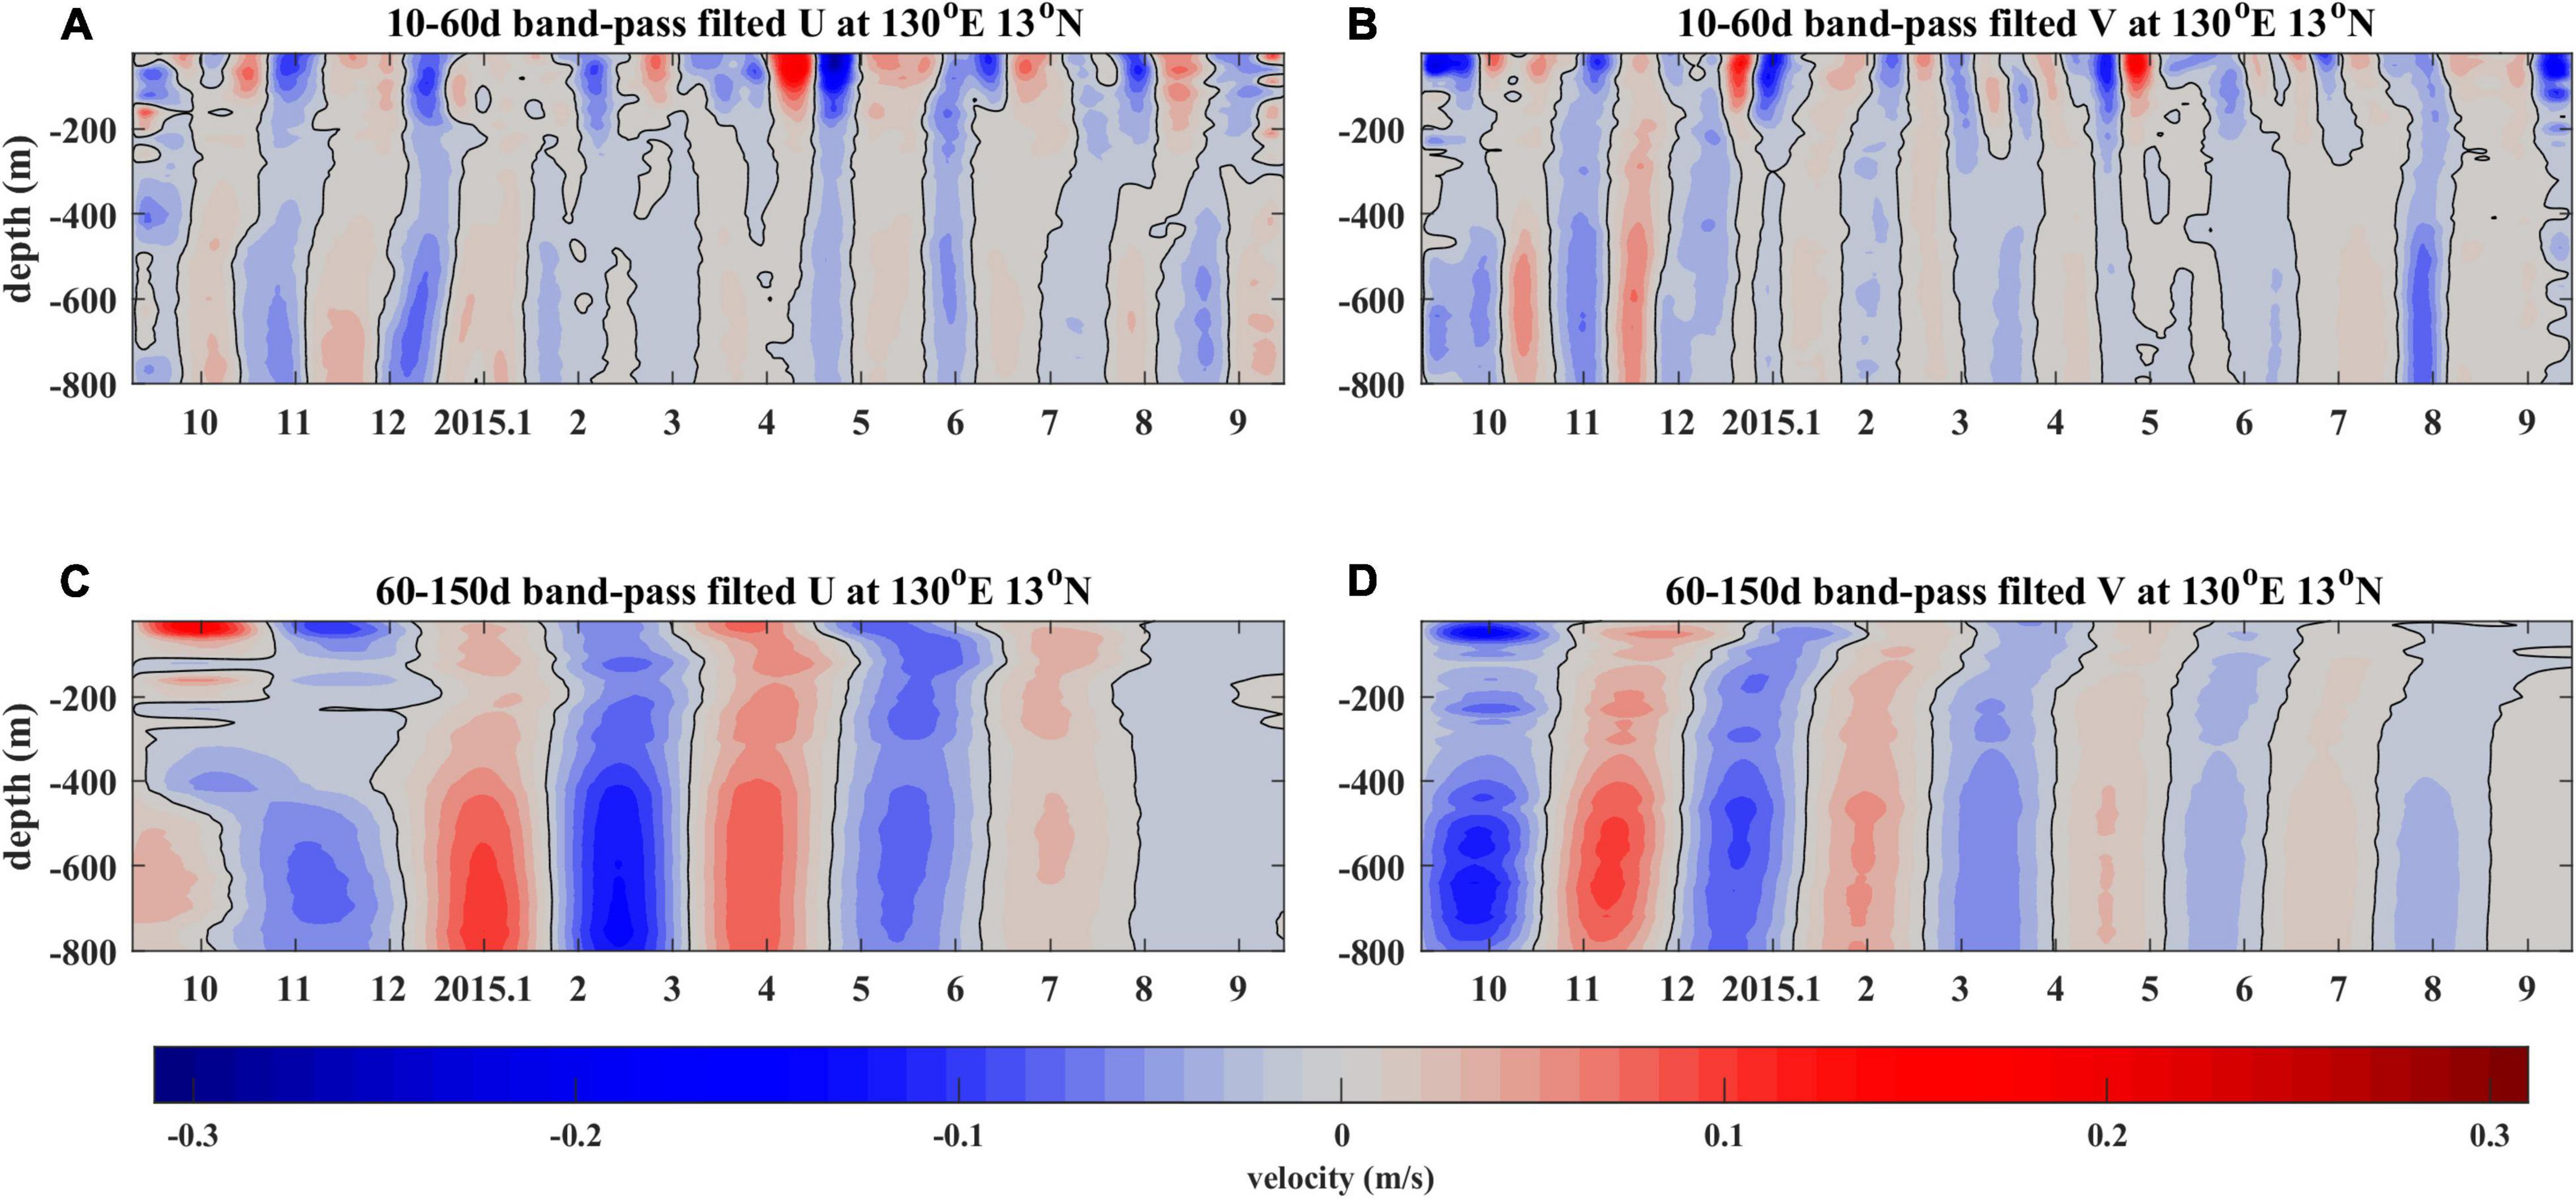
Figure 4. Daily mean zonal (A) and meridional (B) velocity anomalies after a 10–60 days band-pass filtering. (C,D) are the same as the upper panel, but for 60–150 days band-pass filtering.
The percentages of these two flavors of ISV signals in the total velocity variances were calculated as the ratio of standard deviation between the ISV signals and the original velocity time series at each depth. As shown in Figure 5, the contribution of the higher frequency ISV is over 60% above 200 m, which decreases sharply to about 30% with the increasing depth. While the contribution of the lower frequency ISV is relatively smaller in the upper layer, but gradually increases to more than 50% below the depth of 200 m. It demonstrates that these two different ISV signals coexisting at 13°N, 130°E are surface-intensified and subsurface-intensified, respectively. Such a phenomenon is intriguing because past studies suggested that the surface-intensified ISV usually exists at higher latitudes, while the subsurface-intensified ISV distributes at lower latitudes (e.g., Wang, 2017; Zhang et al., 2017). These two flavors of ISV have different vertical structures and frequencies, therefore we hypothesized they are generated by different mechanisms.
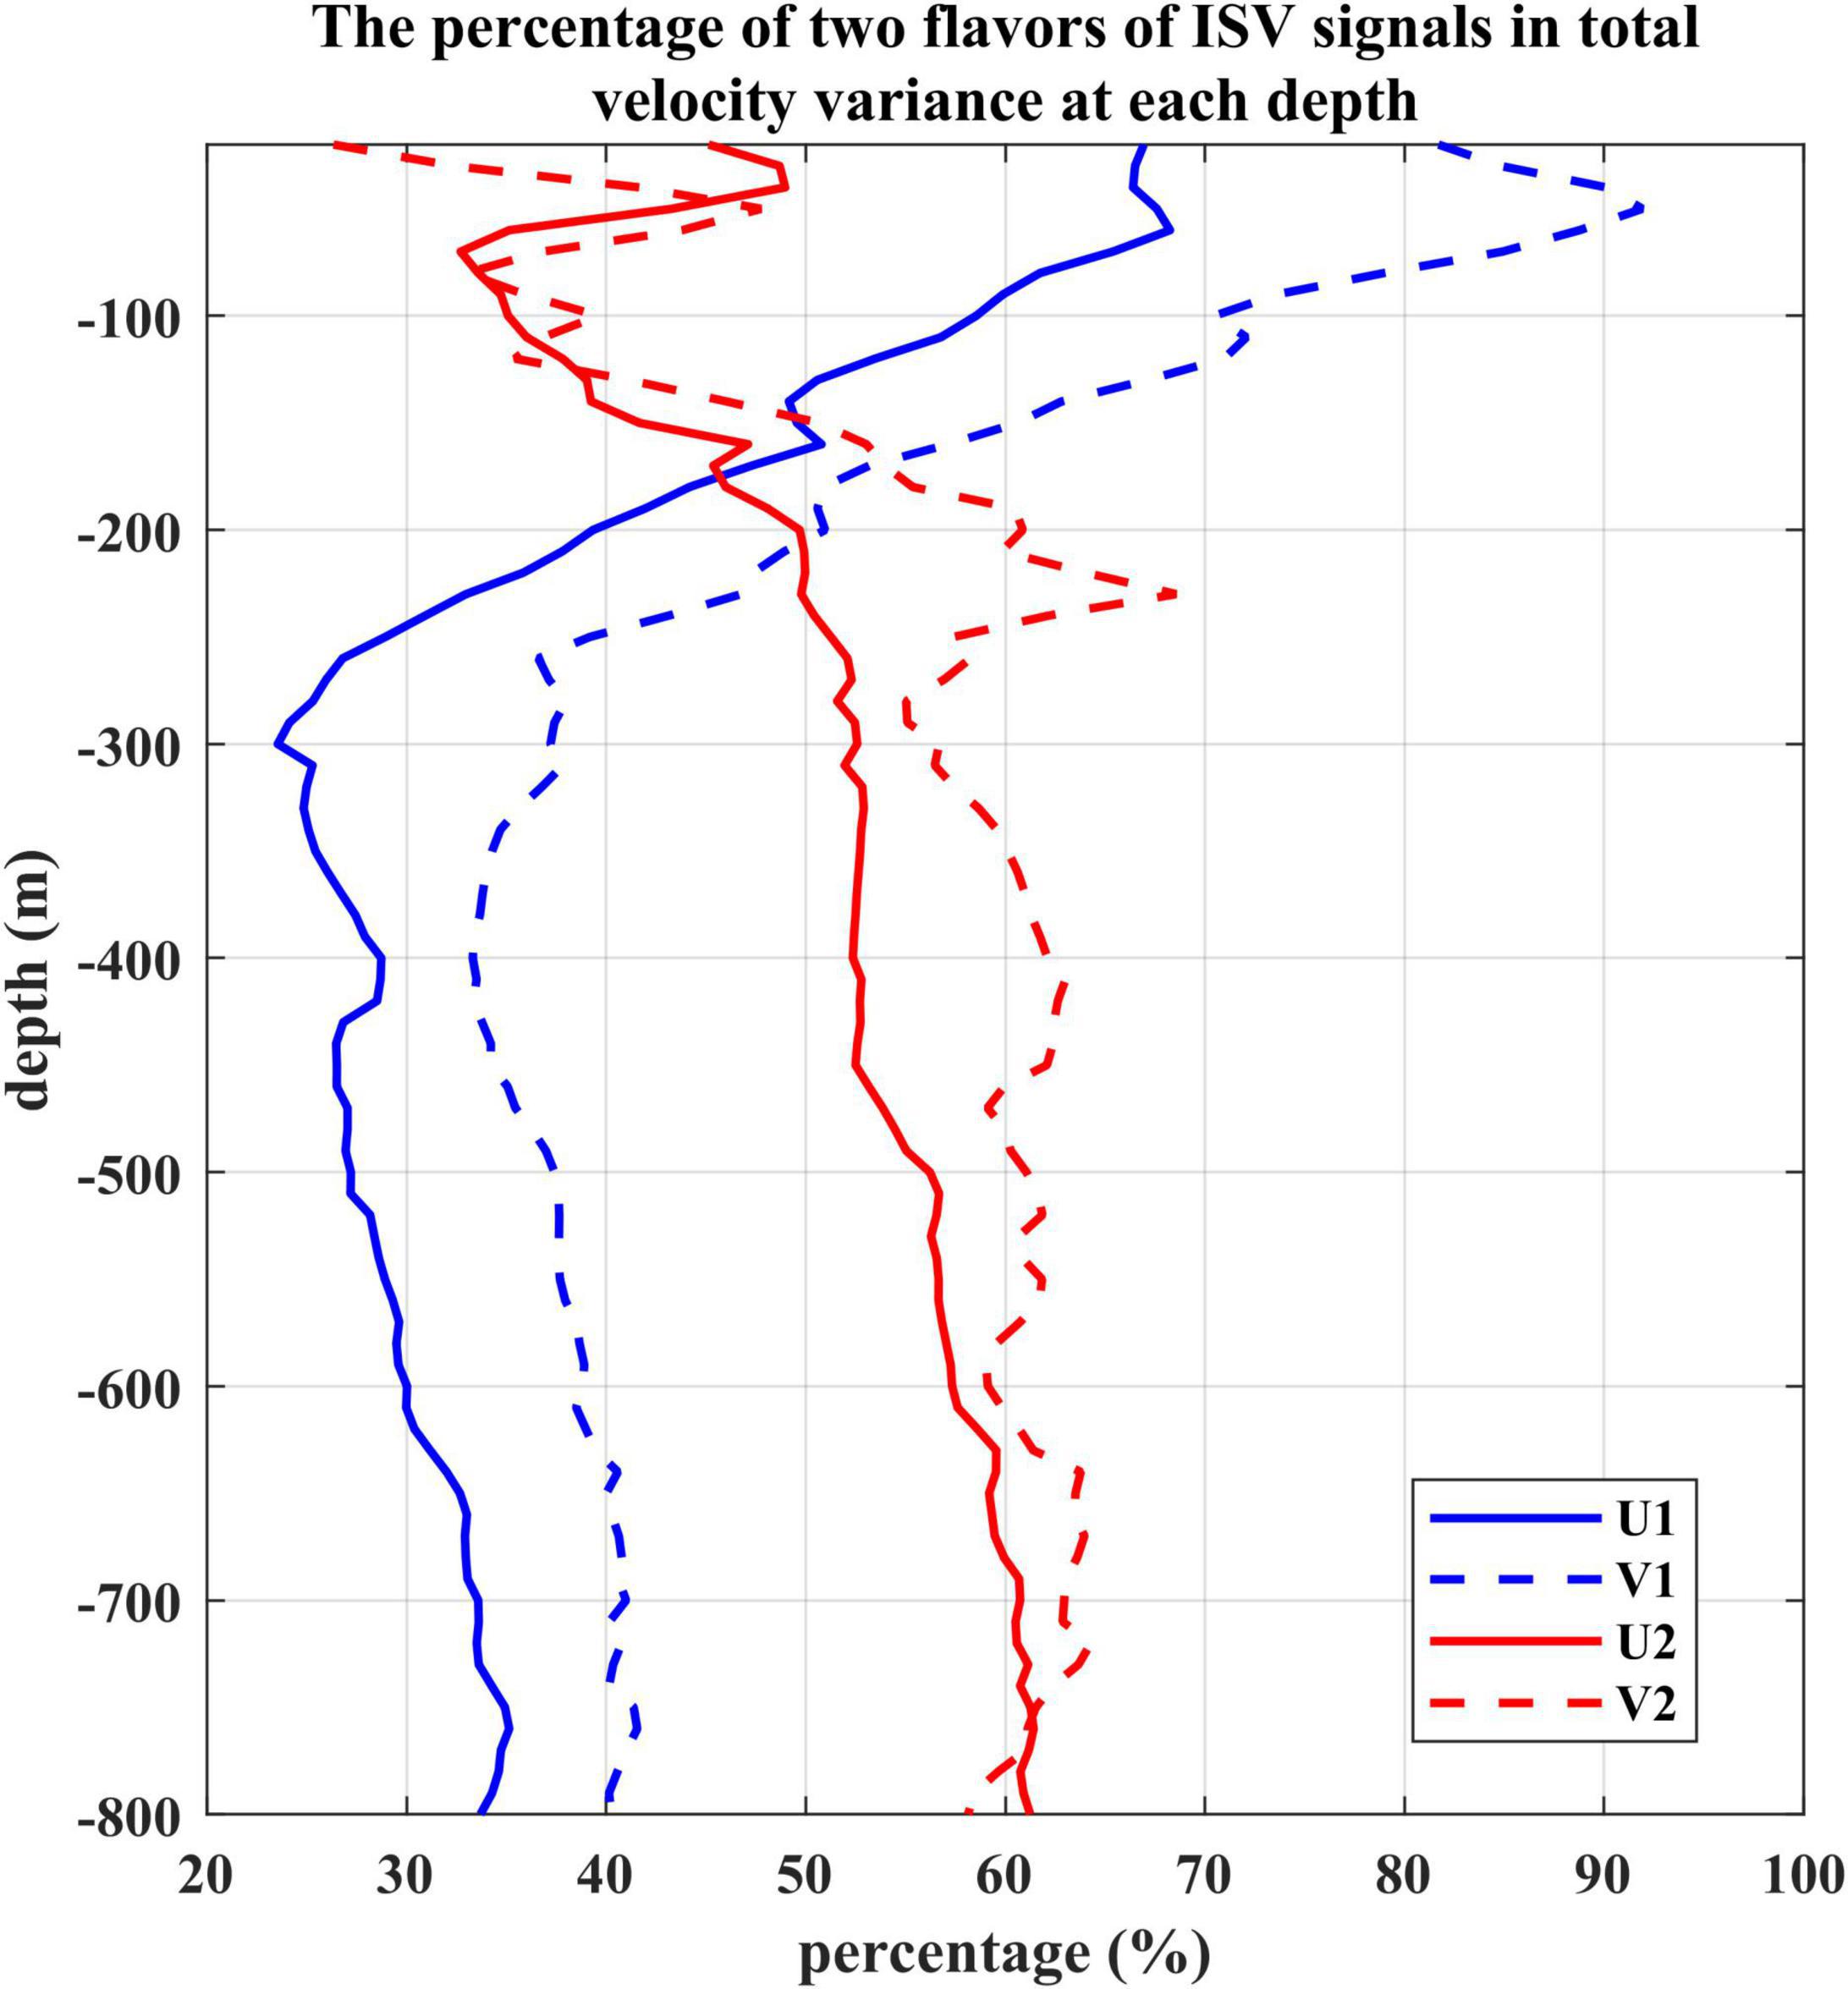
Figure 5. The percentage of two flavors of ISV signals in the total velocity variance at each depth derived from the mooring ADCP measurements. U1 and V1 indicate zonal and meridional velocities after 10–60 days band-pass filter. U2 and V2 indicate zonal and meridional velocities after 60–150 days band-pass filter.
Although the ADCP measurements well capture the mean structure and ISV of the NEC/NEUC at the mooring site, these single-point observations are still insufficient for depicting the spatial structure of the currents and origin of those ISV signals. In terms of the surface-intensified ISV, satellite altimetry provides another powerful tool to investigate its horizontal structures and origins. For the subsurface-intensified ISV, it is almost invisible at the surface and missed by the satellite altimetry, numerical model outputs turn out to be necessary. In the following sections, we will combine the mooring ADCP records with the AVISO data and model outputs to explore the source of the two flavors of ISV and their generation mechanism.
Intraseasonal Variability From Satellite Altimetry and OFES
The time series of surface geostrophic velocities derived from satellite altimetry was compared with the ADCP measurements (not shown). The correlation between the surface zonal velocities derived from ADCP mooring and satellite altimetry is around 0.75, indicating that the surface-intensified ISV signals detected by the mooring ADCP are also well captured by satellite altimetry. Therefore, satellite altimetry products (AVISO) will be used to explore the source of the surface-intensified ISV in this study.
Figure 6A shows the time-longitude plot of the sea surface height (SSH) anomalies along 13°N between the western boundary and 160°E in the WTP. A 10–60 days band-pass filter has been applied to the daily data as we did to the velocities measured by ADCP mooring, to obtain the ISV signals. From 145°E to the western boundary, well-defined positive and negative SSH anomalies appear alternatively, and the westward-propagating speed of those ISV signals is estimated around −0.15m/s, implying that the dominant wavelength of the surface-intensified ISV is around 618 km. Meanwhile, the phase speed of the first mode baroclinic Rossby wave in the presence of a zonal mean flow (NEC) was also calculated, which is around −0.16m/s. It follows that the propagating speed of the ISV signals estimated from the satellite altimetry is consistent with the phase speed of the baroclinic Rossby wave.
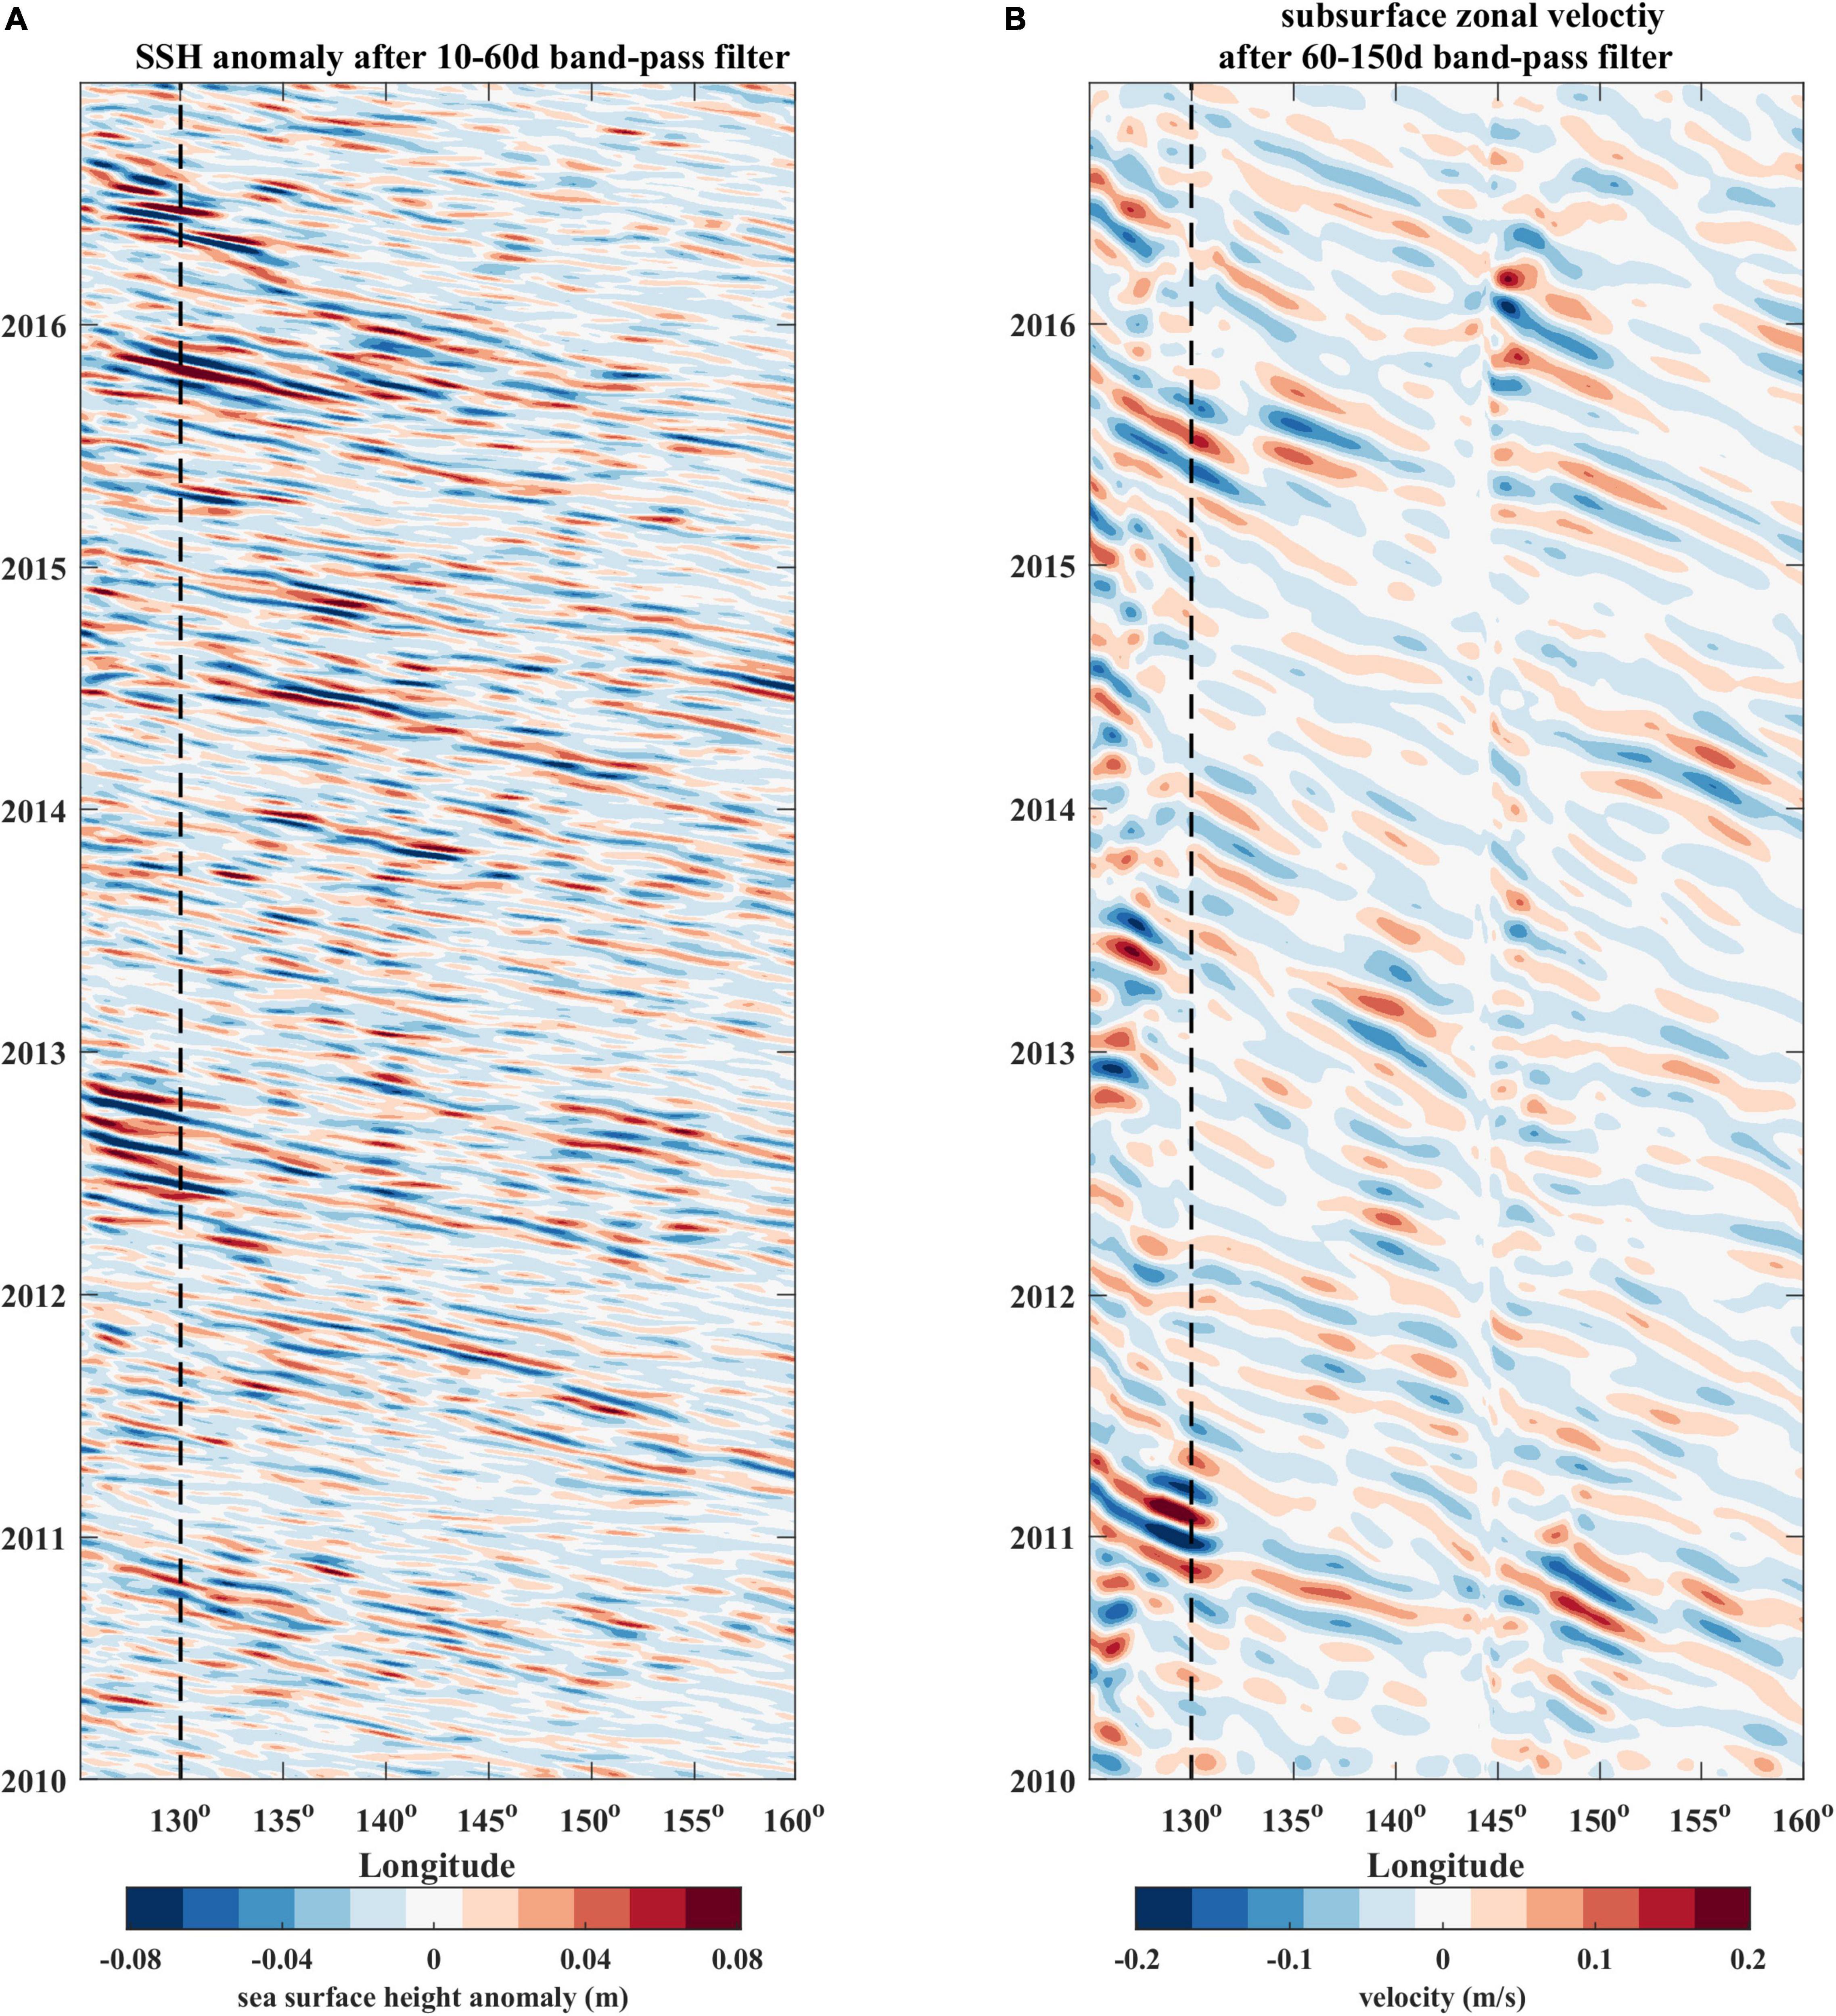
Figure 6. (A) Time-Longitude plot of the 10–60 days band-pass filtered SSH anomalies between western boundary and 160°E along 13°N in the WTP. (B) Time-Longitude plot of the 60–150 days band-pass filtered subsurface zonal velocity (400–600m) along 13°N between western boundary and 160 E in the WTP from OFES outputs. The dashed lines denote the location of 130°E.
The zonal and meridional velocities and their anomalies at 13°N, 130°E during the mooring observation period from OFES outputs are shown in Figure 7. To estimate the ability of OFES in simulating the subsurface-intensified ISV, we compared these OFES-simulated time series with the mooring ADCP measurements as shown in Figure 2. Even though there are some differences between the model outputs and observations, especially in terms of the appearing time of peak values, both of them show obvious ISV in the surface and subsurface layer (Figures 7A,B). Moreover, the spectral analysis suggests that the OFES-simulated currents in the subsurface layer exhibit significant ISV signals with a period of 80 days (not shown), which is almost consistent with the subsurface-intensified ISV detected by the mooring ADCP measurements. Using a 60–150 days band-pass filter, the intraseasonal components of OFES-simulated currents were extracted (Figure 7C). Generally speaking, the OFES is able to simulate the background currents and the ISV of the currents in the NEC/NEUC region.
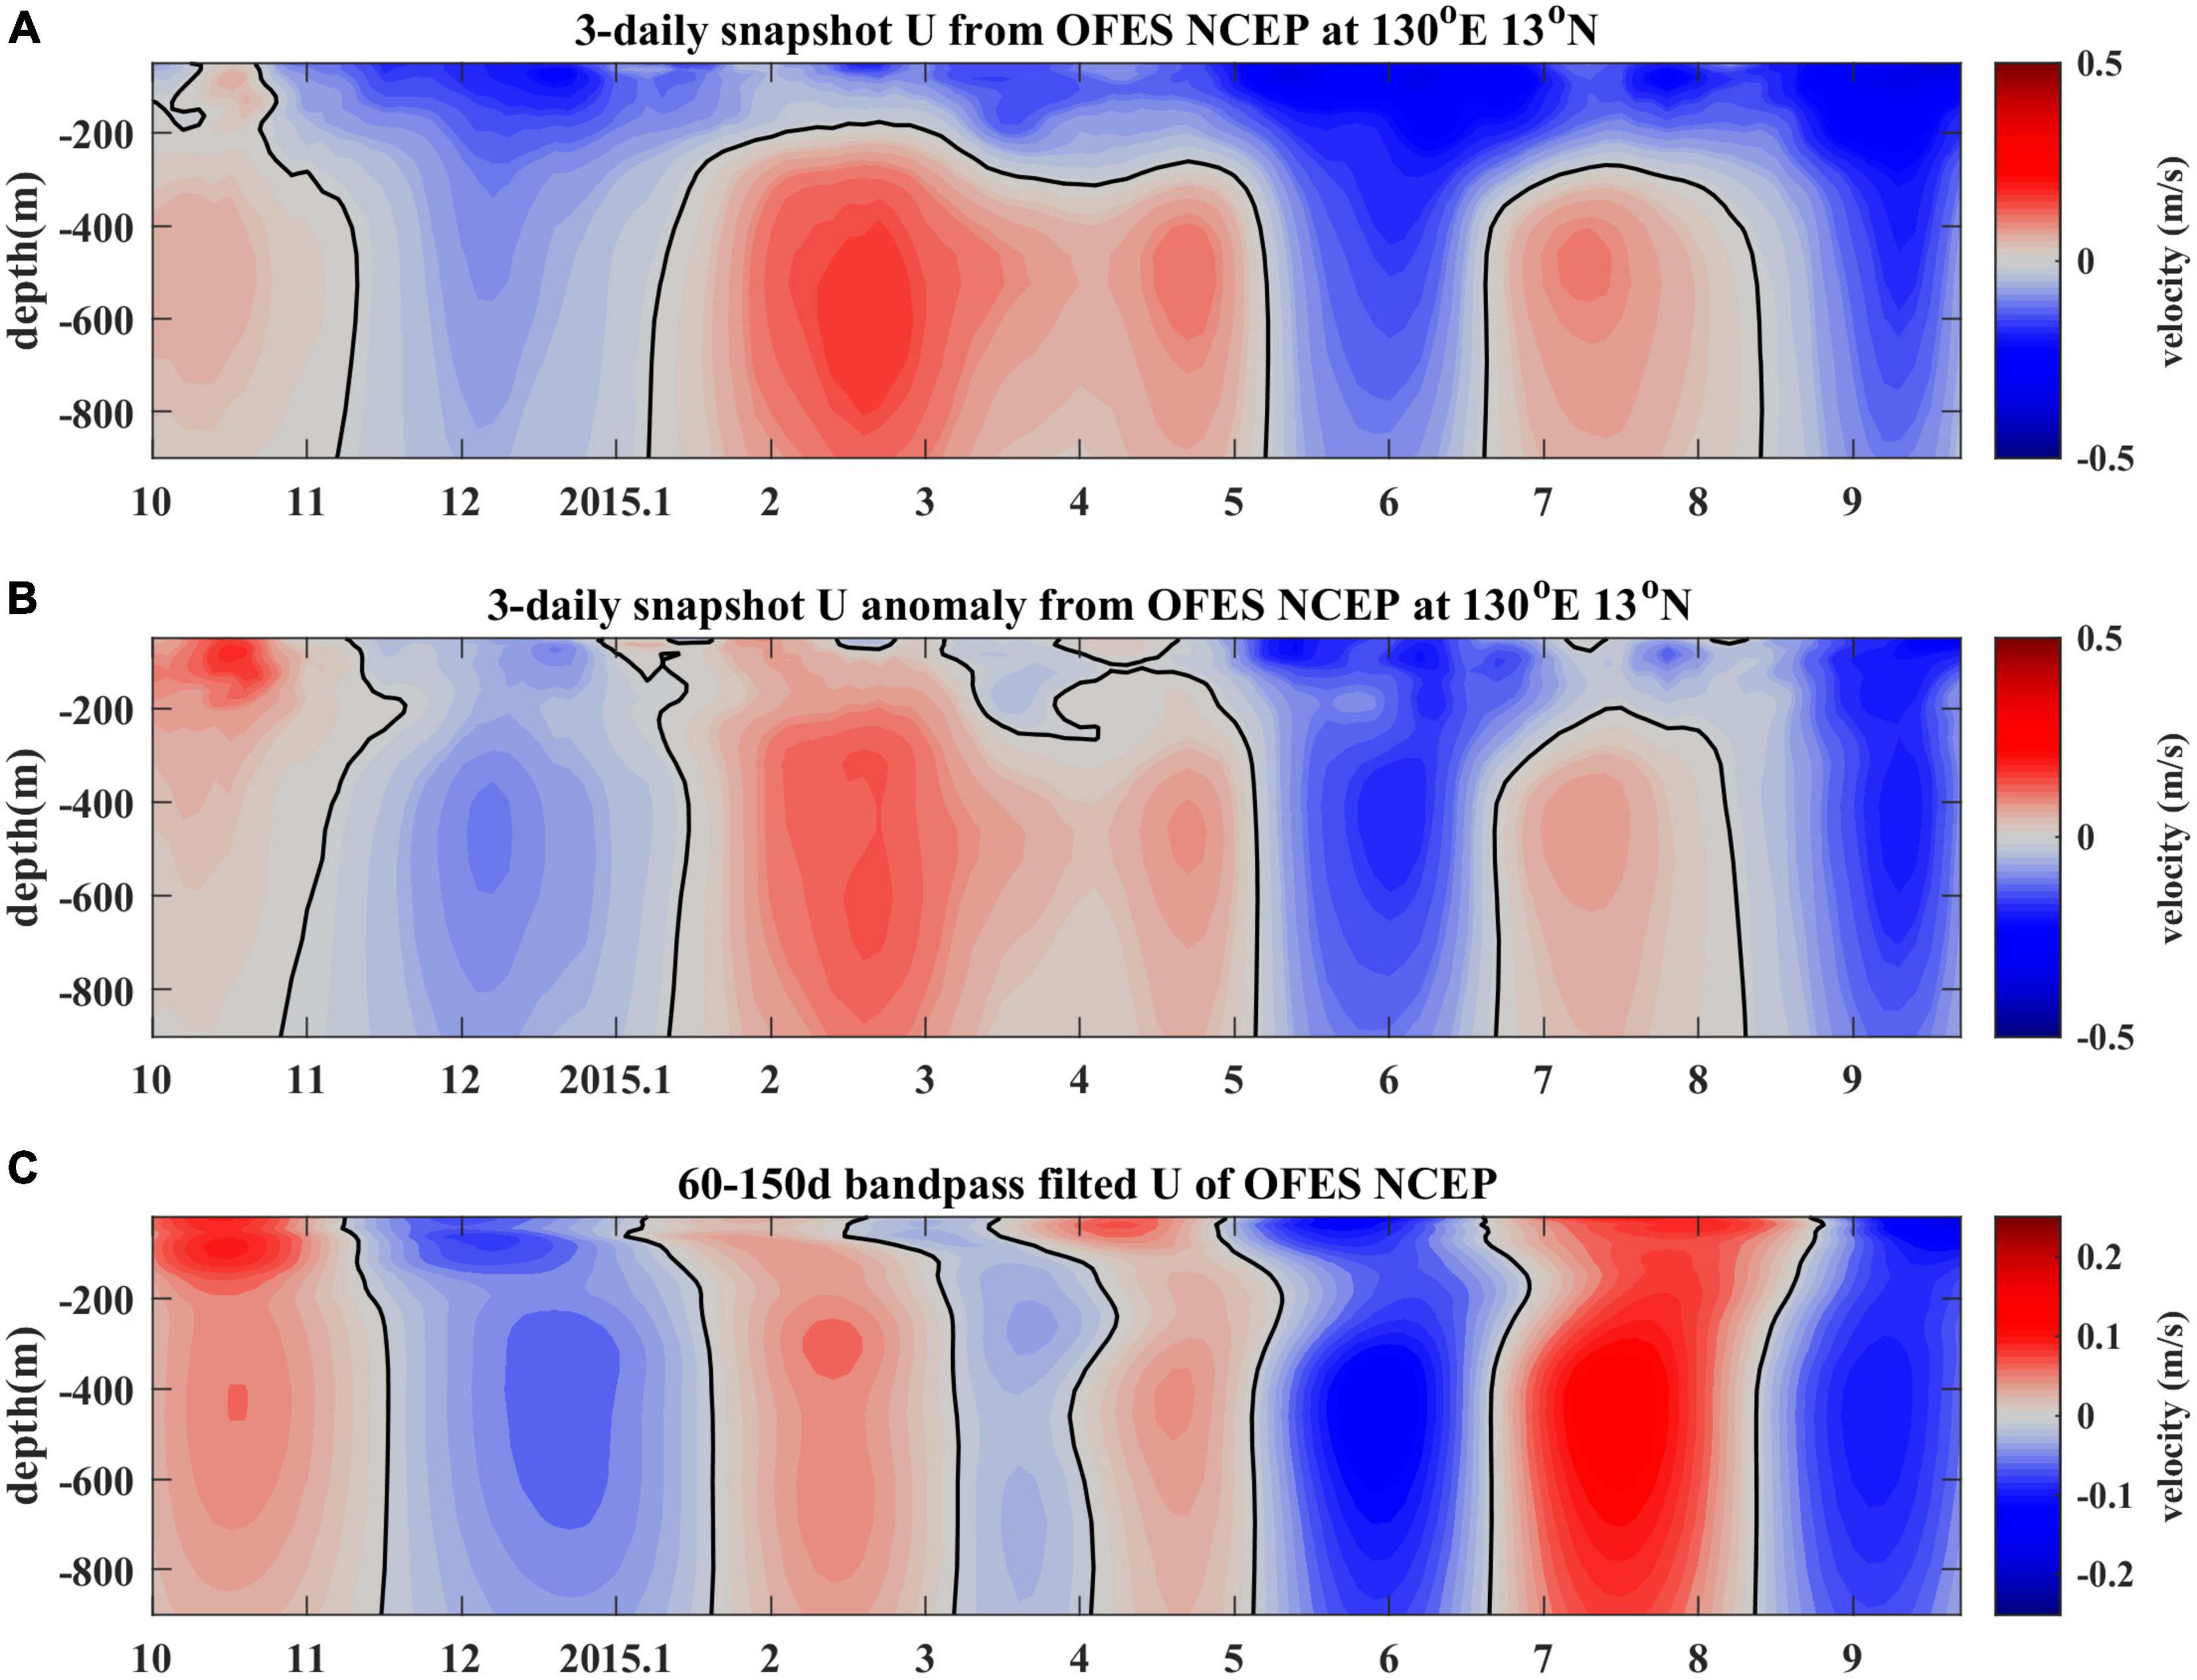
Figure 7. 3-daily snapshot velocities (A) and its anomalies (B) at 13°N, 130°E from OFES outputs. (C) is the same as (B) but after a 60–150 day band-pass filter.
Figure 6B shows the time-longitude plots of the subsurface zonal velocity anomalies averaged between 400 and 600 m at 13°N from the western boundary to 145°E in the WTP from OFES and a 60–150 days band-pass filter has been applied to the 3-daily zonal velocity anomalies to isolate the ISV signals. Once again, energetic ISV signals exist between the western boundary and 145°E, as shown by those well-defined positive and negative velocity anomalies appearing alternatively. The westward-propagating speed of those ISV signals is estimated at around −0.11m/s, which implies that the dominant wavelength of the subsurface-intensified ISV is around 628 km.
Origins of Two Flavors of Intraseasonal Variability
Mooring measurements reveal significant surface-intensified and subsurface-intensified ISVs with different periods and vertical structures at 13°N, 130°E, and they are also captured by the satellite altimetry and the OFES outputs. Although some of the ISV signals can be traced back to the east of 145°E, the contribution from local generation near 130°E seems non-negligible as well. To explore the origins of these two flavors of ISV, 7 years (2010–2016) of AVISO data and OFES outputs in the WTP were used to detect and track the surface and subsurface eddies, respectively, with the method mentioned in see section “Data and Method.”
Based on the eddy tracking results, the starting position of each eddy trajectory was presumed as the generation location of the eddy, and there are 2,769 surface eddies and 2,024 subsurface eddies in total generated in the study region (8°–20°N, 120°–160°E) during 2010–2016. Then, the number of generated eddies was counted in each 2°×2° box and shown in Figure 8. For the surface layer, lots of eddies are generated between the western boundary and 145°E (Figure 8A). Due to the beta effect, most of them would travel westward and persistently modulate the ISV of the surface current (Figure 6A). While the number of eddies generated in the subsurface layer is relatively less, and most of the eddies are generated near the western boundary and around 145°E (Figure 8B). Similarly, most of the subsurface eddies would translate westward and modulate the ISV of the subsurface current (Figure 6B).
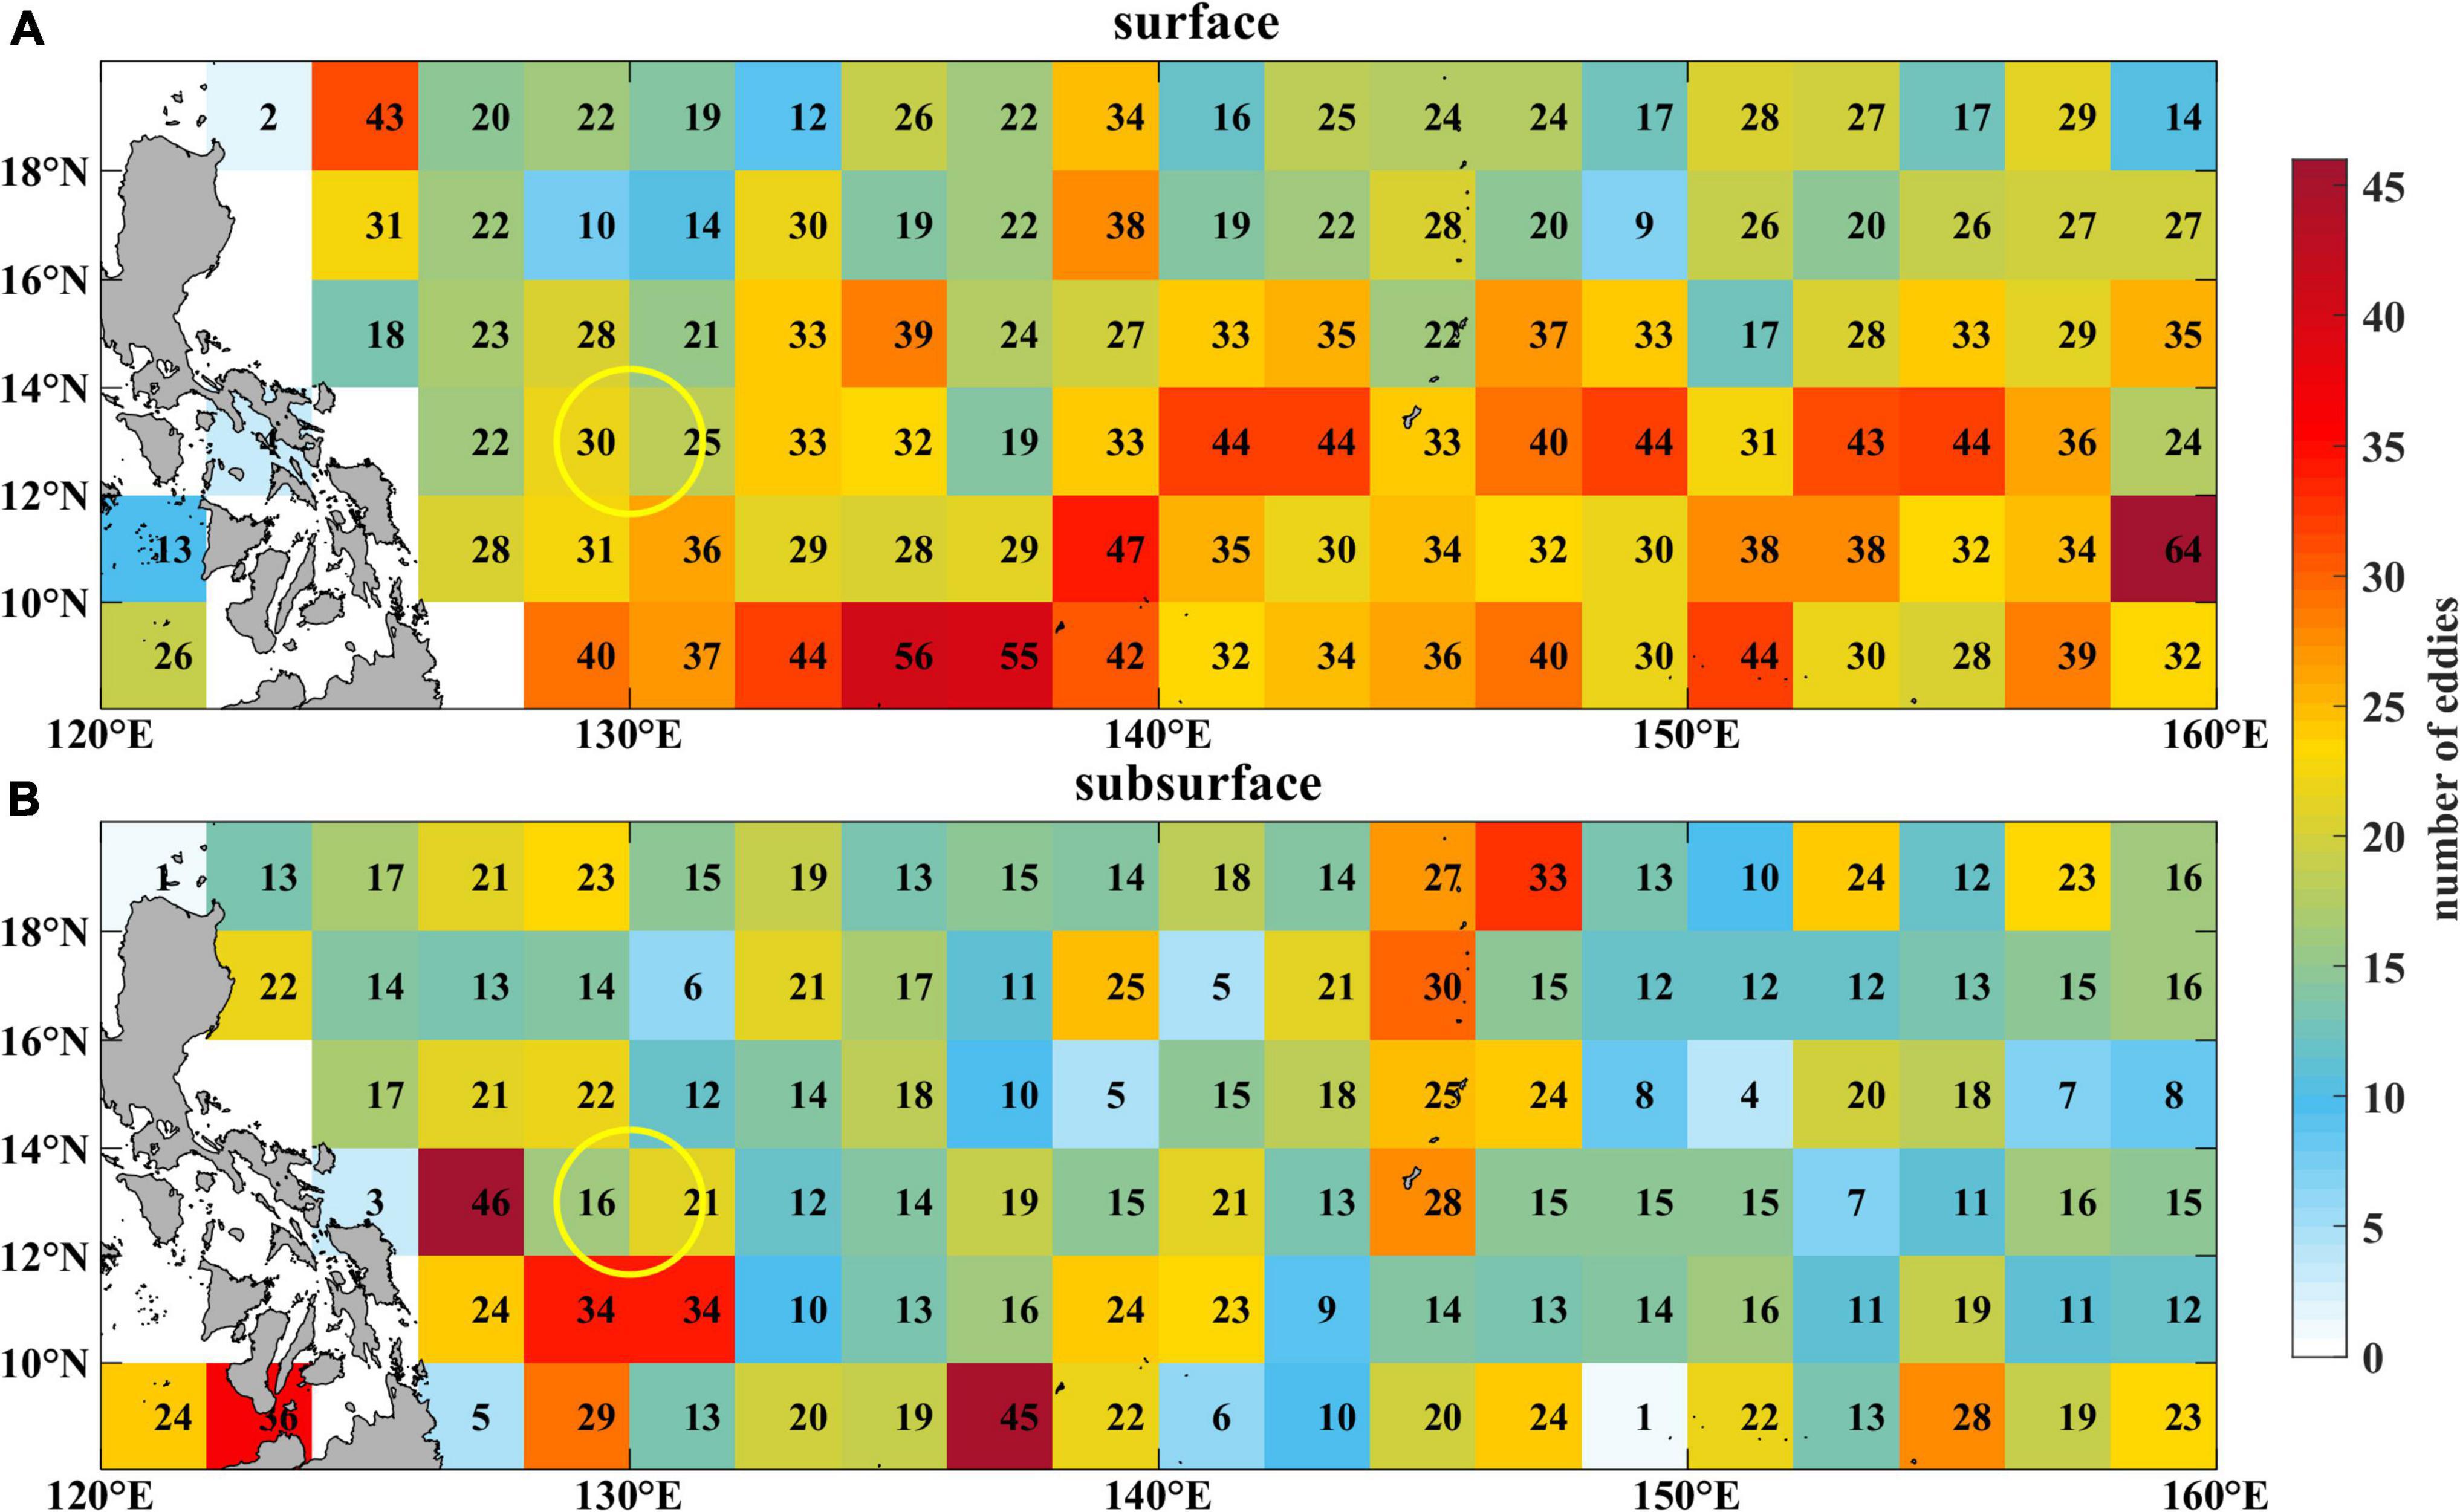
Figure 8. (A) Geographic distribution of the generation number of surface eddies in each 2 × 2 box based on eddy trajectory analysis using 6 years of AVISO data (2010–2016). (B) same as (A), but for subsurface eddies using OFES outputs in the same period. The yellow circle denotes the region centering at the mooring location with a radius of 150 km.
To determine the origin of the eddies that can affect the ISV of the currents at the mooring position (13°N, 130°E), we further tracked the eddy trajectories that can travel around the mooring position (within 150 km from the mooring location) in the surface and subsurface layer, respectively (Figures 9A,B). It indicates that most of the eddies which can affect the currents at the mooring position are generated locally between 130 and 135°E, for both the surface and subsurface layer. Although abundant eddies are generated around the east of 145°E, most of these eddies dissipate before reaching 130°E, as implied by Figures 8, 9. Therefore, the surface-intensified and subsurface-intensified ISVs unveiled by the ADCP measurements are induced primarily by the locally generated surface and subsurface eddies, respectively.
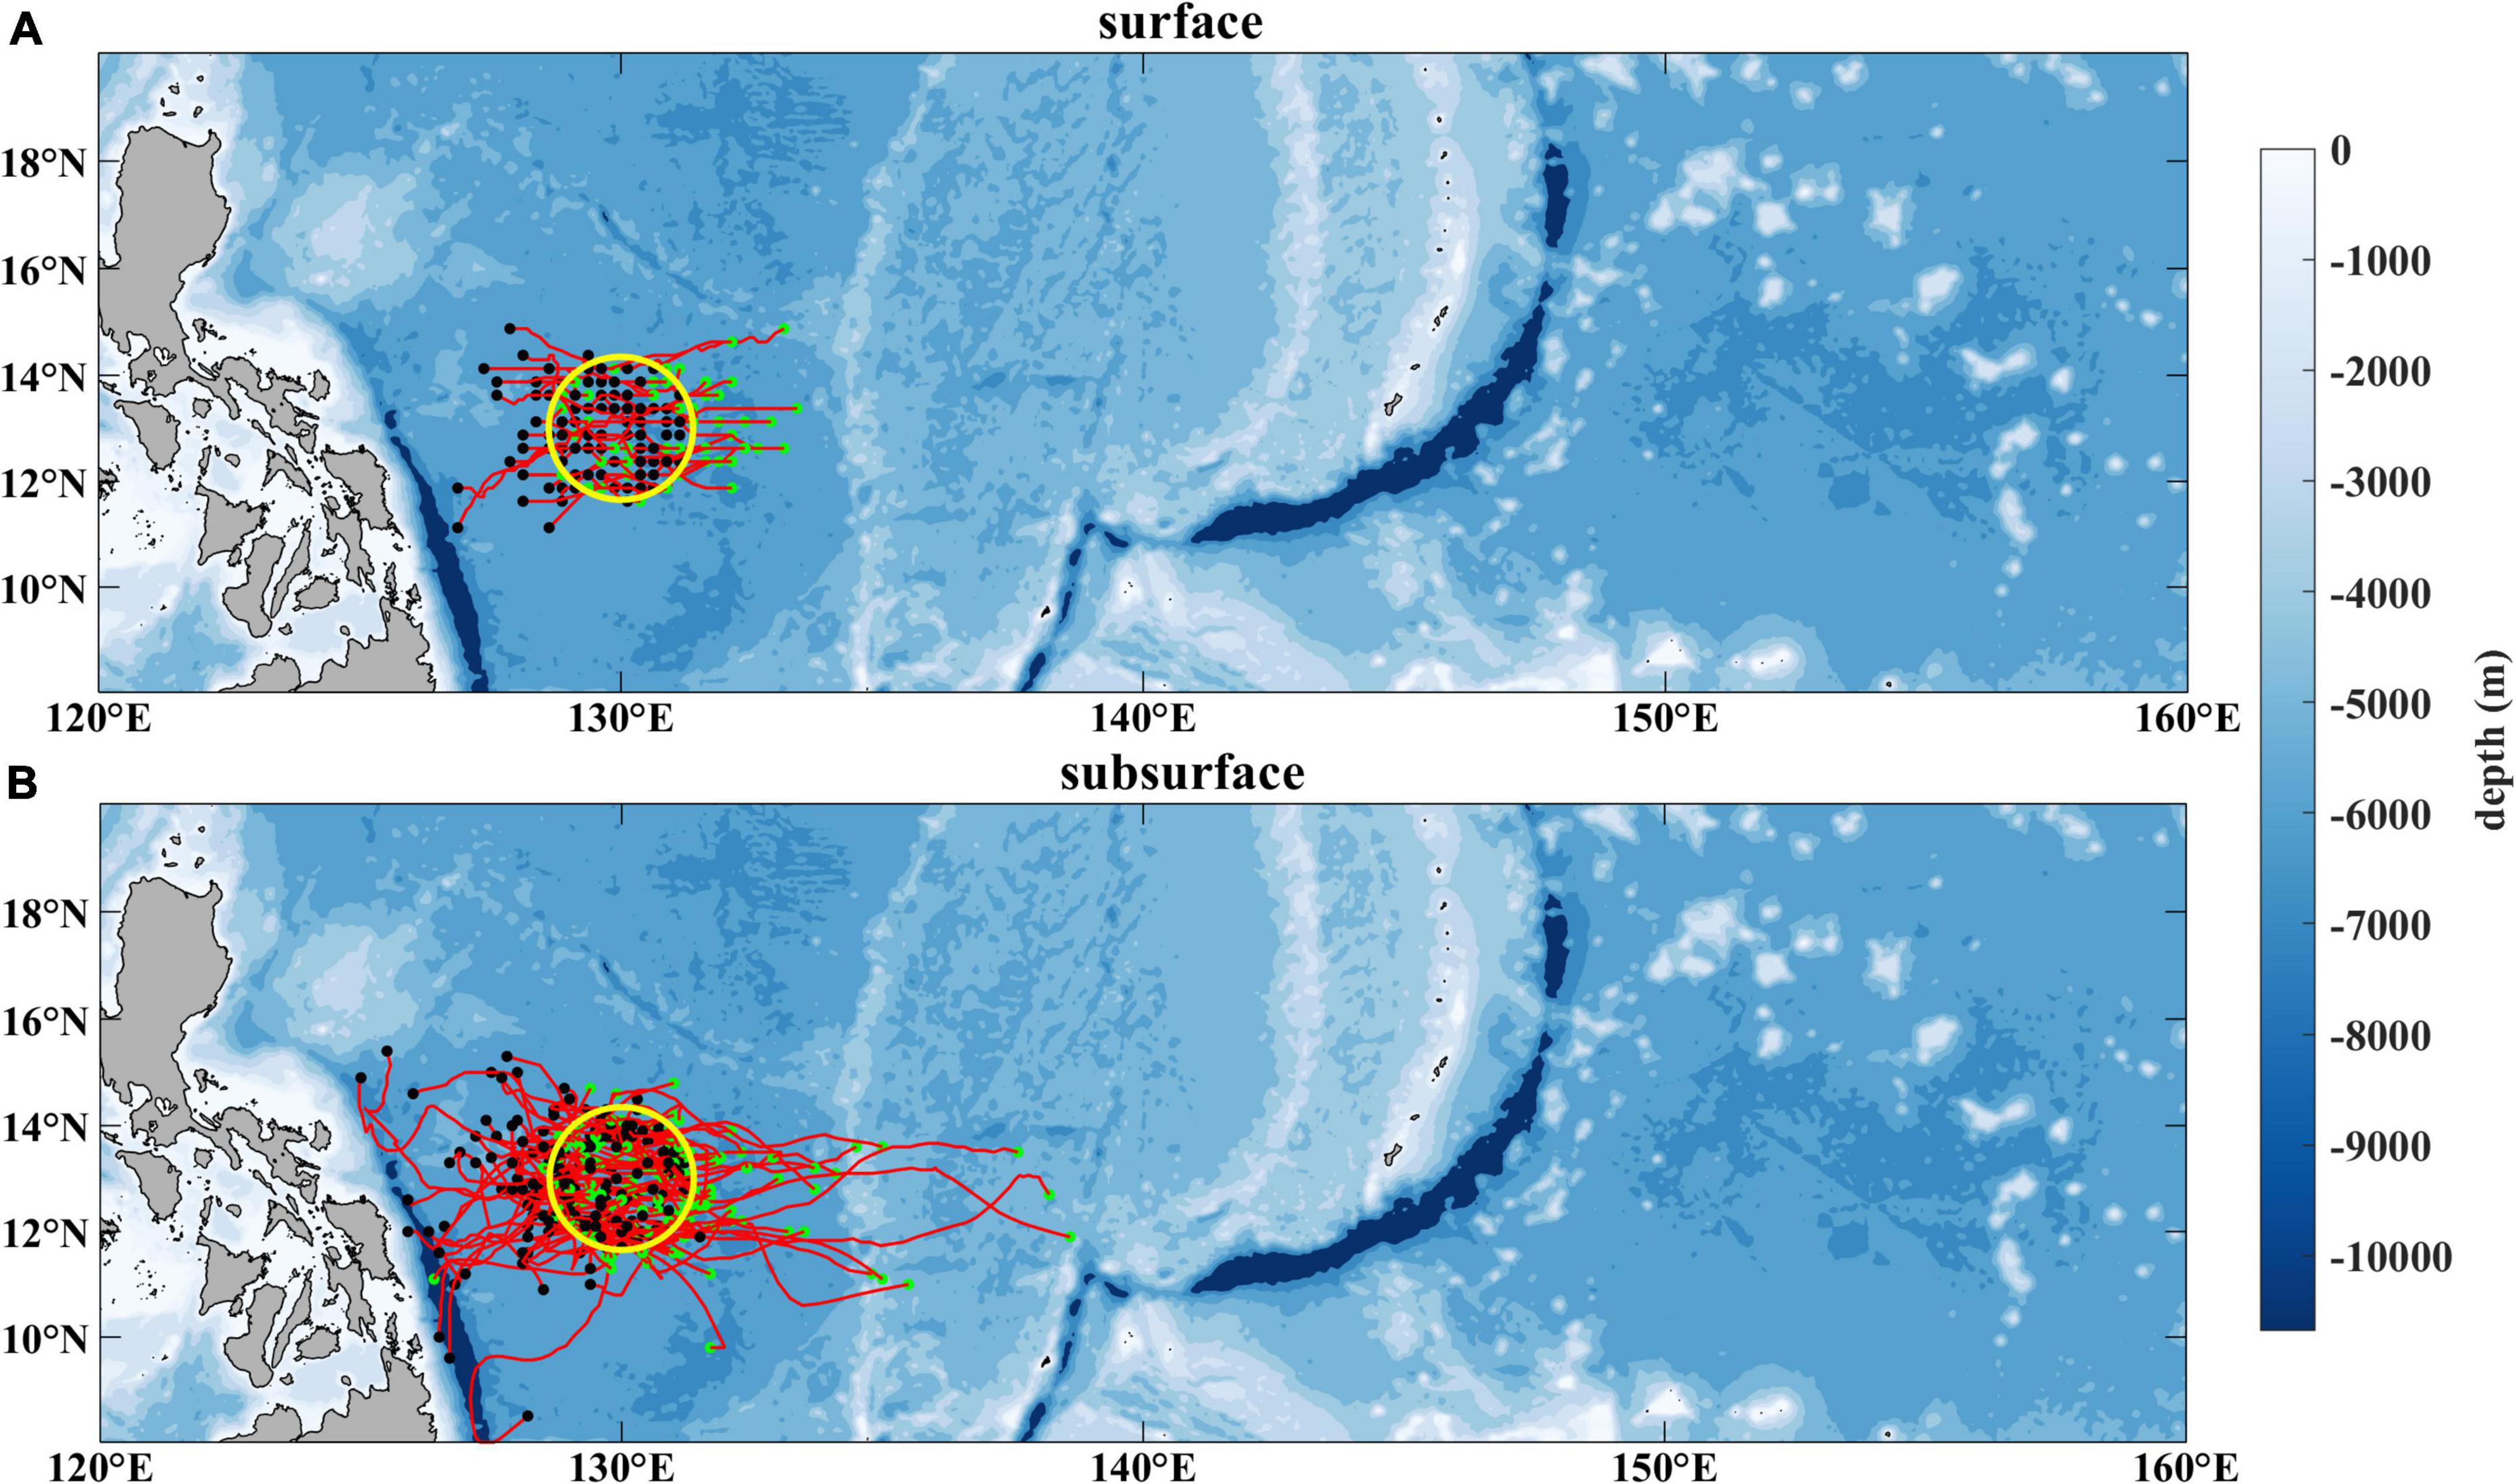
Figure 9. (A) Trajectories (red curves) of all the surface eddies that can affect the currents at 13°N, 130°E during 2010–2016 derived from the AVISO data. (B) same as (A), but for subsurface eddies derived from OFES outputs in the same period. The green dots denote the origins of those eddies and the black dots denote their destinations. The yellow circle denotes the region centering at the mooring location with a radius of 150 km.
Generation of Two Flavors of Intraseasonal Variability
Velocity Shear of the Background Flow
Different frequencies and vertical structures between those two flavors of ISV or eddy as revealed by both observations and model outputs imply that they may have different generation mechanisms. The generation of the meso-scale eddy is usually attributed to the oceanic internal instability (e.g., Chelton et al., 1998; Qiu, 1999). Previous studies have emphasized the role of barotropic and baroclinic instability induced by horizontal and vertical shear of the background currents in generating the surface and subsurface eddies (e.g., Qiu and Chen, 2004; Dutrieux, 2009; Qiu et al., 2009). Therefore, we checked the velocity shear of the currents near the mooring position. Figure 10 shows the vertical profile of the zonal mean flow derived from the ADCP measurements at 13°N, 130°E, as well as the horizontal profile of the zonal mean surface flow along 130°E, derived from AVISO data during 2010–2016. The NEC characterized by strong westward flow varies gradually with depth within the upper 400 m and its vertical shear (the difference between the maximum and minimum zonal velocities in the vertical) is around 0.23m/s, while the eastward subsurface flow associated with the NEUC, ranging from about 400 to 800 m, is relatively stable with depth and its vertical shear is around 0.04m/s in a depth interval of 300 m, suggesting that the significant vertical shear of velocity is primarily in the upper 400 m (Figure 10A). In contrast, the horizontal shear (the difference between the maximum and minimum zonal velocities in the horizontal) of the surface zonal mean flow averaged between 128° and 132°E is around 0.17m/s in a horizontal distance of 500 km, which is relatively weaker than the vertical shear of the upper 400 m (Figure 10B). Considering that the oceanic internal instability induced by velocity shear is prone to generate meso-scale eddies or ISV, the vertical shear of the zonal currents in the NEC region seems more important than its horizontal shear in the generation of the surface-intensified ISV.
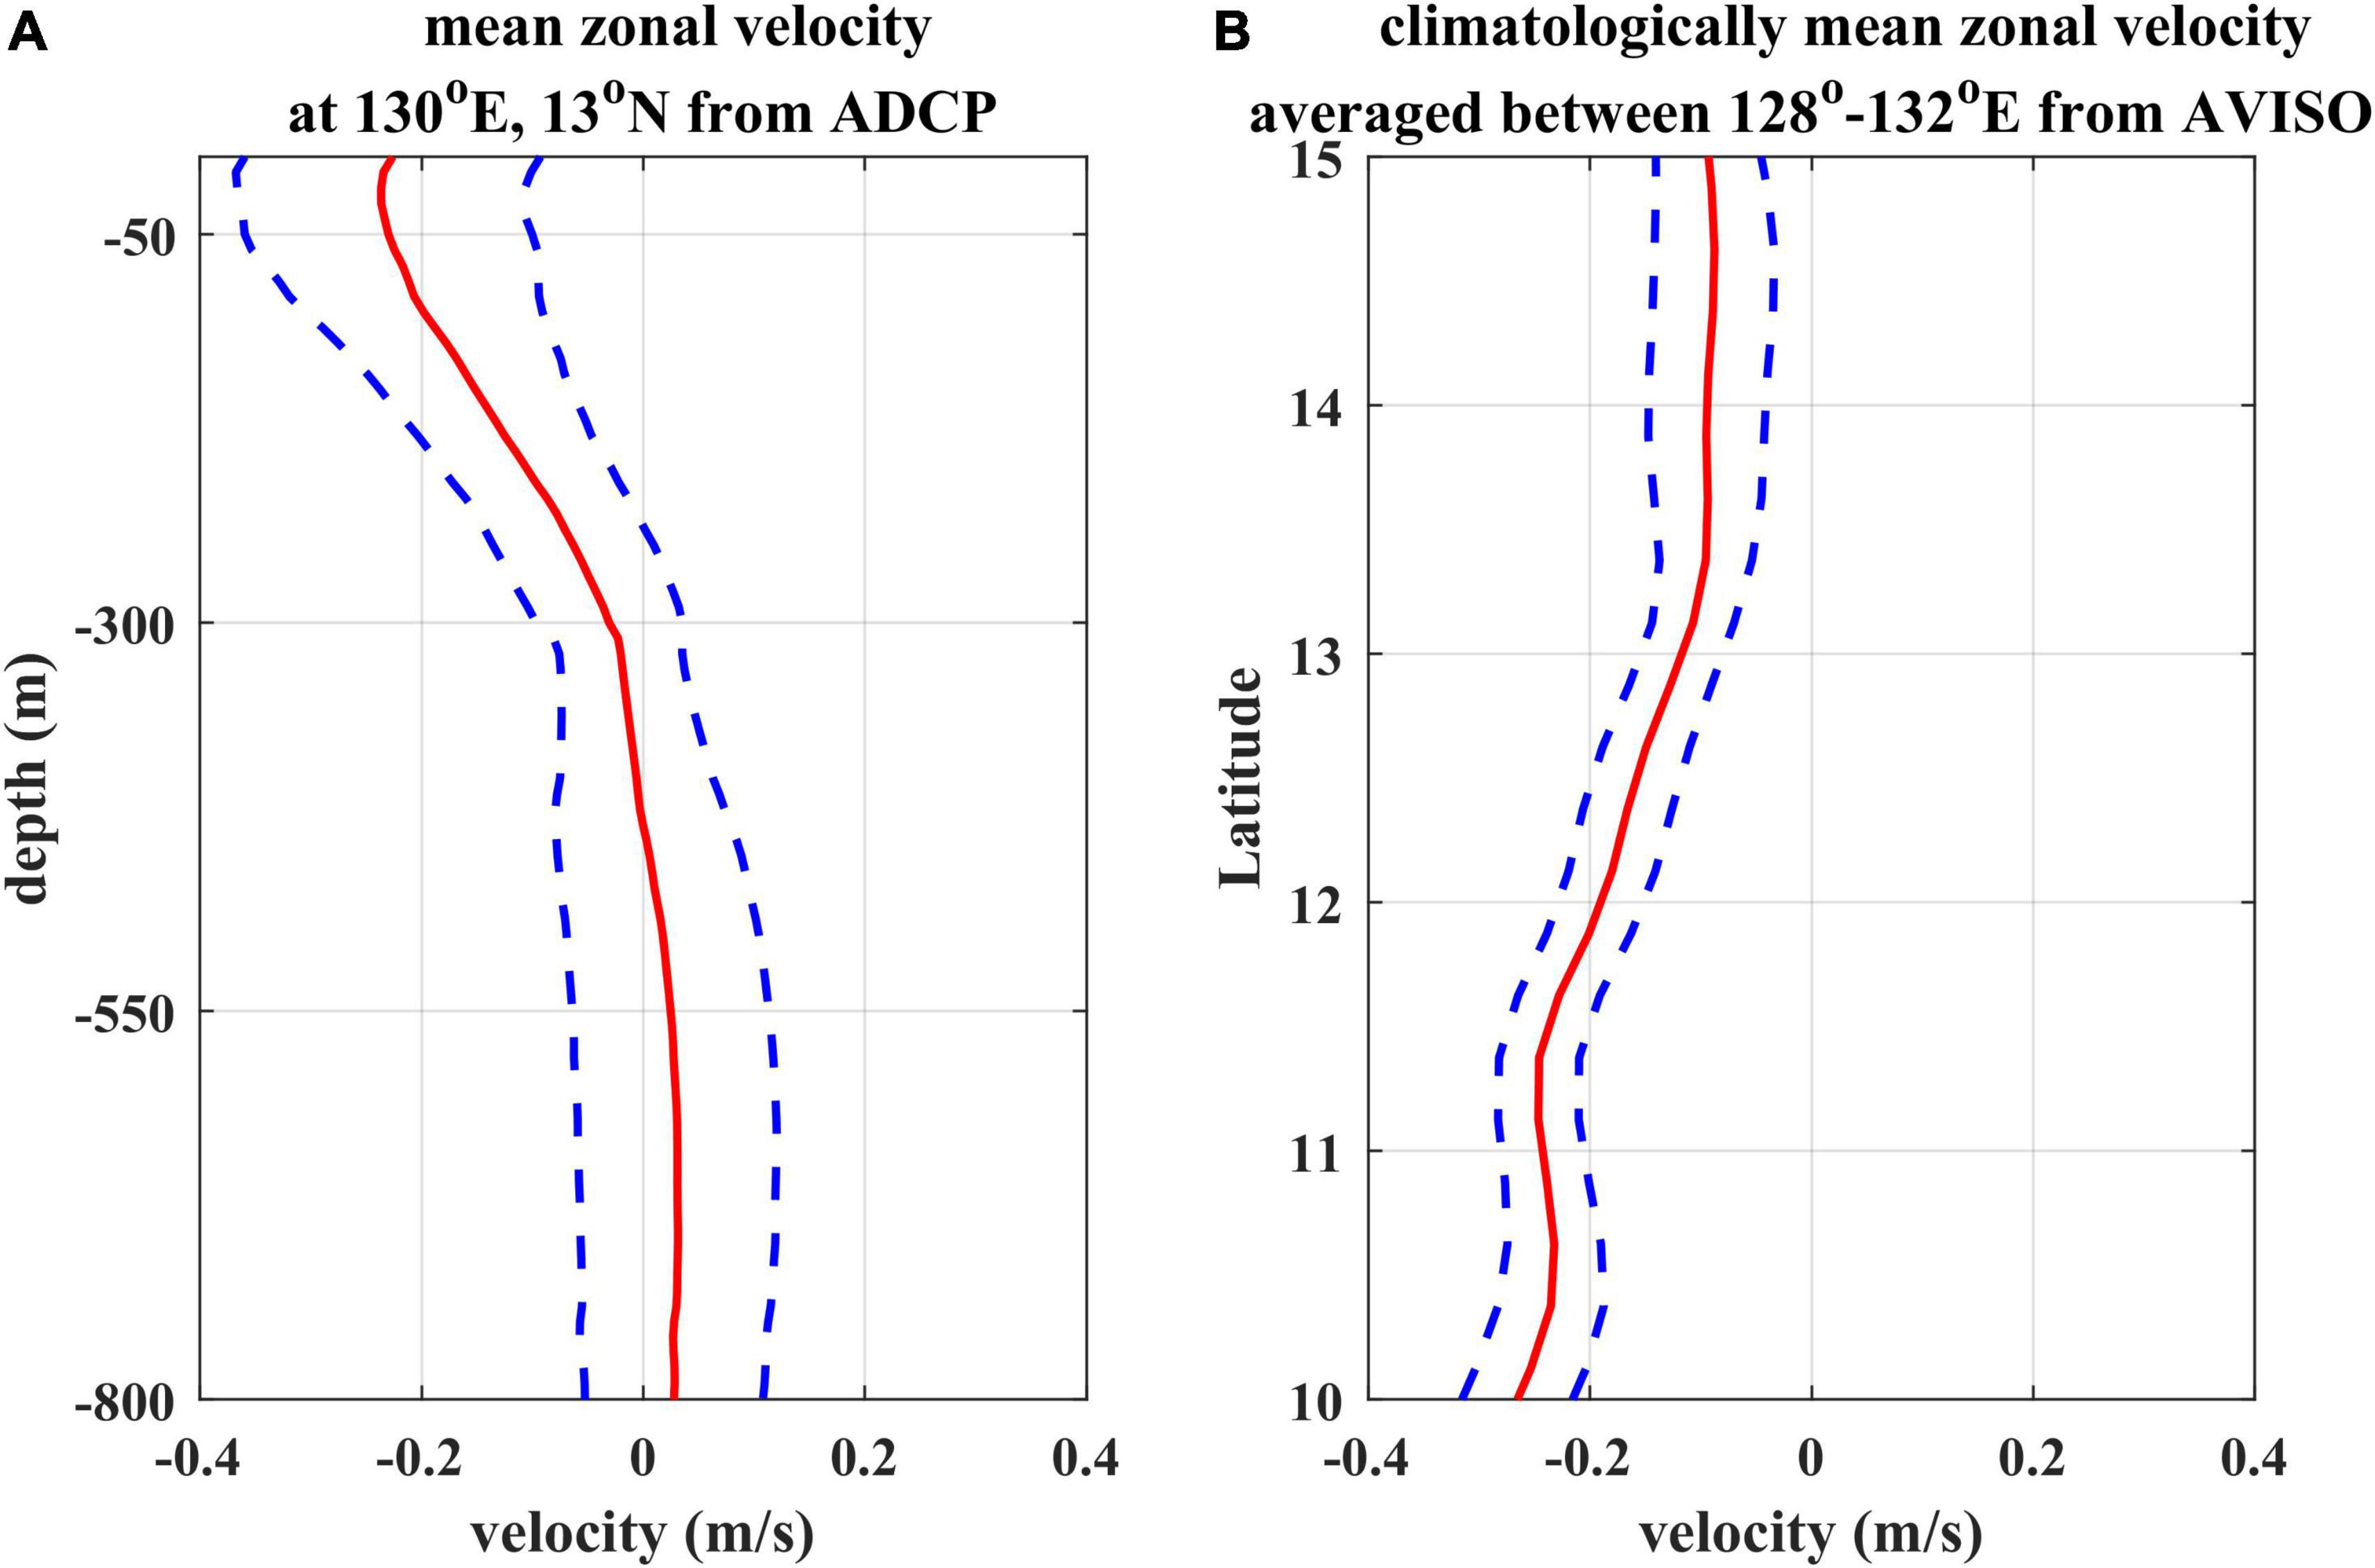
Figure 10. (A) Mean zonal velocity profile (red) above 800 m averaged from the mooring ADCP measurements with the standard deviation (blue), and (B) Mean zonal geostrophic velocity averaged between 128° and 132°E from 10° to 15°N derived by satellite altimetry with the standard deviation (blue).
In terms of the subsurface currents, ADCP measurements suggest the vertical shear below 400 m is weak (Figure 10A). To diagnose the horizontal shear of subsurface currents in this region, we plotted the time series of subsurface zonal velocity (400–600 m) averaged between 128°–132°E during 2010–2016 (Figure 11). To focus on the low-frequency variation of the background currents, the 1-year moving average of the zonal velocity was calculated to remove the small-scale and meso-scale signals and seasonal cycle. The filtered results exhibit significant meridional shear between 10° and 15°N during 2010. Therefore, we hypothesize that the generation of the subsurface-intensified eddies or ISV may be related to the barotropic instability induced or enhanced by the intensified meridional shear of the subsurface zonal currents.
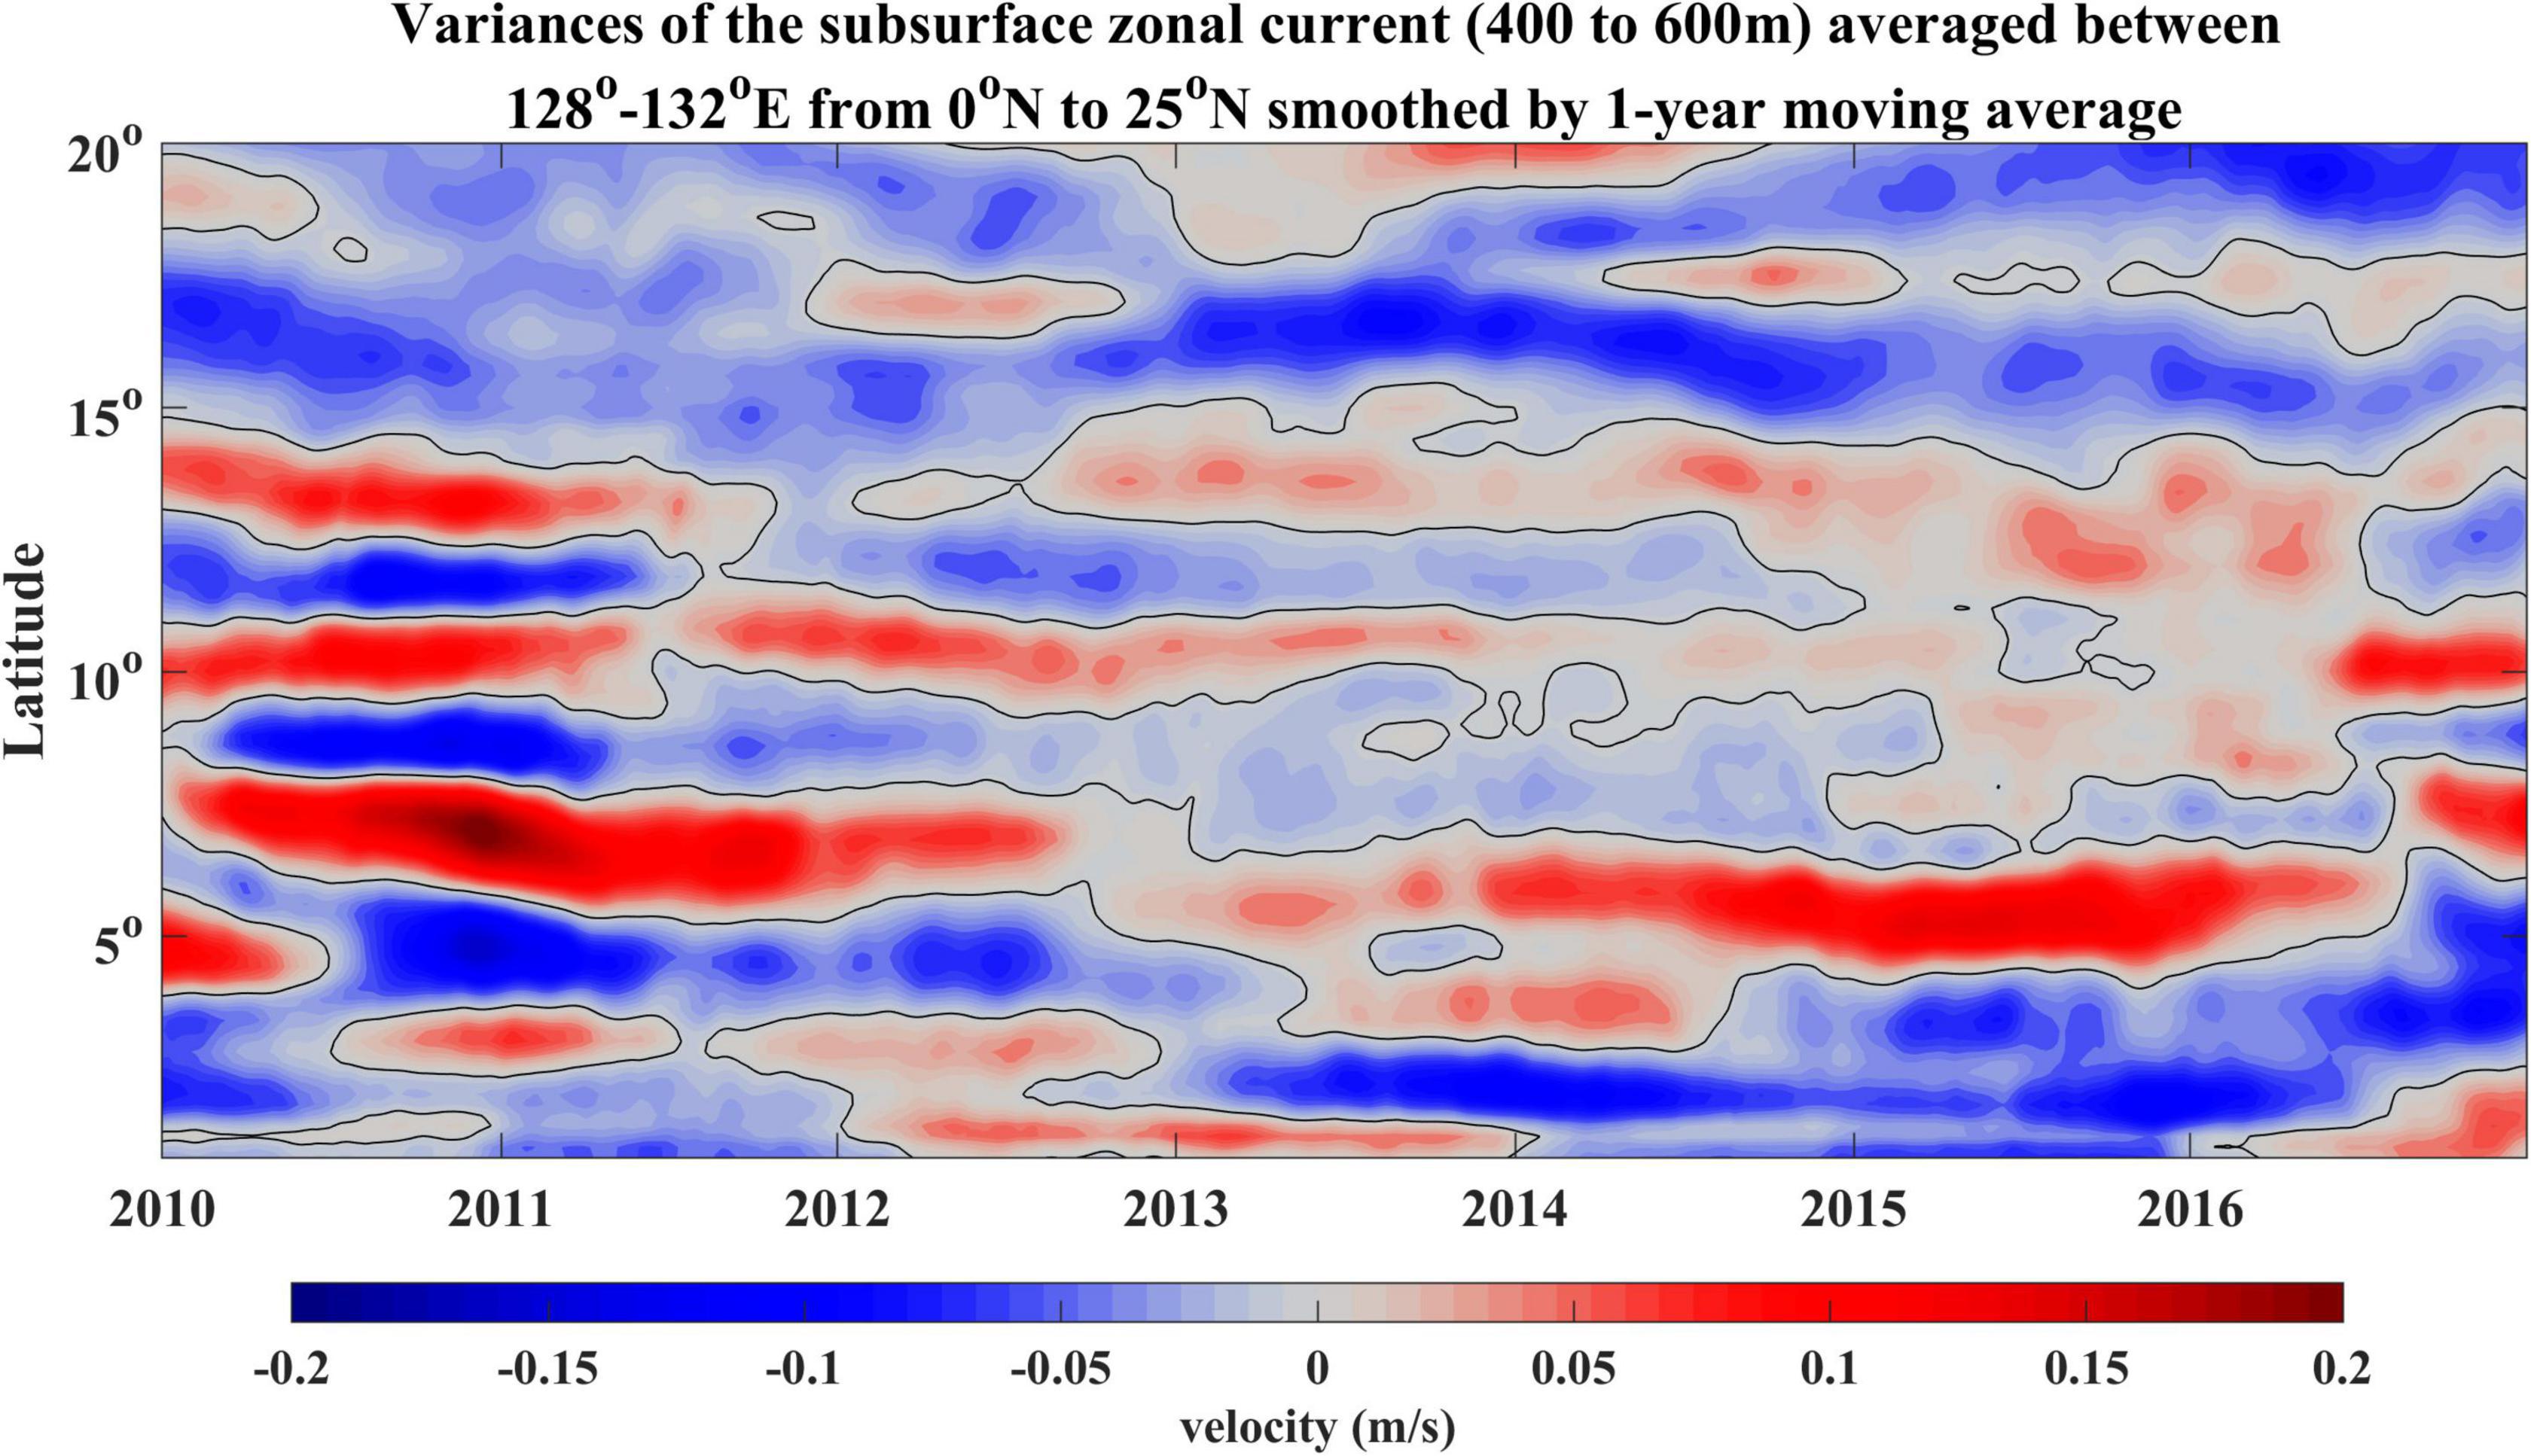
Figure 11. Time-latitude plot of the subsurface zonal velocity (400–600 m) averaged between 128° and 132°E during 2010–2016 from OFES outputs smoothed by 1-year moving average.
Energy Analysis
To evaluate the contribution of barotropic and baroclinic instability in generating the meso-scale eddies and modulating the ISV of surface and subsurface currents, the local barotropic energy conversion rate (BTR) and baroclinic energy conversion rate (BCR) in the surface and subsurface layer are calculated using OFES outputs during 2010–2016 (Figures 12A,B). It suggests that baroclinic instability dominates in the surface layer between the western boundary and 145°E, which is consistent with previous studies (e.g., Qiu, 1999; Liu et al., 2003; Qiu et al., 2015). Based on the statistical analysis of eddy tracking results (Figure 9), most of the ISV signals near 13°N, 130°E are related to locally generated eddies. Therefore, a local box centering at 13°N, 130°E with a width of 4° was chosen to compare the relative contribution of barotropic instability and baroclinic instability to the ISV. In the surface layer, the regional mean BTR and BCR in the box are 7.9×10⁻¹⁰m2⋅s−3 and 1.4×10⁻⁹m2⋅s−3, respectively, indicating the dominant role of local baroclinic instability in the generation of the surface-intensified ISV. In the subsurface layer, both the BTR (−1.5×10⁻¹¹m2⋅s−3) and BCR (6.7×10⁻¹⁰ m2⋅s−3) reduce remarkably compared with that in the surface layer (not shown). As mentioned above, the horizontal shear of the subsurface current enhanced significantly during 2010, which reminds us to check the BTR and BCR this year (Figures 12C,D). The regional mean BTR and BCR in the box are 4.5×10⁻¹⁰ m2⋅s−3 and 2.3×10⁻¹⁰ m2⋅s−3, respectively. The barotropic instability was enhanced due to the increased horizontal shear of the current. It suggests that the subsurface-intensified ISV unveiled by the mooring measurements is probably related to the enhanced local barotropic instability of the subsurface currents.
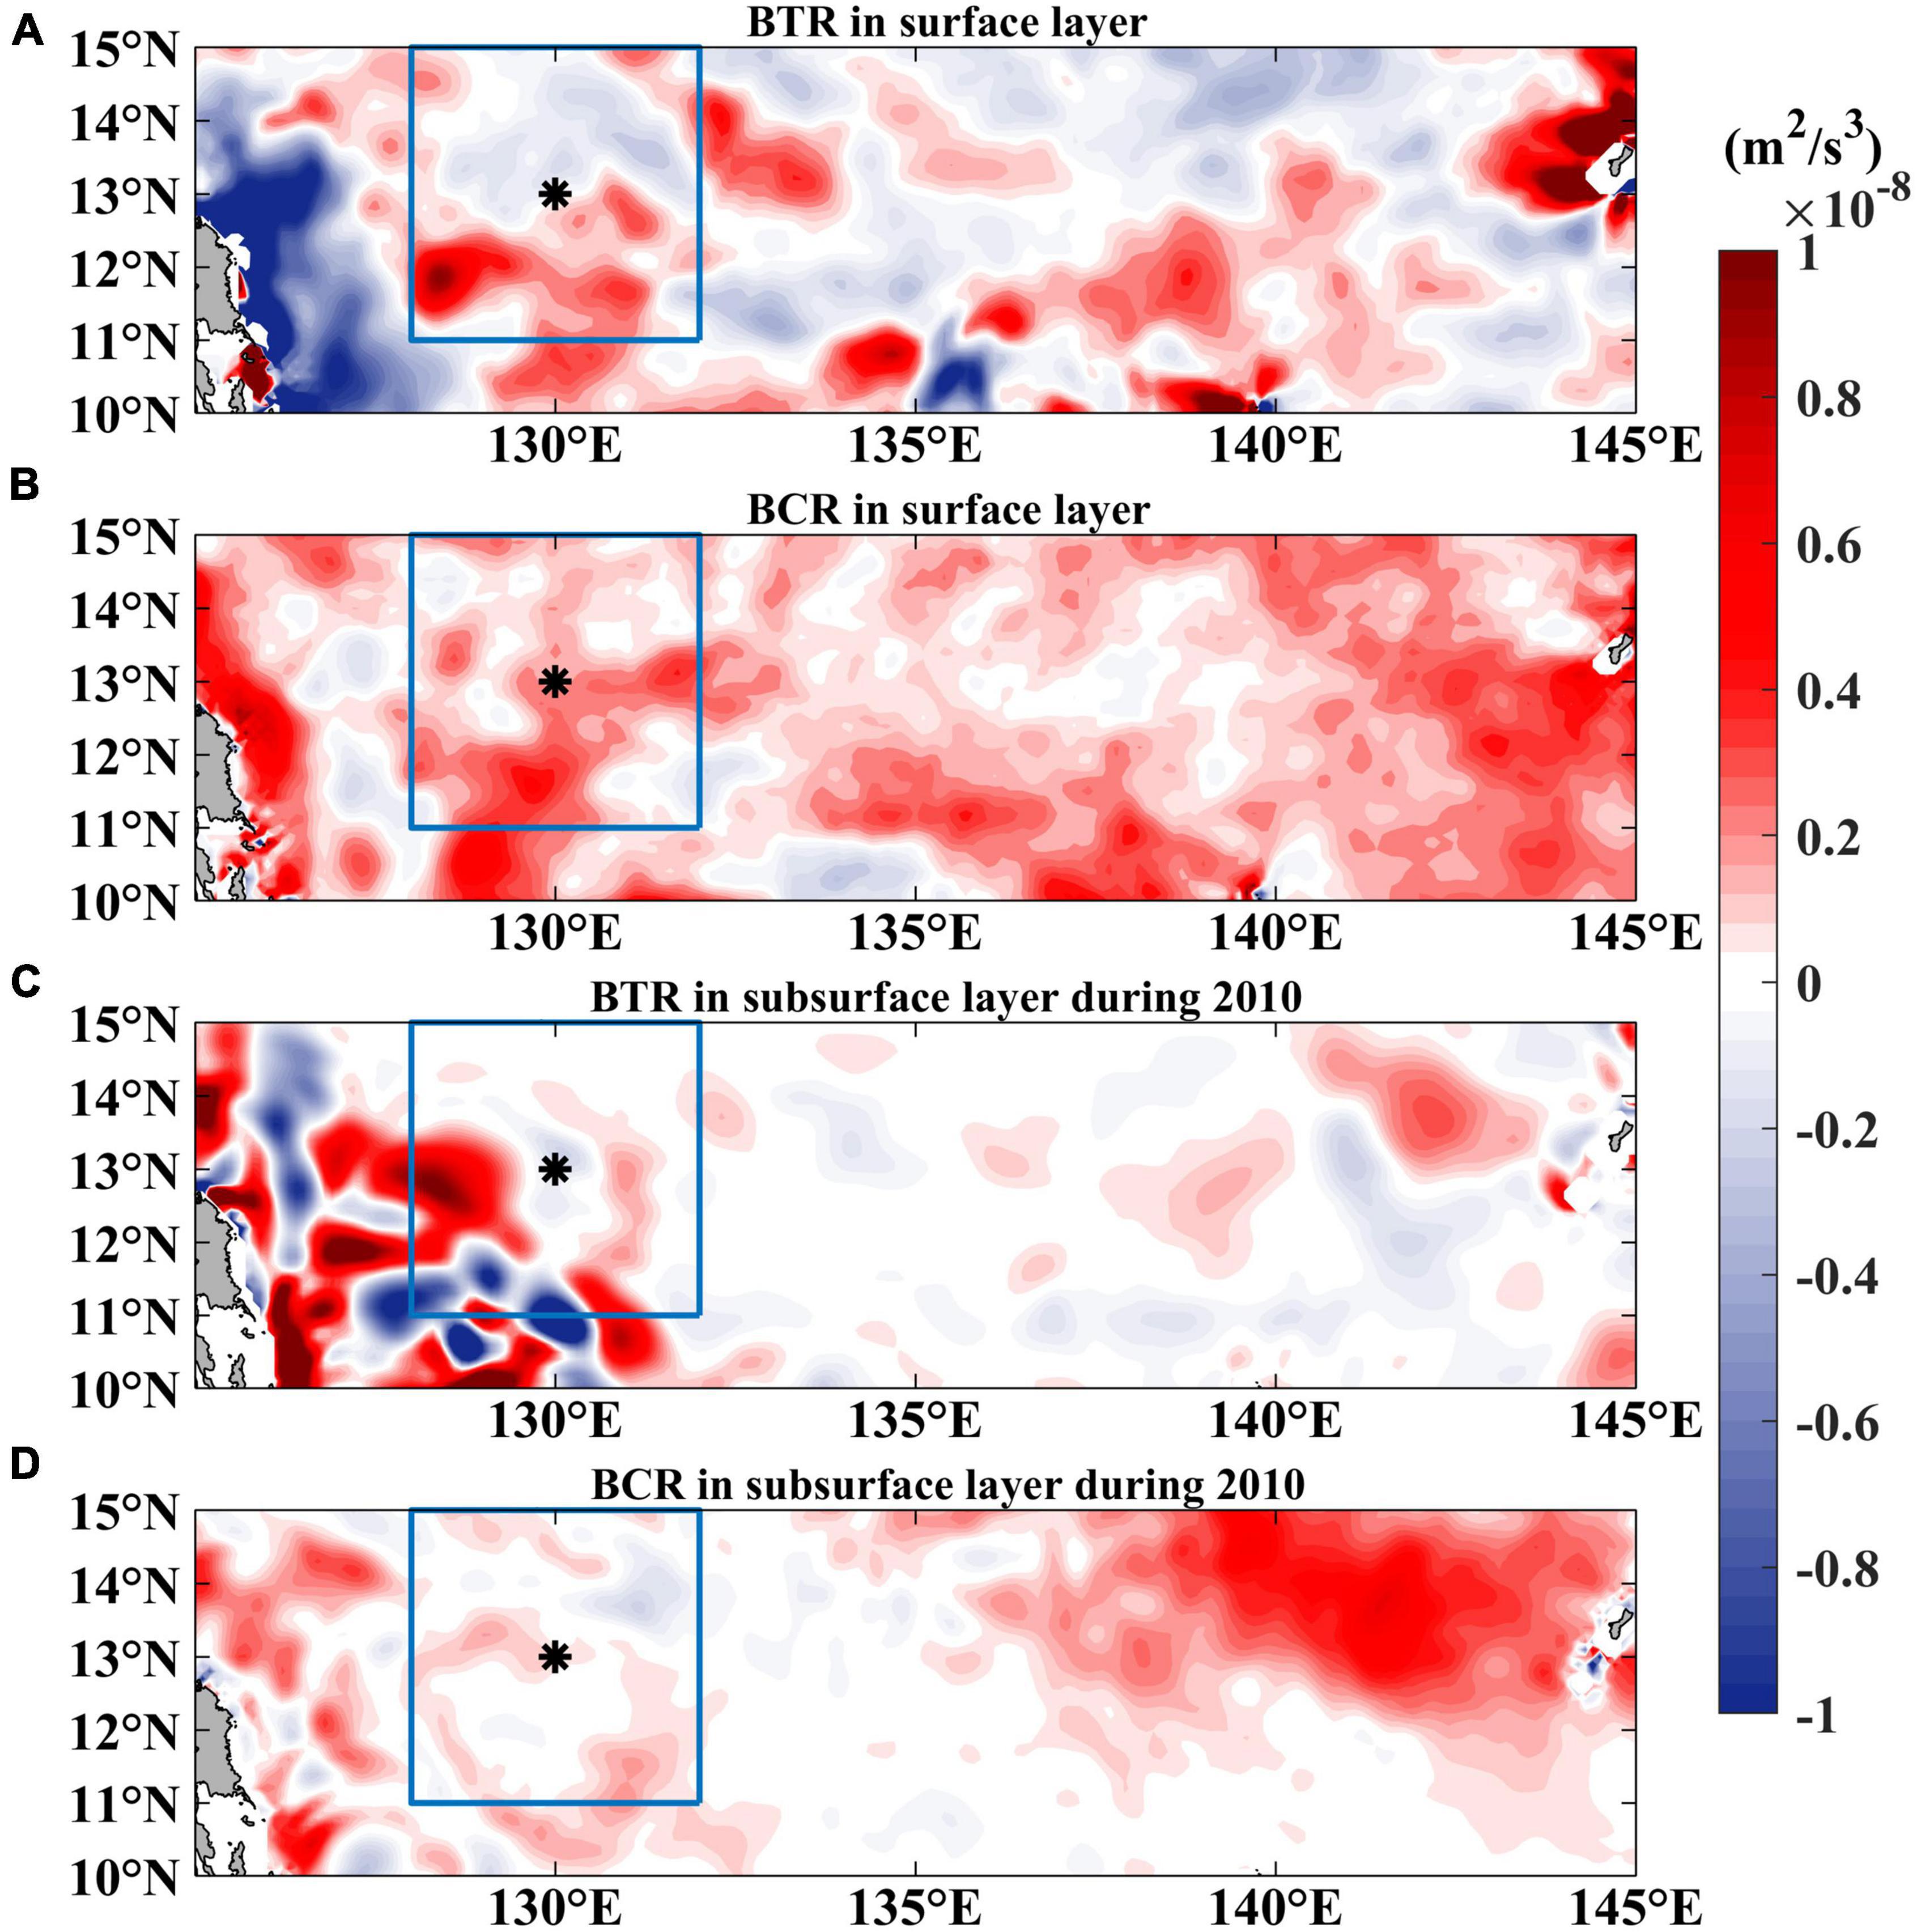
Figure 12. Climatological mean barotropic (A) and baroclinic (B) energy conversion rate in the surface layer (0–150 m) derived from OFES outputs during 2010–2016. (C,D) are the same as (A,B) but for the subsurface layer (400–600 m) during 2010.
To further investigate the role of baroclinic and barotropic instability in the generation of those two different flavors of ISV, we will employ a 2.5-layer reduced gravity model and a 1.5-layer reduced gravity model as our theoretical framework, analyze the growth of the unstable waves, and estimate the properties of the most unstable wave in the baroclinic and barotropic instability processes.
Dynamics of Surface-Intensified Intraseasonal Variability
Previous studies suggested that baroclinic instability induced by the vertical shear of the complex currents in the WTP is responsible for the excitation of traditional surface-intensified ISV signals (e.g., Qiu, 1999; Liu et al., 2003; Qiu et al., 2014). To investigate the contribution of baroclinic instability in generating this type of ISV quantitatively, we adopted a 2.5-layer linearized reduced gravity model, which assumed that the ocean is composed of two active upper layers and an inert, infinitely deep abyssal layer. The general framework of this model is similar to the one used by past studies (e.g., Qiu, 1999; Liu et al., 2003; Qiu et al., 2014; Wang et al., 2020) to explore the dynamics of the seasonal eddy field modulation in the WTP. Under the quasi-geostrophic approximation, the governing equations of the perturbation potential vorticity in the two active layers are given as follow:
where qn is the perturbation potential vorticity, ϕn is the perturbation stream function, and Πn is the mean potential vorticity in the n-th layer (n = 1 and 2).
The mean flow Un in the n-th layer is assumed meridionally uniform, in order to eliminate the influence of the barotropic instability according to our hypothesis in see section “Results.” Considering Un to be constant, the perturbation stream function and the meridional gradient of Πn in the 2.5-layer reduced gravity model can be expressed by
where
and
In the above equations, β is the meridional gradient of the Coriolis parameter, f0 is the Coriolis parameter at the reference latitude, ∇2 is the horizontal Laplacian operator, ρ0 denotes the reference density, ρn and Hn represents the density and mean thickness of the n-th layer, and λ is the internal Rossby radius of deformation.
By neglecting the meridional perturbations and seeking the normal mode solution which is described by the following form:
and substituting them into Eq. 3 and using Eqs. 4–7, we get
where k is the zonal wavenumber. Requiring non-trivial solutions for An leads to the following quadratic equation for the complex phase speed crici:
where
and
The complex phase speed c consists of the real part cr representing the phase speed and the imaginary part ci, and the growth rate kci represents the stability of the system. If kci0, the system is unstable; otherwise, the system is stable.
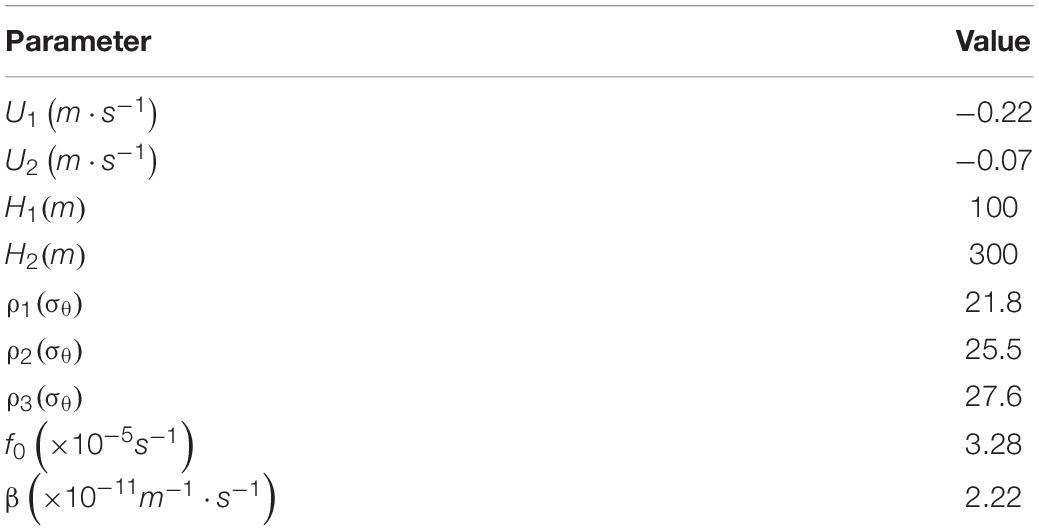
In Table 1, we make a list of the parameters appropriate for the upper ocean system at 13°N, 130°E. Based on the band-pass filter results mentioned in see section “Results” (Figure 4), the core of surface-intensified ISV is mainly situated above 100 m (Figure 5). Hence, we consider the upper 400 m ocean as the vertical shear system of the 2.5-layer model, with a 100 m-thick first layer and a 300 m-thick second layer. The mean zonal velocities of the first layer U1 and the second layer U2 are derived from the ADCP measurements. The reference latitude for f0 and β is taken as 13°N and the potential densities are calculated from the World Ocean Atlas 2018 (WOA18) date set at the mooring position.
Figure 13 shows the phase speed cr and the growth rates kci plotted as a function of wavenumber k using the parameters listed in Table 1. The most unstable mode is obtained when kmax = 1.51×10⁻³cpkm or when the perturbation wavelength is 661 km (Figure 13B), and its period is close to the surface-intensified ISV revealed by ADCP measurement. The phase speed of the most unstable wave is about −0.15m/s (Figure 13A). The results derived from the 2.5-layer model agree well with the dominant propagating properties of the ISV signals observed by the satellite altimeter at the mooring station. In addition, the thermocline along 130°E deepens with the increasing latitude, which implies that the thickness of the 1st and 2nd layers of the 2.5-layer model should vary with the thermocline depth. Therefore, we checked the dependence of the growth rate of the baroclinic instability on the varying layer thickness (not shown). The results indicate that the varying H1 and H2 do not alter the results of the baroclinic instability. Generally speaking, the surface-intensified ISV observed by the ADCP mooring and satellite altimeter is suggested to be induced by baroclinic instability of the NEC system. Using the same 2.5-layer model, previous studies have proposed that the NEC in the zonal band between 10° and 18°N is baroclinic stable on basin-scale, based on a qualitative stability analysis by dividing the upper 300 m ocean above the main thermocline into two sublayers of 150 m-thick (e.g., Qiu, 1999; Wang et al., 2020). It is worth noting that the surface-intensified ISV signals in the NEC region unveiled by the mooring measurement at 130°E concentrate in the upper 100 m. Consequently, the simplification in this study is different from theirs, which leads to the conclusion in this study that the surface-intensified ISV signals derived from mooring measurement are related to the baroclinic instability of the vertically sheared upper part of the NEC. It agrees with the conclusion proposed by Liu et al. (2003).
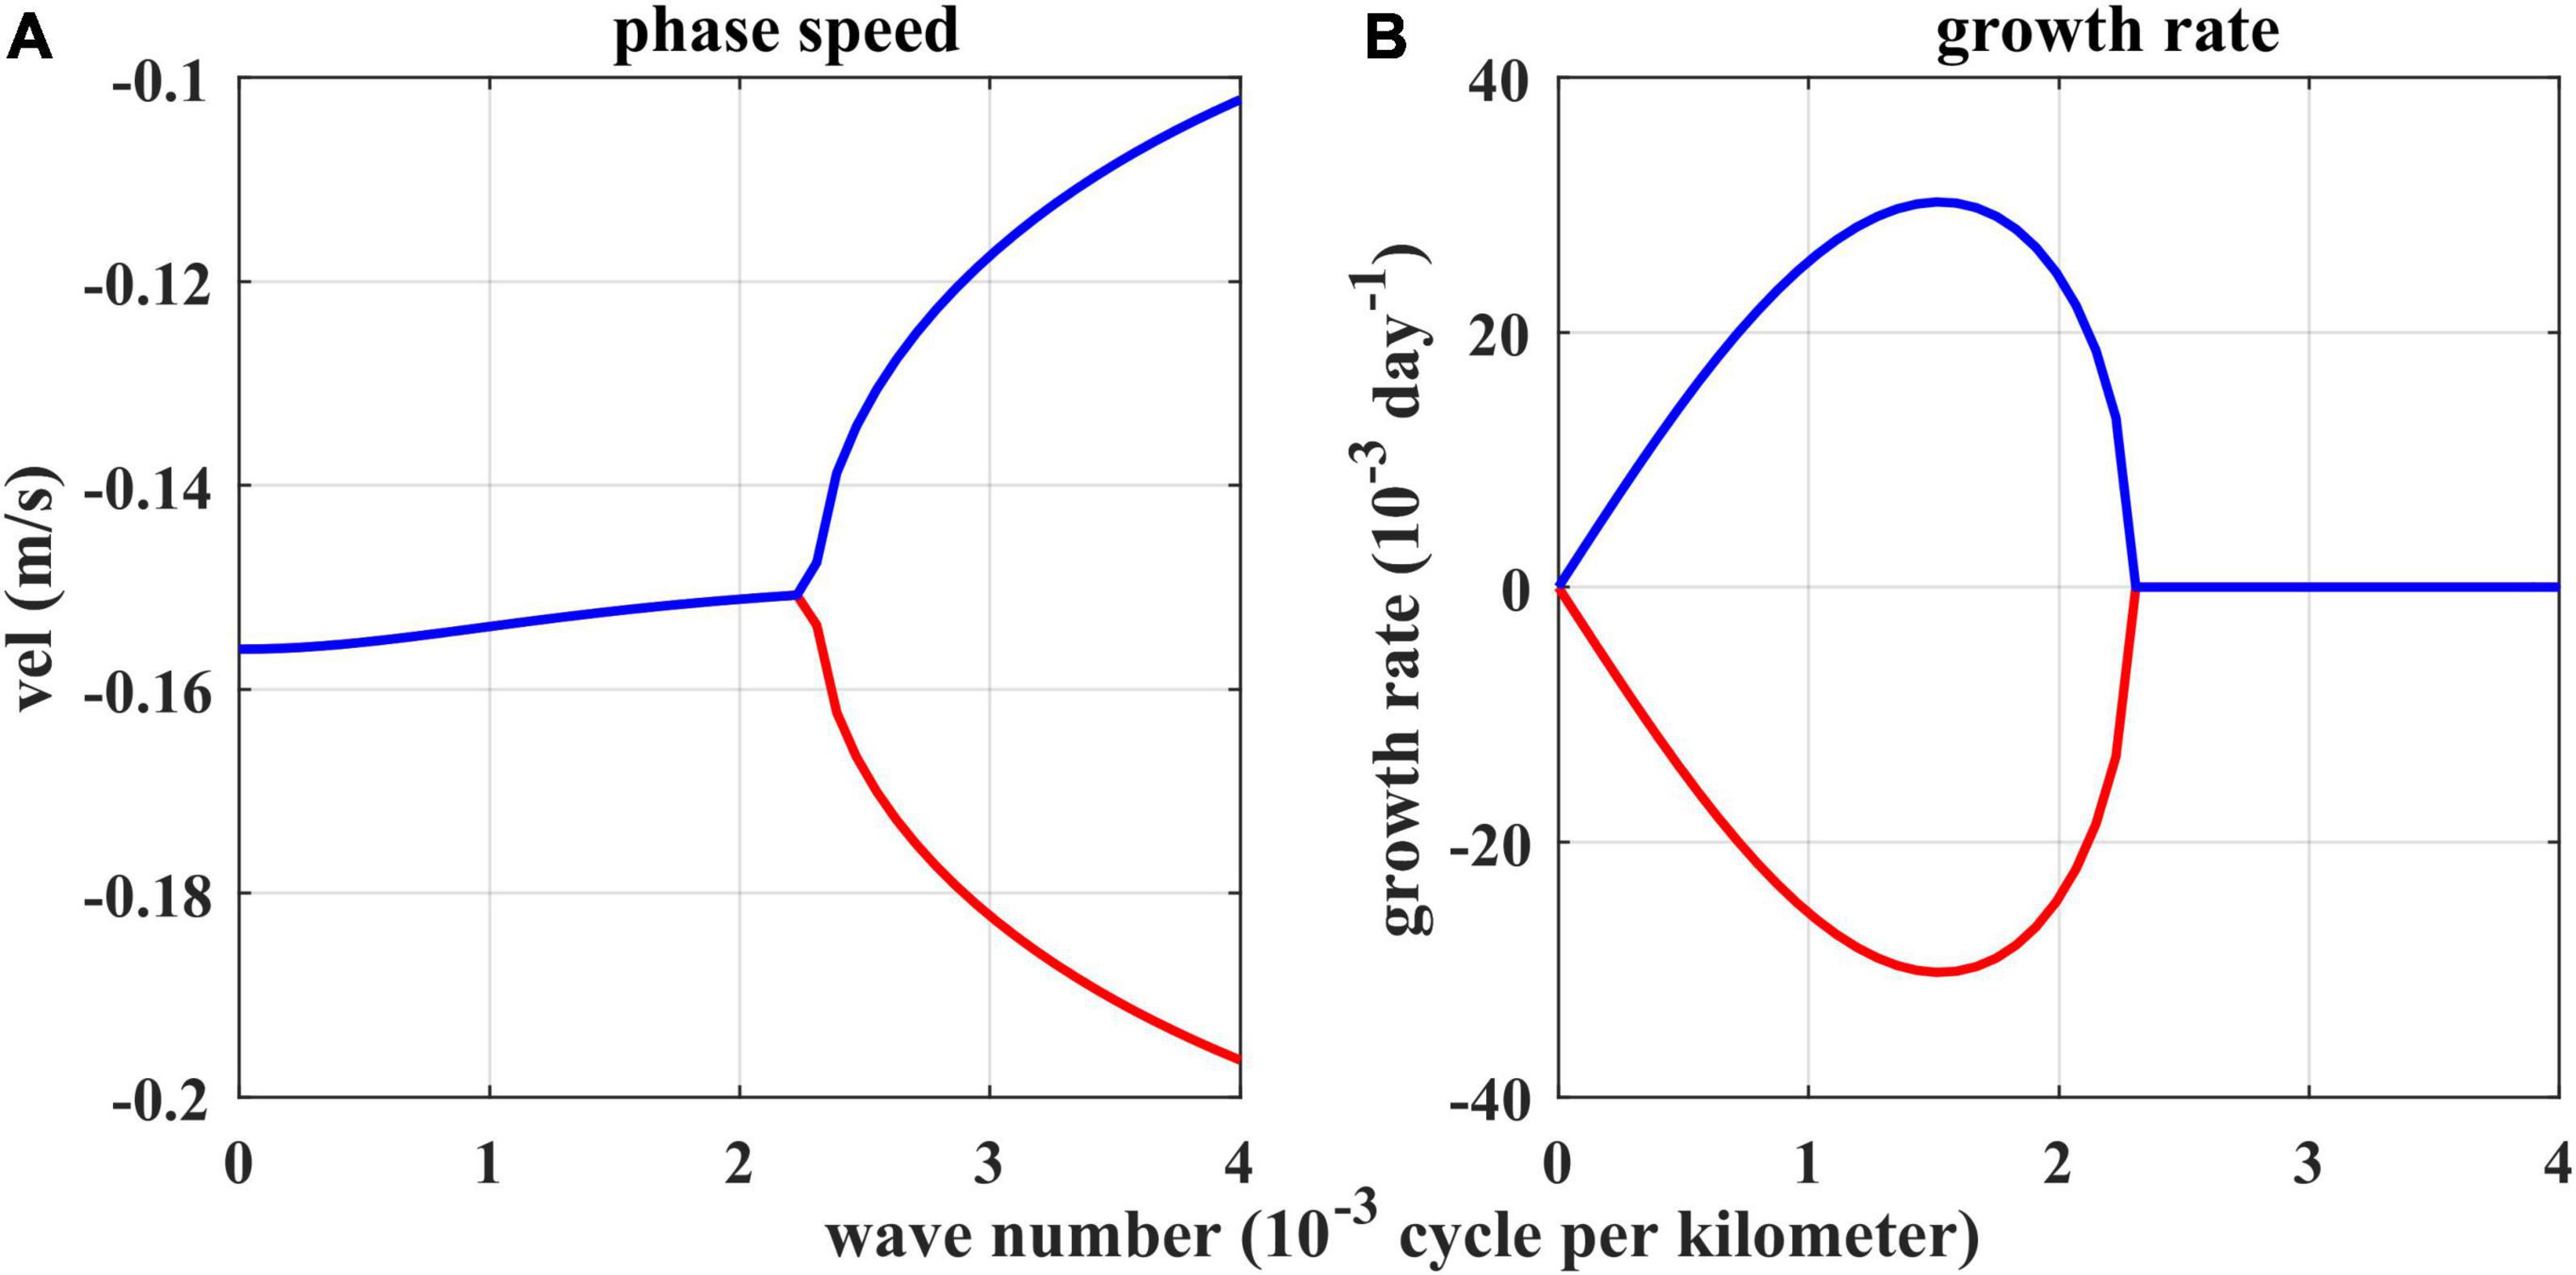
Figure 13. Phase speed (A) and growth rate (B) as a function of zonal wavenumber k calculated from the 2.5-layer linearized reduced gravity model.
Dynamics of Subsurface-Intensified Intraseasonal Variability
The subsurface-intensified ISV observed by the mooring ADCP measurements at 13°N, 130°E seems to have similar features to the subsurface-intensified ISV east of Mindanao Island reported by previous studies based on mooring observations and OFES outputs, which suggests the subsurface-intensified ISV is closely related to the propagating subsurface eddies (Wang et al., 2014; Zhang et al., 2014; Chiang et al., 2015; Wang, 2017). Although the relationship between subsurface-intensified ISV and subsurface eddies has been confirmed, the underlying mechanism for the generation of subsurface-intensified eddies or ISV still remains unclear. Past studies indicated the energy source of the subsurface eddies should be the locally barotropic and baroclinic instability (e.g., Chiang et al., 2015; Zhang et al., 2021). The 2.5-layer reduced gravity model and baroclinic instability are able to explain the surface-intensified ISV signals, but it is not appropriate to explain the excitation of the subsurface-intensified ISV signals observed by mooring ADCP measurements at 13°N, 130°E (Figure 4). As mentioned above, the subsurface-intensified ISV is probably due to the horizontal shear and barotropic instability of the subsurface currents in the NEC/NEUC region. To verify this hypothesis, a 1.5-layer reduced gravity model was used to investigate the barotropic instability process. Qiu and Chen (2004) and Qiu et al. (2009) used a similar model to explore the barotropic instability that contributed to the seasonal modulation in the eddy field of the South Pacific Ocean. This model has a mean horizontally sheared flow in the active upper layer and an inert, infinitely deep abyssal layer. The linearized equation governing the active upper-layer perturbation potential vorticity q is
Where
In Eq. 13, Π is the mean potential vorticity, and H is the mean upper-layer thickness, which is under geostrophic balance with the background upper-layer zonal velocity U through fU = −g′Hy, g′ is the reduced gravity, and h is the perturbation upper-layer thickness. Using the quasi-geostrophic approximation to connect u to h (i.e., fk×u = −g′∇h), u(u,v) are the perturbation upper-layer velocities.
Likewise, we can seek the normal mode solution which is described by the following form:
By substituting Eq. 14 into Eq. 13, we get
where λ2 = g′H/f2 is the squared internal Rossby radius of deformation. We can solve A numerically by regarding the complex phase speed c = cr + ici, with the real part cr and the imaginary part ci, as an eigenvalue. We choose the horizontal sheared zonal mean flow of the subsurface current (400–600 m) averaged between 128° and 130°E from 10° to 15°N in 2010 as the background flow in the active layer (Figure 14A). Other parameter values are chosen to be appropriate for our diagnosis: β = 2.22×10⁻¹¹m−1⋅s−1 is chosen approximately at 13°N, and λ = 150km is chosen following Chelton et al. (1998).
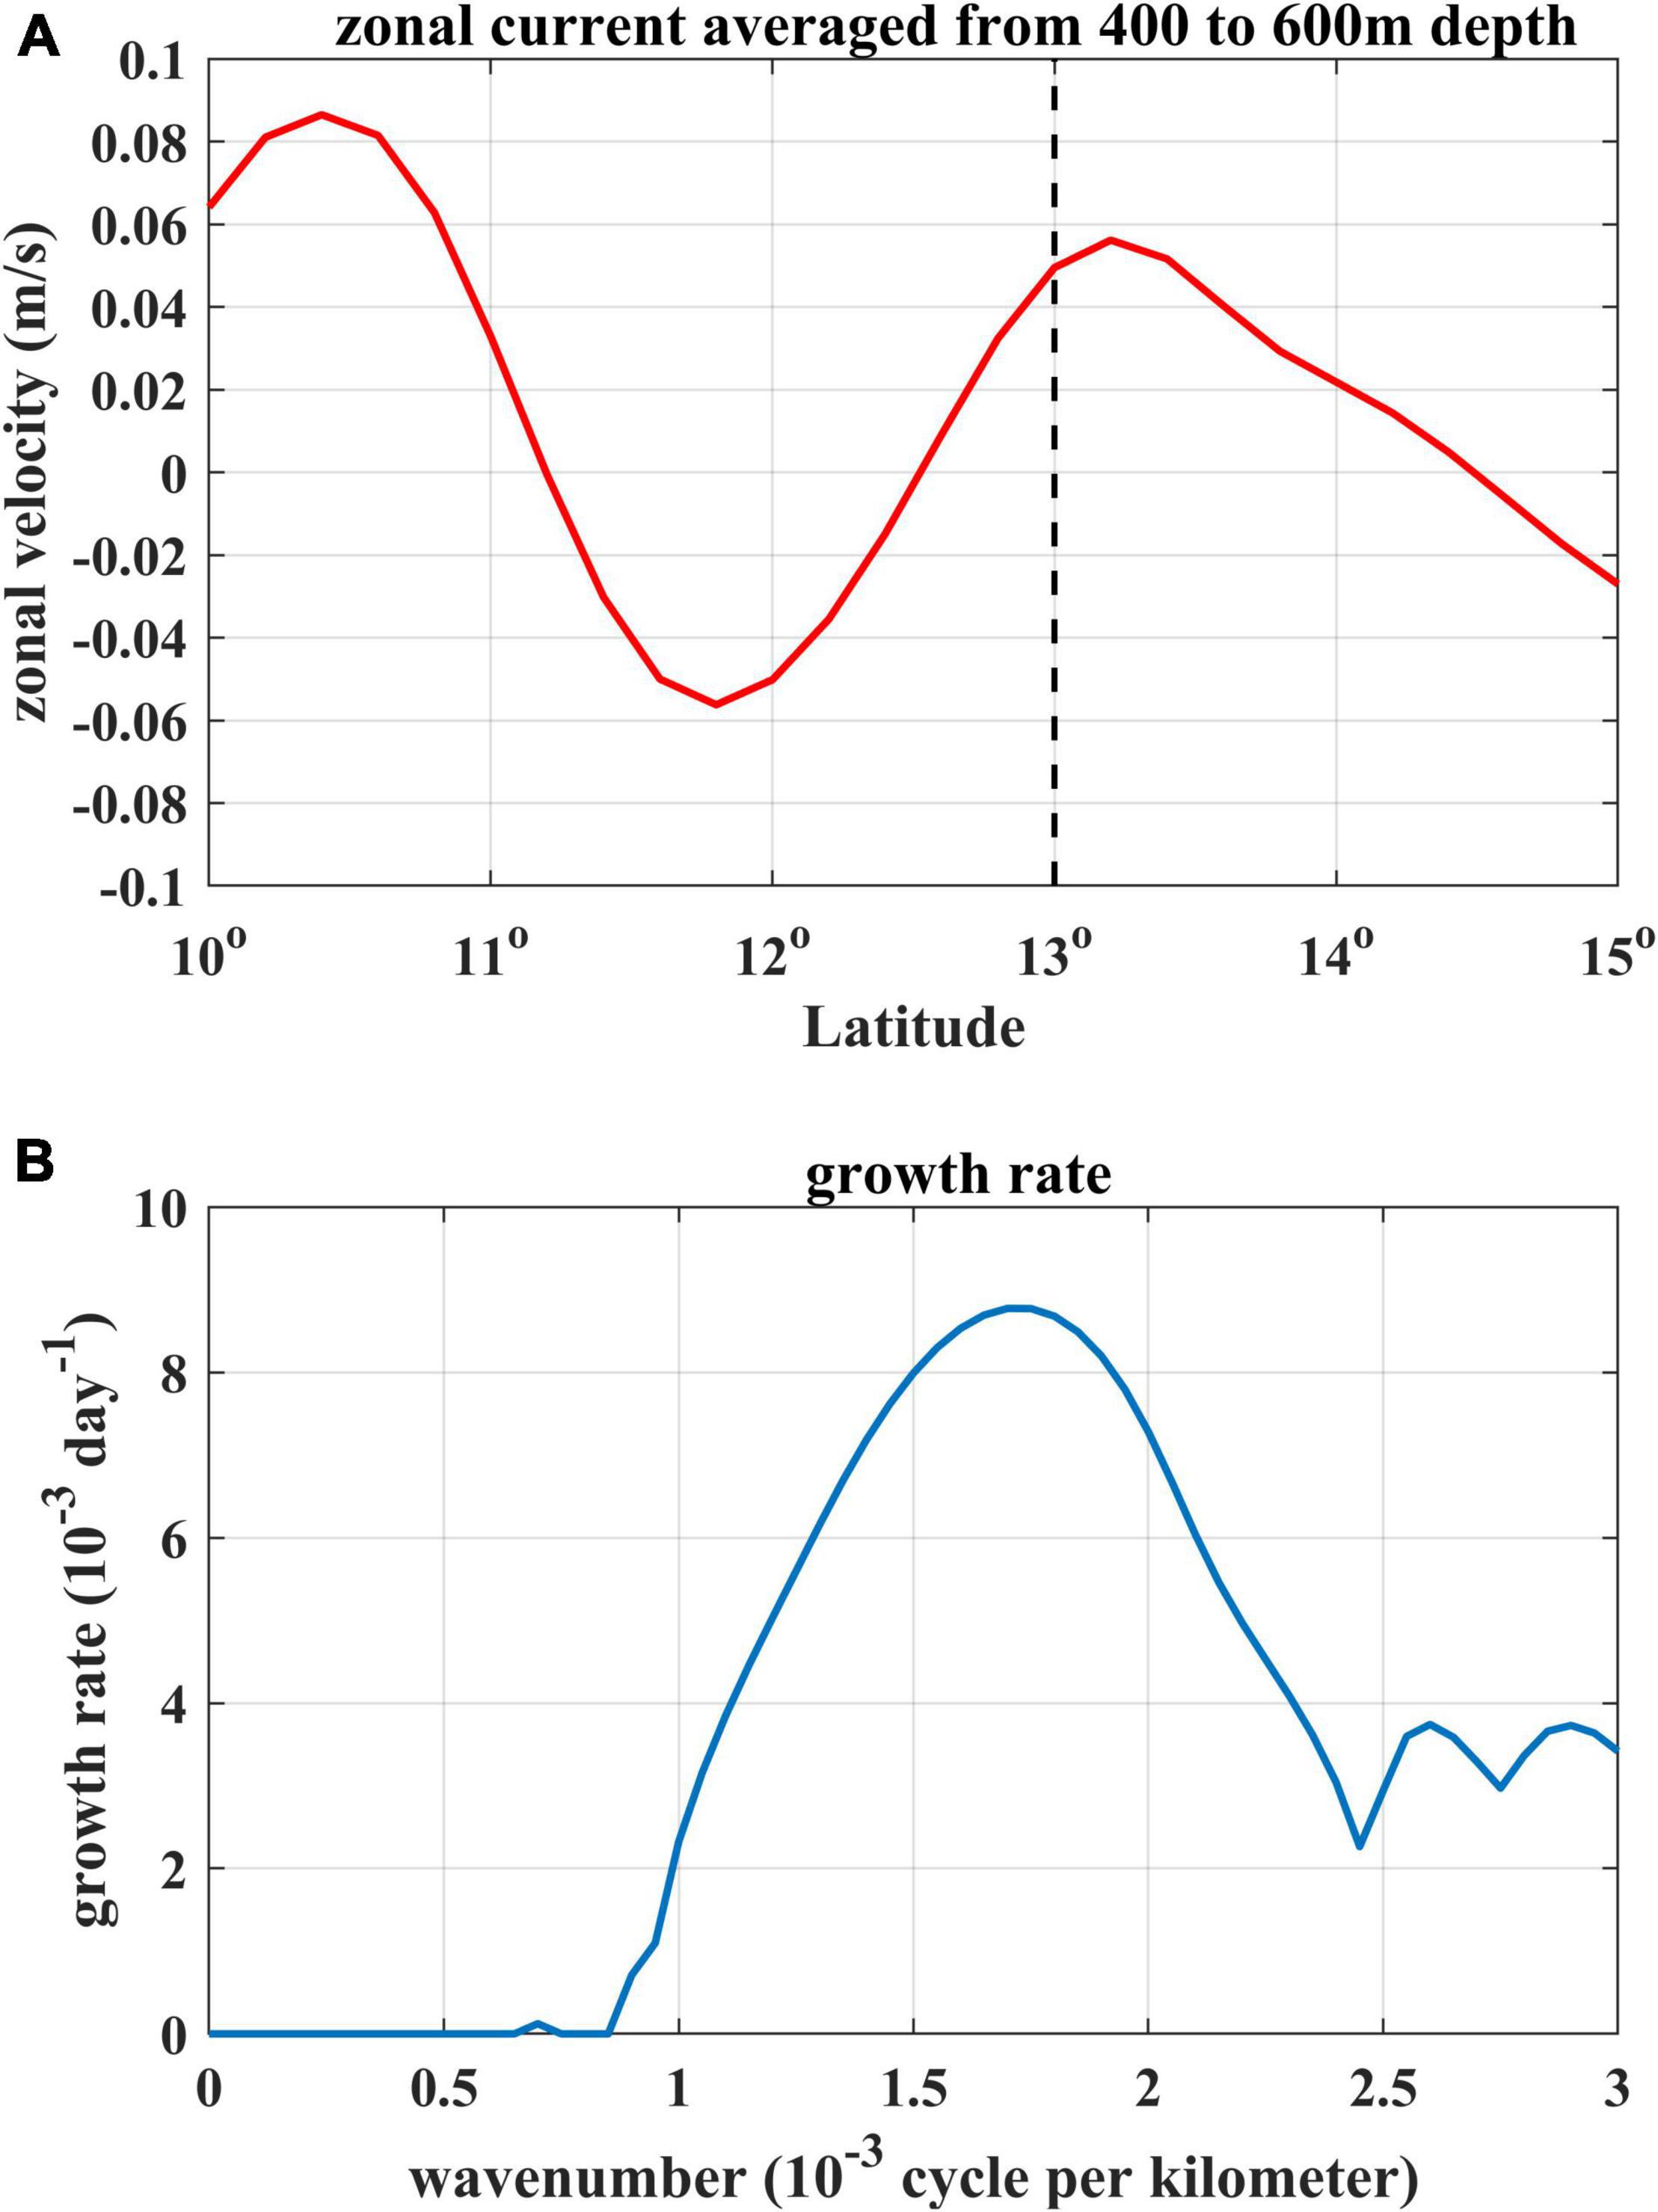
Figure 14. (A) Mean zonal velocity (400–600 m) averaged between 128° and 132°E from OFES outputs in 2010. (B) Growth rate as a function of zonal wavenumber k calculated from the 1.5-layer linearized reduced gravity model.
Based on the above parameters, we calculated and plotted the growth rate kci as a function of zonal wavenumber k (Figure 14B). The most unstable mode has a period that matches with the subsurface-intensified ISV observed by mooring ADCP, and it corresponds to a zonal wavenumber of kmax = 1.7×10⁻³cpkm, or a wavelength of 590 km, which agrees well with the dominant wavelength of the subsurface-intensified ISV signals derived from the OFES outputs. It follows that the horizontal shear in the subsurface currents system of the NEC/NEUC between 10 and 15°N is responsible for the subsurface-intensified ISV signals illustrated by both mooring measurements and OFES outputs.
It is worth noting that the horizontally sheared zonal flow U(y) specified in Figure 14A represents the background flow condition of the subsurface currents system in 2010 when the horizontal shear of the flow was much enhanced. We also calculated the growth rate of the wave when the horizontal shear of the subsurface zonal flow is in the weak phase (not shown). Consistent with our hypothesis, the subsurface currents system is stable owing to its weak horizontal shear. Therefore, the variances of the subsurface horizontal shear in the NEC/NEUC region would alter the barotropic instability and further influence the generation of the subsurface-intensified eddies or ISV. In some cases, the baroclinic nature of the background flow can provide both barotropic and baroclinic instability (Qiu et al., 2009), which suggests that the subsurface-intensified ISV may exist even more complex underlying mechanism.
Conclusion and Discussion
Significant surface-intensified and subsurface-intensified ISV signals are identified to coexist based on the 1-year mooring ADCP measurements at 13°N, 130°E in the NEC/NEUC region. The power spectral analysis demonstrates that the periods of these two flavors of ISV signals are around 45 and 85 days, respectively. Two flavors of ISV signals with different vertical structures are also detected from both the surface zonal geostrophic velocity derived from satellite altimetry and the subsurface zonal velocity from OFES outputs. Based on the altimeter data, the surface-intensified ISV with a relatively higher frequency has a westward-propagating speed of −0.15m/s, and its wavelength can be estimated approximately at 618 km. While the subsurface-intensified ISV with a relatively lower frequency, has a westward-propagating speed of −0.11m/s, and its wavelength is around 628 km from the OFES outputs.
Based on eddy trajectory tracking and energy analysis, we hypothesize that the two flavors of ISV signals detected by the ADCP mooring in the NEC/NEUC region are due to local instability of the background flow because of the significant vertical and horizontal velocity shears in this region. A 2.5-layer and a 1.5-layer reduced gravity model were then used to analyze the stability of the sheared background flow. As these two models predicted, the most unstable anomalies of the vertically sheared surface flow in the upper 400 m and horizontally sheared subsurface flow between 400 and 600 m near the mooring position have a zonal wavelength of 661 and 590 km, respectively. These results agree well with those features detected by satellite altimetry and OFES simulations.
The correct predictions for the zonal wavelength of those two ISV signals from two dynamic models presume comparable predictions for the surface-intensified and subsurface-intensified ISV observed by the ADCP mooring. Therefore, we suggest that the surface-intensified ISV is mainly due to baroclinic instability of the surface currents in the upper 400 m, while the subsurface-intensified ISV is mostly induced by barotropic instability of the subsurface currents between 400 and 600 m. A recent study also proved that barotropic instability is non-ignorable in the generation of subsurface eddies east of the Philippine coast, and it even overcomes the contribution from baroclinic instability in some local areas (Zhang et al., 2021). However, it is worth noting that the intensity of the horizontal shear plays a key role in inducing the barotropic instability. In our examination, the unstable mode of the barotropic instability is only excited when the subsurface horizontal shear is enhanced.
In addition, the subsurface mooring we used in this study is located near the strong western boundary currents like the MC and MUC. The ISV at the mooring site is likely to be modulated by the strong horizontal and vertical velocity shears of the western boundary currents. Nevertheless, this issue still remains unexplored, and further studies are necessary to clarify the contribution of the sheared western boundary currents to the generation of the ISV signals.
Data Availability Statement
The original contributions presented in the study are included in the article/supplementary material, further inquiries can be directed to the corresponding author/s.
Author Contributions
ZW performed the data analysis and wrote the initial draft. LZ proposed the main ideas, took part in the data analysis, and dramatically modified the manuscript. YH, FW, and DH all participated in the discussion and contributed to the improvement of the manuscript. All authors contributed to the article and approved the submitted version.
Funding
This study was supported by the National Natural Science Foundation of China (No. 42122041), the National Key Research and Development Program of China (No. 2020YFA0608801), the Strategic Priority Research Program of the Chinese Academy of Sciences (No. XDB42010105), the National Natural Science Foundation of China (No. 41776021), and the National Key Research and Development Program of China (No. 2017YFA0603202). The Youth Innovation Promotion Association (CAS) and the TS Scholar Program also supported this study. Mooring and CTD data were collected on board of R/V KeXue implementing open research cruises NORC2019-09 and NORC2021-09 supported by NSFC Shiptime Sharing Projects (41849909 and 42049909) and the Major Project of Science and Technology Innovation of Shan Dong (2018SDKJ0105).
Conflict of Interest
The authors declare that the research was conducted in the absence of any commercial or financial relationships that could be construed as a potential conflict of interest.
Publisher’s Note
All claims expressed in this article are solely those of the authors and do not necessarily represent those of their affiliated organizations, or those of the publisher, the editors and the reviewers. Any product that may be evaluated in this article, or claim that may be made by its manufacturer, is not guaranteed or endorsed by the publisher.
Acknowledgments
For the deployment and recovery of subsurface mooring, we offer our heartfelt gratitude to the crew of the R/V science, including all scientists and personnel on board. This study was also benefited from the openly available datasets: the mooring ADCP data are available at the NPOCE website (http://npoce.org.cn/), the satellite altimetry data are obtained from the AVISO website (http://aviso.oceanobs.com/), and OFES data are downloaded from the Asia-Pacific Data-Research Center (APDRC) website (http://apdrc.soest.hawaii.edu/).
References
Azminuddin, F., Jeon, D., and Shin, C. W. (2019). Intraseasonal-to-interannual variability of the upper-layer zonal currents in the tropical Northwest Pacific Ocean. Ocean Sci. J. 54, 15–27. doi: 10.1007/s12601-019-0001-2
Chaigneau, A., Gizolme, A., and Grados, C. (2008). Mesoscale eddies off Peru in altimeter records: identification algorithms and eddy spatio-temporal patterns. Prog. Oceanogr. 79, 106–119. doi: 10.1016/j.pocean.2008.10.013
Chelton, D. B., Deszoeke, R. A., Schlax, M. G., El Naggar, K., and Siwertz, N. (1998). Geographical variability of the first baroclinic Rossby radius of deformation. J. Phys. Oceanogr. 28, 433–460.
Chen, Z., and Wu, L. (2011). Dynamics of the seasonal variation of the north equatorial current bifurcation. J. Geophys. Res. Ocean. 116, 1–14. doi: 10.1029/2010JC006664
Chiang, T.-L., Wu, C.-R., Qu, T., and Hsin, Y.-C. (2015). Activities of 50–80 day subthermocline eddies near the Philippine coast. J. Geophys. Res. Ocean. 120, 3606–3623. doi: 10.1002/2013JC009626s
Doglioli, A. M., Blanke, B., Speich, S., and Lapeyre, G. (2007). Tracking coherent structures in a regional ocean model with wavelet analysis: application to Cape Basin eddies. J. Geophys. Res. Ocean. 112, 1–12. doi: 10.1029/2006JC003952
Donguy, J. R., and Meyers, G. (1996). Mean annual variation of transport of major currents in the tropical Pacific Ocean. Deep. Res. Part I Oceanogr. Res. Pap. 43, 1105–1122. doi: 10.1016/0967-0637(96)00047-7
Dutrieux, P. (2009). Tropical Western Pacific Currents and the Origin of Intraseasonal Variability Below the Thermocline. Ph.D. thesis. Honolulu, HI: University of Hawai‘i at Mānoa, 140.
Hu, D., Wang, F., Sprintall, J., Wu, L., Riser, S., Cravatte, S., et al. (2020). Review on observational studies of western tropical Pacific Ocean circulation and climate. J. Oceanol. Limnol. 38, 906–929. doi: 10.1007/s00343-020-0240-1
Hu, D., Wu, L., Cai, W., Sen Gupta, A., Ganachaud, A., Qiu, B., et al. (2015). Pacific western boundary currents and their roles in climate. Nature 522, 299–308. doi: 10.1038/nature14504
Hu, S., and Hu, D. (2014). Variability of the Pacific North Equatorial Current from repeated shipboard acoustic Doppler current profiler measurements. J. Oceanogr. 70, 559–571. doi: 10.1007/s10872-014-0253-5
Kashino, Y., España, N., Syamsudin, F., Richards, K. J., Jensen, T., Dutrieux, P., et al. (2009). Observations of the North Equatorial Current, Mindanao Current, and Kuroshio current system during the 2006/07 El Niño and 2007/08 La Niña. J. Oceanogr. 65, 325–333. doi: 10.1007/s10872-009-0030-z
Kessler, W. S. (1990). Observations of long Rossby waves in the northern tropical Pacific. J. Geophys. Res. 95, 5183–5217. doi: 10.1029/JC095iC04p05183
Kim, Y. Y., Qu, T., Jensen, T., Miyama, T., Mitsudera, H., Kang, H. W., et al. (2004). Seasonal and interannual variations of the North Equatorial current bifurcation in a high-resolution OGCM. J. Geophys. Res. Ocean. 109, C03040. doi: 10.1029/2003jc002013
Liu, Q. Y., Pan, A. J., and Liu, Z. Y. (2003). Intraseasonal oscillation and baroclinic instability of upper layer ocean in the North Equator Current. Oceanol. Limnol. Sin. 34, 94–100. (In Chinese),
Liu, X., and Zhou, H. (2020). Seasonal variations of the north equatorial current across the pacific ocean. J. Geophys. Res. Ocean. 125:e2019JC015895. doi: 10.1029/2019JC015895
Lukas, R., Yamagata, T., and McCreary, J. P. (1996). Pacific low-latitude western boundary currents and the Indonesian throughflow. J. Geophys. Res. C Ocean. 101, 12209–12216. doi: 10.1029/96JC01204
Masina, S., Philander, S. G. H., and Bush, A. B. G. (1999). An analysis of tropical instability waves in a numerical model of the Pacific Ocean: 2. Generation and energetics of the waves. J. Geophys. Res. Ocean. 104, 29637–29661. doi: 10.1029/1999jc900226
Masumoto, Y., and Yamagata, T. (1991). Response of the Western tropical pacific to the asian winter monsoon: the generation of the mindanao dome. J. Phys. Oceanogr. 21, 1396–1398.
Masumoto, Y., Sasaki, H., Kagimoto, T., Komori, N., Ishida, A., Sasai, Y., et al. (2004). A fifty-year eddy-resolving simulation of the world ocean: preliminary outcomes of OFES (OGCM for the Earth Simulator). J. Earth Simulator 1, 35–56.
Meyers, G. (1979). On the annual rossby wave in the tropical north pacific ocean. J. Phys. Oceanogr. 9, 663–674.
Nencioli, F., Dong, C., Dickey, T., Washburn, L., and Mcwilliams, J. C. (2010). A vector geometry-based eddy detection algorithm and its application to a high-resolution numerical model product and high-frequency radar surface velocities in the Southern California Bight. J. Atmos. Ocean. Technol. 27, 564–579. doi: 10.1175/2009JTECHO725.1
Nitani, H. (1972). “Beginning of the Kuroshio,” in Kuroshio: Physical Aspects of the Japan Current, eds H. Stommel and K. Yoshida (Seattle, WA: University of Washington Press), 129–163.
Qiu, B. (1999). Seasonal eddy field modulation of the North Pacific Subtropical Countercurrent: TOPEX/Poseidon observations and theory. J. Phys. Oceanogr. 29, 2471–2486.
Qiu, B., and Chen, S. (2004). Seasonal modulations in the eddy field of the south pacific ocean. J. Phys. Oceanogr. 34, 1515–1527.
Qiu, B., and Joyce, T. M. (1992). Interannual variability in the mid- and low-latitude western north pacific. J. Phys. Oceanogr. 22, 1062–1079.
Qiu, B., and Lukas, R. (1996). Seasonal and interannual variability of the North Equatorial current, the mindanao current, and the Kuroshio along the Pacific western boundary. J. Geophys. Res. 101, 12315–12330. doi: 10.1029/95JC03204
Qiu, B., Chen, S., and Kessler, W. S. (2009). Source of the 70-day mesoscale Eddy variability in the coral sea and the North Fiji Basin. J. Phys. Oceanogr. 39, 404–420. doi: 10.1175/2008JPO3988.1
Qiu, B., Chen, S., Klein, P., Sasaki, H., and Sasai, Y. (2014). Seasonal mesoscale and submesoscale eddy variability along the north pacific subtropical countercurrent. J. Phys. Oceanogr. 44, 3079–3098. doi: 10.1175/JPO-D-14-0071.1
Qiu, B., Chen, S., Rudnick, D. L., and Kashino, Y. (2015). A new paradigm for the north pacific subthermocline low-latitude western boundary current system. J. Phys. Oceanogr. 45, 2407–2423. doi: 10.1175/JPO-D-15-0035.1
Qu, T., and Lukas, R. (2003). The bifurcation of the North Equatorial Current in the Pacific. J. Phys. Oceanogr. 33, 5–18.
Sasaki, H., Nonaka, M., Masumoto, Y., Sasai, Y., Uehara, H., and Sakuma, H. (2008). “An eddy-resolving hindcast simulation of the quasiglobal ocean from 1950 to 2003 on the earth simulator,” in High Resolution Numerical Modelling of the Atmosphere and Ocean, eds W. Hamilton and K. Ohfuchi (New York, NY: Springer). doi: 10.1007/978-0-387-49791-4_10
Toole, J. M., Millard, R. C., Wang, Z., and Pu, S. (1990). Observations of the pacific north equatorial current bifurcation at the Philippine coast. J. Phys. Oceanogr. 20, 307–318.
Ueki, I., Kashino, Y., and Kuroda, Y. (2003). Observation of current variations off the New Guinea coast including the 1997-1998 El Niño period and their relationship with Sverdrup transport. J. Geophys. Res. Ocean. 108, 1–17. doi: 10.1029/2002jc001611
Wang, F., Feng, J., Wang, Q., Zhang, L., Hu, S., and Hu, D. (2020). Instability in boundary layer between the North Equatorial Current and underlying zonal jets based on mooring observations. J. Oceanol. Limnol. 38, 1368–1381. doi: 10.1007/s00343-020-0015-8
Wang, F., Li, Y., and Wang, J. (2016). Intraseasonal variability of the surface zonal currents in the western tropical Pacific Ocean: characteristics and mechanisms. J. Phys. Oceanogr. 46, 3639–3660. doi: 10.1175/JPO-D-16-0033.1
Wang, F., Wang, Q., Zhang, L., Hu, D., Hu, S., and Feng, J. (2019). Spatial distribution of the seasonal variability of the North Equatorial Current. Deep. Res. Part I Oceanogr. Res. Pap. 144, 63–74. doi: 10.1016/j.dsr.2019.01.001
Wang, F., Zang, N., Li, Y., and Hu, D. (2015). On the subsurface countercurrents in the Philippine Sea. J. Geophys. Res. C Ocean. 120, 131–144. doi: 10.1038/175238c0
Wang, Q. (2017). Three-dimensional structure of mesoscale eddies in the western tropical Pacific as revealed by a high-resolution ocean simulation. Sci. China Earth Sci. 60, 1719–1731. doi: 10.1007/s11430-016-9072-y
Wang, Q., Zhai, F., Wang, F., and Hu, D. (2014). Intraseasonal variability of the subthermocline current east of Mindanao. J. Geophys. Res. C Ocean. 119, 8552–8566. doi: 10.1002/2014JC010343
Zhai, F., and Hu, D. (2012). Interannual variability of transport and bifurcation of the North Equatorial Current in the tropical North Pacific Ocean. Chin. J. Oceanol. Limnol. 30, 177–185. doi: 10.1007/s00343-012-1194-8
Zhang, L., Hu, D., Hu, S., Wang, F., Wang, F., and Yuan, D. (2014). Mindanao Current/Undercurrent measured by a subsurface mooring. J. Geophys. Res. Ocean. 119, 3617–3628. doi: 10.1002/2013JC009693
Zhang, L., Hui, Y., Qu, T., and Hu, D. (2021). Seasonal variability of subthermocline eddy kinetic energy east of the Philippines. J. Phys. Oceanogr. 51, 685–699. doi: 10.1175/JPO-D-20-0101.1
Zhang, L., Wang, F. J., Wang, Q., Hu, S., Wang, F., and Hu, D. (2017). Structure and variability of the north equatorial current/Undercurrent from mooring measurements at 130°e in the western pacific. Sci. Rep. 7:46310. doi: 10.1038/srep46310
Keywords: intraseasonal variability, North Equatorial Current, meso-scale eddy, baroclinic instability, barotropic instability
Citation: Wang Z, Zhang L, Hui Y, Wang F and Hu D (2022) Two Flavors of Intraseasonal Variability and Their Dynamics in the North Equatorial Current/Undercurrent Region. Front. Mar. Sci. 9:845575. doi: 10.3389/fmars.2022.845575
Received: 30 December 2021; Accepted: 17 February 2022;
Published: 28 March 2022.
Edited by:
Gilles Reverdin, Centre National de la Recherche Scientifique (CNRS), FranceReviewed by:
Lei Zhou, Shanghai Jiao Tong University, ChinaHailun He, Second Institute of Oceanography, Ministry of Natural Resources, China
Copyright © 2022 Wang, Zhang, Hui, Wang and Hu. This is an open-access article distributed under the terms of the Creative Commons Attribution License (CC BY). The use, distribution or reproduction in other forums is permitted, provided the original author(s) and the copyright owner(s) are credited and that the original publication in this journal is cited, in accordance with accepted academic practice. No use, distribution or reproduction is permitted which does not comply with these terms.
*Correspondence: Linlin Zhang, emhhbmdsaW5saW5AcWRpby5hYy5jbg==
 Zhenxiao Wang
 Linlin Zhang
 Yuchao Hui1,3