 Sara Zeidan
 Jennifer Walker1
 Brent G. T. Else
 Lisa A. Miller
 Kumiko Azetsu-Scott
 Brett D. Walker
94% of researchers rate our articles as excellent or good
Learn more about the work of our research integrity team to safeguard the quality of each article we publish.
Find out more
ORIGINAL RESEARCH article
Front. Mar. Sci., 27 April 2022
Sec. Marine Biogeochemistry
Volume 9 - 2022 | https://doi.org/10.3389/fmars.2022.845536
This article is part of the Research TopicNatural and Artificial Radionuclides as Tracers of Ocean ProcessesView all 12 articles
The Canadian Arctic is warming at three times the rate of the rest of the planet and the effects of climate change on the Arctic marine carbon cycle remains unconstrained. Baffin Bay is a semi-enclosed, Arctic basin that connects the Arctic Ocean to the north to the Labrador Sea to the south. While the physical oceanography of surface Baffin Bay is well characterized, less is known about deep water formation mechanisms within the Basin. Only a few residence-time estimates for Baffin Bay Deep Water (BBDW) exist and range from 20 to 1450 years. Better residence time estimates are needed to understand the oceanographic significance of Baffin Bay. Here we report stable carbon (δ13C) and radiocarbon (Δ14C) values of dissolved inorganic carbon (DIC) collected aboard the CCGS Amundsen in 2019. DIC δ13C and Δ14C values between ranged between -0.7‰ to +1.9‰ and -90.0‰ to +29.8‰, respectively. Surface DIC δ13C values were between +0.7‰ to +1.9‰, while deep (>100m) values were 0.0 to -0.7‰. Surface DIC Δ14C values ranged between -5.4‰ to +22.9‰, while deep DIC (>1400m) DIC Δ14C averaged -82.2 ± 8.5‰ (n = 9). To constrain natural DIC Δ14C values, we quantified the amount of atmospheric “bomb” 14C in DIC (Δ14Cbomb; using the potential alkalinity method; Palk) and anthropogenic DIC (DICanth; using the ΔC* method). Both proxies indicate an absence of Δ14Cbomb and DICanth below 1000m. Using two previously proposed deep water formation mechanisms and our corrected DIC Δ14Cnatural values, we estimated a 14C-based residence time of 360-690 years for BBDW. Based on these residence times, we infer carbon is likely stored for centuries in deep Baffin Bay.
Approximately half of the carbon dioxide (CO2) emitted into the atmosphere from fossil fuels has been absorbed by the oceans. It has been suggested the oceans comprise the only true sink of atmospheric CO2 over the past 200 years, storing carbon in the deep ocean on timescales of ~1000 years (Sabine et al., 2004). Most of this oceanic carbon is stored as dissolved inorganic carbon (DIC; ~38,000 GtC), the largest marine carbon reservoir (Heinze, 2014). The Arctic Ocean is an important region for the marine carbon cycle (Hamilton and Wu, 2013) and is warming at three times the rate of the rest of the planet (Arctic Monitoring and Assessment Programme Arctic Climate Change Update, 2021). The effect of climate change on the marine carbon cycle in the Arctic remains unconstrained.
Many Arctic regions act as sinks of anthropogenic carbon below the mixed layer, through the export of particulate organic carbon (POC) and downwelling of surface DIC. Previous studies have used DIC concentrations in Arctic gateways coupled with mass transport models to establish an Arctic Ocean DIC budget (e.g., MacGilchrist et al., 2014; Olsen et al., 2015). The Arctic Ocean absorbs roughly 225 ± 49 Tg C yr-1 via air-sea gas exchange during the summer months (MacGilchrist et al., 2014). These studies suggest the Arctic Ocean is a carbon sink for most of the year. Open water biological activity and air-sea gas exchange account for most CO2 uptake. The sink is assumed to be minimal during the winter due to sea ice cover (Shadwick et al., 2011). While DIC and total alkalinity measurements have played a critical role in our understanding of Arctic carbon cycling and ocean acidification, these studies require repetition of high spatial resolution field measurements to estimate carbon fluxes. Most Arctic sampling campaigns are limited to the summer/fall, limiting air-sea gas exchange estimates (Bates and Mathis, 2009).
Marine DIC radiocarbon (Δ14C) and stable carbon (δ13C) measurements are powerful tracers of water mass sources, ages, and advection. Additionally, the decrease in atmospheric δ13CO2 (i.e., the Suess effect) has been used as key evidence for anthropogenic carbon sequestration in the form of marine DIC (Körtzinger et al., 2003). DIC δ13C values serve as valuable endmembers for understanding DIC cycling in dynamic Arctic Ocean environments. For example, surface DIC δ13C values in the Arctic Ocean range between -0.6 and +2.2‰, with deep DIC δ13C ranging from -1.0 to +2.0‰, in both the Canadian and Eurasian Basins (Griffith et al., 2012; Bauch et al., 2015). DIC δ13C values in the Beaufort Sea, which feeds Pacific water to the Canadian Arctic Archipelago (CAA), range between -0.5 to +2.2‰ (Mol, 2017). The North Atlantic Ocean, which receives Arctic water through Davis and Fram Strait, consists of DIC δ13C between -0.1 to +1.9‰ (Humphreys et al., 2016).
Radiocarbon is naturally produced in the stratosphere through the capture of slow cosmic ray neutrons by atmospheric 14N nuclei (Trumbore et al., 2016). In addition, the infiltration of atmospheric “bomb” CO2 into the global oceans since the 1960s has made 14C a useful physical oceanographic tracer. Northern hemisphere atmospheric Δ14C values reached +1000‰ with surface marine DIC Δ14C peaking at roughly +200‰ a decade later. Atmospheric CO2 Δ14C values have declined to 0‰ today, due to dilution of this signal via increased fossil fuel output and the incorporation of atmospheric CO2 into the oceans and terrestrial biosphere (Guilderson et al., 2000; Brown and Reimer, 2004). Similarly, the influx of fossil (Δ14C = -1000‰) CO2 into the marine DIC reservoir (i.e., the Suess Effect) has proven a useful tool for quantifying anthropogenic impacts on the ocean (Chen and Millero, 1979). However, to date, only a handful of Arctic DIC Δ14C measurements have been published. DIC Δ14C values of -60‰ were found in the deep Eurasian Basin, and values as low as -105‰ to -112‰ in the deep Canada Basin (Östlund et al., 1987). Surface DIC Δ14C values range between -35‰ to +19‰ in the Beaufort Sea, and a value of +52‰ was measured at a single station in the Amundsen Basin (Druffel et al., 2017). Deep DIC Δ14C values in the Beaufort Sea were as low as -111‰ (Griffith et al., 2012).
In this study, we present the first DIC Δ14C and new δ13C data for Baffin Bay. We use Δ14C and δ13C values of DIC to trace water mass characteristics, DIC sources, the penetration of bomb vs. anthropogenic (fossil) Δ14C and to estimate the first 14C-based residence time of deep Baffin Bay.
DIC samples for isotopic analysis were collected from 11 stations throughout Baffin Bay in July 2019 aboard the icebreaker CCGS Amundsen (Figures 1A–C). Water samples were collected throughout the water column for each station using a rosette equipped with the SBE 911plus conductivity, temperature, depth probe (CTD) and 24 × 12L Niskin bottles. Prior to DIC Δ14C and δ13C sample collection, 250 mL Pyrex bottles (Corning #1395-250), caps and 45 mm clear pouring rings were cleaned by soaking in 10% HCl for 1 hour, rinsed with copious amounts of 18.2 MΩ Milli-Q water (TOC <4ppb) and dried overnight. The bottles were then baked at 540°C for 2 hours. Samples for DIC and Total Alkalinity (AT) concentrations were collected into 250 mL borosilicate glass bottles, overflowed three times, poisoned with 100μL of saturated HgCl2, sealed with Apezion M grease on ground glass stoppers and secured with electrical tape. Samples for DIC Δ14C followed a similar process but were re-opened briefly after collection in the wet lab, poisoned, re-capped and stored in the dark at room temperature. Nutrient samples were collected in 20 mL polyethylene flasks and measured immediately at sea.
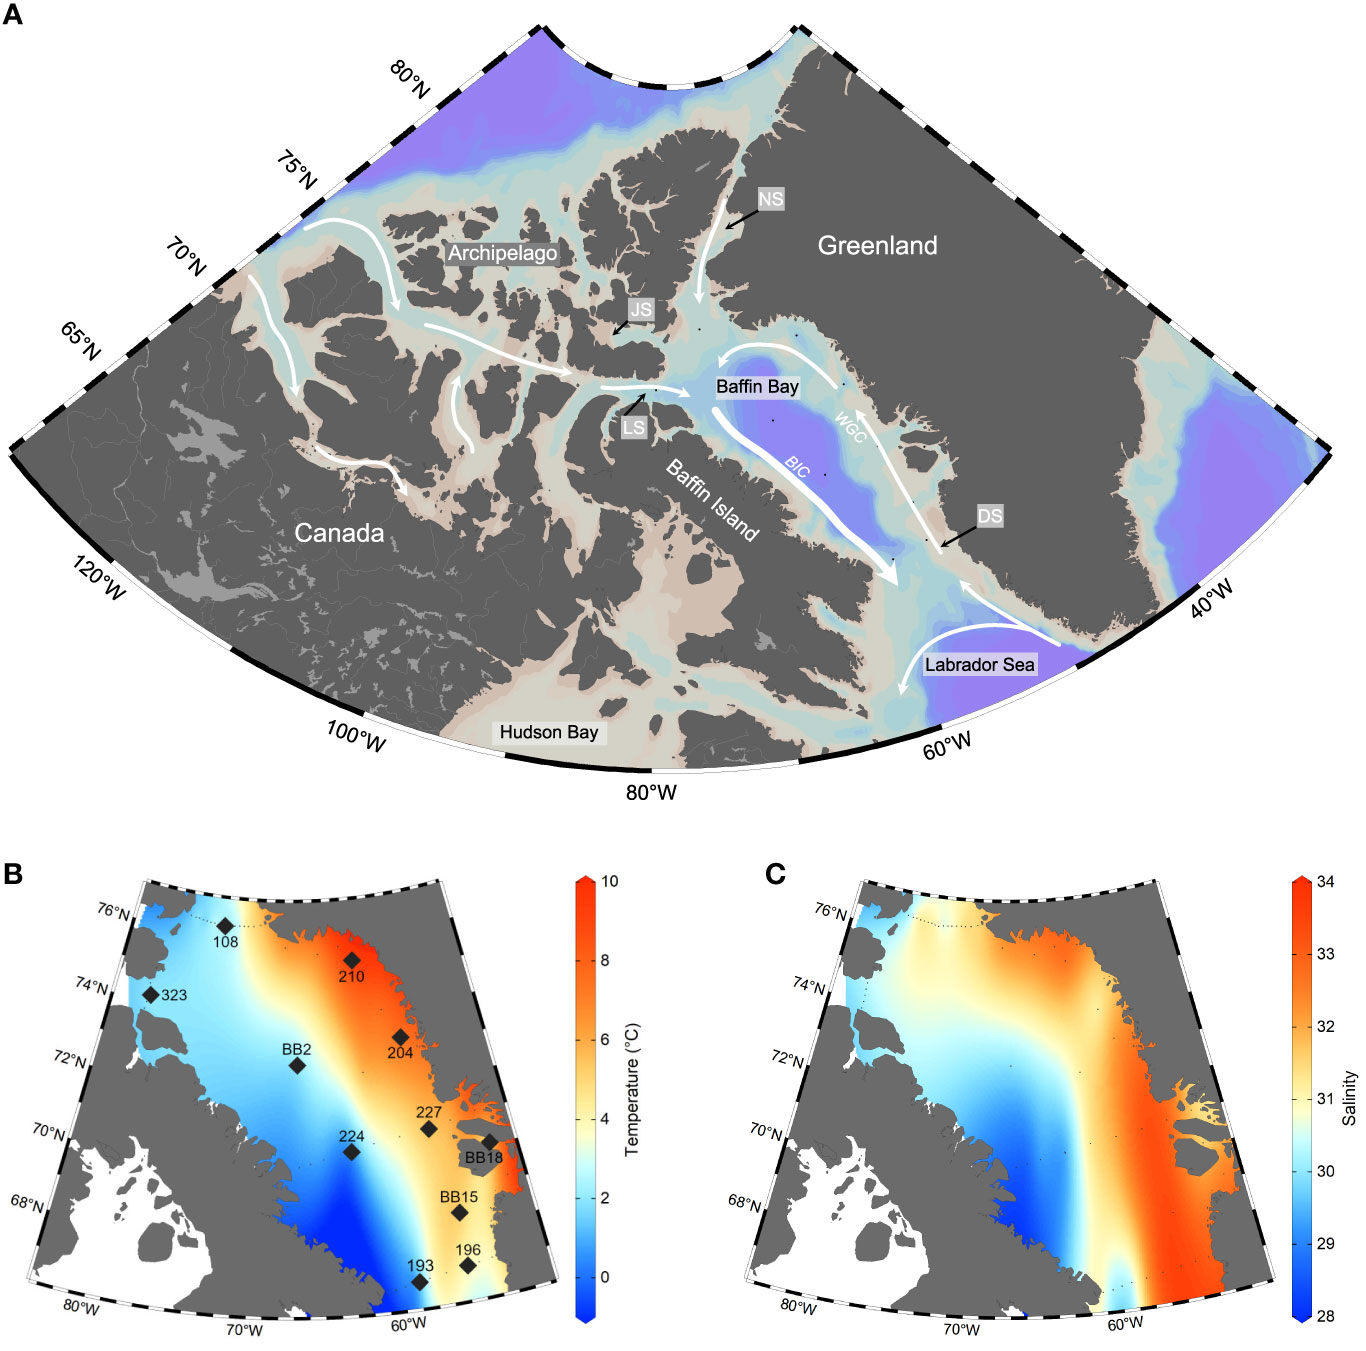
Figure 1 Area and station maps with temperature and salinity in Baffin Bay. (A) broader area map indicates major currents (white arrows) land masses and Baffin Bay gateways (grey boxes). Gateways include Davis Strait (DS; 640m), Nares Strait (NS; 250m), Jones Sound (JS; 120m), and Lancaster Sound (LS; 300-800m). (B) Data from all stations visited in the 2019 research cruise were used to create the interpolated surface distributions of sea surface temperature (°C). Stations sampled for DIC are indicated by large black diamonds and labeled. (C) Data from all stations visited in the 2019 research cruise were used to create the interpolated surface distributions of salinity from 2-3 metres depth are reported in Practical Salinity Units (PSU). Plots b and c are Ocean Data View interpolations resulting from all CTD casts on the cruise (small black dots; n=52 stations) and are used to indicate the presence of the Baffin Island Current (BIC) and Western Greenland Currents (WGC) during the time of sampling.
DIC concentrations were analyzed by coulometry (Johnson et al., 1993) and AT by open cell potentiometric titration after (Dickson et al., 2007). DIC and AT samples were analyzed within 15 months of collection at both the Bedford Institute of Oceanography (BIO; stations 193, 196, and 224) and the Institute of Ocean Sciences (IOS; stations BB15, BB18, 227, 224, BB2, 204, 210 108, and 323). Analytical precision was determined by repeated analysis of a bulk seawater sample. For samples analyzed at Bedford Institute of Oceanography, precision for DIC and AT was ±0.03%. ± 0.05%, respectively. Results for DIC and AT at IOS were calibrated against certified reference material (CRM) supplied provided by Dr. Andrew Dickson (Scripps Oceanographic Institution, San Diego, USA), and the analytical precision, based on the average difference between replicates, was ±1.1 µmol kg-1 for DIC and ±2.0 µmol kg-1 for AT. An inter-lab comparison of DIC and AT concentrations yielded errors of ±7.76 µmol kg-1 and ±14.27 µmol kg-1 (n = 24), respectively. Bottle salinity data were collected from the rosette system and analyzed onboard using an AUTOSAL 8400B salinometer and reported in the Practical Salinity Scale units (PSU). Nutrient concentrations were measured by colorimetry following Aminot and Kérouel (2007) at Université Laval with an analytical precision of ±1 µmol kg-1.
For each sample, 1 mL of seawater was transferred into a pre-cleaned 12 mL Exetainer vials, which had been flushed with UHP He gas within a glove bag to remove of any atmospheric CO2. 100 µL of 85% H3PO4 was then added to each sample, which was shaken and left to equilibrate for at least 12 hours at room temperature. This allowed the DIC to equilibrate with CO2 in the headspace of the vials (Olack et al., 2018). Isotopic standards were prepared using external calcite and limestone standards (IAEA NBS-18, δ13C = -5.01‰; IAEA NBS-19, δ13C = +1.95). Internal bicarbonate standards for calibration correction were also used (VL-1 δ13C = -3.21‰; VL-2 δ13C = -15.80‰; VL-3 δ13C = -13.89‰ from Ján Veizer Stable Isotope Laboratory; OXG δ13C = -7.5‰ from Oxford University). DIC δ13C values were measured using a Thermo-Finnigan Gas Bench coupled to a Thermo-Finnigan Delta V-Plus Continuous Flow Isotope-Ratio Mass Spectrometer (IRMS) at the University of Ottawa, Ján Veizer Stable Isotope Laboratory. Results are reported in standard per mil (‰) notation and relative to Vienna Pee Dee Belemnite (V-PDB) for δ13C. Average external precision based on sample replicates (n = 100) was ±0.1‰.
Seawater DIC was extracted using the headspace CO2 method for Δ14C following Gao and co-workers (2014). Approximately 40 mL of seawater was transferred to pre-cleaned and pre-weighed 60 mL vials (Fisher Scientific #5719398) by decanting in a glove bag flushed multiple times with ultra-high purity (UHP) N2 gas. Vials were filled with ~40mL sample, were then sealed with Viton and silicone septa, secured with caps, and re-weighed to calculate seawater volume. Each vial was then injected with 0.5 mL of 85% H3PO4 (Fisher Scientific #A260500) using a 5mL gas-tight glass syringe (Hamilton #81520) and a 23-gauge side-port needle (Fisher Scientific #14815488). Acidified samples were gently shaken and heated in a block at 75°C for 2 hours.
Isotopic standards were prepared using in-house carbonate standards (Fm = 0.9444 ± 0.0018; Coral STD, UC Irvine), IAEA-C2 travertine (Fm = 0.4114 ± 0.0003), and 14C-free NaHCO3 (Fm = 0, uOttawa). Standards were weighed and transferred in a glove bag into pre-cleaned 60 mL I-Chem vials, along with 40 mL of stripped standard water (100 mL of Milli-Q water stripped with UHP N2 gas for 15 minutes) and sealed. Standards were then acidified with 0.5 mL of 85% H3PO4 and heated at 75°C for 2 hours.
Combusted OX-1 (Fm = 1.0398), OX-2 (Fm = 1.3407) standards and in-house Glycine (Fm = 0) were used as modern normalization standards and dead process blank standards during AMS sample analysis. These standards were weighed into pre-baked (540°C/2 hrs) 6 mm quartz tubes with ~150 mg of CuO, sealed under vacuum and combusted (850°C/3 hrs). Combusted standards were then expanded into a vacuum line to cryogenically purify the resultant CO2 that was then graphitized using the sealed-tube Zn method (Xu et al., 2007).
DIC samples and standard headspace was extracted using a pre-flushed 60 mL BD Luer-Lock syringe equipped with a BD 2.5 cm needle and inserted into the vacuum line system through a septum. The CO2 was then cryogenically purified with liquid nitrogen and quantified manometrically. Purified CO2 was graphitized using the sealed-tube Zn method (Xu et al., 2007), pressed into targets at uOttawa and analyzed for Δ14C at the Keck Carbon Cycle AMS facility at the University of California Irvine. DIC radiocarbon data is reported as Fraction Modern (Fm), Δ14C and apparent 14C age following the conventions set forth by (Stuiver and Polach, 1977) and corrected for year of sample collection and for modern vs. dead C blanks associated with sample preparation and extraction.
Our measured DIC Δ14C values include contributions of both atmospheric “bomb” 14C (from 1950s above-ground thermonuclear weapons testing) and fossil (anthropogenic) CO2 that are incorporated into the DIC reservoir through air-sea gas exchange. This DIC mixture is expressed in Equation 1.
We use two methods to correct DIC Δ14Cmeasured values to Δ14Cnatural values which can then be used to estimate a 14C-residence time for BBDW. The potential alkalinity method (Palk) proposed by Rubin and Key (2002) was used to separate the amount of Δ14Cbomb from Δ14Cnatural. Palk is first calculated using measured total alkalinity (AT), then corrected for biological activity using nitrate concentrations and normalized to salinity (Equation 2). Δ14Cbomb corr was then calculated based on the regression statistics between global Δ14C versus potential alkalinity measurements (Equation 3) corrected for a global surface potential alkalinity value of 2320, known as Palk0. Δ14Cbomb was determined by calculating the difference between Δ14Cmeasured and Δ14Cbomb corr for each sample.
The amount of anthropogenic carbon present in DIC (DICanth) was calculated by using the quasi-conservative tracer (ΔC*) method following Lee et al. (2003). ΔC* is calculated using measured DIC (DICmeasured) and alkalinity concentrations (AT) in Equation 4 and is reported in µmol kg-1. O2 measured and O2 eq represent measured oxygen concentrations and oxygen saturation levels at a given temperature and salinity, respectively. Preformed alkalinity concentrations are determined using Equation 5. Here, NO represents the relationship between oxygen and nitrate concentrations (Equation 6) and RC:O and RN:O represent the stoichiometric ratios which relate inorganic carbon (C), nitrate (N), and dissolved oxygen (O). RC:O and RN:O are based on the Redfield Ratio proposed by (Anderson and Sarmiento, 1994). DICeq is the DIC in equilibrium with pre-industrial atmospheric CO2 levels with a fugacity of 280 μatm (Equation 7).
Final DICanth concentrations are calculated using Equation 8, with ΔDICdiseq values from Lee et al. (2003) based on seawater potential density. In our study, DICanth values <5 µmol kg-1 were assumed to contain zero DICanth (see Supplementary Table 2).
In comparing North Atlantic vs. Baffin Bay DICanth and Δ14Cbomb depth profiles, we find that the Palk proxy grossly overestimated Δ14Cbomb values for depths shallower than 400m. We found estimated DICanth values via the ΔC* proxy gave realistic values, albeit lower than in the North Atlantic. Both proxies were parameterized for the subtropical North Atlantic and have recognized limitations at high latitudes (Rubin and Key, 2002; Lee et al., 2003).
To correct our Δ14Cmeasured for DICanth and DICbomb Δ14C contributions, a two-endmember mixing model was used to determine the Δ14C per mil equivalence of DICanth, that accounts for DICanth, DICmeasured, and a Δ14Canth value of -1000‰. For stations above 500m, only the per mil equivalence DICanth was subtracted from Δ14Cmeasured. For stations below 500m, both Δ14Cbomb and the per mil equivalence of DICanth were subtracted from Δ14Cmeasured, to determine Δ14Cnatural. DIC Δ14Cnatural values were converted to a fraction modern (Fm) value and then to an apparent 14C-age based on a half-life of 5730 years. To calculate a residence time of the region, we used DIC Δ14C and other relevant measurements from the A16N line in the North Atlantic in 2013 (https://cchdo.ucsd.edu/cruise/33RO20130803). DICanth and Δ14Cbomb corrections made to Δ14Cnatural values and a corrected apparent 14C-age.
DIC δ13C values ranged from -0.7‰ to +1.9‰ across Baffin Bay (Figure 2A). Enriched DIC δ13C values were observed at surface depths (+0.7‰ to +1.9‰) and depleted DIC δ13C were observed at depths greater than 100m (-0.0‰ to -0.7‰). Surface DIC δ13C values (less than 20m) were enriched along the coast of Greenland and in the Northern gateways (stations BB18, 227, 210, 108 and 323; δ13C = +1.3 ± 0.4‰, n = 12), while more depleted values were found along Davis Strait and central Baffin Bay (stations 193, 196, BB2, and 224; δ13C = +0.9 ± 0.3‰, n = 8). Mid-depth (200 – 700m) DIC δ13C ranged from -0.4‰ to +0.2‰, with slightly depleted values found at stations BB18 and 227 (δ13C = -0.30 ± 0.07‰; n = 4). Below 750m in Baffin Bay, DIC δ13C values had a narrow range (-0.28 ± 0.16‰; n = 19). Deep water (>1200m) at Station 224 was more depleted (-0.51 ± 0.11‰; n = 4) than DIC δ13C values at station BB2 (-0.27 ± 0.07‰; n = 4).
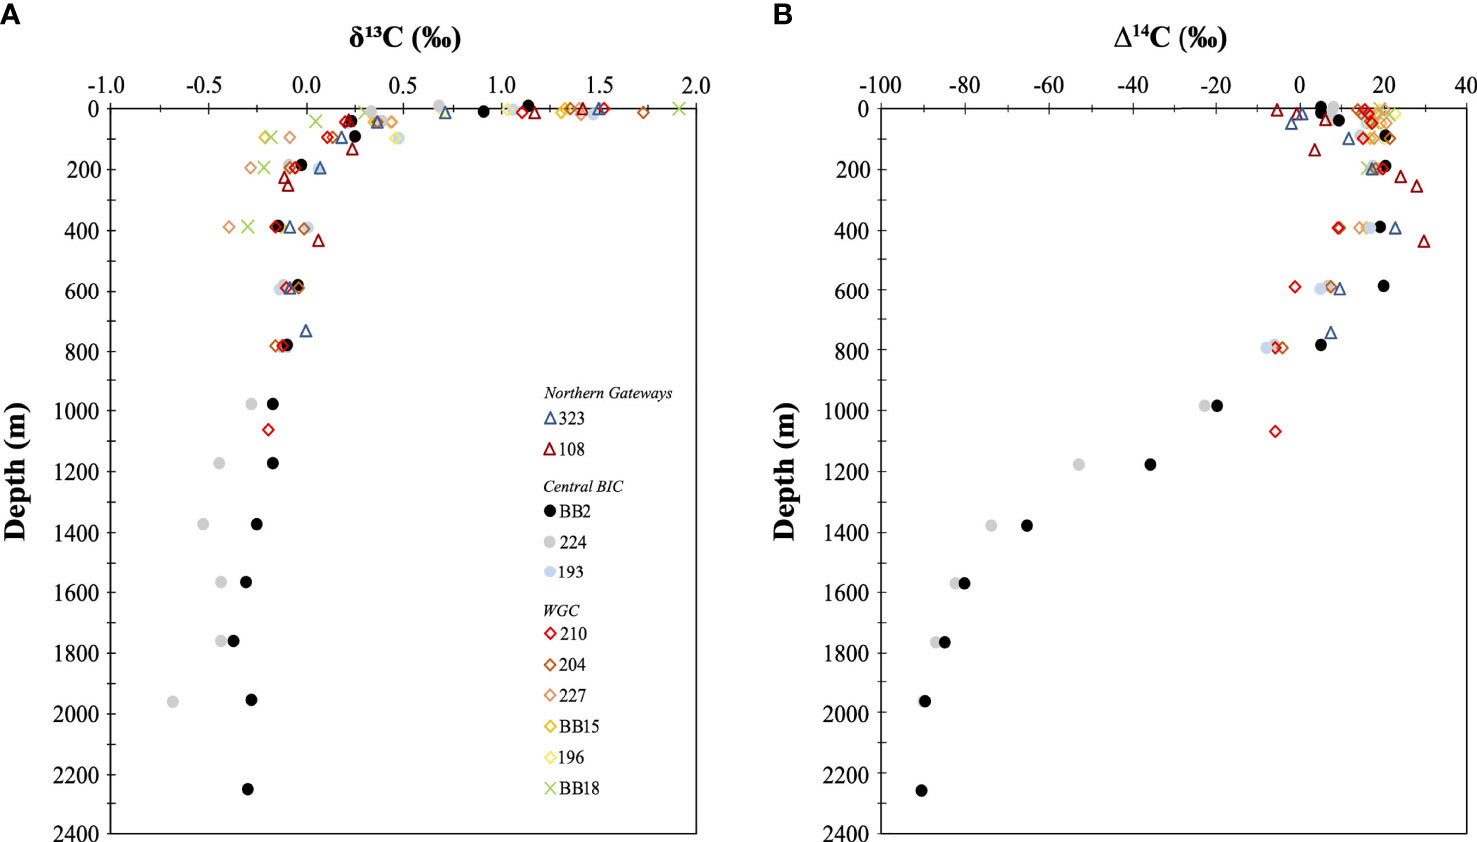
Figure 2 Depth profiles of DIC δ13C and Δ14C values in Baffin Bay. (A) measured DIC δ13C values, ± 0.1‰ (See Stable Isotope (δ13C) Analysis). Different sampled stations (Figure 1) indicated by legend, which cover the extent of the Baffin Island Current (BIC) in central Baffin Bay (circles), the Western Greenland Current (WGC) along the coast of Greenland, (diamonds). and the Northern gateways of Nares Strait and Lancaster Sound (triangles). (B) DIC Δ14C signatures, with errors ranging between ±1.2 to 2.0‰ (See “Natural Abundance Radiocarbon (Δ14C) Analysis” and “Estimation of Anthropogenic (DICanth) and “Bomb” DIC 14C”).
Our measured Baffin Bay DIC Δ14C values had a ~120‰ range (from –90.0‰ to +29.8‰; Figure 2B). Surface (less than 20m) DIC Δ14C values ranged between -5.4‰ to +22.9‰. Positive surface DIC Δ14C were found along coastal Greenland (stations 196, BB15, BB18, 227 204, and 210; Δ14C = +17.6 ± 2.5‰, n = 12). In contrast, more negative DIC Δ14C surface values were found in the Northern gateways (stations 108 and 323; Δ14C = -1.7 ± 3.3‰, n = 3). Surface DIC Δ14C values at central stations (193, BB2, 224) fell between these two end members (Δ14C = +8.5 ± 3.7‰; n = 6). Mid-depth waters (200 – 700m) had DIC Δ14C between -1.11‰ and +29.8‰, with positive Δ14C values found in Northern Baffin Bay (stations BB2, 108, and 323; Δ14C = +23.8 ± 3.9‰, n = 7). Below 750m, DIC Δ14C values gradually decreased from +7.7‰ to –90.0‰, with the deepest water (1400 – 2400m) having the most negative Δ14C values (-82.2 ± 8.5‰; n = 9).
Wide ranges in Baffin Bay surface water salinity and temperature were observed (Figures 1B, C; Figures 3A, B). Surface water (above 50m) on the western side of Baffin Bay was cooler and fresher, while surface water on the eastern side was warmer and more saline (Fox and Walker (2022), accepted). We note that the Ocean Data View interpolation of n=52 stations from Baffin Bay in Figure 1 are meant for visualizing these differences and do not reflect the true spatial structure of temperature or salinity. These surface water summer conditions are influenced by surface processes such as solar insulation, wind-driven mixing, and ice melt (Fissel et al., 1982). Surface water variance is also influenced by the current systems within Baffin Bay. Baffin Bay is a marginal sea ice zone experiencing full sea-ice coverage from December to April. Due to the relatively warm West Greenland Current, ice cover decreases earlier along the Greenland coast than on the western side of Baffin Bay . By late summer, Baffin Bay is typically clear of extensive sea-ice, although icebergs are common, especially in proximity to fjords. Sources of freshwater in Baffin Bay include local precipitation, river runoff, sea ice, ice bergs and glacial meltwater, and the Arctic Ocean outflow. It is estimated Baffin Bay has a total river inflow of ~100 km3 y-1 (Shiklomanov et al., 2020). Work by Azetsu-Scott et al. (2012) suggests that glacial melt on the Greenland Shelf comprises ~6% total freshwater and that Arctic outflow water from the CAA and Northern Gateways dominates freshwater flux in Baffin Bay (~60% in Western Davis Strait). The Arctic outflow water from the CAA includes Pacific (31.5 < S < 33), sea ice meltwater and meteoric (Mackenzie R. and CAA tributaries) water endmembers. A small portion of meteoric water enters Baffin Bay via Nares Strait from Russian rivers (Mungall et al., 2017; Burgers et al., 2017).
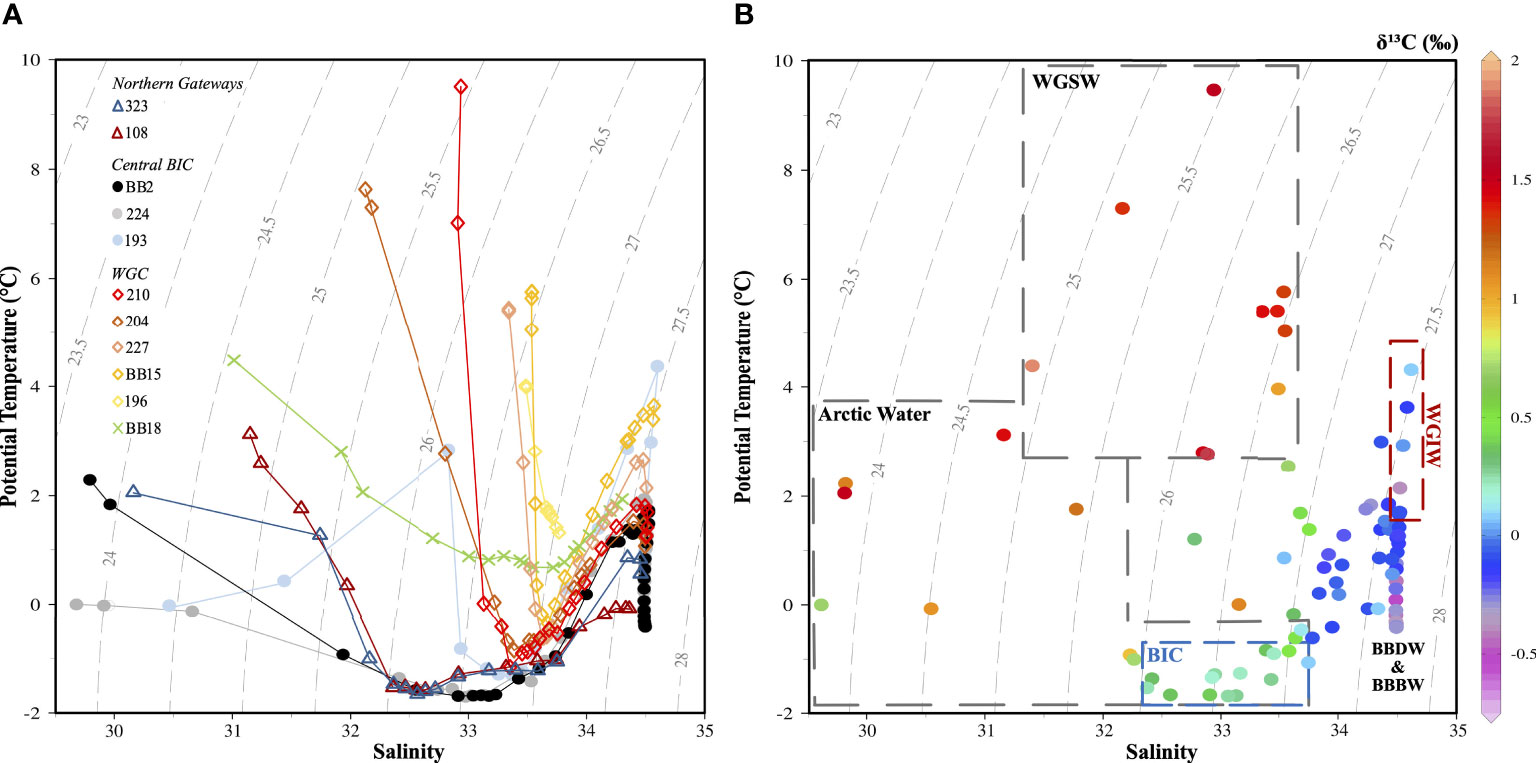
Figure 3 Potential temperature-salinity diagram with DIC δ13C values throughout Baffin Bay. (A) Bottle salinity and potential temperature values plotted for each collected station. Different sampled stations (Figure 1) indicated by legend; Baffin Island Current (circles), Western Greenland Current (diamonds), Northern gateways (triangles). Dashed grey lines represent potential density anomaly contours. (B) Potential temperature versus salinity with DIC δ13C (color bar). Dashed boxes indicate designated currents and water masses; Arctic Water (AW), western Greenland shelf water (WGSW), Baffin Island current (BIC), West Greenland Irminger water (WGIW), and Baffin Bay deep and bottom water (BBDW; BBBW). Note: fewer data points on plot b are since not all Niskin bottle depths were sampled for DIC δ13C.
Baffin Bay water masses are indicated on Figure 3B. Two main surface currents dominate Baffin Bay: the Baffin Island Current (BIC) and the West Greenland Current (WGC). The BIC is a southerly flowing current containing Arctic Water (AW) to depths of 300m and has water temperatures <-1.6°C and salinities <33.8 (Münchow et al., 2015). AW enters Baffin Bay via the Northern Gateways (Nares Strait and Lancaster Sound) and is modified through glacial and sea ice discharge (Curry et al., 2011). In this study, AW was observed at both central stations (BB2, 224) between 100-300m. Western Greenland Shelf Water (WGSW) was evident along the coast of Greenland and was both warm (7°C) and saline (34.1), with a density anomaly (σθ = ρθ – 1000, where ρ is density and θ indicates potential temperature) ranging between 25.5 and 27.3 kg m-3. WGSW is composed of waters from the East Greenland Current (EGC), which originate from AW exiting through Fram Strait and later enter Baffin Bay via the WGC (Cuny et al., 2002). As the WGSW progresses northward along the WGC extension, it becomes fresher and cooler, due to mixing with glacial meltwater (Münchow et al., 2015).
At depth, several water masses are present in Baffin Bay. West Greenland Irminger Water (WGIW) is defined by salinities >34.1, potential temperatures >2°C, and a density anomaly range of 27.3 to 28 kg m-3 (Curry et al., 2011). WGIW originates from warm, saline water found in the Irminger Sea. Transitional Water (TrW) found below 250m, is modified AW that has mixed with WGIW (Curry et al., 2011). The TrW typically has temperatures >2°C, salinities <33.7, and σθ of 25.5 – 27.3kg m-3 (Curry et al., 2011). Baffin Bay Deep Water (BBDW) has a temperature and salinity of 0°C and ~34.5, respectively, and is found between 1200 and 1800m (Curry et al., 2011). Baffin Bay Bottom Water (BBBW) has a temperature and salinity of -0.4°C and ~34.5, respectively. BBBW is more difficult to distinguish using temperature, salinity, and water mass density alone (Lehmann et al., 2019).
Surface DIC δ13C values can provide useful constraints on DIC source contributions. In Baffin Bay there are several possible DIC sources in the BIC and WGC, including: Pacific, North Atlantic, Arctic water, regional sea ice melt and glacial melt water. The many surface DIC sources in Baffin Bay results in a diversity of isotopic endmember values that could also contribute to deep-water DIC δ13C values. Understanding the processes shaping surface DIC δ13C distributions are therefore important to understanding the DIC cycle within Baffin Bay. Here we discuss surface and intermediate water DIC δ13C values as water mass tracers.
Our observed depth trends in DIC δ13C values are broadly consistent with the open ocean. Surface DIC δ13C values are enriched, whereas deep DIC δ13C values are depleted (Figures 2A, 3B). These trends in DIC δ13C are attributed to air-sea gas exchange with some isotopic fractionation of CO2 across the air-liquid boundary and to a much lesser extent the fractionation of organic carbon through photosynthesis (Zhang et al., 1995). Depleted DIC δ13C values at depth can be attributed to the preferential oxidation of 13C-depleted sinking particulate and dissolved organic matter (POM; DOM) via heterotrophic respiration. Older aged water masses typically contain depleted DIC δ13C values, since there is more time for remineralization (Kroopnick, 1985; Emerson and Hedges, 2008).
Surface (above 20m) DIC δ13C is variable in Baffin Bay. The warm WGSW along the coast of Greenland contains enriched DIC δ13C values (>+1.03‰). These values are consistent with previously reported DIC δ13C from the North Atlantic along the southern tip of Greenland (+1.09 to +1.90‰; Humphreys et al., 2016). Within WGSW, we observe an increase in surface DIC δ13C values from station 196 to 210 (+1.03 to +1.90‰, respectively). One possible explanation for this trend is high nutrient loading from melting Greenland glaciers, leading to enhanced primary production and enriched DIC δ13C values as the WGC flows north. For example, station BB18, located in the Viagat Fjord behind Disko Island, had the highest surface DIC δ13C (+1.90‰). This station also had high POM and chlorophyll-a concentrations due to an abundance of diatoms (Fox and Walker (2022), accepted; Lovejoy pers. comm.). This marginal sea ice region and the inflow of saline Atlantic water have been previously shown to promote primary production (Krawczyk et al., 2021).
Northern Gateway stations (108 and 323) had enriched surface DIC δ13C values (+0.71 to +1.42‰). Surface water in Smith Sound (Station 108) is a mixture of both the inflow of AW from Nares Strait and WGSW (Hamilton and Wu, 2013). Thus, Station 108 does not represent a pure AW endmember. Surface water in Lancaster Sound (Station 323) contains Pacific Water entering Baffin Bay via the CAA. Enriched surface DIC δ13C values in Lancaster Sound may be indicative of this Pacific influence, which has been observed to have DIC δ13C values up to +2.20% in the Amundsen Gulf (Mol, 2017). Lancaster Sound is also a region of seasonal sea ice cover, high nutrient, primary production, and diatom species richness (Krawczyk et al., 2021). These factors contribute to the enriched surface DIC δ13C values at Station 323. Variability in surface DIC δ13C in Baffin Bay can also be attributed to sea-ice and glacial melt, as evident in large ranges in observed surface salinity as shown in Figure 3A.
Central Baffin Bay stations BB2 and 224 had more depleted surface DIC δ13C values (+1.06 to +1.50‰) than Eastern Baffin Bay stations along coastal Greenland (Figure 3). These lower DIC δ13C values coincide with AW within the BIC. The Arctic Ocean is covered in sea ice for most of the year, inhibiting air-sea gas exchange and increasing the time in which heterotrophic respiration can result in depleted DIC δ13C values (Morée et al., 2018). DIC δ13C values within the BIC (20 – 200m; +0.07 to +0.37‰) are significantly higher than that of WGIW (-0.39 to +0.07‰), reflecting more recent air-sea gas exchange in the BIC vs. older, intermediate water (Münchow et al., 2015).
Overall, the trends we observe in DIC δ13C values in temperature-salinity space (Figure 3B) suggest that DIC δ13C can be used as an effective tool for distinguishing carbon sources within water masses. A simple least squares regression of DIC δ13C (y) and potential density (x) resulted in statistically significant correlations at all stations in Baffin Bay; in particular for coastal Greenland (R2 = 0.78-0.98) and Northern Gateways stations (R2 = 0.85-0.96; see Table S3 and Figures S1 and S3). Surface DIC δ13C variability is strongly affected by sea-ice melt (more positive DIC δ13C) and the inflow of saline Atlantic water (more negative δ13C). This is especially true for several coastal Greenland stations adjacent to large fjord regions (Stations BB18, 227, 210; Figure S4 and Table S5). In contrast, deep DIC δ13C variability is driven by slow heterotrophic respiration at depth. This is indicated by depleted DIC δ13C values >1000m (σθ = ~27.7 kg/m3) at stations 224 and BB2 (-0.27 to -0.68‰ at 1000 to 2000m and -0.16 to -0.36‰ at 1200 to 2300m, respectively).
We observe a wide range in DIC Δ14C values within Baffin Bay (-90.0‰ to +29.8‰; Figure 2B). DIC Δ14C values can reflect water mass aging via radioactive decay, varying degrees of recent air-sea gas exchange or allochthonous DIC Δ14C sources. For example, the advection of waters with different 14C reservoir ages (i.e., surface DIC Δ14C vs. atmospheric Δ14C offsets). With deep-water formation, modern surface DIC Δ14C can also contribute to observed deep ocean DIC Δ14C values (e.g., in the North Atlantic Ocean; Broecker et al., 1960).
Surface (<20m) DIC Δ14C ranged between -5.4‰ to +22.9‰. Surface DIC Δ14C values at Greenland stations (196, BB15, 227, 204, 210) had the most positive DIC Δ14C values (+14.3‰ to +22.9‰). These values represent positive DIC Δ14C endmembers from the North Atlantic at depths <150m (+30.2‰ to +62.3‰; Bullister and Barigner, 2020), indicating the WGSW has a large impact on DIC Δ14C values in Eastern Baffin Bay. Previous studies have noted summer upwelling of warmer, saline WGSW along Greenland (Melling et al., 2010) which would clearly contribute DIC with positive Δ14C values.
Surface water (above 20m) at the Northern gateway stations (108, 323) had far lower DIC Δ14C values (-5.4‰ to +0.9‰). These stations contain Arctic and CAA contributions to the Smith and Lancaster Sounds, respectively. Surface DIC Δ14C values in the Amundsen Gulf and Beaufort Sea range between -35‰ to +19‰, whereas a value of +52‰ was measured in the Eurasian Basin (Druffel et al., 2017). Thus, the lower DIC Δ14C values we observe in Lancaster Sound (station 323) are consistent with advection of Pacific water with low DIC Δ14C to Baffin Bay from the CAA. Pacific water nutrient contributions to Baffin Bay were recently reported (Lehmann et al., 2019), again suggesting this is a plausible explanation for our low Station 323 DIC Δ14C values. The low DIC Δ14C values we observe for Smith Sound (Station 108) are likely impacted by both AW entering from the Lincoln Sea and WGC water. While no DIC Δ14C data exist for the Lincoln Sea, this station experiences extended periods of sea ice cover – inhibiting air-sea gas exchange and likely resulting in lower surface DIC Δ14C values.
Surface DIC Δ14C values in central Baffin Bay are modern (BB2, 224; +5.8‰ to +15.7‰) and possibly comprise a mixture of low AW DIC Δ14C with positive DIC Δ14C from WGSW and the influence of seasonal sea ice cover. At these stations, large DIC Δ14C gradients (-90.0 to +20.6‰) were present in deep (>500m) water of similar densities (σθ = 27.56 to 27.72 kg m-3). Below 1200m, DIC Δ14C values gradually decrease from -35.4‰ to -90.0‰ (or 225 to 675 14C-years) towards the bottom (σθ = 27.70 ± 0.02 kg m-3, BBDW). Unlike DIC δ13C, no significant relationships were found between potential density and DIC Δ14C (Table S4; Figure S2). This is because similar, modern DIC Δ14C values were measured across large surface salinity (and density) gradients. Conversely, at Stations BB2, 224, large gradients in DIC Δ14C values were present in mid-depth (500-1200 m) waters of relatively invariant σθ (e.g., 27.7 kg m-3; Figures 2B; S2F, G).
While the distributions of DIC Δ14C appear consistent with the physical oceanography of Baffin Bay, measured DIC Δ14C values can also include atmospheric “bomb” carbon (Δ14C = -1000‰; Mahadevan, 2001; Sweeney et al., 2007) or anthropogenic fossil fuel carbon (DICanth; Carter et al., 2019). The contribution of DICanth and Δ14Cbomb are ever present in the modern global surface ocean, but their relative contributions and depth of infiltration in the water column vary widely. Since our goal is to derive a 14C-based residence age of Baffin Bay, we next quantify these contributions to deep Baffin Bay water.
Our estimates of Δ14Cbomb using the Palk method (see Estimation of Anthropogenic (DICanth) and “Bomb” DIC 14C) for Station BB2 are shown in Figure 4. Both DIC Δ14Cbomb and Δ14Cbomb corr values are highly unconstrained above 400m, with very negative Δ14Cbomb corr values and very positive Δ14Cbomb values beyond what would be reasonably expected for seawater DIC Δ14C in 2019. This is a known limitation of the Palk proxy which was parameterized for the subtropical and tropical Atlantic (<60°N/S) with salinities averaging 36.31 ± 0.35, and surface alkalinity averaging 2377 ± 22 µmol kg-1 (Jiang et al., 2014). In comparison, surface Baffin Bay salinity and total alkalinity values average 32.2 ± 1.2 and 2194 ± 59 µmol kg-1, respectively. Lower surface salinity and alkalinity values, combined with seasonal sea ice cover in Baffin Bay, limits the application of the Palk method in the Arctic. The overestimation of bomb Δ14C above 400m in Baffin Bay is particularly telling. At their peak, global surface DIC Δ14C values reached +200‰ in the late 1960s (Rodgers et al., 2000). We note that Rubin and Key (2002) recognized the Palk proxy predicts lower than expected Δ14Cbomb corr values north of 58°N and suggested a more reliable calibration value (Palk0) of 2330 µmol kg-1 for high latitudes. However, we find surface Δ14Cbomb corr values to remain unconstrained even using this Palk0 value and that more work is needed to refine the Palk proxy in the Arctic.
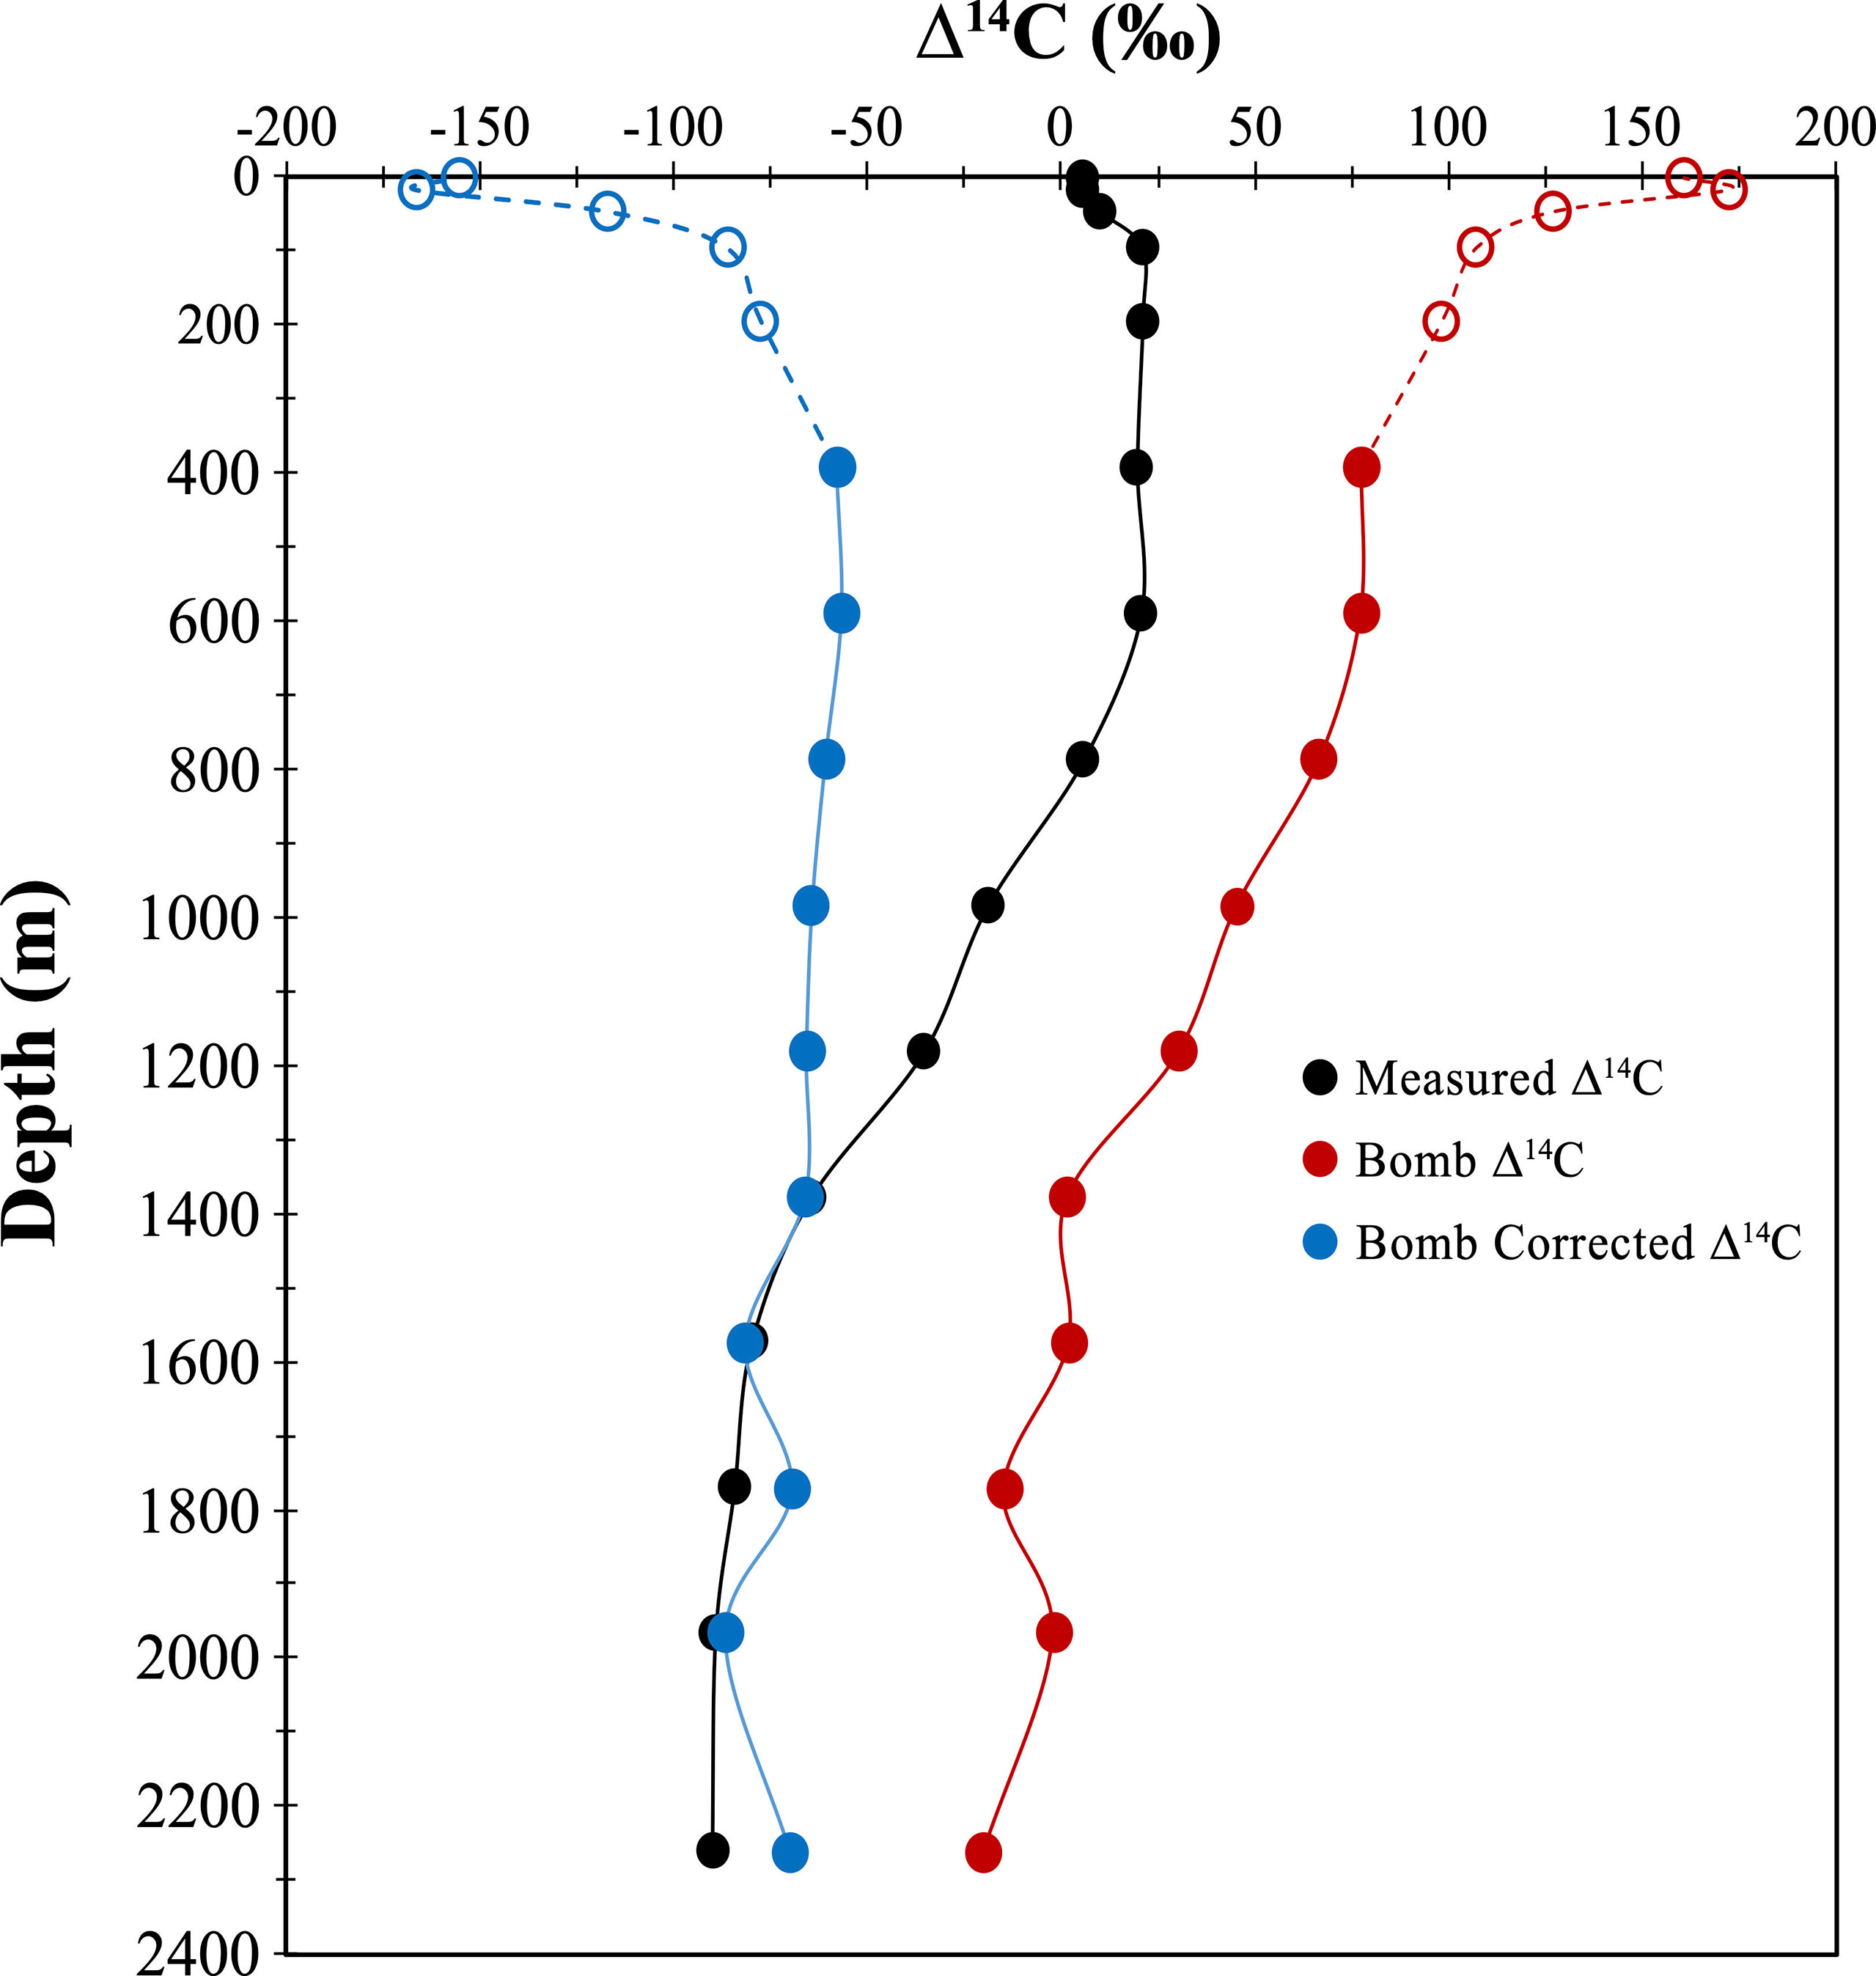
Figure 4 Calculated bomb Δ14C and natural Δ14C values for Baffin Bay deep water. Measured DIC Δ14C values for deepest station collected in Baffin Bay, BB2 (Figure 1). Calculated Δ14Cbomb and Δ14Cbomb corr values derived using the Potential Alkalinity (Palk) method (Rubin and Key, 2002) method (see Estimation of Anthropogenic (DICanth) and “Bomb” DIC 14C). Dashed lines and open circle indicate overestimated bomb and underestimated natural Δ14C values above 400m.
Despite the unconstrained surface estimates of Δ14Cbomb and Δ14Cbomb corr, these parameters provide realistic values at depth (Figure 4). The confluence of the corrected and measured values suggests the Palk proxy can accurately predict Δ14Cbomb corr at depth, and an absence of Δ14Cbomb in BBDW and BBBW. We believe the reliability of the Palk proxy below 400m can be attributed to the similar salinity, nitrate, and alkalinity values in North Atlantic Deep Water (NADW) and deep Baffin Bay. For example, NADW below 1200m in the tropics (35°N to Equator) has average salinity and alkalinity values of 35.4 ± 1.1 and 2371 ± 37 µmol kg-1, respectively (Takahashi et al., 1981). Average salinity and total alkalinity values below 1000m in BBDW are 34.39 ± 0.01 and 2290 ± 13 µmol kg-1, respectively. While these deep ocean values are not identical, it appears that they fall within a range for which the Palk proxy was developed (i.e., closer to deep sub-tropical Atlantic values). Because deep water alkalinity is globally less variable than surface waters, it is also possible the Palk method is simply more robust in deep waters than in surface waters. Ultimately, since we can find no evidence of Δ14Cbomb below 1400m, there is no need to correct our deepest measured DIC Δ14C values for Δ14Cbomb when determining a 14C-based residence time.
Calculated DICanth concentrations suggest an influx of DICanth via Davis Strait (Figure 5). At Station 193, DICanth = 25 - 40 µmol kg-1 between 100 and 400 m and at Station 196, DICanth = 20 - 33 µmol kg-1 at 0-100m (Figures 5A, B; Table S2). DICanth enters Davis Strait via the WGC and advects north within WGSW into central Baffin Bay. Davis Strait DICanth concentrations are only slightly lower than those previously reported for the North Atlantic (Lee et al., 2003). Thus, we conclude the North Atlantic supplies significant DICanth to Baffin Bay. DICanth contributions were lower at our Northern Gateway stations 108 and 323 (9.4 to 41.5 µmol kg-1), and no DICanth was found below 100m at these stations. Between 150-300m the southward BIC also contains little DICanth. We note that the Ocean Data View interpolation in Figure 5 is from a limited number of stations, and thus meant for illustrative purposes only. The Ocean Data View distributions does not necessarily reflect the fine-scale spatial structure of DICanth in Baffin Bay.
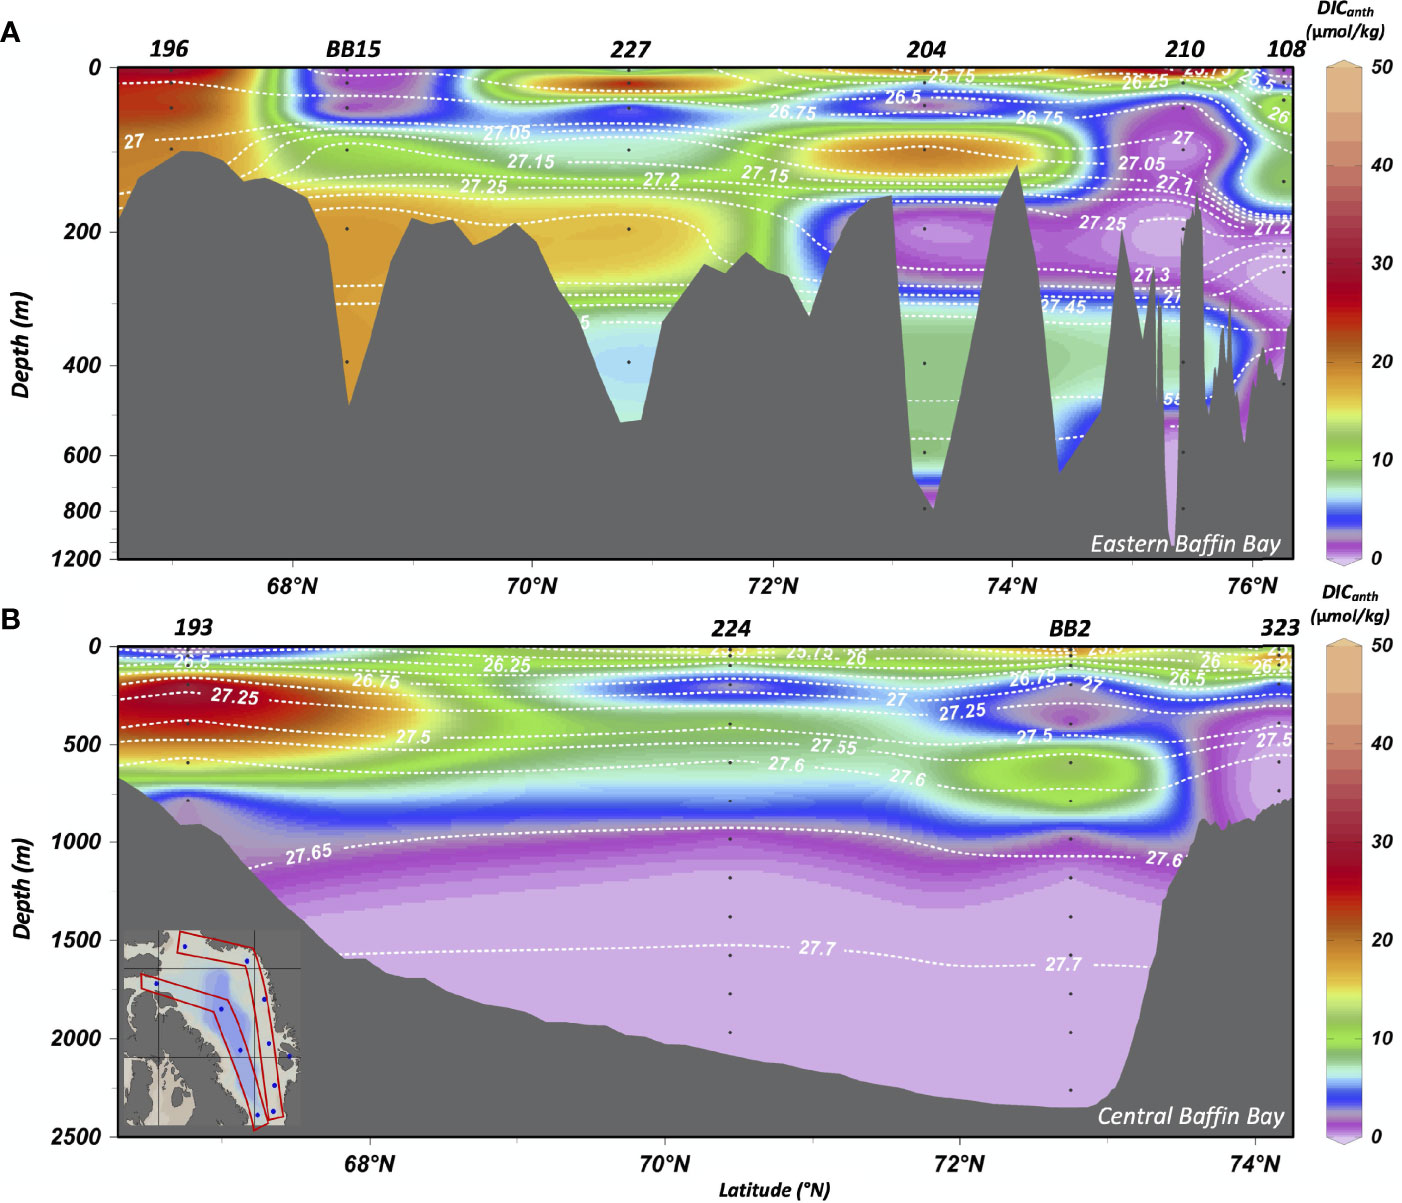
Figure 5 Calculated DICanth concentrations found throughout central and Eastern Baffin Bay. Distributions of DICanth concentrations plotted from two transects along (A) the west coast of Greenland and (B) central Baffin Bay, as indicated by the inset on b). DICanth concentrations calculated based on methods by Lee et al. (2003). DICanth values <5µmol kg-1 are assumed to contain zero DICanth (See Estimation of Anthropogenic (DICanth) and “Bomb” DIC 14C). Sample depths and locations are indicated by black dots, with station names labelled at the top of the plots. Dashed white contours are density anomaly (σθ in kg m-3) isopycnals. We note that Ocean Data View interpolations of DICanth (from n=11 stations) are meant for interpretation and do not reflect an accurate spatial distribution of DICanth.
Although we are the first to apply the ΔC* proxy to Baffin Bay, Earth System models estimate low DICanth inventories in the Arctic due to seasonal sea ice and limited air-sea gas exchange (Tjiputra et al., 2010). Lee and co-workers (2003) also found low DICanth inventories in surface waters at higher Atlantic Ocean latitudes (~65°N). Low DICanth at higher latitudes may also be attributed to mixing of intermediate waters with deeper “DICanth free” water. Short residence times (~2 years) of surface water within Baffin Bay may also limit the region’s surface DICanth inventories (Rudels, 1986; Poisson and Chen, 1987; Hoppema et al., 2001). Large volumes of water are annually exported south through Davis Strait (2.3 ± 0.7 Sv; Curry et al., 2011) perhaps also precluding the BIC from containing significant DICanth (Figure 5).
Above 50m, DICanth is variable in Baffin Bay. High DICanth is found in surface water along the coast of Greenland (29-46 µmol kg-1) although surface DICanth was not found in the Vaigat Fjord (Station BB18) and on the west side of Davis Strait (193). Such wide-ranging DICanth in surface waters directly in contact with the atmosphere demonstrates limitations in the ΔC* proxy at low temperatures and salinities. Like the Palk method, the ΔC* proxy was also developed for the mid-latitude open ocean. As a result, many of our surface DICanth values had high errors and/or negative values. The ΔC* proxy however appears to provide more reasonable estimates of anthropogenic carbon in surface water than the Palk method does for Δ14Cbomb. With the limitation of the Palk method throughout Baffin Bay surface water, we assume the absence of Δ14Cbomb when DICanth is undetectable. As mentioned in section 2.5, DICanth values <5 µmol kg-1 (including negative values) were considered free of DICanth (0 µmol kg-1). Despite these DICanth proxy limitations, we do not observe the presence of DICanth in Baffin Bay below 800m. We believe this to be reasonable given the absence of Δ14Cbomb in BBDW. Thus, our deep water measured DIC Δ14C values do not require further correction for the addition of fossil C.
The formation of BBDW and BBBW is a topic of ongoing debate. Two main formation mechanisms have been proposed: mixing of cold, saline, brine-enriched surface shelf water with either Arctic Intermediate Water in Nares Strait and Smith Sound (Bailey, 1956; Collin, 1965; Bourke et al., 1989; Bourke and Paquette, 1991) or with Labrador Sea intermediate water entering via Davis Strait (Tang et al., 2004). Some research has argued that the depth of convective mixing from freezing would be too shallow (<100m) to produce the bottom water in Northern Baffin Bay (Muench, 1970), but this would not necessarily preclude downslope transport of dense water from northern shelves (Tang et al., 2004).
To constrain a 14C-residence age for deep Baffin Bay, it is important to consider each of these formation mechanisms. The addition of winter brine to AW at intermediate depths in Smith Sound has been previously supported by temperature, salinity and δ18O isotopic data (Bailey, 1956; Tan and Strain, 1980). Nares Strait is a relatively shallow region (~200m in Kane Basin). The potential density anomaly at 225m in Station 108 was 27.27 kg m-3, which would not be dense enough to contribute directly to BBDW (σθ = 27.72 kg/m3). However, Bourke et al. (1989) suggested that mixing brine-enriched winter waters produced in the North Water Polynya in Smith Sound, with Arctic Intermediate Water could produce deep water densities. If we use measured DIC Δ14C values from 200-300 m at Station 108 (where Cath was not detected and presumably little additional bomb Δ14C is present; Table S2) as a deep-water source endmember (Δ14C = +26.3‰; n = 2), then the 14C residence time of BBDW (σθ > 27.7 kg/m3, Δ14C = -90.7‰) would be roughly approximate to its apparent 14C age (690 ± 35 years).
The second plausible source of BBDW is water entering Davis Strait from the Labrador Sea over a 640m depth sill. Sverdrup et al. (1942) suggested the cooling of Labrador Sea deep water with winter surface water brine as a formation mechanism. The WGC is cooler and fresher than the EGC (3.0°C < θ < 5.5°C and 34.4 < S < 35.0) or the Irminger Current (3.5°C < θ < 5.5°C, S ~ 35.0; Lobb, 2004). In the northern Labrador Sea, the Irminger Current lies below the WGC (Rykova et al., 2009). As it flows northward, the upper portion of the Irminger Current mixes with the cooler and fresher WGC (Cuny et al., 2002). Inflow of WGIW via Davis Strait is seasonal and extends to depth of up to 1000m during the fall (Curry et al., 2014).
We use North Atlantic DIC Δ14C values (A16N GO-SHIP, Station 4; Bullister and Barigner, 2020) from the Davis Strait sill depth (640m) with a density anomaly (σθ = 27.53 to 27.67 kg m-3) as a second source endmember from which to estimate a 14C residence time for Baffin Bay. We applied both the Palk and ΔC* proxies to correct for Δ14Cbomb and DICanth from measured North Atlantic DIC Δ14C to determine a Δ14Cnatural depth profile (Figure 6). Both proxies provided robust estimates of Δ14Cbomb and DICanth for the North Atlantic station, consistent with previously published values (Rubin and Key, 2002; Lee et al., 2003). This North Atlantic BBDW source end-member was determined to have a 14C-age of 330 ± 35 years. Subtracting this age from the apparent 14C age of BBDW (690 ± 35 years) results in an estimated 14C residence time of 360 ± 35 years. Since both bomb Δ14C and DICanth are present in the North Atlantic, this BBDW formation mechanism requires extremely slow deep water formation rates.
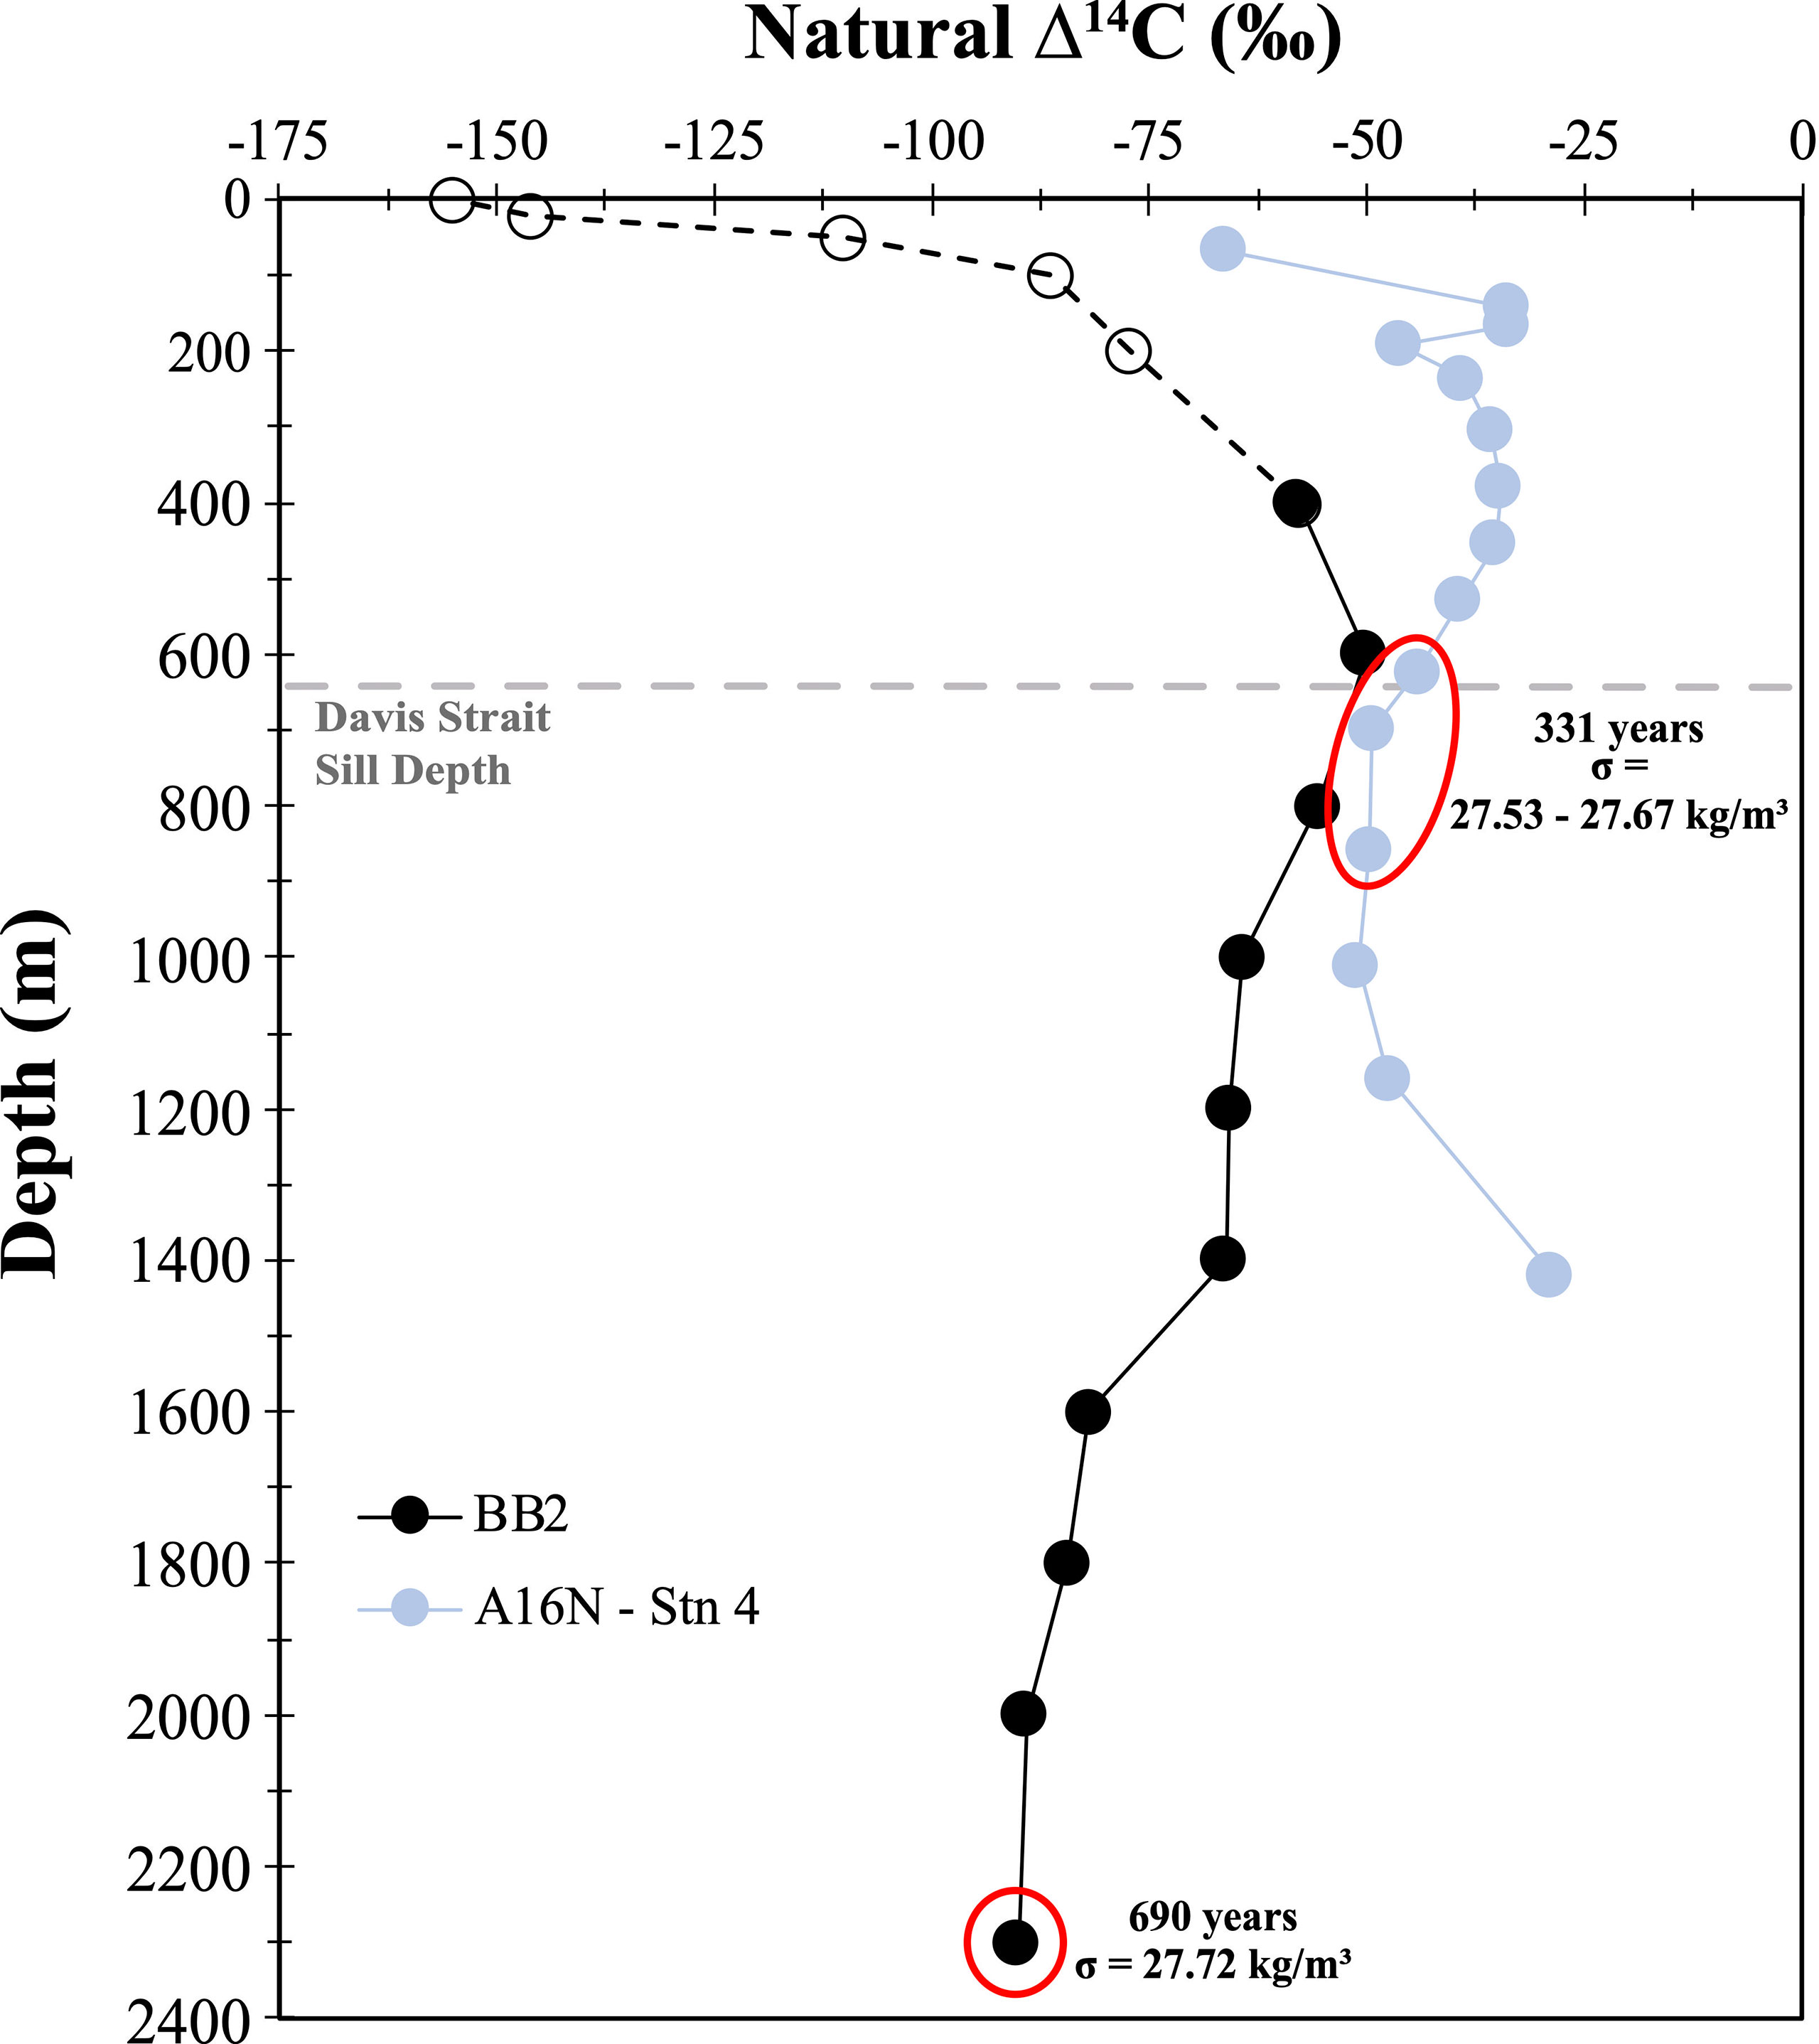
Figure 6 DIC Δ14Cnatural depth profiles, corrected for both Δ14Cbomb and DICanth contributions for Station BB2 and A16N. DIC Δ14Cnatural values from A16N (Station 4; 62.75°N, -20.00°W just south of Iceland) were corrected for DICanth and Δ14Cbomb. Apparent 14C-ages are calculated based on Δ14Cnatural values (see Natural Abundance Radiocarbon (Δ14C) Analysis) for depths with potential densities close to BBBW values (θσ = 27.7 kg m-3). Dashed horizontal grey line indicates depth of the Davis Strait sill, at 640m. Dashed line with open circles for BB2 profile indicate unconstrained Δ14Cnatural values based on limitation of the Palk proxy. Red circles indicate depths at which apparent 14C-ages were calculated.
Our two estimated 14C residence times (360-690 years) for deep Baffin Bay provide new constraints on the ventilation age of this ocean basin. Our residence times fall between those previously estimated for BBDW of 20 to 1,450 years (Sadler, 1976; Top et al., 1980; Wallace, 1985). Both deep water formation mechanisms require cooling and brine rejection during sea ice formation that would increase the local DIC concentration of underlying waters (Rysgaard et al., 2007; Moreau et al., 2016; König et al., 2018). This increase in DIC would also selectively preconcentrate DIC with modern Δ14C (atmospheric), Δ14Cbomb, and fossil (Canth) Δ14C values. Since we do not detect these Δ14C endmembers in BBDW, significant dilution must occur during such a deep-water formation mechanism (e.g., “shaving” of the deep-water plume; Bourke et al., 1989). This would also suggest that our estimated 14C residence times are minimum age estimates. Nevertheless, with a minimum residence time of 360 ± 35years, BBDW has the potential to store carbon on centennial timescales.
Seawater DIC δ13C and Δ14C values place new constraints on the sources and cycling of carbon in the Arctic. Baffin Bay is a dynamic region, with Arctic, Pacific, and Atlantic carbon source endmembers, as well as glacial inputs along the coast of Greenland. Δ14Cbomb and DICanth estimates through the ΔC* and Palk proxies are limited in their scope of application in the Arctic but highlight important DIC source constraints to Baffin Bay water masses. We observe DICanth-replete water entering from the North Atlantic Ocean, DICanth-free AW in Northern Baffin Bay, and no DICanth or bomb Δ14C in BBDW. Using two possible deep water formation mechanisms for BBDW, we determine a Baffin Bay 14C residence time of 360-690 years, suggesting deep Baffin Bay stores carbon for several centuries.
Baffin Bay exports cold, dense water to the Labrador Sea which is critical for North Atlantic Deep Water (NADW) formation (Goosse et al., 1997). Global climate change has resulted in warming and freshening of Arctic surface water exported through Baffin Bay and increased stratification in the North Atlantic Ocean. This stratification is now reducing NADW formation (Caesar et al., 2021). We now observe warming temperatures in the Arctic Ocean acting to reduce sea ice extent but also CO2 uptake (MacGilchrist et al., 2014). With a residence time of 360-690 years, Baffin Bay may partially moderate Arctic climate change through storage of deep carbon on centennial timescales.
The original contributions presented in the study are included in the article/Supplementary Material. Further inquiries can be directed to the corresponding author.
BW conceived the hypothesis and the objectives of this investigation. SZ and BW drafted the manuscript with input from JW, BE, LM, and KA-S. SZ, BW, and JW performed radiocarbon and stable isotopic analysis of DIC samples. LM and KA-S contributed total alkalinity and DIC concentration data. All authors read, edited, and approved the final manuscript.
This work was supported by the Natural Sciences and Engineering Research Council (NSERC) of Canada through a Discovery Grant, Accelerator and Launch Supplements (RGPIN-2020-06501, RGPAS-2020-00071, DGECR-2020-00256; to BW), a Discovery Grant (RGPIN-2015-04780 to BE), the Canada Research Chairs program (BW), the NSERC Alexander Graham Bell Canadian Graduate Scholarship (SZ), the Ontario Graduate Scholarship (SZ), and Fisheries and Oceans Canada. This work is a contribution to ArcticNet, a Network of Centres of Excellence Canada.
The authors declare that the research was conducted in the absence of any commercial or financial relationships that could be construed as a potential conflict of interest.
All claims expressed in this article are solely those of the authors and do not necessarily represent those of their affiliated organizations, or those of the publisher, the editors and the reviewers. Any product that may be evaluated in this article, or claim that may be made by its manufacturer, is not guaranteed or endorsed by the publisher.
We gratefully acknowledge Chief Scientist Alexandre Forest, Anissa Merzouk and the staff of Amundsen Science and the crew of the CCGS Amundsen for the opportunity to participate in the 2019 research cruise. We also would like to thank Dr. Cara Manning for her help in coordinating the sampling and logistics of the Biogeochemistry groups aboard the CCGS Amundsen. Tonya Burgers (University of Manitoba) and Shawn Marriott (University of Calgary) collected DIC and AT samples. Danielle Caleb and Marty Davelaar (Institute of Ocean Sciences) performed DIC and AT analyses. We thank Drs. Xiaomei Xu and John Southon of the UC Irvine Keck Carbon Cycle AMS lab for their expertise and help with 14C analysis, Paul Middlestead, and the staff of the Ján Veizer Stable Isotope Laboratory at the University of Ottawa for aiding in δ13C analysis, Jonathan Gagnon, and Jean-Éric Tremblay (Université Laval) for nutrient measurements and Aislinn Fox for ODV analysis and providing site map figures. Finally, we acknowledge the reviewers, whose constructive comments greatly improved the paper.
The Supplementary Material for this article can be found online at: https://www.frontiersin.org/articles/10.3389/fmars.2022.845536/full#supplementary-material
Aminot A., Kérouel R. (2007). Dosage Automatique Des Nutriments Dans Les Eaux Marines: Méthodes En Flux Continu, Edited by: IFREMER. Méthodes. d’analyse. en milieu. marin. 188. 0–188
Anderson L. A., Sarmiento J. L. (1994). Redfield Ratios of Remineralization Determined by Nutrient Data Analysis. Global Biogeochem. Cycles. 8 (1), 65–80. doi: 10.1029/93gb03318
Arctic Monitoring and Assessment Programme Arctic Climate Change Update (2021) Key Trends and Impacts - Summary for Policy-Makers. Arctic Council Secretariat, Summary Report. Available at: https://oaarchive.arctic-council.org/handle/11374/2621 (Accessed September 15, 2021).
Azetsu-Scott K., Petrie B., Yeats P., Lee C. (2012). Composition and Fluxes of Freshwater Through Davis Strait Using Multiple Chemical Tracers. J. Geophys. Res. Oceans. 117, C12011. doi: 10.1029/2012JC008172
Bailey W. B. (1956). On the Origin of Deep Baffin Bay Water. J. Fisheries. Board. Canada. 13 (3), 303–308. doi: 10.1139/f56-020
Bates N. R., Mathis J. T. (2009). The Arctic Ocean Marine Carbon Cycle: Evaluation of Air-Sea CO2 Exchanges, Ocean Acidification Impacts and Potential Feedbacks. Biogeosciences 6 (11), 2433–2459. doi: 10.5194/bg-6-2433-2009
Bauch D., Polyak L., Ortiz J. D. (2015). A Baseline for the Vertical Distribution of the Stable Carbon Isotopes of Dissolved Inorganic Carbon (δ13cdic) in the Arctic Ocean. Arktos 1 (1), 15. doi: 10.1007/s41063-015-0001-0
Bourke R. H., Addison V. G., Paquette R. G. (1989). Oceanography of Nares Strait and Northern Baffin Bay in 1986 With Emphasis on Deep and Bottom Water Formation. J. Geophys. Res. 94 (C6), 8289. doi: 10.1029/jc094ic06p08289
Bourke R. H., Paquette R. G. (1991). Formation of Baffin Bay Bottom and Deep Waters. Elsevier. Oceanogr. Ser. 57, 135–155. doi: 10.1016/s0422-9894(08)70065-5
Broecker W. S., Gerard R., Ewing M., Heezen B. C. (1960). Natural Radiocarbon in the Atlantic Ocean. J. Geophys. Res. 65 (9), 2903–2931. doi: 10.1029/jz065i009p02903
Brown T. A., Reimer R. W. (2004). Discussion: Reporting and Calibration of Post-Bomb 14c Data. Radiocarbon 46 (3), 1299–1304. doi: 10.1017/s0033822200033154
Bullister J., Barigner M. (2020) Bottle Data From Cruise 33RO20130803, Exchange Version (CCHDO). Available at: https://cchdo.ucsd.edu/cruise/33RO20130803 (Accessed September 15, 2021).
Burgers T. M., Miller L. A., Thomas H., Else B. G. T., Gosselin M., Papakyriakou T. (2017). Surface Water pco2 Variations and Sea-Air CO2 Fluxes During Summer in the Eastern Canadian Arctic. J. Geophys. Res. Oceans. 122, 9663–9678. doi: 10.1002/2017JC013250
Caesar L., McCarthy G. D., Thornalley D. J. R., Cahill N., Rahmstorf S. (2021). Current Atlantic Meridional Overturning Circulation Weakest in Last Millennium. Nat. Geosci. 14, 118–120. doi: 10.1038/s41561-021-00699-z
Carter B. R., Feely R. A., Wanninkhof R., Kouketsu S., Sonnerup R. E., Pardo P. C., et al. (2019). Pacific Anthropogenic Carbon Between 1991 and 2017. Global Biogeochem. Cycles. 33 (5), 597–617. doi: 10.1029/2018gb006154
Chen G. T., Millero F. J. (1979). Gradual Increase of Oceanic CO2. Nature 277 (5693), 205–206. doi: 10.1038/277205a0
Collin A. E. (1965). Oceanographic Observations in Nares Strait, Northern Baffin Bay 1963 and 1964. Bedford Institute of Oceanography Fourth Annual Report, Dartmouth, NS. Bio Rep. 65-5, 9. Available at: https://publications.gc.ca/collections/collection_2015/mpo-dfo/Fs97-16-5-5-eng.pdf
Cuny J., Rhines P. B., Niiler P. P., Bacon S. (2002). Labrador Sea Boundary Currents and the Fate of the Irminger Sea Water. J. Phys. Oceanogr. 32 (2), 627–647. doi: 10.1175/1520-0485(2002)032<0627:lsbcat>2.0.co;2
Curry B., Lee C. M., Petrie B. (2011). Volume, Freshwater, and Heat Fluxes Through Davis Strait 2004–05. J. Phys. Oceanogr. 41 (3), 429–436. doi: 10.1175/2010jpo4536.1
Curry B., Lee C. M., Petrie B., Moritz R. E., Kwok R. (2014). Multiyear Volume, Liquid Freshwater, and Sea Ice Transports Through Davis Strait 2004–10. J. Phys. Oceanogr. 44 (4), 1244–1266. doi: 10.1175/jpo-d-13-0177.1
Dickson A. G., Sabine C. L., Christian J. R. (2007). Guide to Best Practices for Ocean CO2 Measurement. (PICES Special Publication 3; IOCCP Report 8) (Sidney, British Columbia: North Pacific Marine Science Organization), 191. doi: 10.25607/OBP-1342
Druffel E. R. M., Griffin S., Glynn C. S., Benner R., Walker B. D. (2017). Radiocarbon in Dissolved Organic and Inorganic Carbon of the Arctic Ocean. Geophys. Res. Lett. 44 (5), 2369–2376. doi: 10.1002/2016gl072138
Emerson S., Hedges J. (2008). Chemical Oceanography and the Marine Carbon Cycle. Cambridge: Cambridge University Press. doi: 10.1017/CBO9780511793202
Fissel D. B., Lemon D. D., Birch J. R. (1982). Major Features of the Summer Near-Surface Circulation of Western Baffin Bay 1978 and 1979. ARCTIC 35 (1), 180–200. doi: 10.14430/arctic2318
Fox A., Walker B. D. (2022). Sources and Cycling of Particulate Organic Matter in Baffin Bay: a multi-isotope δ13C, δ15N, and Δ14C approach. Front. Mar. Sci. 35 (1), 180–200. doi: 10.14430/arctic2318 Cambridge
Gao P., Xu X., Zhou L., Pack M. A., Griffin S., Santos G. M., et al. (2014). Rapid Sample Preparation of Dissolved Inorganic Carbon in Natural Waters Using a Headspace-Extraction Approach for Radiocarbon Analysis by Accelerator Mass Spectrometry. Limnol. Oceanogr: Methods 12 (4), 174–190. doi: 10.4319/lom.2014.12.174
Goosse H., Fichefet T., Campin J. M. (1997). The Effects of the Water Flow Through the Canadian Archipelago in a Global Ice-Ocean Model. Geophys. Res. Lett. 24 (12), 1507–1510. doi: 10.1029/97gl01352
Griffith D. R., McNichol A. P., Xu L., McLaughlin F. A., Macdonald R. W., Brown K. A., et al. (2012). Carbon Dynamics in the Western Arctic Ocean: Insights From Full-Depth Carbon Isotope Profiles of DIC, DOC, and POC. Biogeosciences 9 (3), 1217–1224. doi: 10.5194/bg-9-1217-2012
Guilderson T. P., Caldeira K., Duffy P. B. (2000). Radiocarbon as a Diagnostic Tracer in Ocean and Carbon Cycle Modeling. Global Biogeochem. Cycles. 14 (3), 887–902. doi: 10.1029/1999gb001192
Hamilton J., Wu Y. (2013). Synopsis and Trends in the Physical Environment of Baffin Bay and Davis Strait. Ocean. Ecosystem. Sci. Division. Maritimes. Region. Dartmouth, Nova Scotia: Fisheries. Oceans. Canada. Available at: publications.gc.ca/pub?id=9.504781&sl=0
Heinze C. (2014). The Role of the Ocean Carbon Cycle in Climate Change. Eur. Rev. 22 (1), 97–105. doi: 10.1017/s1062798713000665
Hoppema M., Roether W., Bellerby R. G. J., de Baar H. J. W. (2001). Direct Measurements Reveal Insignificant Storage of Anthropogenic CO2 in the Abyssal Weddell Sea. Geophys. Res. Lett. 28 (9), 1747–1750. doi: 10.1029/2000gl012443
Humphreys M. P., Greatrix F. M., Tynan E., Achterberg E. P., Griffiths A. M., Fry C. H., et al. (2016). Stable Carbon Isotopes of Dissolved Inorganic Carbon for a Zonal Transect Across the Subpolar North Atlantic Ocean in Summer 2014. Earth Syst. Sci. Data 8 (1), 221–233. doi: 10.5194/essd-8-221-2016
Jiang Z. P., Tyrrell T., Hydes D. J., Dai M., Hartman S. E. (2014). Variability of Alkalinity and the Alkalinity-Salinity Relationship in the Tropical and Subtropical Surface Ocean. Global Biogeochem. Cycles. 28 (7), 729–742. doi: 10.1002/2013gb004678
Johnson K. M., Wills K. D., Butler D. B., Johnson W. K., Wong C. S. (1993). Coulometric Total Carbon Dioxide Analysis for Marine Studies: Maximizing the Performance of an Automated Gas Extraction System and Coulometric Detector. Mar. Chem. 44 (2-4), 167–187. doi: 10.1016/0304-4203(93)90201-x
König D., Miller L. A., Simpson K. G., Vagle S. (2018). Carbon Dynamics During the Formation of Sea Ice at Different Growth Rates. Front. Earth Sci. 6. doi: 10.3389/feart.2018.00234
Körtzinger A., Quay P. D., Sonnerup R. E. (2003). Relationship Between Anthropogenic CO2 and the 13C Suess Effect in the North Atlantic Ocean. Global Biogeochem. Cycles. 17 (1), 5–1. doi: 10.1029/2001GB001427
Krawczyk D. W., Kryk A., Juggins S., Burmeister A., Pearce C., Seidenkrantz M. S., et al. (2021). Spatio-Temporal Changes in Ocean Conditions and Primary Production in Baffin Bay and the Labrador Sea. Palaeogeograph. Palaeoclimatolog. Palaeoecol. 563, 110175. doi: 10.1016/j.palaeo.2020.110175
Kroopnick P. M. (1985). The Distribution of 13C of ΣCO2 in the World Oceans. Deep Sea Research Part A. Oceanogr. Res. Papers. 32 (1), 57–84. doi: 10.1016/0198-0149(85)90017-2
Lee K., Choi S. D., Park G. H., Wanninkhof R., Peng T. H., Key R. M., et al. (2003). An Updated Anthropogenic CO2 Inventory in the Atlantic Ocean. Global Biogeochem. Cycles. 17 (4), 1116, 1–17. doi: 10.1029/2003gb002067
Lehmann N., Kienast M., Granger J., Bourbonnais A., Altabet M. A., Tremblay J. E. (2019). Remote Western Arctic Nutrients Fuel Remineralization in Deep Baffin Bay. Global Biogeochem. Cycles. 33 (6), 649–667. doi: 10.1029/2018gb006134
Lobb J. (2004). On Arctic and Atlantic Halocline Interactions in Baffin Bay. [Ph.D. Thesis] (Victoria, Canada: University of Victoria).
MacGilchrist G. A., Naviera A. C., Garabato N., Tsubouchi T., Bacon S., Torres-Valdés S., et al. (2014). The Arctic Ocean Carbon Sink. Deep. Sea. Res. Part I: Oceanogr. Res. Papers. 86, 39–55. doi: 10.1016/j.dsr.2014.01.002
Mahadevan A. (2001). An Analysis of Bomb Radiocarbon Trends in the Pacific. Mar. Chem. 73 (3–4), 273–290. doi: 10.1016/s0304-4203(00)00113-4
Melling H., Gratton Y., Ingram G. (2010). Ocean Circulation Within the North Water Polynya of Baffin Bay. Atmosphere-Ocean 39 (3), 301–325. doi: 10.1080/07055900.2001.9649683
Mol J. (2017). The Exchange of Inorganic Carbon on the Canadian Beaufort Shelf. [MSc Thesis] (Halifax, Canada: Dalhousie University). Available at: http://hdl.handle.net/10222/72992.
Moreau S., Vancoppenolle M., Bopp L., Aumont O., Madec G., Delille B., et al. (2016). Assessment of the Sea-Ice Carbon Pump: Insights From a Three-Dimensional Ocean-Sea-Ice Biogeochemical Model (NEMO-LIM-PISCES) Assessment of the Sea-Ice Carbon Pump. Elementa.: Sci. Anthropocene. 4, 122. doi: 10.12952/journal.elementa.000122
Morée A. L., Schwinger J., Heinze C. (2018). Southern Ocean Controls of the Vertical Marine δ13C Gradient – A Modelling Study. Biogeosciences 15, 7205–23. doi: 10.5194/bg-15-7205-2018
Muench R. D. (1970). The Physical Oceanography of the Northern Baffin Bay Region. [Ph.D. Thesis] (Seattle, USA: University of Washington).
Münchow A., Falkner K. K., Melling H. (2015). Baffin Island and West Greenland Current Systems in Northern Baffin Bay. Prog. Oceanogr. 132, 305–317. doi: 10.1016/j.pocean.2014.04.001
Mungall E. L., Abbatt J. P. D., Wentzell J. J. B., Lee A. K. Y., Thomas J. L., Blais M., et al. (2017). Microlayer Source of Oxygenated Volatile Organic Compounds in the Summertime Marine Arctic Boundary Layer. Proc. Natl. Acad. Sci. 114, 6203–6208. doi: 10.1073/pnas.1620571114
Olack G. A., Colman A. S., Pfister C. A., Wootton J. T. (2018). Seawater DIC Analysis: The Effects of Blanks and Long-Term Storage on Measurements of Concentration and Stable Isotope Composition: The Analysis of Seawater Carbon. Limnol. Oceanogr.: Methods 16 (3), 160–179. doi: 10.1002/lom3.10235
Olsen A., Anderson L. G., Heinze C. (2015). “Arctic Carbon Cycle: Patterns, Impacts and Possible Changes,” in The New Arctic. Eds. Evengård B., Nymand Larsen J., Paasche O. (Cham: Springer). doi: 10.1007/978-3-319-17602-4_8
Östlund H. G., Possnert G., Swift J. H. (1987). Ventilation Rate of the Deep Arctic Ocean From Carbon 14 Data. J. Geophys. Res.: Oceans. 92 (C4), 3769–3777. doi: 10.1029/jc092ic04p03769
Poisson A., Chen C. T. A. (1987). Why is There Little Anthropogenic CO2 in the Antarctic Bottom Water? Deep Sea Research Part A. Oceanograph. Res. Papers. 34 (7), 1255–1275. doi: 10.1016/0198-0149(87)90075-6
Rodgers K. B., Schrag D. P., Cane M. A., Naik N. H. (2000). The Bomb 14C Transient in the Pacific Ocean. J. Geophys. Res.: Oceans. 105 (C4), 8489–8512. doi: 10.1029/1999jc900228
Rubin S. I., Key R. M. (2002). Separating Natural and Bomb-Produced Radiocarbon in the Ocean: The Potential Alkalinity Method. Global Biogeochem. Cycles 16 (4), 110552-1-52–19. doi: 10.1029/2001gb001432
Rudels B. (1986). The Outflow of Polar Water Through the Arctic Archipelago and the Oceanographic Conditions in Baffin Bay. Polar. Res. 4 (2), 161–180. doi: 10.3402/polar.v4i2.6929
Rykova T., Straneo F., Lilly J. M., Yashayaev I. (2009). Irminger Current Anticyclones in the Labrador Sea Observed in the Hydrographic Record 1990–2004. J. Mar. Res. 67 (3), 361–384. doi: 10.1357/002224009789954739
Rysgaard S., Glud R. N., Sejr M. K., Bendtsen J., Christensen P. B. (2007). Inorganic Carbon Transport During Sea Ice Growth and Decay: A Carbon Pump in Polar Seas. J. Geophys. Res.: Oceans. 1978–2012), 112. doi: 10.1029/2006jc003572
Sabine C. L., Feely R. A., Gruber N., Key R. M., Lee K., Bullister J. L., et al. (2004). The Oceanic Sink for Anthropogenic CO2. Science 305 (5682), 367–371. doi: 10.1126/science.1097403
Sadler H. E. (1976). Water, Heat, and Salt Transports Through Nares Strait, Ellesmere Island. J. Fisheries Board. Canada 33 (10), 2286–2295. doi: 10.1139/f76-275
Shadwick E. H., Thomas H., Chierici M., Else B., Fransson A., Michel C., et al. (2011). Seasonal Variability of the Inorganic Carbon System in the Amundsen Gulf Region of the Southeastern Beaufort Sea. Limnol. Oceanogr. 56 (1), 303–322. doi: 10.4319/lo.2011.56.1.0303
Shiklomanov A., Déry S., Tretiakov M., Yang D., Magritsky D., Georgiadi A., et al. (2020). “River Freshwater Flux to the Arctic Ocean” in Yang D., Kane D.L.. Eds Arctic Hydrology, Permafrost and Ecosystems (Springer, Cham). p. 703–738. doi: 10.1007/978-3-030-50930-9_24
Stuiver M., Polach H. A. (1977). Discussion Reporting of 14C Data. Radiocarbon 19, 3, 355–363. doi: 10.1017/s0033822200003672
Sverdrup H. V., Johnson M. W., Fleming R. H. (1942). The Ocean, Their Physics, Chemistry and General Biology (Englewood Cliffs, NJ, USA: Prentice-Hall), p. 1087. doi: 10.2307/520072
Sweeney C., Gloor E., Jacobson A. R., Key R. M., McKinley G., Sarmiento J. L., et al. (2007). Constraining Global Air-Sea Gas Exchange for CO2 With Recent Bomb 14C Measurements. Global Biogeochem. Cycles. 21 (2), 1–10. doi: 10.1029/2006gb002784
Takahashi T., Broecker W. S., Bainbridge A. E. (1981). “Carbon Cycle Modelling” in The Alkalinity and Total Carbon Dioxide Concentration in the World Oceans. 16 (3078), p. 271–86Bolin B. Scientific Committee on Problems of the Environment (SCOPE of the International Council of Scientific Unions (ICSU) in Collaboration with the United Nations Environment Programme
Tang C. C. L., Ross C. K., Yao T., Petrie B., DeTracey B. M., Dunlap E. (2004). The Circulation, Water Masses and Sea Ice of Baffin Bay. Prog. Oceanogr. 63 (4), 183–228. doi: 10.1016/j.pocean.2004.09.005
Tan F. C., Strain P. M. (1980). The Distribution of Sea Ice Meltwater in the Eastern Canadian Arctic. J. Geophys. Res.: Oceans. 85 (C4), 1925–1932. doi: 10.1029/jc085ic04p01925
Tjiputra J. F., Assmann K., Heinze C. (2010). Anthropogenic Carbon Dynamics in the Changing Ocean. Ocean. Sci. 6 (3), 605–614. doi: 10.5194/os-6-605-2010
Top Z., Clarke W. B., Eismont W. C., Jones E. P. (1980). Radiogenic Helium in Baffin Bay Bottom Water. J. Mar. Res. 38 (3), 435–452. doi: 10.4095/119621
Trumbore S.E., Sierra C.A., Hicks Pries C.E. (2016). “Radiocarbon Nomenclature, Theory, Models, and Interpretation: Measuring Age, Determining Cycling Rates, and Tracing Source Pools. Eds ” in Schuur E., Druffel E., Trumbore S., Radiocarbon and Climate Change (Springer, Cham). doi: 10.1007/978-3-319-25643-6_3
Wallace D. W. R. (1985). A Study of the Ventilation of Arctic Water Using Chlorofluoromethanes as Tracers. [Ph.D. Thesis]. Ed. Halifax N. S. (Canada: Dalhousie University).
Xu X., Trumbore S. E., Zheng S., Southon J. R., McDuffee K. E., Luttgen M., et al. (2007). Modifying a Sealed Tube Zinc Reduction Method for Preparation of AMS Graphite Targets: Reducing Background and Attaining High Precision. Nucl. Instruments. Methods Phys. Res. Sec. B: Beam. Interact. Material. Atoms. 259 (1), 320–329. doi: 10.1016/j.nimb.2007.01.175
Keywords: dissolved inorganic carbon, DIC, 13C, 14C, anthropogenic, bomb, residence time, Baffin Bay
Citation: Zeidan S, Walker J, Else BGT, Miller LA, Azetsu-Scott K and Walker BD (2022) Using Radiocarbon Measurements of Dissolved Inorganic Carbon to Determine a Revised Residence Time for Deep Baffin Bay. Front. Mar. Sci. 9:845536. doi: 10.3389/fmars.2022.845536
Received: 29 December 2021; Accepted: 22 March 2022;
Published: 27 April 2022.
Edited by:
Núria Casacuberta, ETH Zürich, SwitzerlandReviewed by:
Ann P. McNichol, Woods Hole Oceanographic Institution, United StatesCopyright © 2022 Zeidan, Walker, Else, Miller, Azetsu-Scott and Walker. This is an open-access article distributed under the terms of the Creative Commons Attribution License (CC BY). The use, distribution or reproduction in other forums is permitted, provided the original author(s) and the copyright owner(s) are credited and that the original publication in this journal is cited, in accordance with accepted academic practice. No use, distribution or reproduction is permitted which does not comply with these terms.
*Correspondence: Brett D. Walker, YnJldHQud2Fsa2VyQHVvdHRhd2EuY2E=
Disclaimer: All claims expressed in this article are solely those of the authors and do not necessarily represent those of their affiliated organizations, or those of the publisher, the editors and the reviewers. Any product that may be evaluated in this article or claim that may be made by its manufacturer is not guaranteed or endorsed by the publisher.
Research integrity at Frontiers
Learn more about the work of our research integrity team to safeguard the quality of each article we publish.