 Masanao Shinohara
 Tomoaki Yamada
 Takeshi Akuhara
 Kimihiro Mochizuki
 Shin’ichi Sakai2,1
94% of researchers rate our articles as excellent or good
Learn more about the work of our research integrity team to safeguard the quality of each article we publish.
Find out more
ORIGINAL RESEARCH article
Front. Mar. Sci., 27 April 2022
Sec. Ocean Observation
Volume 9 - 2022 | https://doi.org/10.3389/fmars.2022.844506
This article is part of the Research TopicThe Discovery of the Unknown Planet: The OceanView all 17 articles
Recently, the distributed acoustic sensing (DAS) measurement, which utilizes an optical fiber itself as a sensor, becomes popular for various fields and is being applied to seismic observations. The shortest spatial sampling of DAS observations reaches a few meters, and the total measurement distance becomes greater than 50 km. A high temporal sampling rate is achieved. Due to these characteristics, a DAS measurement allows for a dense seismic observation as a linear array. Applying a DAS measurement to the seafloor cable is advantageous because the quantity of data can be significantly increased in a marine area. A seafloor seismic tsunami observation cable system using an optical fiber for data transmission was deployed off Sanriku by the Earthquake Research Institute, the University of Tokyo in 1996. This seafloor cable observation system has spare fibers for extension. Beginning in February 2019, we made several DAS observations using the spare fibers of the seafloor system. Consequently, many earthquakes were recorded. Small earthquakes with a magnitude of 1.8 occurring near the cable system were recorded by the DAS system. The arrivals of P- and S-waves of the earthquake with a magnitude of 3 were clearly seen using the phase data from the DAS measurement. In addition, a teleseismic event with an epicentral distance of approximately 2,300 km and a magnitude of 6.6 was clearly observed. Because there are conventional seismometers in the Sanriku cable system, we compared records from the DAS measurement with those from the seismometer. The DAS records and the data by the seismometer showed a high coherency. The noise levels of the DAS measurement were evaluated, and there was little temporal variation of the noise levels. A spatial variation of ambient seismic noises was revealed using a spatially high-density observation with a long distance. In November 2020, a seismic survey using the DAS system and airguns was carried out, and the DAS system clearly recorded signals from the airguns. We also compared these data from the DAS system with that of the seismometer. Both records had the same characteristics, although P-wave arrivals on the DAS records have smaller amplitude.
The distributed acoustic sensing (DAS) measurement is a technology measuring the sensing strain or strain rate of an optical fiber using the optical fiber itself as a sensor. Initially, the DAS measurement had been applied to security surveillance, the monitoring of pipeline, and traffic monitoring (Owen et al., 2012; Dou et al., 2017). Later, for seismic explorations, such as vertical seismic profiles in a field of resource surveys, the DAS measurement began to be applied (Daley et al., 2013; Mateeva et al., 2014; Karrenbach et al., 2019). Because the DAS measurement provides spatially high-density data, a seismic observation for natural earthquakes on land has been conducted using the DAS measurement (e.g., Lindsey et al., 2017). In addition, the DAS measurement is useful to provide the information related to shallow structures (e.g., Zeng et al., 2017). Recently, the DAS measurement was applied for seafloor observation using a seafloor cable containing optical fiber (Lindsey et al., 2019; Shinohara et al., 2019; Sladen et al., 2019; Ide et al., 2021; Lior et al., 2021; Matsumoto et al., 2021). In addition, the DAS measurement was also used for the studies of other topics, such as microseisms and ocean waves (e.g., Williams et al., 2019).
The DAS measurement is an optical fiber sensing technology. A coherent laser pulse with short duration is transmitted intermittently to a single-mode optical fiber for the DAS measurement, and Rayleigh scattering occurs at inhomogeneity within the optical fiber. The backscattering light is observed at the point where the coherent laser pulse is transmitted (Posey et al., 2000). When a fiber has a small deformation due to its movement, the distance between the two scatterers where Rayleigh scattering occurs is changed. The distance of the scatterers is measured using interferometry technology. The distance of the scatterers is expressed using the phase difference between two scattered lights by optical interferometry. The travel time of a light indicates a distance to a measurement point from the laser light source, and a distance between two scatterers that is called a gauge length, for an interference measurement, corresponds to the spatial resolution of the DAS measurement. A recent interrogator has a spatial resolution of a few meters. Due to a repetition of an interference measurement with very short time intervals, a spatial measurement interval, which is usually called as a channel interval, becomes a few meters, and a measurement with a long distance on a fiber can be performed. This results in a long linear measurement array with a measurement interval of a few meters. The total length of the DAS measurement reaches more than 50 km at the present, although the recording performance of the DAS measurement seems to decrease with a distance greater than 50 km from an interrogator generally. Seismic observations using the DAS technology, which measures a strain on a fiber using interferometry, have become popular because spatially high-density data can be obtained. DAS measurements have become increasingly accurate, and the progress of the technology accelerates the increase of obtained data quality. Therefore, various sophisticated data analyses can be applied to recent DAS data; however, for data processing, DAS measures strain wave fields, which are different from those from conventional seismic measurements using the devices based on the pendulum principle.
The Earthquake Research Institute, the University of Tokyo is carrying out seafloor seismic observation using two seafloor cable observation systems off Sarinku, northeastern Japan, in the source region of the 2011 Tohoku-oki earthquake with a magnitude of 9. One system using conventional communication technology was installed in 1996 and another system using Internet technology for data transmission and system control was deployed in 2015 (Shinohara et al., 2021). The first system installed in 1996 has a total length of approximately 120 km. Three three-component seismometers and two tsunami-meters (pressure gauges) are connected in the line (Figure 1). The seafloor cable was buried using a plough-type burial machine simultaneously with the cable deployment in the region where the water depth was less than 500 m. A remote-operated vehicle buried the cable just after the deployment of the system in the range of the water depths from 500 to 1,000 m. The burial depth was estimated to be less than 1 m below the seafloor. The data from the scientific sensors are digitally transmitted to a landing station in Kamaishi, Iwate prefecture, using optical fibers in the seafloor cable, and each sensor uses a dedicated optical fiber. One optical fiber is used for the delivery of a timing clock to each sensor system. The seafloor units synchronize with the timing clock, which is generated by a Global Positioning System (GPS) receiver on the landing station. Because the seafloor cable of the 1996 system has 12 optical fibers, six spare (dark) optical fibers, including the system for future extension, are available. The seafloor cable in the 1996 system has dispersion-shifted single-mode optical fibers with a wavelength of 1,550 nm, and therefore, the spare fibers are suitable for the DAS measurement. Because the spare fibers have no repeater or connector on the seafloor, the DAS measurement can be performed up to the seaward end of the seafloor cable. In addition, the records from the DAS measurement can be compared to those obtained by three seismometers installed in the 1996 cable system. We carried out phase-based DAS measurements using a spare fiber of the Sanriku system beginning in February 2019.
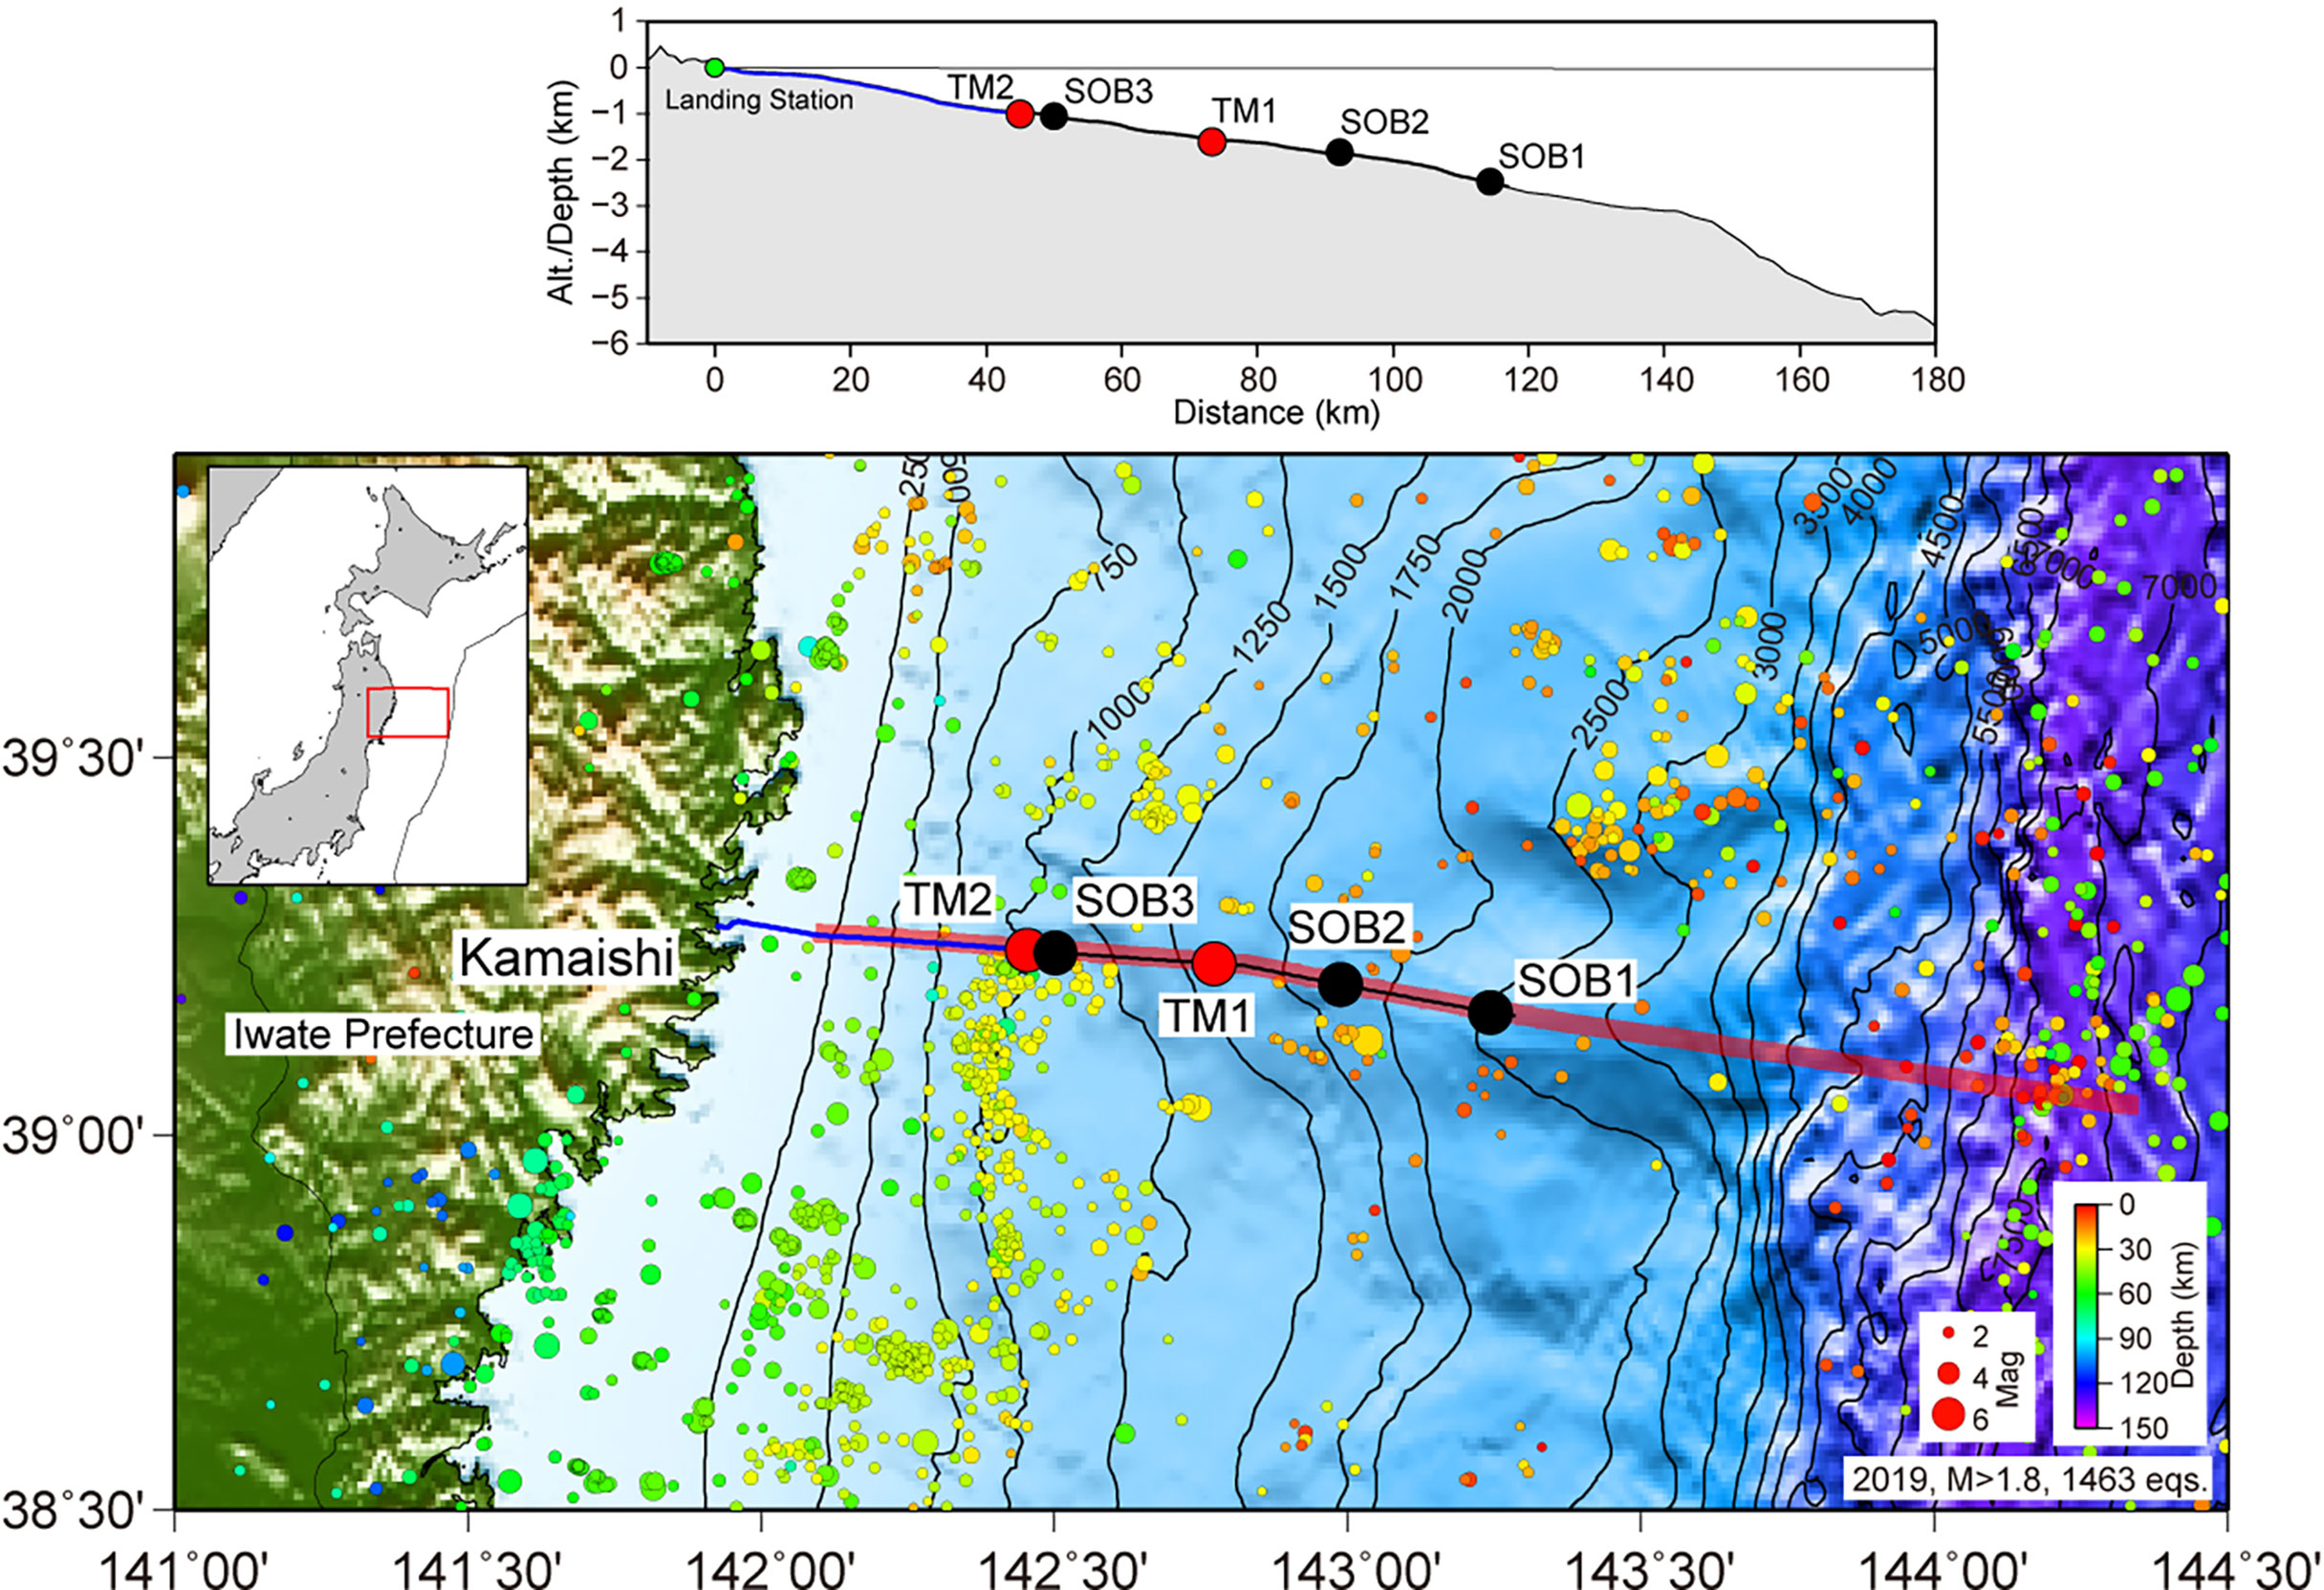
Figure 1 The seafloor cable observation system off Sanriku installed in 1996. Upper: depth profile of the cable system. The seafloor gradually deepens toward the Japan trench. Lower: the position of the seafloor cable. Black and blue lines indicate the cable route of the 1996 system. Blue lines denote a segment where the cable is buried. Black and red circles show the positions of the seismometers and tsunami-meters. Translucent red lines indicate the profile of the seismic survey using an array of large airguns. Colored circles denote epicenters of earthquakes with magnitudes greater than 1.8 occurring in 2019. Size and color of circles indicate magnitude and depth of events, respectively.
In February 2019, we made the first pilot observation of a DAS measurement using a dark fiber of the Sanriku seafloor observation system. Prior to the DAS measurement, we confirmed a good condition of the dark fibers using an optical time domain reflectometer (OTDR). The OTDR also sends laser pulse light into an optical fiber and observes backscattered light from inhomogeneity in an optical fiber. Unlike a DAS using interferometry, the OTDR uses the intensity of the backscattered light and a travel time to check the conditions of an optical fiber. The phase-based DAS interrogators have been used through the observations using the Sanriku seafloor observation system. An interrogator for the DAS measurement was installed in the landing station temporarily. A commercial DAS measurement system model N5200A from AP Sensing GmbH was used (Cedilnik et al., 2019). N5200A outputs phase data as a result of the interferometry and can measure strain for a long range of more than 70 km. Data were recorded for 100 km in length with a spatial sampling interval of 5 m and sampling frequency of 500 Hz. The gauge length was set to 40 m. The laser light with a wavelength of 1,550 nm was used for the interferometry. The DAS interrogator generated phase data that are obtained from the interferometer for backscattered lights and frequency band-extracted (FBE) data, which indicate the energy of the strain rate in a frequency band as a function of distance from the interrogator and time. Both kinds of data were collected continuously for approximately 46 h. The data were stored in the hard disks in the recording system. We copied the data of a total capacity of approximately 4 TB to an external disk after the observation.
For long-term seafloor seismic monitoring, an experimental measurement for a long-term observation was carried out in 2019. For the observation, N5200A was also used. The recording period basically depends on the capacity of a recording device. We succeeded in a obtaining a continuous DAS measurement for approximately 2 weeks using the same type of the interrogator for the measurement in February 2019. The DAS measurement using the Sanriku seafloor cable system began on November 18, 2019, and the measurement was completed on December 2, 2019. We set the same recording parameters as those of the measurement in February 2019. To reduce the dataset, a total length of the measurement was set to 48 km for the first day and extended to 70 km after the second day. The total capacity of the dataset reached 17 TB over approximately 2 weeks.
In March 2021, we performed the DAS measurements using a different interrogator on the Sanriku seafloor observation system. We used the commercial DAS system model QuantX from OptaSense Ltd., Farnborough, Hampshire, UK for this observation. The interrogator QuantX is also a phase-based DAS system with a maximum range of 100 km. The interval of the channel is 2 m; therefore, 50,000 channel data can be obtained. The aim was to obtain spatially long-range data. The interrogator was also installed in the cable landing station temporarily, and the length of data collection (array aperture) was set to 50 or 100 km. The data were recorded with various values of parameters, such as gauge length and ping rate, to evaluate the data quality. The wavelength of the interferometry was 1,550 nm. The total recording period was approximately 35 h. On the first day, we tuned the system using various tests and performed overnight recording with a gauge length of 100 m and spatial sampling interval of 2 m. Because the total channel number was 50,000, the total spatial length became 100 km. On the next day, an observation with a gauge length of 200 m and a spatial sampling interval of 1 m was carried out through the night. The ping rate was 500 Hz, and the data were decimated to the temporal sampling rate of 250 Hz through the observation. The system could store the data to an internal disk and external disk concurrently during the observation. The data size was approximately 3.4 TB.
A seismic survey using controlled sources and a DAS measurement on a seafloor optical fiber cable was carried out (Figure 1). The objectives of the survey were to evaluate the DAS data for seismic surveys and to obtain a seismic structure beneath the seafloor cable with a high resolution. The survey was performed from November 3–8, 2020, using the R/V Hakuho-maru belonging to the Japan Agency for Marine-Earth Science and Technology. For controlled seismic sources, we used two types of seismic sources. One was an array of four large airguns (Bolt 1500LL). Each 1500LL airgun had a chamber volume of 1,500 in3. The other was two GI-guns from Sercel Inc. Each Generator and Injector (GI)-gun had a capacity of 355 in3. Shooting the large-airgun array was carried out on November 5 and 6 along the profile with a length of approximately 200 km (Figure 1). The shot interval was approximately 40 s. Two GI-guns were shot on November 6 and 7. The shot interval of the GI-gun was 20 s, the length of the profile was approximately 90 km, and the cruising speed was 4.5 kts. A multichannel hydrophone streamer with a length of 1.2 km was towed during the GI-gun shootings. Seismic signals from the large-airgun array were also recorded by a two-channel hydrophone streamer with a length of 150 m. In addition to the DAS measurement, pop-up type Ocean Bottom Seismometer (OBSs) were temporally deployed on the profile before the shooting of the airguns and the pop-type OBSs recording airgun signals were recovered after the completion of the shooting. Corresponding to the airgun shooting, the DAS measurements were conducted at the landing station of the Sanriku cable system. Because the cable system has six spare fibers, we made observations with two identical systems of DAS measurement (N5200A, AP Sensing GmbH) concurrently. Each system used a dedicated fiber and recorded the data independently. The continuous recording began on November 4 and was completed on November 8. The data were recorded for 100 or 80 km of the total length with a spatial sampling interval of 5 m and temporal sampling frequency of 500 Hz. The gauge length was set to 40 m. Although one DAS system had a missing data for several hours during the airgun shooting due to a recording issue, the other system worked throughout the airgun shooting. Data with a total capacity of approximately 8 TB from two DAS systems were obtained.
The DAS measurement senses the exact distance of two scatterers approximately gauge length apart by the interferometry of backscattered light. There are three seismic stations connecting the Sanriku cable system (Figure 1). The seismic station has a conventional three-component accelerometer (JA-5; Japan Aviation Electronics Industry, Ltd., Tokyo, Japan). The direction of the X-component of the accelerometer is parallel to that of the seafloor cable. Therefore, the DAS measurement can be compared to X-component of the accelerometer.
The phase data provided by an interrogator were converted to strain:
where ϵxx is the principal strain for the x-direction, λl is the wavelength of used laser light in a vacuum, nc is the refraction index of a fiber, L is the gauge length, ξ is the optical-elastic coefficient for the fiber direction in isotropic media (usually set to 0.78), and Δϕ is the phase of a DAS measurement (SEAFOD, 2018). This conversion is a linear operation; therefore, strain is proportional to phase. Strain can be converted to particle velocity under an assumption of a plane wave propagation (Daley et al., 2015; Wang et al., 2018). When a plane wave propagates to the x-direction, we can express displacement as follows:
where u(x,t) is the displacement for the x-direction, A is the amplitude, k is the wave number, and ω is the angular frequency. Assuming that A is constant, we can calculate
where c is the apparent speed of the plane wave. Consequently, a simple formula is obtained:
This means that particle velocity in the media and the phase measured by the DAS have a proportional relationship, and we compared DAS data to the data recorded by a conventional seismometer using the principal of the pendulum.
According to the observations carried out in the periods from 2019 to 2021, the records of many earthquakes including deep earthquakes and teleseismic events were obtained through the DAS measurements. First, we inspected the FBE data for local earthquakes to evaluate the performance of the DAS records. The FBE data with a frequency range from 10 to 20 Hz were provided using the software from the supplier of the interrogator and represent the visualization of energy in some frequency band on a time domain. A local earthquake with a magnitude of 3.0 was clearly recognized in the FBE data (Shinohara et al., 2019). Because the earthquake was recorded with a high signal-to- noise (S/N) ratio, we checked the sensitivity of the DAS measurement using the records of earthquakes. The Japan Meteorological Agency (JMA) routinely determines the hypocenters of local earthquakes using land seismic networks. The earthquake catalog from the land seismic network was compared to the DAS records to evaluate the sensitivity of the DAS measurement. We identified all earthquakes with magnitudes greater than 1.8 in the JMA catalog near the cable system in the records from the DAS system (Figure 2). All earthquakes with magnitudes greater than 1.8 near the cable system were recorded by the DAS system. The DAS measurement was concluded to have an enough sensitivity for earthquake observation. In addition, a deep earthquake with a depth of 490 km occurring below the Japan Sea in February 2019 was clearly recorded. For other observations, local microearthquakes and deep earthquakes were recorded clearly. The sensitivity of the DAS measurement was examined in previous observations. Sladen et al. (2019) and Ide et al. (2021) reported microearthquakes based on DAS measurements using a seafloor cable in the region of off-Toulon, France and Nankai trough, Japan, respectively. Microseismicity in glaciated terrain has been observed using DAS technology as well (Walter et al., 2020). Because we confirmed that the DAS measurement clearly recorded earthquakes, we made a time–distance profile of earthquake records using phase data (Figure 3). The earthquake occurred on February 15, 2019, at a depth of 50 km below the cable system, and the magnitude of the event was 3.0. The phase data of each channel were filtered from 1 to 15 Hz in the frequency to increase the S/N ratio. Although there are 10,000 channels in the distance range from the landing station to 50 km from the coast, we only plotted 100 trace data at an interval of 100 channels. The arrivals of P- and S-waves were clearly seen in the time–distance section. In addition, we recognized seismic arrivals with large amplitudes in distances from 0 to 10 km after the first arrivals before the arrivals of S-waves. The S/N ratio decreases at distances greater than 50 km. The decrease in the S/N ratio is thought to be caused by the attenuation of laser light for the interferometry, which travels for a long distance. The teleseismic event was also recorded by the DAS measurement. A large earthquake occurred under the Kamchatsk Peninsula, Russia on March 16, 2021. The depth and magnitude were 13 km and 6.6, respectively, according to the US Geological Survey. The epicentral distance from the cable system was approximately 2,300 km. The earthquake was clearly observed by the DAS measurement (Figure 4). Reflecting a long epicentral distance, low frequency was dominant. The DAS records have a high S/N ratio even in the low-frequency band. Within periods ranging from 10 to 5 s, the amplitudes of the seismic signal had large variations depending on the channel positions of the DAS records. We found that the DAS measurement using the seafloor cable off Sanriku could detect teleseismic events with magnitudes greater than 6 and epicentral distances smaller than 2,000 km; however, few teleseismic events were recorded due to the short observation periods and there was no earthquake with a magnitude greater than 7 during the observation periods. To accurately evaluate the performance for recording low-frequency events such as teleseismic events, more observations for longer periods using the DAS measurement are needed.
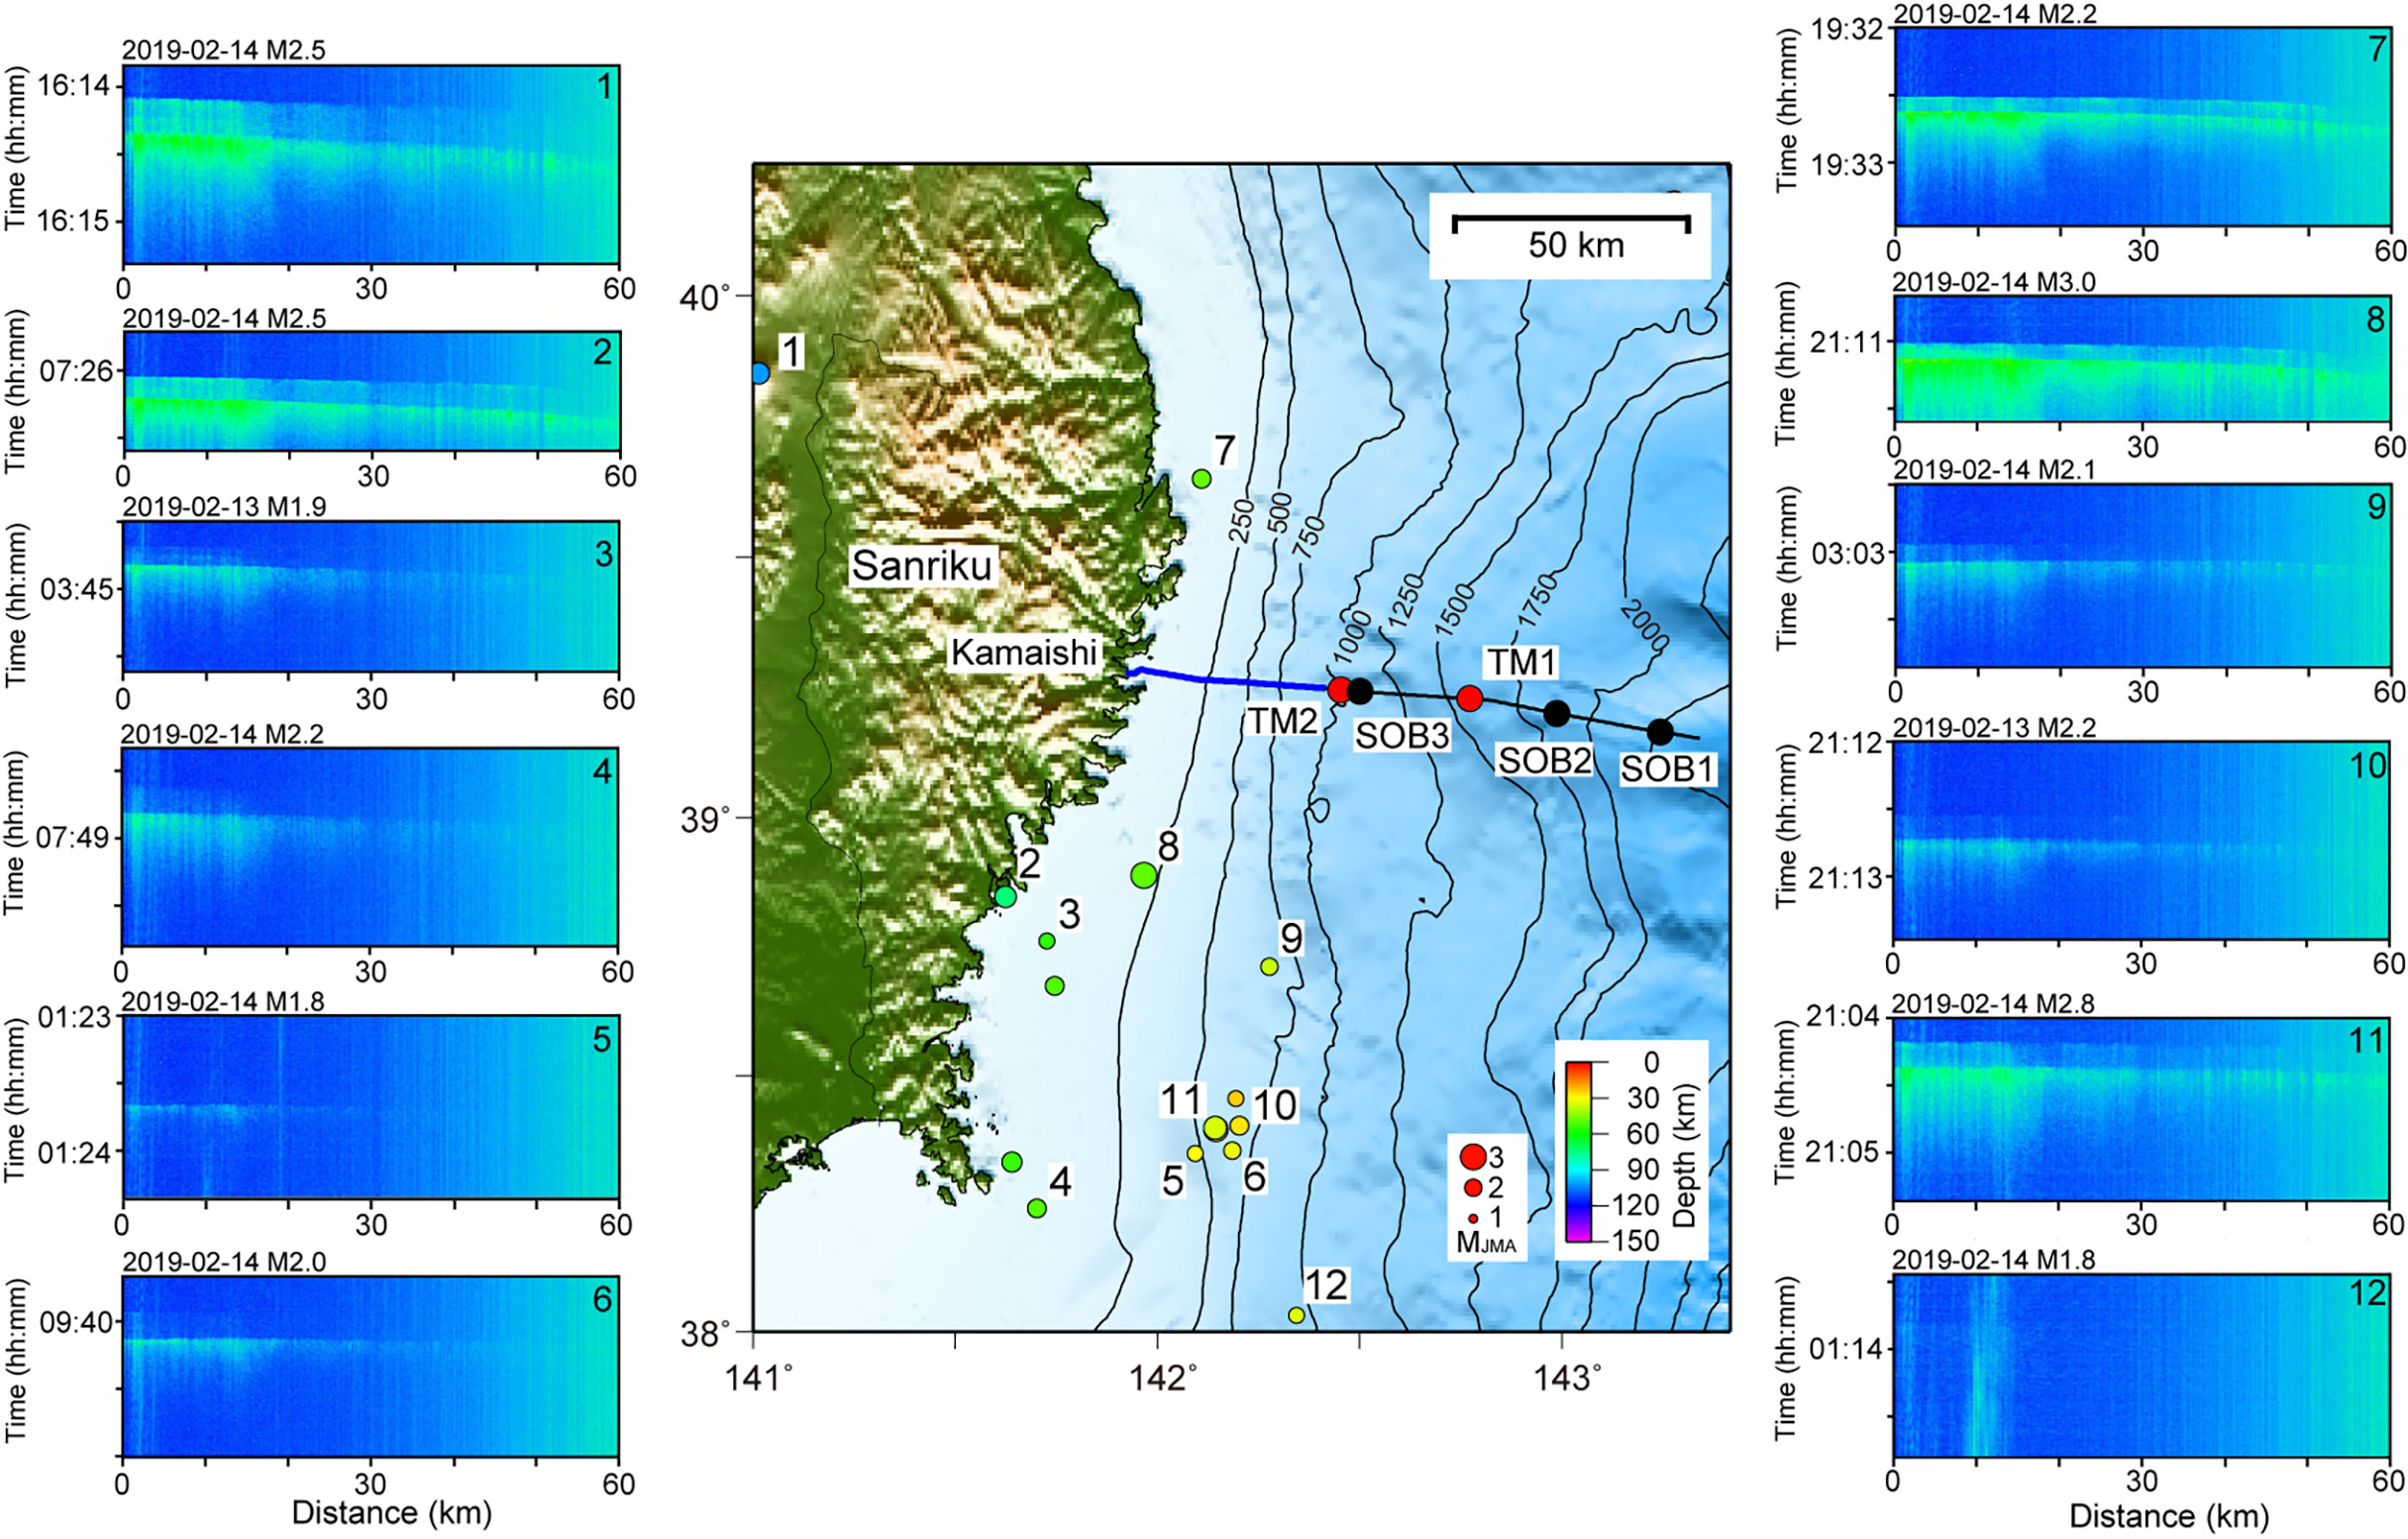
Figure 2 FBE data of local earthquakes recorded by the DAS measurement using the Sanriku cable system. FBE data show the energy of strain rate in a frequency band from 10 to 20 Hz. Position of the seafloor cable for the DAS measurement is indicated by blue and black lines. Event numbers are shown in the FBE data, and epicenters are indicated by numbers on the map.
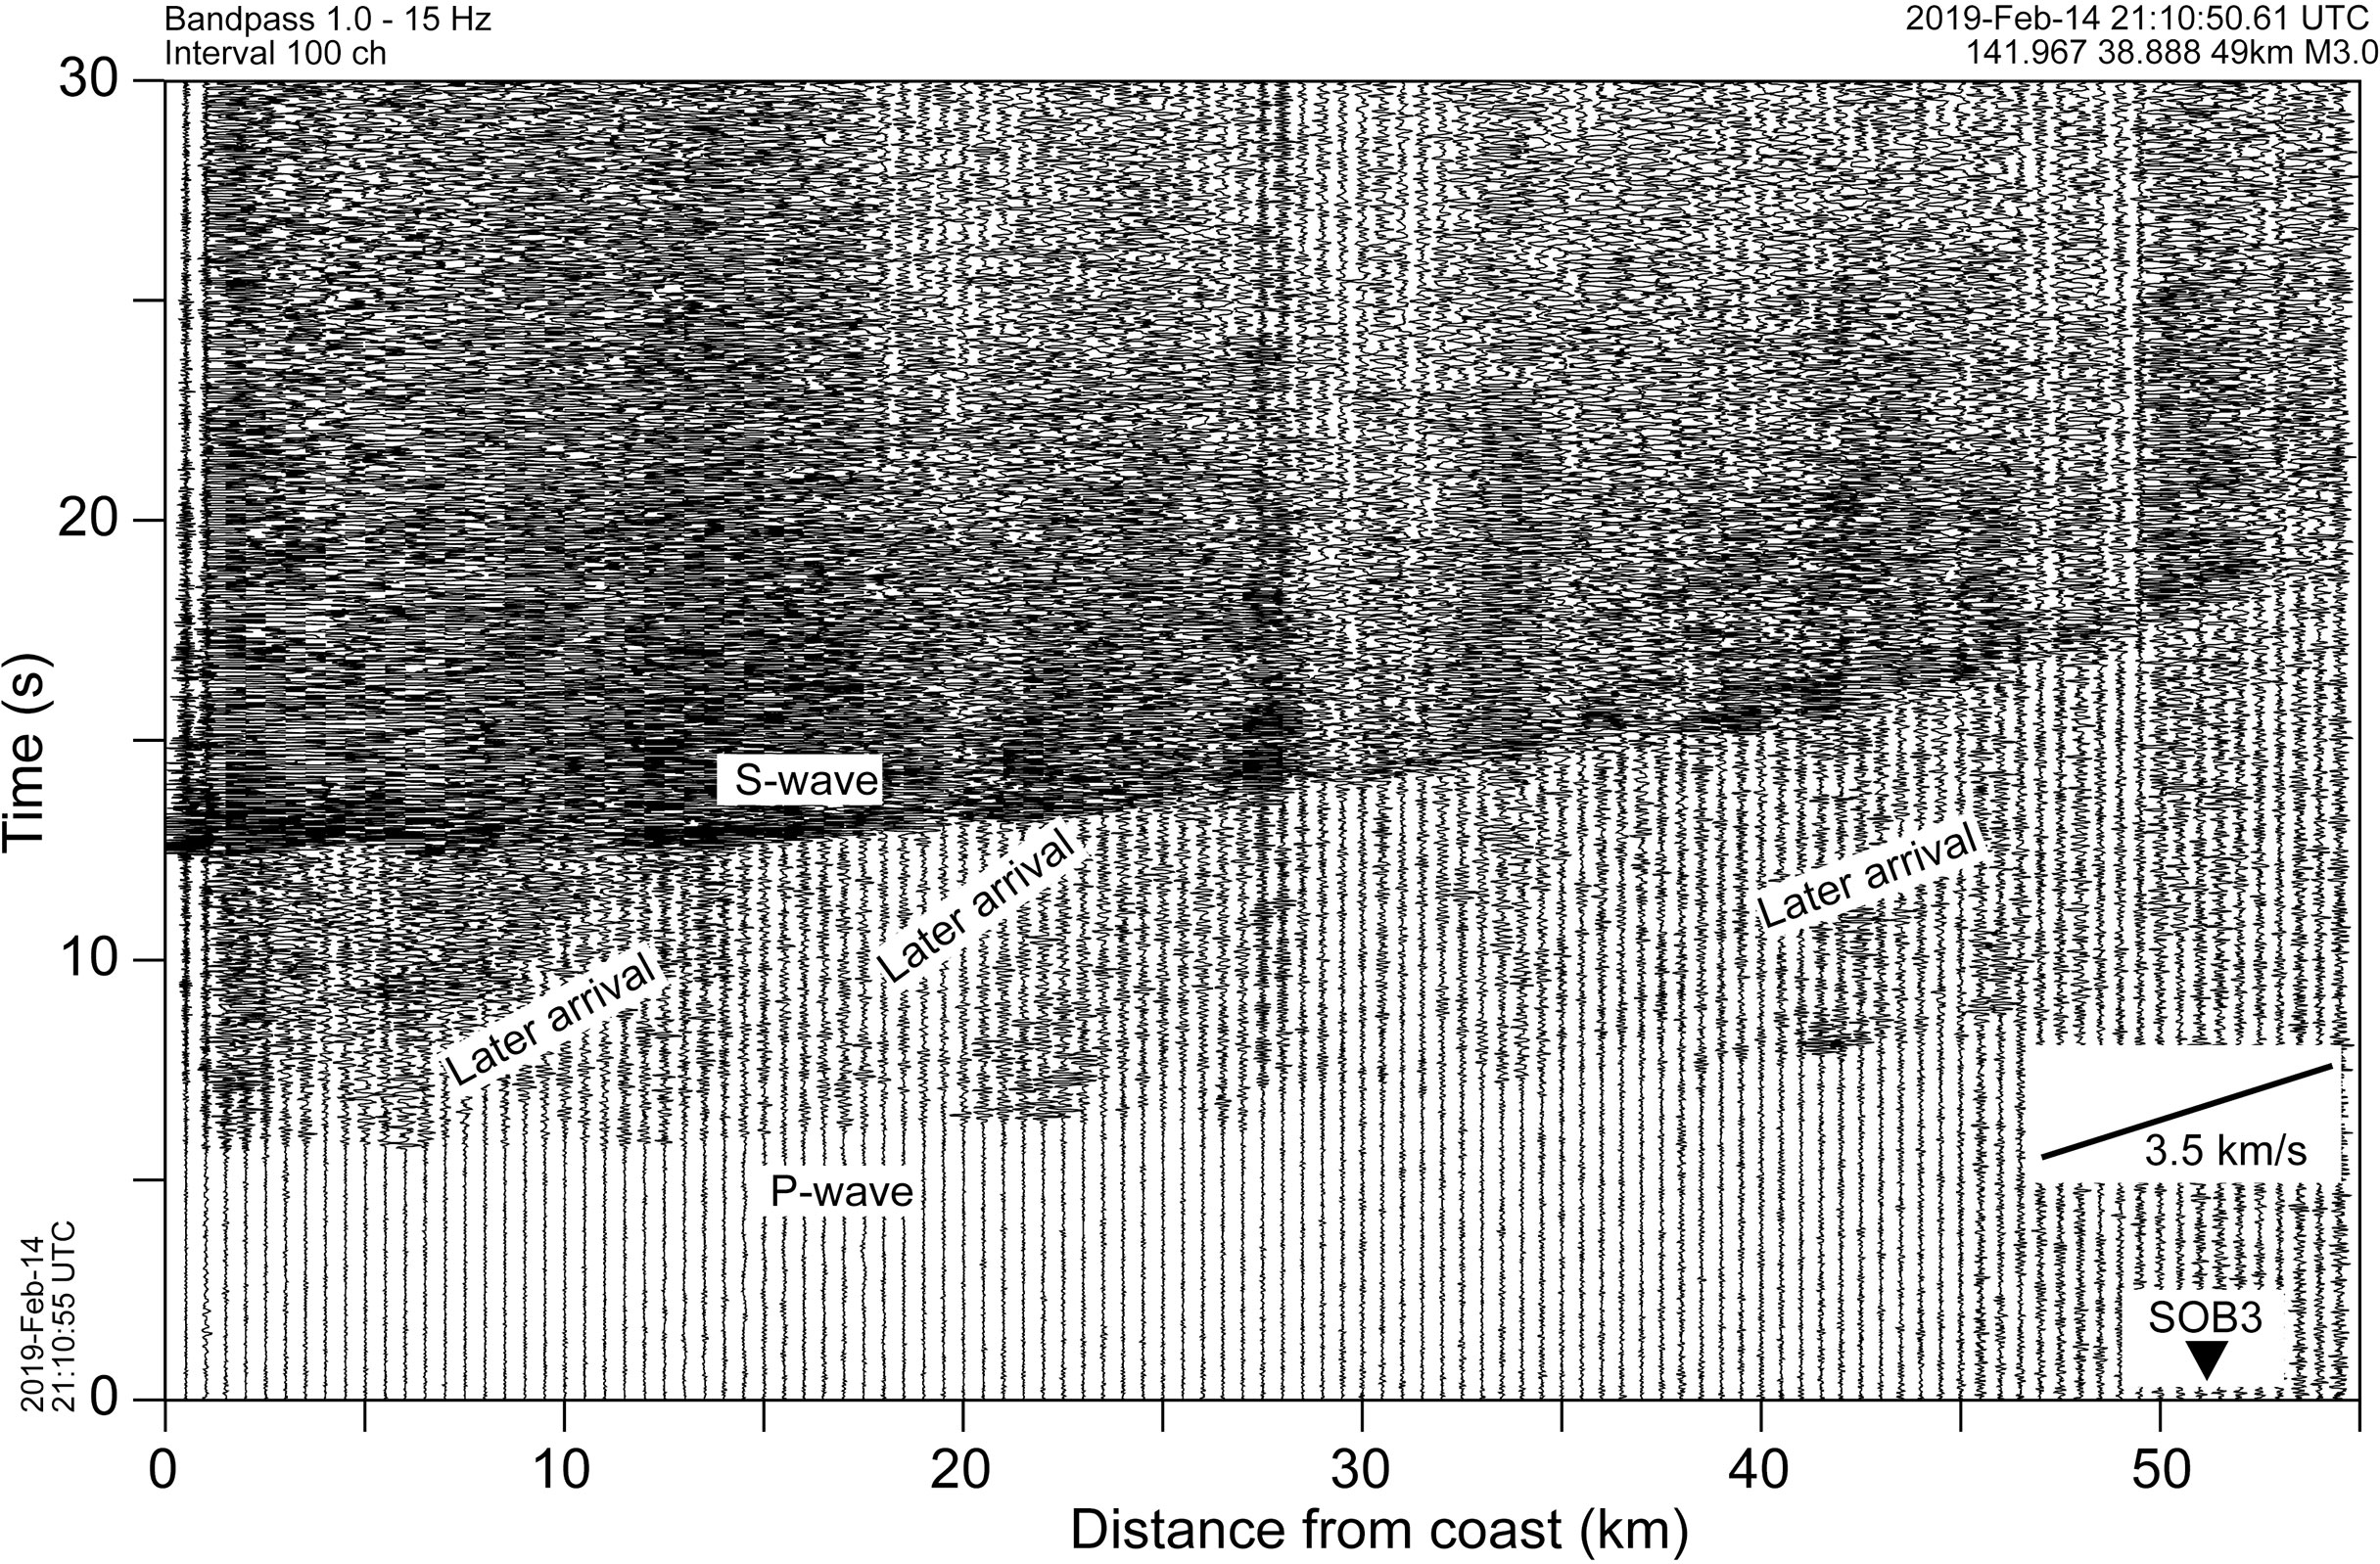
Figure 3 Time–distance profile of phase data for a local earthquake recorded by the DAS system. The phase data of each channel were filtered from 1 to 15 Hz to increase the S/N ratio. Each trace was plotted using the same amplitude scale. The horizontal axis is distance from the coast, and the vertical axis shows time. A position of the seismic station SOB3 in the cable observation system is indicated. There are 10,000 channels in the DAS measurement, and only 100 channels are plotted at an interval of 100 channels. The arrival of P-waves and S-waves are clearly seen. In addition, other seismic arrivals can be recognized. The earthquake corresponds to event No. 8 in Figure 2.
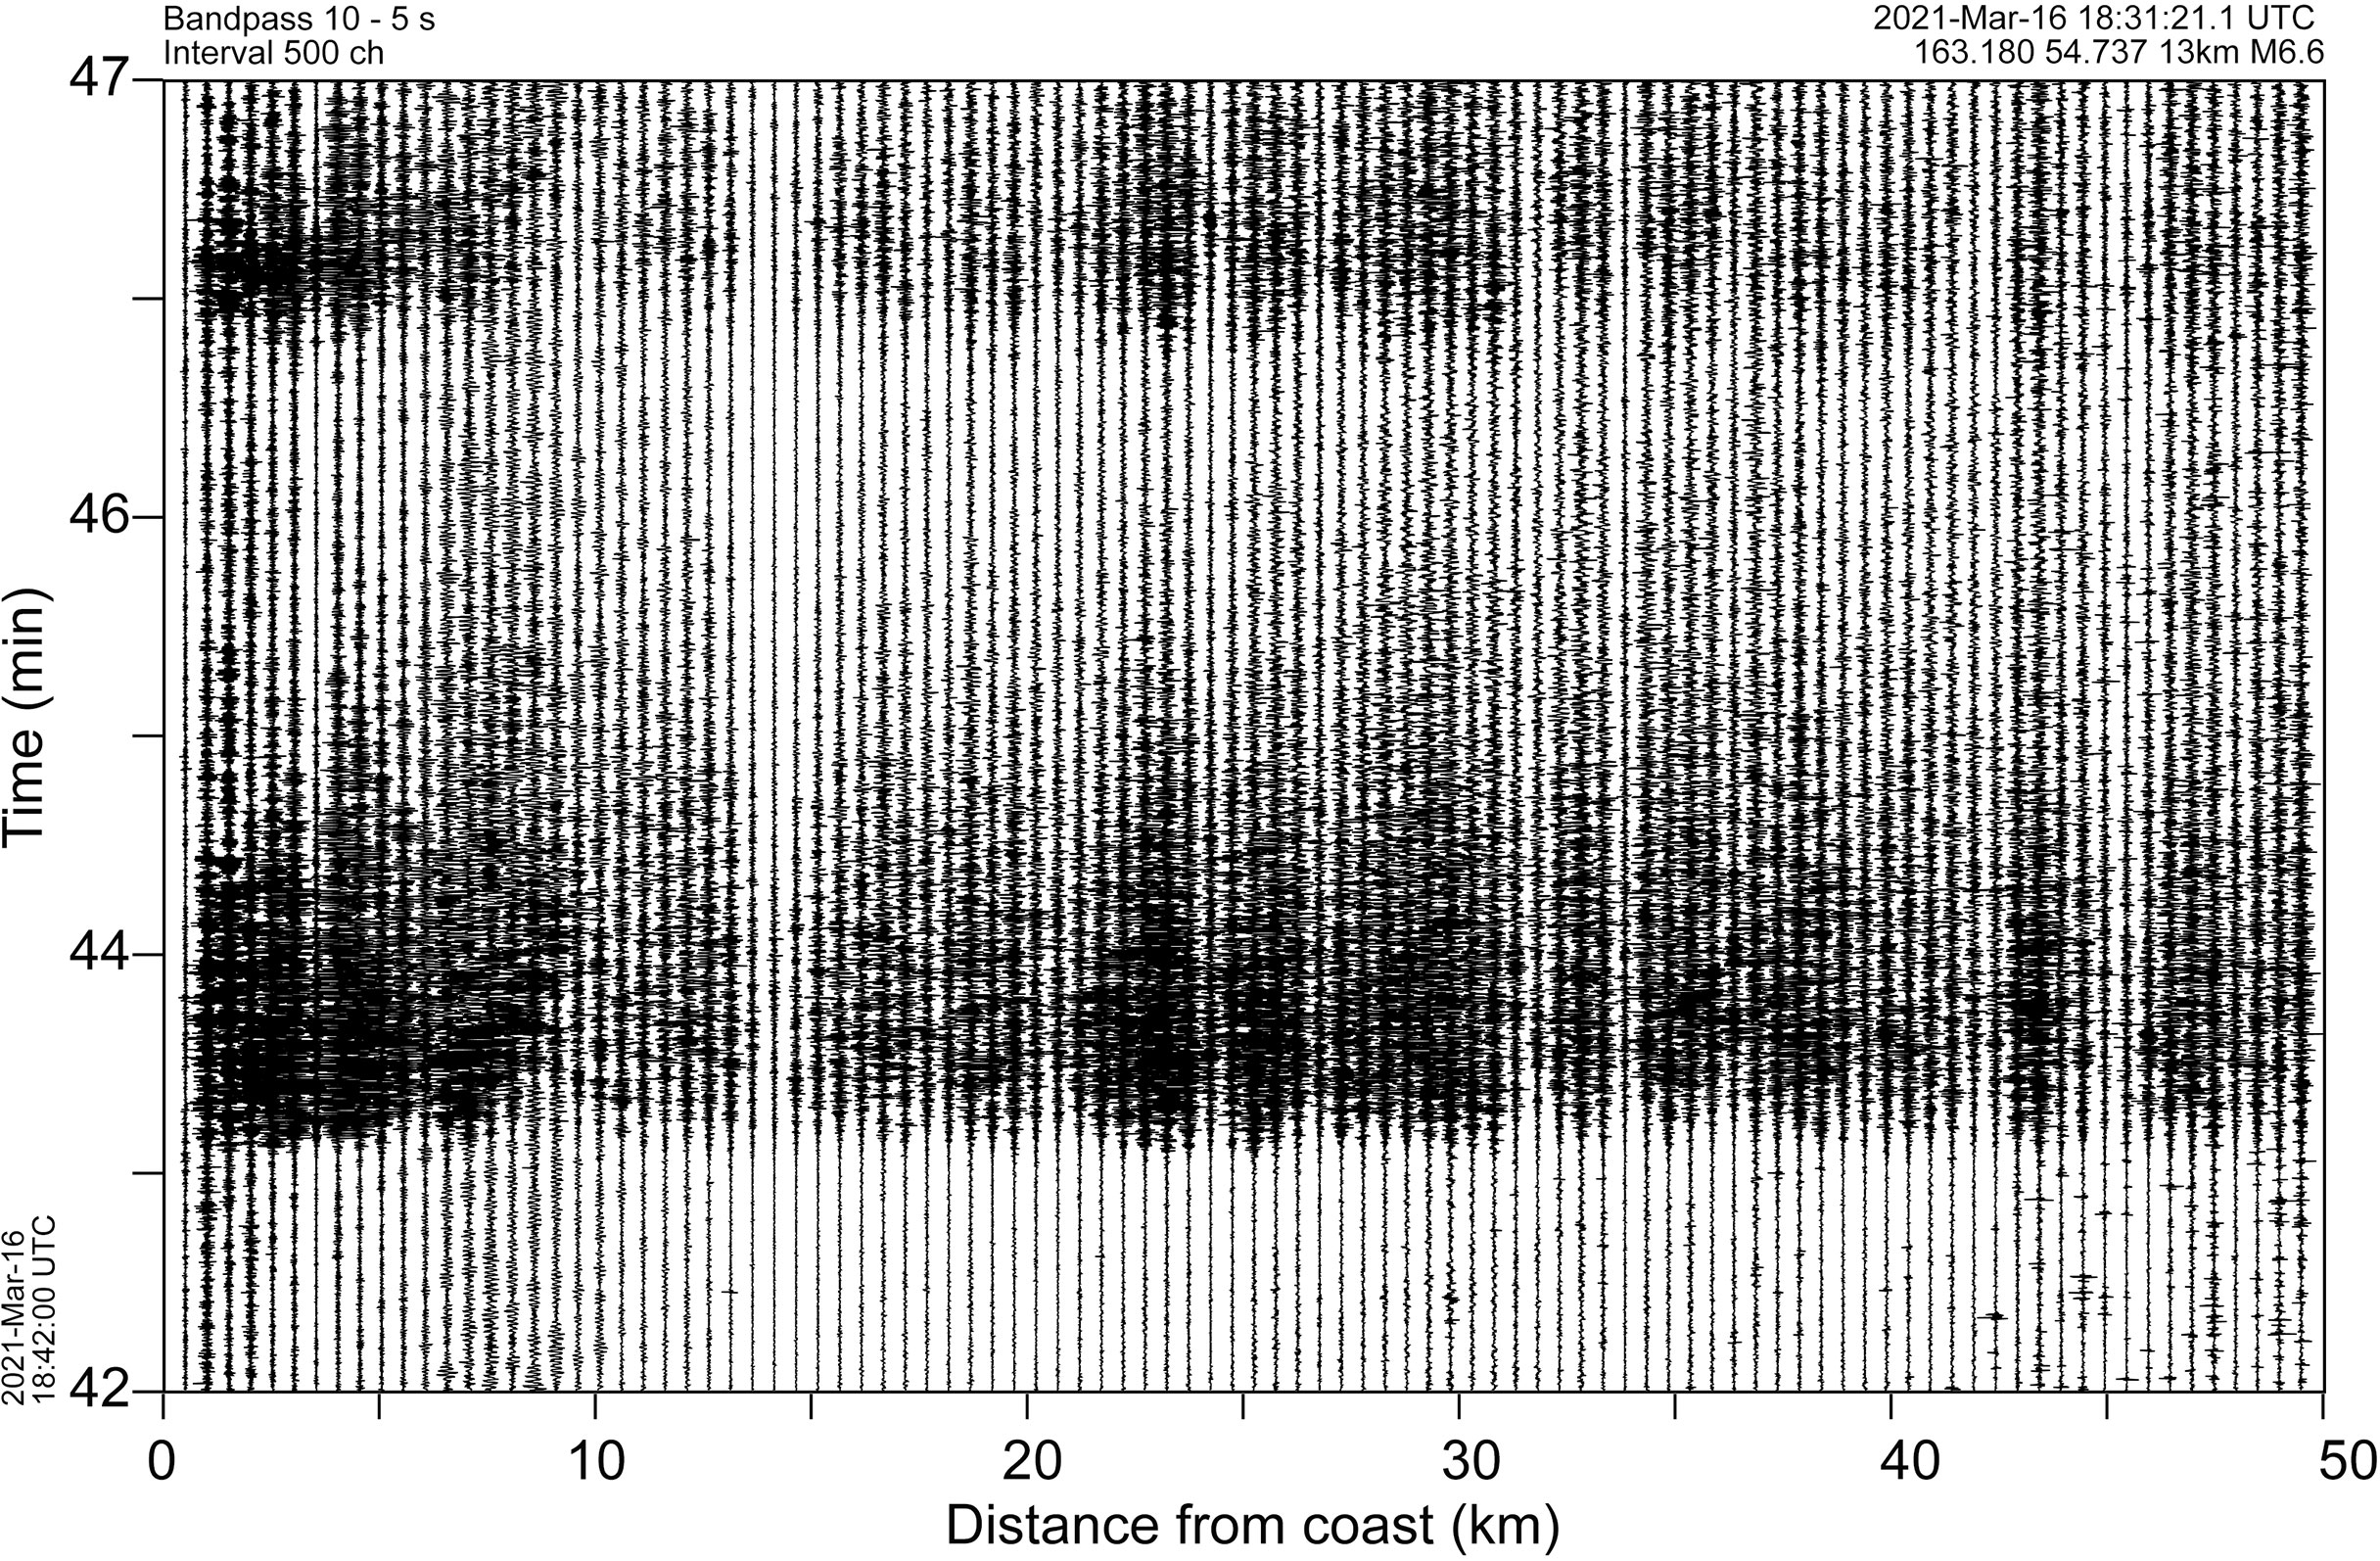
Figure 4 Time–distance profile of phase data for a teleseismic event recorded by the DAS system. The phase data of each channel were band-passed from 10 to 5 s to increase the S/N ratio. The horizontal axis is distance from the coast, and the vertical axis shows time. Each trace is plotted using the same amplitude scale. There are 10,000 channels in the DAS measurement, and only 100 channels are plotted at an interval of 100 channels. An earthquake with a magnitude of 6.6 occurred under Kamchatka Peninsula, Russia on March 16, 2021, and the epicentral distance from the cable system was approximately 2,300 km. Amplitudes of seismic signals had variations depending on the channel positions.
Because the conventional seismometers are connected to the Sanriku cable system, we can compare the records from the DAS measurement with those from the conventional seismometers. The records of the earthquake that occurred on February 15, 2019 (Figure 3) were used for the comparison. First, we searched the DAS data and retrieved the DAS data of close channels to the seismometer SOB3, which is closest to the coast. The DAS data of the adjacent 11 channels were averaged to increase the S/N ratio. After averaging, the phase data were converted to strain data. The SOB3 is positioned at a distance of approximately 50 km from the coast. We read an apparent velocity of 3.5 km/s around a distance of 50 km from the DAS record of the earthquake (Figure 3) and obtained particle velocity data using the velocity of 3.5 km/s, which was read from the DAS record. Finally, the velocity data were differentiated to convert to acceleration because the seismometer of the SOB3 is an accelerometer. Because the X-component of the SOB3 is parallel to the cable direction, we compared the acceleration data from the DAS measurement to the X-component of the SOB3 (Figure 5). The arrivals of seismic phases on the acceleration data converted from the DAS measurement are consistent with those on the records of the SOB3, and the amplitudes of seismic phases of both records are comparable. Because the converted DAS records to acceleration had similarities with the records of the accelerometer, our results indicate that the DAS measured actual ground movement.
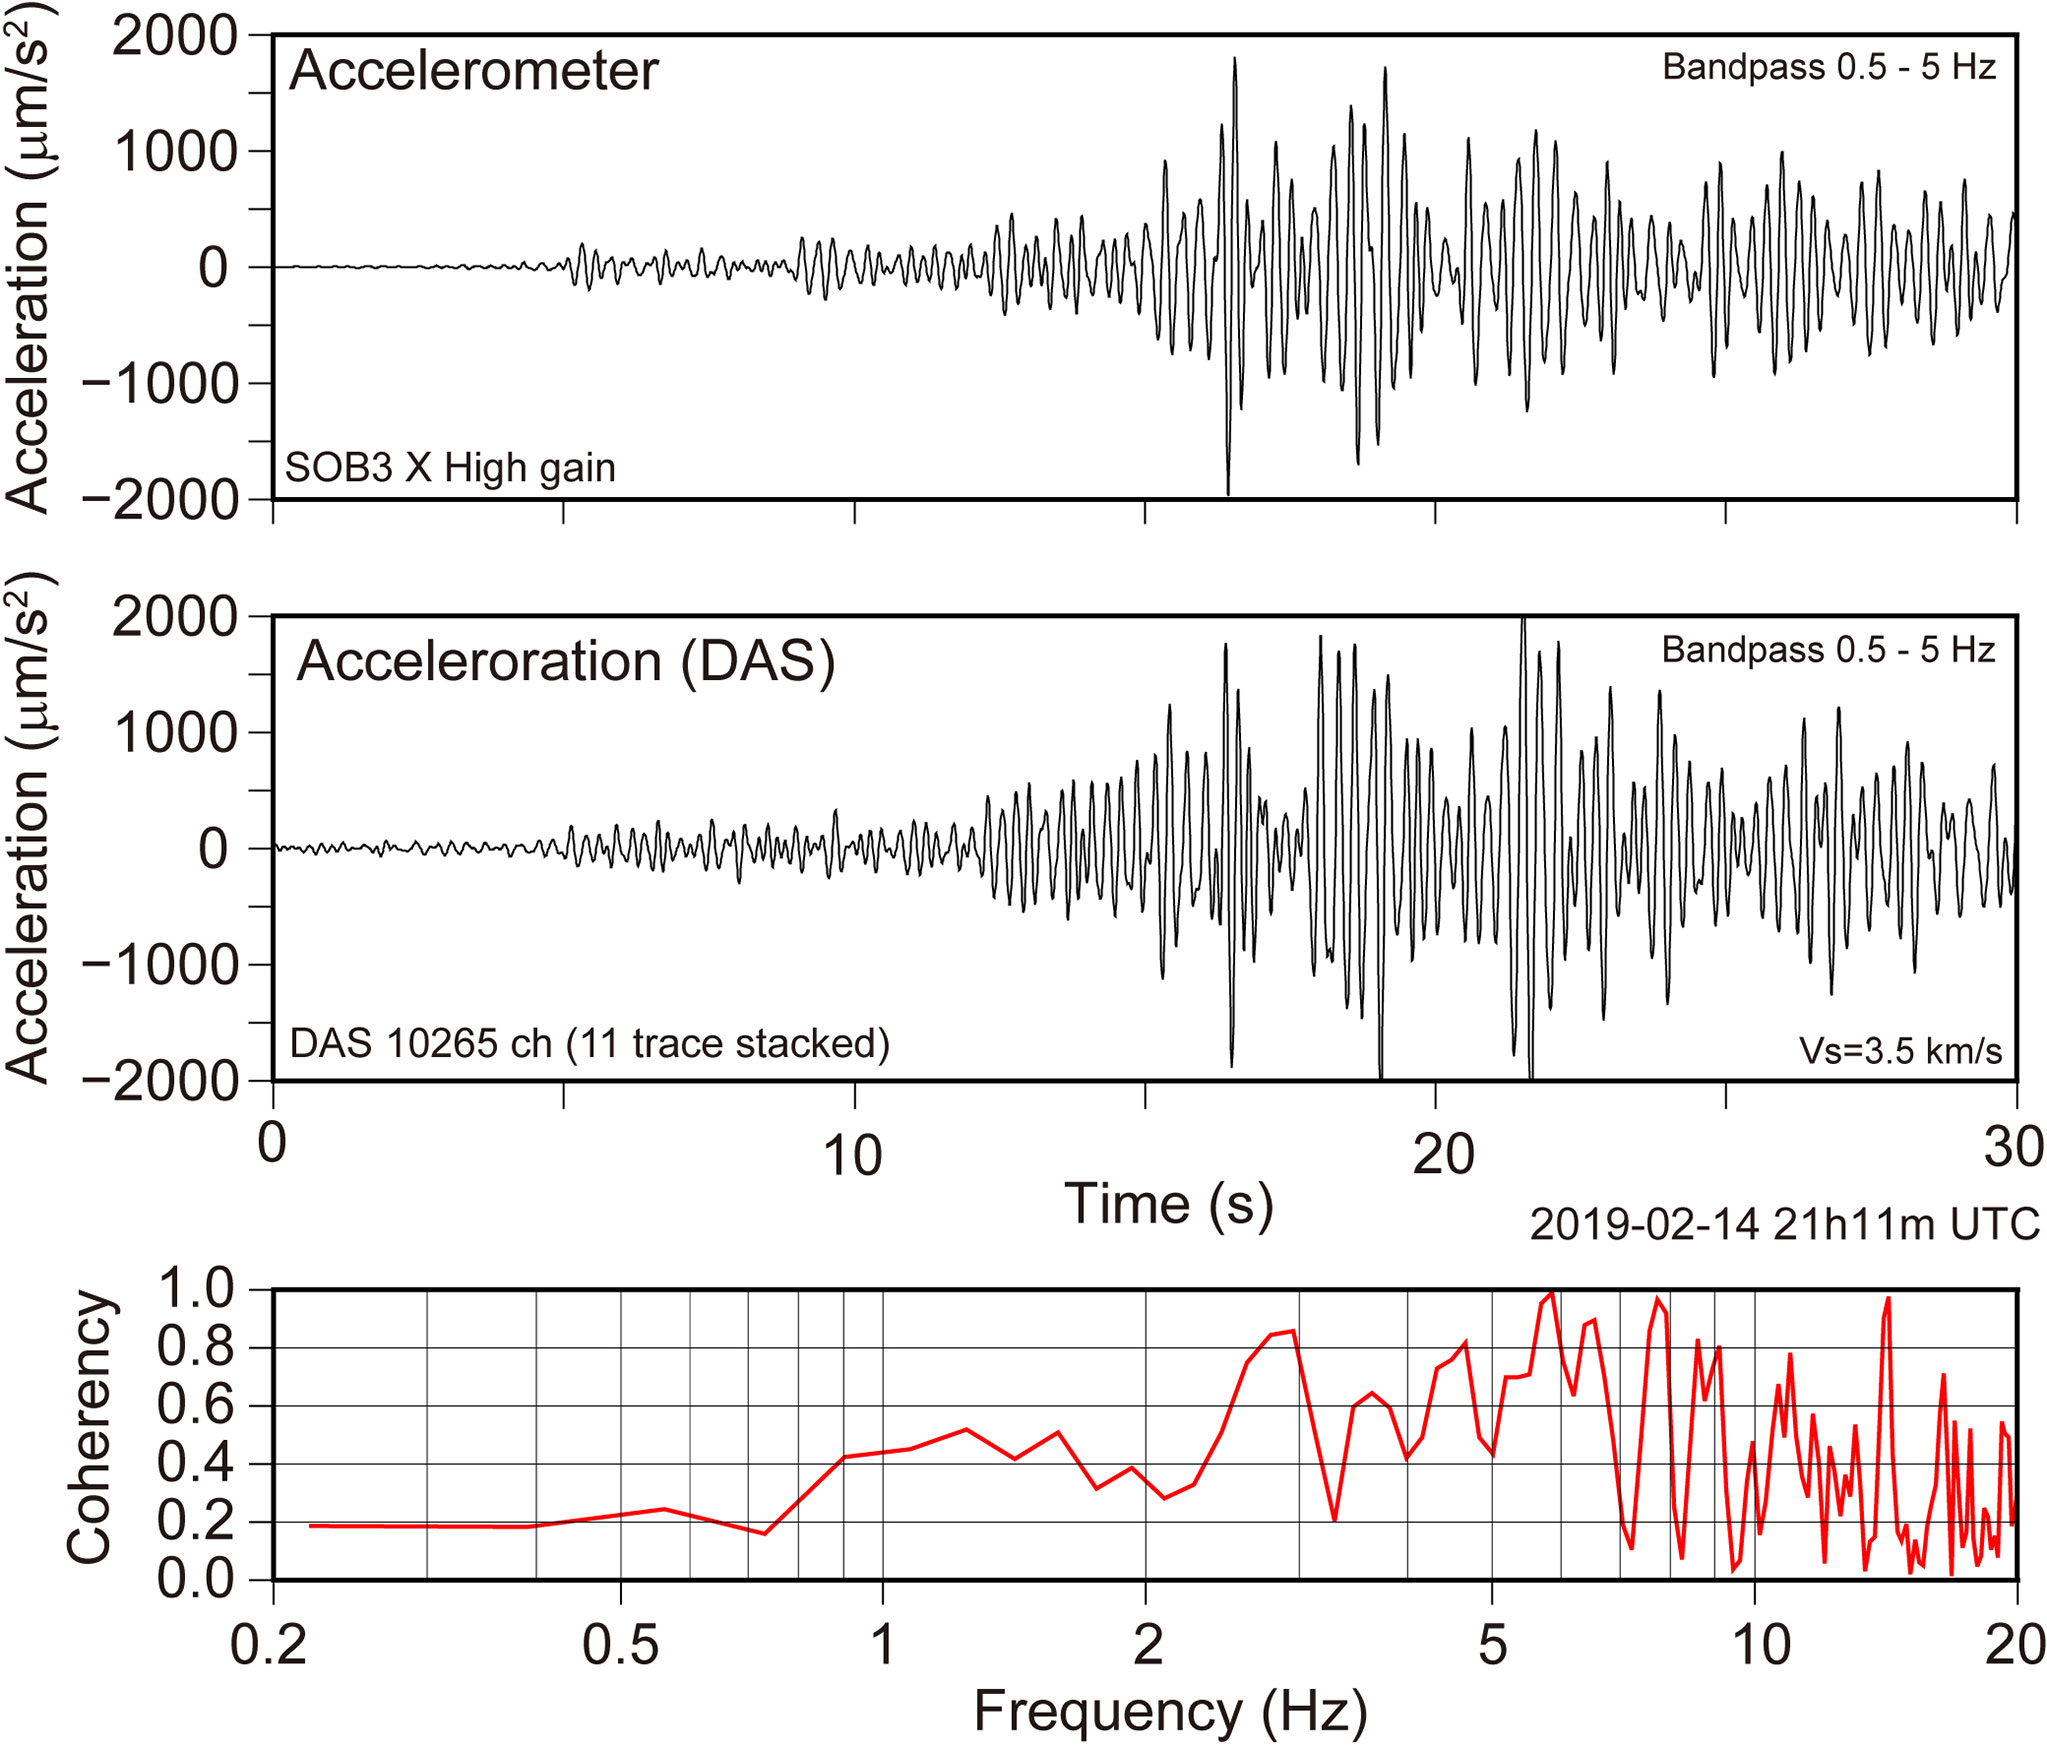
Figure 5 Comparison of the DAS records and records obtained by an accelerometer connected to the cable observation system. The data from the DAS measurement were converted to acceleration to compare the data from the accelerometer (SOB 3). The X-component of the SOB3 is parallel to the seafloor cable. The DAS data for the adjacent 11 channels were averaged and transformed to particle acceleration under an assumption of plane wave propagation with a velocity of 3.5 km. Both the records were filtered from 2 s to 5 Hz. Coherency between the records from the accelerometer and the acceleration data transformed from the DAS records was calculated. The channel of the DAS records to compare the data of the SOB3 was selected using airgun signals.
Phase data can be converted to strain data using a simple equation (1) according to the principle of interferometry. We converted phase data to strain data and estimated spectra to investigate the ambient noise obtained by the DAS measurement. First, we evaluated the temporal changes of ambient noise. Because continuous records were obtained through the observation, we calculated spectra at time intervals of 15 min throughout the observation using the DAS data at distances of 10 and 35 km from the coast after the conversion of the data from phase to strain using the appropriate parameters for each observation. The data for the calculation of the spectrum included 262,144 or 131,072 samples, respectively, which correspond to 524.288 s in time length, and the spectra were smoothed on the frequency domain. We calculated the spectra for the observations in February 2019 and March 2021. We obtained a total of 184 and 51 spectra for the observations in 2019 and 2021, respectively. The probability density functions of the power spectra (McNamara and Buland, 2004; McNamara and Boaz, 2006) of the strain were estimated. (Figure 6). Although the interrogators for the observations for 2019 and 2021 were different, the noise levels at the same distance were identical. Generally, the larger the noises in the strain, the longer the periods became. On the spectra at a distance of 10 km, large noise peaks were observed at time periods around 15 s for both spectra from the data of 2019 and 2021 (Figure 6). Large noises that correspond to microseisms (Webb, 1998) were also recognized at a distance of 35 km. The noise levels of strain-meters installed at the bottom of the borehole in land ranged from -200 to -180 dB (Barbour and Agnew, 2011). Araya et al. (2017) reported the noise levels from a laser strain-meter with a 1,500 m baseline constructed at an underground site of a deep vault in Kamioka, Gifu Prefecture, Japan. The noise levels at the Kamioka site were estimated to be some of the quietest in the world. In comparison with the noises obtained from the strain-meters installed in land, the noise levels from the DAS records were larger at time periods greater than 1 s. The noise levels of the DAS records become larger in longer periods. There is a possibility that this characteristic originates from DAS interrogators. On the other hand, the noise levels of the DAS measurement in the frequency range higher than 1 Hz were comparable to those from strain-meters in land. At a frequency around 10 Hz, the DAS noise levels were close to those of the Kamioka site (Araya et al., 2017).
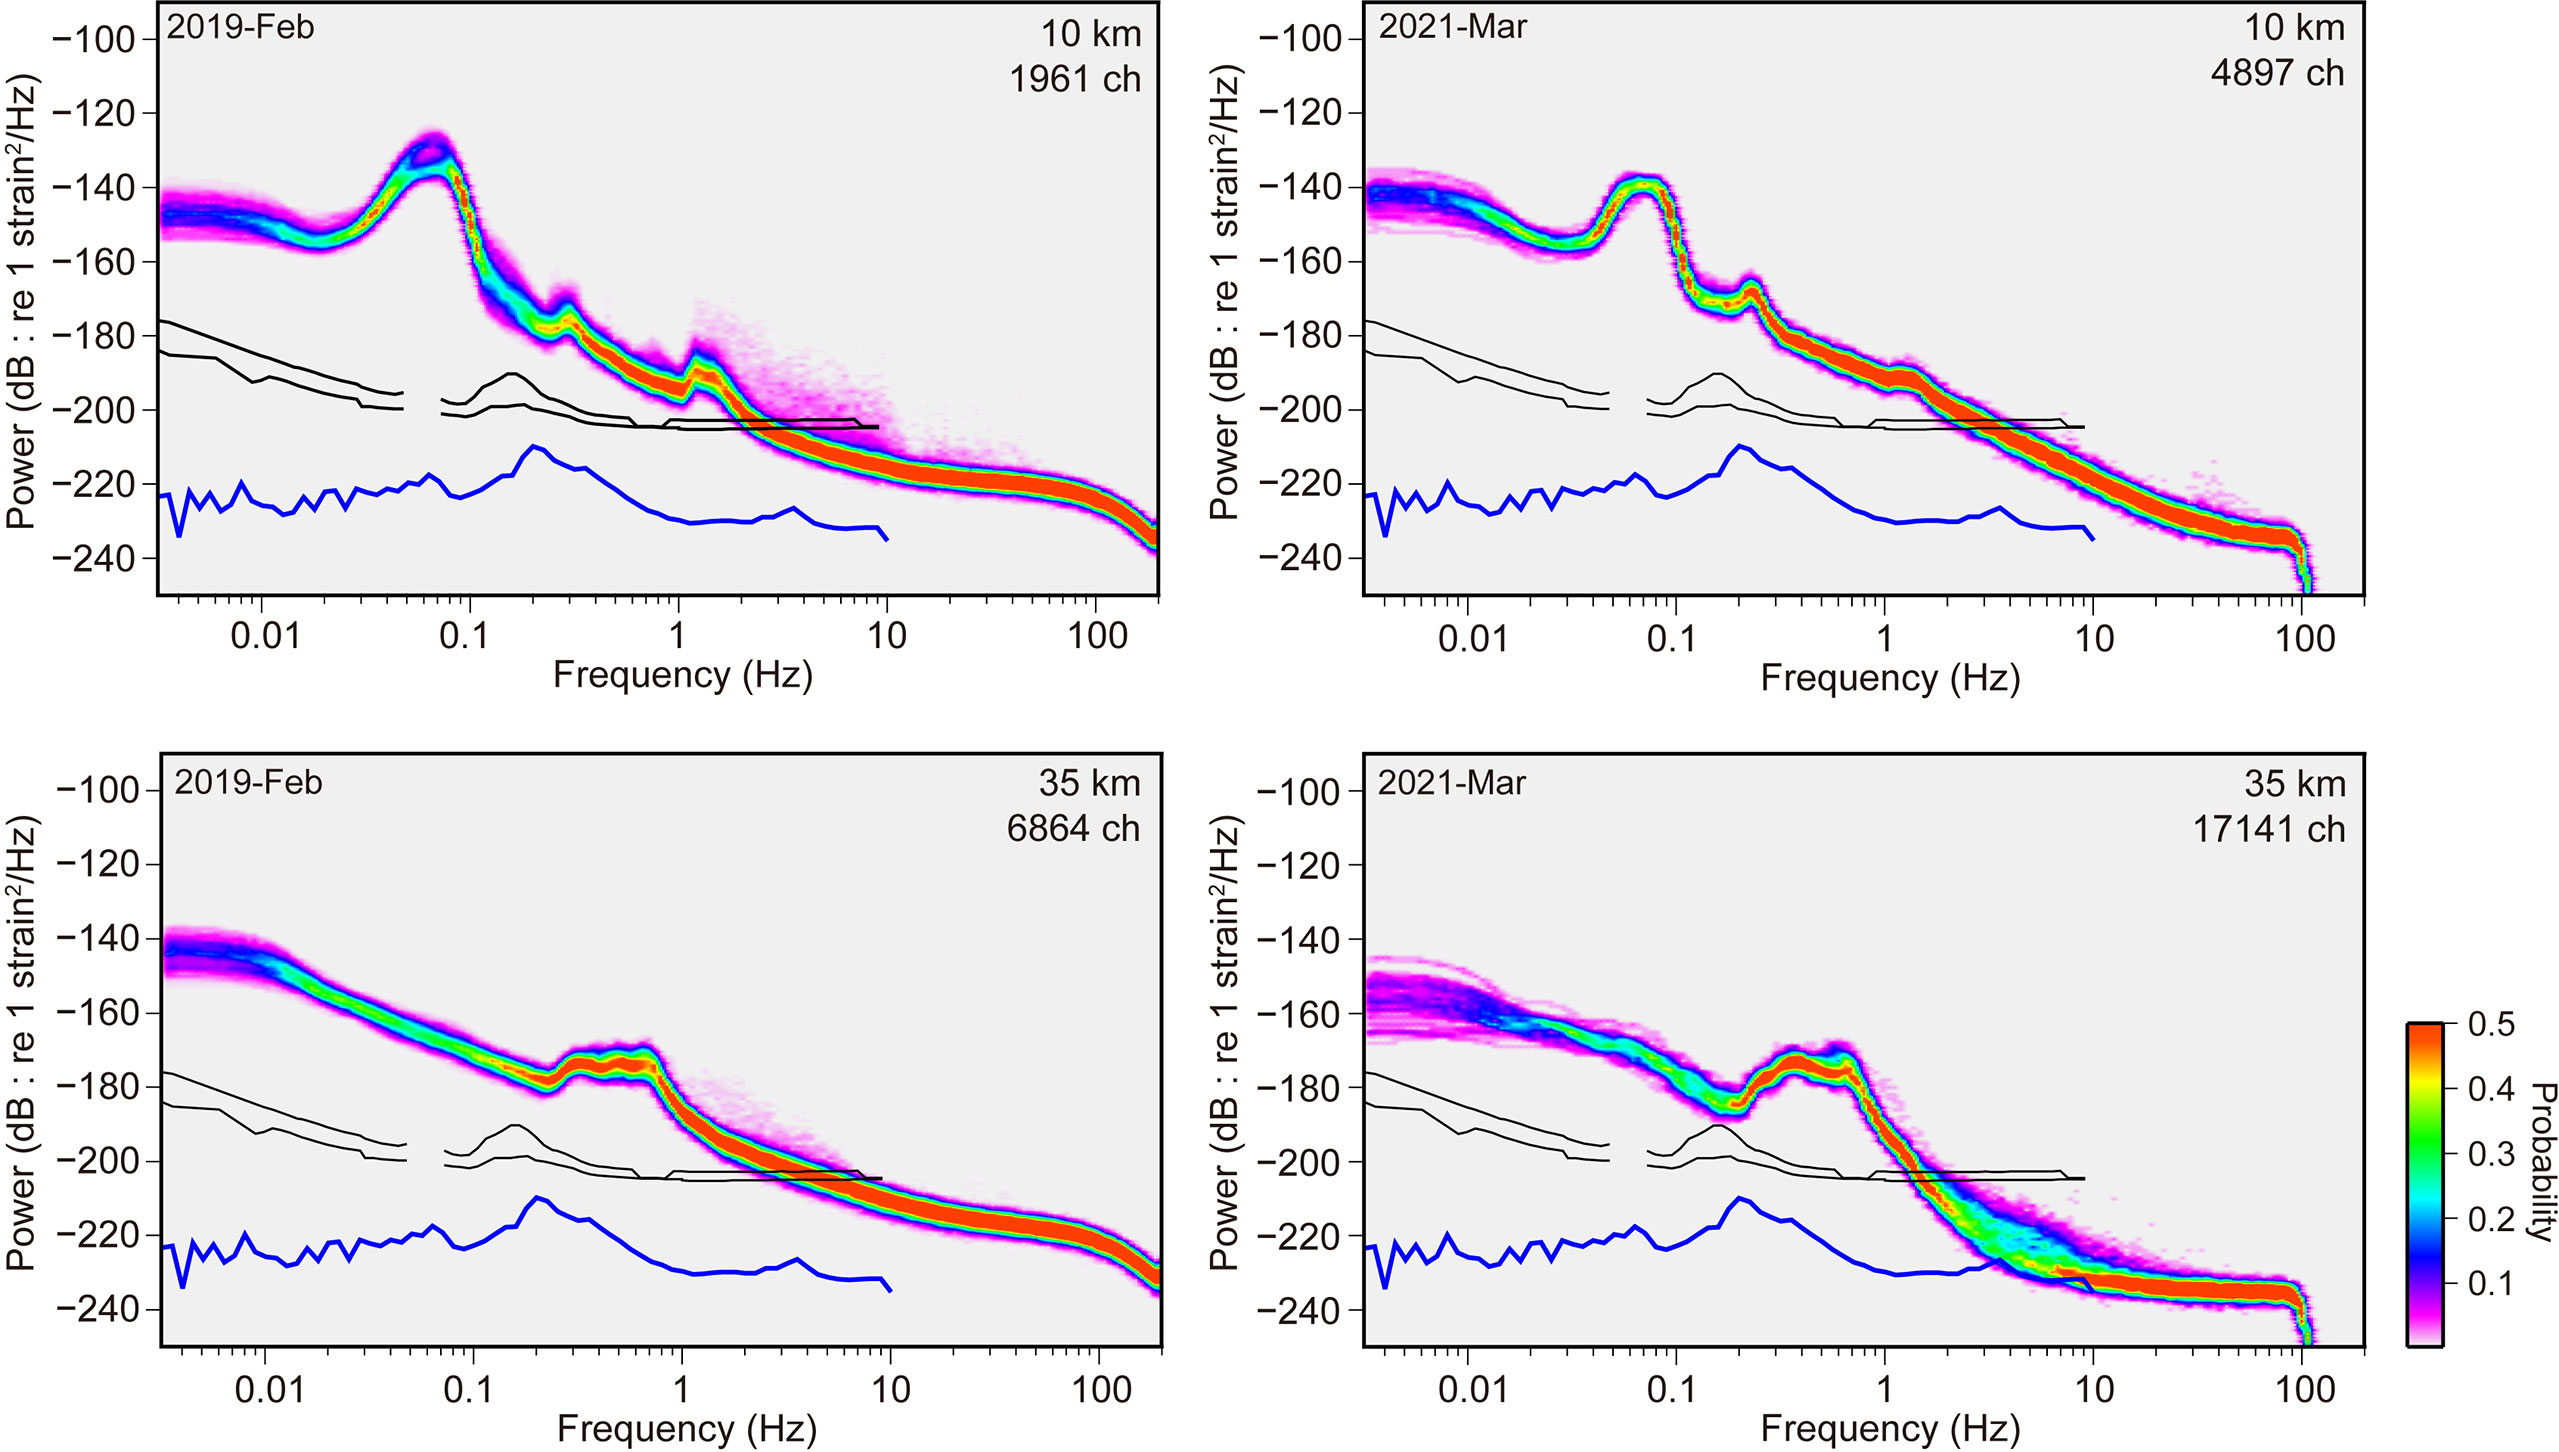
Figure 6 The probability density functions of ambient noise spectra on the seafloor collected by the DAS observation carried out in February 2019 (left) and March 2021 (right). Spectra of the data at distances of 10 and 35 km from the landing station are shown. Phase data of the DAS measurement were converted to strain. Black lines show the spectra of strain-meter on land (Barbour and Agnew, 2011). The blue curve indicates a result of a laser strain-meter in deep vaults in Japan (Araya et al., 2017). The DAS measurement has low noise levels in frequency greater than 1 Hz.
One advantage of a DAS measurement is obtaining an observation with a spatially high density over a long distance. Taking advantage of a spatially high density for the DAS dataset, the spatial variations of ambient seismic noise along the seafloor cable were revealed. Spectra were calculated using the time window of 524.288 s at every 50 m to estimate the spatial variation of ambient noise (Figure 7). We estimated the spatial changes of ambient noise levels for both observations in February 2019 and March 2021 and found that both results from different observations had similar characteristics. The primary seismic noises with a large amplitude in the periods around 15 s close to the coast were recognized. There was a secondary microseismic noise with a period of approximately 1 s from a distance of 10 km. In the vicinity of the coast, large noises with a period of approximately 15 s appeared. These large, low-frequency noise levels were observed by other DAS observations using a seafloor cable (Lior et al., 2021). The frequency of the noise migrates to a lower frequency, and the amplitude becomes small. At a distance of 20 km from the coast, the large noise levels around 15 s disappeared. The peaks of the noise were observed at a frequency of 1 Hz at a distance of 10 km from the coast. The peak frequency of this noise also migrated to a lower frequency, and the amplitude of the noises increases as the distance from the coast increased. These noise levels at large distances from the coast seem to correspond to the microseisms (Webb, 1998), which are commonly observed in the ocean and have a dominant period of 4 s. There is a possibility that this phenomenon is related to the generation of microseisms in the ocean. The observation in February 2019 had slightly larger noise levels in distances greater than 50 km compared to the noise levels at closer distances to the coast. The scattered light travels over a long distance for a large offset attenuate. The small amplitude of scattered light may affect the accuracy of a measurement using interferometry.
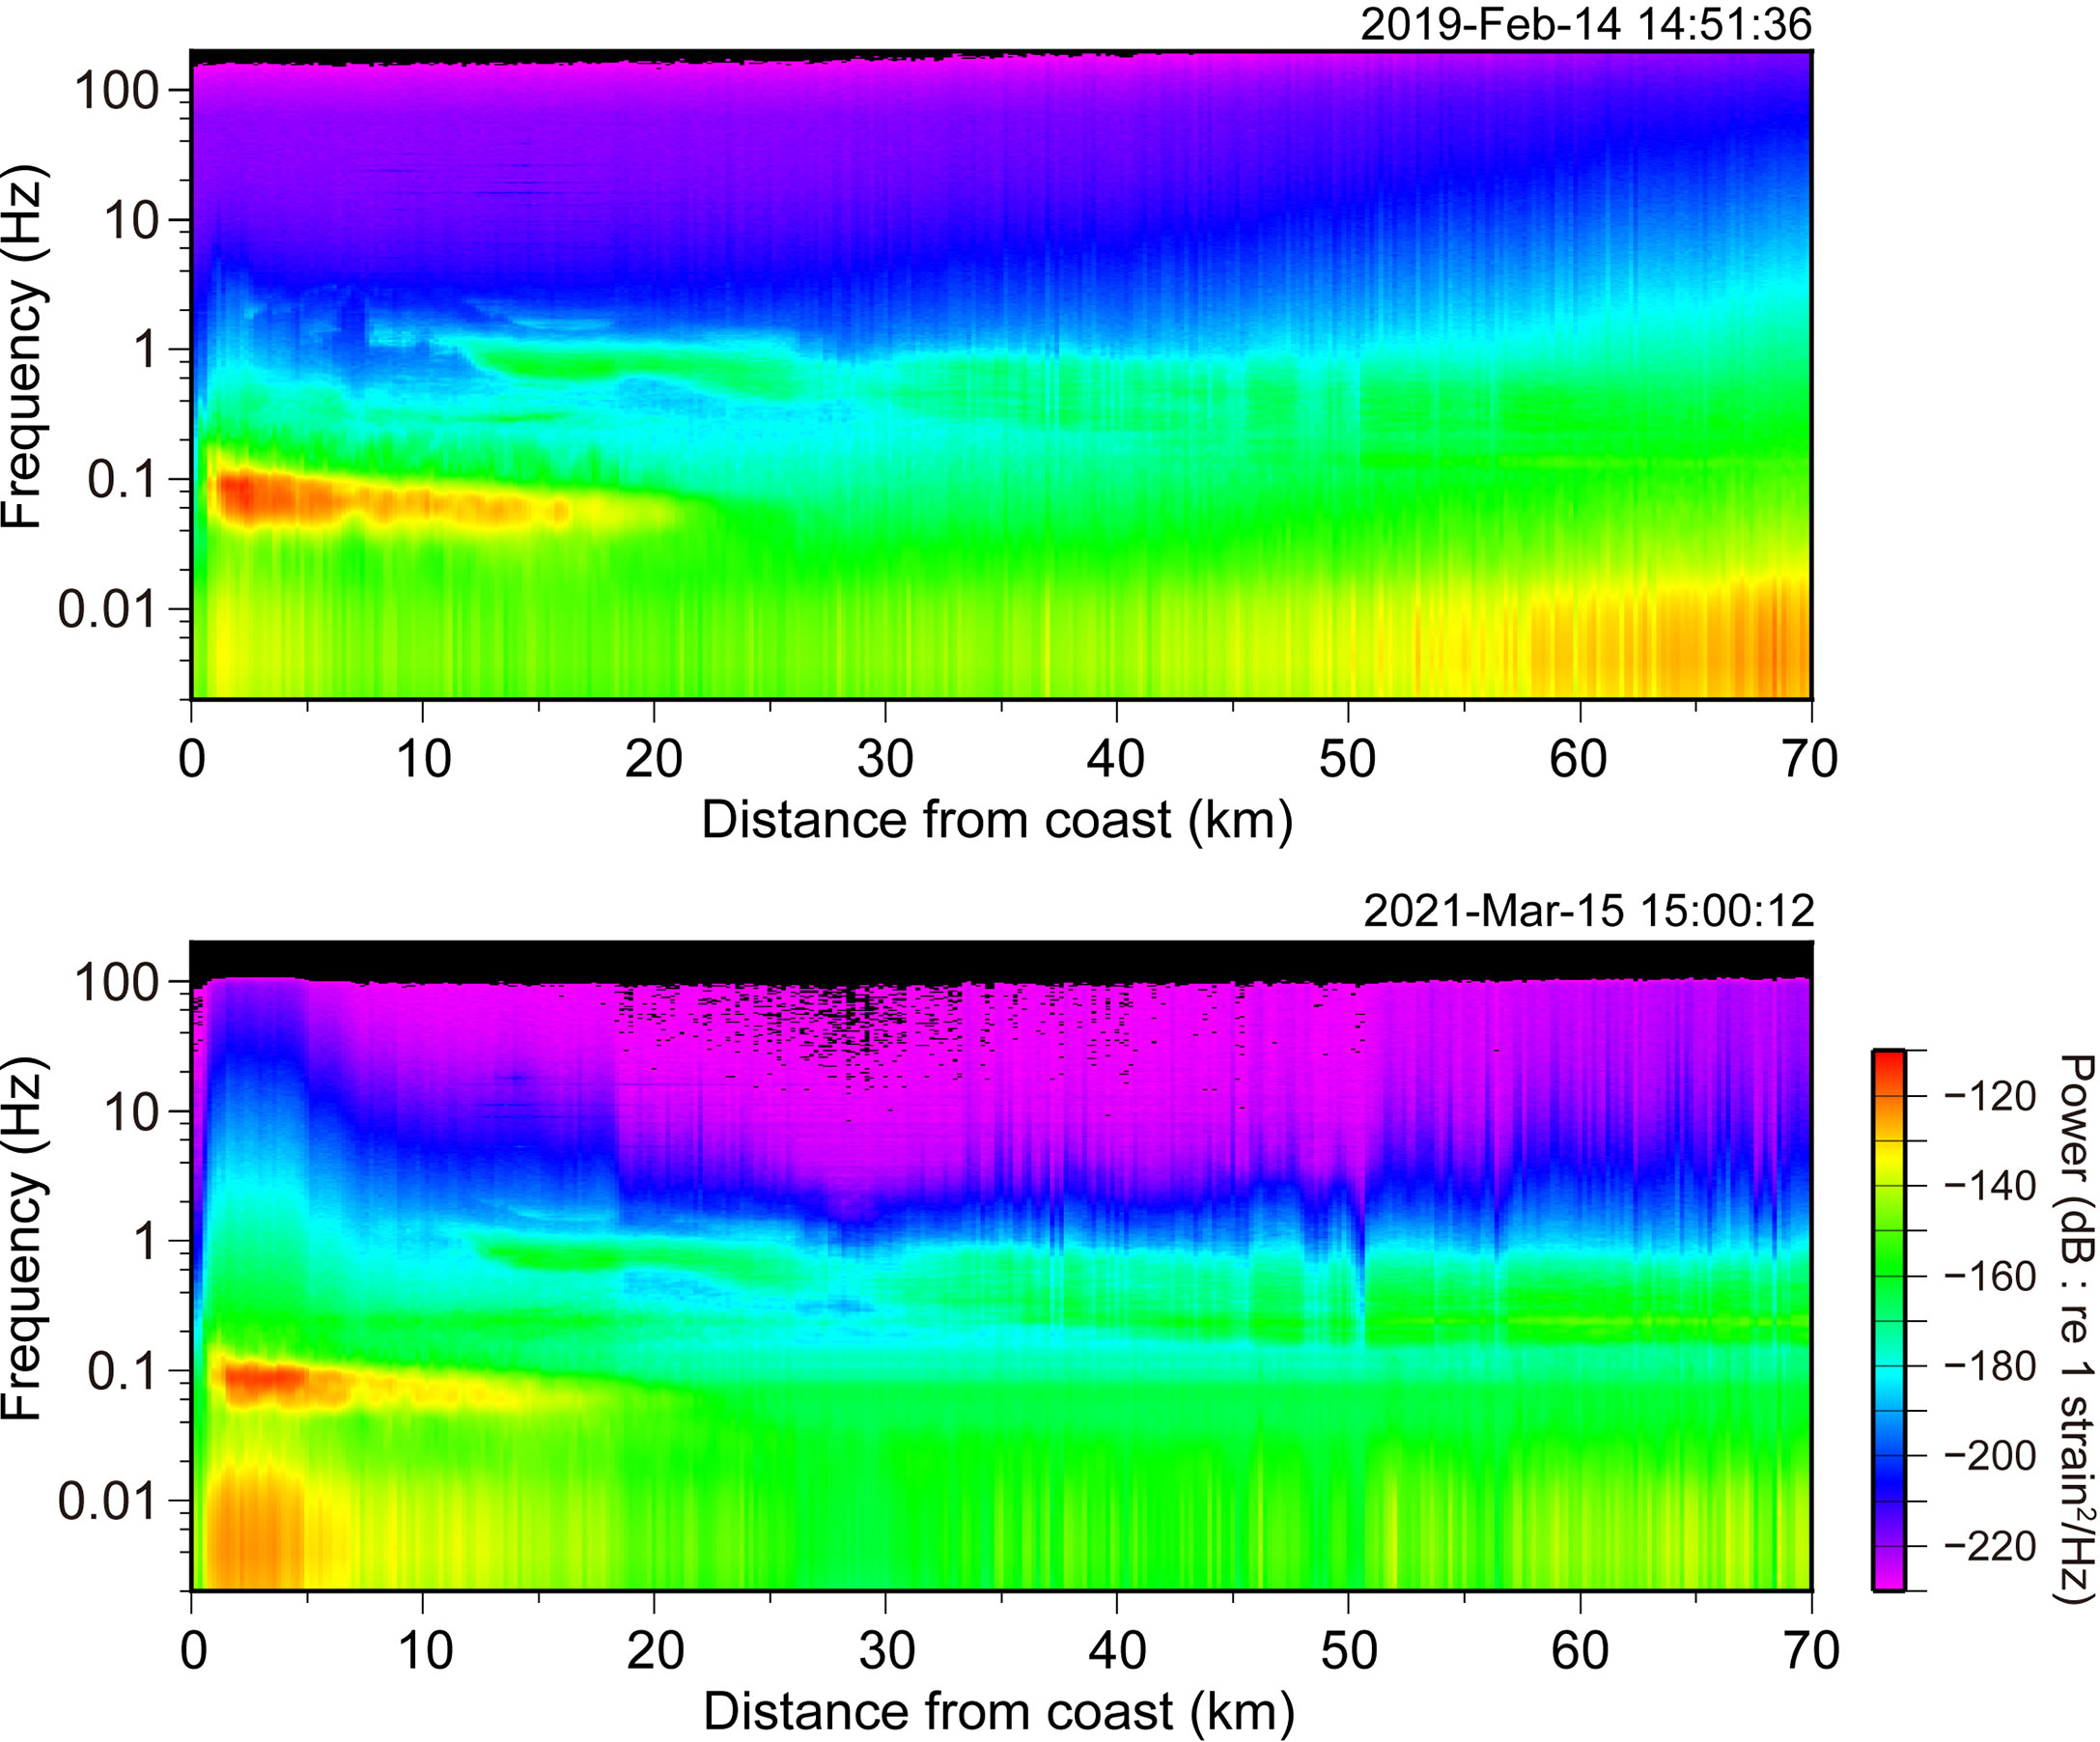
Figure 7 Spatial variation of ambient noise spectra on the seafloor obtained by the DAS measurements in February 2019 (upper) and March 2021 (lower). The horizontal axis is the distance from the coast, and the vertical axis shows frequency. There were large noises around a period of 15 s near the coast.
The spectra of ambient seismic noises recorded by the DAS system were compared to a noise model after the conversion of the DAS data to particle acceleration. We estimated the spectra of ambient noises using the DAS records. Ambient noises are thought to propagate as surface waves along the seafloor. Spica et al. (2020) obtained an S-wave velocity just below the Sanriku cable system using the DAS data. We adopted an apparent velocity of 500 m/s for the conversion from strain to particle velocity because there was an average velocity of 500–700 m/s for the shallow layers (Spica et al., 2020). We calculated the spectra for the observation in February 2019 at every 1,000 channels, which correspond to a spatial interval of 5 km with a time window of 524.288 s (Figure 8). The levels of the ambient noise based on the DAS measurement were close to the high-noise model (HNM) (Peterson, 1993) from the estimated spectra. Large peaks of noises around 15 s were recognized in the spectra estimated from the data collected at distances smaller than 20 km from the coast. These peaks were much larger than the HNM; however, the amplitude of these peaks decreased with the distance from the coast, and there was no peak around 15 s in the spectra calculated using the data at distances greater than 30 km. We also compared the ambient noise spectra obtained by the DAS system with those of the SOB3, which has a conventional accelerometer and is positioned at a distance of approximately 50 km from the coast. The noise levels obtained from the SOB3 were comparable to those recorded by the DAS system. Although it was inferred that the S/N ratio of the DAS record at a distance of 50 km from the coast becomes lower, the noise levels were similar to that of the conventional accelerometer. At a frequency lower than 0.03 Hz, the noise levels estimated from the DAS records become lower than those from the accelerometer at the SOB3. It can be interpreted that the sensitivity of the DAS measurement is low in this low-frequency range. We concluded that the performance of the seismic observation using the DAS system on the seafloor corresponds to that using a conventional force feedback-type accelerometer in a frequency range higher than 0.03 Hz.
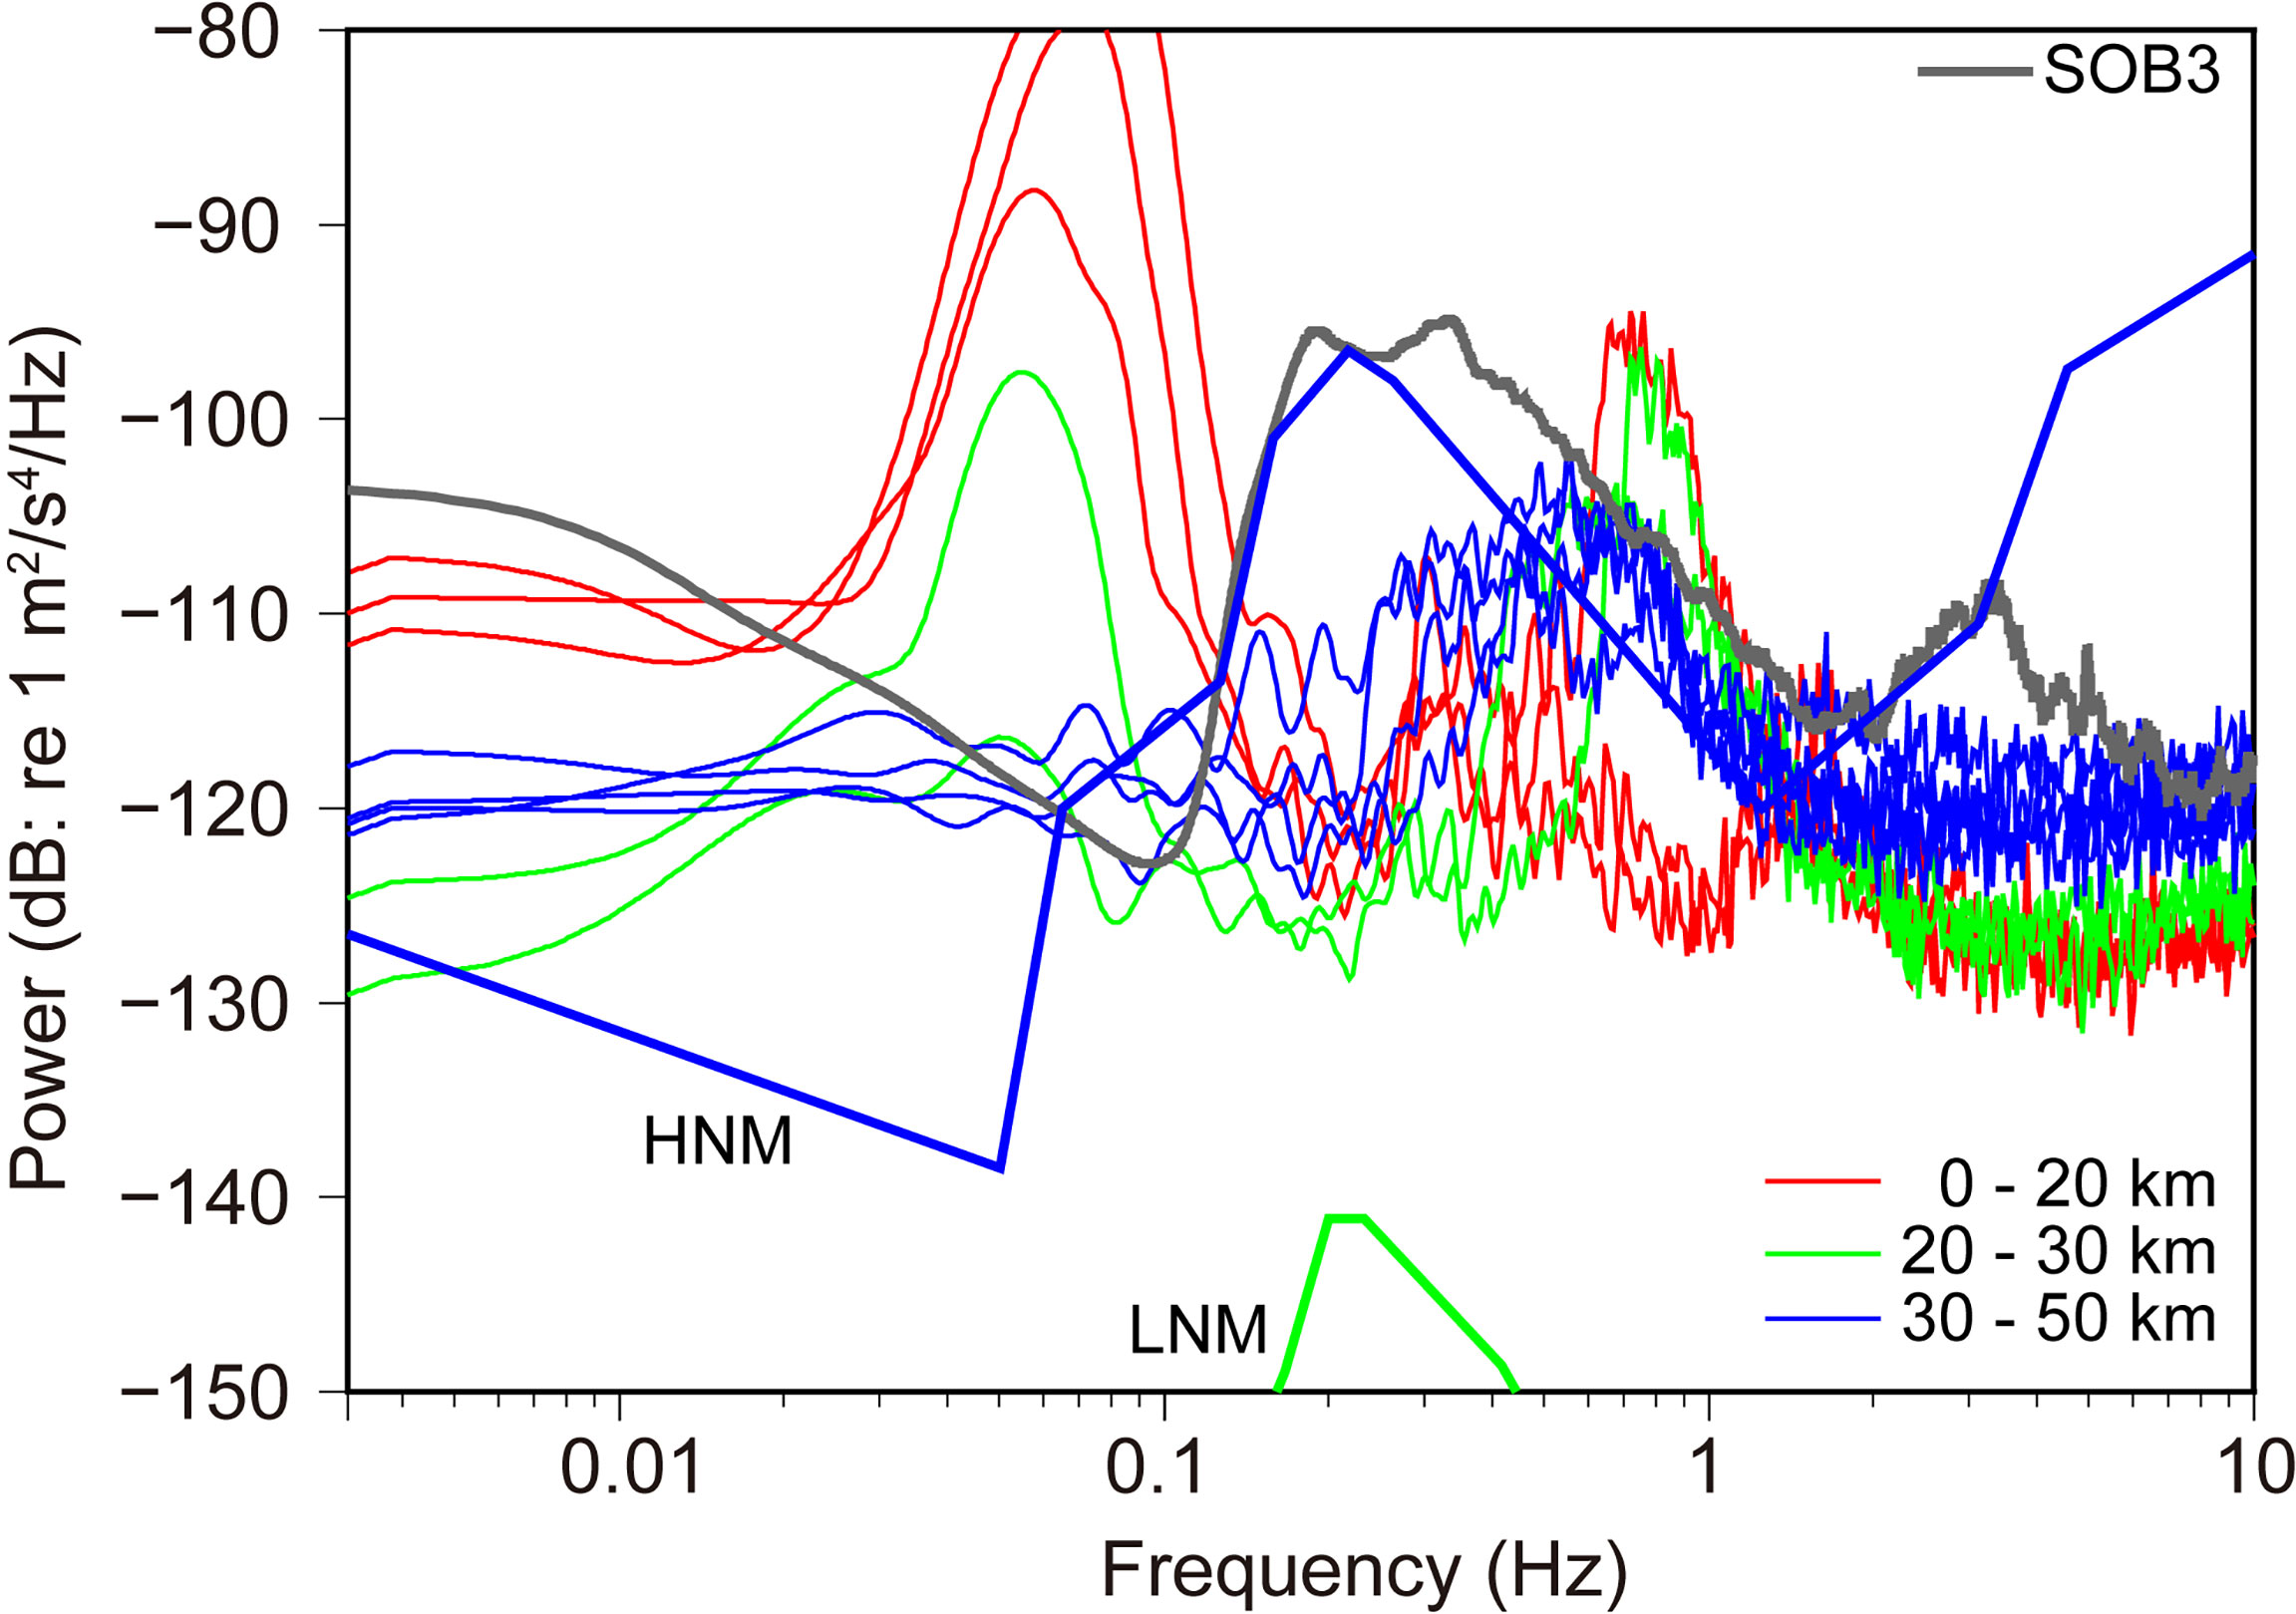
Figure 8 Ambient seismic noise spectra in acceleration on the seafloor estimated using the DAS observation data. The DAS data were converted to particle acceleration under an assumption of plane wave propagation. For the conversion, a wave propagation velocity of 500 m/s was used. The data length for the estimation of the spectra was approximately 524 s. Colors of lines indicate a distance range from the coast. The gray lines denote a typical ambient seismic noise spectrum of the X-component at the SOB3, which is positioned at a distance of approximately 50 km from the coast. The HNM and LNM are also displayed (Peterson, 1993). Noise levels of the DAS measurement are comparable to that of a conventional accelerometer in frequencies greater than 0.5 Hz.
After a few pilot observations using the DAS measurement, we carried out a seismic survey using the DAS measurement and marine-controlled sources in November 2020. The profiles ran along the seafloor cable route of the Sanriku seafloor observation system. The shallowest water depth of the profile was approximately 200 m, and the maximum length of the profile was 213 km (Figure 1). In this section, we discuss the data-recording signals from the large-airgun array (four Bolt 1500LL) with a total capacity of 6,000 in3 due to its large energy. Shooting intervals were 40 s, which correspond to an interval of approximately 100 m at a ship speed of approximately 4.5 knots. Two identical DAS interrogators were used to record the airgun signals. Each interrogator connected separate fibers in the seafloor cable. The temporal sampling frequency was 500 Hz, and the gauge length was set to 40 m. The spatial channel interval was approximately 5 m. The main objective of the recording using two identical interrogators with separate fibers was to make redundant airgun recordings because it was difficult to repeat the shooting in the marine area. There was an additional purpose to confirm the repeatability of the DAS recording, i.e., we tried to check whether identical records using different equipment were obtained. We calculated the coherency between the two records including water wave arrivals, to confirm the repeatability of the DAS records (Figure 9). For the estimation of coherency, we applied a bandpass filter from 1,000 s to 25 Hz. As a result, high coherency was generally obtained; however, the coherency at some frequencies had low values. It is known that the airgun source has no broadband spectra. After the calculation of the spectra of an airgun source recorded by the towed hydrophone streamer, the notch frequencies in an airgun source seem to be different from the frequencies where coherency decreases. We concluded that system noises may cause this low coherency. After the records were band-passed with a narrow band filter, which is usually applied for a seismic survey, we obtained similar records. It was confirmed that there is little difference between different interrogators and fibers.
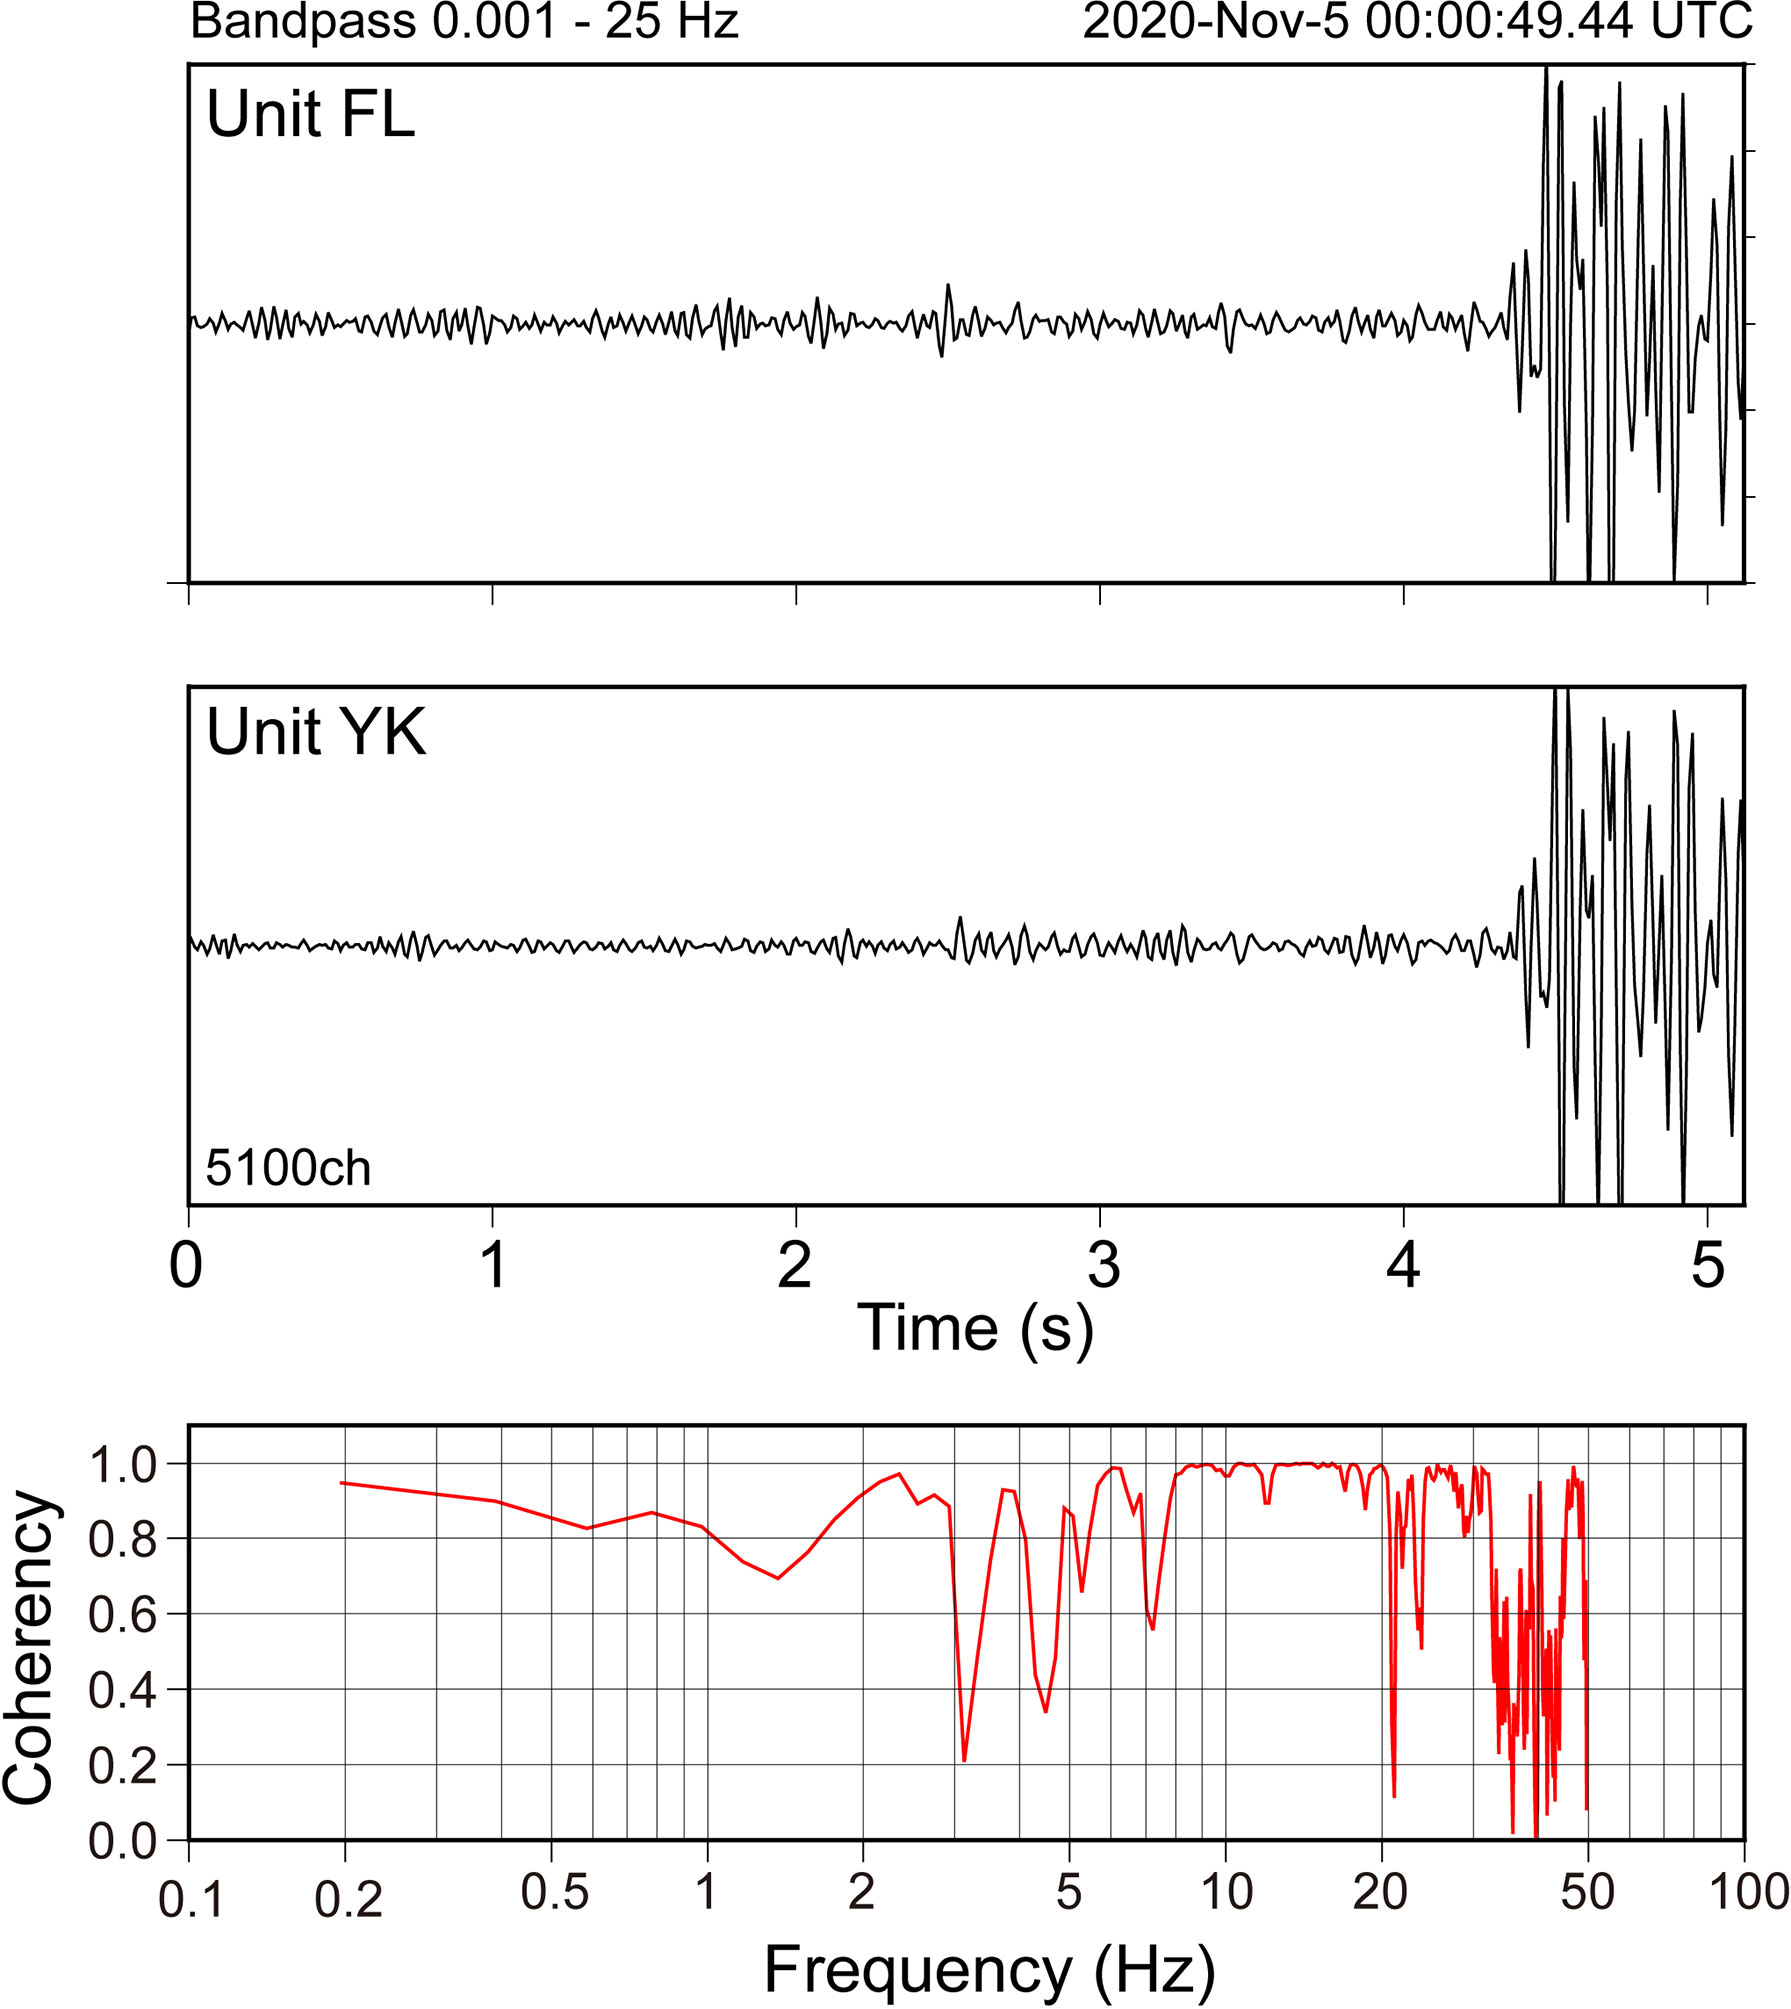
Figure 9 Comparison of the records of airgun signals by two identical interrogators using a different fiber in the same seafloor cable. A bandpass filter from 1,000 s to 25 Hz was applied. The large amplitude of both records indicates arrivals of direct water waves from airguns. Coherency between both the records was calculated (lower). High coherency was generally obtained; however, the coherency at some frequencies was low.
The signals from the airguns were clearly recorded using the DAS measurement (Figure 10). The DAS records had a high S/N ratio until the offset distance of 40 km for the seaward side. Water waves were clearly recorded. Before the arrivals of direct water waves, the arrivals of refracted/reflected waves were also recognized. The refracted and reflected waves at offset distances up to 15 km from the seismic sources were observed (Figure 11). Because the first arrivals have an apparent velocity of approximately 3.6 km/s, we concluded they were the first arrivals of refracted P-waves. The DAS measurement using a fiber laid down on the seafloor was sensitive to the horizontal direction. The first arrivals had a small amplitude, and then waves with large amplitudes were observed. The later waves with a similar apparent velocity as the first arrivals, which were estimated to be converted to S-waves, had larger amplitudes than the first arrivals. We also compared the time–distance profiles of a common receiver gather from the accelerometer in the SOB3 to a common shot gather and a common receiver gather using the DAS measurement (Figure 12). The P-wave arrivals of the DAS records had smaller amplitudes than those of the accelerometer. In the DAS records, S-wave arrivals were more clearly seen on the DAS records compared to the P-wave arrivals. Using the travel times of water waves shooting at various positions, we precisely relocated each channel in the DAS records. The position of the accelerometer of the cable observation system was also redetermined by the travel times of airgun shooting. This information was useful to compare the data obtained by the DAS measurement with the accelerometer.
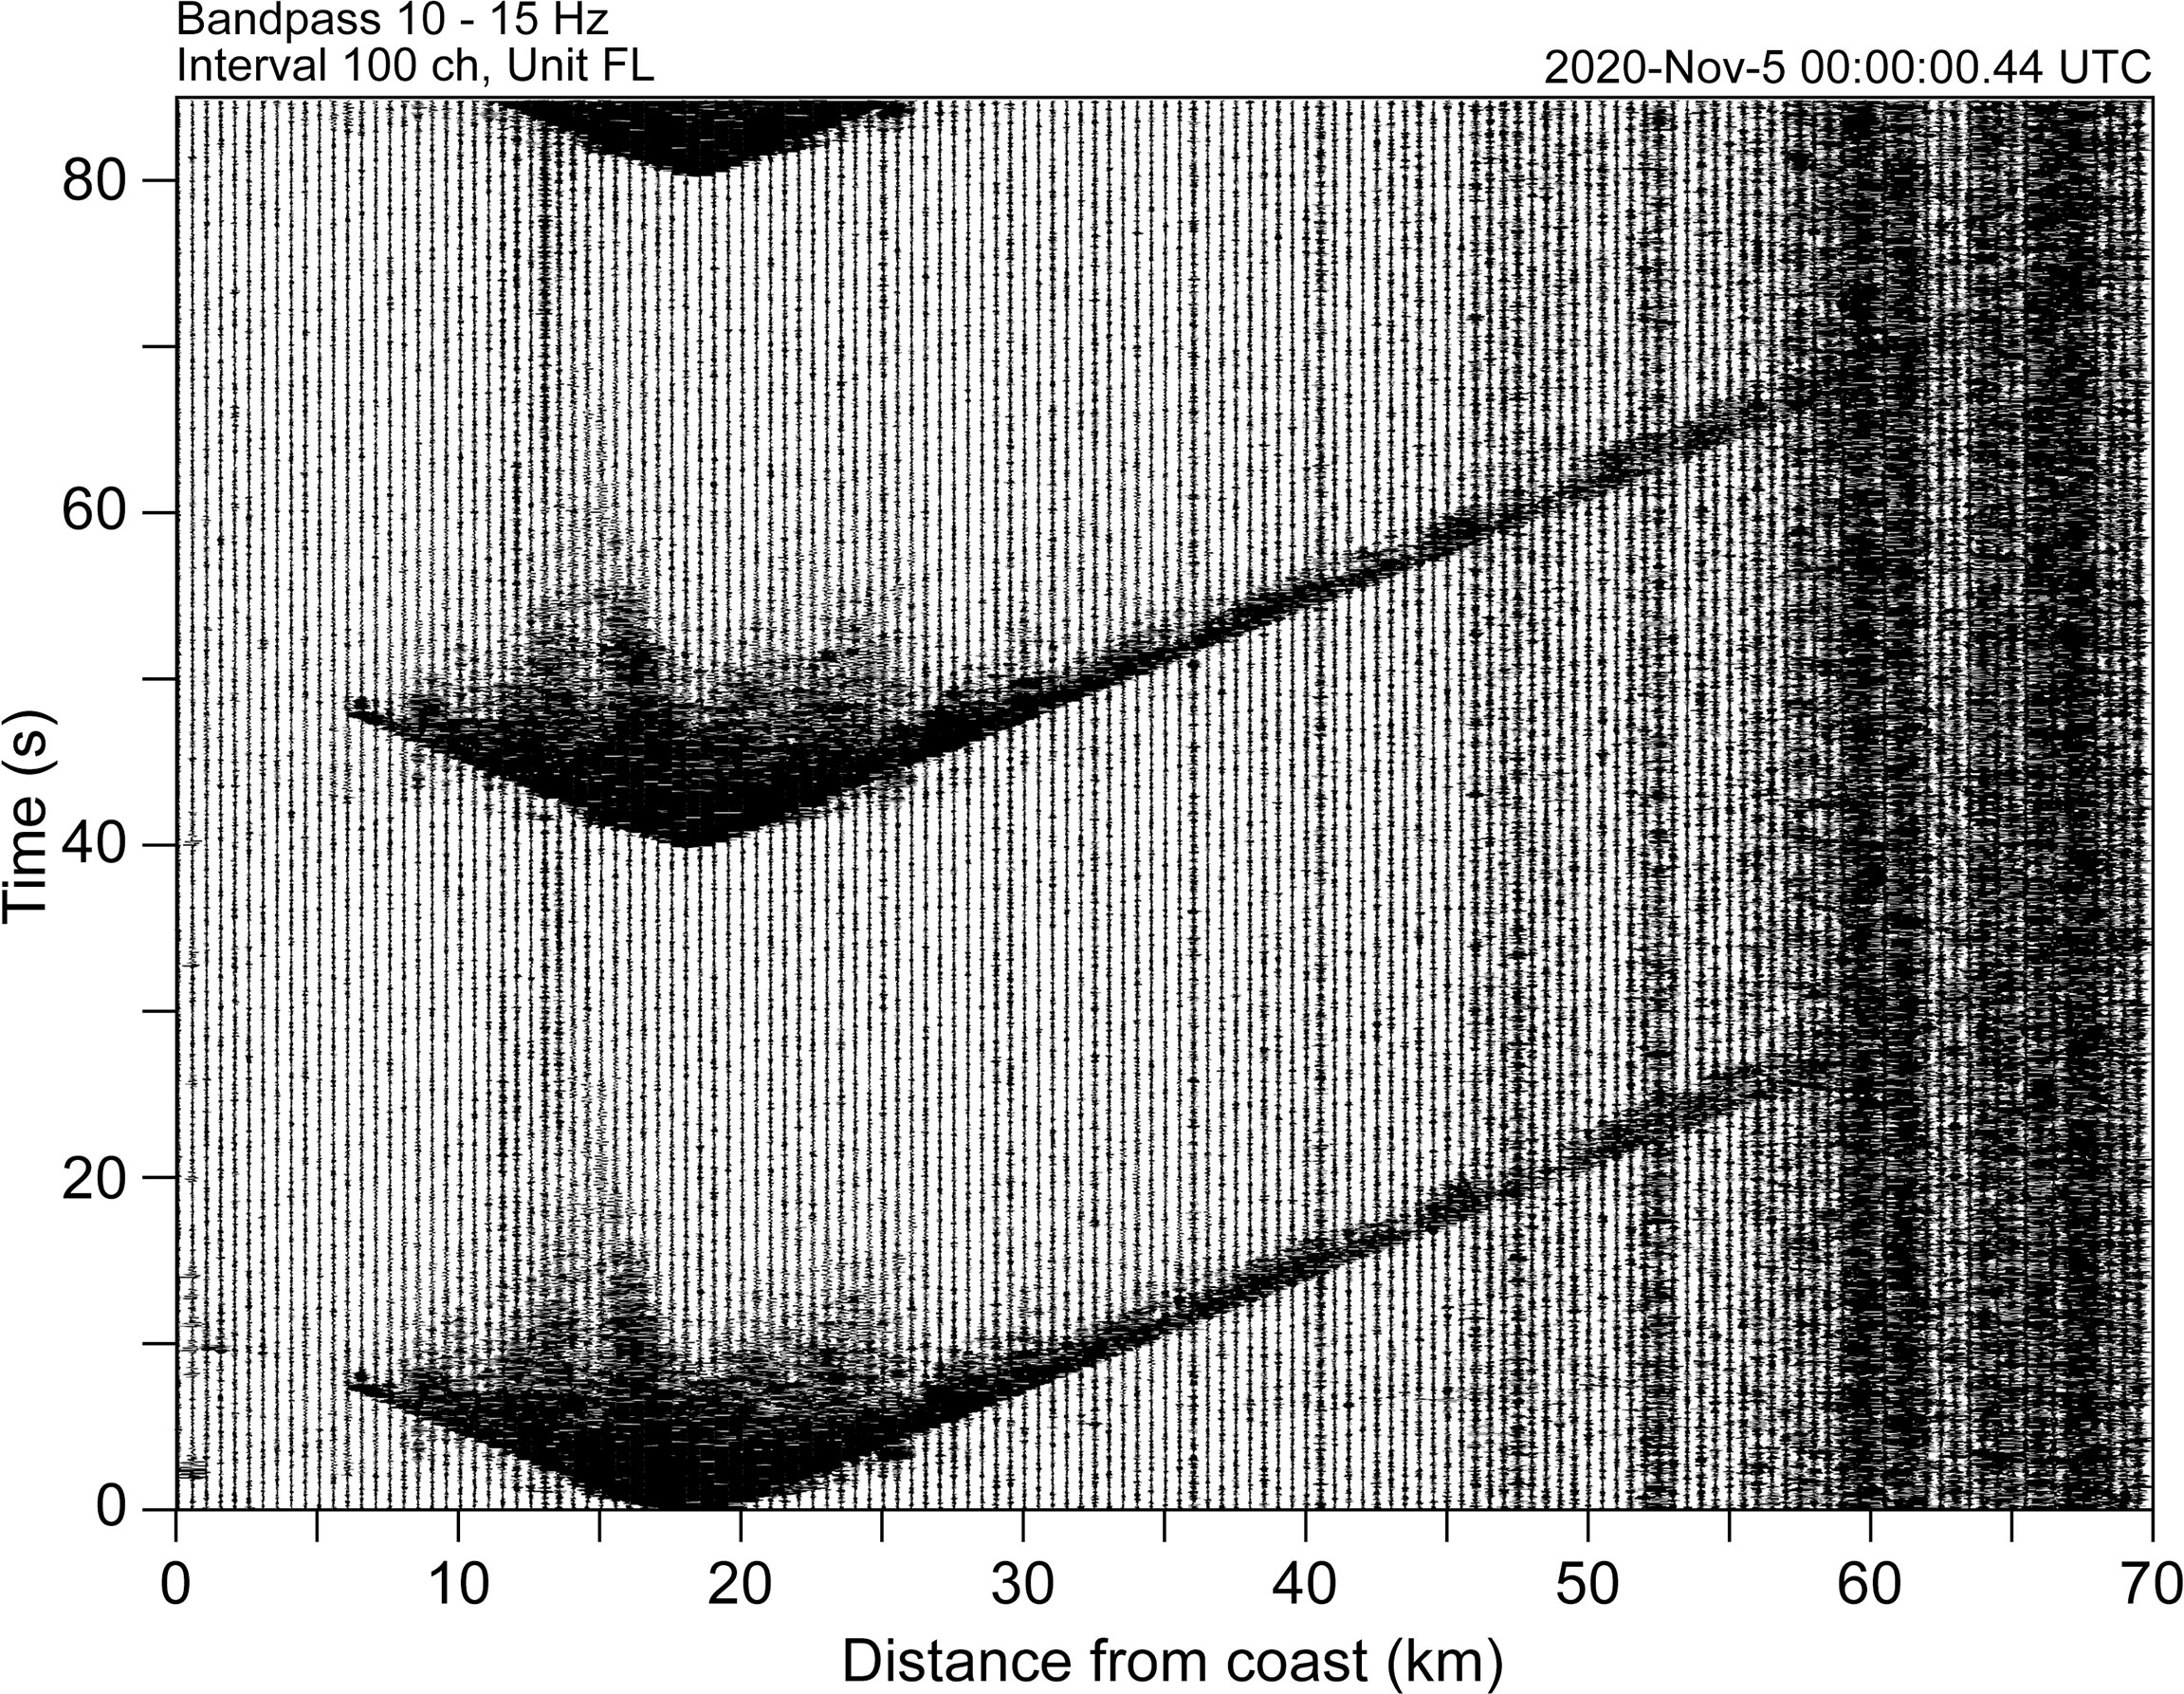
Figure 10 Airgun records by the DAS measurements using the Sanriku cable observation system. The records of every 100 channels are plotted with a bandpass frequency filter. The horizontal axis indicates a distance from the interrogator, and the vertical axis is time. The DAS records have a high S/N ratio up to a distance of 60 km from the coast. Refracted and reflected waves were recognized until approximately 10 km from the seismic source.
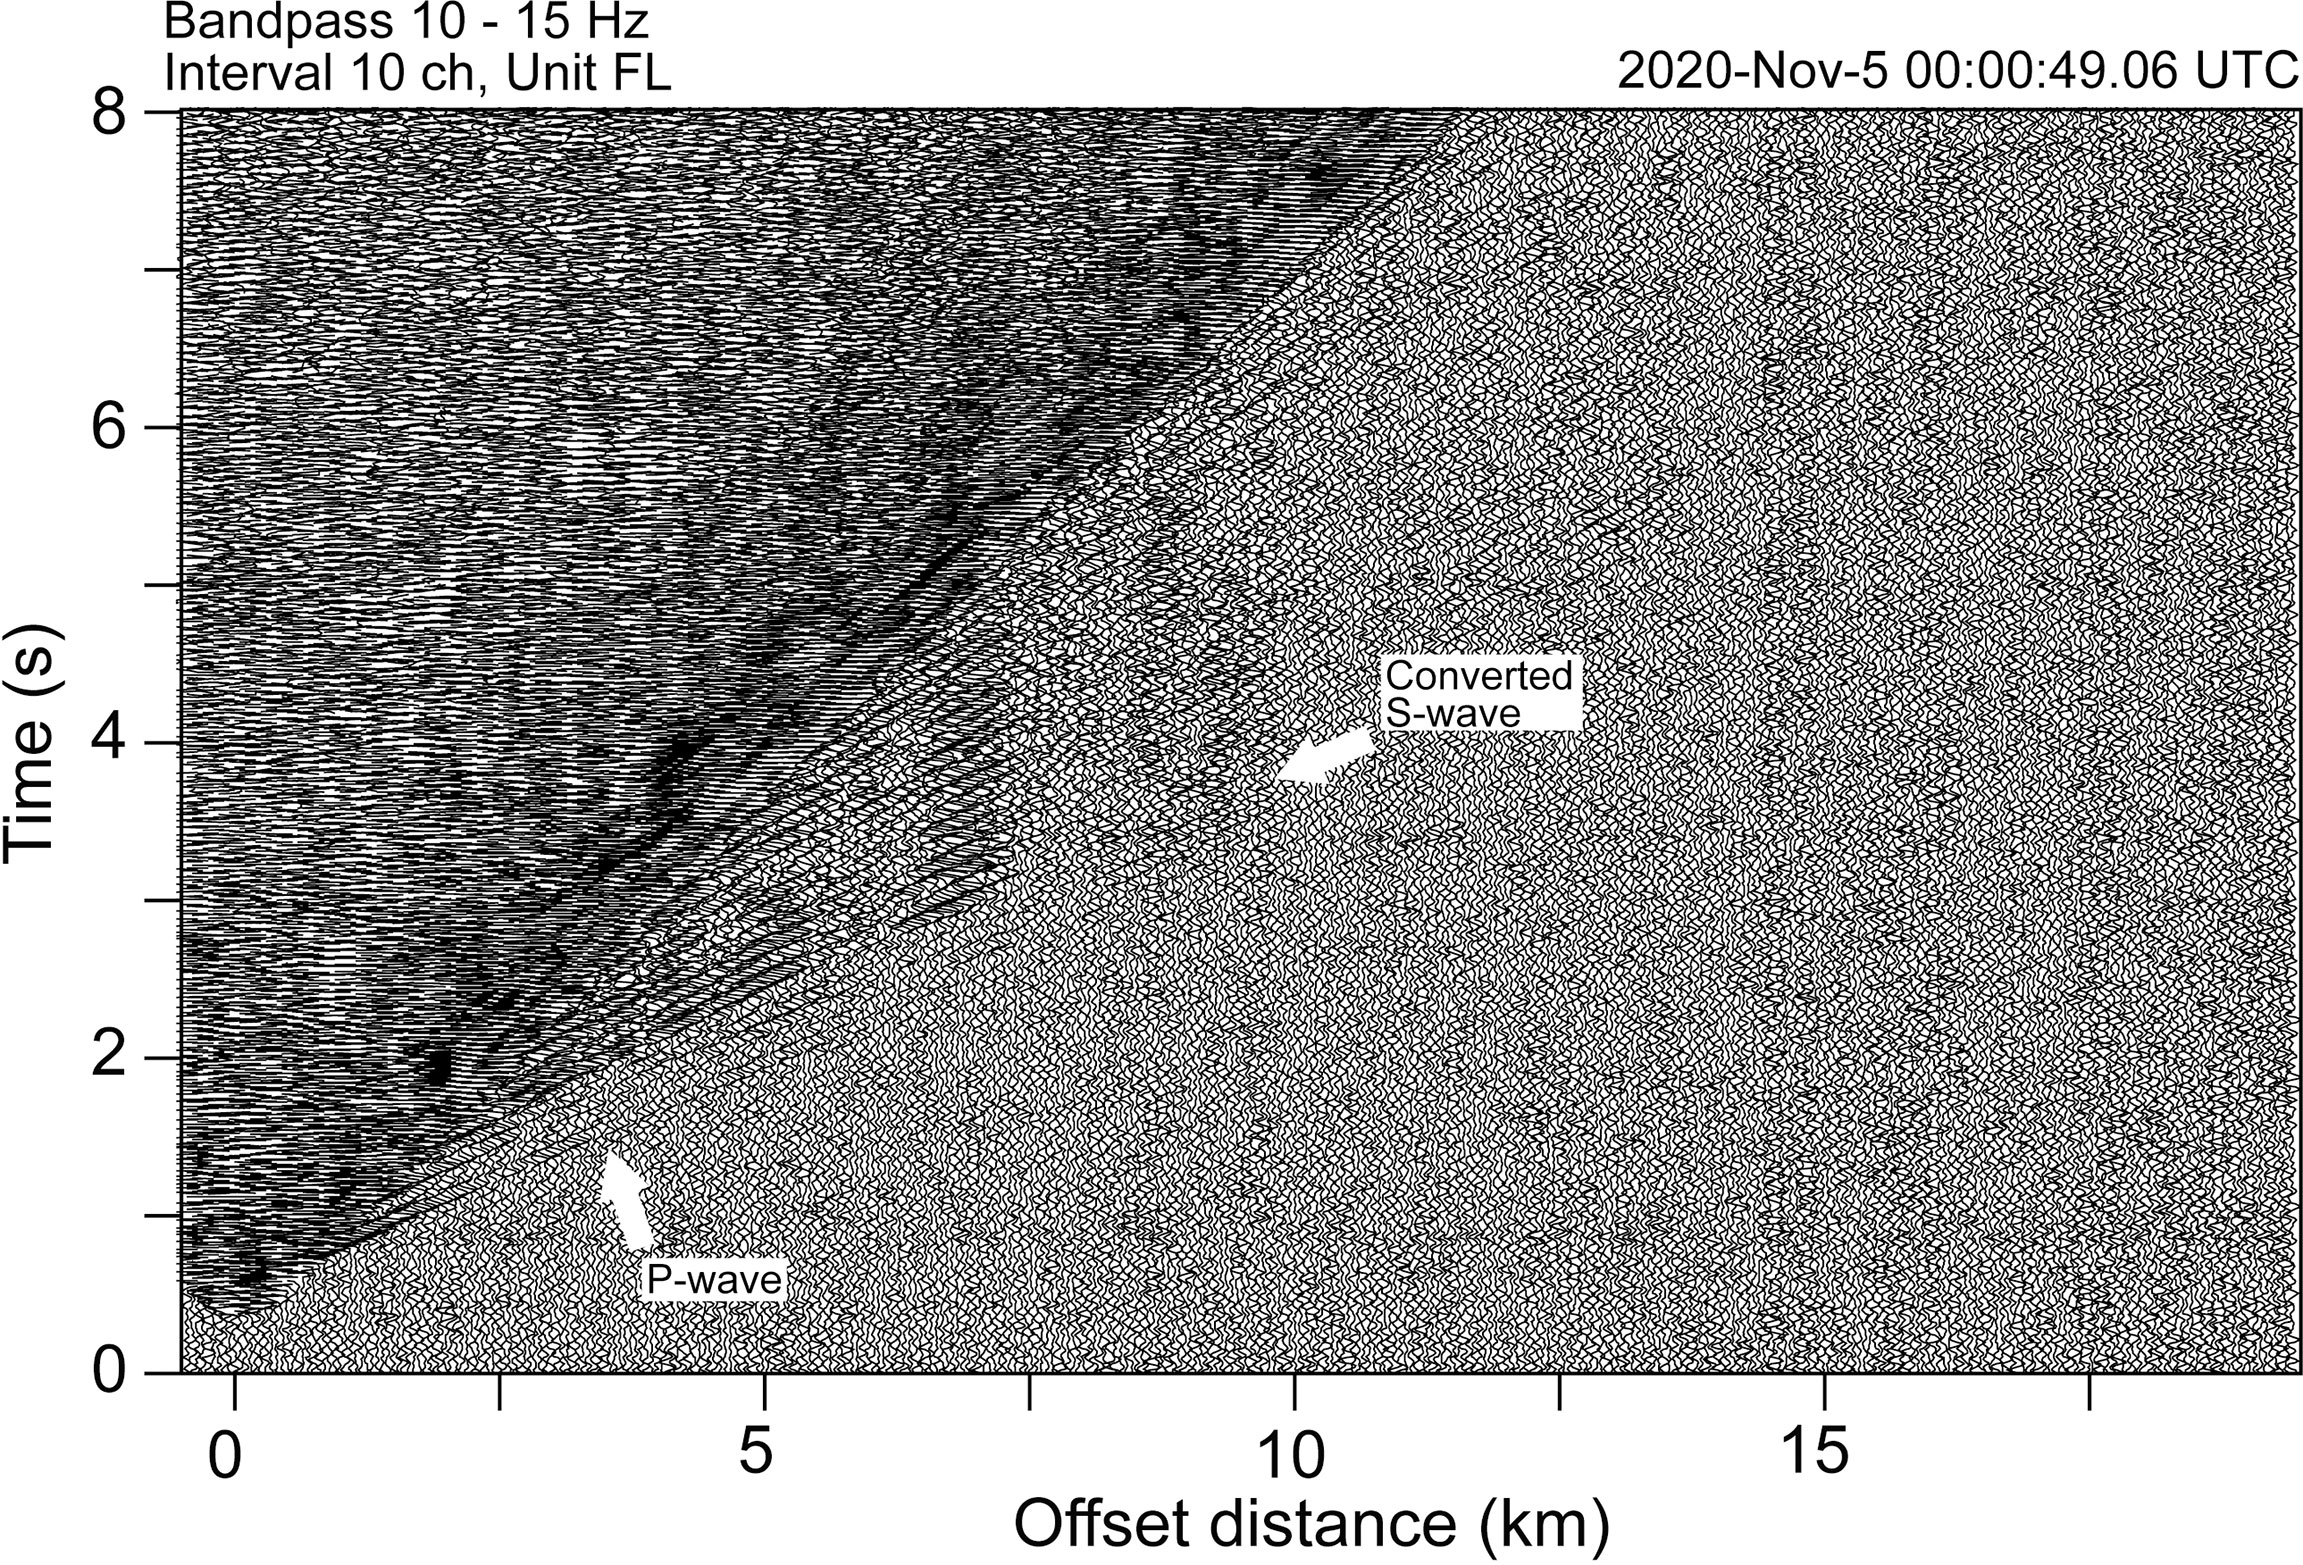
Figure 11 Time–distance profile of the airgun shooting (common shot gather) obtained by a DAS interrogator. To increase the S/N ratio, adjacent 10 traces were averaged, and the bandpass filter was applied. Before the arrivals of the water waves, the arrivals of the refraction waves are clearly seen up to offset distances greater than 10 km. The first arrivals have an apparent velocity of approximately 3.6 km/s. Later arrivals, which were interpreted as converted S-waves, have a larger amplitude than the first arrivals.
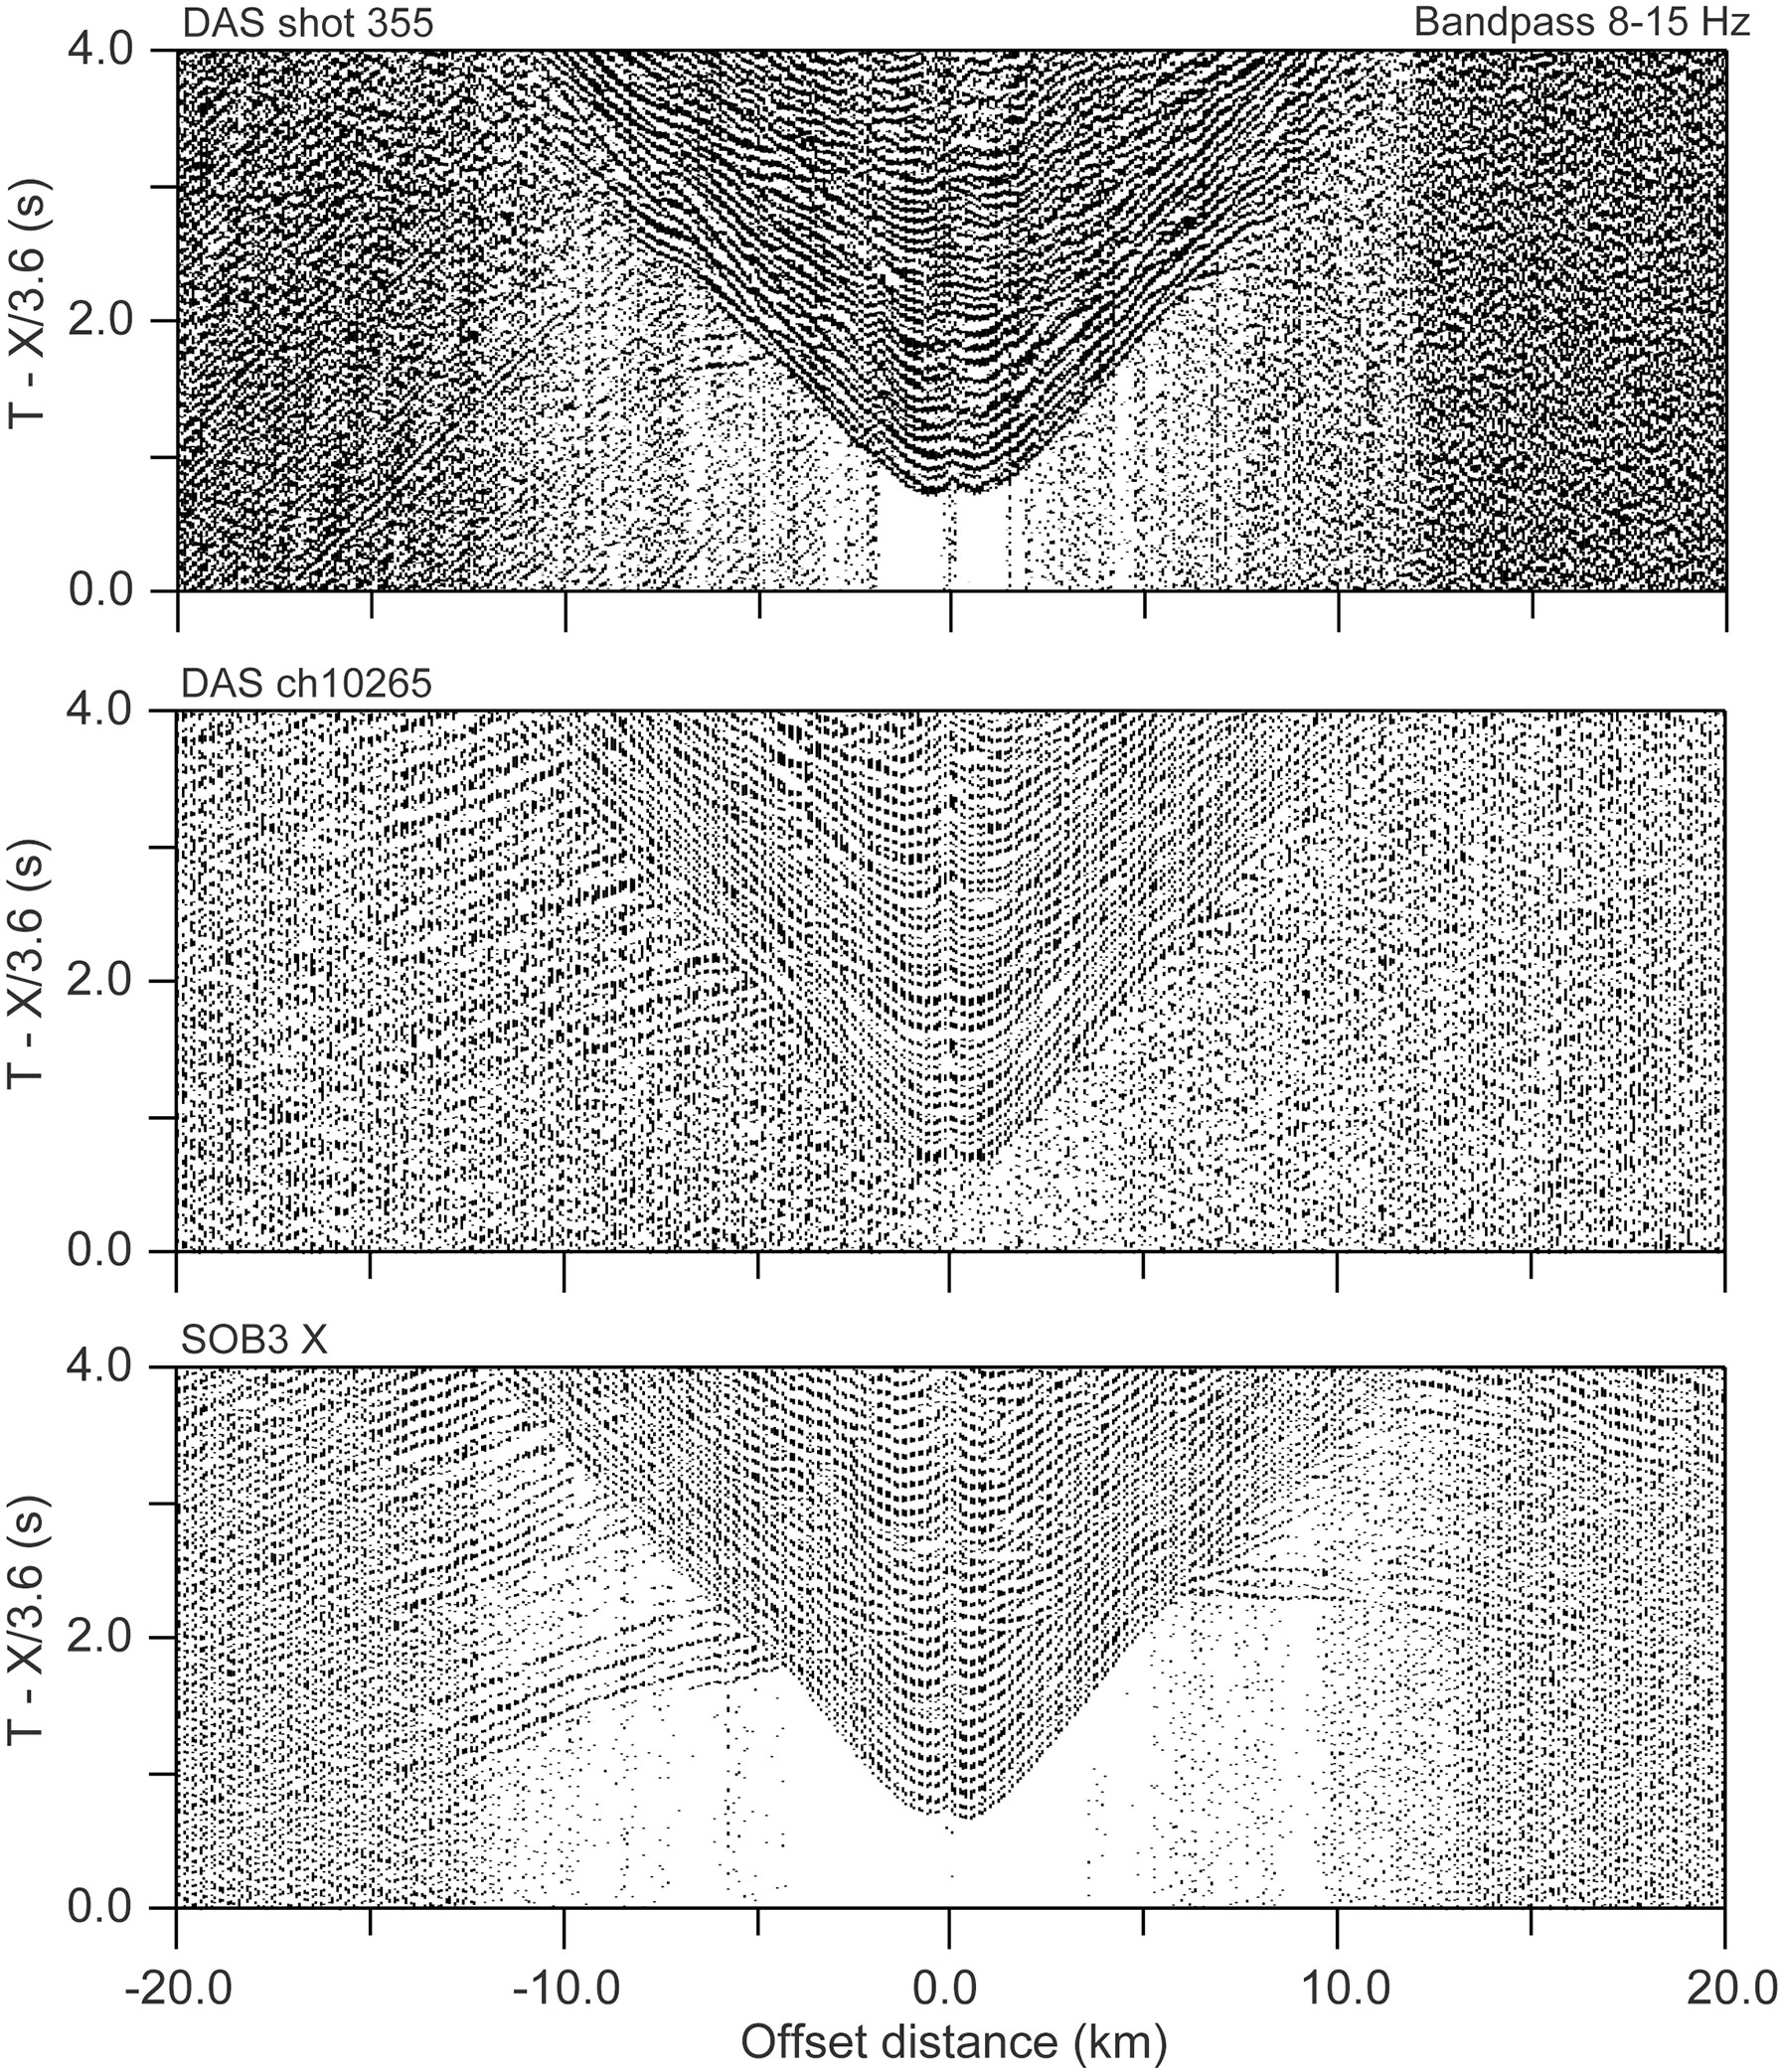
Figure 12 Comparison of time–distance profiles obtained by the accelerometer and DAS. The DAS profiles of both the common shot gather and the common receiver gather are shown. The SOB3 profile is the common receiver gather. The X-component of the records is shown for the accelerometer in the SOB3. The data were bandpass-filtered to increase the S/N ratios. For the DAS profile, the data were displayed every 10 channels, and the adjacent 11 channels were averaged. The positions of the shot number of 355 and a channel of 10265 in the DAS records were estimated to be close to the accelerometer. Although the P-wave arrivals on the DAS records have small amplitudes, both profiles have similar features.
The DAS records and the accelerometer of the SOB3 of the airgun signals were compared to assess the performance of the DAS measurements because the DAS records could be transformed to particle acceleration under the assumption of a plane wave propagation (Daley et al., 2015; SEAFOD, 2018; Wang et al., 2018). In this case, we adopted an apparent velocity of 2.0 km/s, which is sometimes a representative value for S-waves in the sedimentary layer. To increase the S/N ratio, both records were band-passed with a frequency of 1 to 10 Hz. The transformed DAS records of the channel, which were estimated to be positioned closest to the accelerometer in the SOB3, and the records of the X-component, which were in the parallel direction to the seafloor cable, of the accelerometer in the SOB3 were compared (Figure 13). Because the position of the airgun was close to the SOB3 and the DAS records of channel 10265 and records of the accelerometer and DAS were a horizontal component, converted S-wave reflections in the crust were estimated. Both records had similarities, especially in amplitude; however, there were differences. Because the energy of the airgun signal was not large, there is a possibility that the internal noise of the interrogator lessened the similarity. A high dominant frequency of the airgun signal may have affected the similarity as well; however, there is another possibility that the difference between the records originates from that between the observations of strain and acceleration.
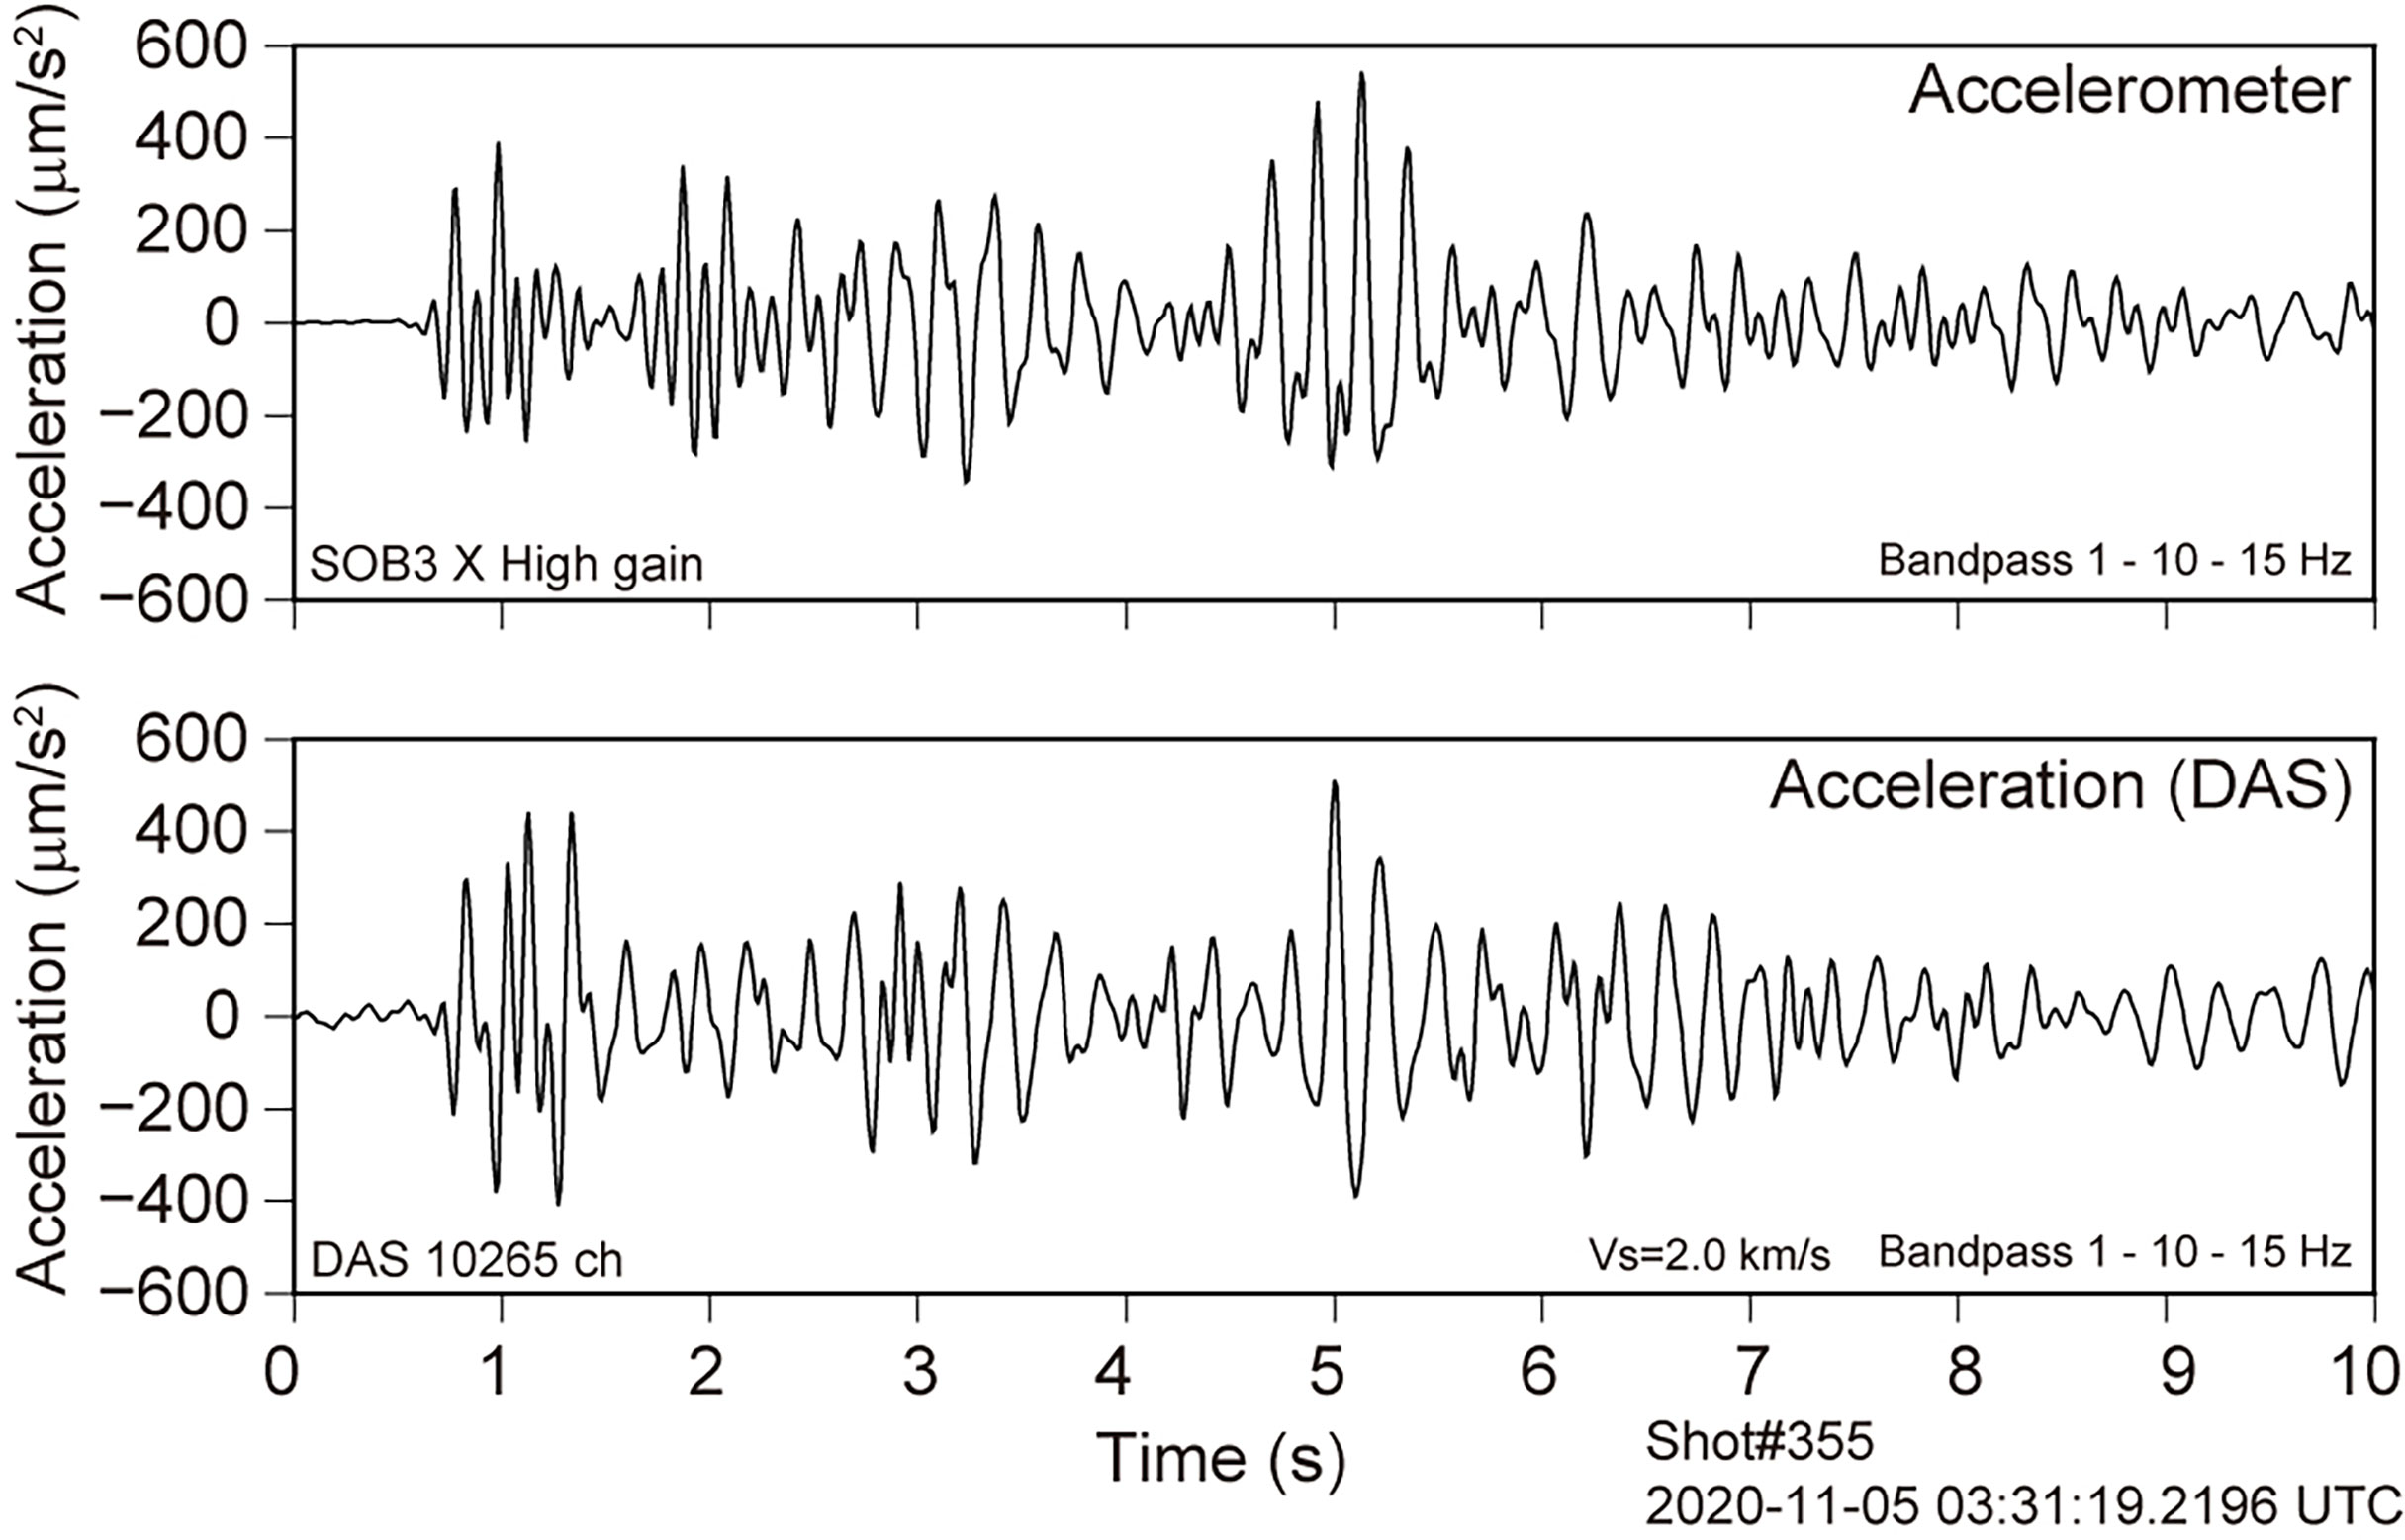
Figure 13 Comparison of the DAS records and SOB3 records for airgun signals (Shot No. 355). The airguns were positioned just above the SOB3. The data from the DAS measurement were converted to acceleration with a wave propagation velocity of 2.0 km/s (lower) to compare the X-component data from the accelerometer (upper). The adjacent 11 channels of the DAS records were averaged. The position of the 10265 channel was estimated to be close to the SOB 3. Both records were filtered from 1 to 10 Hz.
Distributed acoustic sensing (DAS) measurements that utilize an optical fiber itself as a sensor can be applied for various purposes. An observation of earthquakes using an optical fiber deployed on the seafloor with DAS technology is promising because DAS measurements allow for a dense seismic observation as a long linear array. The spatial resolution of the observation reached a few meters. The length of the array was determined by the measurement range of the DAS interrogator deployed on the optical fiber, and a fine spatial sensor interval was configured. Phase-based DAS measurements with interferometry have become increasingly accurate, and the current state of technology allows for obtaining a high signal quality. Therefore, various sophisticated data analyses can be applied to DAS data; however, we should apply proper data processing because DAS measures strain wave fields, and a DAS measurement is different from conventional seismic measurements using devices based on the pendulum principle. In 1996, a seafloor seismic tsunami observation system using an optical fiber cable was deployed off the coast of Sanriku by the Earthquake Research Institute, the University of Tokyo. The system has six spare (dark) optical fibers that are dispersion-shifted single-mode type and have been incorporated for the future extension of the observation system. We have begun the development of a seafloor seismic observation system utilizing phase-based DAS technology on the Sanriku cable observation system as the next generation of a marine seismic observation system.
We performed seven DAS measurements using a dark fiber from the Sanriku seafloor observation system for two years beginning in February 2019. A phase-based interrogator was installed in the cable landing station temporarily, and the length of data collection (array aperture) ranged from 5 to 100 km. Different interrogators for the DAS observation were used. Data were recorded with various values of parameters, such as the gauge length, ping rate, and acquisition offset, for the evaluation of the data quality and S/N ratios. The total recording period became approximately 1 month. As a result, many earthquakes including microearthquakes were recorded in each observation period. All earthquakes with magnitudes greater than 1.8 near the cable system were recorded by the DAS system during the first observation. The arrivals of the P- and S-waves of the earthquake with a magnitude of 3 were clearly observed in the time–distance section using the phase data obtained by the DAS measurement. A teleseismic event with an epicentral distance of approximately 2,300 km and a magnitude of 6.6 was clearly captured by the DAS measurement. It seems that the sensitivity and S/N ratio of different interrogators are comparable. Because conventional seismometers are connected to the Sanriku cable system, we compared the records from the DAS measurement and those from the conventional seismometers. The phase data for the DAS measurement can be transformed to particle-acceleration data under the assumption of a plane wave propagation. The acceleration data converted from the phase data from the DAS measurement were consistent with the records of the accelerometer in the cable system. For the evaluation of the noise levels of the DAS measurement, we estimated spectra using the DAS data with distances of 10 and 35 km from the coast after the conversion of the data from phase to strain using the appropriate parameters for each observation. Then, the probability density functions of the power spectra of the strain were estimated. It was found that the noise levels were stable during the observation, and there was little variation in ambient noise. We obtained similar results from the observations using a different interrogator. A DAS measurement can yield observations with a spatially high density over a long range. We also evaluated the spatial variation of ambient seismic noise along the seafloor cable and obtained the spatial variation of ambient noise, which may be related to the generation of microseisms. We compared the spectra estimated from the acceleration data converted from the DAS measurement to that of the accelerometer in the cable system. It was found that the noise levels in acceleration estimated from the records by the phase-based DAS system are comparable to those calculated based on the data from the accelerometer in the cable system.
We carried out a seismic survey using controlled sources and DAS measurements on a seafloor optical fiber cable to determine a structure in November 2020. We shot the controlled seismic sources using a research ship. We used two types of seismic sources: four large airguns with each chamber volume of 1,500 in3 and two GI-guns with a capacity of 355 in3. The profiles were laid along the seafloor cable. The profiles had a length of approximately 200 km for the large airgun shooting. The cruising speed was approximately 4.5 knots, and a hydrophone streamer was towed during the shooting. Shot intervals were 40 s for large airguns. During airgun shooting, phase-based DAS measurements were conducted at the landing station of the Sanriku cable system. Because the cable system has six spare fibers, we made observations with two systems of DAS measurements concurrently. Each system used a dedicated fiber and recorded the data independently. The continuous recording was performed with a spatial resolution of 5 m and temporal sampling frequency of 500 Hz. The gauge length was set to 40 m. The total array length was approximately 100 km. The DAS records for the signals from the large-airgun array were evaluated because the large-airgun array released larger energy. The airgun signals were clearly recorded by both DAS systems, including seismic waves penetrating the crust. We obtained equivalent records from both DAS recording systems. It can be concluded that there is little difference between different interrogators and fibers. We compared the time–distance profiles of a common receiver gather from the accelerometer in the SOB3 with a common shot gather and a common receiver gather by the DAS measurement. Although the P-wave arrivals of the DAS records had smaller amplitudes than those of the accelerometer records, both records had the same characteristics, especially for travel times. There was a slight difference between the acceleration records converted from the DAS records and those from the accelerometers. There is a possibility that the observations of strain for a DAS and acceleration for a seismometer caused the difference.
The raw data supporting the conclusions of this article will be made available by the authors, without undue reservation.
MS played a leading role in this study, including the organization of this study, observation, data processing and analysis, and completion of the manuscript. TY, TA, KM, and SS contributed to planning the observation, performing the observation, and interpreting the analyzed results. All authors read and approved the final manuscript.
This study was mainly supported by the Ministry of Education, Culture, Sports, Science, and Technology of Japan under the Earthquake and Volcano Hazards Observation and Research Program (Earthquake and Volcano Hazard Reduction Research). A part of this study was also funded by the Earthquake Research Institute, the University of Tokyo.
The authors declare that the research was conducted in the absence of any commercial or financial relationships that could be construed as a potential conflict of interest.
All claims expressed in this article are solely those of the authors and do not necessarily represent those of their affiliated organizations, or those of the publisher, the editors and the reviewers. Any product that may be evaluated in this article, or claim that may be made by its manufacturer, is not guaranteed or endorsed by the publisher.
The authors would like to thank Drs. M. Masuda, and S. Tanaka and Messrs. T. Hashimoto, K. Miyakawa, and T. Yagi of the Earthquake Research Institute, the University of Tokyo for the technical support of the DAS observation. We thank the captain and crew aboard the KH20-11 cruise of the Hakuho-maru, JAMSTEC for their cooperation. Drs. R. Azuma, Y. Ito, R. Nakata, and Y. Yamashita and Messrs. R. Plata-Martinez, P. Mukherjee, Y. Sawaki, H. Takano, and K. Tateiwa contributed to the implementation of the seismic survey in November 2020. For the operations of the DAS interrogator during the observations, the support of the scientists, engineers, technicians and agents from AP Sensing GmbH, Fujitsu Ltd., Harada Corp., OptaSense Ltd., and YK Giken Co. Ltd. was excellent. Comments from Drs. P. Favali and L. Matias and the reviewers were useful in improving the manuscript. This study was partly supported by the Earthquake and Volcano Hazards Observation and Research Program (Earthquake and Volcano Hazard Reduction Research) by the Ministry of Education, Culture, Sports, Science and Technology of Japan. Most figures were created using GMT (Wessel and Smith, 1998).
Araya A., Takamori A., Morii W., Miyo K., Ohashi M., Hayama K., et al. (2017). Design and Operation of a 1500−M Laser Strainmeter Installed at an Underground Site in Kamioka, Japan. Earth Planets Space 69, 77. doi: 10.1186/s40623-017-0660-0
Barbour A. J., Agnew D. C. (2011). Noise Levels on Plate Boundary Observatory Borehole Strainmeters in Southern California. Bull. Seismol. Soc Am. 101 (5), 2453–2466. doi: 10.1785/0120110062
Cedilnik G., Lees G., Schmidt P., Herstrøm S., Geisler T. (2019). “Ultra-Long Reach Fiber Distributed Acoustic Sensing for Power Cable Monitoring,” in 10th International Conference on Insulated Power Cables. Available at: https://www.apsensing.com/fileadmin/Publication%20Files/Cedilnik_et_al._-_2019-Jicable-Proceedings-E4-4-Ultralong-reach-DAS-.pdf.
Daley T. M., Freifeld B. M., Ajo-Franklin J., Dou S., Pevzner R., Shulakova V., et al. (2013). Field Testing of Fiber-Optic Distributed Acoustic Sensing (DAS) for Subsurface Seismic Monitoring. Lead. Edge 32 (6), 699–706. doi: 10.1190/tle32060699.1
Daley T. M., Miller D. E., Dodds K., Cook P., Freifeld B. M. (2015). Field Testing of Modular Borehole Monitoring With Simultaneous Distributed Acoustic Sensing and Geophone Vertical Seismic Profiles at Citronelle, Alabama. Geophys. Prospect. 64 (5), 1318–1334. doi: 10.1111/1365-2478.12324
Dou S., Lindsey N., Wagner A. M., Daley T. M., Freifeld B., Robertson M., et al. (2017). Distributed Acoustic Sensing for Seismic Monitoring of the Near Surface: A Traffic-Noise Interferometry Case Study. Sci. Rep. 7, 11620. doi: 10.1038/s41598-017-11986-4
Ide S., Araki E., Matsumoto H. (2021). Very Broadband Strain−Rate Measurements Along a Submarine Fiber−Optic Cable Off Cape Muroto, Nankai Subduction Zone, Japan, Earth. Planets Space 73, 63. doi: 10.1186/s40623-021-01385-5
Karrenbach M., Cole S., Ridge A., Boone K., Kahn D., Rich J., et al. (2019). Fiber-Optic Distributed Acoustic Sensing of Microseismicity, Strain and Temperature During Hydraulic Fracturing. Geophysics 84 (1), 1–13. doi: 10.1190/GEO2017-0396.1
Lindsey N. J., Dawe T. C., Ajo-Franklin J. B. (2019). Illuminating Seafloor Faults and Ocean Dynamics With Dark Fiber Distributed Acoustic Sensing. Science 366 (6469), 1103–1107. doi: 10.1126/science.aay5881
Lindsey N. J., Martin E. R., Dreger D. S., Freifeld B., Cole S., James S. R., et al. (2017). Fiber-Optic Network Observations of Earthquake Wavefields. Geophys. Res. Lett. 44 (11), 792–11,799. doi: 10.1002/2017GL075722
Lior I., Sladen A., Rivet D., Ampuero J.-P., Hello Y., Becerril C., et al. (2021). On the Detection Capabilities of Underwater Distributed Acoustic Sensing. J. Geophys. Res.: Solid Earth 126, e2020JB020925. doi: 10.1029/2020JB020925
Mateeva A., Lopez J., Potters H., Mestayer J., Cox B., Kiyashchenko D., et al. (2014). Distributed Acoustic Sensing for Reservoir Monitoring With Vertical Seismic Profiling. Geophys. Prospect. 62, 679–692. doi: 10.1111/1365-2478.12116
Matsumoto H., Araki E., Kimura T., Fujie G., Shiraishi K., Tonegawa T., et al. (2021). Detection of Hydroacoustic Signals on a Fiber−Optic Submarine Cable. Sci. Rep. 11, 2797. doi: 10.1038/s41598-021-82093-8
McNamara D. E., Boaz R. I. (2006). Seismic Noise Analysis System Using Power Spectral Density Probability Density Functions—A Stand-Alone Software Package, U.S. Geol. Surv. Open-File Rept. 2005-1438 (U.S. Department of Interior). Available at: https://pubs.usgs.gov/of/2005/1438/.
McNamara D. E., Buland R. P. (2004). Ambient Noise Levels in the Continental United States. Bull. Seismol. Soc Am. 94 (4), 1517–1527. doi: 10.1785/012003001
Owen A., Duckworth G., Worsley J. (2012). “OptaSense: Fibre Optic Distributed Acoustic Sensing for Border Monitoring,” in 2012 European Intelligence and Security Informatics Conference, Odense, Denmark: IEEE, 362–364. doi: 10.1109/EISIC.2012.59
Peterson J. (1993). Observations and Modeling of Seismic Background Noise U.S. Geol. Surv. Open-File Report 93–322 (US Department of Interior). Available at: 10.3133/ofr93322.
Posey R. Jr., Johnson G. A., Vohra S. T. (2000). Strain Sensing Based on Coherent Rayleigh Scattering in an Optical Fibre. Electron. Lett. 36 (20), 1688–1689. doi: 10.1049/el:20001200
SEAFOM Measurement Specification Working Group. (2018). Measuring Sensor Performance – DAS Parameter Definitions and Tests (SEAFOM-MSP-02). Available at: https://seafom.com/?mdocs-file=1270.
Shinohara M., Yamada T., Akuhara T., Mochizuki K., Sakai S., Hamakawa M., et al. (2019). Distributed Acoustic Sensing Measurement by Using Seafloor Optical Fiber Cable System of Sanriku for Seismic Observation (OCEANS 2019 MTS/IEEE SEATTLE), 1–4. Available at: 10.23919/OCEANS40490.2019.8962757.
Shinohara M., Yamada T., Uehira K., Sakai S., Shiobara H., Kanazawa T. (2021). Development and Operation of an Ocean Bottom Cable Seismic and Tsunami Observation System (OBCST) in the Source Region of the Tohoku-Oki Earthquake. Earth Space Sci. 8, e2020EA001359. doi: 10.1029/2020EA001359
Sladen A., Rivet D., Ampuero J. P., De Barros L., Hello Y., Calbris G., et al. (2019). Distributed Sensing of Earthquakes and Ocean-Solid Earth Interactions on Seafloor Telecom Cables. Nat. Commun. 10, 5777. doi: 10.1038/s41467-019-13793-z
Spica Z. J., Nishida K., Akuhara T., Pétrélis F., Shinohara M., Yamada T. (2020). Marine Sediment Characterized by Ocean-Bottom Fiber-Optic Seismology. Geophys. Res. Lett. 47, e2020GL088360. doi: 10.1029/2020GL088360
Walter F., Gräff D., Lindner F., Paitz P., Köpfli M., Chmiel M., et al. (2020). Distributed Acoustic Sensing of Microseismic Sources and Wave Propagation in Glaciated Terrain. Nat. Commun. 11, 2436. doi: 10.1038/s41467-020-15824-6
Wang H. F., Zeng X., Miller D. E., Fratta D., Feigl K. L., Thurber C. H., et al. (2018). Ground Motion Response to an ML 4.3 Earthquake Using Co-Located Distributed Acoustic Sensing and Seismometer Arrays. Geophys. J. Int. 213, 2020–2036. doi: 10.1093/gji/ggy102
Webb S. C. (1998). Broadband Seismology and Noise Under the Ocean. Rev. Geophys. 36 (1), 105–142. doi: 10.1029/97RG02287
Wessel P., Smith W. H. F. (1998). New, Improved Version of the Generic Mapping Tools Released. Eos Trans. AGU 79, 579. doi: 10.1029/98EO00426
Williams E. F., Fernández-Ruiz M. R., Magalhaes R., Vanthillo R., Zhan Z., González-Herráez M., et al. (2019). Distributed Sensing of Microseisms and Teleseisms With Submarine Dark Fibers. Nat. Commun. 10, 5778. doi: 10.1038/s41467-019-13262-7
Keywords: distributed acoustic sensing (DAS), seafloor cable, seismic ambient noise level, optical fiber sensing, microearthquake observation, controlled seismic source survey
Citation: Shinohara M, Yamada T, Akuhara T, Mochizuki K and Sakai S (2022) Performance of Seismic Observation by Distributed Acoustic Sensing Technology Using a Seafloor Cable Off Sanriku, Japan. Front. Mar. Sci. 9:844506. doi: 10.3389/fmars.2022.844506
Received: 28 December 2021; Accepted: 14 March 2022;
Published: 27 April 2022.
Edited by:
Paolo Favali, ERIC foundation, ItalyReviewed by:
Luis Manuel Matias, University of Lisbon, PortugalCopyright © 2022 Shinohara, Yamada, Akuhara, Mochizuki and Sakai. This is an open-access article distributed under the terms of the Creative Commons Attribution License (CC BY). The use, distribution or reproduction in other forums is permitted, provided the original author(s) and the copyright owner(s) are credited and that the original publication in this journal is cited, in accordance with accepted academic practice. No use, distribution or reproduction is permitted which does not comply with these terms.
*Correspondence: Masanao Shinohara, bXNoaW5vQGVyaS51LXRva3lvLmFjLmpw
Disclaimer: All claims expressed in this article are solely those of the authors and do not necessarily represent those of their affiliated organizations, or those of the publisher, the editors and the reviewers. Any product that may be evaluated in this article or claim that may be made by its manufacturer is not guaranteed or endorsed by the publisher.
Research integrity at Frontiers
Learn more about the work of our research integrity team to safeguard the quality of each article we publish.