- 1Department of Earth and Marine sciences, Jeju National University, Jeju-si, South Korea
- 2Korea Meteorological Administration, Seoul, South Korea
A pronounced increase in the intensification of Typhoon Bavi in 2020 was detected when the typhoon passed over the Changjiang plume in the northern East China Sea. Using a coupled atmosphere-ocean modeling system, this study investigates the role of the plume-induced barrier layer (BL) in the air–sea interaction during the intensification of a typhoon. Simple comparative experiments with and without the river plume revealed a strong relationship between BL formation and typhoon intensification as a result of the significant surface freshening discharged from the Changjiang River. The plume-induced BL maintained a warm sea surface before the typhoon approached, thereby influencing the energy transfer at the air–sea interface. The enthalpy and moisture reaching the atmosphere were increased by approximately 20%, leading to the intensification of Typhoon Bavi and providing further support for the results observed in the best-track record. The model comparison also indicates that the salinity-induced BL led to the reduction of the typhoon-induced SST cooling by restricting the vertical diffusion between the surface and the thermocline, and consequently contributed to maintaining the typhoon intensity. This study suggests that the effect of river-induced surface freshening in a coupled atmosphere-ocean model may help in improving typhoon forecasts and may aid in mitigating against the destructive power of typhoons in the future.
Introduction
Warm sea surface temperatures (SST) produce significant amounts of energy through air-sea heat transfer, and typhoons extract energy from such warm waters via positive feedback, leading to intensification (Emanuel, 1987, 1999; Cione and Uhlhorn, 2003; Dutta et al., 2019). The warm sea surface can also be preserved by sea surface freshening in a shallow mixed layer. Freshwater near the surface leads to a shallow mixed layer, creating a barrier layer (BL) between the warm surface water and the cold thermocline below (Lukas and Lindstrom, 1991; Sprintall and Tomczak, 1992; Foltz and McPhaden, 2009). The formation of a BL can then suppress the exchange of heat between the thermocline and the air–sea interface, thereby affecting air-sea fluxes during the passage of a typhoon (Rudzin et al., 2019). Thus, the role of BLs in air-sea interaction is important for understanding the development of typhoons and potentially forecast their intensity (Balaguru et al., 2020).
Much of the interest in BL studies has been focused on the western tropical Atlantic, which is characterized by high SST and the largest freshwater input of all oceans from the Amazon and Orinoco rivers. As the freshwater from the two rivers flows into the ocean, plumes spread out from the coastline to the western tropical North Atlantic and the Caribbean, modifying the large-scale sea surface salinity distribution and forming BLs that can exceed 30 m in thickness (Müller-Karger et al., 1989; Johns et al., 1990; Pailler et al., 1999; Masson and Delecluse, 2001; Ffield, 2007; Mignot et al., 2007; Hlywiak and Nolan, 2019). Surface freshening can form a BL between the surface and the thermocline, particularly the core plume area, by restricting the amount of heat that is exchanged between the surface and the thermocline (Pailler et al., 1999; Mignot et al., 2012; Newinger and Toumi, 2015). Previous studies using satellite and in situ measurements have suggested that the formation of a BL as a result of the presence of freshwater can suppress and reduce surface cooling over plume regions, thereby intensifying tropical cyclones (Wu et al., 2008; Wang et al., 2011; Reul et al., 2014; Rudzin et al., 2019). Using a regional atmospheric model, Vizy and Cook (2010) also showed that the warm SST anomalies that correspond to the river plume area lead to an increase in sensible and latent heating, resulting in the intensification of typhoons.
The Changjiang River, which is the fourth largest river in the world in terms of discharge (Dai et al., 2009), accounts for more than 80% of the total freshwater that is input into the Yellow Sea (YS) and the East China Sea (ECS) (Beardsley et al., 1985). An area that extends hundreds of kilometers over the northern ECS shelf (Figure 1A) is infiltrated by a large amount of freshwater that originates from the Changjiang River during the Korean summer (Beardsley et al., 1985; Shen et al., 1998; Chang and Isobe, 2003; Wu et al., 2011; Moon et al., 2019). As demonstrated in the Amazon and Orinoco systems, freshwater input from the river can modify the surface oceanic conditions and influence energy transfer at the air-sea interface, potentially influencing typhoon intensity. Nevertheless, the impact of the Changjiang plume on typhoon intensification in the ECS has received little attention. Most studies have focused on the dispersal pathways of the freshwater that is discharged from the Changjiang River (Lie et al., 2003; Moon et al., 2009, 2010), with few reporting on the relationship between plume-induced BL formation and SST warming (Delcroix and Murtugudde, 2002; Moon et al., 2019). Since the amount of water transferred via the Changjiang discharge has consistently increased over the recent decade (Figure 1C), it is reasonable to assume that the surface freshening that is caused by the Changjiang plume may contribute to the surface oceanic conditions and affect the intensification of typhoons that pass through the ECS.
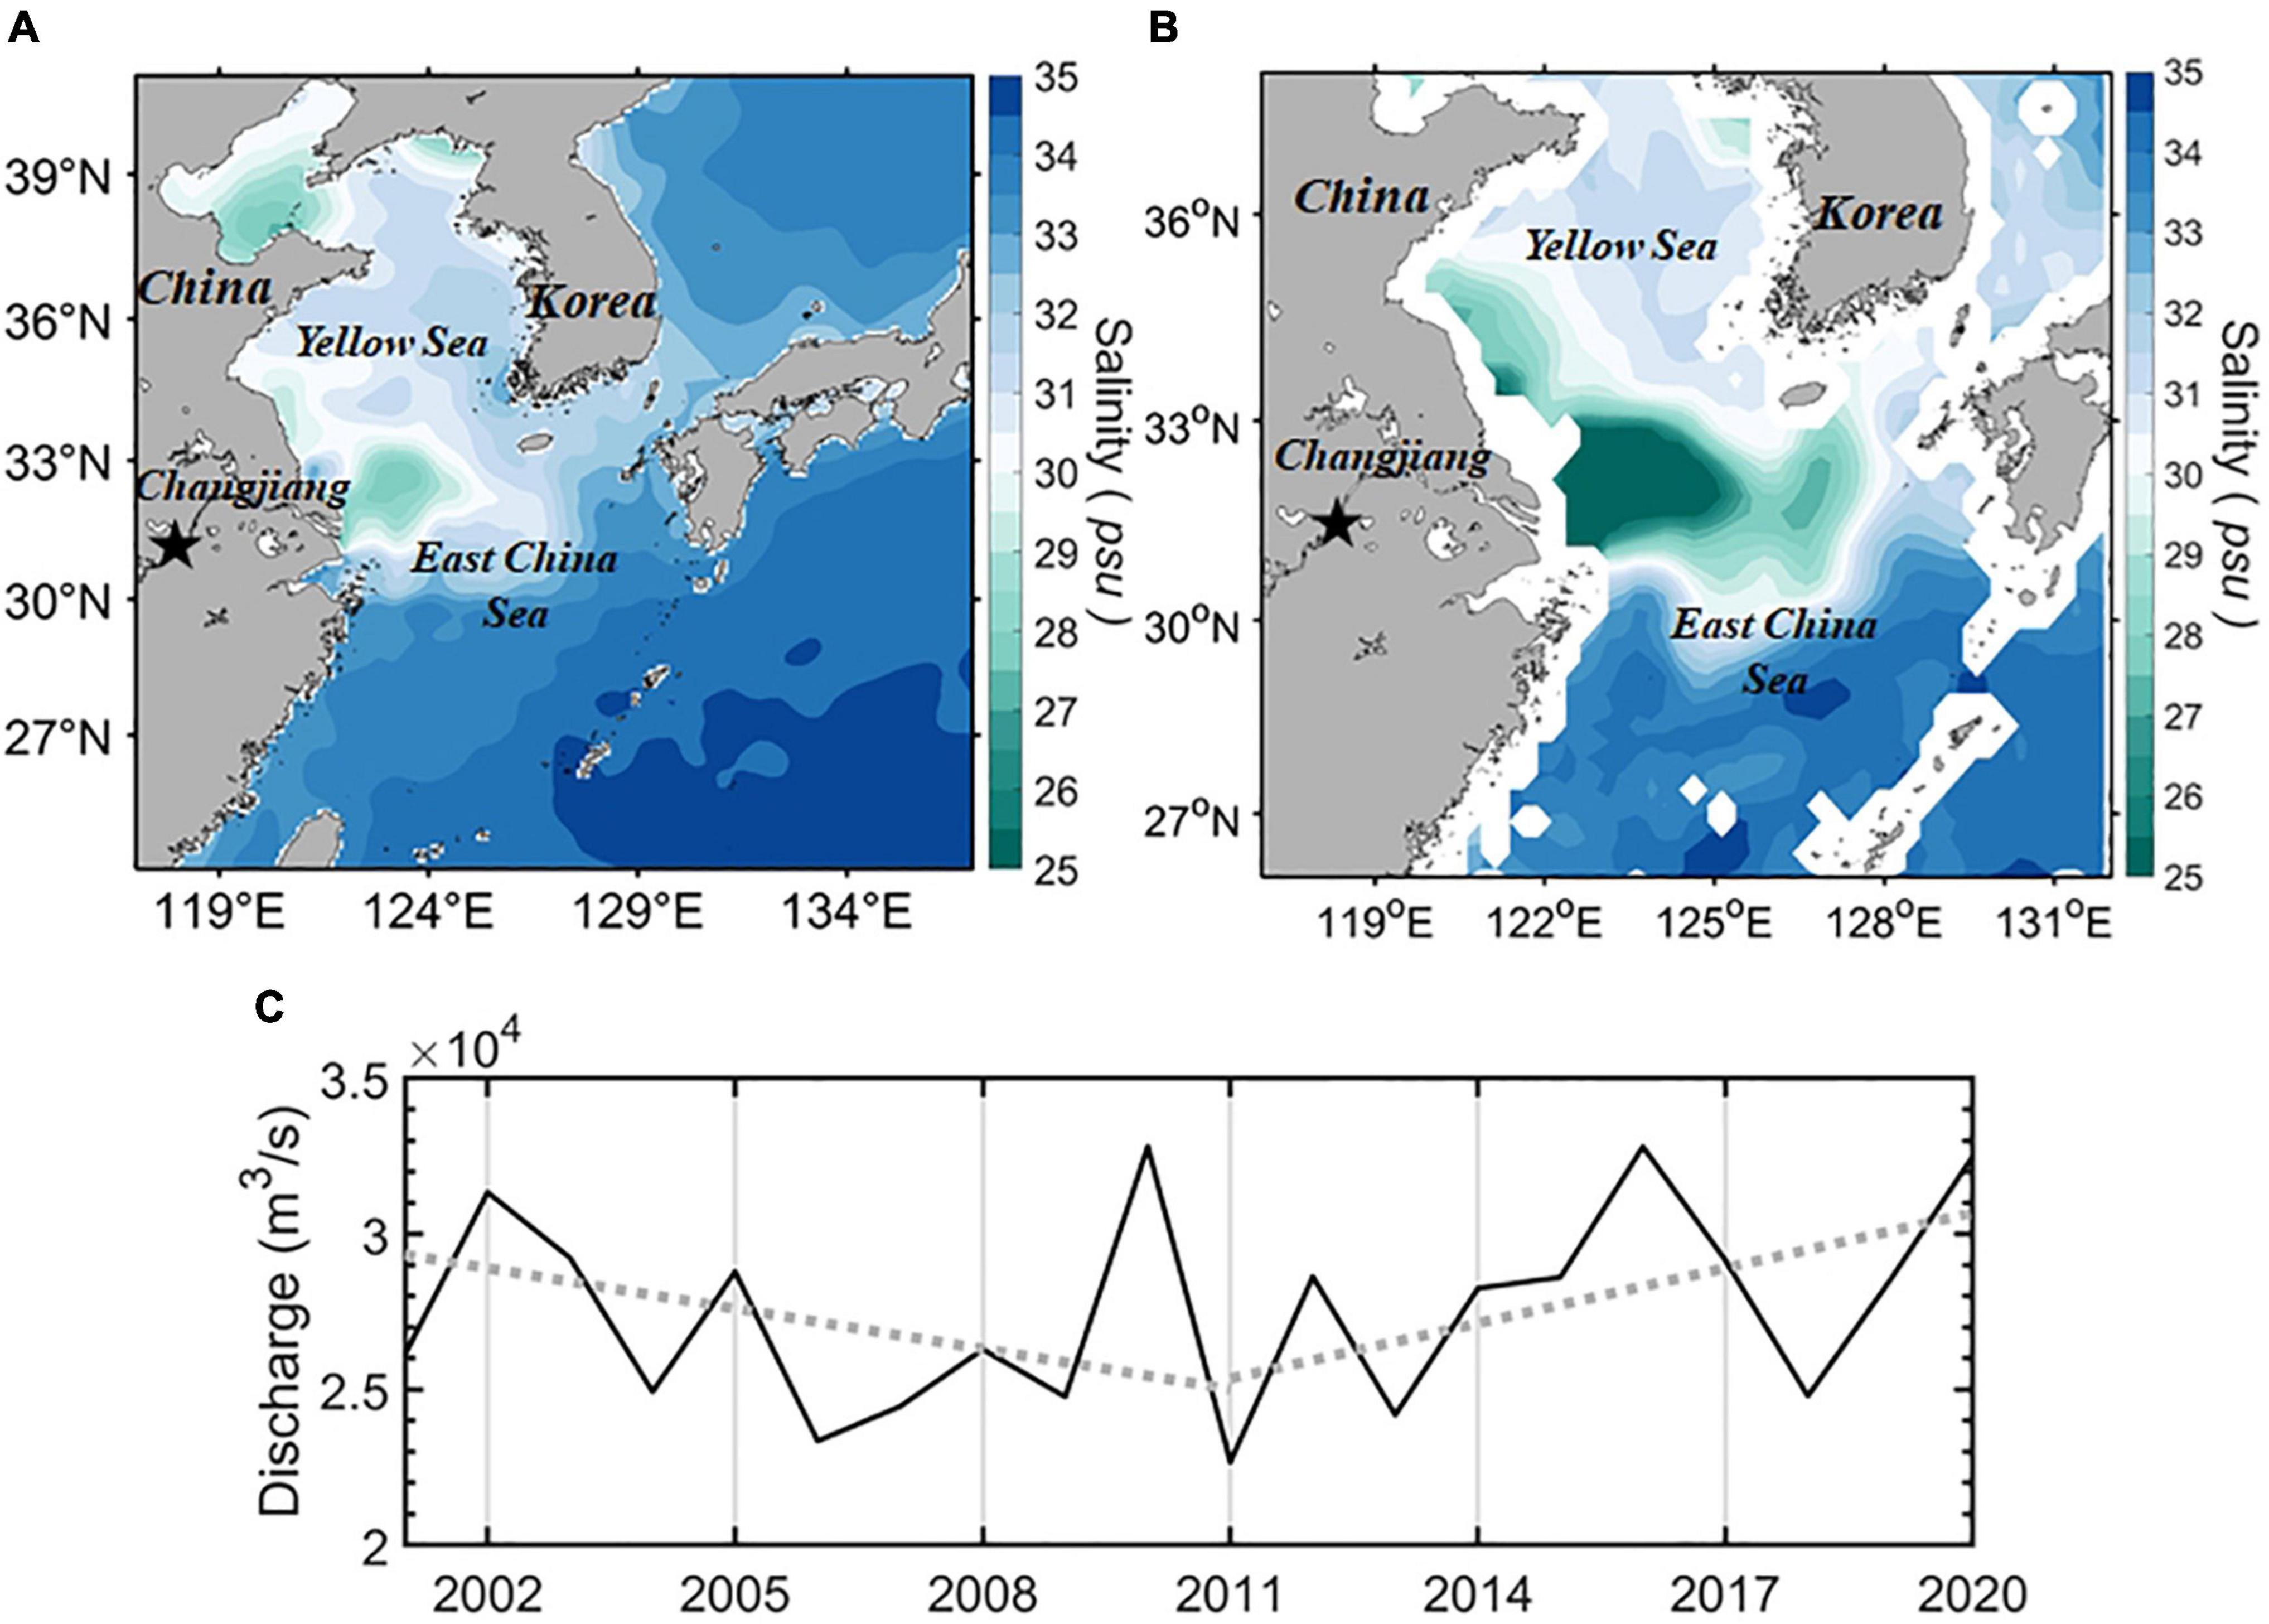
Figure 1. (A) Study area and climatological mean surface salinity from the Yellow Sea Atlas dataset (Lee et al., 1998) in August. The star symbol indicates Datong station. (B) Satellite-based surface salinity averaged from 17 to 25 August 2020 obtained from Remote Sensing Systems (RSS) Soil Moisture Active Passive (SMAP) data. (C) Monthly discharge of the Changjiang River measured at Datong station from 2001 to 2020. The gray dotted lines indicate the linear trends over the two decadal periods 2001–2011 and 2011–2020.
During the summer of 2020, severe flooding occurred in the basin of the Changjiang River, with the discharge reaching a maximum of approximately 8.2 × 10⁴ m3s–1in July. As a result, a substantial volume of freshwater that was discharged from the Changjiang spread offshore to the east of the Chanjiang Bank, forming broad surface freshening areas over the northern ECS shelf (Figure 1B). In this study, an ocean-atmosphere coupled modeling system was used to examine how surface freshening affected the intensification of Typhoon Bavi, which passed through the northern ECS shelf during the period of 22–27 August, 2020. By analyzing the results of comparative experiments with and without the Changjiang plume, this study focused on the role of salinity-induced BL in air–sea interaction during typhoon intensification.
Model and Experimental Design
Model Configurations
The model used in this study is the coupled atmosphere-ocean-wave-sediment transport modeling system (COAWST; Warner et al., 2010). The COAWST permits the simultaneous implementation of an atmospheric model and an ocean model in a 2-way coupled configuration. Data communication between the two models was performed using the Model Coupling Toolkit (MCT, Jacob et al., 2005; Larson et al., 2005) and the Spherical Coordinate Remapping and Interpolation Package (SCRIP; Jones, 1998; Warner et al., 2008) software was used to create interpolation weights between the different model grids.
The weather research and forecasting (WRF) model version 3.7 (Skamarock et al., 2008) was used to delineate the atmospheric component of the coupled model. WRF is a fully compressible, Eulerian non-hydrostatic equation model that uses Arakawa-C grid staggering for horizontal discretization and the time-split 3rd ordered Runge Kutta integration scheme. The parameterizations and schemes used for the current study were: a 3-class microphysics scheme for micro-physical sub-grid processes (Hong et al., 2004; mp physics = 3); the Kain-Fritsch (Kain, 2004; cu physics = 1) scheme for cumulus parameterization; the Noah land-surface model (Chen and Dudhia, 2001; surface physics = 2); the Mellor-Yamada-Janjic Planetary Boundary Layer parameterization scheme (Janjić, 1994; bl pbl physics = 2); and the Rapid Radiative Transfer Model (RRTM) for long-wave radiation parameterization (Mlawer et al., 1997; Dudhia, 1989; ra lw physics = 1), which was utilized to represent short-wave radiation interactions in the atmosphere. The model domain covers the western North Pacific from 21.7 to 48.6°N and 101.4 to 152.8°E (Figure 2) and has a horizontal grid spacing of 10 km with 30 vertical levels for coupled model simulation at regional scale (Jacob et al., 2014; Zambon et al., 2014; Mandal et al., 2016; Ricchi et al., 2017; Prakash et al., 2018; Dutta et al., 2019; Mooney et al., 2019). The initial and boundary atmospheric conditions were obtained from the 6-hourly National Center for Environmental Prediction-the Global Data Assimilation System (NCEP GDAS1 ; ds083.32 National Centers for Environmental Prediction/National Weather Service/NOAA/U.S. Department of Commerce, 2015), which provided reanalysis data with a horizontal resolution of 1/4° (25 km).
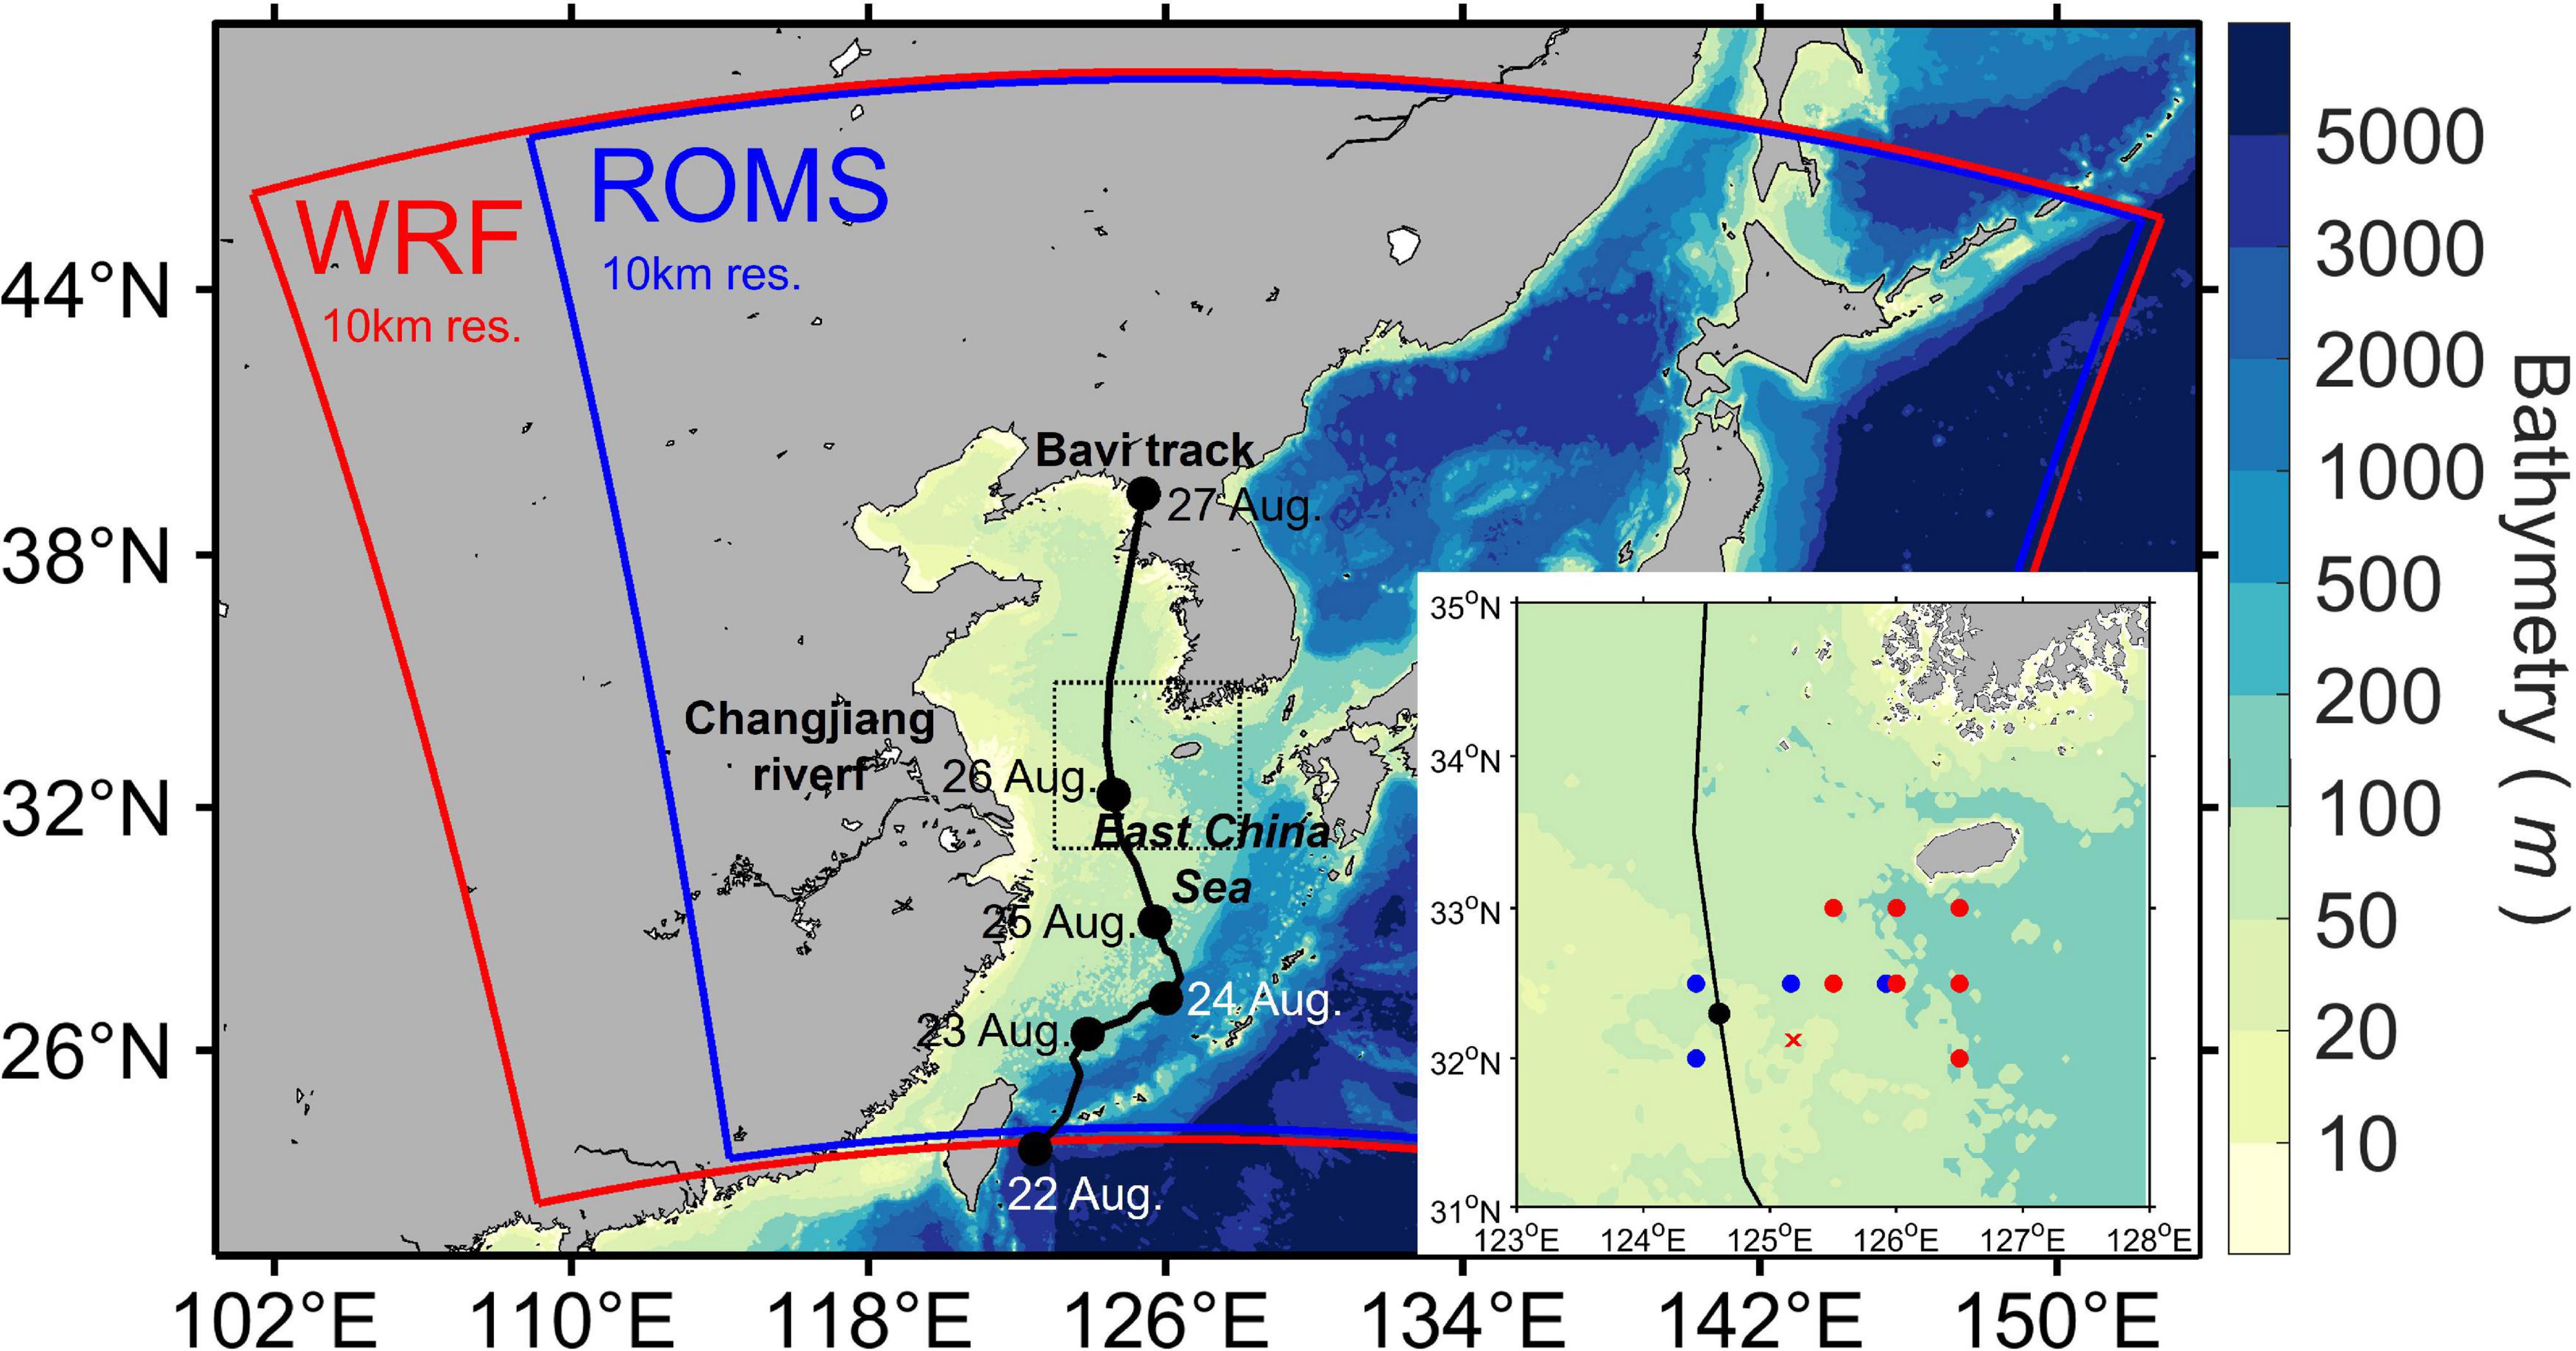
Figure 2. Domains in the atmosphere (red polygon) and ocean models (blue polygon) with bathymetry (in meters colored contour). The black line indicates the track of Typhoon Bavi with the dots on the track representing the center of the typhoon. The insert shows a close-up of the northern East China Sea (ECS) region and includes the locations of the hydrographic observations. Red and blue dots indicate the location of the in-situ CTD observation stations that are operated by the Ocean and Fisheries Research Institute (OFRI) and the Korea Meteorological Administration (KMA), respectively. Location of the Ieodo Ocean Research Station (IORS) is denoted by the red asterisk.
The oceanic component of the coupled model was set up using the regional ocean modeling system (ROMS; Shchepetkin and McWilliams, 2005; Haidvogel et al., 2008). ROMS is a free-surface, terrain following, primitive equation ocean model that solves the finite-difference approximations of the 3D Reynolds averaged Navier–Stokes equations in curvilinear coordinates. In this implementation, a generic length scale (GLS) approach was adopted for the turbulence closure as suggested by Umlauf and Burchard (2003) and Warner et al. (2005), which was modified to consider surface wave breaking (Craig and Banner, 1994). Ten tidal constituents from TPXO 7 (TOPEX/POSEIDON) were imposed along the lateral boundaries (M2, S2, N2, K2, K1, O1, P1, Q1, Mf, and Mm) via T_tide in the MATLAB toolbox developed by Egbert and Erofeeva (2002). The ocean model domain covered the area 22.1–48.5°N and 108.8–152.2°E with a horizontal spacing of 10 km (Figure 2). The ocean model has 40 layers in the vertical stretched terrain-following coordinate, with 21 layers in the upper 30 m in a water column of 150 m thick (Moon et al., 2019; Hong et al., 2020). The initial and lateral boundary conditions for the temperature, salinity, velocity fields, and sea surface elevation for 1 August, 2020 were interpolated from the global Hybrid Coordinate Ocean Model (Bleck, 2002; Chassignet et al., 2007) with 1/12 resolution, and then the model was spun up for 3 weeks before the typhoon Bavi entered the domain. On 22 August, an operational forecast ocean model for the YS and ECS was used to represent a realistic salinity distribution for the Changjiang plume. This operational model was implemented using ROMS with 4D-variational data assimilation, including the daily discharge from the Changjiang River and real-time tides (Lee et al., 2018; Moon et al., 2019).
Experimental Design
Two simple comparative experiments were carried out to examine the effect of the Changjiang plume on the intensity of the typhoon; one using the initial salinity from the HYCOM (Case 1) and the other using the salinity replaced by that from the YECS regional model (Case 2) after spin-up. As shown in Figure 3A, the surface freshening area (less than 30 psu) obtained from the global HYCOM is confined to the Changjiang River mouth, while relatively high-salinity water dominates the northern ECS shelf ranging from 33 to 34 psu, disagreeing with the climatological pattern shown in Figure 1B. This may be due to the fact that the global HYCOM treats freshwater river input as a nudged surface precipitation, which acts as freshwater surface flux (the software design description for HYCOM v2.2).3 In contrast, the initial salinity obtained with the YECS regional model shows that the plume (<26 psu) extends several hundreds of kilometers to the east of Changjiang mouth into the northern ECS region (Figure 3B). This tongue-shaped low-salinity pattern matches the satellite-based plume pattern (Figure 1B) and typical distribution of the Changjiang plume suggested in previous studies (e.g., Lie et al., 2003; Moon et al., 2009, 2010; Hong et al., 2016). Note that the distribution of low-salinity patches from the SMAP extends to the northern ECS area. However, the salinity near the core of the river plume is quite underestimated compared to the in-situ observation presented in Figure 4, which is attributed to be the coarse resolution (40 km) and the algorithm limitations for estimating salinity.
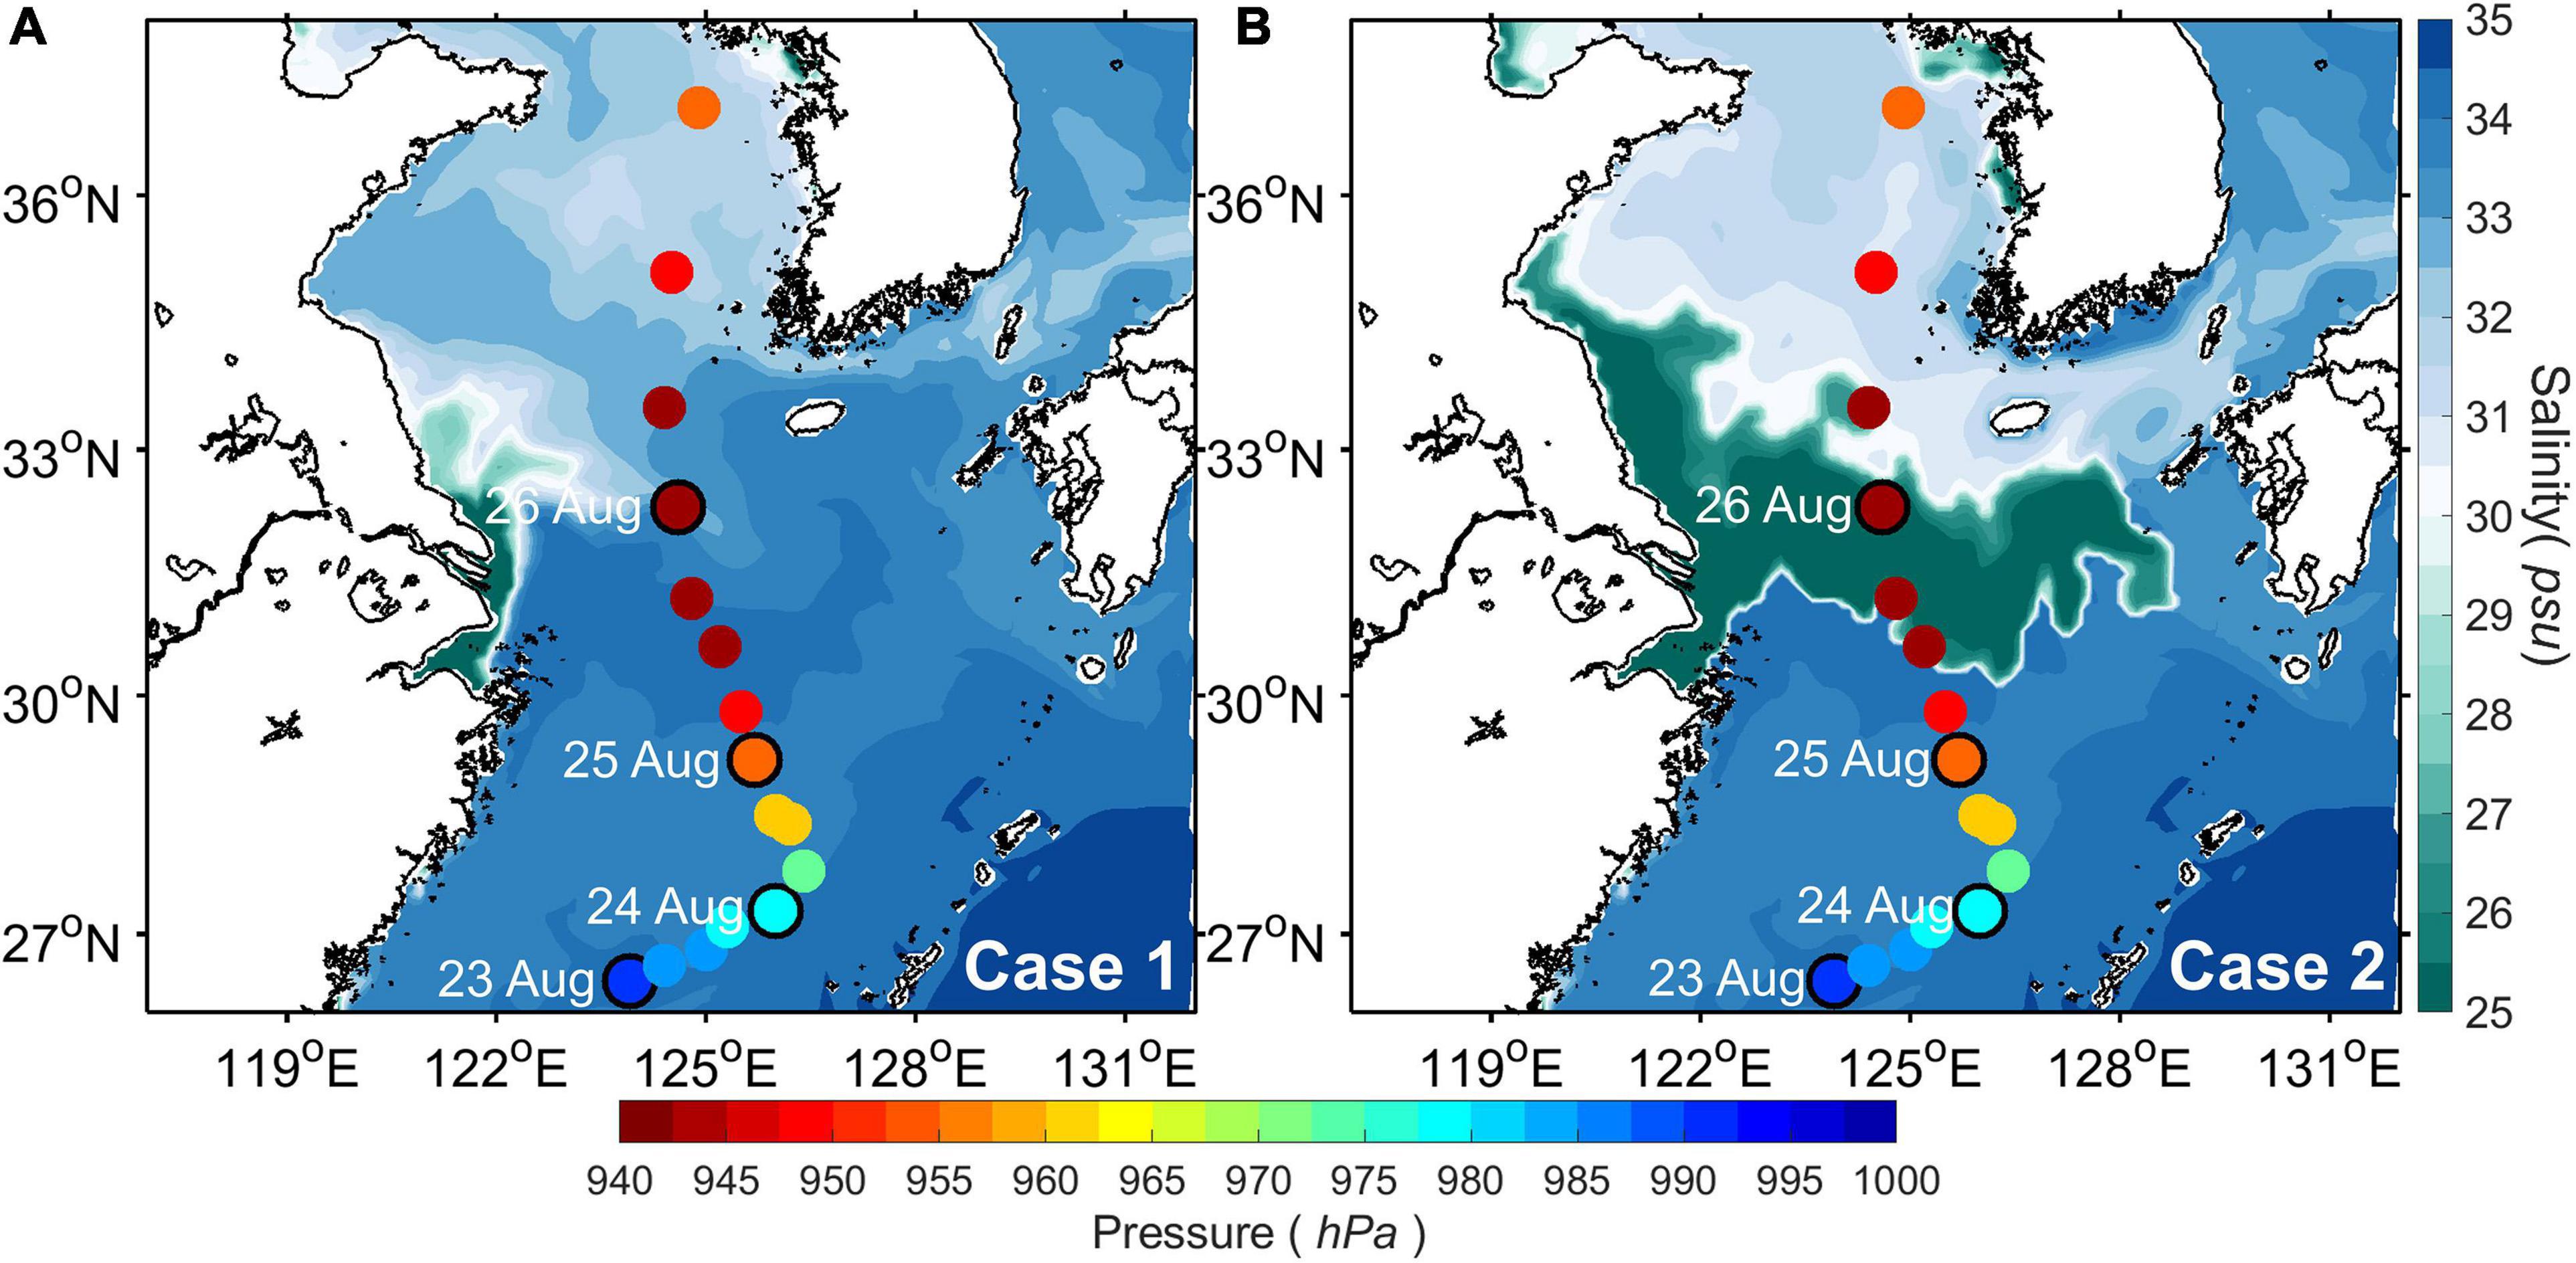
Figure 3. Horizontal distributions of the initial sea surface salinity conditions used in (A) Case 1 and (B) Case 2 at 00 UTC on 22 August 2020. The color of the circle represents the central pressure of Typhoon Bavi reported from the Korea Meteorological Administration (KMA).
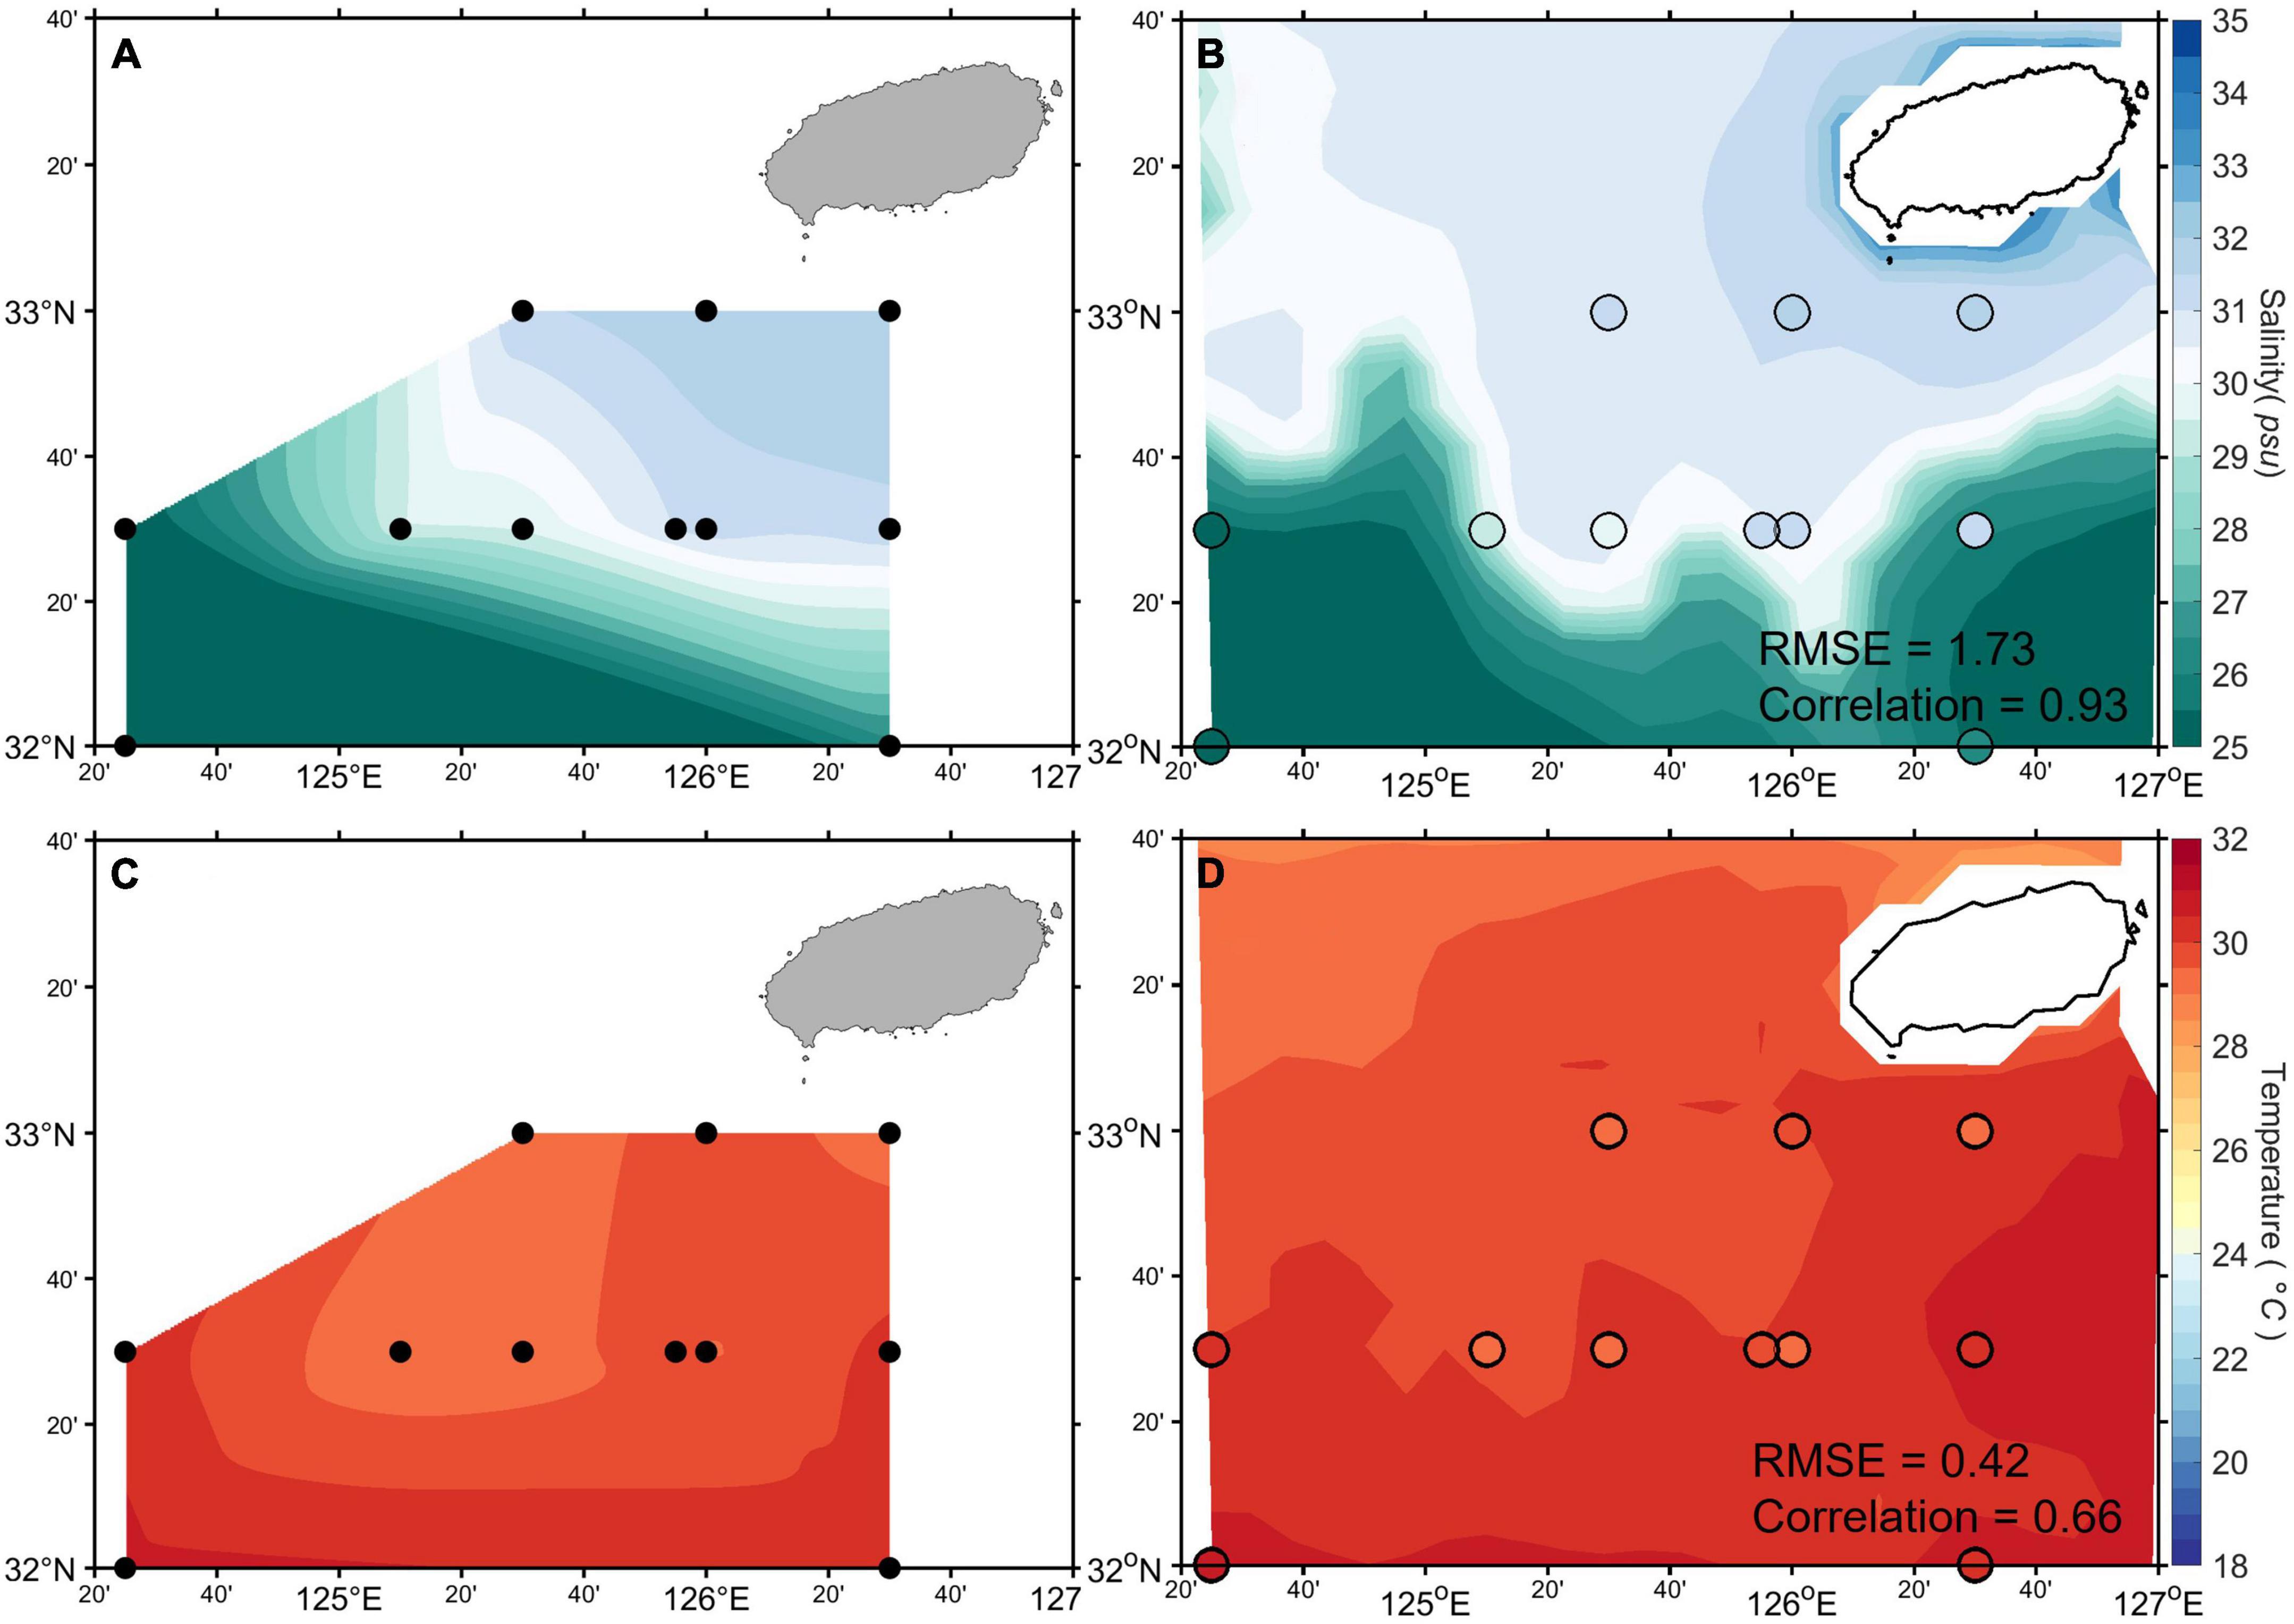
Figure 4. Horizontal distributions of surface salinity (A,B) and temperature (C,D) obtained by in-situ observations (A,C) and simulated in Case 2 (B,D). The circles in the right panels represent the corresponding values obtained from the in-situ observation for the direct comparison. Also, the root mean squared errors and correlation coefficients between the observed and simulated values at 11 stations are given.
As discussed below, the low-salinity water that extends toward the east also agrees well with the in-situ observation in August 2020. In both experiments, we set the temperature of the freshwater source from the Changjiang River to be similar to the temperature around the river estuary based on the HYCOM analysis data to isolate the effect of salinity-induced BL on the typhoon intensity. Therefore, we were able to obtain information on the role of the river plume in air–sea interaction during the passage of Typhoon Bavi based on the comparison between the two coupled experiments. In all simulations, the coupled model was initiated at 00 UTC on 22 August, 2020, before Typhoon Bavi entered the model domain and was run until 28 August, 2020, with lateral boundary conditions based on the 6-hourly NCEP-GDAS reanalysis data and the daily HYCOM reanalysis data for atmospheric and ocean models, respectively.
Validation of Numerical Models
Before analyzing the effects of the Changjiang plume on the air–sea interaction during Typhoon Bavi, we need to confirm that the coupled model yielded reasonable salinity patterns. The surface salinity averaged from 22 to 25 August in the simulation that includes the river plume (Case 2) was compared with the in-situ observations measured by the Ocean and Fisheries Research Institute (OFRI) and the Korea Meteorological Administration (KMA, red and blue dots in Figure 2) for the period 18–21 August, before the typhoon approach (Figure 4). Abnormal low-salinity water (<25 psu) with a temperature of above 30°C was detected in the southwestern region of Jeju Island (Figures 4A,B). The low-salinity water is attributed to the extension of the Changjiang plume into the northern ECS shelf during summer (Moon et al., 2019). The coupled simulation accurately reproduced the warm and fresh surface water that was observed around 125°E and 32°N, indicating that the strong surface warming signal corresponds to the region with significant freshening (Figures 4B,D).
Before the typhoon approached, the warm sea surface was also evident in the satellite-based SST for 25 August, 2020 (Figure 5A). The satellite data were obtained using blended SST products in the remote sensing system (RSS, Gentemann et al., 2009). The RSS satellite data showed a patch structure of warm surface water over the northern ECS, the Korean south coast, and the Ryukyu Islands chain, that exceeded 30°C, which is warmer by more than 2°C than those of the normal years (Moon et al., 2019). The coupled model (Case 2) successfully captured the satellite-derived warm surface pattern over the northern ECS shelf, which corresponds to the region in which surface freshening is significant (see Figure 3B). Compared to the satellite observation, however, the simulation without the Changjiang plume (Case 1) underestimated the SST by around 1°C over the northern ECS region (Figure 5B). This result clearly indicates that the low-salinity water originating from the Changjiang River played a significant role in maintaining a warm surface temperature in front of the typhoon. Because warm surface water is a major factor in typhoon intensification because of the heat energy that is supplied from the sea surface to the lower atmospheric boundary layer, these results indicate that the surface freshening caused by the Changjiang plume may have contributed to the intensification of the typhoon.
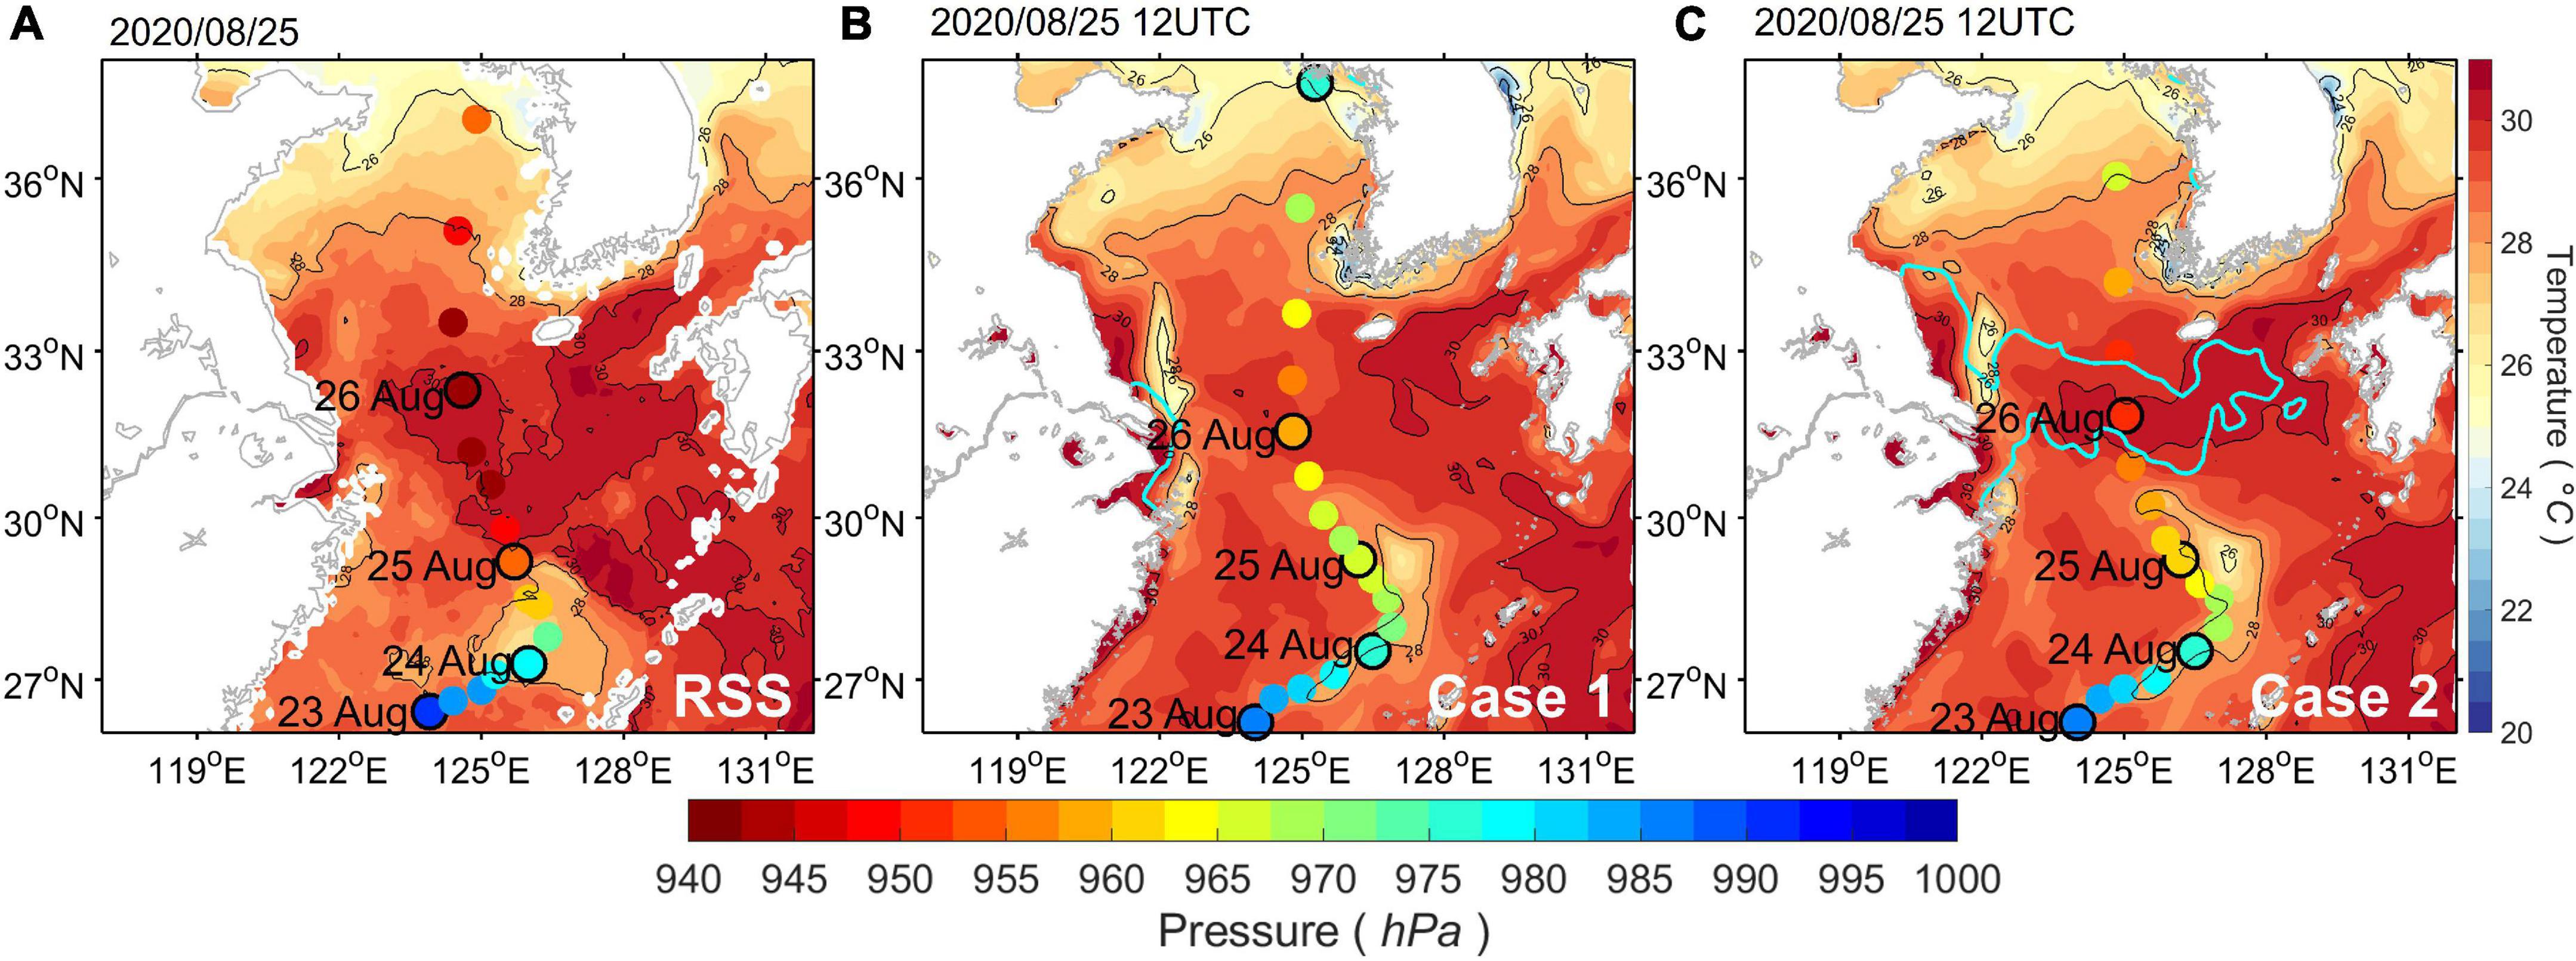
Figure 5. Horizontal distributions of the SST observed by (A) RSS satellite and simulated in (B) Case 1 and (C) Case 2 at 12 UTC on 25 August 2020. The color of the circle represents the central pressure of Typhoon Bavi observed from the (A) best track, and that simulated from the (B) Case 1 and (C) Case 2. The cyan contours indicate the surface 26-psu isohaline.
The colored circles in Figure 5 show the typhoon track and the central pressure for the period 22–27 August. Bavi began as a tropical depression and became a typhoon as it skirted the coast east of Taiwan (Saffir-Simpson Category 1) in the southern ECS near 27.8°N, 126.4°E on 24 August, 2020. It intensified to Category 2 on the southern shelf of the ECS on 25 August and then moved northward, passing over the pre-existing warm surface water until 26 August while it strengthened to Category 3 (with a maximum of 51.44 m/s in 1-min mean wind speed reported by the Joint Typhoon Warning Center). Bavi then continued moving northwards, accompanied by a sharp decrease in intensity and made landfall in North Korea on 27 August. The typhoon tracks simulated in both experiments closely followed the best track, although at a slightly slower speed in the northern ECS (Figures 5B,C). However, significant differences between the two experiments were found in terms of the central mean sea-level pressure and the wind speed. Figure 6 shows the temporal changes in mean sea level pressure, wind speed, temperature, and salinity that were measured at Ieodo station (marked by a red cross in Figure 2) during the passage of the typhoon. During the period 25–26 August, the typhoon produced a maximum wind speed of more than 45 ms–1 (Figure 6D) as it passed over the northern ECS shelf, on which substantial surface freshening area was widely spread (26-psu isohaline in Figure 5C). Due to this typhoon-induced wind, A substantial surface cooling (∼8°C) occurred when Typhoon Bavi passed over the northern ECS (gray shaded area in Figure 6), while the surface salinity increased (∼8 psu) concurrently, indicating typhoon-induced intense vertical mixing and/or upwelling (Figures 6A,C). The abrupt cooling of the surface water was well reproduced in both simulations, albeit with a time delay of approximately 3–6 h. Compared to the observed record, the SST cooling was overestimated by around 1°C when surface freshening was not included. In addition, the simulation that did not include the Changjiang plume underestimated the wind speed by 8 ms–1 and overestimated the sea level pressure by 10 hPa as the typhoon passed over the northern ECS shelf (Figures 6B,D). The discrepancy in the intensity of the typhoon was significantly improved by considering the river plume in the coupled model. In comparison with the result without the plume, the central pressure decreased by 8 hPa and the wind speed increased by 5 ms–1 over the period 25–26 August, showing better agreement with the observation. Moreover, the simulated result with the river plume accurately captured the increase in surface salinity after the typhoon passed.
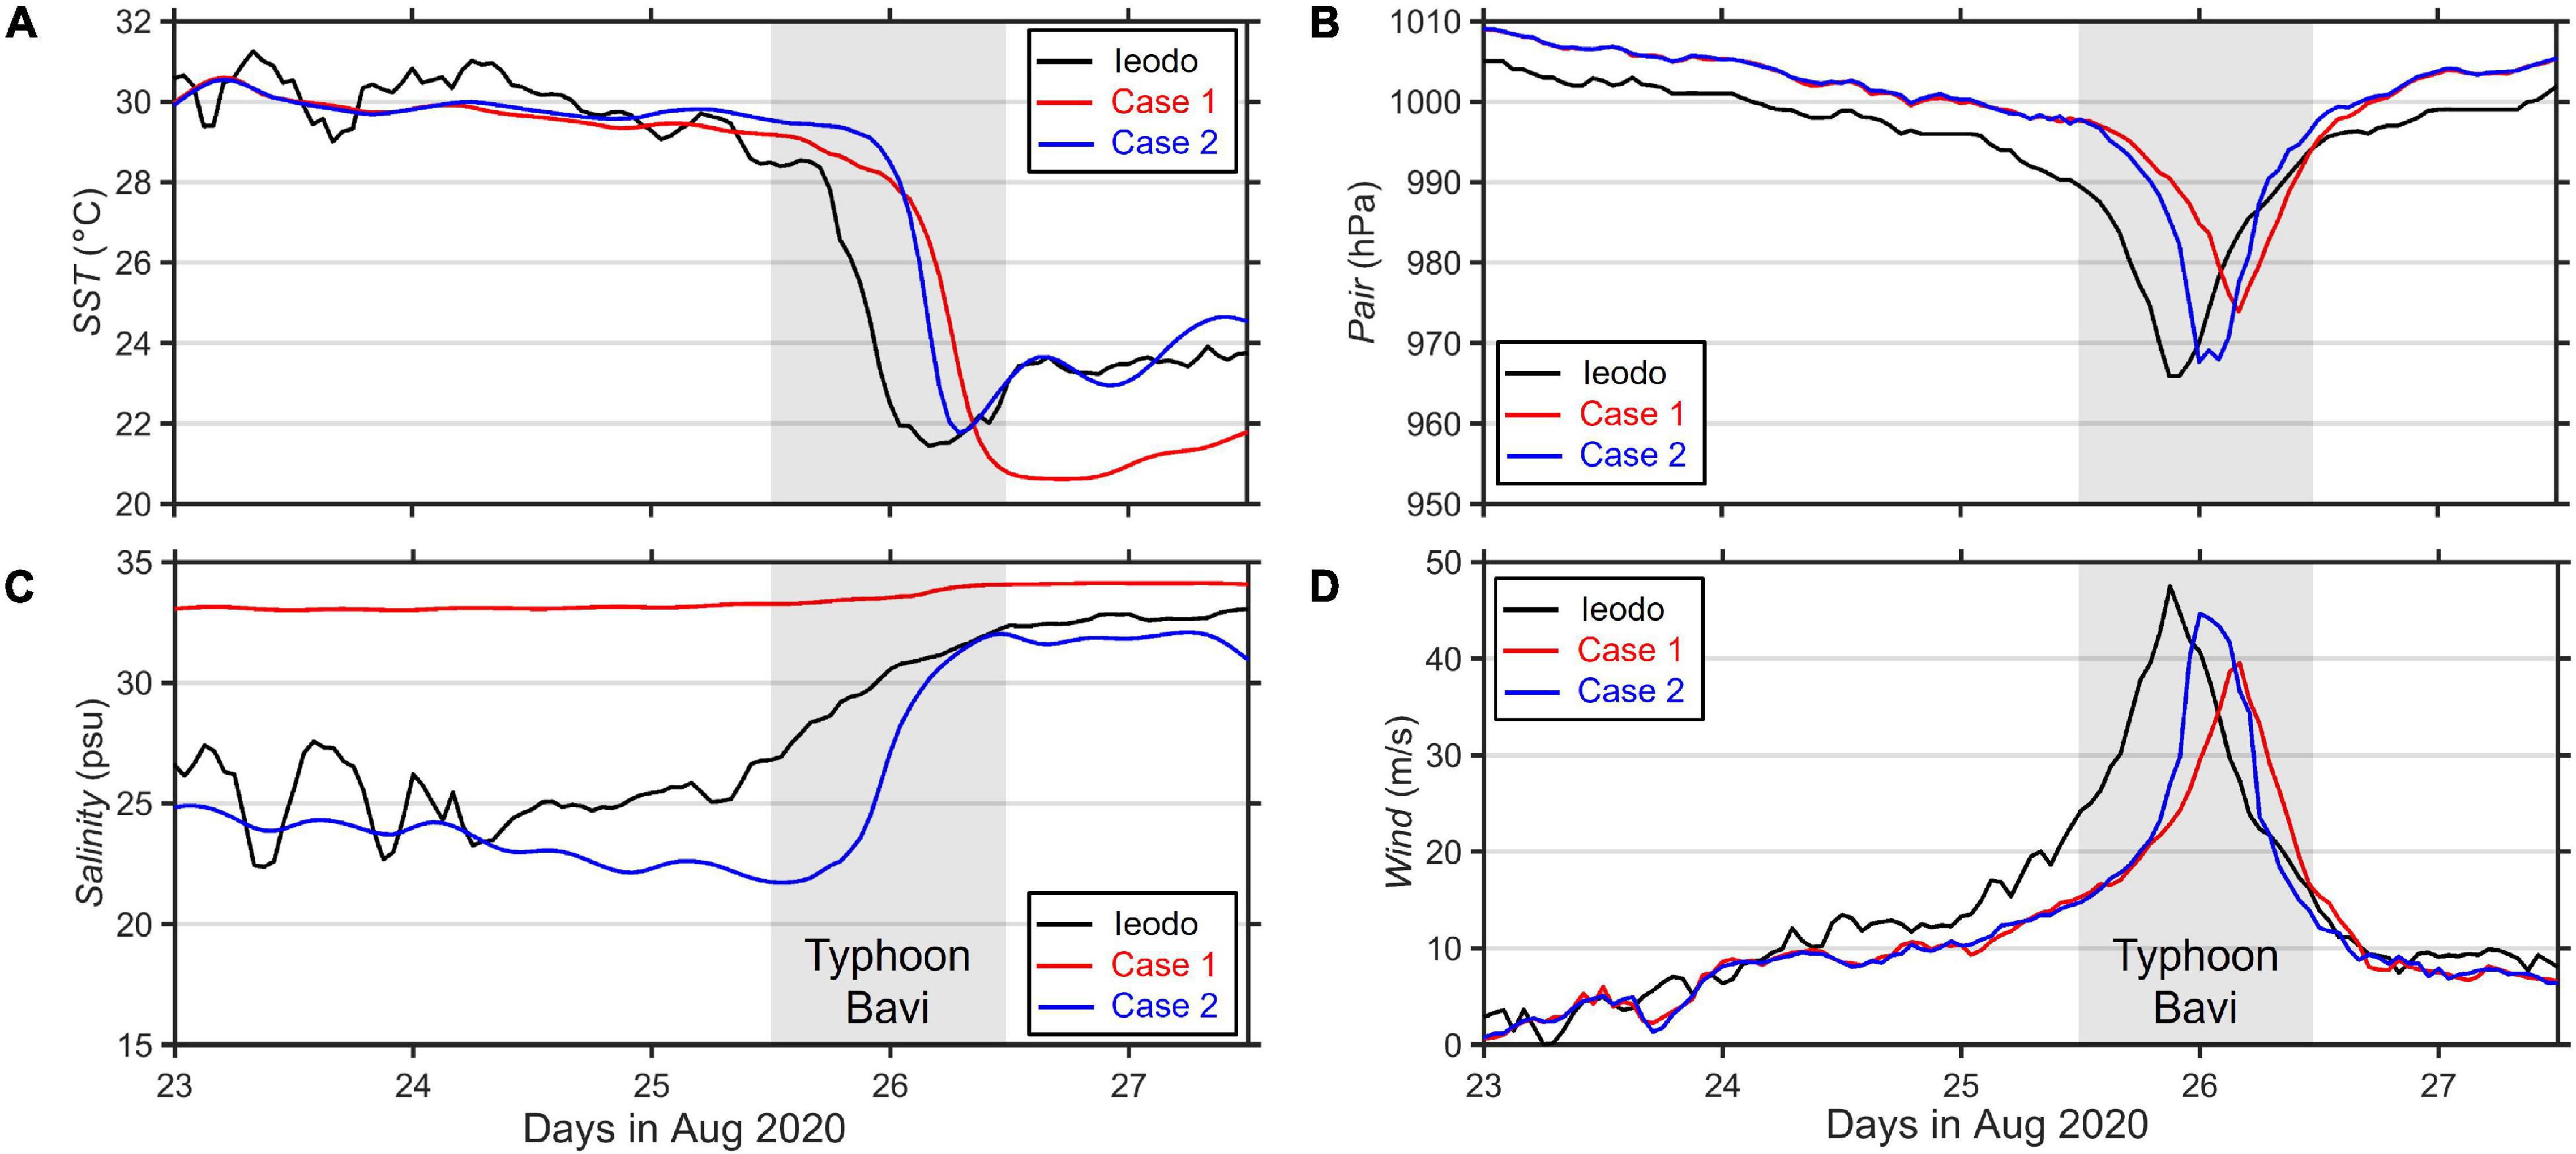
Figure 6. Time series comparison of (A) surface temperature, (B) mean sea level pressure, (C) salinity and (D) 10 m height wind speed simulated in the two experiments and measured observations (black lines) at IORS. The red and blue lines indicate the results of the experiment for Case 1 and Case 2, respectively. The gray shaded area denotes the period corresponding to Typhoon Bavi passing through the IORS.
Responses of Typhoon Intensity to Low-Salinity Water
Salinity Effects on the Typhoon Intensity
The impact of the river plume on the intensity of the typhoon is clearly shown in Figure 7, which shows the swaths of sea-level pressure in the two experiments during Typhoon Bavi. The swath represents the minimum values of sea-level pressure at each grid point throughout the typhoon in 6 h intervals. The temporal change in sea-level pressure showed a similar pattern in both experiments, showing an increase in the intensity of Bavi as it moved toward the northern ECS shelf until 26 August. Bavi then weakened rapidly as it approached the western coast of the Korean Peninsula. A significant difference between the two simulations was clearly observed at around 32°N. When the realistic plume pattern was included, the coupled model simulated lower central pressure when Bavi passed over the northern ECS shelf, where extremely low-salinity water (<26 psu) was observed (Figure 7C). The pressure difference between the two experiments reached a maximum value of approximately 5–10 hPa at around 32°N. An additional experiment (Case 2-1) that initialized by 10% increased salinity in the river plume area was carried out to ascertain whether there have been variations in intensity of typhoon in response to upper ocean salinity (Figure 8). Figure 9 clearly shows the alleviated intensification in Case 2-1 compared to Case 2, revealing that the intensification of the typhoon are direct consequences of the variation of the salinity in the freshwater plume. These results show a link between surface freshening and typhoon intensity, demonstrating the impact of the river plume on storm intensification, as reported in previous studies (Wu et al., 2008; Wang et al., 2011; Reul et al., 2014; Rudzin et al., 2019).
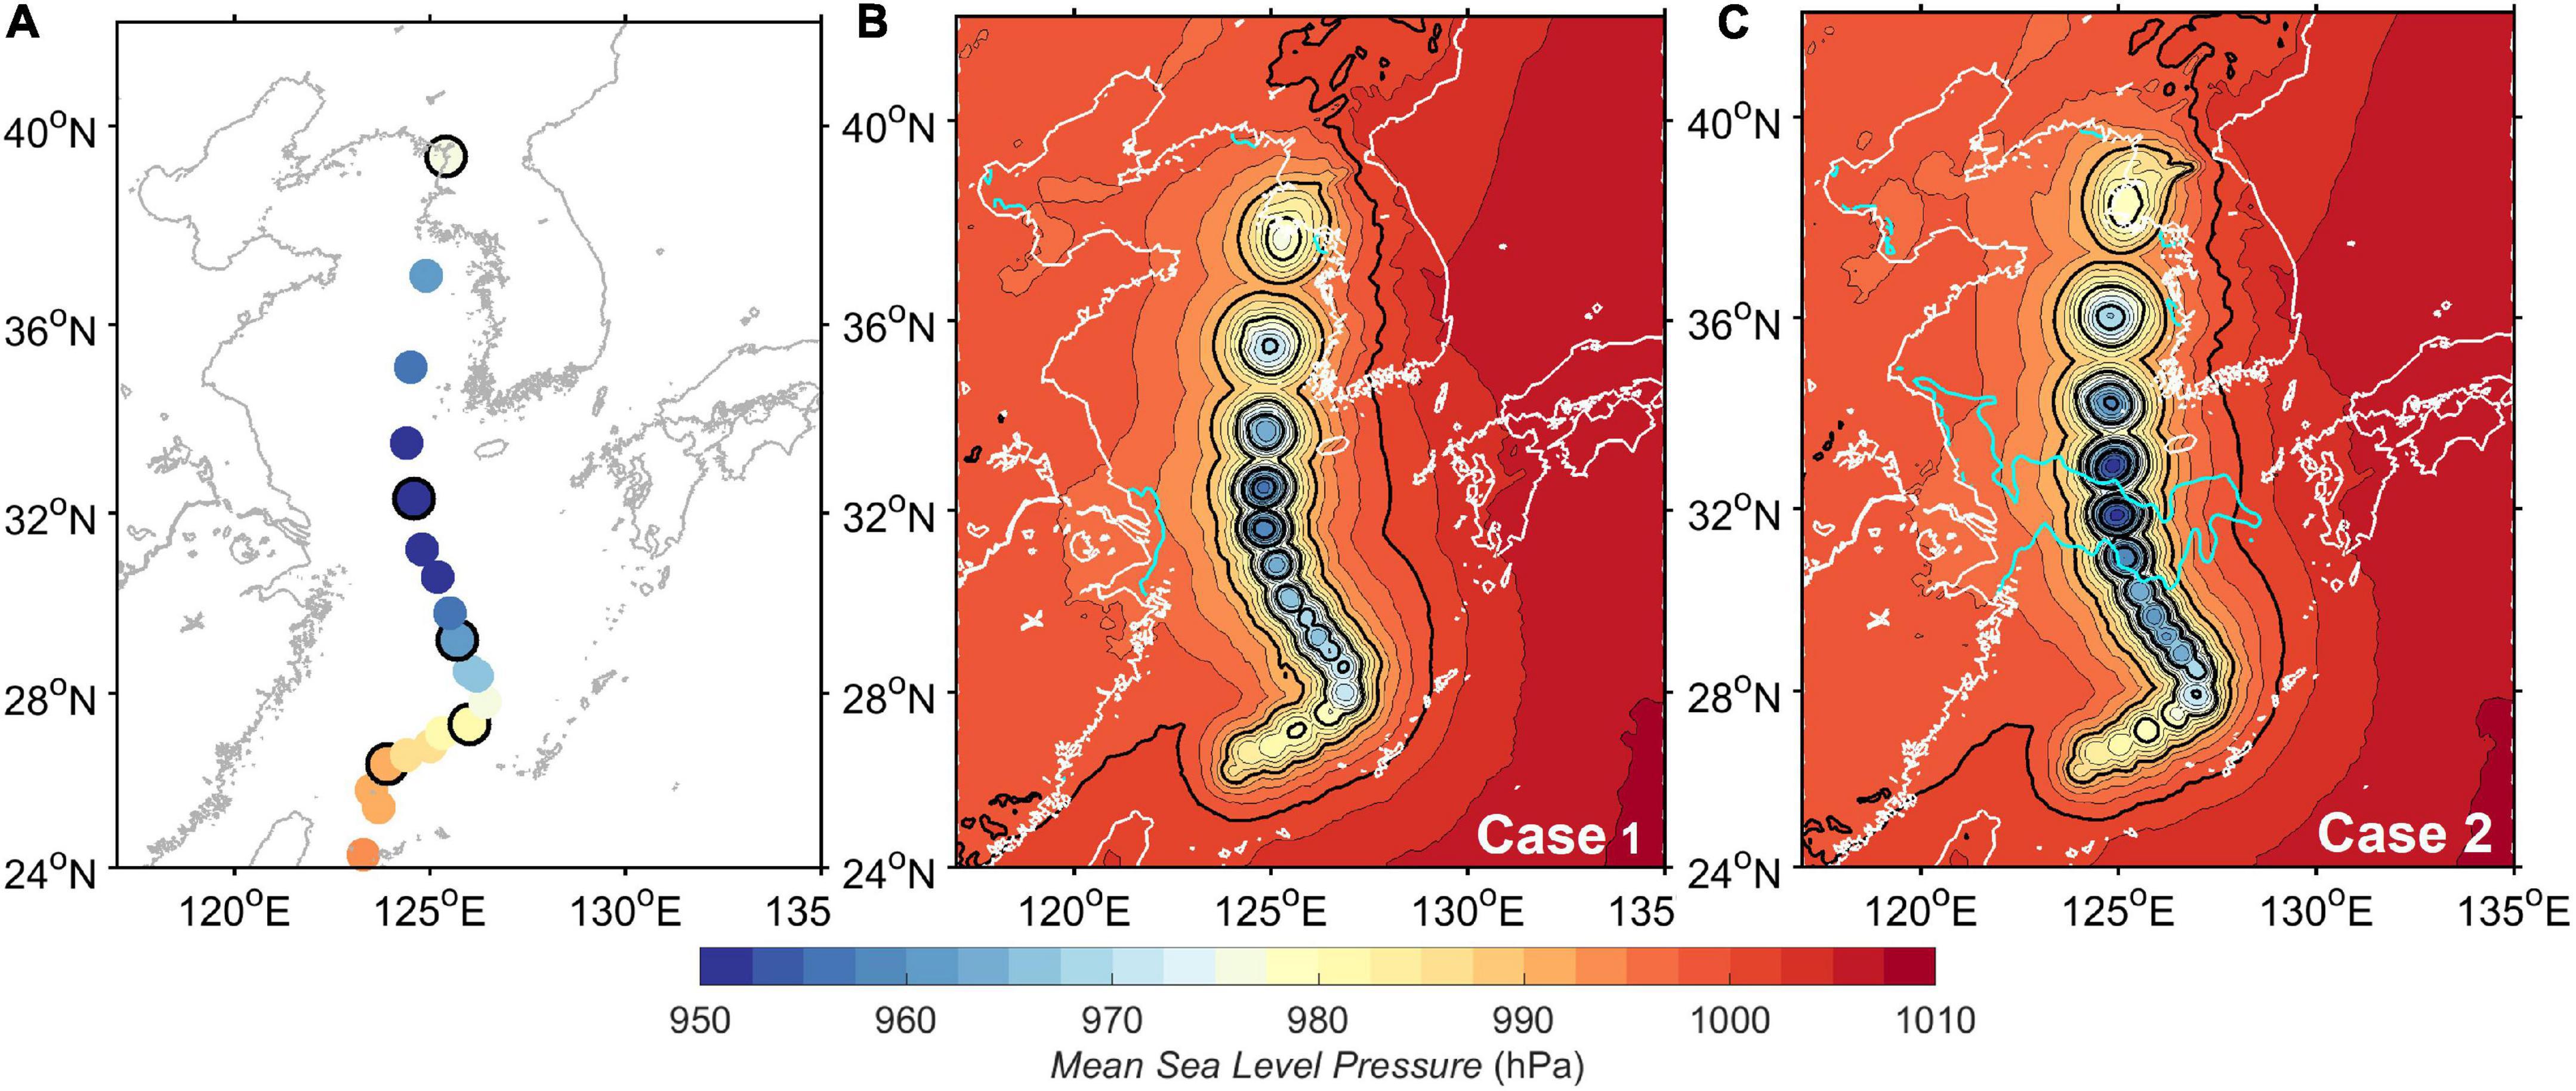
Figure 7. Comparison of (A) best track and central pressure of Typhoon Bavi with the simulated tracks in (B) Case 1 and (C) Case 2. The colored dots in (A) represent the minimum central pressure along the track of the typhoon in 6-h intervals. The color shaded area in (A,C) represent the swaths of mean sea level pressure simulated in (B) Case 1 and (C) Case 2. The black contours indicate the sea-level pressure at 10 hPa intervals and the cyan lines represent the surface 26-psu isohaline.

Figure 8. Horizontal distributions of the initial sea surface salinity conditions used in (A) Case 1, (B) Case 2, and (C) Case 2 with the 10% increased salinity in the river plume area at 00 UTC on 22 August 2020.
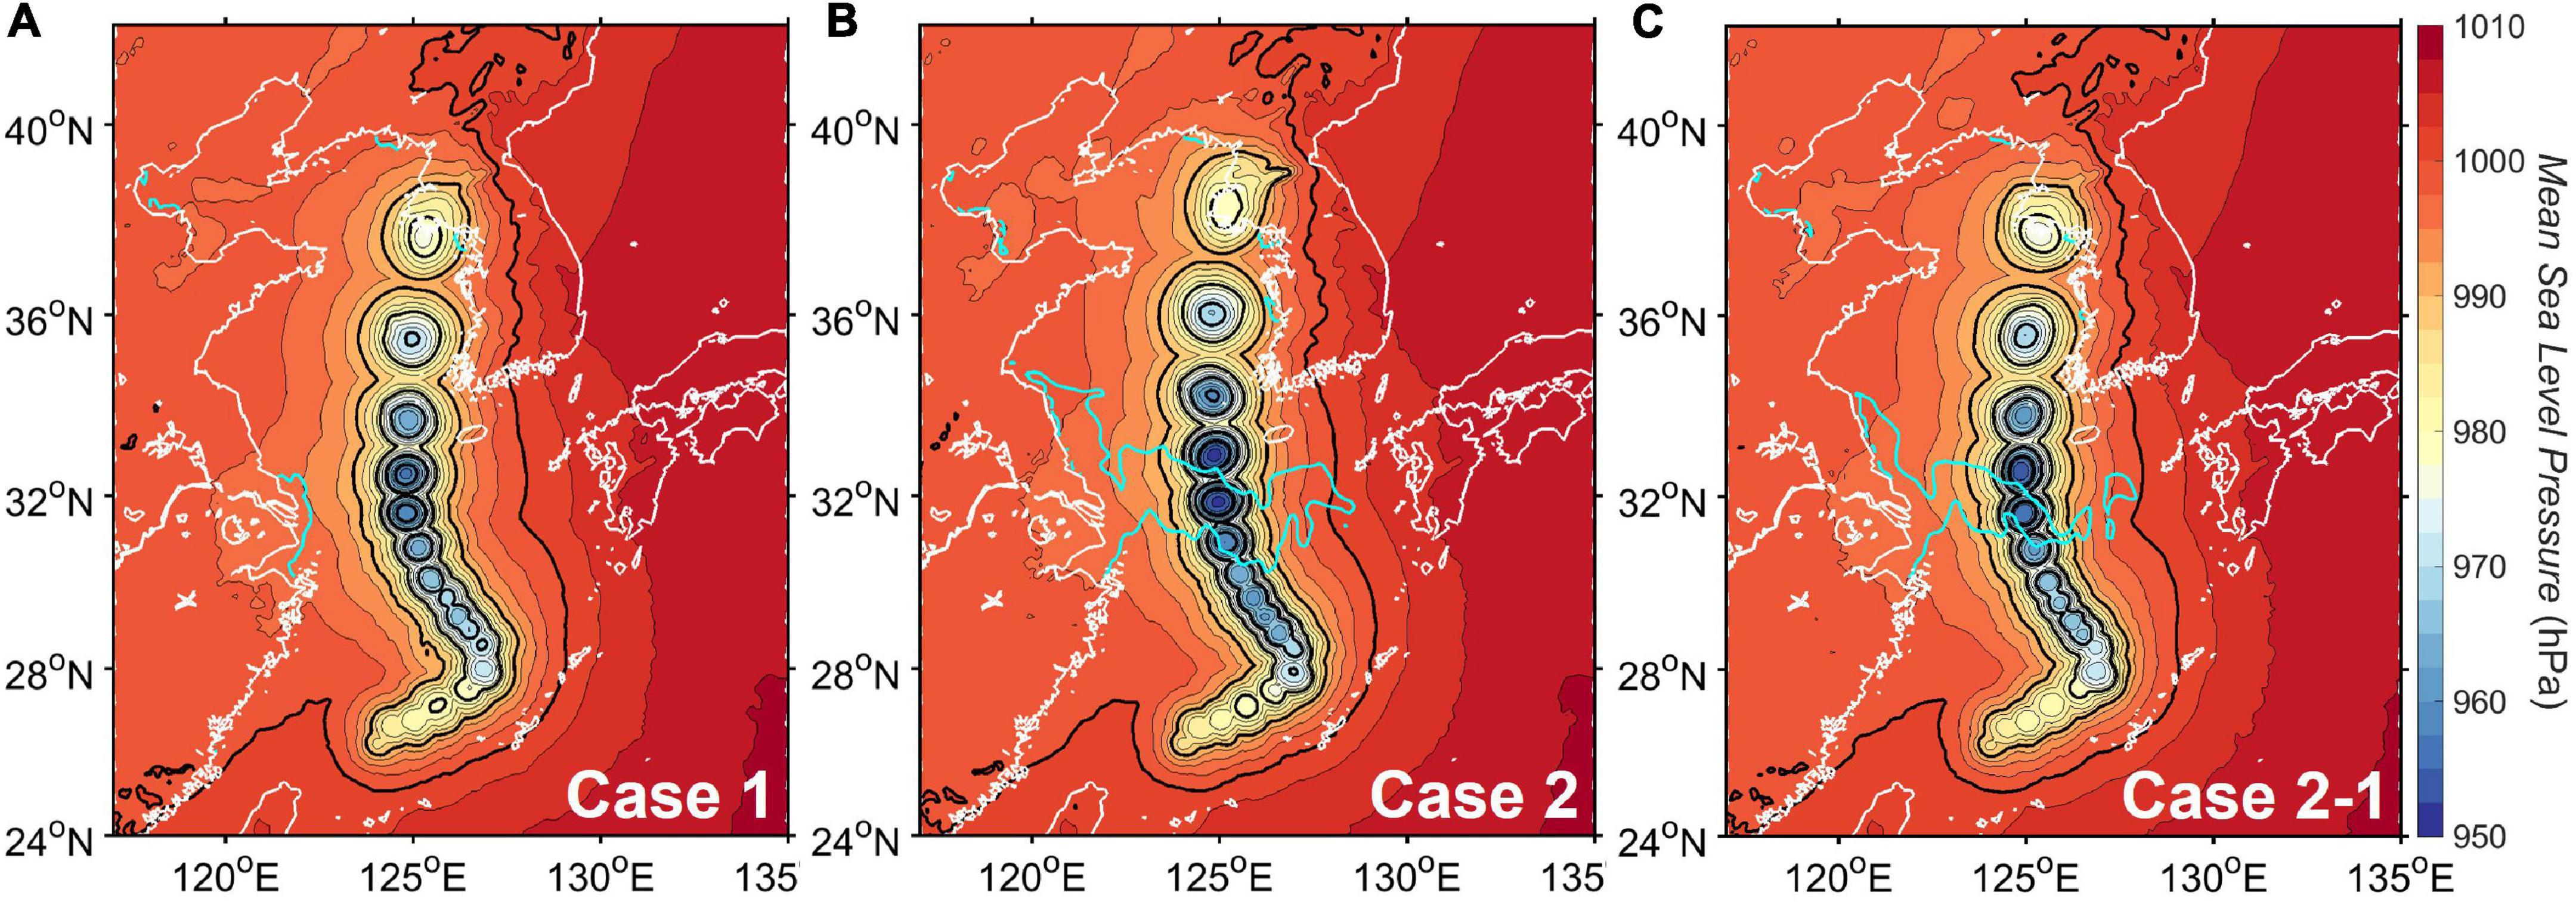
Figure 9. Comparison of central pressure of Typhoon Bavi in (A) Case 1, (B) Case 2, and (C) Case 2 with 10% increased salinity in the river plume area. The colored dots in (A) represent the minimum central pressure along the track of the typhoon in 6-h intervals. The shaded color represents the swaths of mean sea level pressure. The black contours indicate the sea-level pressure at 10 hPa intervals and the cyan lines represent the surface 26-psu isohaline.
Salinity Effects on Air-Sea Energy Fluxes
To identify the impact of low-salinity water on air–sea interactions, a comparison of enthalpy and moisture fluxes between the two experiments was carried out. The enthalpy flux is given as the sum of the latent (Ql) and sensible (Qs) heat fluxes obtained from the WRF model as follows:
where ρ is the air density, cp is the specific heat capacity of dry air (Jkg–1K–1), Ch and Ce are the surface exchange coefficient of heat and moisture, U is the wind speed at 10 m height, θs is the potential temperature at the surface layer, θa is the temperature at 10 m height of atmosphere, and qs and qa are the mixing ration of water vapor (Jkg–1) at the surface and 10 m height of atmosphere, respectively. The moisture or evaporative flux (E) in the WRF model is related to the latent heat flux through:
where Lv is the latent heat of vaporization (Liu, 1988; Duda et al., 2017; Sun X. et al., 2017; Chen et al., 2019; Wenta and Herman, 2019).
Figure 10 presents the swaths of enthalpy and moisture fluxes in the two experiments during the passage of Typhoon Bavi. The swath represents the maximum values of the two fluxes at each grid point throughout the typhoon in a 6-h interval. The upward fluxes (i.e., from ocean to atmosphere) of enthalpy and moisture appeared along the typhoon track in both simulations, showing their maximum values at around 32°N. Similar to the pressure pattern, the largest differences in enthalpy and moisture fluxes between the two experiments were clearly shown in the region where the river plume-induced surface freshening is dominant. The surface heat and moisture fluxes increased by as much as 20% when the river plume was included in the coupled model, revealing a distinct response to a warm sea surface due to the freshwater discharged from the Changjiang. The additional experiment with the 10% increased salinity in the river plume area showed a reduced upward enthalpy and moisture fluxes compared to Case 2, further supporting the connectivity between the low-salinity water and the air-sea energy fluxes (Figures 10C,F). The swath map of enthalpy flux in Case 2-1 shows a maximum value of 1,668, which is reduced to about 100 W/m2 compared to 1,765 W/m2 in Case 2. This reduction in response to the increased salinity of the river plume was associated with a marked decrease in the sensible and latent heat flux that depends on heat and moisture exchange at the air-sea interface (Eqs 1, 2). Figure 11 showed that the sensible heat flux in Case 2-1 is still larger (305 W/m2) than 235 W/m2 in Case 1 but not as large as in Case 2 (320 W/m2). Also, the upward latent heat flux, a major energy source of typhoon development, significantly diminished to 1,360 W/m2 in response to a 5% reduction of moisture flux compared with 1,440 W/m2 in Case 2. These comparisons suggest that the river plume-induced surface freshening played an important role in the typhoon intensification through the heat and moisture supplies from ocean to atmosphere.
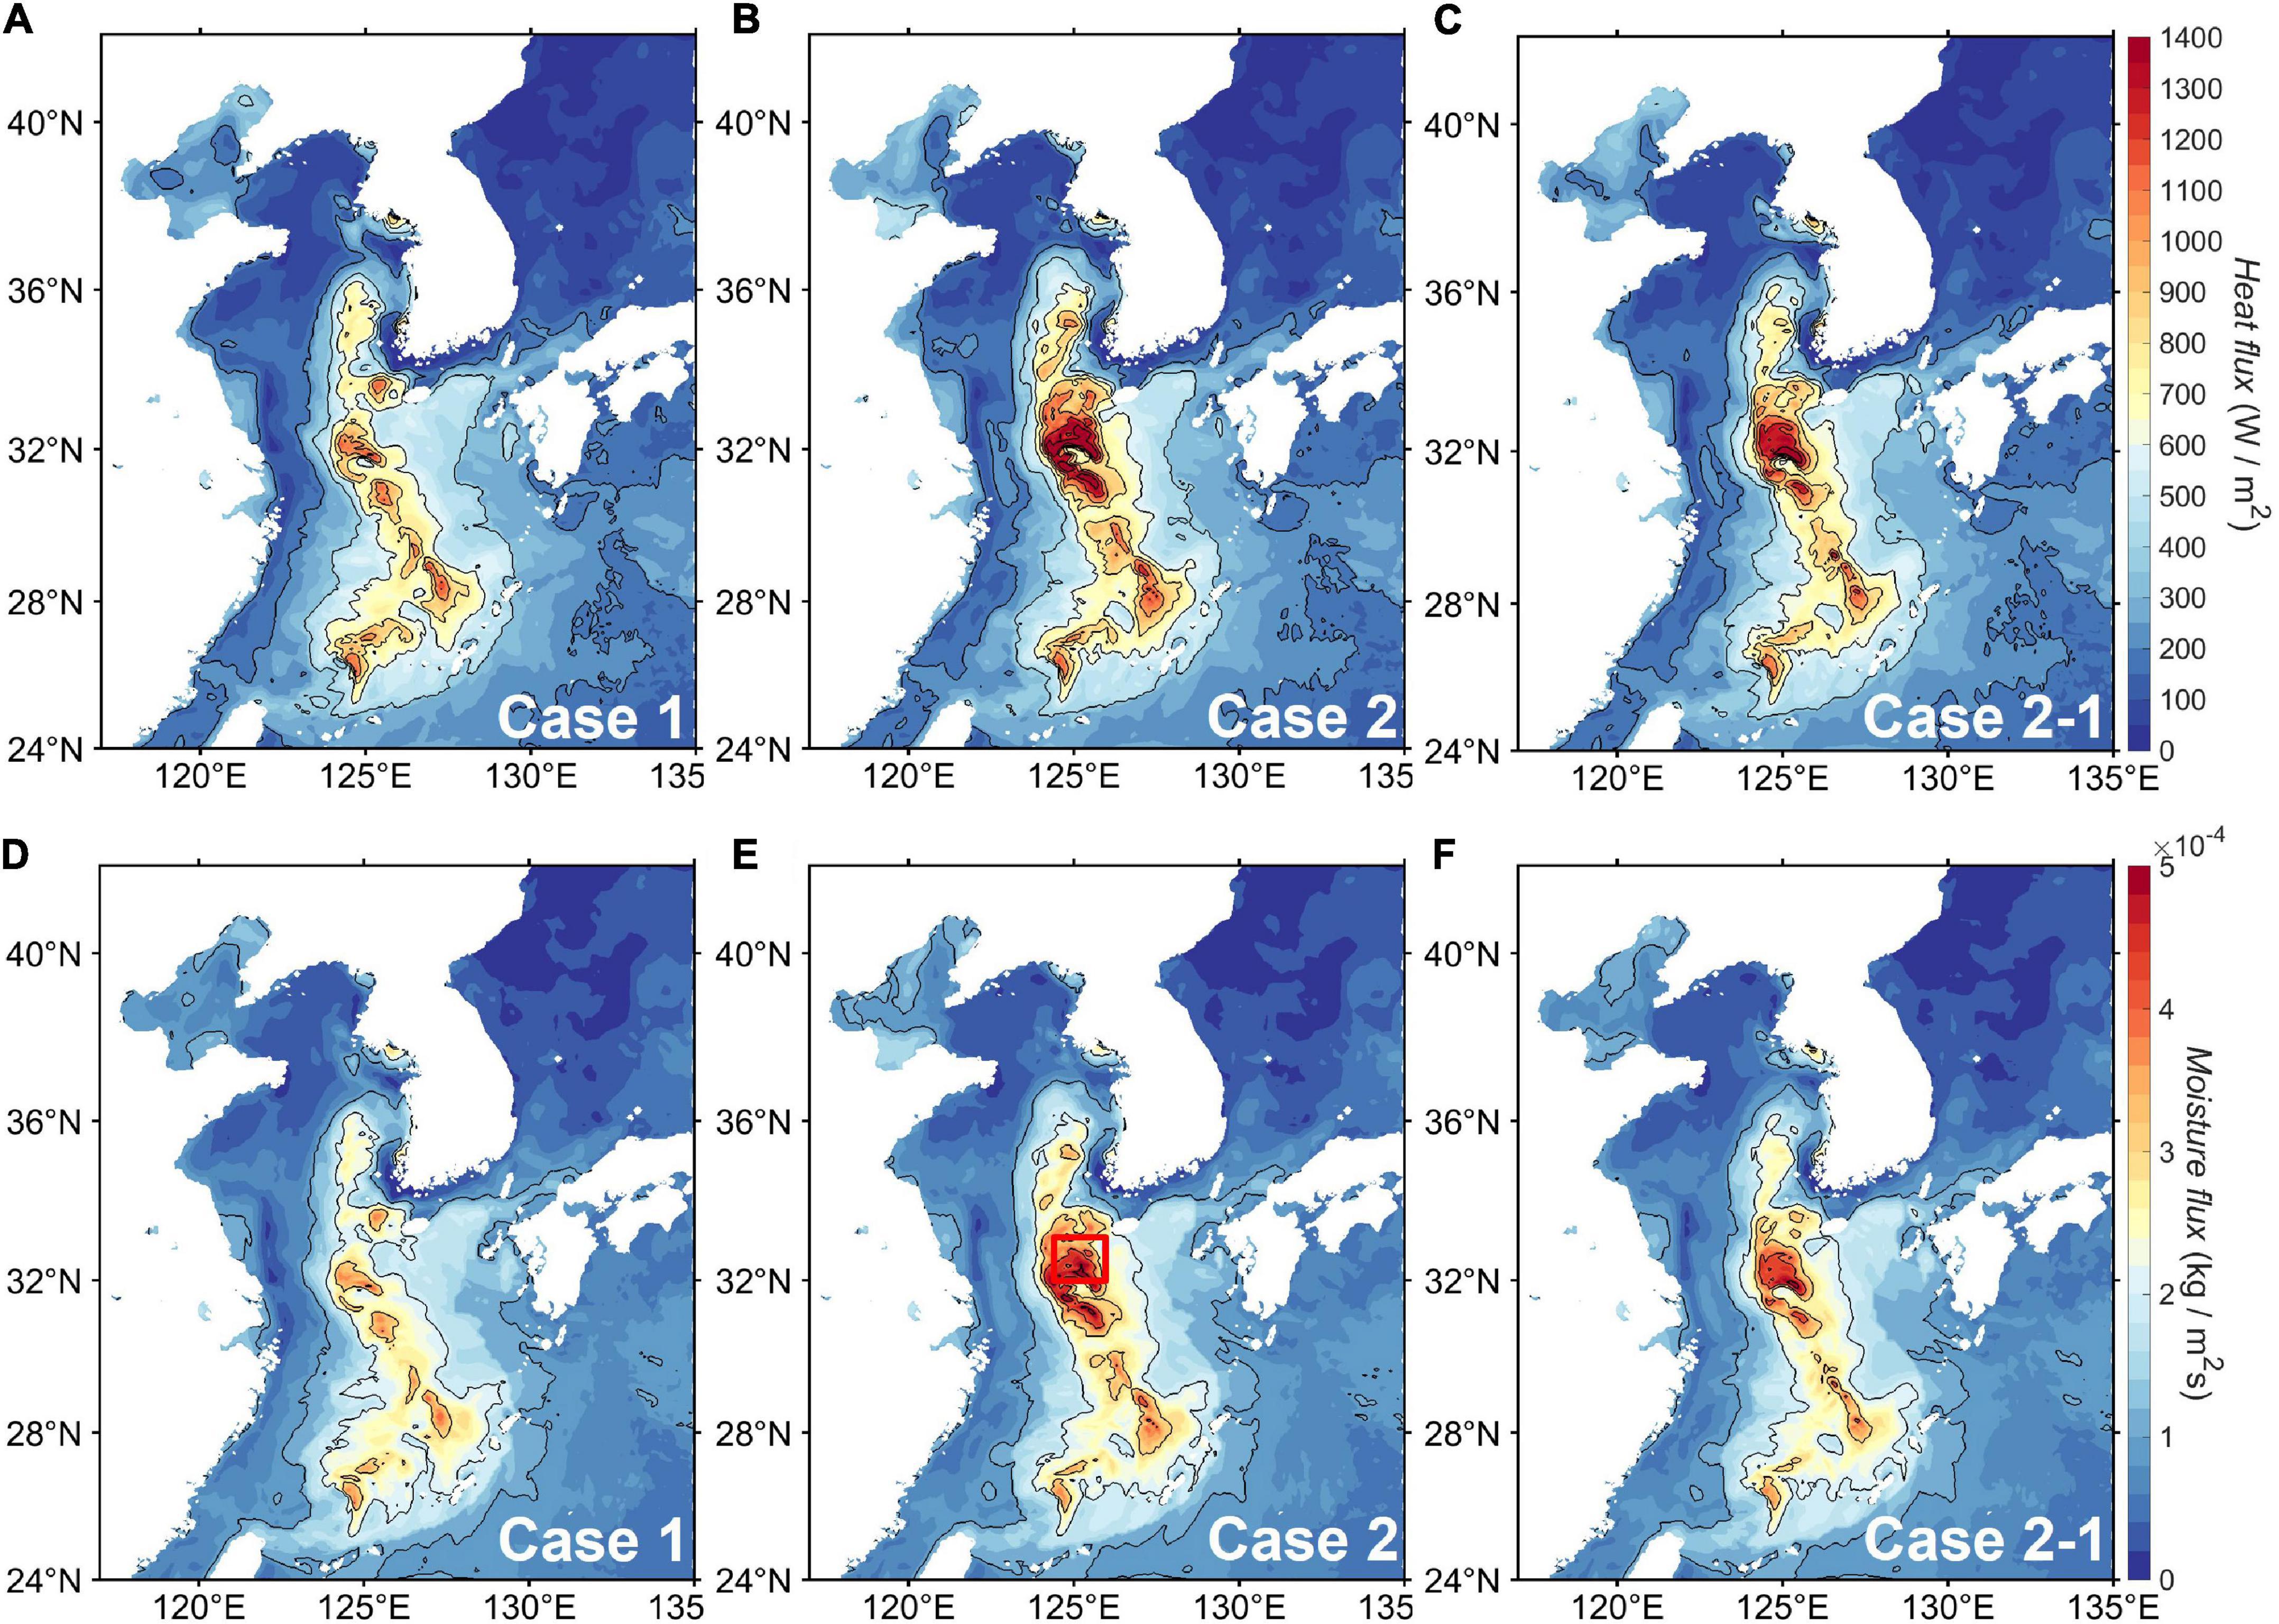
Figure 10. Swaths of enthalpy flux (A–C) and moisture flux (D–F) simulated in Case 1 (A,D), Case 2 (B,E), and Case 2 with 10% increased salinity in the river plume area (C,F). Contour intervals are 100 Wm–2 for enthalpy flux and 1 kgm–2s–1 for moisture flux. The red solid box is the region for which the temporal changes in the heat and moisture fluxes are estimated.
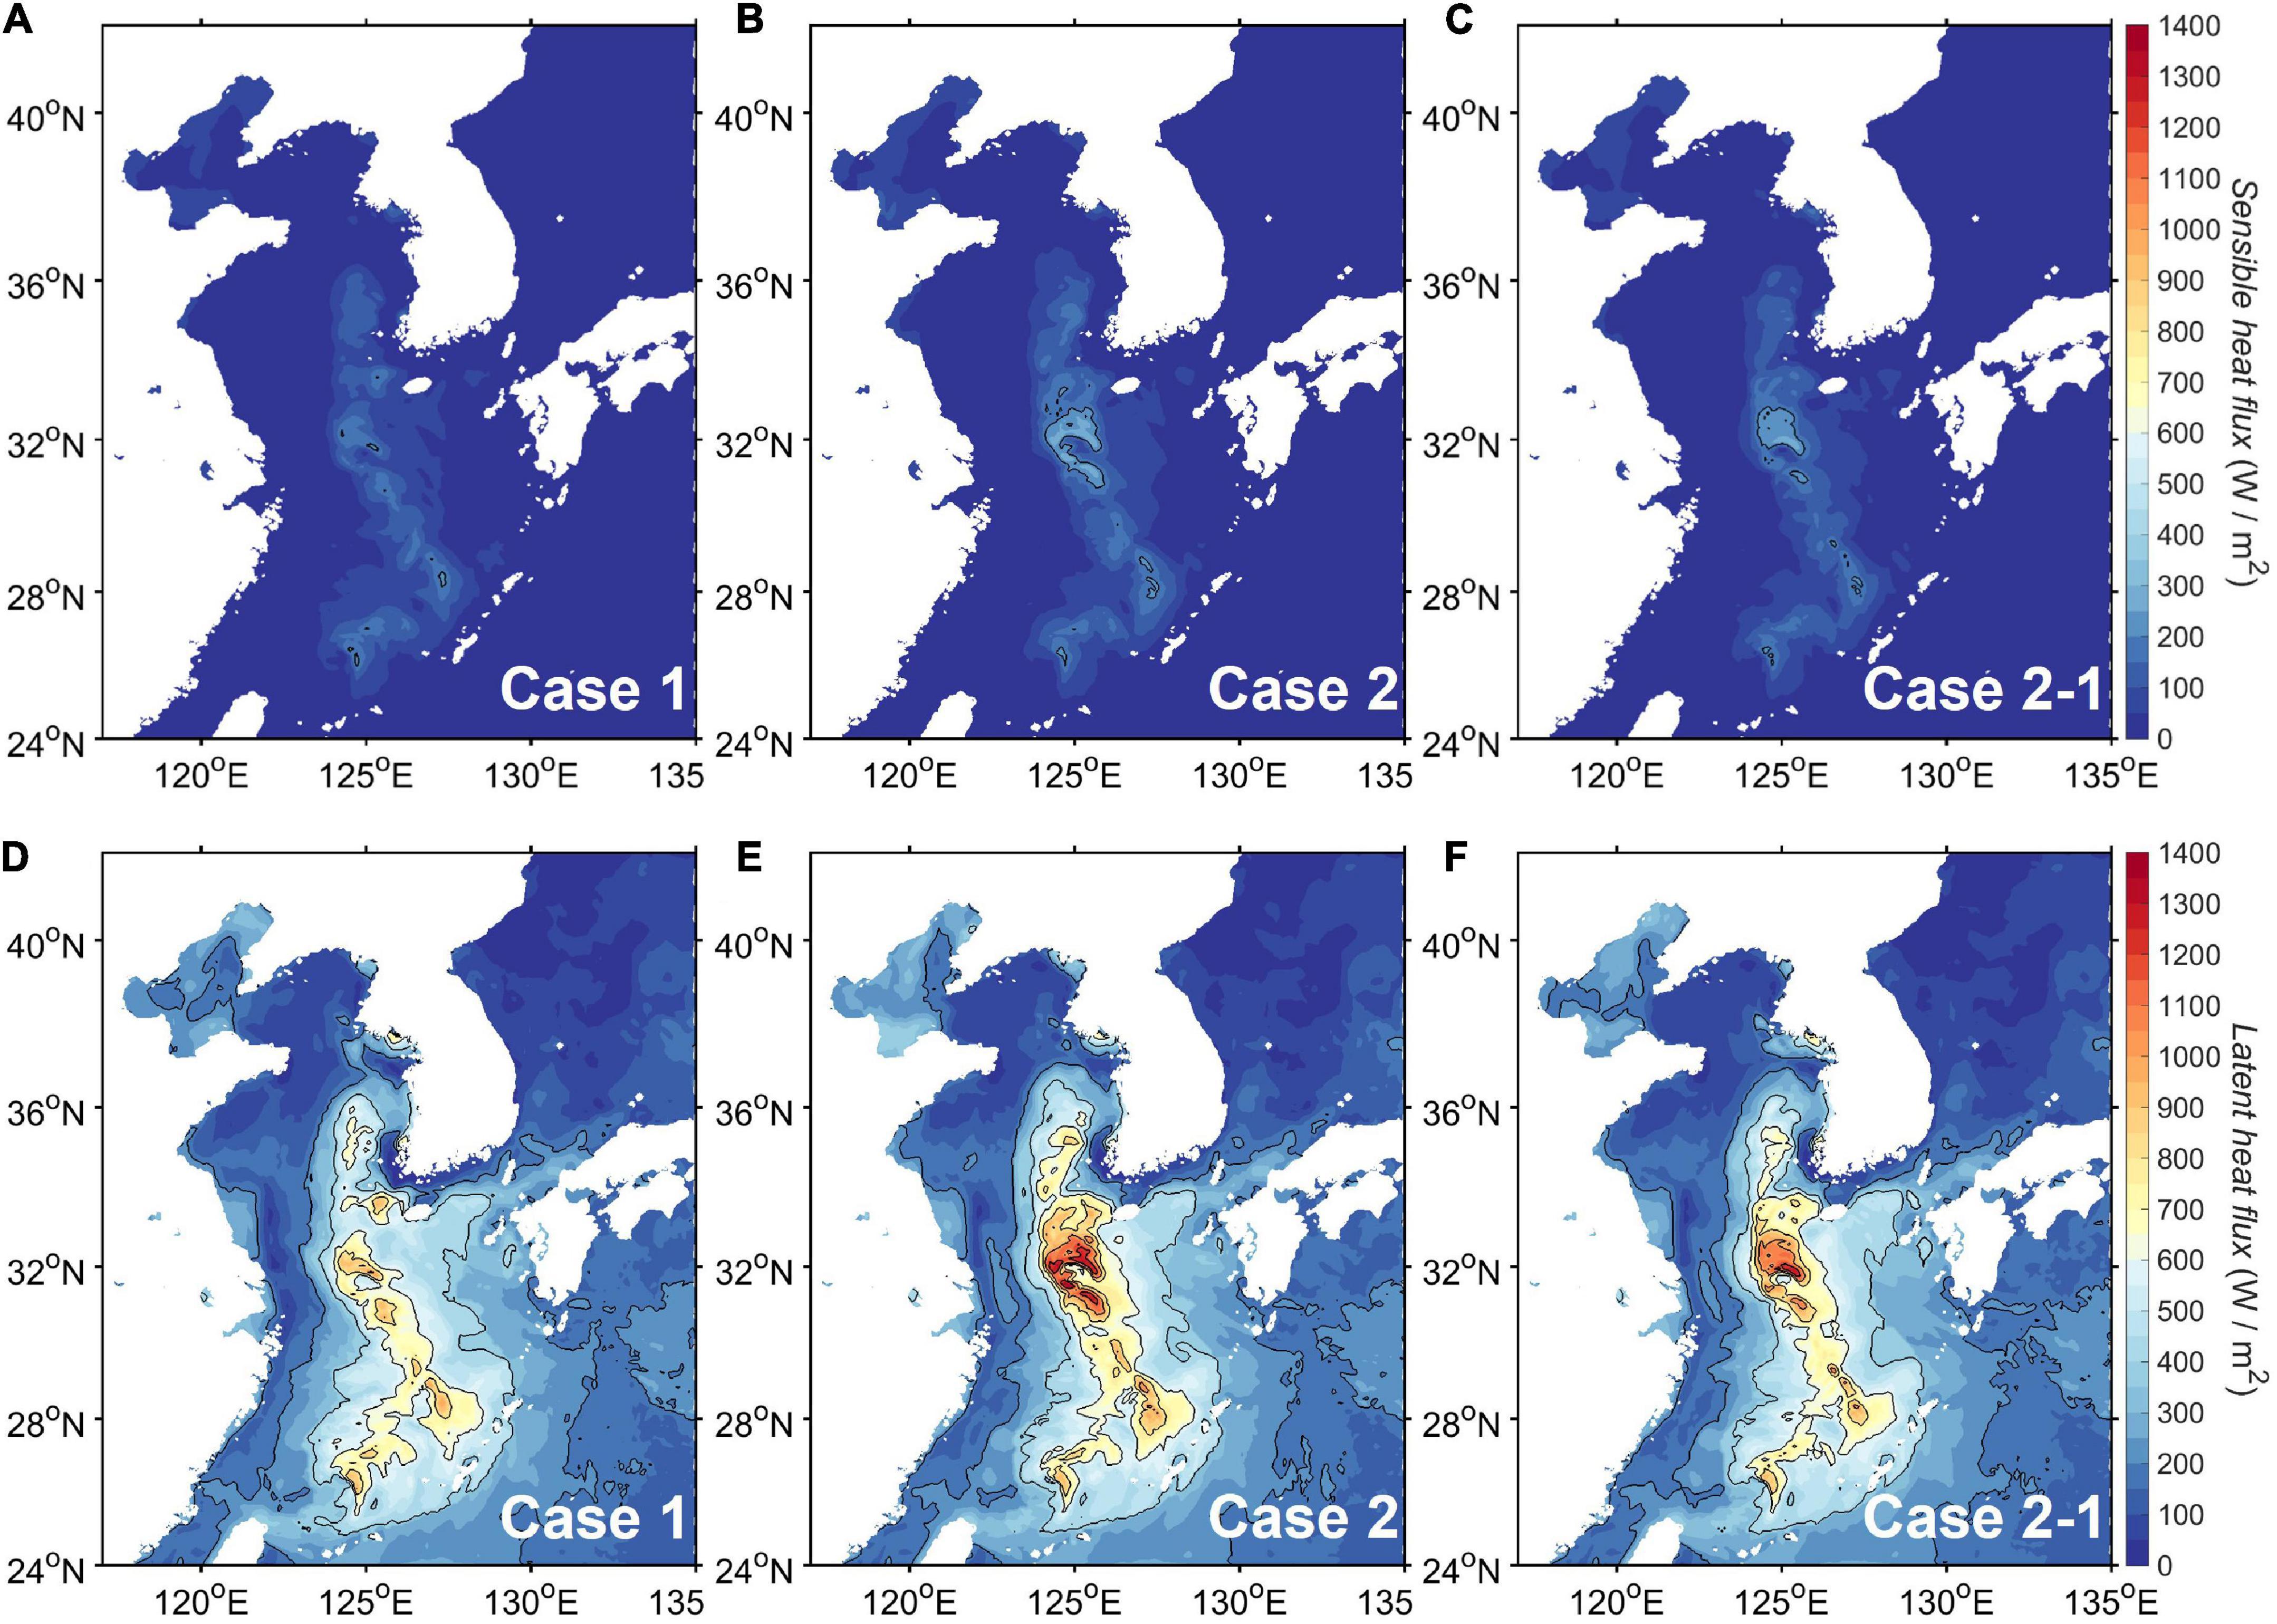
Figure 11. Swaths of sensible heat flux (A–C) and latent heat flux (D–F) simulated in Case 1 (A,D), Case 2 (B,E), and Case 2 with 10% increased salinity in the river plume area (C,F). Contour intervals are 100 Wm–2 for heat flux.
The temporal changes in the heat and moisture exchange that occur during the passage of a typhoon are presented in Figure 12. These values were averaged over the area marked by the red box in Figure 10D (from 125 to 126°E and 32 to 33°N). In both simulations, the largest upward enthalpy and moisture fluxes occurred when the typhoon had just passed, with rapid reduction to near zero directly afterward as a result of the strong surface cooling. The latent heat flux contributed to more than 90% of the enthalpy flux (Figure 12C). Compared with the simulation without the river plume, the simulation with the plume indicated that more heat and moisture were supplied to the atmosphere when the typhoon passed over the freshening area. Of particular interest is that the enthalpy and moisture fluxes still maintained positive values in the plume simulation after the typhoon had passed, implying that surface freshening can play a role in maintain the typhoon intensity, especially in case of the slow-moving typhoon. As will be discussed later, this result is closely related to the fact that the typhoon-induced SST cooling is reduced under conditions in which surface freshening is dominant.
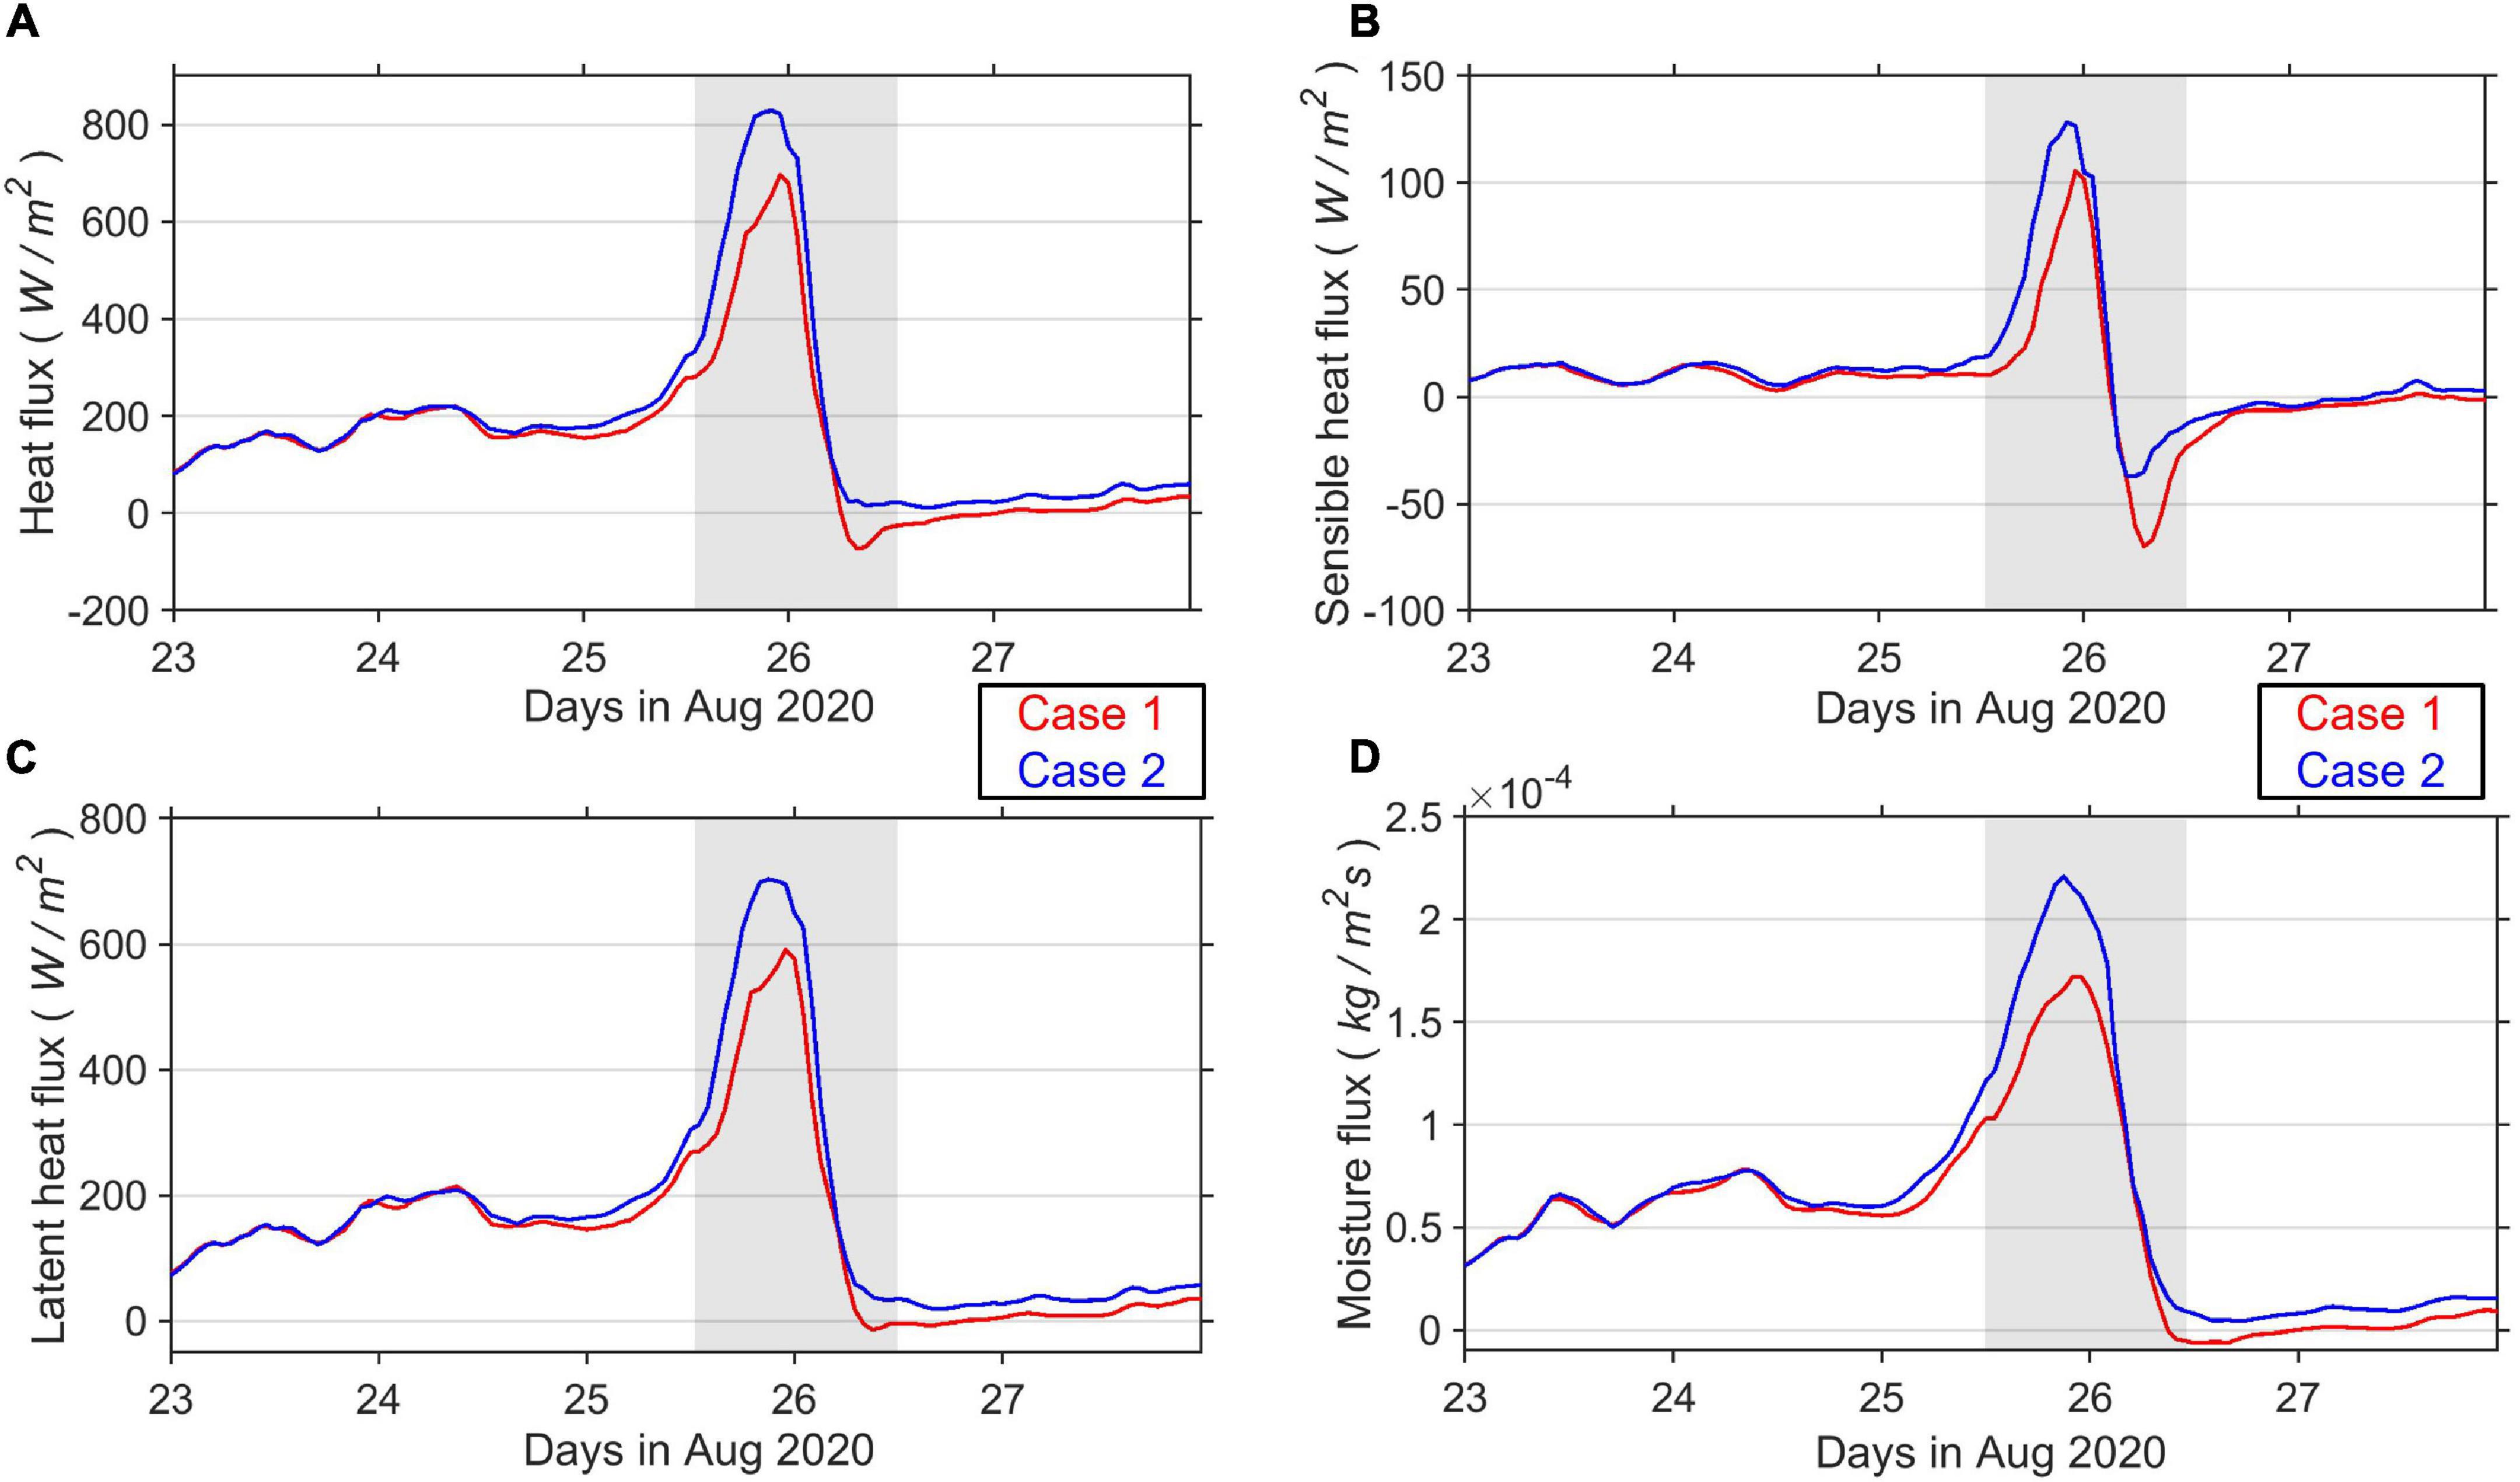
Figure 12. Time series of (A) enthalpy flux, (B) sensible heat flux, (C) latent heat flux, and (D) moisture flux simulated in Case 1 and Case 2. The values are averaged for the area marked by a red box in Figure 10D. The gray shaded area indicates the period corresponding to when Typhoon Bavi passed over the northern ECS shelf.
Impact of Salinity-Induced Barrier Layer on Typhoon Intensity
The energy transfer from ocean to atmosphere during the passage of a typhoon is closely associated with the thermal and haline structures in the ocean affected. To analyze the impact of surface freshening on the upper-layer structure, we estimated the isothermal layer depth (ILD), in which the temperature decreases by 0.5°C as compared to the SST (Chu et al., 2002; Rudzin et al., 2018), and the mixed layer depth (MLD), which is defined in terms of density increment (Δρ) as follows:
where ΔT is the temperature threshold (Sprintall and Tomczak, 1992; de Boyer Montégut et al., 2007), T0, S0, and P0 are the temperature, salinity and pressure at the surface layer, respectively. The thickness of the BL is estimated as the difference between the ILD and the MLD.
Figure 13 shows the temporal changes in the vertical profiles of salinity and temperature with the corresponding sea level pressure in the northern ECS area that was marked by a box in Figure 10D. Since the Changjiang plume is the dominant source of freshwater in the ECS, there are clear differences in the salinity stratification of the two experiments (Figures 13A,B). Before Bavi approached, the low-salinity water (<26 psu) from the Changjiang plume clearly appeared in the upper 10 m layer, resulting in distinct saline stratification (Figure 13B). In contrast, the simulation without the plume demonstrated a relatively homogeneous salinity structure that was due to the lack of any major freshwater inputs (Figure 13A). An apparent difference arising from the presence of the Changjiang plume is the warmer signal in the upper ocean layer (∼10 m), which led to strengthening of the stratification before the typhoon arrived (Figure 13D). The enhanced intensity of the typhoon in correspond to the warmer SST is consistent with the response of the typhoon intensity to the upper-ocean thermal structure suggested by a previous study (Dutta et al., 2019), who focused on the dependence of intensity on the heat potential that is associated with the isothermal and barrier layer thickness.
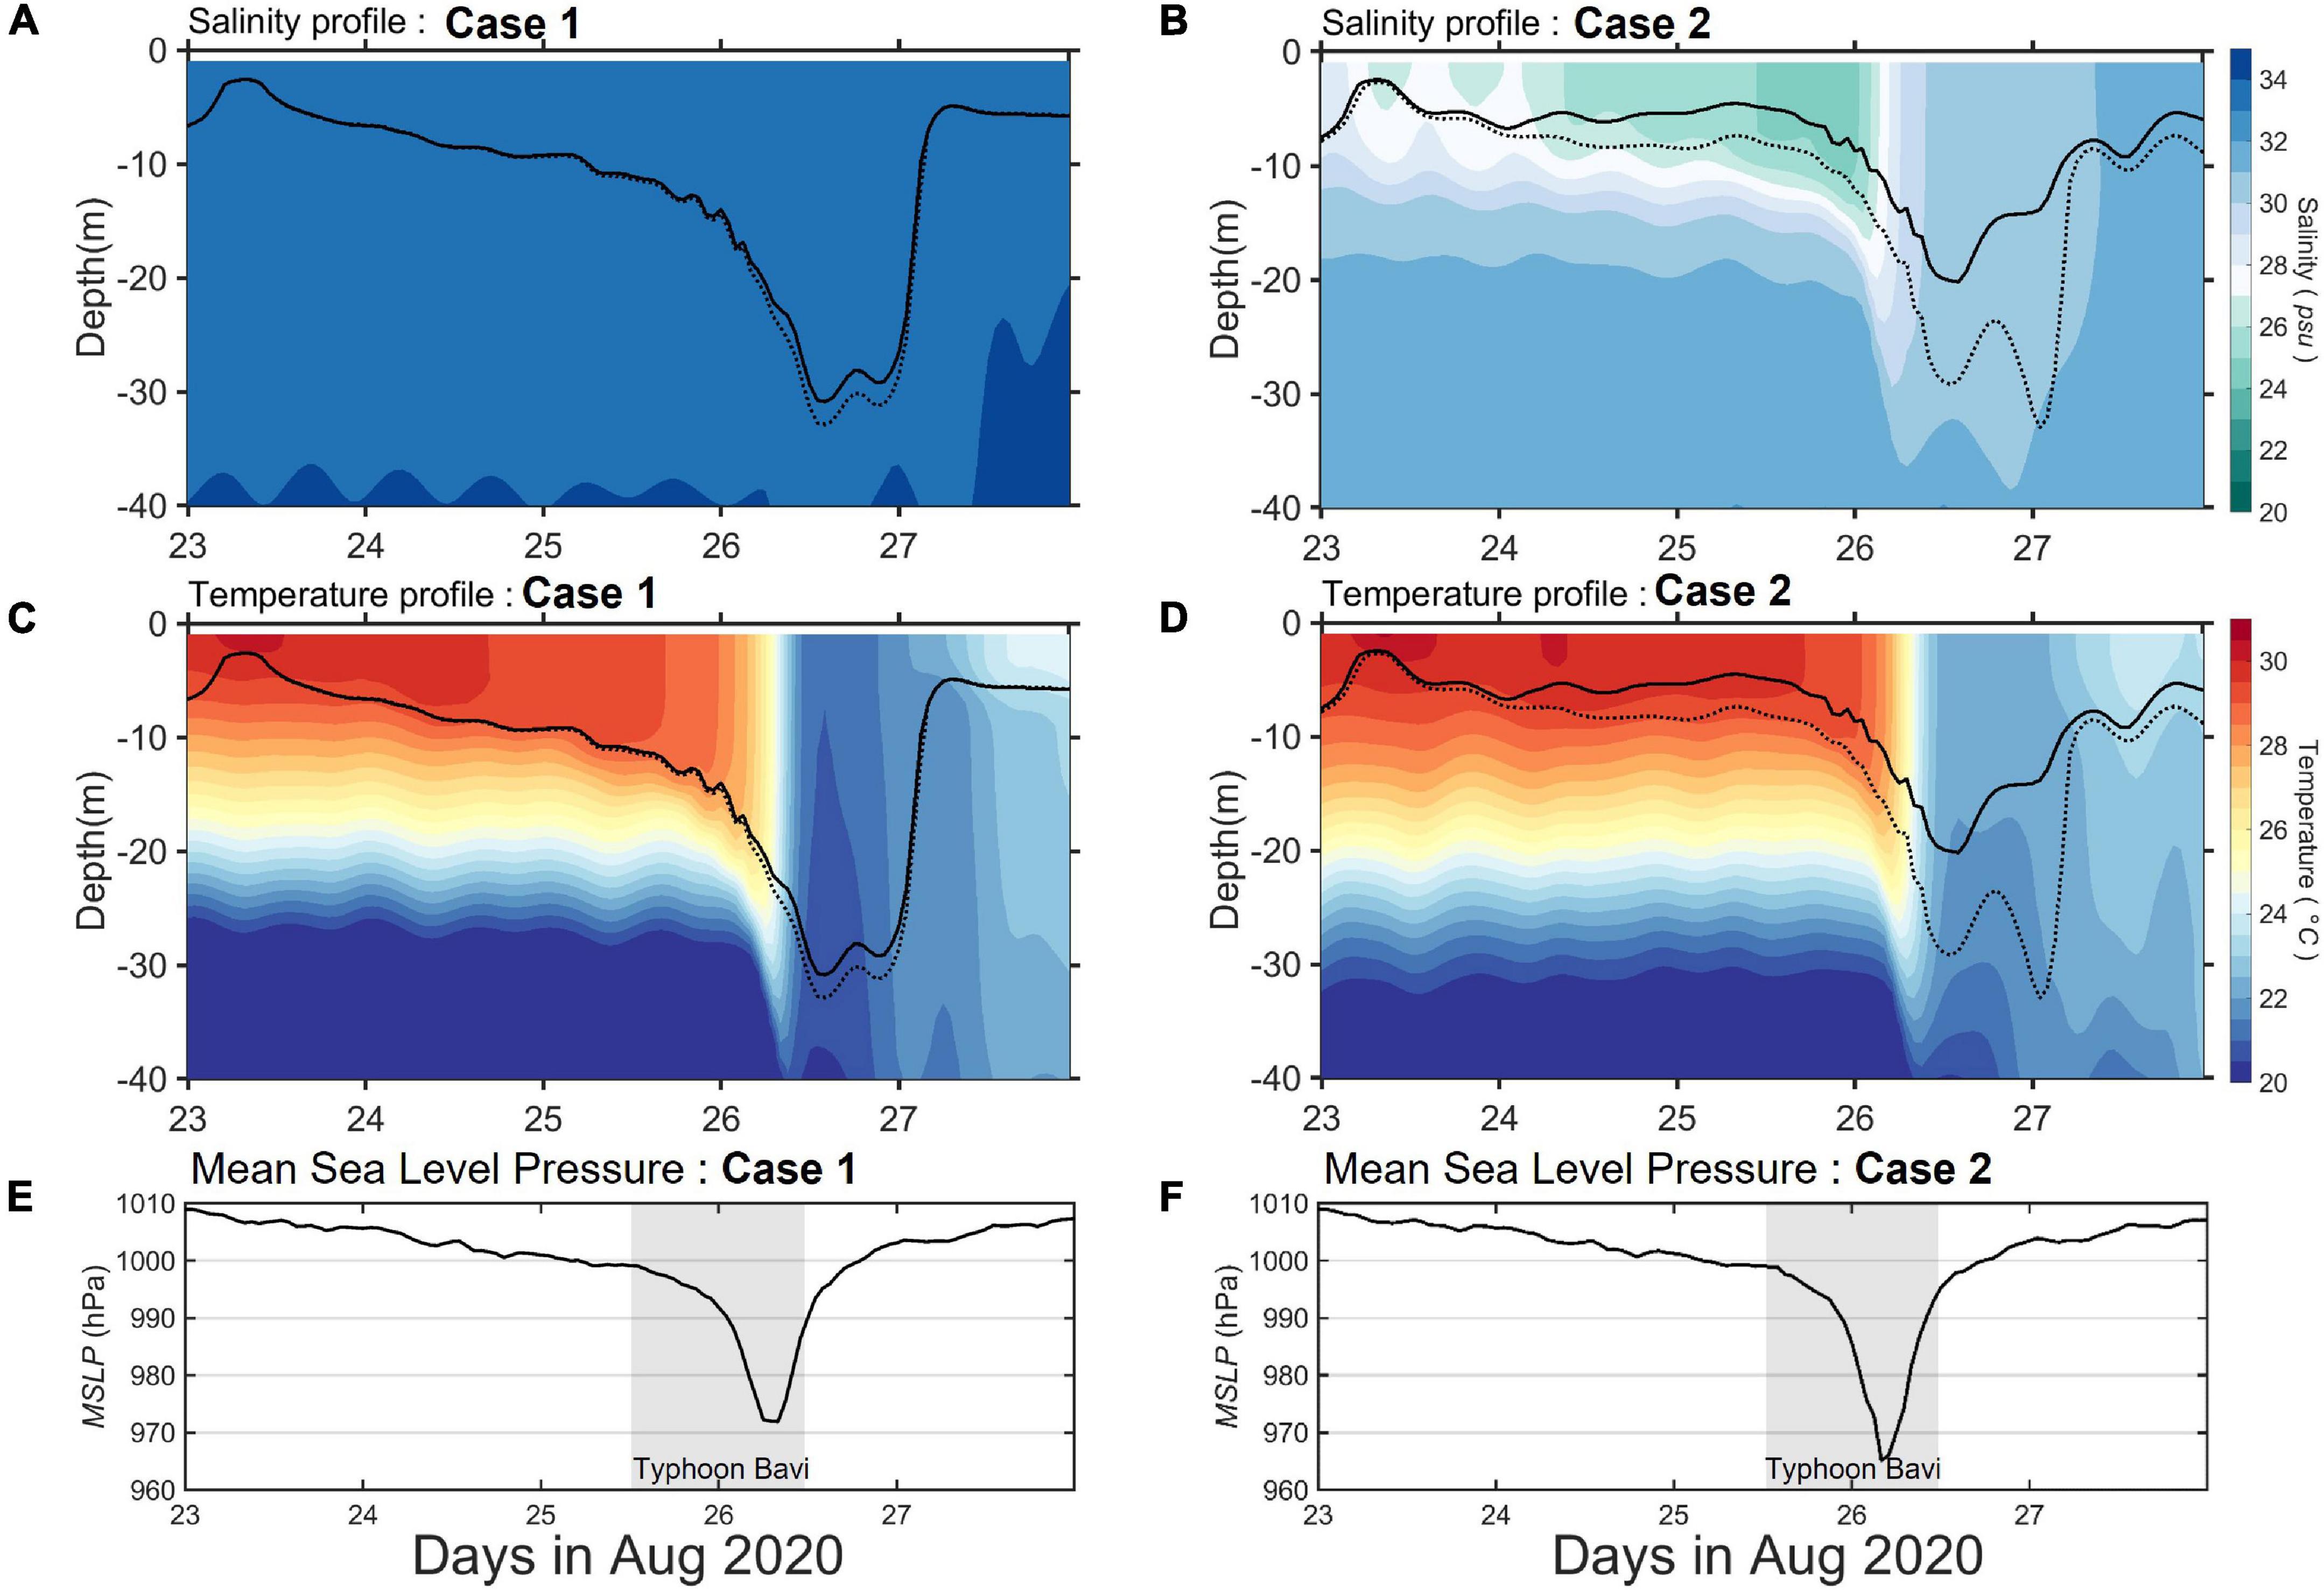
Figure 13. Time-depth diagrams for (A,B) salinity and (C,D) temperature simulated in Case 1 and Case 2. The solid and dotted line denote the depths of the mixed layer and isothermal layer, respectively. (E,F) Time series of simulated mean sea level pressure in (A) Case 1 and (B) Case 2. The gray shaded area indicates the period corresponding to when Typhoon Bavi passed over the northern ECS shelf.
The pronounced response to surface freshening occurred via the thickening of the BL during typhoon passage. When the river plume was included in the model, the low-salinity water developed a very shallow ML and a thick BL, with the maximum BL thickness (of > 10 m) forming on 26 August, when the typhoon passed over the freshening region (Figure 13D). However, when the freshening was not intensive, the ML was relatively deep and the BL was quite thin (<2 m) compared to the results that included surface freshening. This analysis suggests that the shallow ML leads to a thick BL that is located between the ML and the top of the thermocline, which inhibits significant vertical mixing and sea surface cooling. Also, as described in section “Validation of Numerical Models,” the intensity of Bavi was strong enough to break through the BL base, penetrating to the thermoclines. Previous studies have showed the response of the typhoon intensity on the BL in a certain situation that the TC-induced forcing is strong enough to increase the mixed layer temperature (Yan et al., 2017; Hlywiak and Nolan, 2019). In the present study, Typhoon Bavi already evolved to Category 1 on 23 August before the TC arrived at the river plume area and thereafter, TC has grown to Category 3 with strong enough wind forcing that keeps the BL to maintain the warm temperature or inhibit the temperature cooling of the mixed layer. This suggests that the deepening of the BL combined with the typhoon-induced strong winds may contribute to maintain the warm surface water before the typhoon passage.
When the typhoon passed over the area, strong winds triggered a strong surface cooling in both simulations through the intense vertical mixing that occurred between the warm surface and the cold thermocline below. However, a significant reduction in the typhoon-induced surface cooling was observed in the simulation that included the river plume. This reduction in the surface cooling is clearly demonstrated in Figure 14, in which the spatial pattern of the temperature in the two experiments along with their differences are presented. Compared to the simulation without the plume, the simulated sea surface cooling in Case 2 was smaller by approximately 2°C in northern edge of the ECS (around 33N), which is closer to the satellite-based SST data. This comparison indicates that the surface freshening contributed to preventing significant sea surface cooling after the typhoon passed.
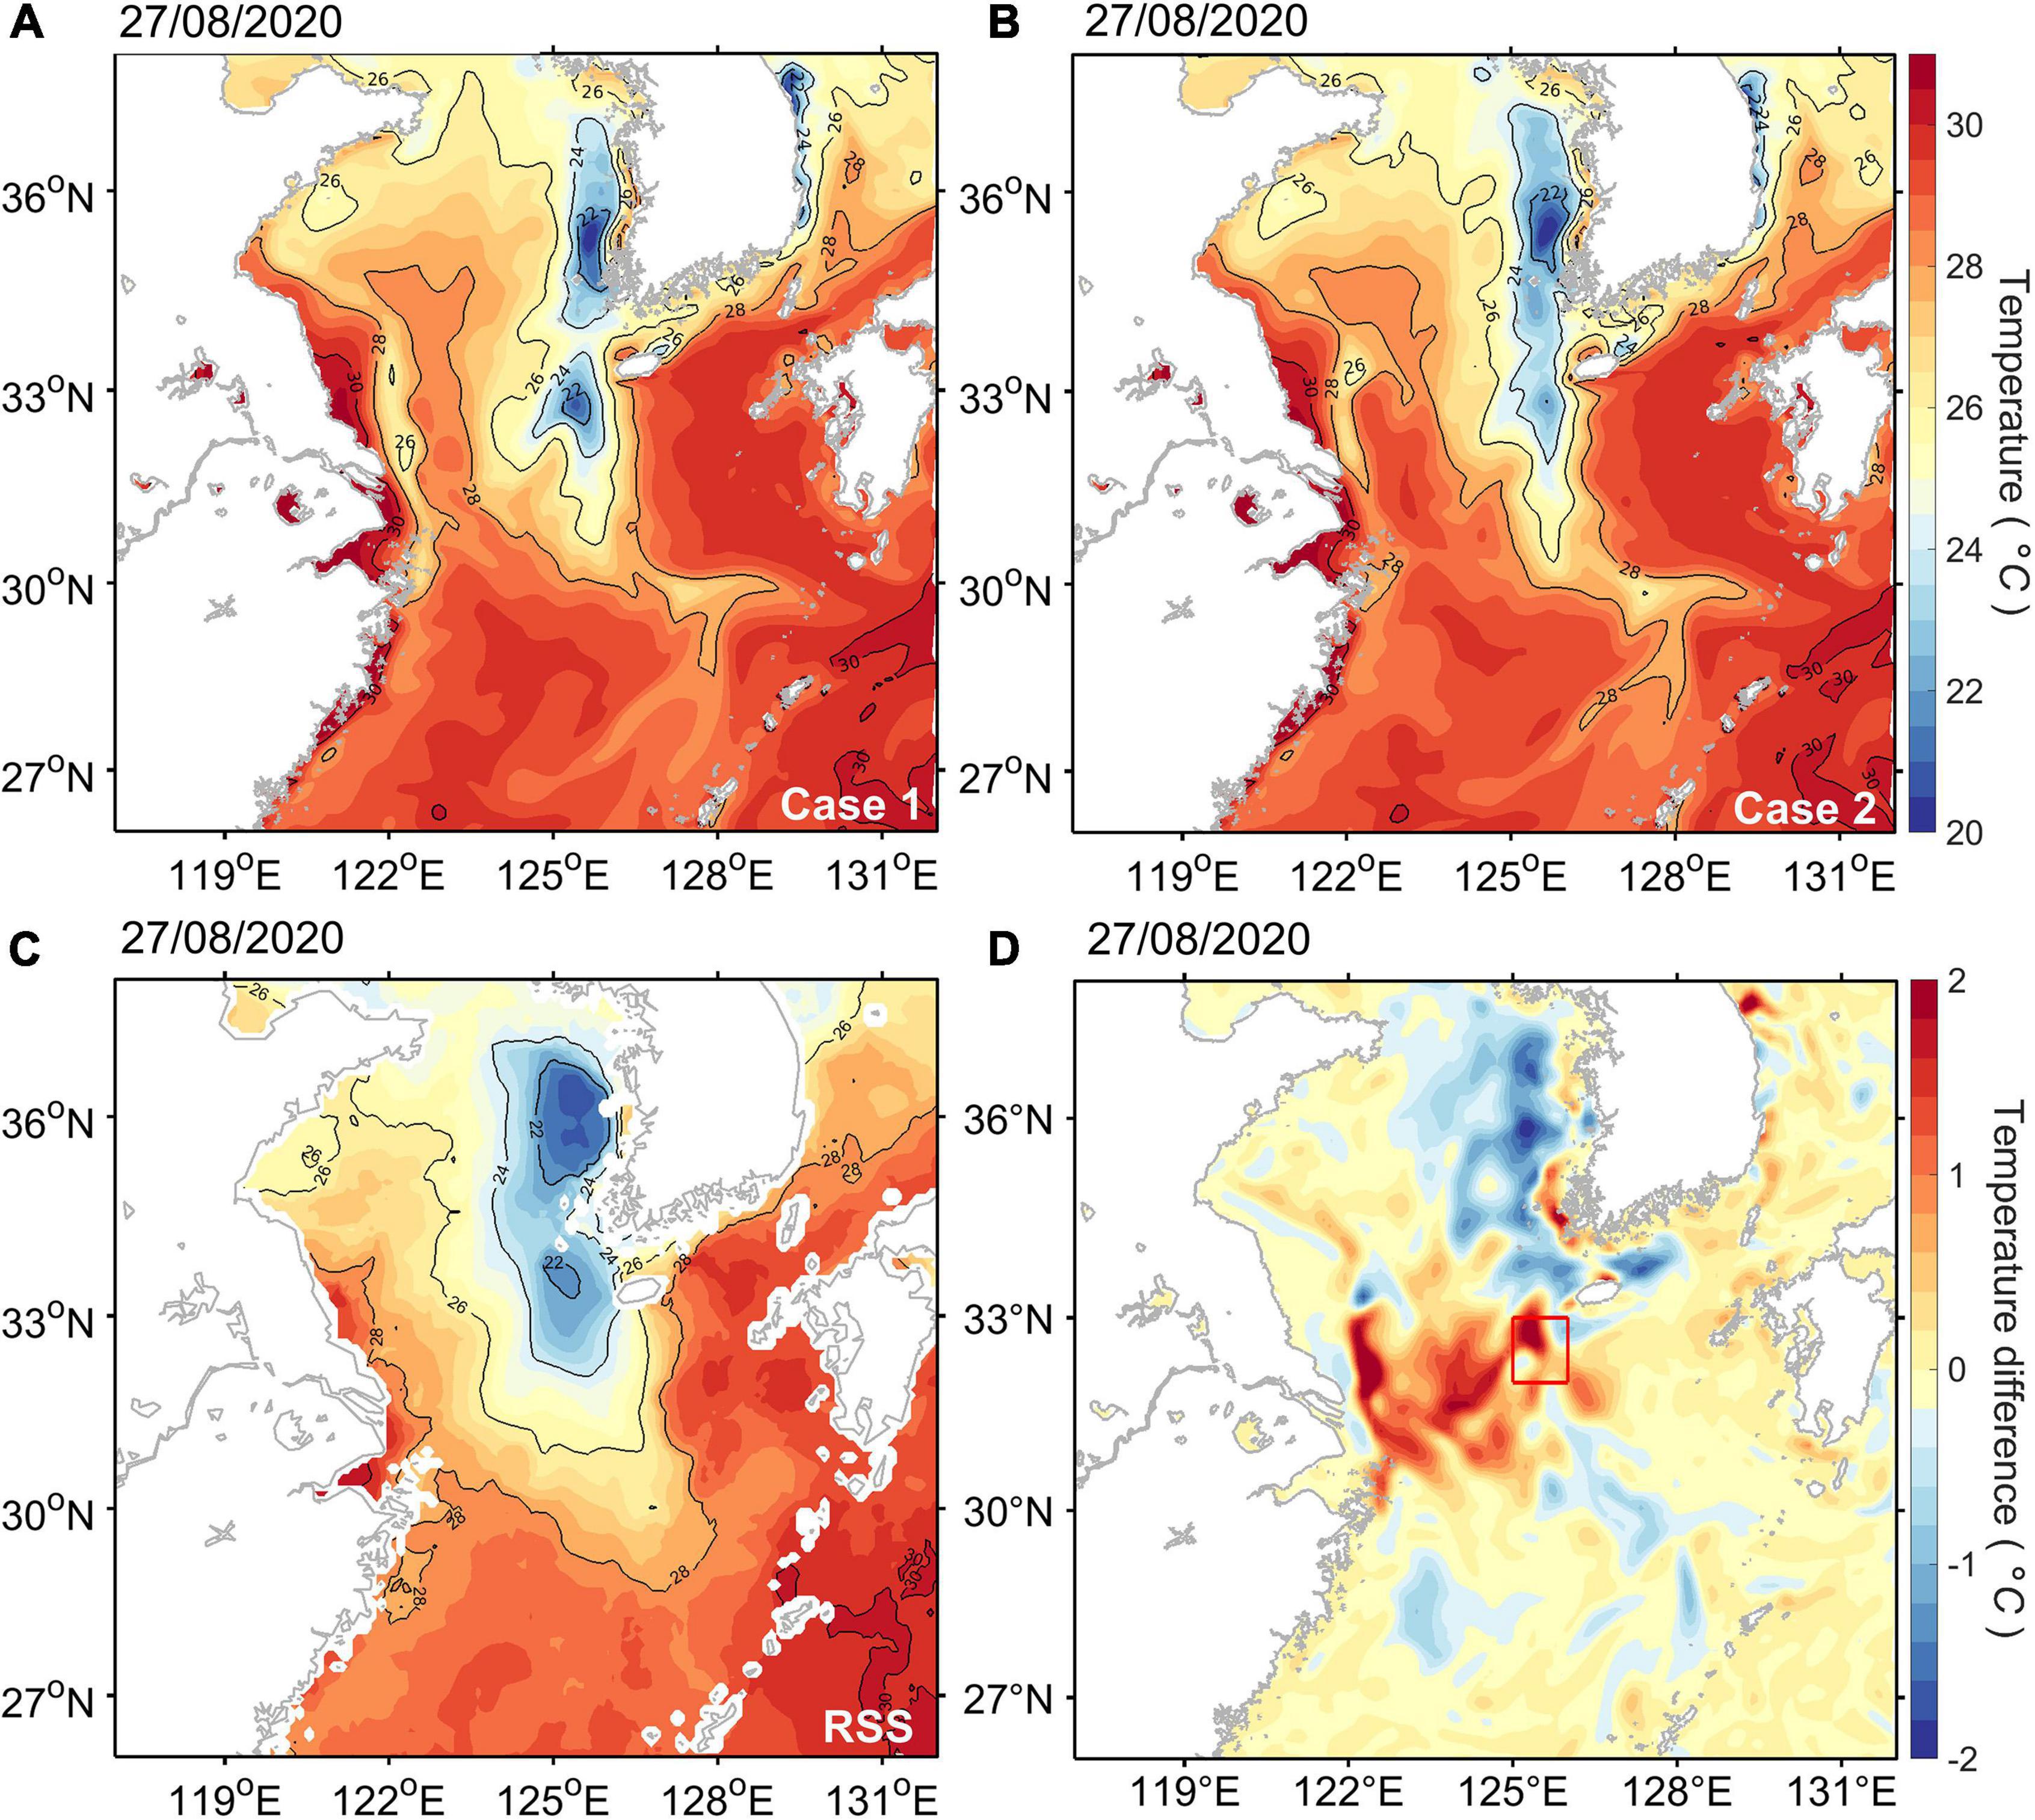
Figure 14. Horizontal distributions of surface temperature simulated in (A) Case 1, (B) Case 2, and observed from the (C) satellite-based observation on 27 August 2020. (D) The difference in surface temperature between the two experiments (Case 2—Case 1).
To further analyze the role of oceanic processes on the typhoon-induced sea surface cooling, the contribution of each term in the temperature tendency equation was also examined.
where T is the simulated temperature, t is time, (u,v,w) are the velocity components, and kh and kz are the horizontal and vertical diffusivity, respectively. The first term on the right side of the equation indicates the total (horizontal and vertical) advection term. The second and third terms represent the horizontal and vertical diffusions, respectively. Figure 15 shows the time series of the local rate of temperature change, total advection, and vertical diffusion during the passage of the typhoon, which is averaged from the surface to a depth of 30 m in the area marked by a red box in Figure 14. In both simulations, the local rate of temperature change was mainly balanced with the total advection term and the vertical diffusion term during the period of study (Figure 15). The other term was negligibly small and is not shown here. Before the typhoon arrived, the total advection term dominated the changes in temperature, with an apparent semidiurnal oscillation that was a result of tidal forcing. However, when the typhoon passed over the freshening area on 26 August, the contribution of vertical mixing term on the surface cooling shows an abrupt increase, explaining more than 61 and 48% of the temperature changes in Case 1 and Case 2, respectively. Compared to the simulation without surface freshening, the magnitude of SST cooling was relatively reduced by approximately 1°C/day, with the reduction mostly determined by the weakening of the vertical diffusion term. To identify the contribution of the tide-induced vertical mixing to the surface cooling, an additional experiment without tidal forcing in Case 2 was conducted. As shown in Figure 15C, during the typhoon passage (on 26 August) the rate of temperature change without tidal mixing was slightly decreased compared to the Case 2; however, the contribution of the vertical diffusion to the surface cooling showed a similar magnitude between the two experiments (Figures 15B,C), providing further support to the BL-induced inhibition of vertical mixing on the surface cooling. This analysis suggests that the salinity-induced BL weakened the typhoon-induced sea surface cooling by restricting vertical diffusion between the surface and the thermocline, and consequently contributed to maintaining the intensity of Typhoon Bavi.
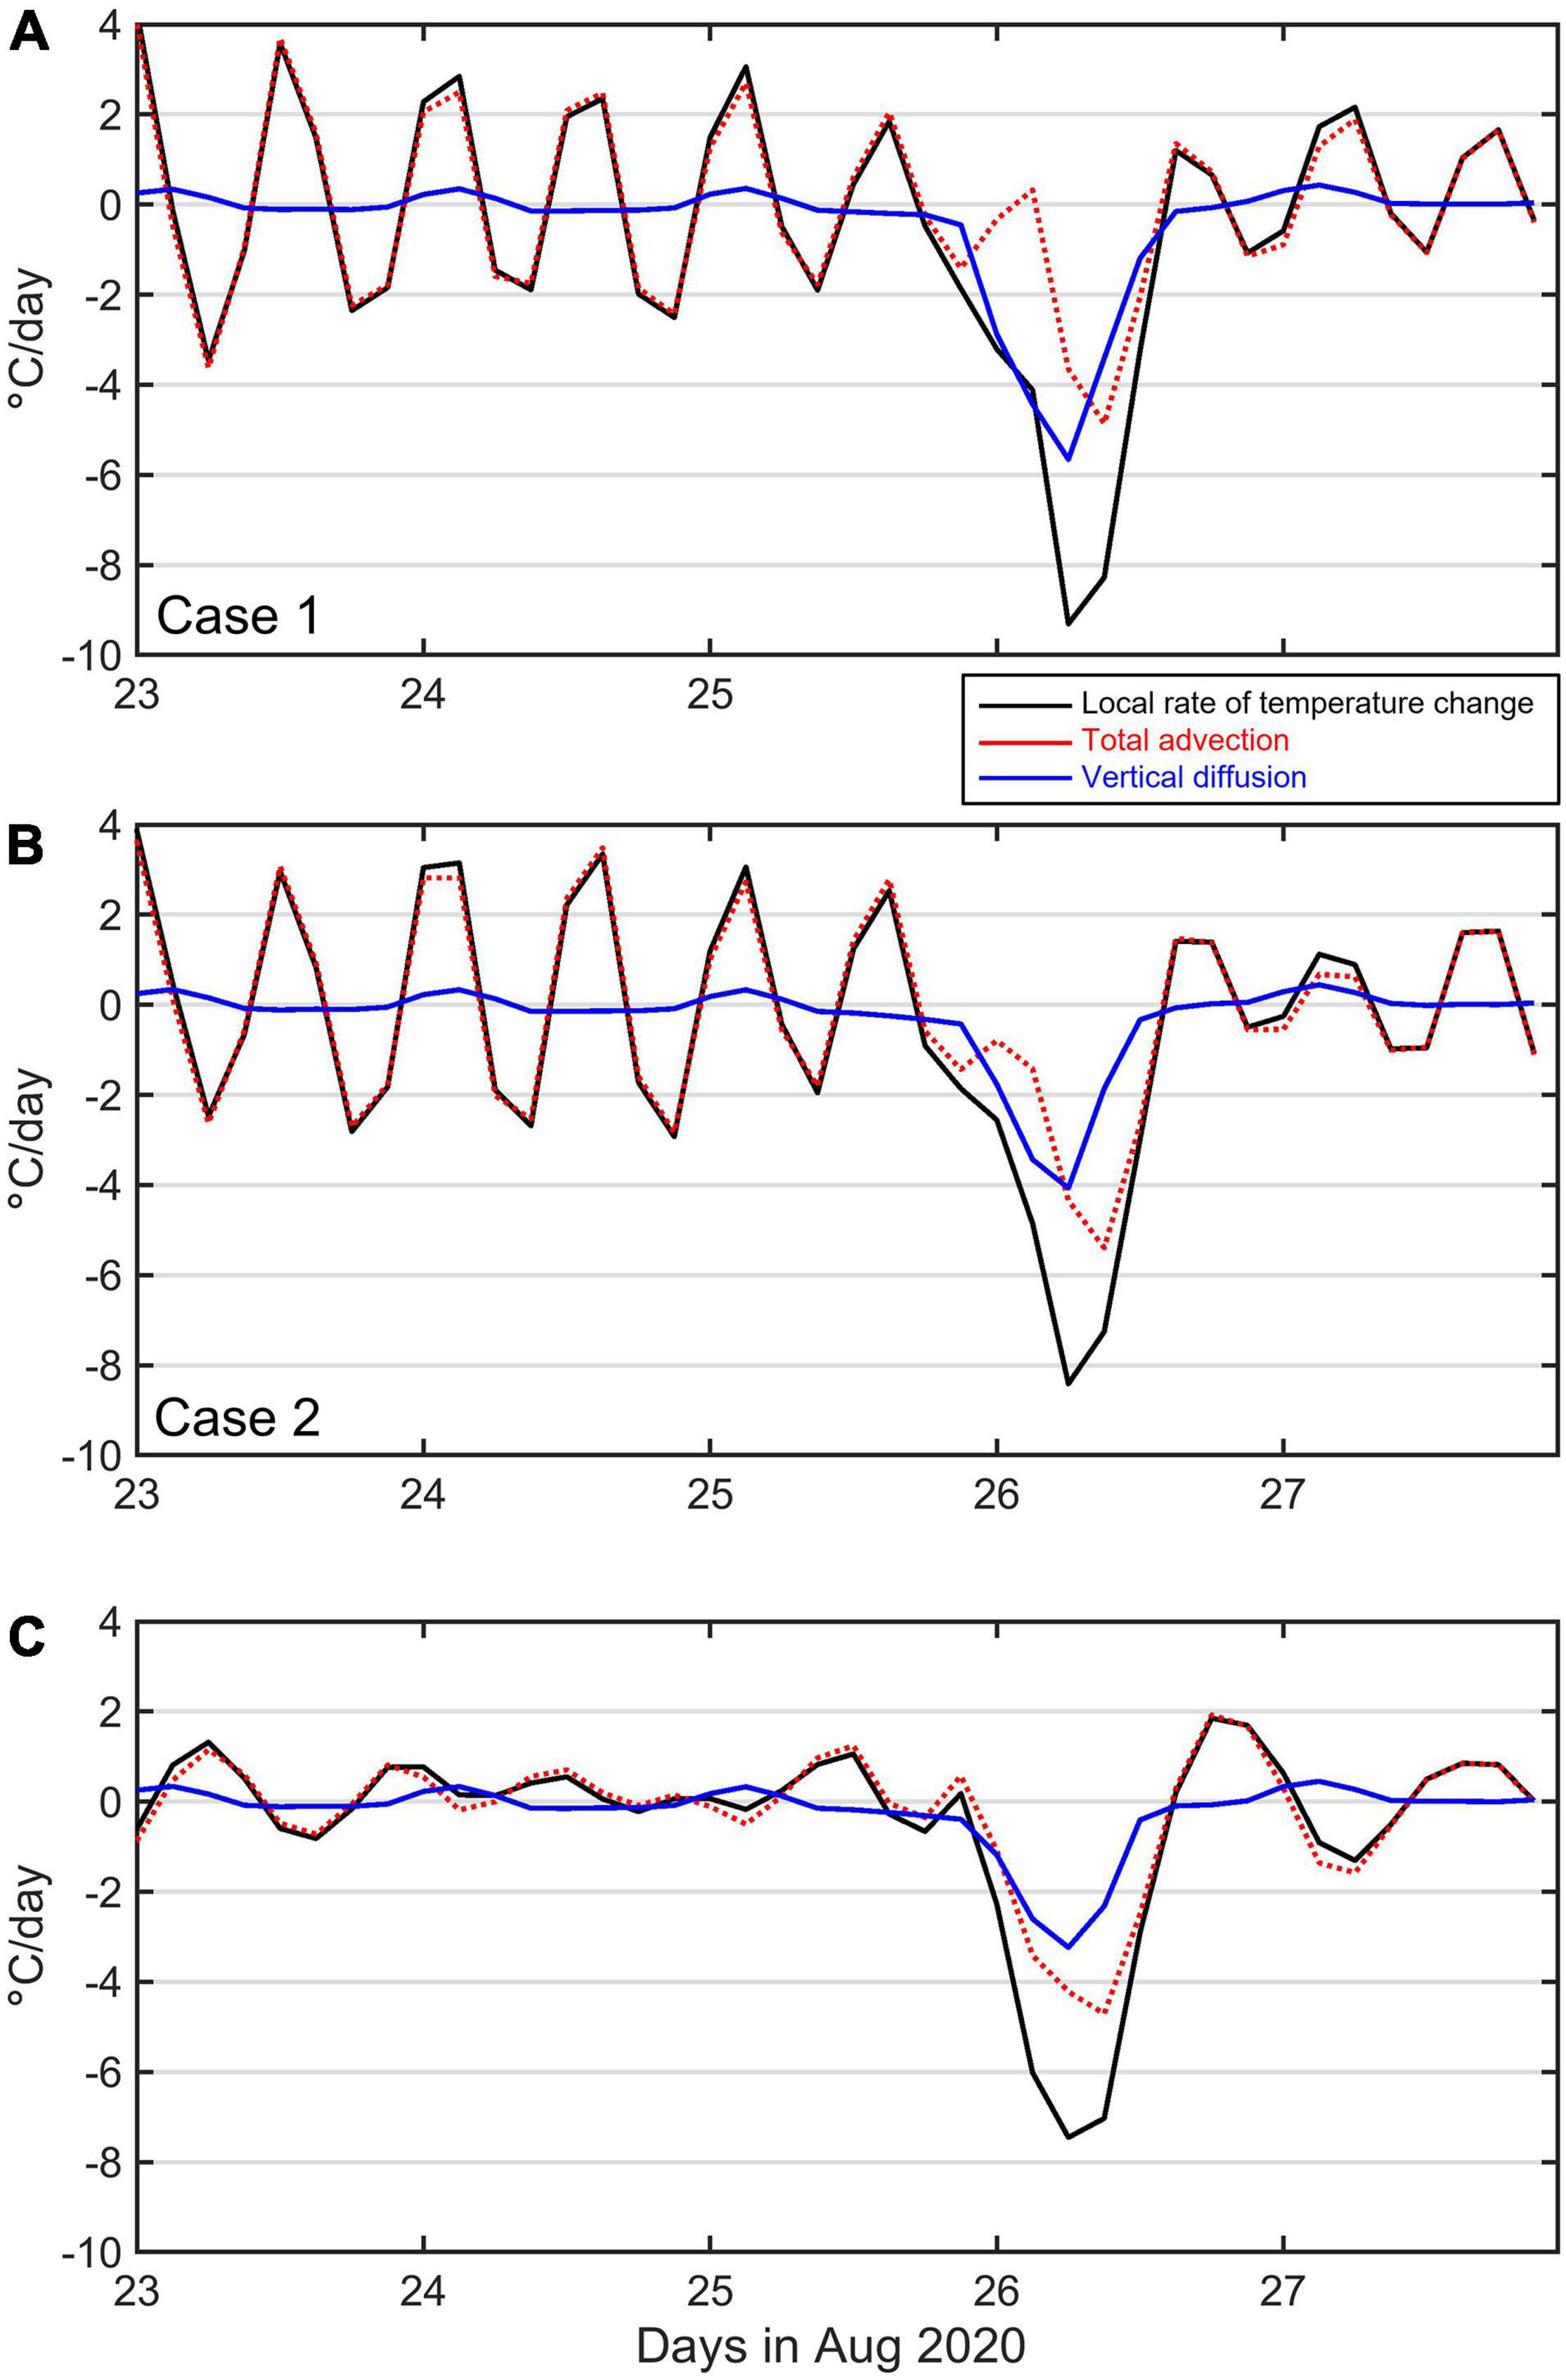
Figure 15. Time series of the temperature rate (black), total advection (red), and vertical diffusion (blue lines) averaged from surface to a depth of 30 m in the area marked by a red box in Figure 12 for (A) Case 1, (B) Case 2, (C) Case 2 but without tidal forcing from the period 23–27 August 2020.
Summary
The KMA best-track data recorded the intensification of Chang et al. (2021) when the typhoon passed over the northern ECS shelf region, which is characterized by extremely low-salinity water. By analyzing the hydrographic data and the results from comparative experiments using an ocean-atmosphere coupled modeling system, this study investigated the impact that the Changjiang plume-induced BL had on the air–sea interaction during the typhoon passage. The in-situ measurements and the comparative experiments demonstrated a strong relationship between surface freshening and SST, both before and after the passage of the typhoon. Before the typhoon approached, the formation of the BL that resulted from the Changjiang plume contributed to maintaining the warm sea surface over those regions in which surface freshening was significant. The coupled model showed that the thick BL with the warmer SST played an important role in the intensification of the typhoon through the heat and moisture that was supplied from the ocean to the atmosphere. The comparison between the comparative experiments also showed a significant reduction in the sea surface cooling after the typhoon passed, indicating that surface freshening largely contributes to the reduction of the typhoon-induced sea surface cooling. This thermal response to the salinity-induced BL supports the finding of Hlywiak and Nolan (2019) who have shown that the thick BL associated with the salinity stratification in the Amazon-Orinoco river plume region can lead to reduced sea surface cooling in stronger and slowly moving hurricane cases, based on the idealized numerical experiment with an atmosphere-ocean coupling. This implies a great importance of salinity that can make an oceanic pre-condition which has a high potential to modulate the typhoon evolution through energy fluxes at air-ocean interface (Dutta et al., 2019). Our analysis demonstrates that the salinity-induced BL weakened the typhoon-induced sea surface cooling by restricting the vertical mixing that could take place between the surface and the thermocline, and consequently contributed to maintaining the intensity of Typhoon Bavi. Nonetheless, a caution is required in interpreting the effect of sea surface freshening as an indicator of intensification of typhoons because typhoon intensity is not a linear function of the surface salinity. The typhoon intensity could be affected by several atmospheric process, including the well-known primary factors such as the tropical cyclone translation speed, mesoscale vortex, and the vertical wind shear (DeMaria, 1996; Chen and Luo, 2004; Chang et al., 2020).
The impact of the salinity-induced BL on air–sea interaction has implications for predicting the intensification of typhoons when they pass over the ECS shelf, where significant surface freshening discharged from the Changjiang is frequently observed. As typhoons increase in strength as a result of global warming, the role of the Changjiang plume-induced BLs in typhoon intensification should be considered for accurate forecasting of typhoon activity (Park et al., 2011; Arora and Dash, 2016; Sun Y. et al., 2017). Therefore, this study suggests that including realistic salinity structures in ocean-atmosphere coupling is useful and capable of improving typhoon forecasting.
Data Availability Statement
The raw data supporting the conclusions of this article will be made available by the authors, without undue reservation.
Author Contributions
J-HM and TK contributed to the conception and design of the study and critically revised the manuscript. J-SH performed the numerical experiments and wrote the first draft of the manuscript. SY, K-YB, and HE provided the study materials. All authors contributed to manuscript revision, read, and approved the submitted version.
Funding
This research was supported by the Basic Science Research Program to Research Institute for Basic Science (RIBS) of Jeju National University through the National Research Foundation of Korea (NRF) funded by the Ministry of Education (No. 2019R1A6A1A10072987) and was a part of the Basic Science Research Program through the NRF funded by the Ministry of Education (No.2021R1I1A2050261). TK was funded by Basic Science Research Program through the NRF funded by the Ministry of Education, Korea (No. NRF-2020R1I1A1A01053137).
Conflict of Interest
The authors declare that the research was conducted in the absence of any commercial or financial relationships that could be construed as a potential conflict of interest.
Publisher’s Note
All claims expressed in this article are solely those of the authors and do not necessarily represent those of their affiliated organizations, or those of the publisher, the editors and the reviewers. Any product that may be evaluated in this article, or claim that may be made by its manufacturer, is not guaranteed or endorsed by the publisher.
Acknowledgments
We are grateful for publicly available products: the assimilative atmospheric forcing data, GDAS, provided by NCEP (NCEP GDAS; https://rda.ucar.edu/datasets/ds083.3/, ds083.3; https://doi.org/10.5065/D65Q4T4Z); the high resolution global ocean analysis data from HYCOM (https://tds.hycom.org/thredds/dodsC/GLBy0.08/expt_93.0.html); the satellite-based surface temperature data from RSS (https://data.remss.com/SST/daily/).
Footnotes
- ^ https://rda.ucar.edu/datasets/ds083.3/
- ^ https://doi.org/10.5065/D65Q4T4Z
- ^ http://hycom.org/hycom/documentation
References
Arora, K., and Dash, P. (2016). Towards dependence of tropical cyclone intensity on sea surface temperature and its response in a warming world. Climate 4:30. doi: 10.3390/cli4020030
Balaguru, K., Foltz, G. R., Leung, L. R., Kaplan, J., Xu, W., Reul, N., et al. (2020). Pronounced impact of salinity on rapidly intensifying tropical cyclones. Bull. Am. Meteorol. Soc. 101, E1497–E1511. doi: 10.1175/BAMS-D-19-0303.1
Beardsley, R. C., Limeburner, R., Yu, H., and Cannon, G. A. (1985). Discharge of the Changjiang (Yangtze river) into the East China sea. Cont. Shelf Res. 4, 57–76. doi: 10.1016/0278-4343(85)90022-6
Bleck, R. (2002). An oceanic general circulation model framed in hybrid isopycnic-Cartesian coordinates. Ocean Model. 4, 55–88. doi: 10.1016/S1463-5003(01)00012-9
Chang, P. H., and Isobe, A. (2003). A numerical study on the Changjiang diluted water in the Yellow and East China Seas. J. Geophys. Res. 108, 1–17. doi: 10.1029/2002JC001749
Chang, T. Y., Chen, H., Hsiao, S. C., Wu, H. L., and Chen, W. B. (2021). Numerical analysis of the effect of binary typhoons on ocean surface waves in waters surrounding taiwan. Front. Mar. Sci. 8:749185.
Chang, Y. T., Lin, I. I., Huang, H. C., Liao, Y. C., and Lien, C. C. (2020). The Association of Typhoon Intensity Increase with Translation Speed Increase in the South China Sea. Sustainability 12:939. doi: 10.3390/su12030939
Chassignet, E. P., Hurlburt, H. E., Smedstad, O. M., Halliwell, G. R., Hogan, P. J., Wallcraft, A. J., et al. (2007). The HYCOM (hybrid coordinate ocean model) data assimilative system. J. Mar. Syst. 65, 60–83. doi: 10.1016/j.marpolbul.2011.06.026
Chen, F., and Dudhia, J. (2001). Coupling an advanced land surface–hydrology model with the Penn State–NCAR MM5 modeling system. Part I: model implementation and sensitivity. Mon. Weather Rev. 129, 569–585. doi: 10.1175/1520-0493(2001)129<0569:CAALSH>2.0.CO;2
Chen, L., Li, Y., Chen, F., Barlage, M., Zhang, Z., and Li, Z. (2019). Using 4-km WRF CONUS simulations to assess impacts of the surface coupling strength on regional climate simulation. Clim. Dyn. 53, 6397–6416. doi: 10.1007/s00382-019-04932-9
Chen, L., and Luo, Z. (2004). Interaction of typhoon and mesoscale vortex. Adv. Atmos. Sci. 21, 515–528. doi: 10.1371/journal.pone.0226366
Chu, P. C., Liu, Q., Jia, Y., and Fan, C. (2002). Evidence of a barrier layer in the Sulu and Celebes Seas. J. Phys. Oceanogr. 32, 3299–3309. doi: 10.1175/1520-0485(2002)032<3299:eoabli>2.0.co;2
Cione, J. J., and Uhlhorn, E. W. (2003). Sea surface temperature variability in hurricanes: implications with respect to intensity change. Mon. Weather Rev. 131, 1783–1796. doi: 10.1175//2562.1
Craig, P. D., and Banner, M. L. (1994). Modeling wave-enhanced turbulence in the ocean surface layer. J. Phys. Oceanogr. 24, 2546–2559. doi: 10.1175/1520-0485(1994)024<2546:MWETIT>2.0.CO;2
Dai, A., Qian, T., Trenberth, K. E., and Milliman, J. D. (2009). Changes in continental freshwater discharge from 1948 to 2004. J. Clim. 22, 2773–2792. doi: 10.1175/2008JCLI2592.1
de Boyer Montégut, C., Mignot, J., Lazar, A., and Cravatte, S. (2007). Control of salinity on the mixed layer depth in the world ocean: 1. General description. J. Geophys. Res. 112:C06011. doi: 10.1029/2006JC003953
Delcroix, T., and Murtugudde, R. (2002). Sea surface salinity changes in the East China Sea during 1997–2001: influence of the Yangtze River. J. Geophys. Res. 107, SRF 9-1–SRF 9-11. doi: 10.1029/2001JC000893
DeMaria, M. (1996). The effect of vertical shear on tropical cyclone intensity change. J. Atmos. Sci. 53, 2076–2088. doi: 10.1038/nature10552
Duda, J. D., Wang, X., and Xue, M. (2017). Sensitivity of convection-allowing forecasts to land surface model perturbations and implications for ensemble design. Mon. Weather Rev. 145, 2001–2025. doi: 10.1175/MWR-D-16-0349.1
Dudhia, J. (1989). Numerical study of convection observed during the winter monsoon experiment using a mesoscale two-dimensional model. J. Atmos. Sci. 46, 3077–3107. doi: 10.1175/1520-0469(1989)046<3077:nsocod>2.0.co;2
Dutta, D., Mani, B., and Dash, M. K. (2019). Dynamic and thermodynamic upper-ocean response to the passage of Bay of Bengal cyclones ‘Phailin’and ‘Hudhud’: a study using a coupled modelling system. Environ. Monit. Assess. 191, 1–20. doi: 10.1007/s10661-019-7704-9
Egbert, G. D., and Erofeeva, S. Y. (2002). Efficient inverse modeling of barotropic ocean tides. J. Atmos. Ocean. Technol. 19, 183–204. doi: 10.1175/1520-0426(2002)019<0183:EIMOBO>2.0.CO;2
Emanuel, K. A. (1987). The dependence of hurricane intensity on climate. Nature 326, 483–485. doi: 10.1038/326483a0
Emanuel, K. A. (1999). Thermodynamic control of hurricane intensity. Nature 401, 665–669. doi: 10.1038/44326
Ffield, A. (2007). Amazon and Orinoco River plumes and NBC rings: bystanders or participants in hurricane events? J. Clim. 20, 316–333. doi: 10.1175/jcli3985.1
Foltz, G. R., and McPhaden, M. J. (2009). Impact of barrier layer thickness on SST in the central tropical North Atlantic. J. Clim. 22, 285–299. doi: 10.1175/2008JCLI2308.1
Gentemann, C. L., Meissner, T., and Wentz, F. J. (2009). Accuracy of satellite sea surface temperatures at 7 and 11 GHz. IEEE Trans. Geosci. Remote Sens. 48, 1009–1018. doi: 10.1109/TGRS.2009.2030322
Haidvogel, D. B., Arango, H., Budgell, W. P., Cornuelle, B. D., Curchitser, E., Di Lorenzo, E., et al. (2008). Ocean forecasting in terrain-following coordinates: formulation and skill assessment of the Regional Ocean Modeling System. J. Comput. Phys. 227, 3595–3624. doi: 10.1016/j.jcp.2007.06.016
Hlywiak, J., and Nolan, D. S. (2019). The influence of oceanic barrier layers on tropical cyclone intensity as determined through idealized, coupled numerical simulations. J. Phys. Oceanogr. 49, 1723–1745. doi: 10.1175/JPO-D-18-0267.1
Hong, J. S., Moon, J. H., and Kim, T. (2020). Effect of Breaking Waves on Near-Surface Mixing in an Ocean-Wave Coupling System under Calm Wind Conditions. J. Mar. Sci. Eng. 8:540. doi: 10.3390/jmse8070540
Hong, J. S., Moon, J. H., Lee, J. H., and Pang, I. C. (2016). Modeling the largest inflow of Changjiang freshwater into the Yellow Sea in 2012 with particle-tracking experiment. Ocean Sci. J. 51, 549–562. doi: 10.1007/s12601-016-0057-1
Hong, S. Y., Dudhia, J., and Chen, S. H. (2004). A revised approach to ice microphysical processes for the bulk parameterization of clouds and precipitation. Mon. Weather Rev. 132, 103–120. doi: 10.1175/1520-0493(2004)132<0103:ARATIM>2.0.CO;2
Jacob, D., Petersen, J., Eggert, B., Alias, A., Christensen, O. B., Bouwer, L. M., et al. (2014). EURO-CORDEX: new high-resolution climate change projections for European impact research. Reg. Environ. Change 14, 563–578. doi: 10.1007/s10113-013-0499-2
Jacob, R., Larson, J., and Ong, E. (2005). M× N communication and parallel interpolation in Community Climate System Model Version 3 using the model coupling toolkit. Int. J. High Perform. Comput. Appl. 19, 293–307. doi: 10.1177/1094342005056116
Janjić, Z. I. (1994). The step-mountain eta coordinate model: further developments of the convection, viscous sublayer, and turbulence closure schemes. Mon. Weather Rev. 122, 927–945. doi: 10.1175/1520-0493(1994)122<0927:tsmecm>2.0.co;2
Johns, W. E., Lee, T. N., Schott, F. A., Zantopp, R. J., and Evans, R. H. (1990). The North Brazil Current retroflection: seasonal structure and eddy variability. J. Geophys. Res. 95, 22103–22120. doi: 10.1029/jc095ic12p22103
Jones, P. W. (1998). A user’s guide for SCRIP: a spherical coordinate remapping and interpolation package. Los Alamos, NM: Los Alamos National Laboratory.
Kain, J. S. (2004). The Kain–Fritsch convective parameterization: an update. J. Appl. Meteorol. 43, 170–181. doi: 10.1175/1520-0450(2004)043<0170:tkcpau>2.0.co;2
Larson, J., Jacob, R., and Ong, E. (2005). The model coupling toolkit: a new Fortran90 toolkit for building multiphysics parallel coupled models. Int. J. High Perform. Comput. Appl. 19, 277–292. doi: 10.1177/1094342005056115
Lee, J. H., Kim, T., Pang, I. C., and Moon, J. H. (2018). 4DVAR data Assimilation with the Regional Ocean Modeling System (ROMS): impact on the Water Mass Distributions in the Yellow Sea. Ocean Sci. J. 53, 165–178. doi: 10.1007/s12601-018-0013-3
Lee, Y. C., Qin, Y. S., and Li, R. Y. (1998). Yellow sea atlas. Beijing: Chinese Academy of Sciences, 524.
Lie, H. J., Cho, C. H., Lee, J. H., and Lee, S. (2003). Structure and eastward extension of the Changjiang River plume in the East China Sea. J. Geophys. Res. 108:3077. doi: 10.1029/2001JC001194
Liu, W. T. (1988). Moisture and latent heat flux variabilities in the tropical Pacific derived from satellite data. J. Geophys. Res. 93, 6749–6760. doi: 10.1029/JC093iC06p06749
Lukas, R., and Lindstrom, E. (1991). The mixed layer of the western equatorial Pacific Ocean. J. Geophys. Res. 96, 3343–3357. doi: 10.1029/90jc01951
Mandal, M., Singh, K. S., Balaji, M., and Mohapatra, M. (2016). Performance of WRF-ARW model in real-time prediction of Bay of Bengal cyclone ‘Phailin’. Pure Appl. Geophys. 173, 1783–1801. doi: 10.1007/s00024-015-1206-7
Masson, S., and Delecluse, P. (2001). Influence of the Amazon river runoff on the tropical Atlantic. Phys. Chem. Earth B Hydrol. Oceans Atmos. 26, 137–142. doi: 10.1016/S1464-1909(00)00230-6
Mignot, J., de Boyer Montégut, C., Lazar, A., and Cravatte, S. (2007). Control of salinity on the mixed layer depth in the world ocean: 2. Tropical areas. J. Geophys. Res. 112:C10010. doi: 10.1029/2006JC003954
Mignot, J., Lazar, A., and Lacarra, M. (2012). On the formation of barrier layers and associated vertical temperature inversions: a focus on the northwestern tropical Atlantic. J. Geophys. Res. 117:C02010. doi: 10.1029/2011JC007435
Mlawer, E. J., Taubman, S. J., Brown, P. D., Iacono, M. J., and Clough, S. A. (1997). Radiative transfer for inhomogeneous atmospheres: RRTM, a validated correlated-k model for the longwave. J. Geophys. Res. Atmos. 102, 16663–16682. doi: 10.1029/97JD00237
Moon, J. H., Hirose, N., Yoon, J. H., and Pang, I. C. (2010). Offshore detachment process of the low-salinity water around Changjiang Bank in the East China Sea. J. Phys. Oceanogr. 40, 1035–1053. doi: 10.1175/2010jpo4167.1
Moon, J. H., Kim, T., Son, Y. B., Hong, J. S., Lee, J. H., Chang, P. H., et al. (2019). Contribution of low-salinity water to sea surface warming of the East China Sea in the summer of 2016. Prog. Oceanogr. 175, 68–80. doi: 10.1016/j.pocean.2019.03.012
Moon, J. H., Pang, I. C., and Yoon, J. H. (2009). Response of the Changjiang diluted water around Jeju Island to external forcings: a modeling study of 2002 and 2006. Cont. Shelf Res. 29, 1549–1564. doi: 10.1016/j.csr.2009.04.007
Mooney, P. A., Mulligan, F. J., Bruyère, C. L., Parker, C. L., and Gill, D. O. (2019). Investigating the performance of coupled WRF-ROMS simulations of Hurricane Irene (2011) in a regional climate modeling framework. Atmos. Res. 215, 57–74. doi: 10.1016/j.atmosres.2018.08.017
Müller-Karger, F. E., McClain, C. R., Fisher, T. R., Esaias, W. E., and Varela, R. (1989). Pigment distribution in the Caribbean Sea: observations from space. Prog. Oceanogr. 23, 23–64. doi: 10.1016/0079-6611(89)90024-4
National Centers for Environmental Prediction/National Weather Service/NOAA/U.S. Department of Commerce (2015). updated daily. NCEP GDAS/FNL 0.25 Degree Global Tropospheric Analyses and Forecast Grids. Research Data Archive at the National Center for Atmospheric Research, Computational and Information Systems Laboratory. Available Online at: https://doi.org/10.5065/D65Q4T4Z (accessed 20 July 2020). doi: 10.5065/D65Q4T4Z
Newinger, C., and Toumi, R. (2015). Potential impact of the colored A mazon and O rinoco plume on tropical cyclone intensity. J. Geophys. Res. 120, 1296–1317. doi: 10.1002/2014jc010533
Pailler, K., Bourlès, B., and Gouriou, Y. (1999). The barrier layer in the western tropical Atlantic Ocean. Geophys. Res. Lett. 26, 2069–2072. doi: 10.1029/1999gl900492
Park, T., Jang, C. J., Jungclaus, J. H., Haak, H., and Park, W. (2011). Effects of the Changjiang river discharge on sea surface warming in the Yellow and East China Seas in summer. Cont. Shelf Res. 31, 15–22. doi: 10.1016/j.csr.2010.10.012
Prakash, K. R., Nigam, T., and Pant, V. (2018). Estimation of oceanic subsurface mixing under a severe cyclonic storm using a coupled atmosphere–ocean–wave model. Ocean Sci. 14, 259–272. doi: 10.5194/os-14-259-2018
Reul, N., Chapron, B., Lee, T., Donlon, C., Boutin, J., and Alory, G. (2014). Sea surface salinity structure of the meandering Gulf Stream revealed by SMOS sensor. Geophys. Res. Lett. 41, 3141–3148. doi: 10.1002/2014GL059215
Ricchi, A., Miglietta, M. M., Barbariol, F., Benetazzo, A., Bergamasco, A., Bonaldo, D., et al. (2017). Sensitivity of a Mediterranean tropical-like cyclone to different model configurations and coupling strategies. Atmosphere 8:92. doi: 10.3390/atmos8050092
Rudzin, J. E., Shay, L. K., and Jaimes de la Cruz, B. (2019). The Impact of the Amazon–Orinoco River Plume on Enthalpy Flux and Air–Sea Interaction within Caribbean Sea Tropical Cyclones. Mon. Weather Rev. 147, 931–950. doi: 10.1175/MWR-D-18-0295.1
Rudzin, J. E., Shay, L. K., and Johns, W. E. (2018). The influence of the barrier layer on SST response during tropical cyclone wind forcing using idealized experiments. J. Phys. Oceanogr. 48, 1471–1478. doi: 10.1175/jpo-d-17-0279.1
Shchepetkin, A. F., and McWilliams, J. C. (2005). The regional oceanic modeling system (ROMS): a split-explicit, free-surface, topography-following-coordinate oceanic model. Ocean Model. 9, 347–404. doi: 10.1029/2007JC004602
Shen, H., Zhang, C., Xiao, C., and Zhu, J. (1998). “Change of the discharge and sediment flux to estuary in Changjiang River,” in Health of the Yellow Sea, ed. C. H. Hong (Seoul: Earth Love), 129–148.
Skamarock, W. C., Klemp, J. B., Dudhia, J., Gill, D. O., Barker, D. M., Duda, M. G., et al. (2008). G.: a description of the Advanced Research WRF version 3. In NCAR Tech. Note NCAR/TN-475+ STR. Boulder: Mesoscale and Microscale Meteorology Division, National Center for Atmospheric Research.
Sprintall, J., and Tomczak, M. (1992). Evidence of the barrier layer in the surface layer of the tropics. J. Geophys. Res. 97, 7305–7316. doi: 10.1029/92jc00407
Sun, Y., Zhong, Z., Li, T., Yi, L., Hu, Y., Wan, H., et al. (2017). Impact of ocean warming on tropical cyclone size and its destructiveness. Sci. Rep. 7, 1–10. doi: 10.1038/s41598-017-08533-6
Sun, X., Holmes, H. A., Osibanjo, O. O., Sun, Y., and Ivey, C. E. (2017). Evaluation of surface fluxes in the WRF Model: case study for farmland in rolling terrain. Atmosphere 8:197. doi: 10.3390/atmos8100197
Umlauf, L., and Burchard, H. (2003). A generic length-scale equation for geophysical turbulence models. J. Mar. Res. 61, 235–265. doi: 10.1357/002224003322005087
Vizy, E. K., and Cook, K. H. (2010). Influence of the Amazon/Orinoco Plume on the summertime Atlantic climate. J. Geophys. Res. 115:D21112. doi: 10.1029/2010JD014049
Wang, X., Han, G., Qi, Y., and Li, W. (2011). Impact of barrier layer on typhoon-induced sea surface cooling. Dyn. Atmos. Oceans 52, 367–385. doi: 10.1016/j.dynatmoce.2011.05.002
Warner, J. C., Armstrong, B., He, R., and Zambon, J. B. (2010). Development of a coupled ocean–atmosphere–wave–sediment transport (COAWST) modeling system. Ocean Model. 35, 230–244. doi: 10.1016/j.ocemod.2010.07.010
Warner, J. C., Perlin, N., and Skyllingstad, E. D. (2008). Using the Model Coupling Toolkit to couple earth system models. Environ. Model. Softw. 23, 1240–1249. doi: 10.1016/j.envsoft.2008.03.002
Warner, J. C., Sherwood, C. R., Arango, H. G., and Signell, R. P. (2005). Performance of four turbulence closure models implemented using a generic length scale method. Ocean Model. 8, 81–113. doi: 10.1016/j.ocemod.2003.12.003
Wenta, M., and Herman, A. (2019). Area-averaged surface moisture flux over fragmented sea ice: floe size distribution effects and the associated convection structure within the atmospheric boundary layer. Atmosphere 10:654. doi: 10.3390/atmos10110654
Wu, C. R., Chang, Y. L., Oey, L. Y., Chang, C. W. J., and Hsin, Y. C. (2008). Air-sea interaction between tropical cyclone Nari and Kuroshio. Geophys. Res. Lett. 35:L12605. doi: 10.1029/2008GL033942
Wu, H., Zhu, J., Shen, J., and Wang, H. (2011). Tidal modulation on the Changjiang River plume in summer. J. Geophys. Res. 116:C08017. doi: 10.1029/2011JC007209
Yan, Y., Li, L., and Wang, C. (2017). The effects of oceanic barrier layer on the upper ocean response to tropical cyclones. J. Geophys. Res. 122, 4829–4844. doi: 10.1002/2017JC012694
Keywords: typhoon intensity, Changjiang River, atmosphere-ocean coupling, barrier layer, vertical mixing
Citation: Hong J-S, Moon J-H, Kim T, You SH, Byun K-Y and Eom H (2022) Role of Salinity-Induced Barrier Layer in Air-Sea Interaction During the Intensification of a Typhoon. Front. Mar. Sci. 9:844003. doi: 10.3389/fmars.2022.844003
Received: 27 December 2021; Accepted: 07 February 2022;
Published: 01 March 2022.
Edited by:
Zhiyu Liu, Xiamen University, ChinaReviewed by:
Han Zhang, Second Institute of Oceanography, Ministry of Natural Resources, ChinaKarthik Balaguru, Pacific Northwest National Laboratory (DOE), United States
Copyright © 2022 Hong, Moon, Kim, You, Byun and Eom. This is an open-access article distributed under the terms of the Creative Commons Attribution License (CC BY). The use, distribution or reproduction in other forums is permitted, provided the original author(s) and the copyright owner(s) are credited and that the original publication in this journal is cited, in accordance with accepted academic practice. No use, distribution or reproduction is permitted which does not comply with these terms.
*Correspondence: Jae-Hong Moon, amhtb29uQGplanVudS5hYy5rcg==
 Ji-Seok Hong
 Jae-Hong Moon
 Taekyun Kim
 Sung Hyup You
 Kun-Young Byun2
 Hyunmin Eom