 Haiyan Zhang
 Guangyue Zhang2
 Yifan Lan
 Guisheng Song
 Hao Wei
95% of researchers rate our articles as excellent or good
Learn more about the work of our research integrity team to safeguard the quality of each article we publish.
Find out more
ORIGINAL RESEARCH article
Front. Mar. Sci. , 17 May 2022
Sec. Marine Ecosystem Ecology
Volume 9 - 2022 | https://doi.org/10.3389/fmars.2022.842394
Jellyfish blooms have become a marine environmental issue with detrimental effects on marine ecosystems around the world. The jellyfish Aurelia aurita is one of dominant species of blooms worldwide and also in the Bohai and Yellow Seas (BYSs) of China. To investigate population dynamics and controlling factors on population biomass, a complex population-dynamic model is developed for jellyfish of A. aurita in the BYSs that includes three components, namely, a three-dimensional coupled physical–biogeochemical model, a Lagrangian particle-tracking model, and an energy balance model for the jellyfish life cycle. By comparison, the model well reproduces the individual growth and seasonal evolution of A. aurita population. During individual growth period, the temperature is a key factor controlling growth and dry weight, characterized by a nearly linear growth rate. Longer period tends to favor larger medusa size and further to promote the biomass. The yearly peak biomass shows interannual variations that are controlled by the jellyfish magnitude, food concentration, and effective accumulative temperature of growth, with their contributions quantified through statistical analyses. Only considering the effect of temperature, the yearly peak biomass can be obtained through the durations of suitable temperature ranges for strobilization and individual growth that determines the magnitude and the averaged individual weight, respectively, with longer strobilation duration leading to higher magnitude. The simplified statistical relationships would favor to understand the temperature control on population dynamics of A. aurita.
In recent decades, jellyfish blooms in coastal waters have increased significantly and become a marine environmental issue of global concern, which are considered to be associated with both intensive human activities and climate change (Purcell et al., 2007; Richardson et al., 2009; Sun et al., 2015). Jellyfish blooms can cause detrimental consequences for the marine fishery, industry, and tourism, such as predation to fish eggs and larva, competition with fish for food, clogging cooling water intakes of coastal power plants, and stinging tourist by venomous species (Purcell et al., 2007; Richardson et al., 2009; Zhang et al., 2017; Sun et al., 2019). In coastal seas of China, jellyfish blooms have been one of the most severe marine ecological problems (e.g., eutrophication, harmful algal blooms, and hypoxia), with dominant species of Aurelia aurita, Cyanea nozakii, and Nemopilema nomurai (Dong et al., 2010; Zhang et al., 2017). As one of the common species, A. aurita has a worldwide distribution in neritic waters between 70°N and 40°S (Lucas, 2001) and causes jellyfish blooms in the Bohai and Yellow Seas (BYSs) of China (Dong et al., 2010; Dong et al., 2015).
The life history of A. aurita includes complex strategies in which there are three main stages: the pelagic planula stage, the benthic polyp stage, and the pelagic ephyrae and medusa stage (Lucas, 2001). During the life cycle, the availability of hard substrate is of key importance for the settlement success of planula and the living of the polyp stage; temperature and food are considered the key influence factors on reproduction and growth of A. aurita (Lucas, 2001; Møller and Riisgård, 2007; Shi et al., 2016), while salinity has no significant impact on A. aurita in coastal seas of China (Fu et al., 2011). The suitable temperature for strobilation offshore China is 10°C–20°C (Wang, 2013; Wang and Sun, 2015), with the intensive strobilation at 12°C–13°C (Wang, 2013; Shi et al., 2016). Temperature can also affect the growth and metabolism of ephyrae and medusa by affecting enzymatic activities, with too low temperature (<8°C) or high temperature (>30°C) causing inhibition of growth and even death (Widmer, 2005). Experiments show that 10°C–25°C is the suitable temperature range for A. aurita growth in the northern Yellow Sea (Fu et al., 2011). The growth and metabolism of A. aurita is also modulated by food, with abundant food favoring its predation (Lucas, 1996; Goldstein and Steiner, 2020). Aurelia aurita has a wide range of food, involving all available zooplankton (Ma and Fan, 1998).
Previous studies indicated general seasonal evolutions of A. aurita population in coastal areas such as fjords and lagoon in the northern hemisphere: ephyrae beginning to appear in March and April and abundance and biomass increasing since May with zooplankton (food of A. aurita) increasing and decreasing in September (Möller, 1980; Olesen et al., 1994; Bonnet et al., 2012). In coastal areas of China, the seasonal evolution of A. aurita shows a similar pattern although slight difference in timing. Based on field survey in 2011 in the Jiaozhou Bay of the Yellow Sea, ephyrae were observed in May and June and rapidly grew and developed into jellyfish from late May to early July, but its bell diameter shrank and abundance reduced in August and September (Wang and Sun, 2015). In the Bohai Sea, jellyfish medusa was observed during July to October in the Laizhou Bay and in June and July in the Liaodong Bay (Wang B. et al., 2012; Zuo et al., 2016). Nevertheless, factors influencing seasonal and even interannual variations of A. aurita population in the BYSs are poorly constrained.
Population dynamics of jellyfish have been studied widely, while they mainly focus on life history strategies (Lucas, 2001; Xie et al., 2021) and feeding, growth, respiration, and bioenergetics during the life cycle (Olesen et al., 1994; Møller and Riisgård, 2007; Goldstein and Steiner, 2020; Gueroun et al., 2020; Wang et al., 2021). Statistical models have been used to explore the relationship between jellyfish populations and environmental factors (e.g., temperature, salinity, and zooplankton) and further to predict the distribution of jellyfish (Kremer, 1976; Decker et al., 2007; Xu, 2009; Wang S. et al., 2012; Fernández-Alías et al., 2020). However, these statistical models cannot consider the influence of hydrodynamics. Jellyfish movement is mainly dominated by currents due to its weak swimming ability. To take into account currents, Lagrangian particle-tracking methods are utilized to simulate trajectories and distributions of jellyfish (Moon et al., 2010; Wei et al., 2015). However, the tracking method does not involve the individual growth of jellyfish nor quantify the jellyfish biomass. Therefore, a complex model including the individual growth and the movement of jellyfish is required to investigate population dynamics.
In this study, a population-dynamic model is developed to research population dynamics of A. aurita in the BYSs and explore factors controlling population variations. Based on model results, statistical relationships are established to associate the yearly peak biomass with temperature that further understand the impact of temperature on the population dynamics BYSs.
The population-dynamic model incorporates three components: a three-dimensional coupled physical–biological model that provides temperature, food, and currents to influence growth and movement of A. aurita; a Lagrangian particle-tracking model that simulates movement and determines positions of A. aurita; and an energy balance model that regulates the growth of medusa (Figure 1).
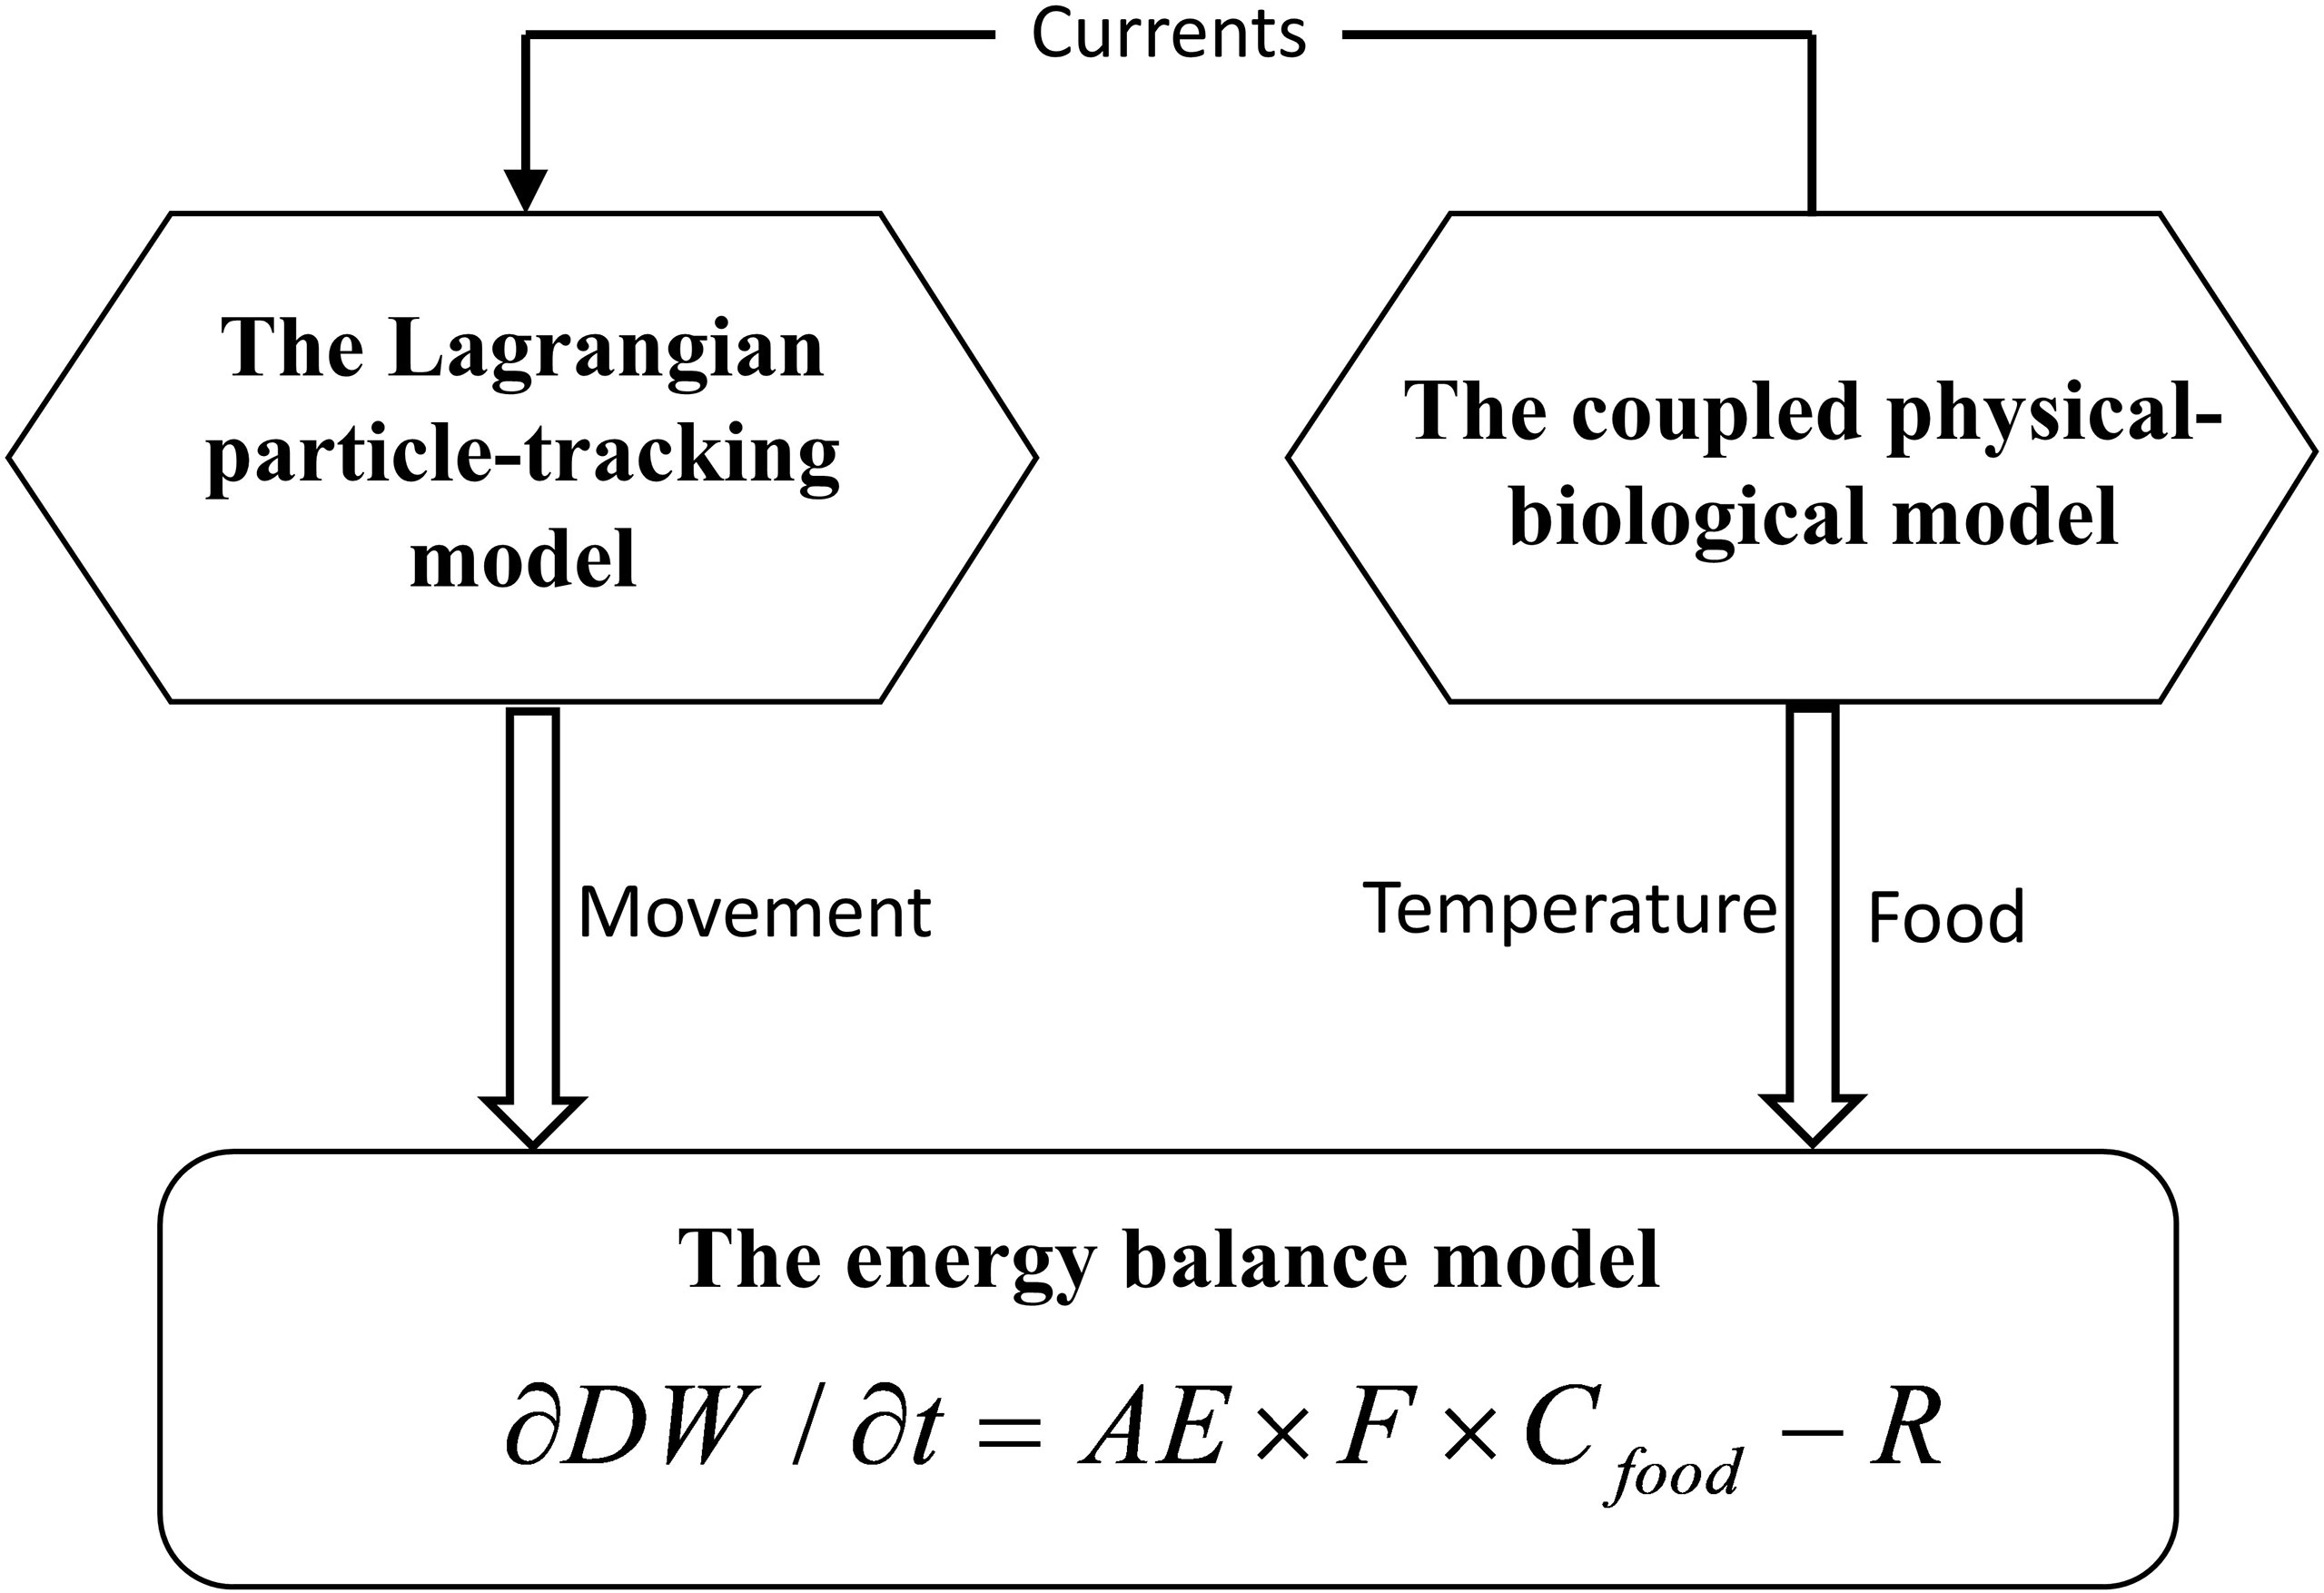
Figure 1 Schematic of the population dynamic model for jellyfish Aurelia aurita.
The coupled model includes a physical and a biological component. The physical model is configured with the Regional Ocean Modeling System (ROMS; Haidvogel et al., 2008). The model domain covers the whole BS, the Yellow Sea, and part of the East China Sea, with a horizontal resolution of 2.2 km in the northern BS and 4.8 km near the open boundary in the East China Sea. The model has 30 vertical layers with enhanced resolution near the surface and bottom. The biogeochemical model is Carbon, Silicate, and Nitrogen Ecosystem (CoSiNE; Chai et al., 2002; Xiu and Chai, 2014). The state variables include two forms of dissolved inorganic nitrogen, namely, nitrate and ammonium; phosphate; silicate; two phytoplankton functional groups, namely, picophytoplankton and diatoms; two classes of zooplankton, namely, microzooplankton and mesozooplankton; and two classes of detritus, namely, slow-sinking small detritus and fast-sinking large detritus. The microzooplankton and mesozooplankton in the model serve as food for A. aurita. More detailed model descriptions can be found in Zhang et al. (2022). The coupled model has been implemented for ecosystem research in the BYSs (Li et al., 2021a; Li et al., 2021b; Nan et al., 2022; Zhang et al., 2022).
The Lagrangian particle-tracking model is Lagrangian TRANSportmodel (LTRANS; Schlag and North, 2012), a three-dimensional offline particle tracking model that can be fully coupled to the instantaneous flow field output from the ROMS hydrodynamic model and that can simulate the motion of passive particles, sediment, or floating objects. The LTRANS model predicts the particle displacement through physical processes of advection and turbulent diffusion. In this model, the external time interval was 1 h for inputs from the physical–biological model, and the internal time interval was 20 min for movement computation. Only the horizontal movement are considered for A. aurita drift in this study.
Specific growth of A. aurita individuals is dependent on energy balance. The energy balance generally involves ingestion, respiration, and excretion that associate with temperature and food (Olesen et al., 1994; Møller and Riisgård, 2007). In previous studies, specific formula relating to energy balance and growth rate has been presented in different forms (Supplementary Table S1). Referring to Møller and Riisgård (2007), the formula for A. aurita bioenergetics in the BYSs is given as
where DW denotes dry weight, AE is assimilation efficiency, F is clearance rate, Cfood is food concentration, and R represents respiration. The dry weight (mg) can be estimated from umbrella diameter (mm) for A. aurita ephyrae and medusa. The relationship for ephyrae (Båmstedt et al., 1999) is expressed as
and the relationship for medusa (Møller and Riisgård, 2007) is
where UD is the umbrella diameter.
Expressions of terms in Eq. (1) and related processes have been deeply discussed (Uye and Shimauchi, 2005; Møller and Riisgård, 2007; Wang and Li, 2012). The formula is further expressed as
where T denotes temperature, and Cs and Cl represent microzooplankton and mesozooplankton concentrations, respectively. Parameters in Eq. (4) are given in Table 1 for ephyrae and medusa, respectively.
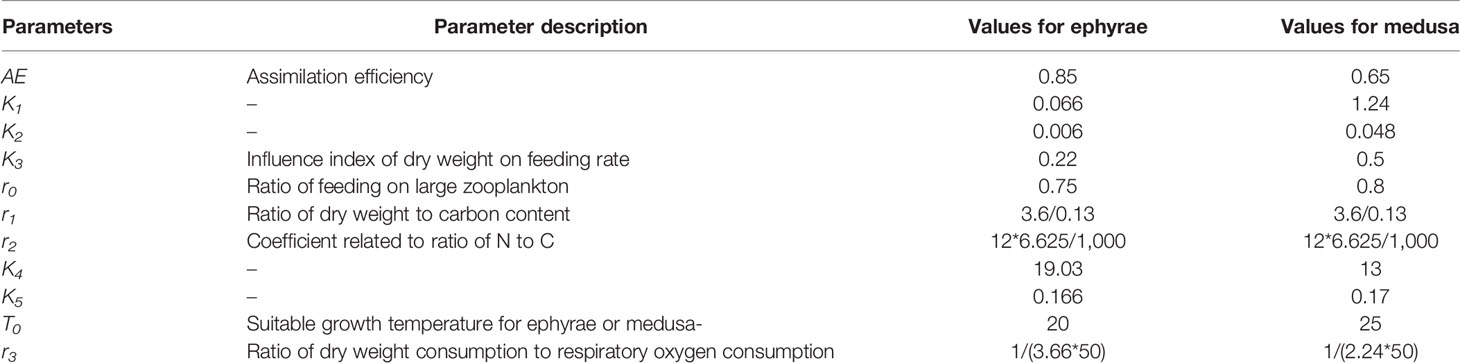
Table 1 Parameters in the formula of Aurelia aurita bioenergetics.
Coastal substrate is of key importance for the benthic polyp stage and then the ephyrae release through strobilation (Toyokawa et al., 2011; Lucas et al., 2012). To indicate possible substrate in the BYSs, the initial condition of A. aurita in the model is ephyrae released in coastal areas with water depth <10 m (Figure 2). The release of ephyrae is dependent on temperature. Referring to Wang (2013; 2015) and Shi et al. (2016), ephyrae are released when temperature is during 10°C–16°C, with intensive release at temperature of 12°C–13°C (Table 2). Based on surveys in 2011 in Jiaozhou Bay by Wang S. et al. (2012), one ephyrae particle represents 1,000 A. aurita individuals (1 particle = 1,000 A. aurita).
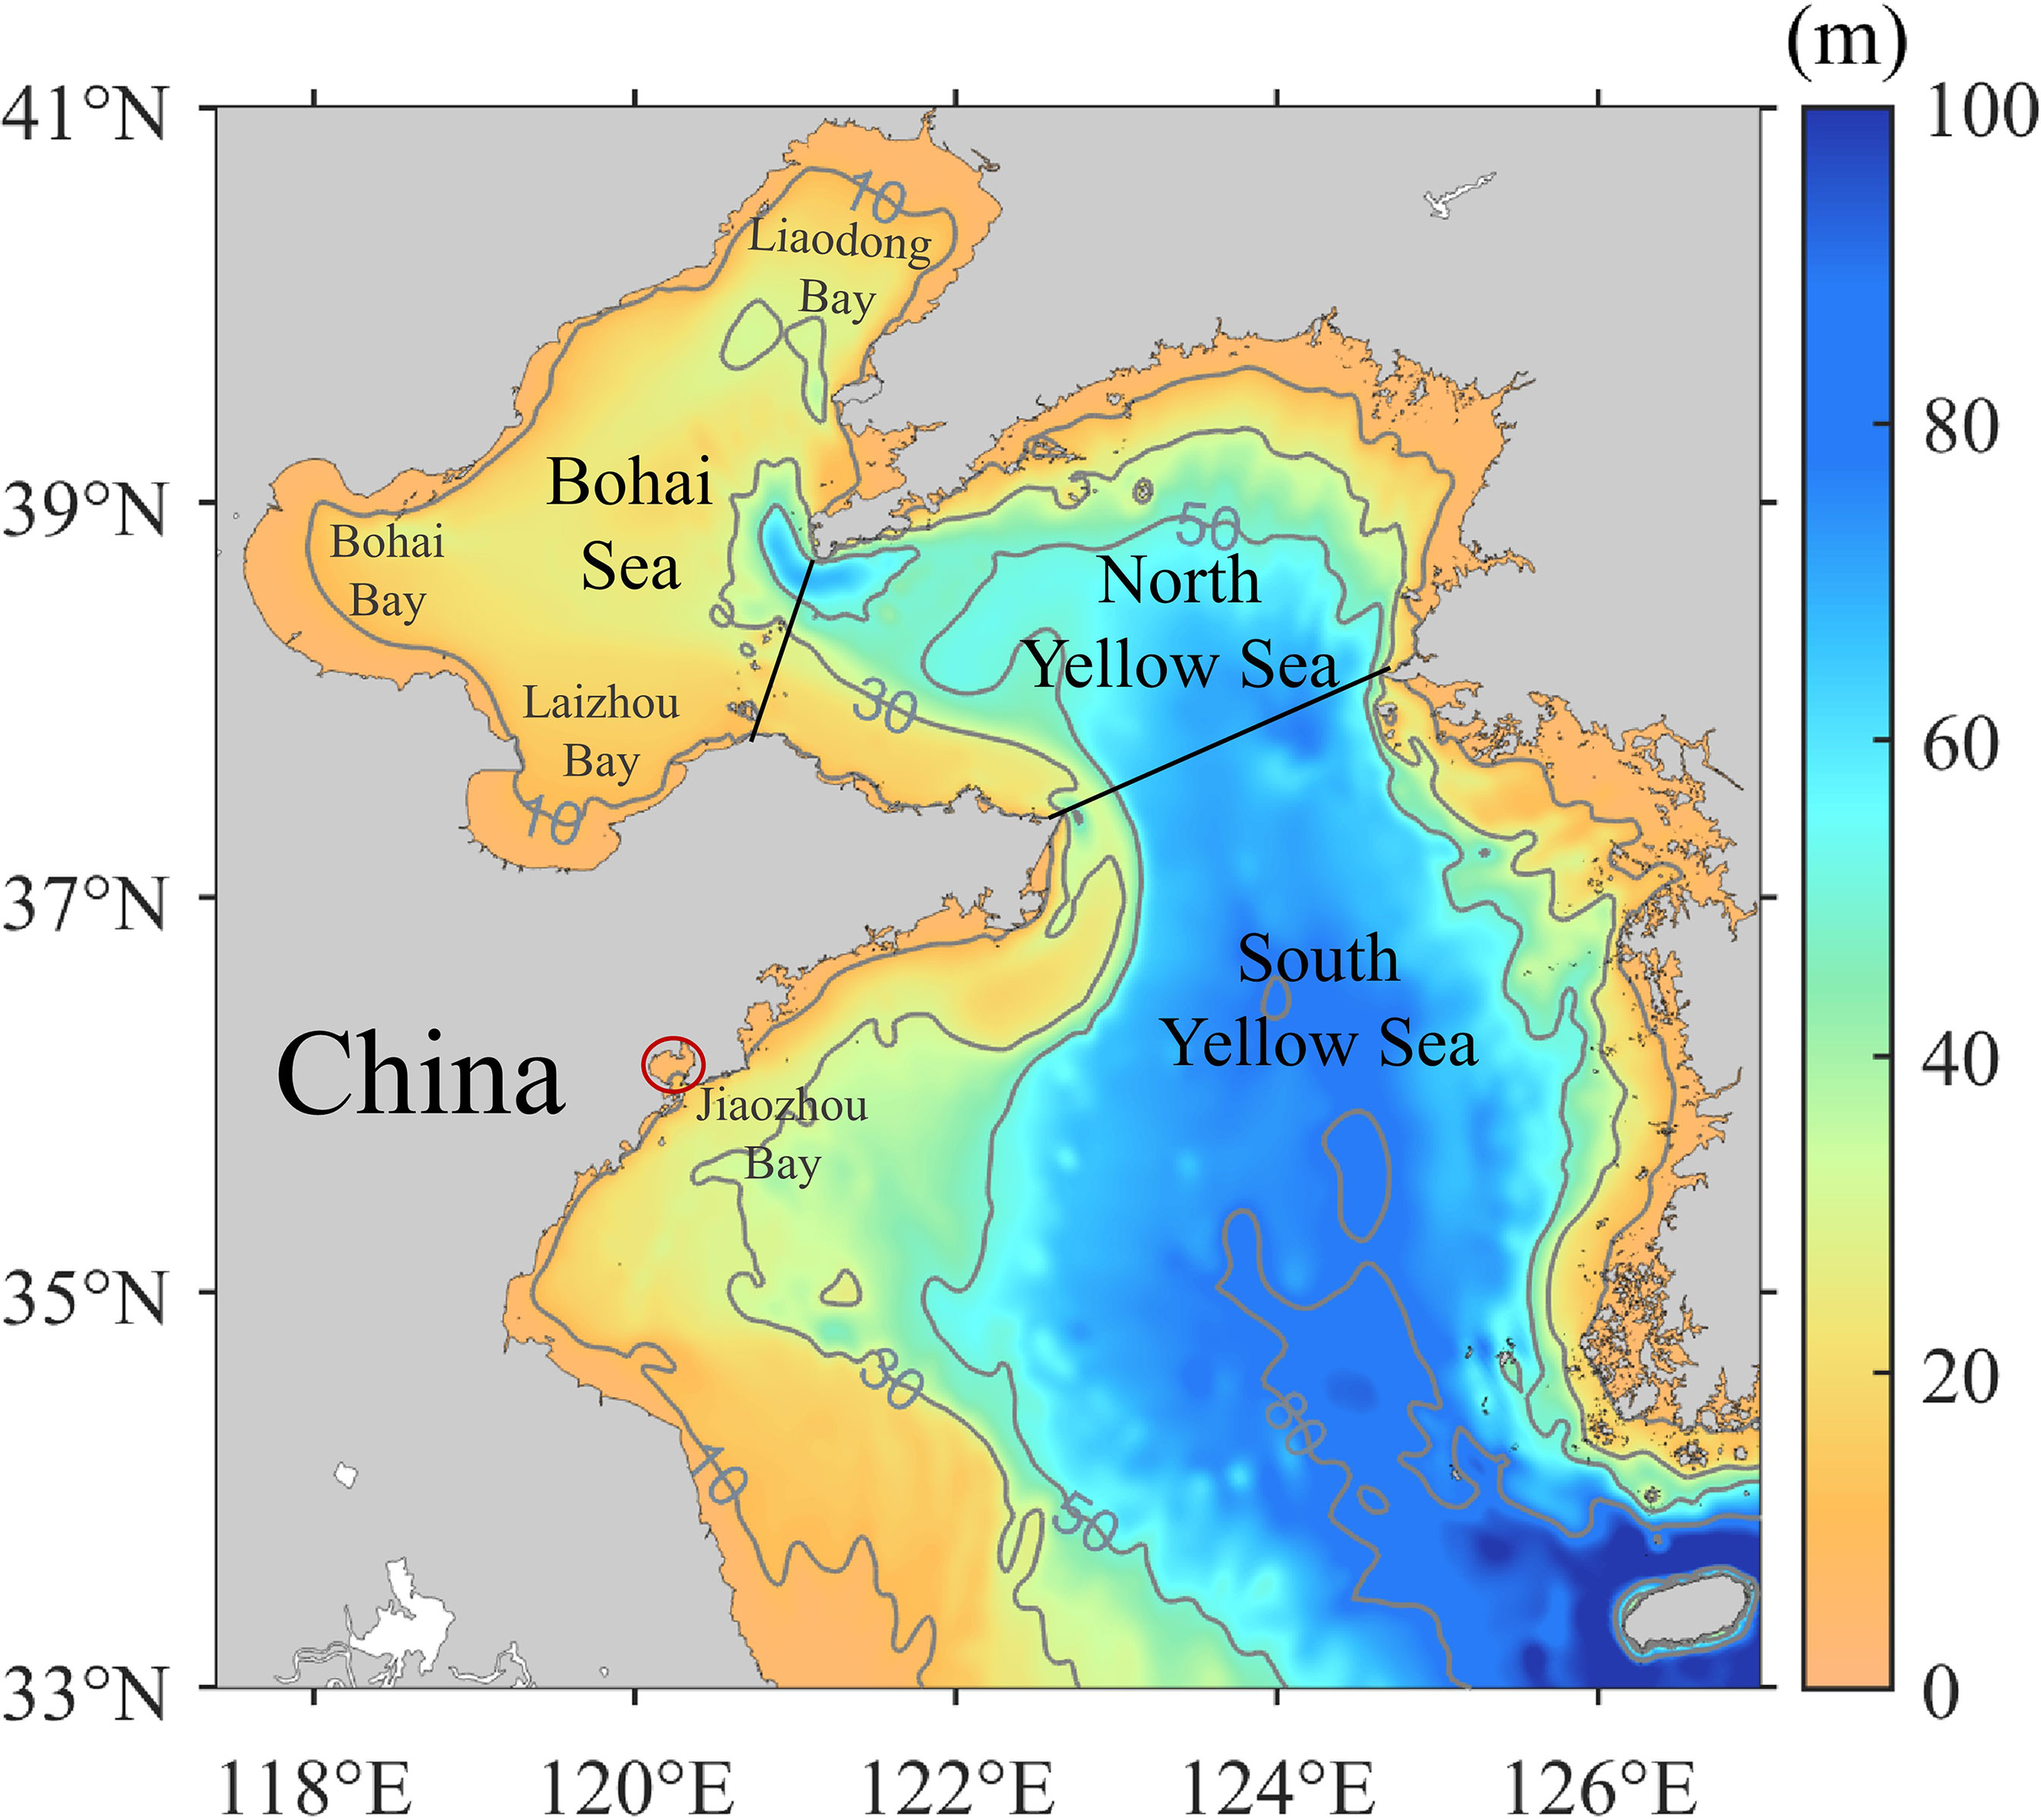
Figure 2 Bathymetry in the Bohai and Yellow Seas with isobaths in gray. Black lines denote boundaries of the seas in this study. The red circle indicates the location of the Jiaozhou Bay.
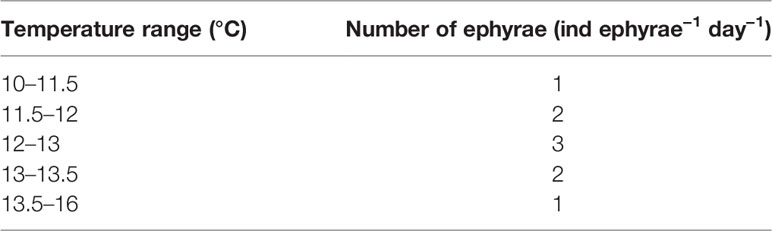
Table 2 The temperature range suitable for the strobilation of polyps and the number of ephyrae released in the model, inspired by Wang (2013; 2015) and Shi et al. (2016).
Considering that A. aurita is observed in the upper layer of the water column, particles representing ephyrae are placed in the upper layer (with depth of 3.5 m) and moved at this depth. Under influence of currents, the horizontal movement speed of A. aurita accounts for about 60% of the current velocity based on field surveys in the southwestern areas of the Korean Peninsula in the Yellow Sea (Yoon et al., 2018). Therefore, this result is used to simulate movement of A. aurita in the BYSs. The population-dynamic model is running from 2011 to 2017 with the time interval of 20 min for computation. Model outputs are saved daily for analyses. In addition, to further understand effects of temperature/currents and zooplankton on interannual variations of A. aurita population, sensitivity experiments are conducted with temperature/currents and zooplankton of 2011 repeated in these years, respectively.
Data for model validation are from laboratory experiments and field surveys. Aurelia aurita ephyrae were incubated at 18°C with food concentration of 0.1 mg C L−1 and without food in the laboratory to get the respiration and growth processes. The feeding rate of A. aurita medusae with bell diameter of 2 cm at different food concentrations was obtained by incubation experiments. Ephyrae and medusae in the experiments were sampled from the Jiaozhou Bay. Details on laboratory experiments can be found in Wang (2015). Bell diameters from May to September in 2011 were obtained by surveys conducted in the Jiaozhou Bay. Ephyrae and young medusae were selected and identified under a dissecting microscope immediately after towing and measured with a vernier caliper. For detailed descriptions, refer to Wang and Sun (2015).
The multiple linear regression method is utilized to quantify the relationship of interannual variations of A. aurita biomass with controlling factors. It is a statistical technique that uses several explanatory variables to predict the outcome of a response variable. When analyzing the links of A. aurita abundance and individual weight with temperature, one-variable linear regression is used for abundance against temperature duration suitable for strobilation, and a quadratic equation is established between the individual weight and temperature duration suitable for A. aurita growth.
Simulated respiration, growth, and feeding rate are calibrated with laboratory experiments (Figures 3A–C). DW of A. aurita ephyrae indicates an exponential decreasing trend against incubation time under respiration, with a determination coefficient of 0.86 between the simulation and laboratory experiment results. With temperature at 18°C and food concentration at 0.1 mg C L−1, DW of ephyrae rises monotonically with a determination coefficient of 0.98. The feeding rate of A. aurita medusa increases monotonically against food concentration with a determination coefficient of 0.99.
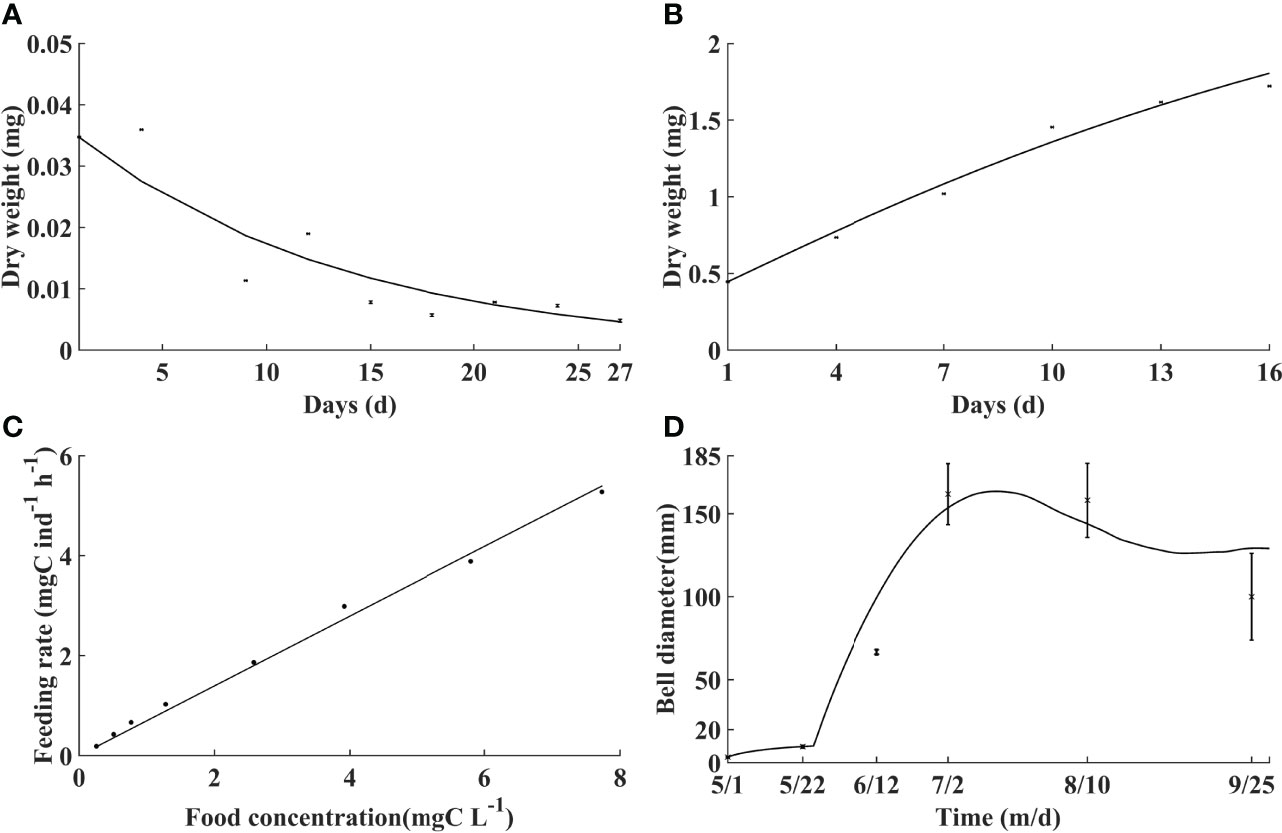
Figure 3 Comparisons of the model with laboratory experiments and field observations (black dots with/without error bars). Dry weight variation of ephyrae against time without (A) and with (B) food, feeding rate against food concentration (C), and bell diameter variation against time in the Jiaozhou Bay in 2011 (D).
Simulated bell diameter during A. aurita growth period is compared with field observations in the Jiaozhou Bay in the Yellow Sea (Figure 3D). The simulated variation of the bell diameter is similar to that of the observations. The bell diameter is overall <10 mm in early and mid-May, suggesting that the ephyrae is released shortly. It increases markedly through the end of May to July, with the maximum bell diameter of about 175 mm in mid-July. After the peak time, the bell diameter begins to decrease. The comparison suggests that the model well reproduces the individual growth of A. aurita.
Temperature, zooplankton, and currents influence strobilation, growth, movement, and further population dynamics of A. aurita. Figures 4–6 shows monthly distributions of temperature, zooplankton, and currents during April–September in 2011 to present their seasonal variations. Temperature in the upper layer (3.5 m) shows significantly seasonal fluctuations (Figure 4). In April, it is cold in most of the Bohai Sea and northern Yellow Seas with temperature of about 7°C, but relatively warm in the southern part of the Yellow Sea and coastal areas with temperature even >10°C. Considering the temperature of 10°C–16°C for strobilation, ephyrae start to be released in April. In May, temperature increases markedly with most areas >12°C but <16°C and is suitable for strobilation. Temperature continues to rise with values between 16°C and 24°C in June and July and over 24°C in August, but deceases slightly in September.
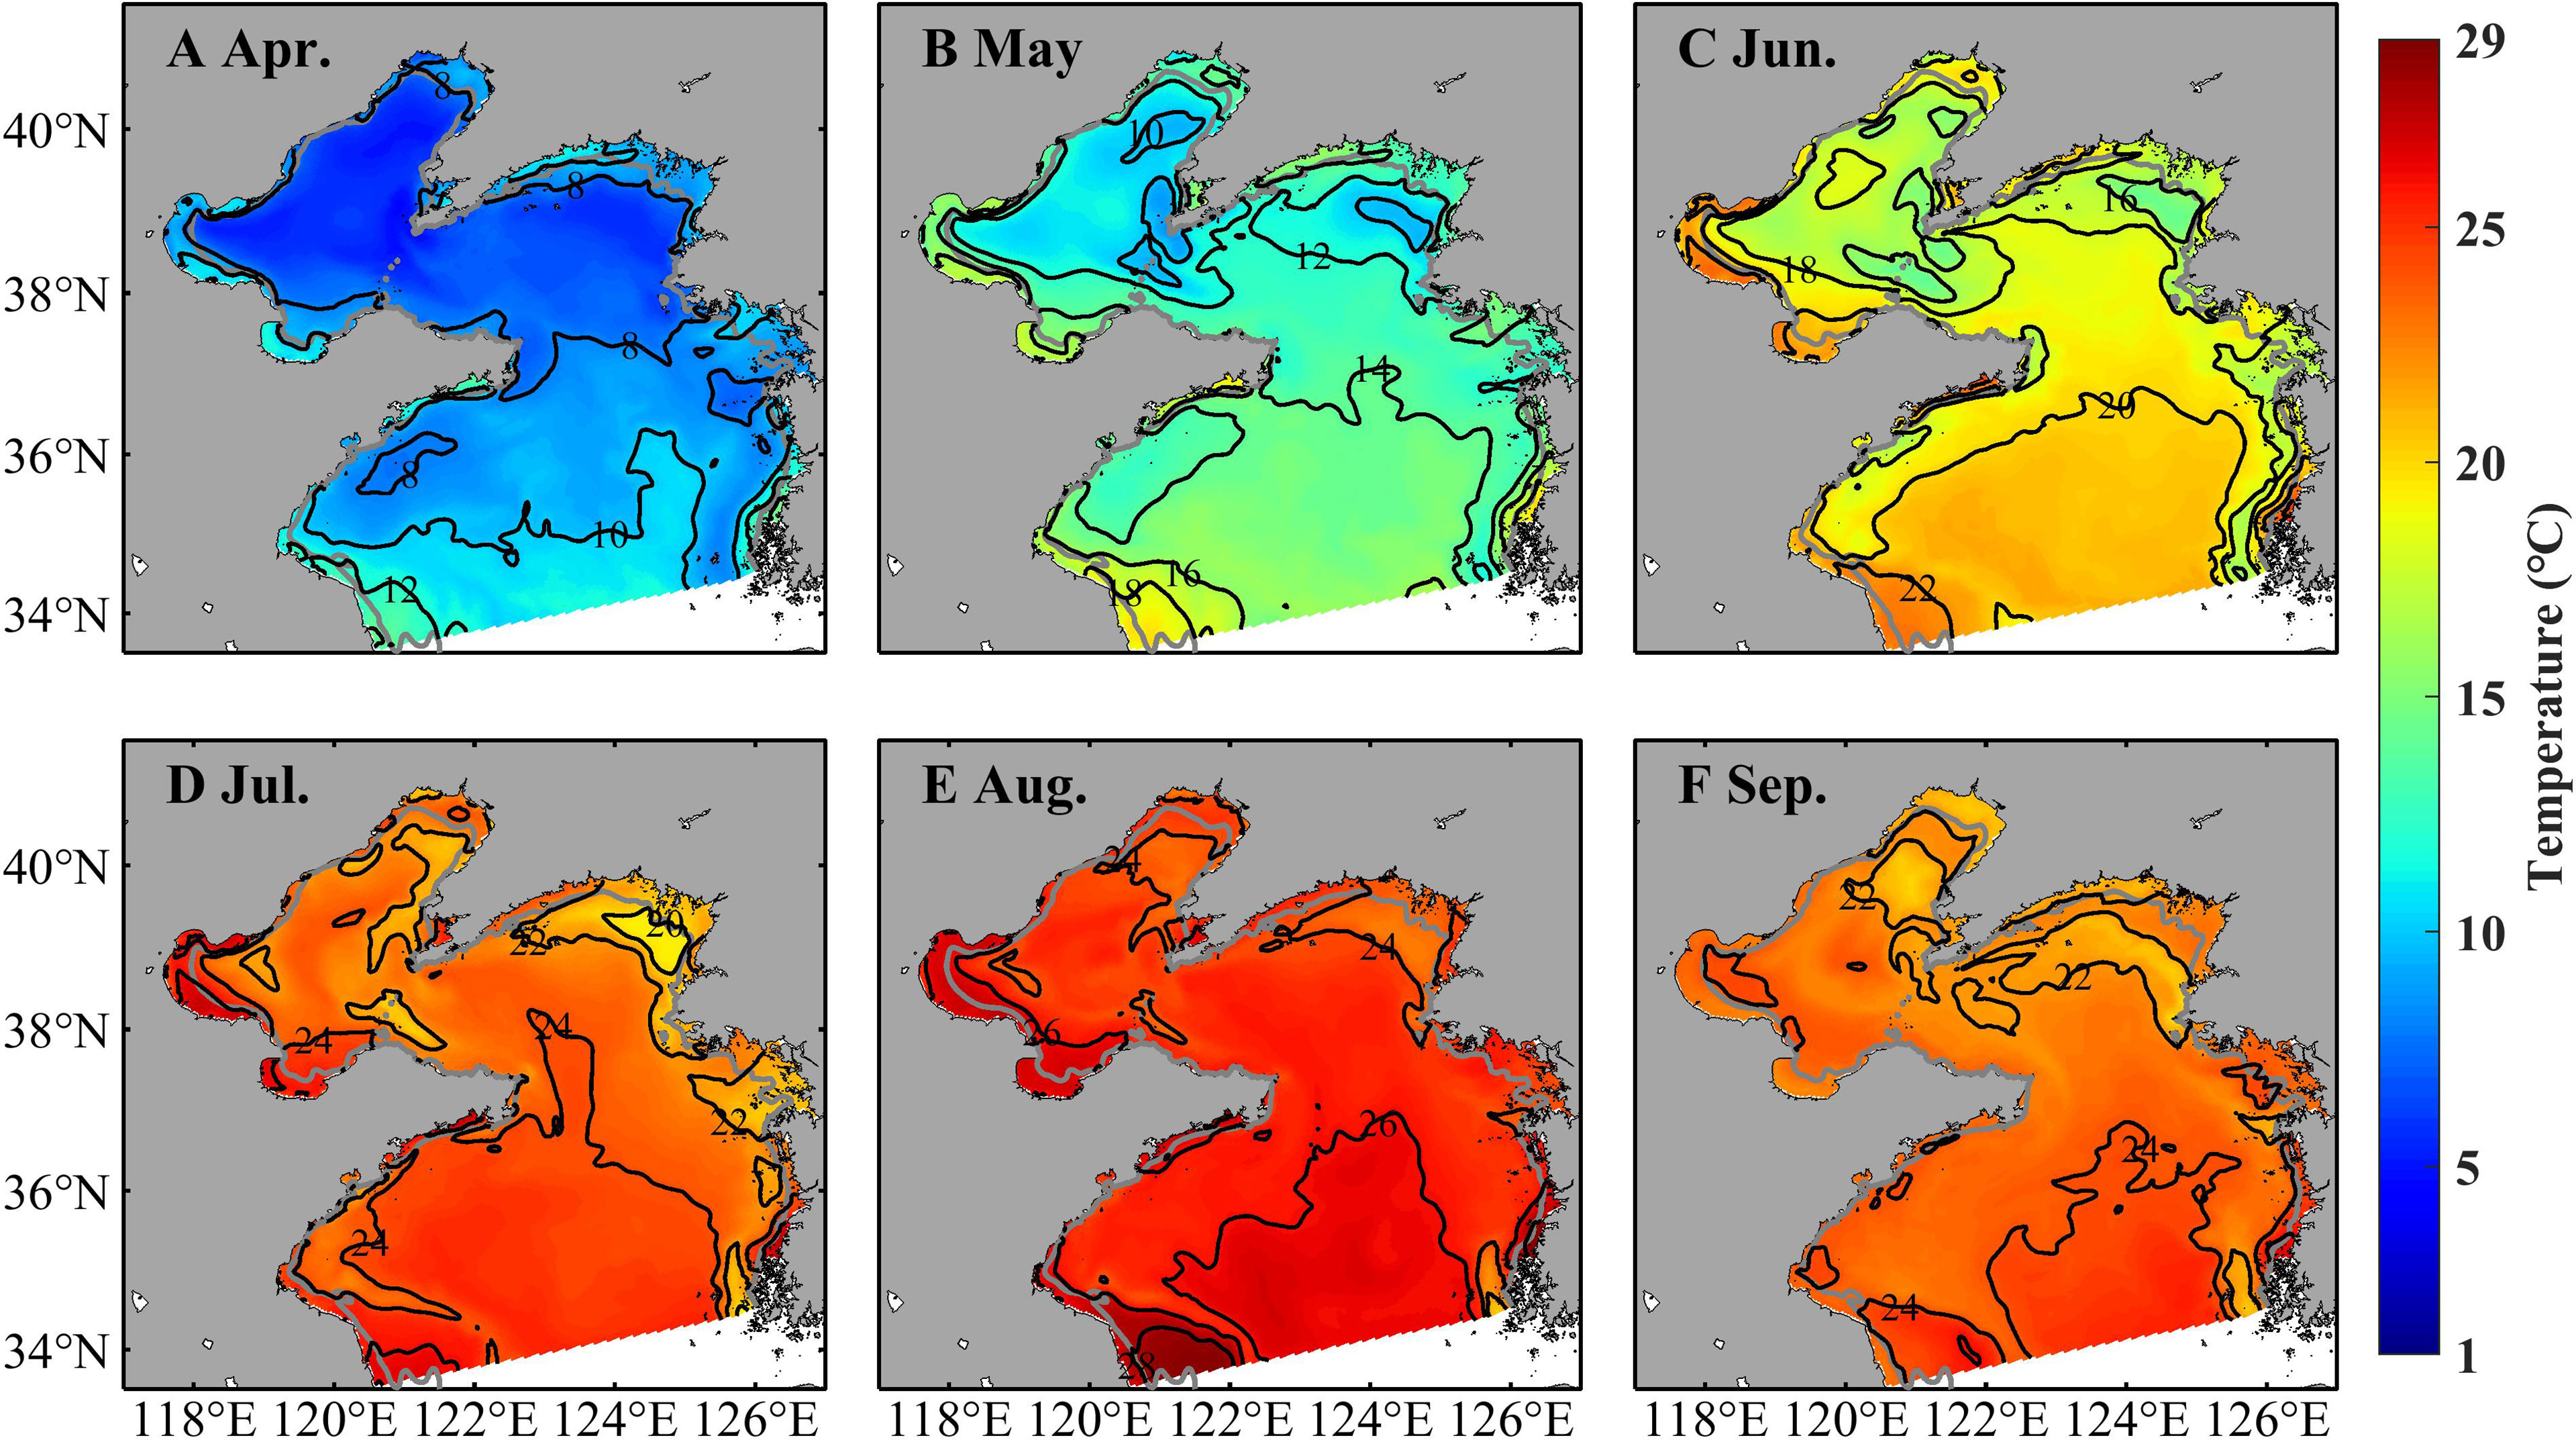
Figure 4 Simulated monthly temperature at 3.5 m in April (A), May (B), June (C), July (D), August (E), and September (F) in 2011.
Zooplankton indicates prominent spatiotemporal variations, with high concentrations in coastal areas and during June–August (Figure 5). In April, the zooplankton concentration is about 0.06 mg C L−1 in the Bohai Sea and shallower areas of the Yellow Sea and over 0.12 mg C L−1 in the vicinity of the coast. It increases in May, June, and July and maintains a high level with concentrations over 0.12 mg C L−1. The zooplankton concentration decreases in August with values over 0.06 mg C L−1 in most areas but decreases drastically in September. During April–September, strong currents occur near temperature fronts (indicated by positions with surface-bottom temperature difference of 0.2°C, Zhang et al., 2020), especially through July–September (Figure 6). In the Bohai Sea, a basin-scale anticyclonic gyre is present in the central area. Overall, the currents flow southward in the west part of the Yellow Sea and northward in the east part.
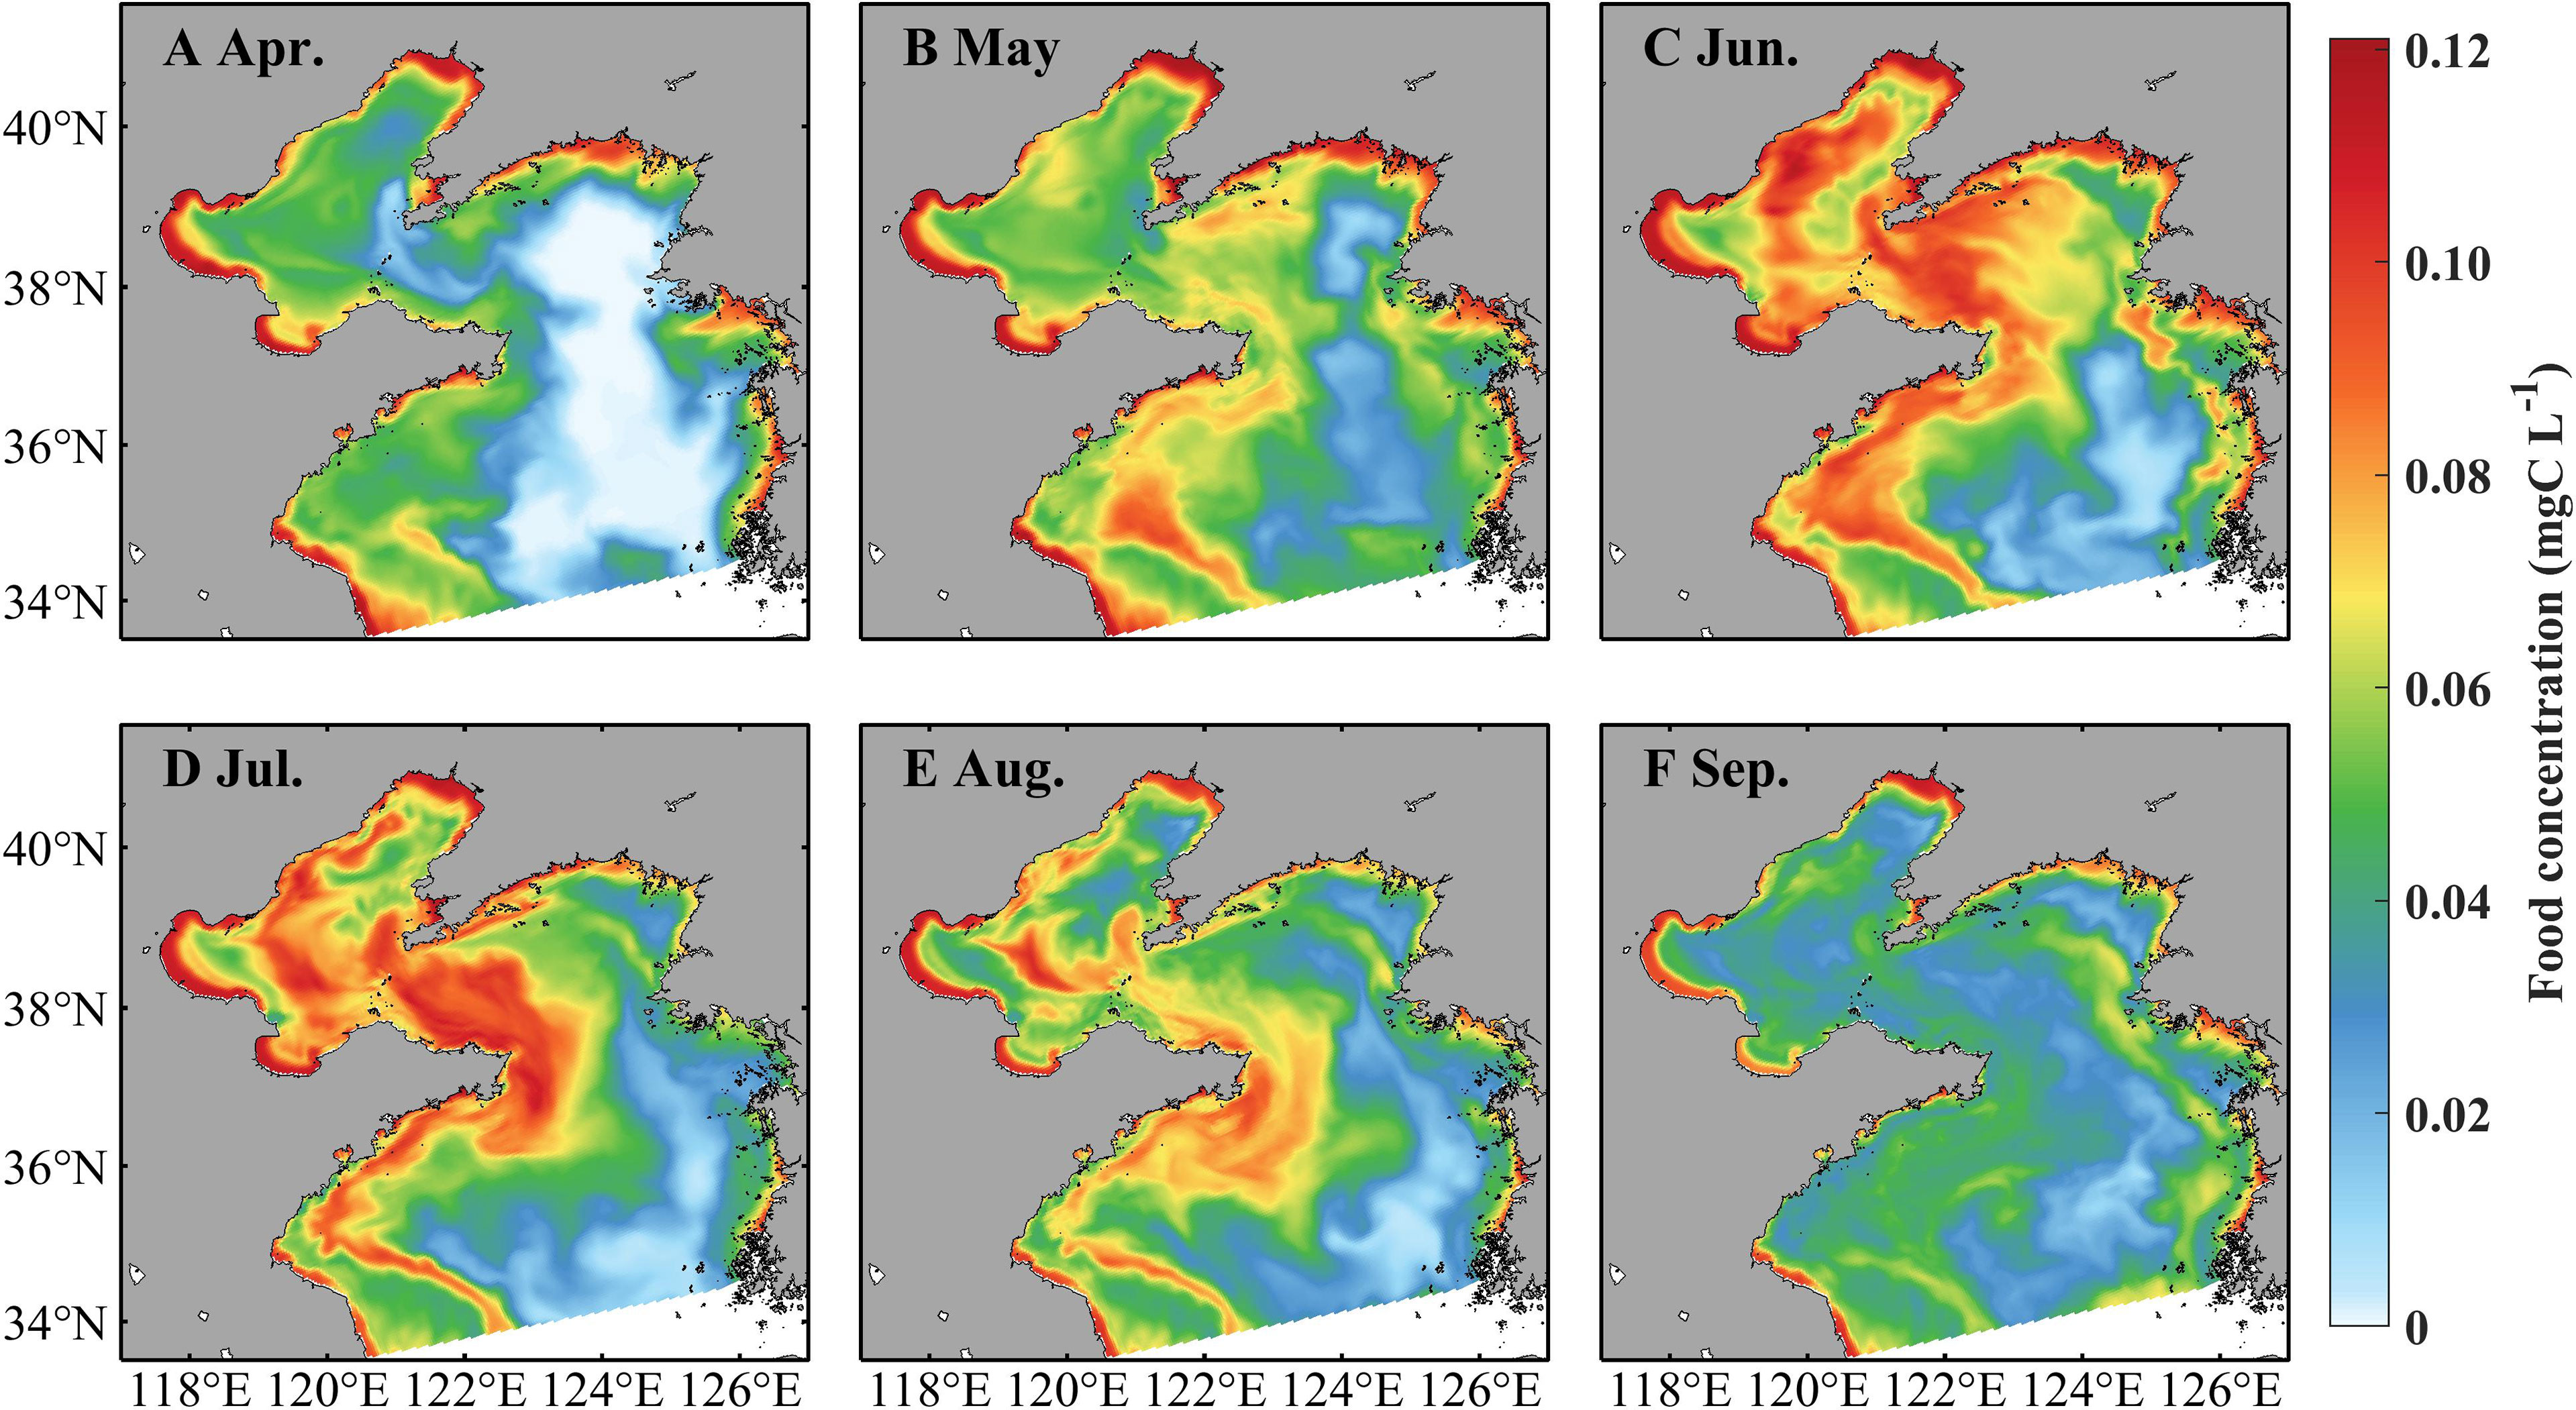
Figure 5 Simulated monthly food concentration (sum of microzooplankton and mesozooplankton) at 3.5 m in April (A), May (B), June (C), July (D), August (E), and September (F) in 2011.
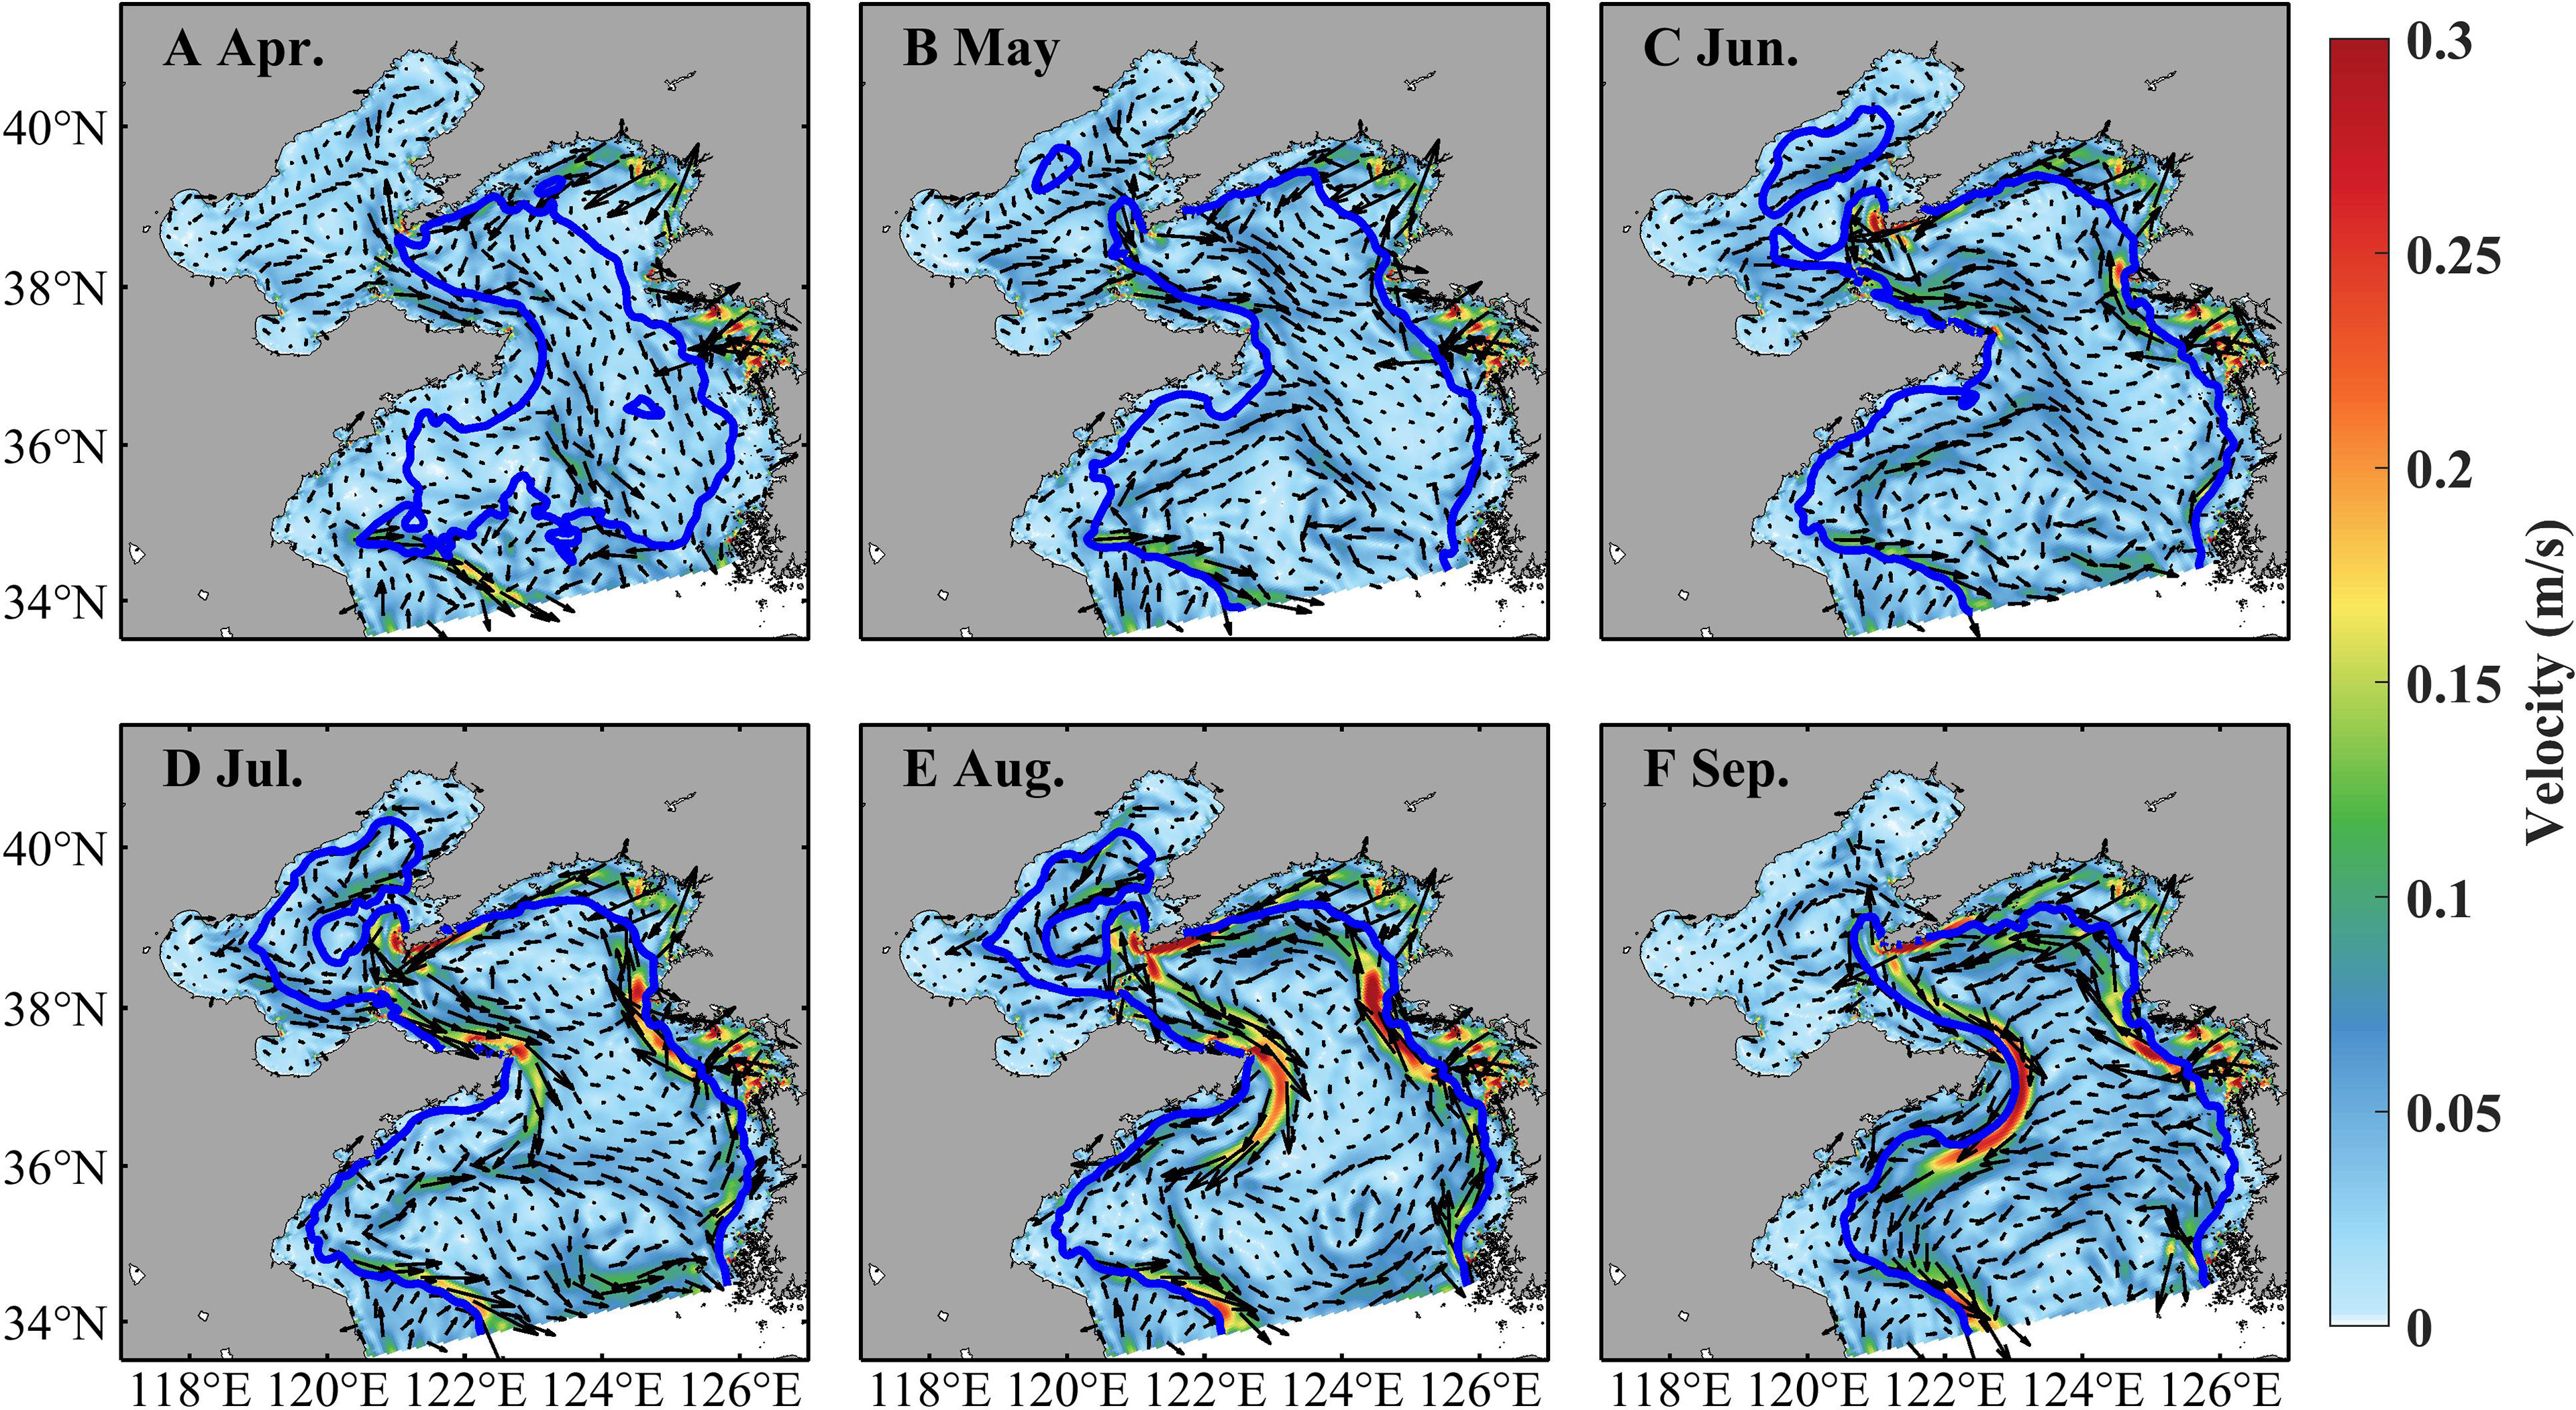
Figure 6 Simulated monthly currents at 3.5 m in April (A), May (B), June (C), July (D), August (E), and September (F) in 2011. The blue line denotes temperature front at the bottom.
Seasonal variations of A. aurita population abundance are presented in Figure 7. In April, ephyrae begin to appear in some coastal areas with low abundance. In May, the abundance becomes prominently high but still near the coast. The jellyfish is apparently dispersed during June to September that suggests the impact of currents on jellyfish distribution. The abundance presents notable spatial differences, with relatively high values more than 1,000 ind km−2 in coastal areas and the middle Bohai Sea. The bell diameter is small in April and May, increases drastically in June and July, and reaches its maximum around 18 cm in July, but then decreases in August and September (Supplementary Figure S1). The biomass, affected by the abundance and the individual size, indicates a similar variation with the bell diameter (Supplementary Figure S2). The spatial distribution of the bell diameter indicates the characteristic with relatively larger size in the more northern region and smaller size in the more southern region.
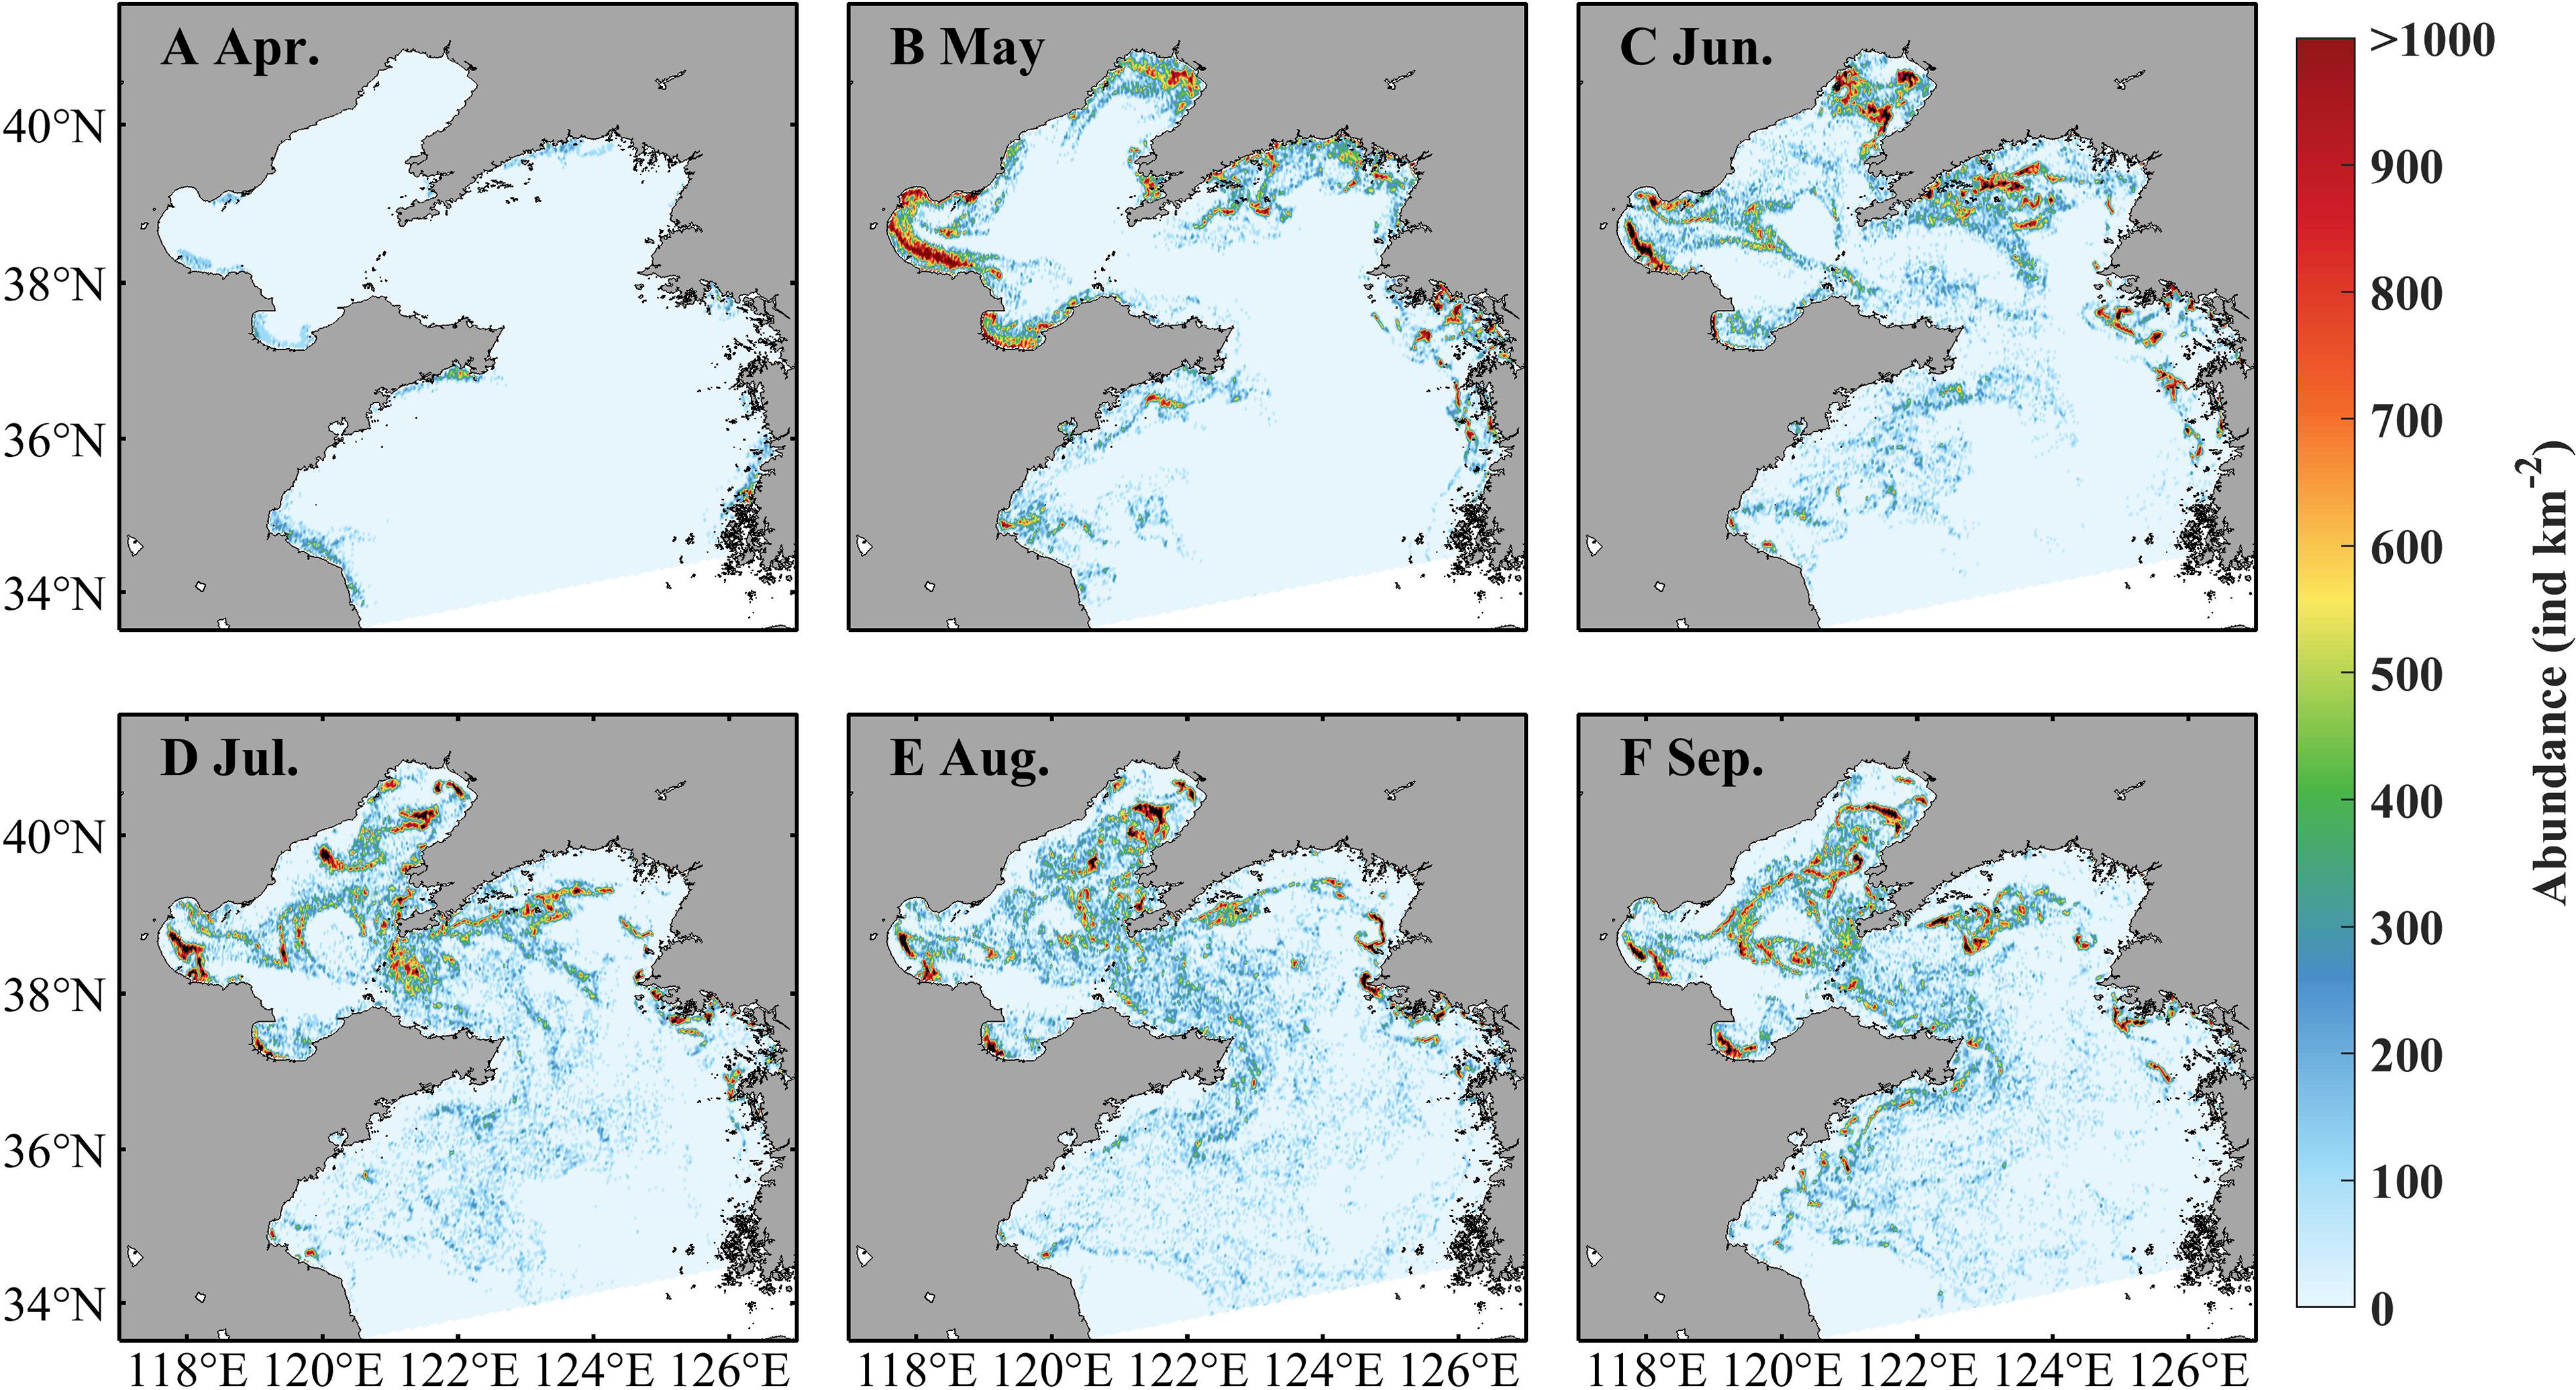
Figure 7 Simulated monthly averaged abundance of Aurelia aurita in April (A), May (B), June (C), July (D), August (E), and September (F) in 2011.
Figure 8A shows the time series of A. aurita total biomass, magnitude (total amount), food concentration, and temperature during jellyfish growth period in the BYSs. In early April, the magnitude began to increase due to ephyrae release through strobilization, with the average temperature over 10°C. The magnitude increases rapidly with the rising temperature in May. In early June, it becomes stable as the temperature reached approximately 16°C, and the strobilization is almost done in this year. Due to the low magnitude and the short period of growth, the total biomass was relatively small in April and May. The biomass increases rapidly in June as a result of the rapid growth medusa. In July, the biomass continued to increase and peaked in mid-July. After then, it gradually decreases that associates with the too high temperature and decreasing food concentrations.
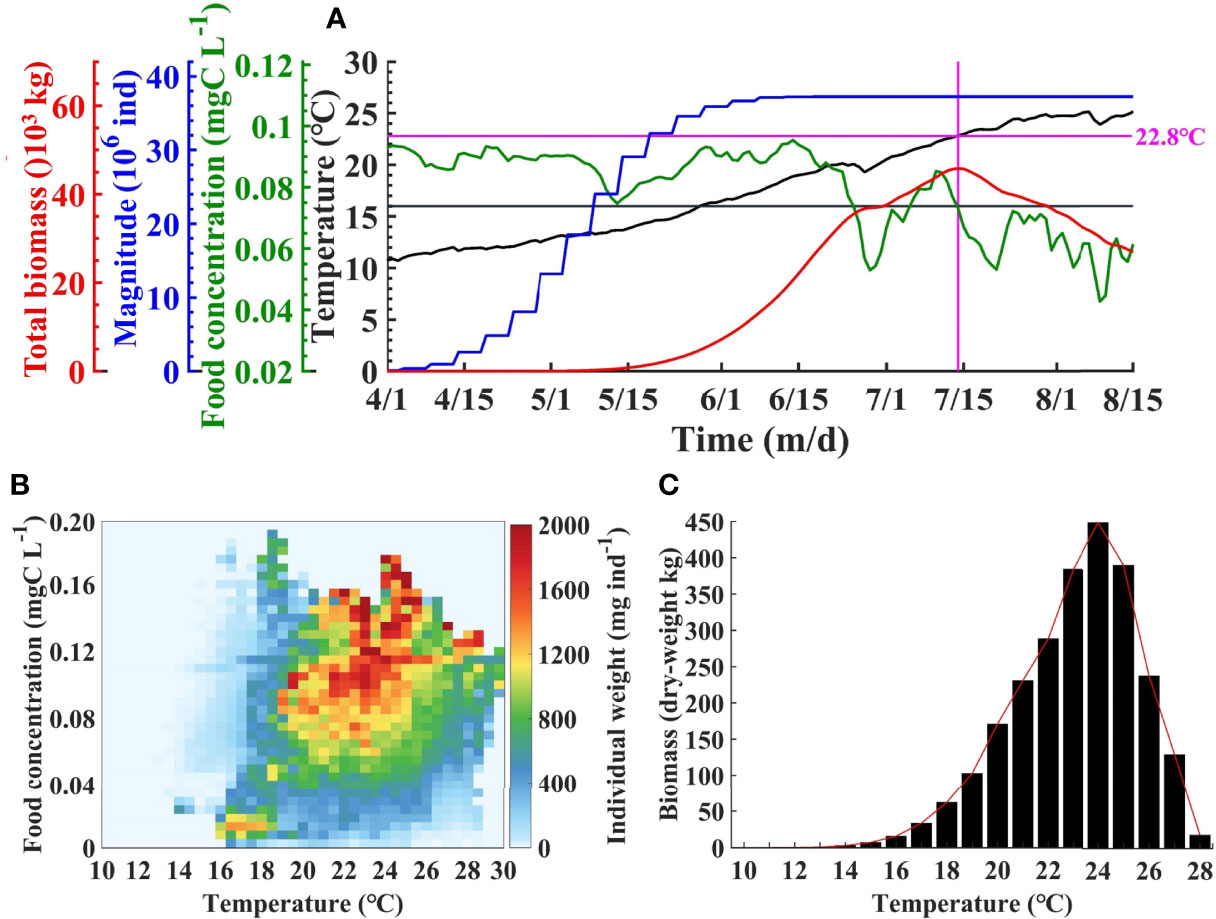
Figure 8 Time series of total biomass, magnitude, mean food concentration, and temperature in the Bohai and Yellow Seas in 2011 (A). The vertical line indicates the position of the peak biomass. Individual weight of Aurelia aurita against food concentration and temperature (B). Integrated biomass against temperature (C).
Seasonal and spatial distributions of A. aurita abundance in 2012–2017 show similar patterns with that in 2011, which reflects the principle seasonal cycle of the marine system of the BYSs (Supplementary Figures S3–S8). However, quantitative differences exist during these years. Figure 9A indicates variations of yearly peak biomass, the magnitude, and the averaged food concentration during the growth period through 2011–2017. There are notable differences in the peak biomass and the abundance, with the least biomass and abundance in 2013 and the highest biomass in 2017 and the greatest abundance in 2014.
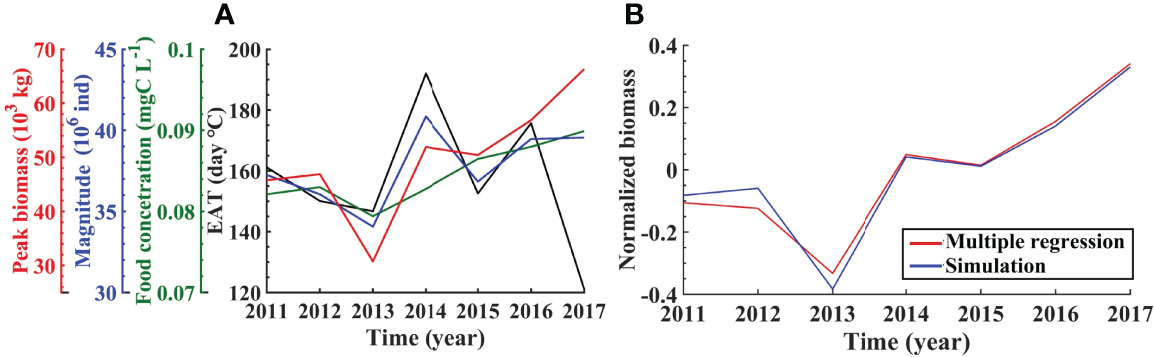
Figure 9 Interannual variations of peak biomass and corresponding magnitude, averaged food concentration during the growing period, and the effective accumulated temperature (EAT) (A), simulated and multiple-regressed interannual variations of normalized biomass (B) based on model results from 2011 to 2017.
The variations in total biomass and magnitude are not completely consistent. Relatively higher magnitude corresponds to higher biomass during 2012–2015, while this is not case in other years. It is also noted that the variation in the magnitude is <20%, while it is more than 100% for the biomass. This means that both the magnitude and the jellyfish size are important for the biomass variations. The magnitude is controlled by ephyrae release through strobilization that is related to temperature, and the jellyfish size is the result of individual growth that is affected by the food supply and temperature. Factors influencing interannual variations will be discussed in the following section.
This study develops a population-dynamic model to investigate seasonal and interannual variations of the A. aurita population in the BYSs. The model is able to reproduce metabolic processes and individual growth of jellyfish by quantitative comparison with laboratory experiments and field observations and is thus used to research population dynamics. Compared with previous modeling studies, such as the life-cycle model without movement of jellyfish (Henschke et al., 2018; Xie et al., 2021) and simulation of jellyfish movement without considering the individual growth (Moon et al., 2010; Wei et al., 2015; Wu et al., 2017), the model in this study considers both the bioenergetics and the effect of currents on movement of jellyfish A. aurita. It is also noted that the environment factors (such as temperature and zooplankton) at the jellyfish’s position determine its growth. Thus, the model attempts to simulate jellyfish dynamics in the actual ecosystem.
Nevertheless, due to the complexity of the life strategies and habitat of A. aurita and difficulties of adequate field observations, there exist shortcomings in this model. Polyps tend to settle on hard substrate in coastal shallow areas (Toyokawa et al., 2011; Lucas et al., 2012). However, the actual distribution and abundance of polyps in the BYSs is unknown. Therefore, the substrate is assumed to be evenly distributed in waters shallower than 10 m for ephyrae release through strobilation in the model. Vertical mitigation of A. aurita could exist, which is associated with temperature and/or zooplankton distribution, but it differs geographically (Barz and Hirche, 2005; Kogovsek et al., 2012). No vertical mitigation is considered in the current model. Hence, further understanding of these aspects in the BYSs would help improve the model performance.
The ephyrae of A. aurita began to appear in April, and the abundance rises rapidly in May. The biomass increased rapidly in June and peaked in July but decreased markedly in August, which is consistent with the previous general understanding of the abundance and biomass of A. aurita population in the Northern Hemisphere (Möller, 1980; Olesen et al., 1994; Bonnet et al., 2012). In coastal areas of BYSs, ephyrae are observed as early in April, and medusa is observed in June, July, and August (Wang B. et al., 2012; Wang and Sun, 2015; Xue et al., 2021). These observations are consistent with the results of simulations. Spatially, these relatively high abundance and biomass in three bays of the Bohai Sea are in agreement with field observations (Zuo et al., 2016; Wang et al., 2020). In addition, the simulated spatial distribution in these years also indicates aggregation near Hongyanhe Power Plant at the east coast of the Liaodong Bay where jellyfish including A. aurita clogged the cooling water intakes repeatedly in summer (Sun et al., 2019; Zhang et al., 2019).
In order to explore the key influencing factors on the individual growth of A. aurita, the relationship between the average individual dry weight (IW) and food concentration and temperature is statistically analyzed (Figure 8B). It is indicated that the relatively higher IW corresponds to a certain range of food concentration and temperature (Figure 5A). Overall, when the temperature was >16°C, the IW began to increase significantly. The IW is kept in relatively high levels with temperatures between 16°C and 26°C and food concentration >0.06 mg C L−1. By integration of IW along food concentration, Figure 8C shows the variation of the biomass with temperature. The biomass is quite low with slow increasing rate when temperature is lower than 16°C, increases almost linearly during 16°C–24°C with peak at 24°C, and begins to decrease drastically as temperature continues to rise. When the temperature reaches 28°C, the biomass just remains <5% of the peak.
It is suggested that 16°C–24°C is a suitable temperature range for individual growth of A. aurita in the BYSs, characterized by a nearly linear growth rate against temperature. Longer duration of this range would promote individual growth and therefore higher biomass of A. aurita population. Specifically in the BYSs, the duration is 51, 50, and 45 days for the Bohai Sea, the North Yellow Sea, and the South Yellow Sea (Table 3). The corresponding bell diameter is 11.5, 10.7, and 10.2 cm, respectively, suggesting the effect of duration for growth on the individual size. The characteristic of relatively larger size in the more northern region and smaller size in the more southern region is in agreement with observations (Wang et al., 2020).
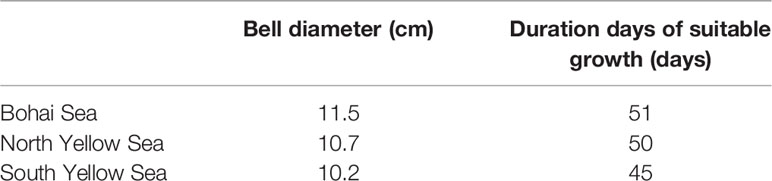
Table 3 The duration days of SST suitable for the growth of Aurelia aurita and the bell diameter of Aurelia aurita in the Bohai and Yellow Seas.
To further analyze influencing factors on interannual variations in the biomass, a statistical relationship is established between the biomass and the abundance, effective accumulated temperature (EAT), and the food concentration. The EAT here is defined as the sum of mean temperature subtracting 16°C at jellyfish positions during the growth period from the start time of 16°C to time of the biomass peak. The food concentration is also averaged during this period. First, normalize these four variables through dividing the anomalies by the mean values through years of 2011–2017. Then, get the relationship by the multiple regression method. The regression equation is given as
where pW denotes the normalized biomass; pT, pF, and pN are normalized EAT, food concentration, and the abundance, with the determination coefficient R2 over 0.9 (Figure 9).
The contributions of pT, pF, and pN to interannual variations of pW are quantified in Table 4, indicating their different roles in different years. The biomass shows the lowest in 2013, with the normalized value of −33.4% in which pT, pF, and pN account for 2.3%, −14.8%, and −20.9%, respectively. Therefore, the relatively less magnitude, dependent on strobilization of ephyrae, is mainly responsible for the lowest biomass in 2013, followed by the food concentration. The highest biomass in 2017 corresponds to a normalized value of 34%, with pT, pF, and pN accounting for 15.6%, 10.4%, and 8.0% respectively, suggesting the consistent contribution of the EAT, food concentration, and the abundance. Sensitivity experiments further confirm the combined effects of these factors on interannual variations (Supplementary Figure S9).
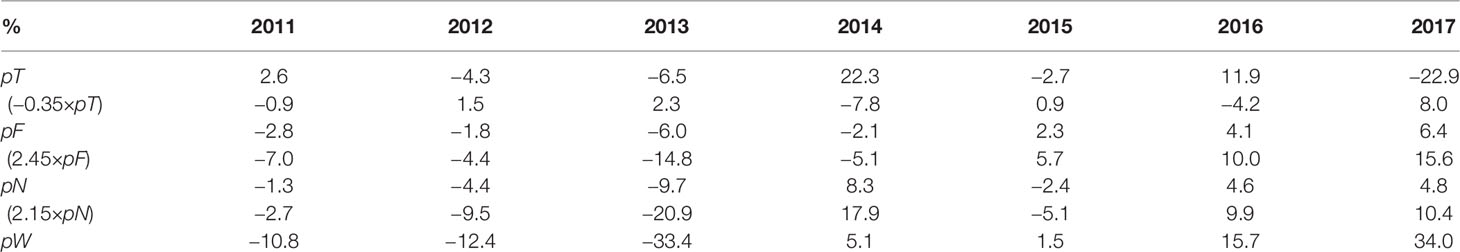
Table 4 Contributions of EAT, food, and the abundance to interannual variations of the yearly peak biomass during 2011–2017.
If only considering the effect of temperature, another statistical method is introduced. As the biomass is the product of the magnitude and the averaged IW, the magnitude and the averaged IW at the timing of the biomass peak can be singly regressed against temperature-related variables, respectively. The abundance is mainly determined by strobilization of ephyrae. Hence, the abundance is linearly regressed against the duration of the temperature for strobilization (10°C–16°C) (Figure 10A). The equation is given as
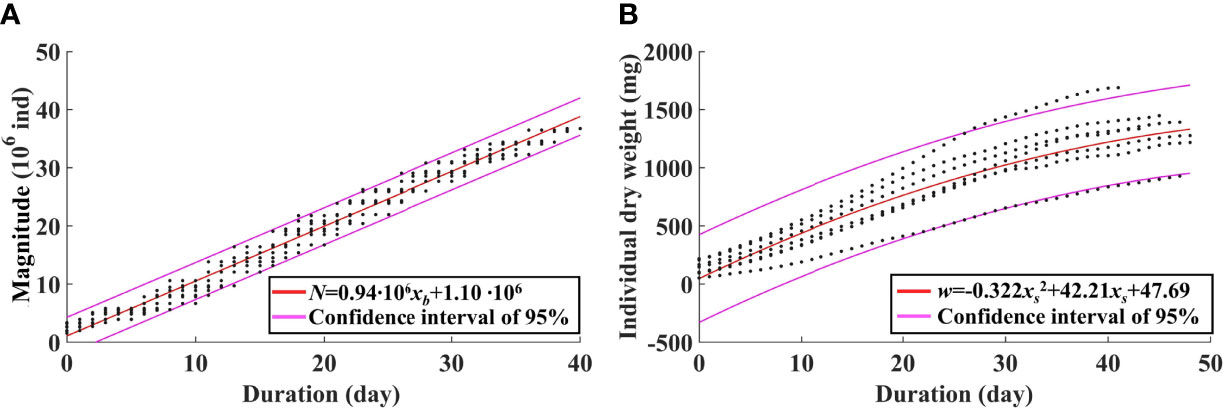
Figure 10 Regression of the jellyfish magnitude against the duration of the temperature range of 10°C–16°C for strobilization (A) and regression of individual weight against the duration of the growth period (B) based on model results from 2011 to 2017.
where N is the magnitude, and xb is the duration of 10°C–16°C, with the determination coefficient R2 of 0.98. Therefore, the biomass can be represented by temperature and food concentrations that are variables in the marine environment. Analysis in Section 3.2 reveals a suitable temperature range for growth of A. aurita. The averaged IW is regressed against the duration of EAT (Figure 10B). The equation is given as
where w is the averaged IW, and xs is the duration of EAT, with the determination coefficient R2 of 0.79.
The effect of temperature variations on A. aurita dynamics has been assessed in some coastal regions under the background of climate warming, with the conclusion of climate warming benefiting A. aurita (Holst, 2012; Ruiz Segura et al., 2012). The simplified relationships can reflect the linkage between temperature and jellyfish magnitude and biomass in some ways, despite the complexity of the marine ecosystem. They would contribute to further understanding the impact of temperature on the population dynamics in the warming BYSs (Lu et al., 2021).
In this study, a complex population-dynamic model is developed for jellyfish A. aurita in the BYSs that incorporates three components, a three-dimensional coupled physical–biological model, a Lagrangian particle-tracking model, and an energy balance model of A. aurita. By comparison with observations, the model well reproduces the individual growth and seasonal evolution of A. aurita population. During individual growth period with the suitable range of 16°C–24°C, the temperature is a key factor controlling growth and dry weight, characterized by a nearly linear growth rate. Longer duration of the temperature range tends to favor larger medusa size and further to promote the peak biomass.
The yearly peak biomass shows interannual variations that are controlled by the magnitude, food concentration, and EAT. Only considering the effect of temperature, the magnitude determined by strobilization of polyps can be expressed through the duration of strobilization, with longer duration leading to higher magnitude. The averaged IW corresponding to the peak biomass can be parameterized by the duration of individual growth period. Thus, the peak biomass can be obtained by the product of the magnitude and the averaged IW that finally relate to temperature. The simplified statistical relationship would help understand the temperature control on population dynamics and provide instructive insights into the impacts of ocean warming on A. aurita population. In addition, the actual distribution and abundance of polyps and the vertical mitigation property of A. aurita in the BYSs would favor improvement of the current population-dynamic model.
The raw data supporting the conclusions of this article will be made available by the authors, without undue reservation.
HW, HZ, and JX designed the research. GZ, YW, and JX contributed to the model establishment. GZ, YL, GS, and HW performed the data analyses. HZ prepared the manuscript with input from all other authors. All authors contributed to the article and approved the submitted version.
This work was financially supported by the National Key Research and Development Program of China (2017YFC1404403 and 2016YFC1401602), the National Natural Science Foundation of China (41806018), and the Natural Science Foundation of Tianjin City (19JCZDJC40300).
The authors declare that the research was conducted in the absence of any commercial or financial relationships that could be construed as a potential conflict of interest.
All claims expressed in this article are solely those of the authors and do not necessarily represent those of their affiliated organizations, or those of the publisher, the editors and the reviewers. Any product that may be evaluated in this article, or claim that may be made by its manufacturer, is not guaranteed or endorsed by the publisher.
The authors thank Nan Wang and Yantao Wang for providing data of laboratory experiments and field observations. The authors also thank the reviewers for their valuable comments.
The Supplementary Material for this article can be found online at: https://www.frontiersin.org/articles/10.3389/fmars.2022.842394/full#supplementary-material
Båmstedt U., Lane J., Martinussen M. B. (1999). Bioenergetics of Ephyra Larvae of the Scyphozoan Jellyfish Aurelia Aurita in Relation to Temperature and Salinity. Mar. Biol. 135 (1), 89–98. doi: 10.1007/s002270050605
Barz K., Hirche H. J. (2005). Seasonal Development of Scyphozoan Medusae and the Predatory Impact of Aurelia Aurita on the Zooplankton Community in the Bornholm Basin (Central Baltic Sea). Mar. Biol. 147 (2), 465–476. doi: 10.1007/s00227-005-1572-2
Bonnet D., Molinero J. C., Schohn T., Yahia M. N. D. (2012). Seasonal Changes in the Population Dynamics ofAurelia Aurita in Thau Lagoon. Cah. Biol. Mar. 53 (3), 343–347.
Chai F., Dugdale R. C., Peng T. H., Wilkerson F. P., Barber R. T. (2002). One-Dimensional Ecosystem Model of the Equatorial Pacific Upwelling System. Part I: Model Development and Silicon and Nitrogen Cycle. Deep Sea Res. Part II 49 (13-14), 2713–2745. doi: 10.1016/S0967-0645(02)00055-3
Decker M. B., Brown C. W., Hood R. R., Purcell J. E., Gross T. F., Matanoski J. C., et al. (2007). Predicting the Distribution of the Scyphomedusa Chrysaora Quinquecirrha in Chesapeake Bay. Mar. Ecol. Prog. Ser. 329, 99–113. doi: 10.3354/meps329099
Dong Z., Liu D., Keesing J. K. (2010). Jellyfish Blooms in China: Dominant Species, Causes and Consequences. Mar. Pollut. Bull. 60 (7), 954–963. doi: 10.1016/j.marpolbul.2010.04.022
Dong Z., Liu Z., Liu D. (2015). Genetic Characterization of the Scyphozoan Jellyfish Aurelia Spp. In Chinese Coastal Waters Using Mitochondrial Markers. Adv. Mar. Biol. 60, 15–23. doi: 10.1016/j.bse.2015.02.018
Fernández-Alías A., Marcos C., Quispe J. I., Sabah S., Pérez-Ruzafa A. (2020). Population Dynamics and Growth in Three Scyphozoan Jellyfishes, and Their Relationship With Environmental Conditions in a Coastal Lagoon. Estuar. Coast. Shelf Sci. 243 (5), 106901. doi: 10.1016/j.ecss.2020.106901
Fu Z., Dong J., Sun M., Zhao Y. (2011). Effects of Water Temperature and Salinity on Growth of Ephyrae in Moon Jellyfish Aurelia Sp in North Yellow Sea in China. Fish. Sci. 30 (4), 221–224. doi: 10.3969/j.issn.1003-1111.2011.04.008
Goldstein J., Steiner U. K. (2020). Ecological Drivers of Jellyfish Blooms - The Complex Life History of a ’Well-Known’ Medusa (Aurelia Aurita). J. Anim. Ecol. 89 (3), 910–920. doi: 10.1111/1365-2656.13147
Gueroun S. M., Molinero J. C., Piraino S., Dali Yahia M. N. (2020). Population Dynamics and Predatory Impact of the Alien Jellyfish Aurelia Solida (Cnidaria, Scyphozoa) in the Bizerte Lagoon (Southwestern Mediterranean Sea). Mediterr. Mar. Sci. 21 (1), 22–35. doi: 10.12681/mms.17358
Haidvogel D. B., Arango H., Budgell W. P., Cornuelle B. D., Curchitser E., Di Lorenzo E., et al. (2008). Ocean Forecasting in Terrain-Following Coordinates: Formulation and Skill Assessment of the Regional Ocean Modeling System. J. Comput. Phys. 227 (7), 3595–3624. doi: 10.1016/j.jcp.2007.06.016
Henschke N., Stock C. A., Sarmiento J. L. (2018). Modeling Population Dynamics of Scyphozoan Jellyfish (Aurelia Spp.) in the Gulf of Mexico. Mar. Ecol. Prog. Ser. 591, 167–183. doi: 10.3354/meps12255
Holst S. (2012). Effects of Climate Warming on Strobilation and Ephyra Production of North Sea Scyphozoan Jellyfish. Hydrobiologia. 690, 127–140. doi: 10.1007/s10750-012-1043-y
Kogovsek T., Molinero J. C., Lucic D., Onofri I., Gangai B., Miloslavic M., et al. (2012). Interannual Size Changes of Adult Aurelia Sp. 5 Medusae Stage in the Marine Protected Area of Mljet Island South Adriatic. Acta Adriat. 53 (2), 233–242.
Kremer P. (1976). Population Dynamics and Ecological Energetics of a Pulsed Zooplankton Predator, the Ctenophore Mnemiopsis Leidyi. Estuar. Processes 1, 197–215. doi: 10.1016/b978-0-12-751801-5.50024-1
Li Z., Wei H., Zhang H., Zhao H., Zheng N., Song G. (2021a). The Interannual Difference in Summer Bottom Oxygen Deficiency in Bohai Sea. Oceanol. Limnol. Sin. 52 (03), 601–613. doi: 10.11693/hyhz20200800227
Li Z., Zhang H., Zhao L., Xu F. (2021b). Spatial and Temporal Distribution and Factors Influencing the Phytoplankton Community Structure in the Bohai Sea. Mar. Sci. 45 (08), 10–20. doi: 10.11759/hykx20210103001
Lucas C. H. (1996). Population Dynamics of Aurelia Aurita (Scyphozoa) From an Isolated Brackish Lake, With Particular Reference to Sexual Reproduction. J. Plankton Res. 18 (6), 987–1007. doi: 10.1093/plankt/18.6.987
Lucas C. H. (2001). Reproduction and Life History Strategies of the Common Jellyfish, Aurelia Aurita, in Relation to Its Ambient Environment. Hydrobiologia 451 (1-3), 229–246. doi: 10.1007/978-94-010-0722-1_19
Lucas C. H., Graham W. M., Widmer C. (2012). Jellyfish Life Histories: Role of Polyps in Forming and Maintaining Scyphomedusa Populations. Adv. Mar. Biol. 63, 133–196. doi: 10.1016/B978-0-12-394282-1.00003-X
Lu H., Xie C., Zhang C., Zhai J. (2021). CMIP5-Based Projection of Decadal and Seasonal Sea Surface Temperature Variations in East China Shelf Seas. J. Mar. Sci. Eng. 9, 367. doi: 10.3390/jmse9040367
Møller L. F., Riisgård H. U. (2007). Feeding, Bioenergetics and Growth in the Common Jellyfish Aurelia Aurita and Two Hydromedusae, Sarsia Tubulosa and Aequorea Vitrina. Mar. Ecol. Prog. Ser. 346, 167–177. doi: 10.3354/meps06959
Möller H. (1980). Population Dynamics of Aurelia Aurita Medusae in Kiel Bight, Germany (FRG). Mar. Biol. 60 (2-3), 123–128. doi: 10.1007/BF00389155
Moon J. H., Pang I. C., Yang J. Y., Yoon W. D. (2010). Behavior of the Giant Jellyfish Nemopilema Nomurai in the East China Sea and East/Japan Sea During the Summer of 2005: A Numerical Model Approach Using a Particle-Tracking Experiment. J. Marine Syst. 80 (1-2), 101–114. doi: 10.1016/j.jmarsys.2009.10.015
Nan X., Wei H., Zhang H., Nie H. (2022). Spatial Difference in Net Growth Rate of Yesso Scallop Patinopecten Yessoensis Revealed by an Aquaculture Ecosystem Model. J. Oceanol. Limnol. 40, 373–387. doi: 10.1007/s00343-021-0423-4
Olesen N. J., Frandsen K., Riisgård H. U. (1994). Population Dynamics, Growth and Energetics of Jellyfish Aurelia Aurita in a Shallow Fjord Mar. Ecol. Prog. Ser. 105 (1/2), 9–18. doi: 10.3354/meps105009
Purcell J. E., Uye S., Lo W. T. (2007). Anthropogenic Cause of Jellyfish Blooms and Their Direct Consequences for Humans: A Review. Mar. Ecol. Prog. Ser. 350, 153–174. doi: 10.3354/meps07093
Richardson A. J., Bakun A., Hays G. C., Gibbons M. J. (2009). The Jellyfish Joyride: Causes, Consequences and Management Responses to a More Gelatinous Future. Trends Ecol. Evol. 24 (6), 312–322. doi: 10.1016/j.tree.2009.01.010
Ruiz Segura J., Prieto L., Astorga D. (2012). A Model for Temperature Control of Jellyfish (Cotylorhiza Tuberculata) Outbreaks: A Causal Analysis in a Mediterranean Coastal Lagoon. Ecol. Model. 233, 59–69. doi: 10.1016/j.ecolmodel.2012.03.019
Schlag Z. R., North E. W. (2012). Lagrangian TRANSport Model (LTRANS) V.2 User’s Guide (Cambridge, Maryland 21613, USA: University of Maryland Center for Environmental Science Horn Point Laboratory).
Shi Y., Mi T., Wang J., Chen L., Wang G., Zhen Y., et al. (2016). The Effect of Temperature and Food Supply on the Asexual Reproduction of Moon Jelly (Aurelia Sp.1) Polyps. Acta Ecol. Sin. 36 (03), 786–794. doi: 10.5846/stxb201404170751
Sun X., Wei H., Zhang H., Wang Y., Zhang G., Liu H. (2019). Tracing Giant Jellyfish in Coastal Waters Nearby Hongyanhe Power Plant. Oceanol. Limnol. Sin. 50 (06), 1281–1291. doi: 10.11693/hyhz20190600104
Sun S., Zhang F., Li C., Wang S. (2015). Breeding Places, Population Dynamics, and Distribution of the Giant Jellyfish Nemopilema Nomurai (Scyphozoa: Rhizostomeae) in the Yellow Sea and the East China Sea. Hydrobiologia 754 (1), 59–74. doi: 10.1007/s10750-015-2266-5
Toyokawa M., Aoki K., Yamada S., Yasuda A., Murata Y., Kikuchi T. (2011). Distribution of Ephyrae and Polyps of Jellyfish Aurelia Aurita (Linnaeus 1758)Sensu Lato in Mikawa Bay, Japan. J. Oceanogr. 67 (2), 209–218. doi: 10.1007/s10872-011-0021-8
Uye S., Shimauchi H. (2005). Population Biomass, Feeding, Respiration and Growth Rates, and Carbon Budget of the ScyphomedusaAurelia AuritaIn the Inland Sea of Japan. J. Plankton Res. 27 (3), 237–248. doi: 10.1093/plankt/fbh172
Wang Y. (2013). tudy on the Key Processes of Life Cycle of Aurelia Sp.1 (Beijing: The University of Chinese Academy of Sciences (Institute of Oceanology).
Wang N. (2015). The Effect of Temperature and Food Supply on the Asexual Reproduction and Ontogeny of Aurelia Sp.1 (Beijing: The University of Chinese Academy of Sciences (Institute of Oceanology).
Wang B., Dong J., Wang W., Li Y., Li Y., Liu X., et al. (2012). The Quantity Distribution of Giant Jellyfish and Its Relationship to Seawater Temperature and Salinity in Inshore Waters of the Northern Liaodong Bay Region. Oceanol. Limnol. Sin. 43 (03), 568–578.
Wang N., Li C. (2012). Effects of Bell Diameters and Prey Concentrations on Individual Feeding Rates of Jellyfish Aurelia Sp.1. Oceanol. Limnol. Sin. 43 (3), 480–485.
Wang Y., Sun S. (2015). Population Dynamics of Aurelia Sp.1 Ephyrae and Medusae in Jiaozhou Bay, China. Hydrobiologia 754 (1), 147–155. doi: 10.1007/s10750-014-2021-3
Wang S., Zhang G., Sun S., Wang Y., Zhao Z. (2012). Population Dynamics of Three Scyphozoan Jellyfish Species During Summer of 2011 in Jiaozhou Bay. Oceanol. Limnol. Sin. 43 (3), 471–479.
Wang P., Zhang F., Sun S., Yang T. (2020). Distribution of Giant Jellyfish in the Bohai Sea in June 2018. Oceanol. Limnol. Sin. 51 (1), 85–94. doi: 10.11693/hyhz20190500085
Wang P., Zhang F., Guo D., Sun S. (2021). Diets and Seasonal Ingestion Rates of Aurelia coerulea (Cnidaria: Scyphozoa) Polyps by In Situ Feeding Experiments in Jiaozhou Bay, China. Front. Mar. Sci. 8 (742999), 1–14. doi: 10.3389/fmars.2021.742999
Wei H., Deng L., Wang Y., Zhao L., Li X., Zhang F. (2015). Giant Jellyfish Nemopilema Nomurai Gathering in the Yellow Sea—A Numerical Study. J. Marine Syst. 144, 107–116. doi: 10.1016/j.jmarsys.2014.12.001
Widmer C. L. (2005). Effects of Temperature on Growth of North-East Pacific Moon Jellyfish Ephyrae, Aurelia Labiata (Cnidaria: Scyphozoa). J. Mar. Biol. Assoc. UK. 85 (3), 569–573. doi: 10.1017/S0025315405011495
Wu L., Wang J., Gao S., Zheng X., Huang R. (2017). An Analysis of Dynamical Factors Influencing 2013 Giant Jellyfish Bloom Near Qinhuangdao in the Bohai Sea, China. Estuar. Coast. Shelf Sci. 185, 141–151. doi: 10.1007/s00343-017-6083-8
Xie C., Fan M., Kang Y. (2021). Population Dynamics of the Giant Jellyfish Nemopilema Nomurai With Age Structure. Ecol. Model. 441, 1–12. doi: 10.1016/j.ecolmodel.2020.109412
Xiu P., Chai F. (2014). Connections Between Physical, Optical and Biogeochemical Processes in the Pacific Ocean. Prog. Oceanogr. 122, 30–53. doi: 10.1016/j.pocean.2013.11.008
Xu Z. (2009). Water Environment Adaptability and Ecological Groups of Hydroidomedusae in East China Sea. Chin. J. Appl. Ecol. 20 (1), 177–184. doi: 10.13287/j.1001—9332.2009.0014
Xue L., Liu Z., Song W., An Y., Yuan X., Chen X. (2021). Spatial Distribution of Aurelia Sp. Ephyrae and Its Relationship With Environmental Factors in the Coastal Waters of Qinhuangdao in Spring 2020. Ecol. Environ. Sci. 30 (6), 1240–1248. doi: 10.16258/j.cnki.1674-5906.2021.06.015
Yoon E. A., Hwang D. J., Chae J., Yoon W. D., Lee K. (2018). Behavior and Frequency Analysis of Aurelia Aurita by Using In Situ Target Strength at a Port in Southwestern Korea. Ocean Sci. J. 53 (1), 53–62. doi: 10.1007/s12601-017-0047-y
Zhang C., Guan C., Xu P., Liu G., Xu Q., Ye J., et al. (2019). Analysis on Risk Organisms for the Cold Source Water of Nuclear Power Plant in the Eastern Waters of Liaodong Bay. Mar. Environ. Sci. 38 (1), 41–45. doi: 10.13634/j.cnki.mes.2019.01.030
Zhang F., Li C., Sun S., Wei H., Wang Y. (2017). Progress on Studying Jellyfish Bloom, and the Monitoring and Control. Oceanol. Limnol. Sin. 48 (06), 1187–1195. doi: 10.11693/hyhz20171000258
Zhang G., Wei H., Xiao J., Zhang H., Li Z. (2020). Variation of Tidal Front Position in Liaodong Bay During Summer 2017. Oceanol. Limnol. Sin. 51 (01), 1–12. doi: 10.11693/hyhz20190600110
Zhang H., Wei H., Zhao L., Zhao H., Guo S., Zheng N. (2022). Seasonal Evolution and Controlling Factors of Bottom Oxygen Depletion in the Bohai Sea. Mar. Pollut. Bull. 117 (113199), 1–11. doi: 10.1016/j.marpolbul.2021.113199
Keywords: Aurelia aurita, population dynamics, biomass, duration of suitable temperature range, Bohai and Yellow Seas
Citation: Zhang H, Zhang G, Lan Y, Xiao J, Wang Y, Song G and Wei H (2022) A Modeling Study on Population Dynamics of Jellyfish Aurelia aurita in the Bohai and Yellow Seas. Front. Mar. Sci. 9:842394. doi: 10.3389/fmars.2022.842394
Received: 23 December 2021; Accepted: 29 March 2022;
Published: 17 May 2022.
Edited by:
Angel Pérez-Ruzafa, University of Murcia, SpainReviewed by:
Xikun Song, Xiamen University, ChinaCopyright © 2022 Zhang, Zhang, Lan, Xiao, Wang, Song and Wei. This is an open-access article distributed under the terms of the Creative Commons Attribution License (CC BY). The use, distribution or reproduction in other forums is permitted, provided the original author(s) and the copyright owner(s) are credited and that the original publication in this journal is cited, in accordance with accepted academic practice. No use, distribution or reproduction is permitted which does not comply with these terms.
*Correspondence: Haiyan Zhang, aGFpeWFuX3poYW5nQHRqdS5lZHUuY24=; Hao Wei, aGFvLndlaUB0anUuZWR1LmNu
Disclaimer: All claims expressed in this article are solely those of the authors and do not necessarily represent those of their affiliated organizations, or those of the publisher, the editors and the reviewers. Any product that may be evaluated in this article or claim that may be made by its manufacturer is not guaranteed or endorsed by the publisher.
Research integrity at Frontiers
Learn more about the work of our research integrity team to safeguard the quality of each article we publish.