- 1School of Earth and Atmospheric Sciences, Georgia Institute of Technology, Atlanta, GA, United States
- 2Department of Oceanography, University of Hawai’i at Manoa, Honolulu, HI, United States
- 3Deep Sea Research Center, Pilot National Laboratory for Marine Science and Technology, Qingdao, China
The Gulf of Mexico is a very productive and economically important system where riverine runoff acts as a linkage between the continental shelf and the open ocean, providing nutrients in addition to freshwater. This work investigates the three-dimensional transport and pathway structure of this river runoff offshore the continental shelf using ensembles of numerical simulations with different configurations regarding grid resolution (mesoscale resolving and submesoscale permitting) and river setup using suites of 5-months long integrations covering nearly 3 years. The riverine forcing is applied only at the surface over an area around the river mouth, a strategy often adopted in numerical studies, or as a meridional flux with a vertical extension. The simulated flow captures the southward offshore transport of river runoff driven by its interaction with the largest mesoscale circulations in the basin, the Loop Current and Loop Current eddies. This pathway is strong and well-document during summer but also active and relevant in winter, despite a less obvious surface signature. The most intense transport occurs primarily at the peripheries of the Loop Current and the detached eddies, and the freshwater is subducted as deep as 600 m around the mesoscale anticyclonic eddies. Submesoscale motions strengthen slightly the spread of freshwater plumes in summer but their contribution is negligible, if not negative, in winter. Differences in the freshwater distribution and transport volume among runs are small and generally less than 10% among ensembles, with overall slightly higher volume of freshwater transported off-shore and at depth in submesoscale permitting runs that include a velocity flux in their riverine input representation.
Introduction
Understanding the pathway and transport of freshwater input into an ocean basin is key for estimating land-ocean linkages, the contribution of coastal areas to the oceanic carbon cycling and one component of the anthropogenic pressure on marine ecosystems. In coastal areas, riverine inflow influences oceanic physical and biogeochemical properties. On the physical side, the inflow of low salinity waters modifies stratification, stability and at times circulation (e.g., in the South China Sea, Cai and Gan, 2017; Zeng et al., 2021), while on the biogeochemical side algal blooms, hypoxia, eutrophication and pollutants accumulation result from nutrient and sediment loading by the riverine water, often modified by anthropogenic stressors (e.g., Krug, 1993).
The Gulf of Mexico (GoM, Figure 1A) is a semi-enclosed region highly impacted by several large rivers and is an ideal testbed for studies on river discharge, plume formation, and freshwater transport. The Mississippi River and the neighboring Atchafalaya River (MARS, Figure 1B) are the first and second-largest freshwater inputs into the GoM, with an average rate of more than 14,000 m3/s, and constitute the biggest river system in North America (Morey et al., 2003; Hu et al., 2005; Schiller et al., 2011). They contribute freshwater and abundant nutrients to the semienclosed basin, and this input also enriches microbial diversity (Mason et al., 2016). Rivers smaller than the MARS also drain in the GoM, and their contribution cannot be neglected because of their specific input locations or seasonality. For example, the Mobile River System (confluence of Alabama and Tombigbee rivers) and the Texas Gulf Coast Hydrologic Region (Sabine, Brazos, Trinity, etc.) can contribute to the GoM as much as 3,500 m3/s and 1,400 m3/s discharge in March and May–June, respectively (Fournier et al., 2019).
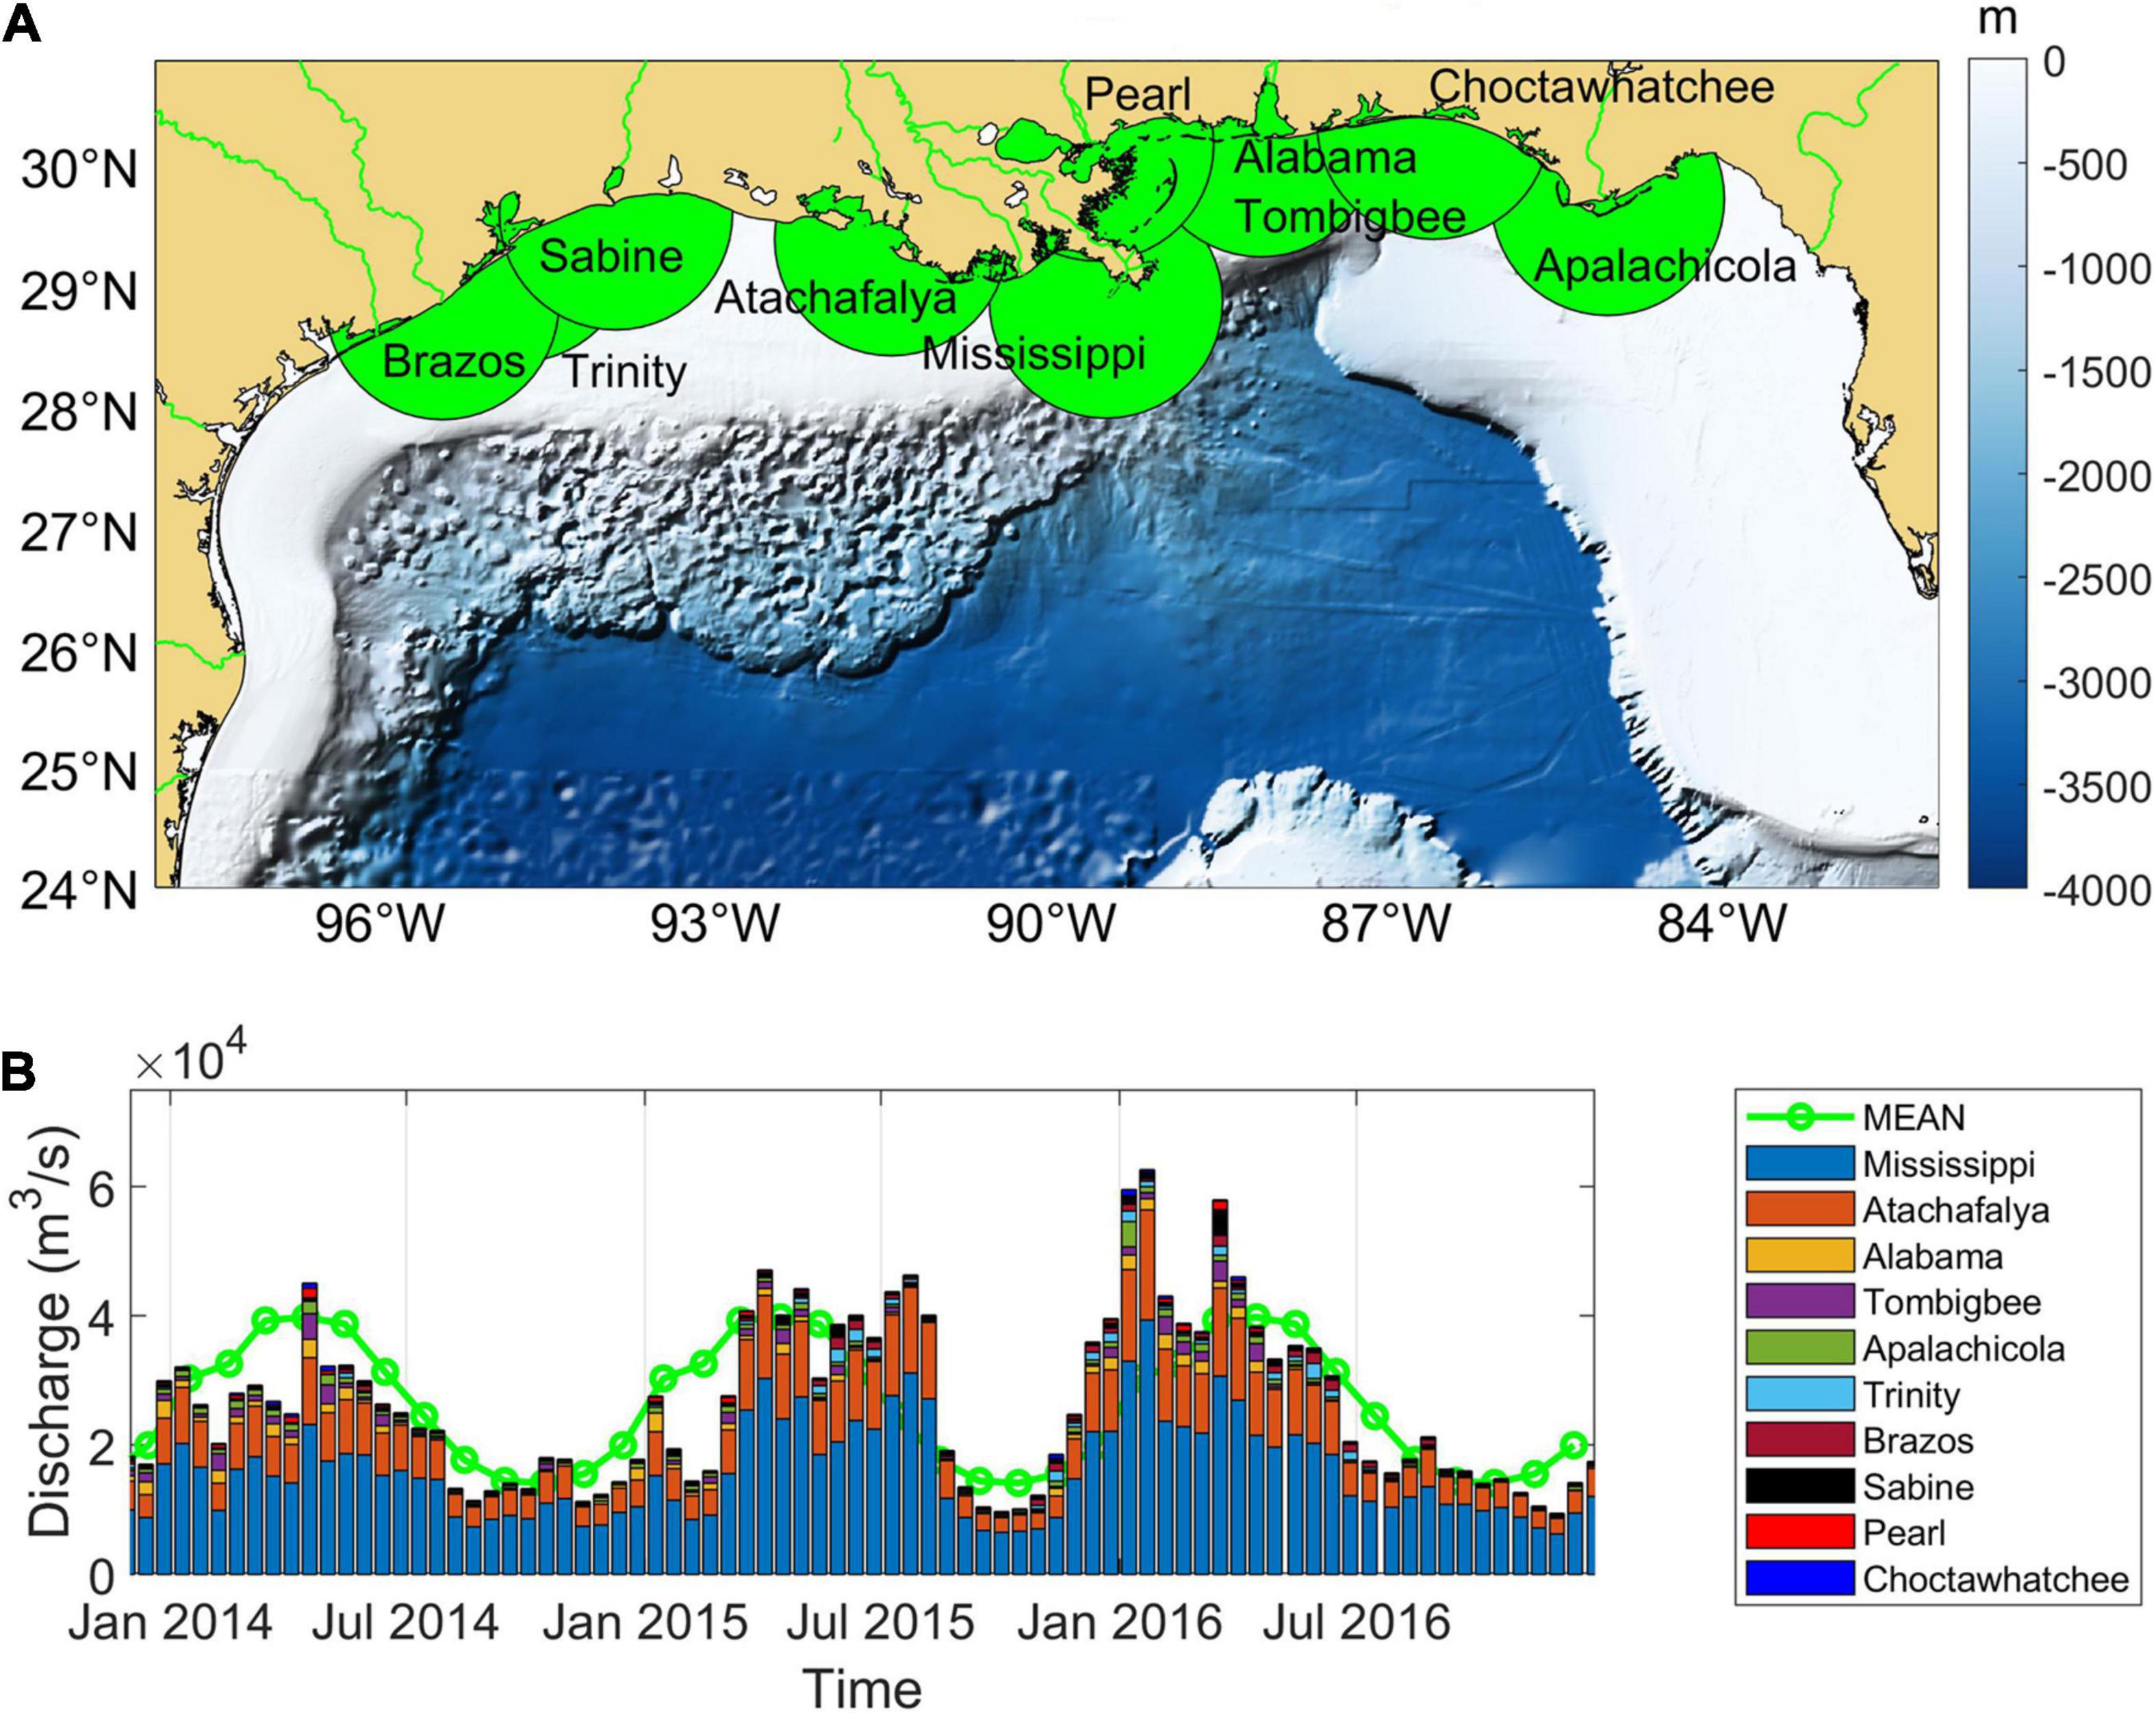
Figure 1. (A) Bathymetry of the Gulf of Mexico with indicated the river mouth of the rivers considered in the simulations (green dots) and major shelves. Rivers Alabama and Tombigbee share the same river mouth in our model setup. The dots cover the region where the bogus freshwater fluxes are applied in the passive configuration. (B) Freshwater discharge rate of each river from December 2013 to August 2016. Vertical dash lines show the 1st day of January and July during this period. Green dotted line indicates the mean discharge rate, calculated as monthly means over the 11-year period Jan 2010 – Nov 2021.
Many studies have shown that the advection of riverine water offshore into the northern GoM is modulated by the seasonally varying wind patterns (Walker et al., 1994; Schiller et al., 2011) and by entrainment events due to occasional intrusions of the Loop Current (LC) into De Soto Canyon and the accompanying LC eddies (Morey et al., 2003; Hu et al., 2005; Schiller and Kourafalou, 2014; Androulidakis et al., 2019; Brokaw et al., 2019). These studies are predominantly focused on the interaction of the river plume and the local mesoscale LC eddies during late spring and summer, when the riverine contribution is generally at its maximum, and the impact of submesoscale currents has not been explored in detail.
Global studies have investigated how representing rivering fluxes as bogus volume fluxes imposed at the ocean surface or point sources may impact global salinity budgets (Feng et al., 2021) but less is known for enclosed basins, where models can be run at high resolution to better represent the dynamics responsible for the offshore and vertical spreading of the freshwater anomalies. Among these dynamics, in the past two decades the oceanographic community has paid particular attention to submesoscale circulations. In the GoM, for example, mesoscale structures and rivering inputs have been shown to jointly contribute to the juxstaposition of water masses with different densities and therefore to the development of frontal and baroclinic instabilities. The end result is the formation of submesoscale lateral convergence zones (Luo et al., 2016; Barkan et al., 2017a,b) where fresh water, nutrients, and pollutants accumulate (Huntley et al., 2015; Choi et al., 2017; Bracco et al., 2019; Justic et al., 2021).
Here, we focus on the representation of the freshwater contribution in an ocean model aiming to answer two questions in the context of regional submesoscale permitting and mesoscale resolving high resolution simulations:
(1) Do submesoscale circulations contribute to the pathway and transport characteristics of the freshwater plume in conjunction with the LC system (LCS), and if so how much?
and
(2) Is there a significant difference in the model representation of this pathway whenever the freshwater input is imposed as a volume flux at the river mouths or more simply as an additional passive contribution at the ocean surface (i.e., is treated similarly to a precipitation term)? We stress that some ocean models use the second, simpler strategy, also when run for prediction and predictability studies.
To answer them, we use ensembles of ocean model runs at two horizontal grid resolutions and with different river configurations, and we examine the three-dimensional structure of river discharges from ten major rivers in the GoM (Figure 1A). The integrations cover the period December 2013 – August 2016, allowing us to explore the variability of the MARS-LCS interactions under different conditions (Figure 1B). This time interval covers a year of relative low discharge in 2014 (medium winter and low summer discharges), a year of typical discharge in 2015 (low winter, high late spring/early summer discharge), and a year characterized by extreme flooding conditions in January-February due to the influence of the El Niño event in 2016 (very high winter and spring discharge).
Materials and Methods
To solve the fine-scale, regional circulation, we use the primitive-equation, free-surface, split-explicit Regional Ocean Modeling System (ROMS) in its Coastal and Regional Ocean COmmunity model version (CROCO; Shchepetkin and McWilliams, 2003, 2011; Debreu et al., 2008, 2012). The model domain covers the GoM north of 24°N (Figure 1A), with open boundaries to the south and east. K-profile parameterization (KPP) is used for vertical mixing of tracers and momentum (Large et al., 1994). The 3rd-order upstream biased advection scheme and the split and rotated 3rd-order upstream biased advection scheme are used for lateral momentum and tracer advection, respectively. Analysis products of the Hybrid Coordinate Ocean Model-Navy Coupled Ocean Data Assimilation (HYCOM-NCODA) experiment 31.0 (before April 4th, 2014) and experiment 32.5 (after April 4th, 2014) at 1/25° resolution are used as initial and boundary conditions (Cummings, 2005; Cummings and Smedstad, 2013). The boundary conditions are updated every 3 h. All forcing fields (i.e., 10 m wind, surface shortwave radiation, surface downward long wave radiation, precipitation, 2 m air temperature and relative humidity) are from the NAVy Global Environmental Model (NAVGEM), which are also used in HYCOM-NCODA analysis. Atmospheric forcing is employed in our simulations with bulk parameterization, as in HYCOM-NCODA. The topography is derived from 2-min Gridded Global Relief Data (ETOPO2) (Smith and Sandwell, 1997) and is smoothed with a maximum slope factor of 0.25 to reduce horizontal pressure gradient errors caused by sigma-coordinates (Sikirić et al., 2009). The configuration choices insure that the Loop Current dynamics do not diverge significantly from the analysis in all runs and that overall the model follows the dynamical evolution of the HYCOM-NCODA system.
River discharges of ten major rivers (Figure 1), collected daily by the U.S. Geological Service (USGS) and the U.S. Army Corps of Engineers (USACE), are imposed in the simulations in an active or passive manner. In the active configuration, the discharges are imposed as a southward volume flux at the river mouths. The river salinity is set to 4 psu, and the temperature is set at the local air temperature value. The freshwater flux decays exponentially away from the surface toward the ocean bottom. In the passive river configuration, which is commonly preferred because easier to implement, the river discharge is simulated as a bogus flux that is added to precipitation around the river mouth, with the amplitude of the flux decreasing according to a Gaussian function with an e-folding length of 50 km. (see Figure 1) to ensure that the freshwater reaches realistically far offshore (Barkan et al., 2017a).
The December 2013 – August 2016 period is divided into 8 intervals, each 5 months long. For each interval, the model is run freely (without any data assimilation) starting on December, April and August 1st, 2nd, and 3rd of each year from the HYCOM analysis. The three-member ensembles allow for quantifying the internal variability, while the re-starting every 5 months assures that the runs do not diverge much from the observed conditions in their LCS representation. At the same time, the set-up choices limit us to investigating subseasonal to (at most) seasonal changes associated with the riverine fluxes representation. Two ensembles (active and passive) are run at 1 km (submesoscale-permitting, SP) and two at 3.5 km (mesoscale-resolving, MR) horizontal resolution, with 70 sigma layers in all cases. In the SP case a two-member ensemble is run also without riverine discharge except for that contained in the initial conditions; in those no-river runs the surface salinity continues to be modified by evaporation and precipitation.
Results
The predictability of surface fields – sea surface temperature (SST), salinity (SSS), relative vorticity and height (SSH) — is described in terms of variability, climatology and ensemble spread in Sun et al. (2021), thereafter SBL21, and is not repeated here. In this work, we focus on salinity pattern at and below the surface, paying closer attention to the 3D distribution of riverine waters as they move offshore into the open ocean. A configuration close to that adopted here has been validated in various fields in previous studies (see e.g., Cardona et al., 2016; Luo et al., 2016, and Liu et al., 2021). Overall the model reproduces well the stratification and mesoscale variability, but LC structures (the LC and the detached eddies) are often stronger than observed in terms of their eddy kinetic energy. This is a common problem in ocean-only model. Renault et al. (2016), for example, assessed the role of atmospheric coupling using ocean-atmosphere coupled and uncoupled simulations, and showed that the current-wind feedback in coupled simulation attenuates the mean transfer of energy from the atmosphere to the ocean, and consequently decreases the level of eddy kinetic energy in the ocean by nearly 30%.
Modeled Salinity and Circulation Features in the Gulf of Mexico
Figure 2 shows the monthly mean sea surface salinity (SSS) in the 3rd and 5th months of each model period for the first member of the SP active ensemble. The SSS field varies greatly across years because of the freshwater input, the variations in wind pattern as well as the position of the LC and the Rings (Morey et al., 2003; Schiller et al., 2011; Schiller and Kourafalou, 2014; da Silva and Castelao, 2018). Winds in the GoM are typically southereasterly in summer and northerly and northeasterly during fall and winter (Morey et al., 2003) and drive the seasonal circulation over the shallow inner shelf. In the multi-year average, in February –April low-salinity waters are confined to the Louisiana-Texas (LATEX) continental shelf, and extend offshore in summer (June to August), with a major branch of freshwater spreading to the east of the Mississippi Delta, along the coast of the Mississippi-Alabama-Florida (MAFLA) and toward the West Florida shelf. The shape and extension of this branch are linked to the position of the LC. In fall the fresh SSS retracts toward the shelf, with remnants around the LCS, and in winter (November to January) only the shelf areas are occupied by low salinity waters near the surface.
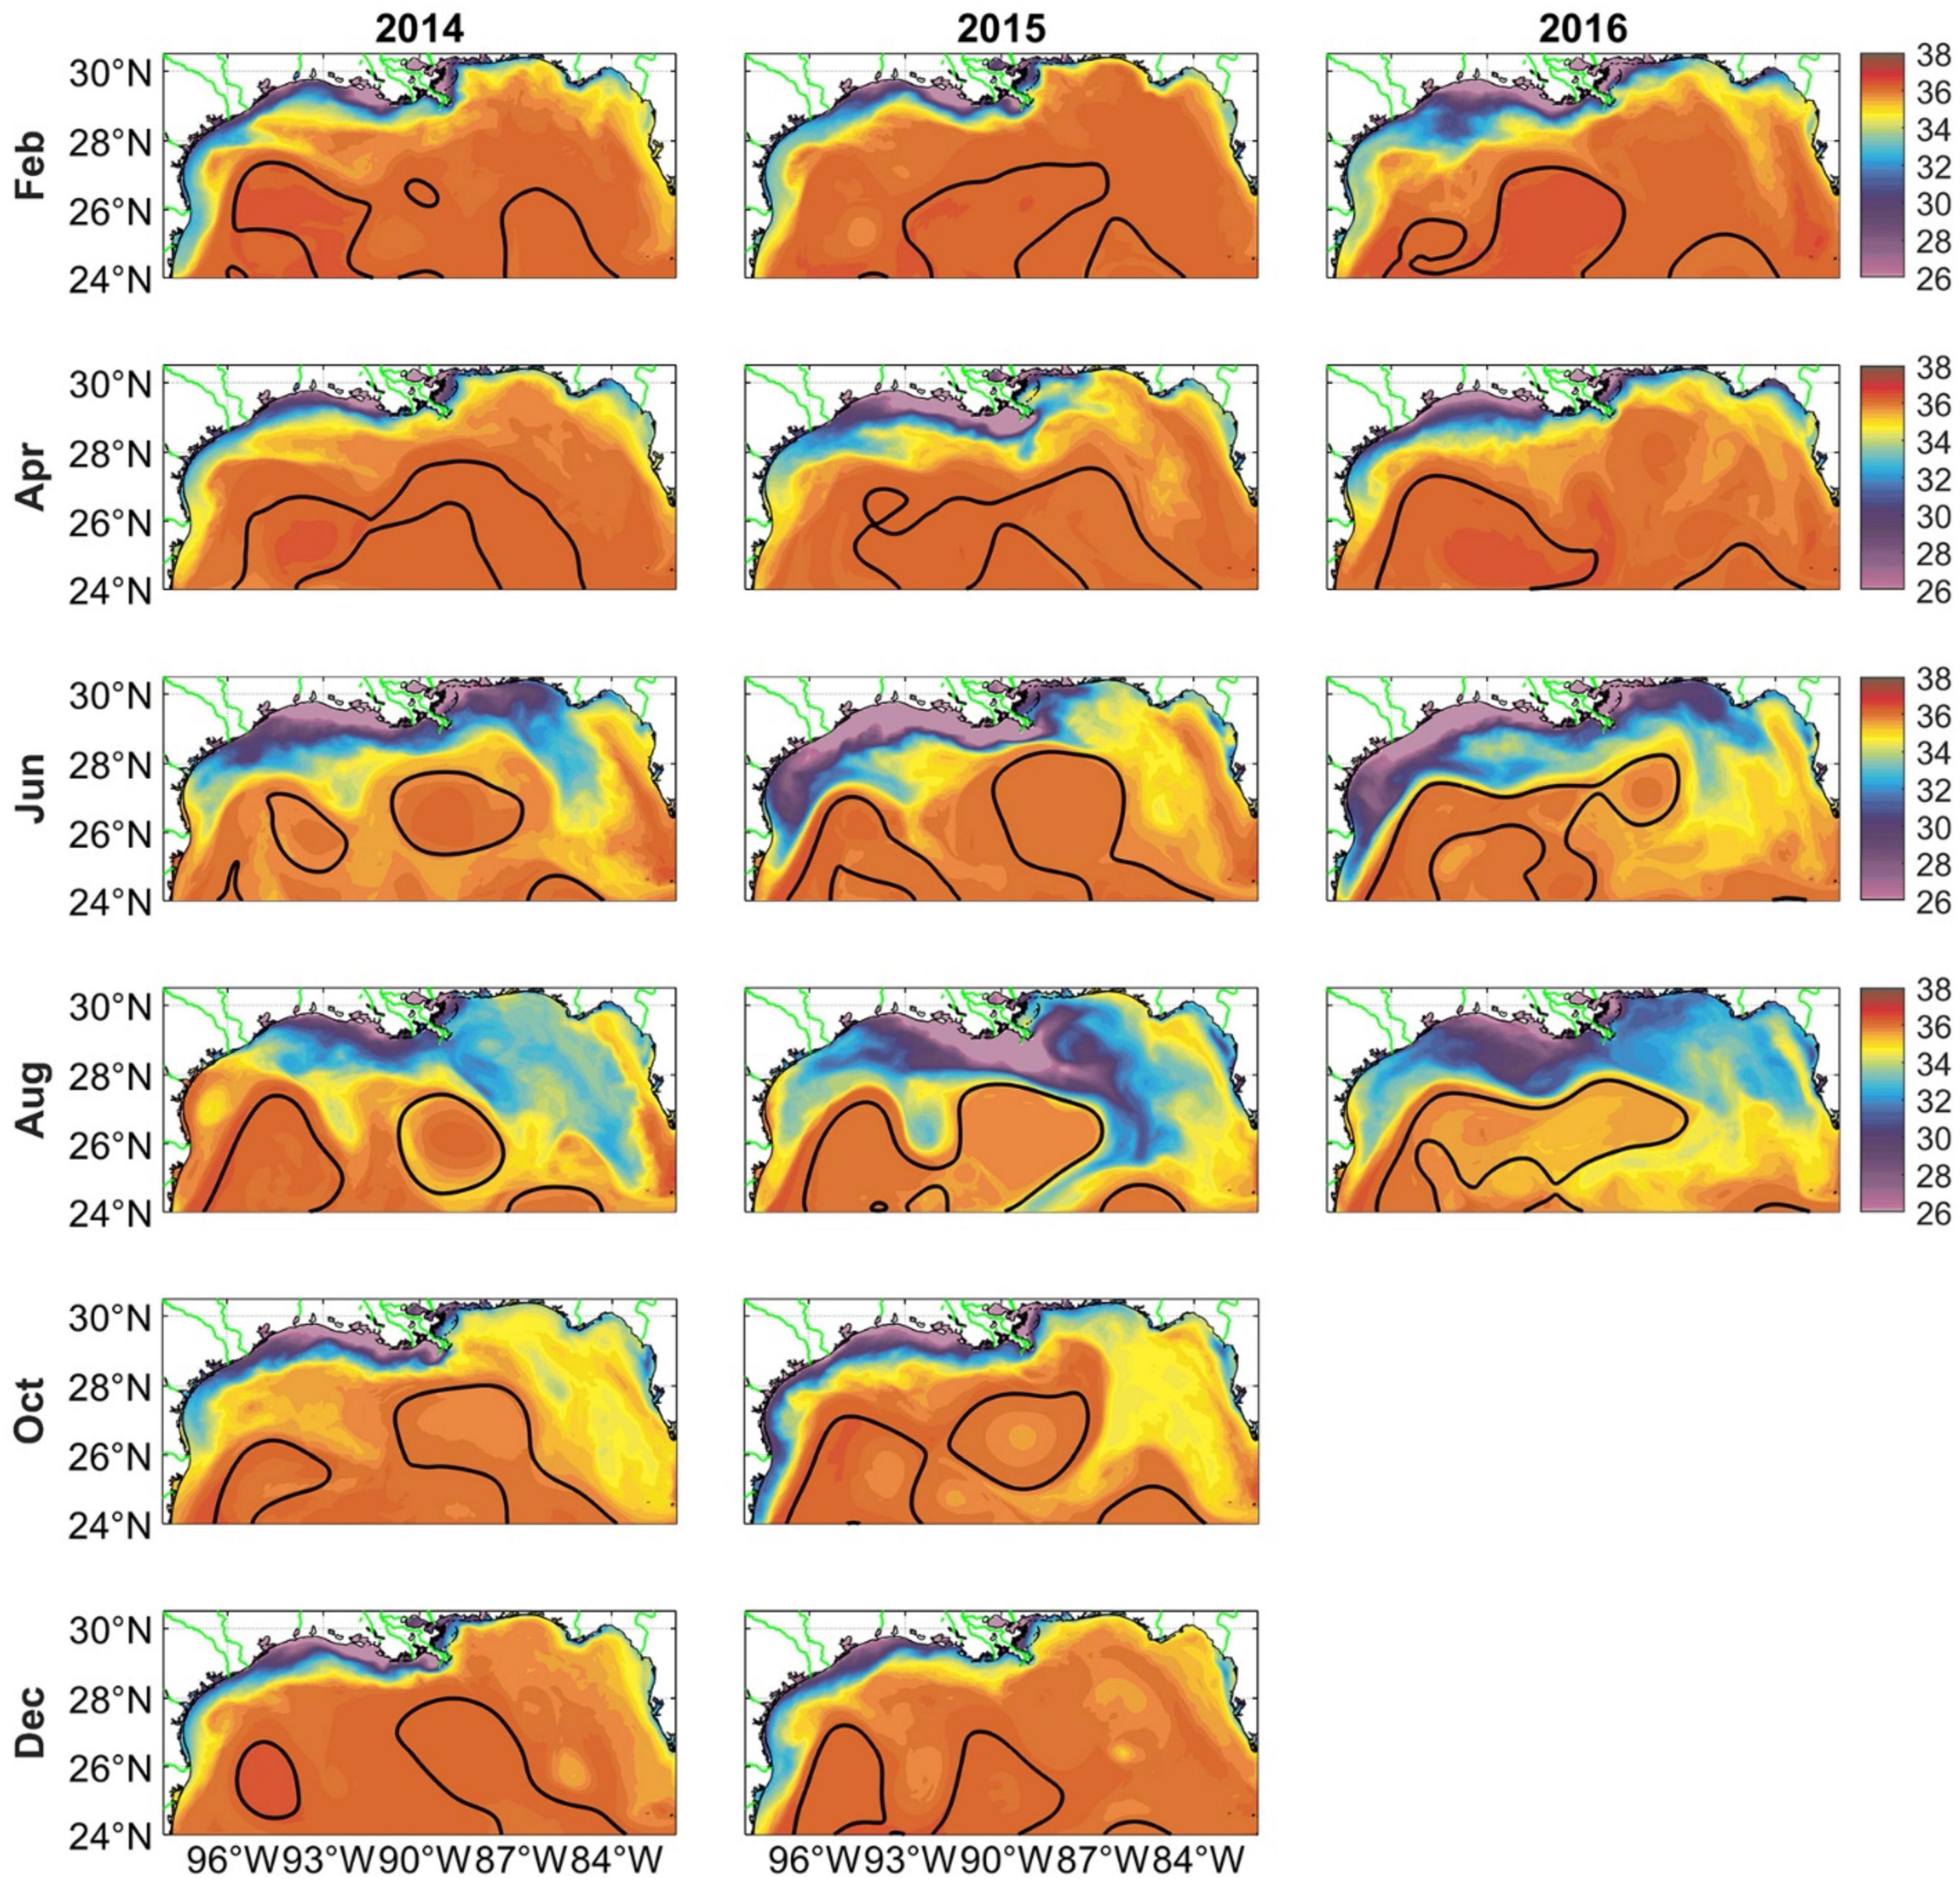
Figure 2. Monthly averaged surface salinity in the first member (initialized on the 1st of the month) of the SP active case shown in the third (February, June, and October) and fifth (April, August, and December) months of the (free) simulation. Black contour indicates 0.17 m sea surface height anomaly (SSHa) and broadly follow the LCS and the Rings, following Leben and Born (1993).
In the period considered, low-salinity waters (identified by salinity less than 34 psu) were mainly limited to the coastal areas in August 2014 because the discharge in April-July was anomalously low, but extended well offshore to as far as 26°N in 2015, when the late spring/summer discharge was highest among the 3 years (Figure 1B) and the LC was in an extended position for most of the time.
During winter and spring, the El Niño Southern Oscillation (ENSO) is an important driver of interannual variability in salinity and coastal circulation (Gomez et al., 2019). ENSO indeed modulates the global precipitation patterns over the continental United States that feed the Mississippi River basin and the wind anomalies that control the alongshore currents over the LATEX shelf via the thermal wind relation (Childers et al., 1990; Schimidt et al., 2001). This modulation results in flooding conditions and wider than normal offshore spreading of low-salinity waters in winter and early spring during El Niño events, as verified in 2016 from February to April.
As mentioned, the GoM circulation in the upper 600–800 m of the water column is dominated by the anticyclonic Loop Current (LC), which is relatively warm and salty, and its detached eddies or Rings (Hamilton, 2009). The LC and the Rings can extend to 200 – 300 km in diameter (Gordon, 1967). Whenever a Ring is formed, and through its westward drift, smaller mesoscale eddies, spinning both cyclonically and anticyclonically, are also generated. Around and within the large mesoscale structures, submesoscale circulations have been observed year-round (Poje et al., 2014; D’Asaro et al., 2018) at horizontal scales from hundreds of meters to few kilometers. They emerge from the conversion of available potential energy from the mixed layer to kinetic energy and are fueled by the density gradients associated with the energetic mesoscale structures (McWilliams, 2008) and the river discharge (Barkan et al., 2017a).
Figure 3 presents the surface salinity gradient field, the surface relative vorticity ζ = ∂v/∂×−∂u/∂y normalized by the Coriolis parameter f, and the near-surface stratification, or the squared Brunt–Väisälä frequency , where ρ is the potential density, in 2015 for one of the SP active runs. Similar patterns are detectd in other cases but with relatively weaker magnitude or less extension for all fields. For relative vorticity, in the offshore portion of the basin – offshore the shallow continental slope – submesoscale circulations in the form of small eddies are most energetic in winter when the mixed layer is deepest and submesoscale fronts prevail in summer, due to the river-induced submesoscale enhancement, as shown in previous studies (Luo et al., 2016; Barkan et al., 2017b). Over the shelf, submesoscale eddies are more commonly observed from late spring to early fall (Horner-Devine et al., 2015; Kobashi and Hetland, 2020). Focusing on stratification, very weakly stratified waters can be seen inside the LC and Rings extending to the shelves in winter, since the nearshore temperature is low throughout the shallow water column and winds strongest at the coast. On the other hand, waters are strongly stratified in summer whenever impacted by the abundant riverine output (Morey et al., 2003).
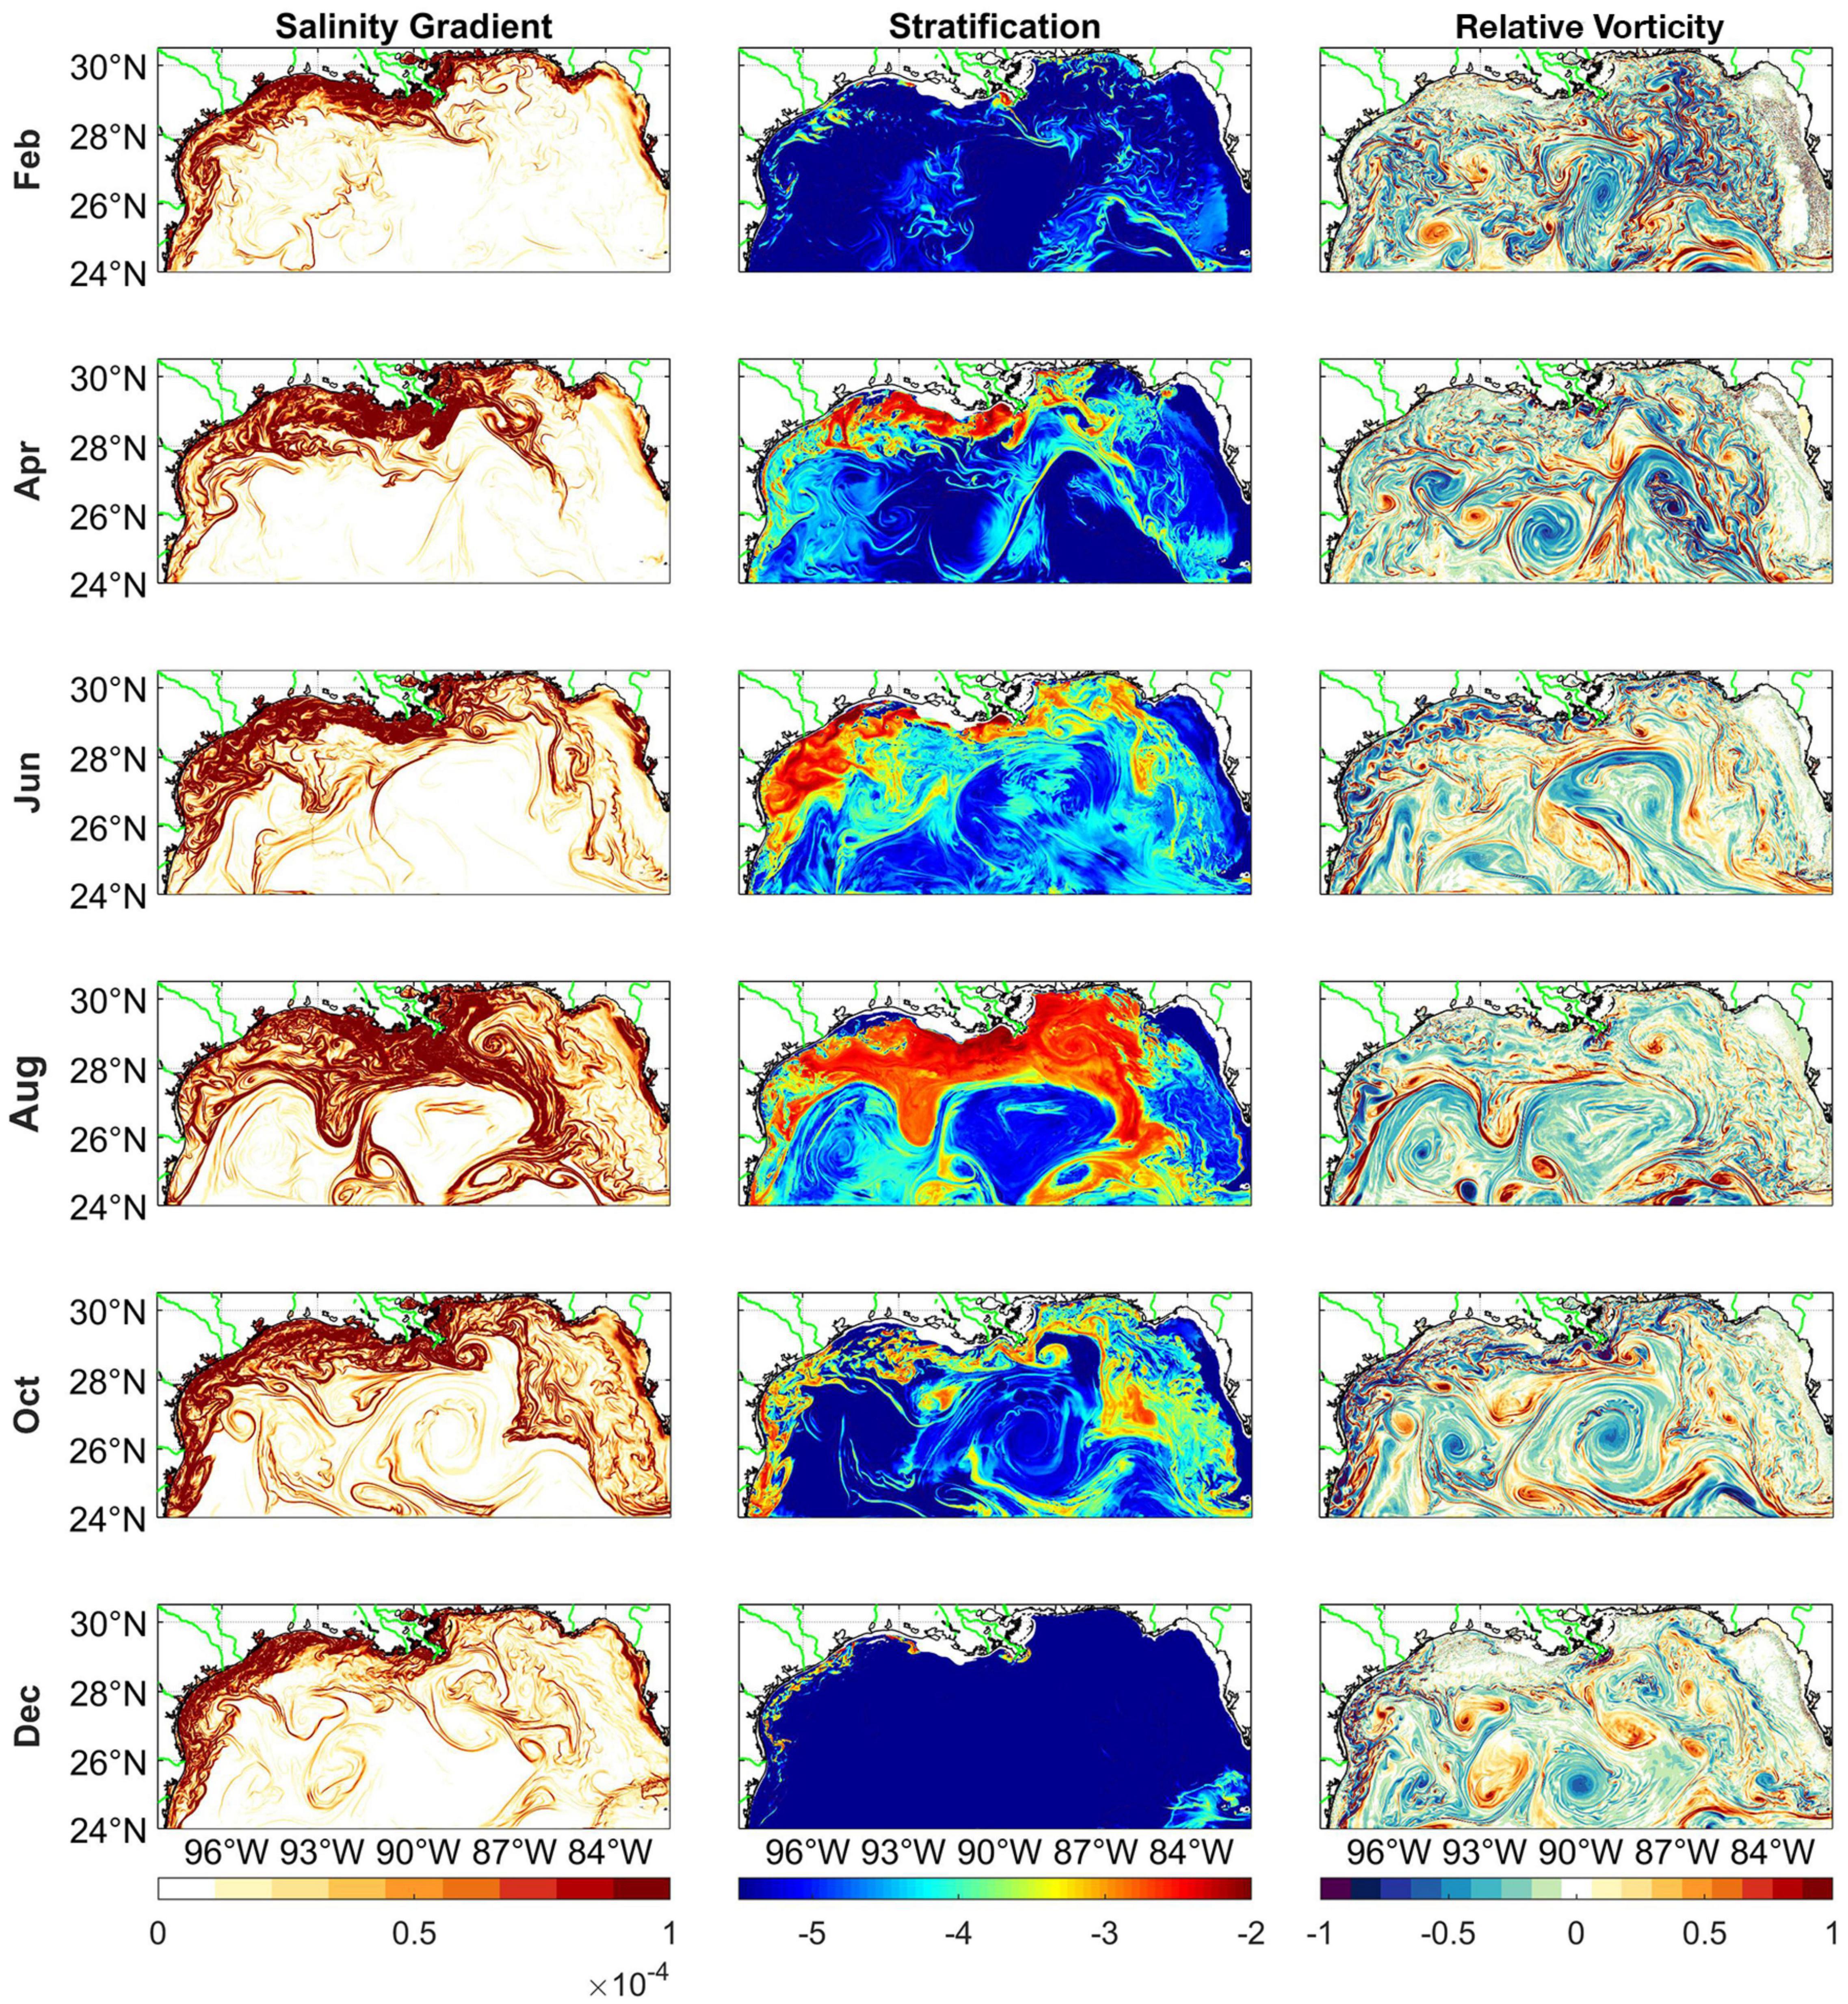
Figure 3. Instantaneous fields of surface salinity gradient (m–1), stratification in the upper 10 m of the water column (log scale, s–2), and normalized surface relative vorticity ζ/f (unitless) in Feb, Apr, Jun, Aug, Oct, and Dec 2015. The patterns are obtained from the first ensemble member of each SP active case in the 3rd and 5th months of the (free) simulation and exemplify the dynamical characteristics of the flow field in the various seasons.
Patterns of salinity gradients, stratification and vorticity at the mesoscales remain considerably similar across ensembles, as seen in Supplementary Figure 1 for the corresponding quantities in the MR ensembles, and in SBL21 for further comparisons of predictability skills.
Spatial Patterns of Low-Salinity Waters
Figure 4 shows the monthly averaged spatial patterns of the freshwater spreading area and normalized volume, or thickness in 2015, together with the sea surface height anomaly (SSHa) contours across the different ensembles. Again, the freshwater is identified by 34 psu isohaline. Sea SSHa contours of 0.17, 0.4, and 0.6 m outline major anticyclonic features, and the 0.17 m threshold is assumed to identify the boundary of the LC and LC eddies in the GoM following previous literature (Leben and Born, 1993; Donohue et al., 2016; Hamilton et al., 2016). In winter, westward/southward wind-driven coastal currents carry low salinity water over the LATEX shelf. During the summer, two branches of low salinity water can be present and transported eastward in the northern GoM. The first branch represents the portion of pre-existing waters on the LATEX shelf transported along-shore, which is also present in the no-river case. The second branch originates mainly from the MARS and moves eastward onto the MAFLA shelf, the West Florida shelf or is advected into the Gulf interior by the intrusion of the LC and the Rings. Finally, in August parcels of low salinity waters can be seen trapped in the cyclonic recirculation between the large anticyclonic patters (LC and Rings) and they are more relevant in the SP-active case than in the other ensembles. The trapping of low salinity waters between two mesoscale anticyclonic structures has been pointed by Androulidakis et al. (2019) as a secondary mechanism of freshwater removal by the LC eddies. The SSHa patterns are overall similar among different ensembles. Quantification of the differences is presented in SBL21, where it is found that the LC has a statistically significant lower probability to extend northward of 28°N in the SP integrations with an active river configuration, compared to the other cases.
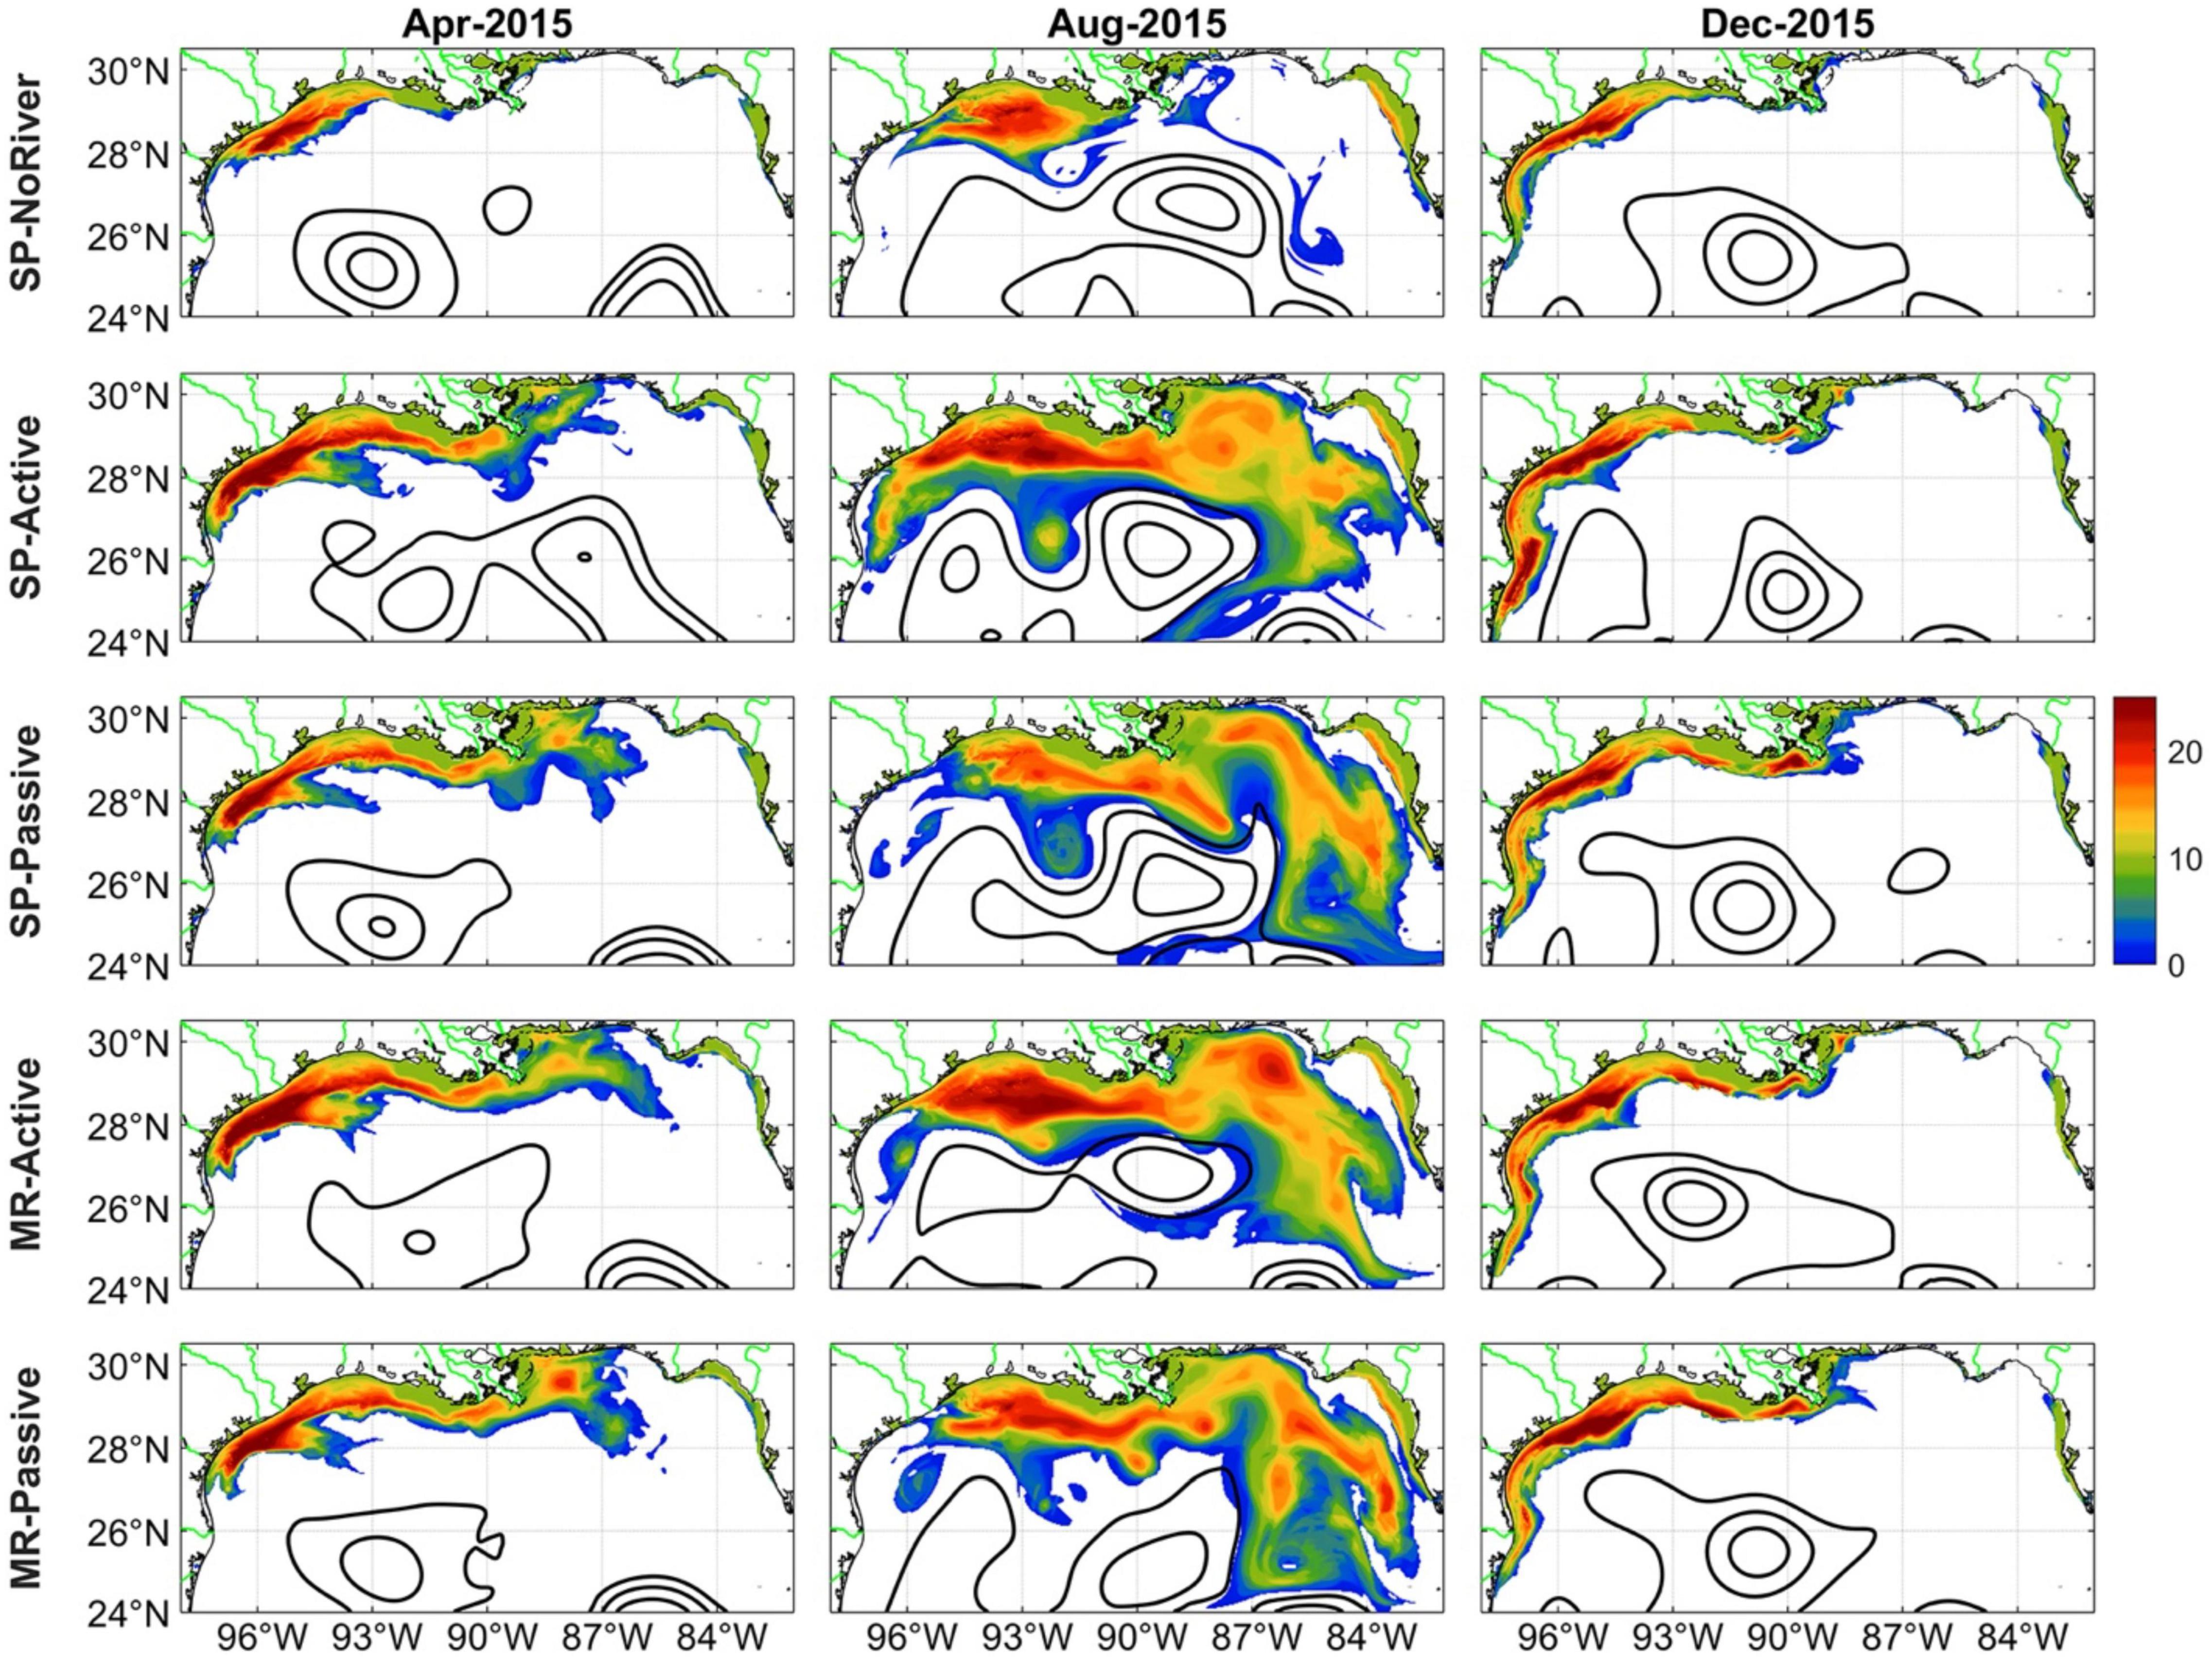
Figure 4. Monthly and vertically averaged freshwater (=34 psu) extension in Apr, Aug, and Dec 2015 with different model setup. Color shading denotes the thickness of the freshwater patches in meters. SSHa contours (0.17, 0.4, and 0.6 m) are also shown.
In terms of salinity, the modeled freshwater spatial distribution is modestly affected by the setup of river forcing. This is the case although Morey et al. (2003) have demonstrated that the variability in river discharge does not control, but only modulate, the seasonal salinity patterns in the GoM, with the LCS being a player at least as important. In our simulations, both the spreading area and volume are small in the no-river case, as to be expected, and maximum values are achieved in the active river simulations. The role of small differences in LCS are most evident in comparing the SP passive and active cases and their salinity distribution in August 2015. The extension of the LC, which is slightly different among the two cases, modifies the pathway of the Mississippi River water pushing it further east in the passive case.
Interannual and Seasonal Variability in Freshwater Plume
To quantify the different behaviors in the transport pathways and transport efficiency, we calculated the time-series of freshwater spreading area and volume, shown in Figure 5. We excluded from the calculation coastal areas where the water column depth is less than 100 m given that differences could be driven by river configuration choices in the immediate surrounding of the river mouths. This arbitrary threshold excludes all areas impacted by the modified precipitation fluxes where waters may stagnate in conditions of low winds. The Mississippi River mouth represents the exception, but its freshwater is rapidly transported offshore or to the west in both passive and active cases. We varied the threshold and tested values between 50 and 200 m and results do not change qualitatively.
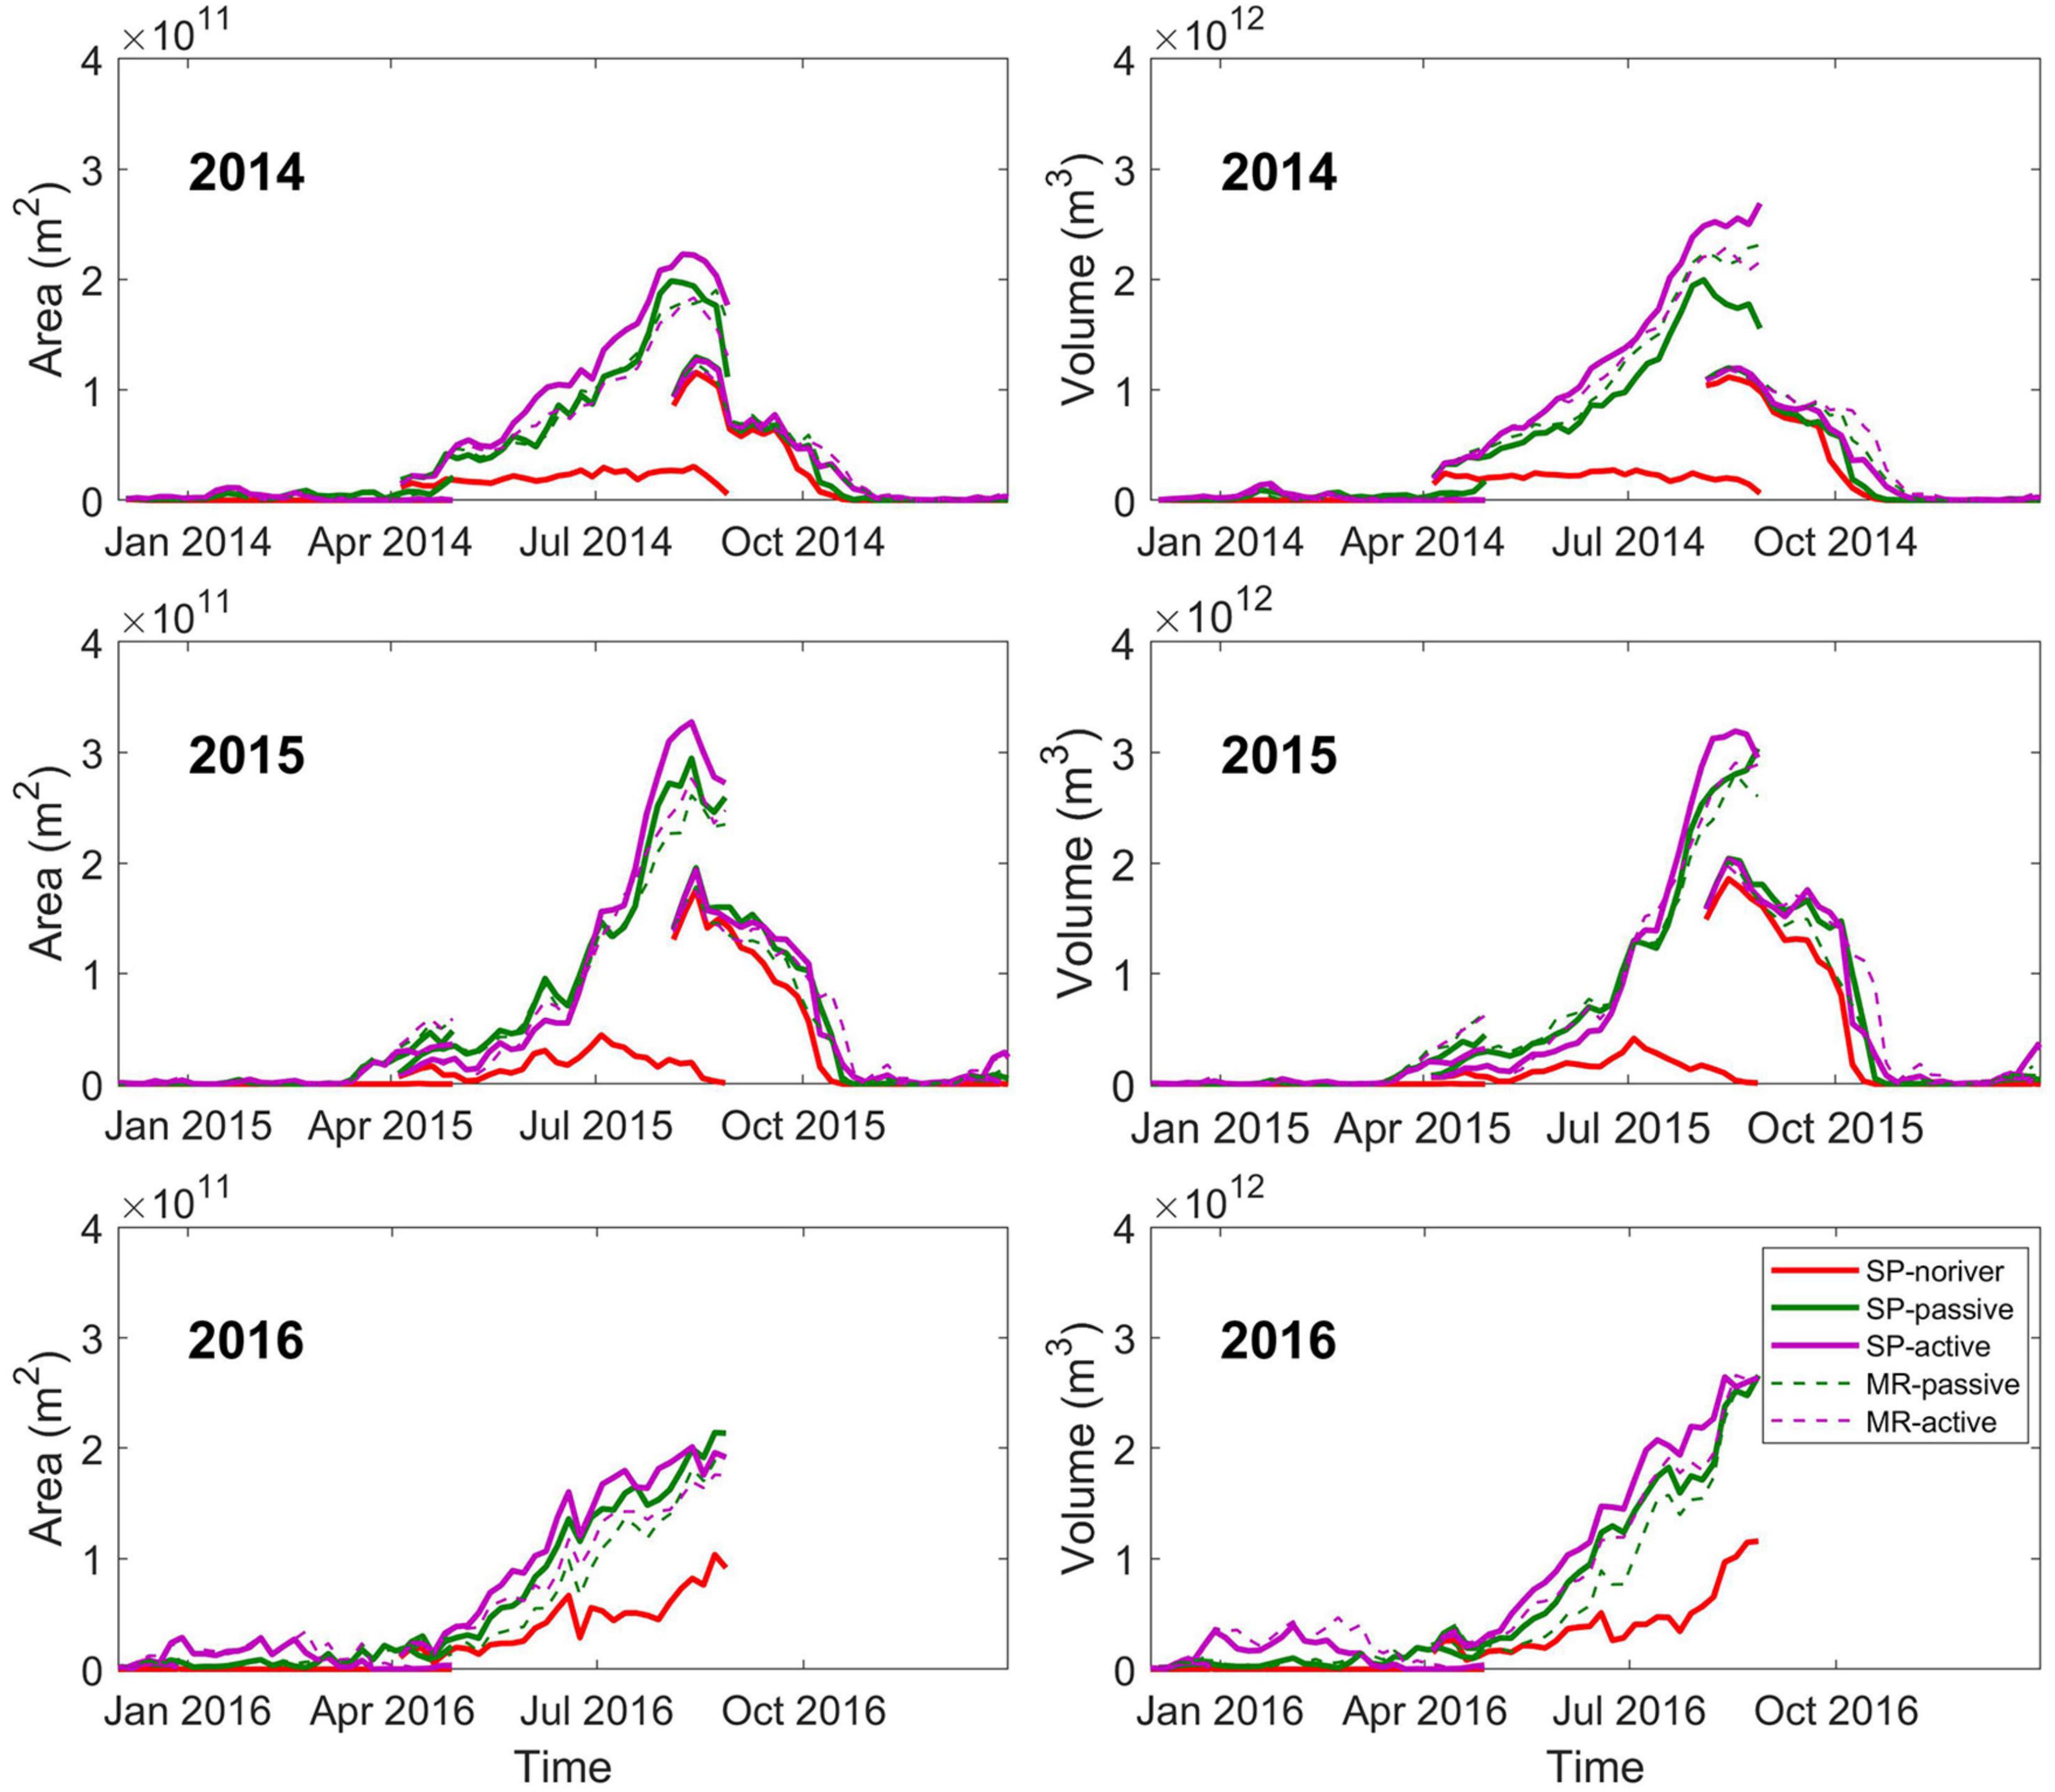
Figure 5. Time evolution of the ensemble mean area (left) and volume (right) of freshwater (psu < 34) in 2014, 2015, and 2016 in waters with depth greater than 100 m. The standard deviation is always much less than one order of magnitude of the mean value and is not shown for clarity.
Interannual changes are generally larger than the differences among different ensembles. As a reminder, for each 5-months long simulation period, the integrations share the atmospheric forcing and start from similar initial conditions (1-day apart). The freshwater area coverage tends to be low in winter, except for 2016, reaches ∼2–3 × 10¹¹ m2 during summer, and drops to less than 1011 m2 in November of 2014 and 2015. The freshwater volume follows an analogous evolution with comparable seasonality. The largest area and volume of low-salinity waters occur in the summer of 2015. Moreover, relatively lower freshwater coverage but comparable to 2015 freshwater volume is found in August 2016, implying that low salinity waters reached deeper than in other summers, because the larger fluxes occurred earlier in the year (Figure 1), when the MLD was deeper. In the 2016 summer the introduction of freshwater in the basin due to extreme precipitation events, which is illustrated by the increasing freshwater area and volume in the no-river case, is also a noticeable occurrence.
Differences among ensembles are small. The MR and SP runs have similar LCS representations and identical river forcing, and the freshwater spreading evolves similarly over time. In the active river configuration the velocity flux associated with the freshwater input contributes to a slightly greater spread compared to the passive set-up. Differences are larger whenever the freshwater discharge is high, as verified during winter/spring 2016 and more generally in the summer season.
The freshwater spreading is a near-surface process strongly affected by the upper-layer circulation dynamics. During late spring and summer the submesoscale circulations tend to further aid spreading in the SP simulations. In these seasons the prevailing submesoscale features are in the form of density fronts with horizontal advective tendency induced by confluence and convergence (Wang et al., 2021) that contribute to the transport of the riverine water. Indeed, in summer the discrepancy between SP and MR simulations is consistent among years. The lateral convergence zones in the submesoscale frontal structures that abound around the LCS (Zhong et al., 2012; D’Asaro et al., 2018) accumulate and distribute freshwater, contributing to the wider extension of riverine inputs. The summer submesoscale contribution is highlighted comparing the instantaneous distributions of surface salinity and frontogenetic tendency, F, defined as where is the total derivative and represents the rate of change () and (Hoskins, 1982; Capet et al., 2008) for a day in August 2015 (Figure 6). F, which is two orders of magnitude greater in the SP-active case compared to the MR-passive one, follows closely the freshwater pathways in all cases.
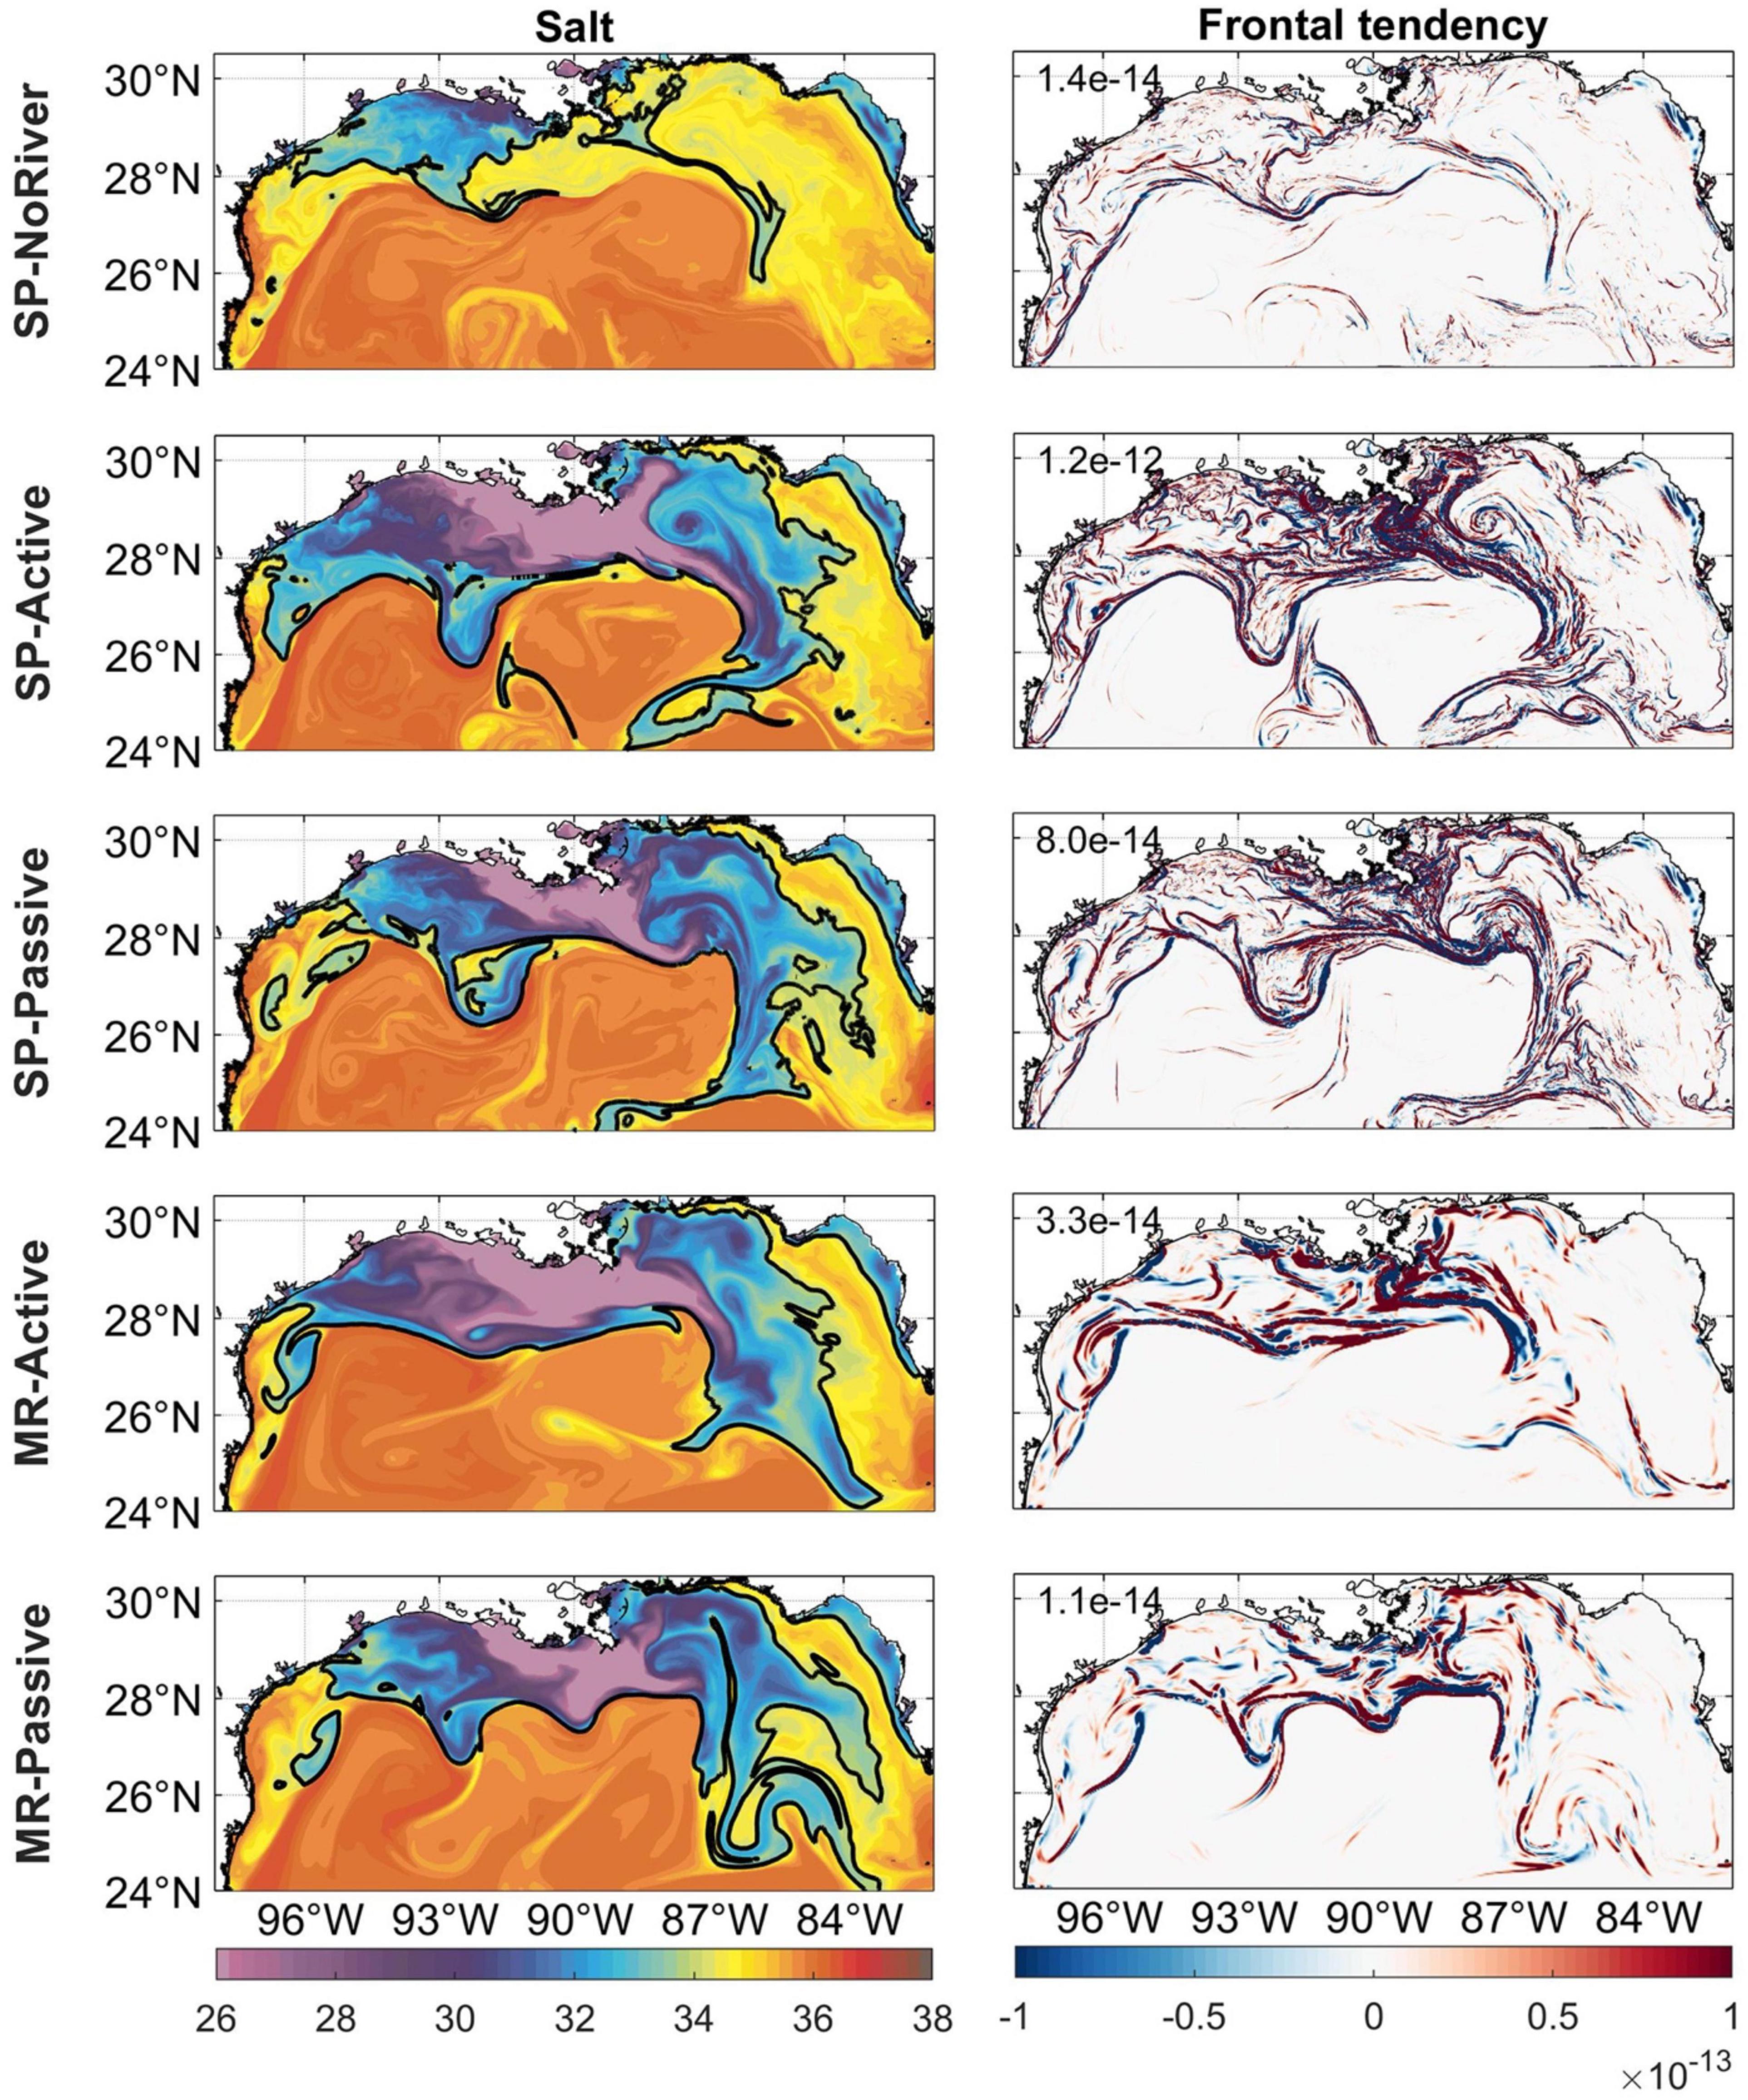
Figure 6. Instantaneous surface salinity and frontal tendency on August 05, 2015 in the first member of each of the 5 ensembles 5 months after initialization. Domain-averaged values for F are indicated in each plot. Black contours in salinity fields indicate 34 psu.
From late fall to early spring, on the other hand, the mixed-layer is deeper and offshore the continental shelf fronts and filaments can be more easily fragmented by submesoscale instabilities that extract energy from the mixed-layer and generate eddies that restratify the upper water column (Luo et al., 2016). The time evolution of F over waters deeper than 100 m is shown in Figure 7, where is also evident that within each given ensemble the internal variability is small even at the submesoscales. Given the conbined annual cycle of F and mixed-layer depth, the prevailing submesoscale circulations converge material at their interior (D’Asaro et al., 2018), stretching the freshwater patches in filaments less effectively than in summer. Furthermore, in these seasons low-salinity waters flow mostly along the LATEX shelve, due to the prevailing northeasterly and northerly winds and more limited river discharge. The submesoscale eddies and fragmented fronts that occupy waters with a depth greater than ∼ 100 m, have negligible impact on the freshwater spread in “normal” winters (2014 and 2015). On the other hand, in 2016, when the river runoff was very abundant and was pushed offshore by the anomalous winds, the submesoscale circulations cause a slight reduction in volume spread compared to the MR case by limiting the mixed-layer extention (Barkan et al., 2017b).

Figure 7. Time series of frontal tendency (in log scale) over the 8 integration periods in all the members of the 5 ensembles averaged over the model domain for which the water column is deeper than 100 m.
Horizontal and Vertical Transport of Riverine Waters
We next analyze the freshwater transport, T, highlighting the riverine water pathways. We do so by adopting the methodology introduced by Schiller et al. (2011) and applied to the GoM in subsequent works (Schiller and Kourafalou, 2014; Androulidakis et al., 2019; Brokaw et al., 2019). The freshwater transport is defined asT = V×fw×dx×dz where V is the horizontal velocity with its zonal or meridional components, dx is the corresponding space distance, dz is the vertical thickness, and fw is the freshwater anomaly calculated as fw = (Sb − S) / Sb. Here Sb is the background salinity field without the added river discharge (i.e., the mean salinity in no-river cases in this work) and S is the salinity field in each of the active or passive runs without any threshold applied. Since V and fw can be both positive and negative, positive zonal transport can be interpreted as either freshwater moving to the east (both positive) or saltier water moving westward (both negative). In the following we modify fw by setting all the negative values to zero in order to select the transport of freshwater. The difference between setting the negative fw to zero and considering freshwater anomalies of both signs is shown in Supplementary Figure 2, while Figure 2 and Supplementary Figure 3 display monthly salinity fields in one of the SP no-river and SP-active members, respectively. We stress that the mesoscale patterns are similar, but necessarily not identical among the runs (see also SBL21), and that the SP no-river ensemble includes contributions from precipitation anomalies in its freshwater budget.
The spatial patterns of freshwater transport integrated over the upper 100 m of the water column in the last month of the 5-month long runs in 2015 are shown in Figure 8 for the first member of the SP active-river ensemble. Positive values correspond to eastward and northward transport. Anticyclonic (clockwise) freshwater transport greater than 100 m3/s is detected at the periphery of large anticyclones in summer, especially near the north, east and south boundaries of the LC eddy (Figure 8, transport vector). A similar pattern is also observed in winter but with reduced transport associated with it. A small cyclonic eddy (Figure 3) with opposite transport can indeed be seen at about 94°W, 25°N during February.
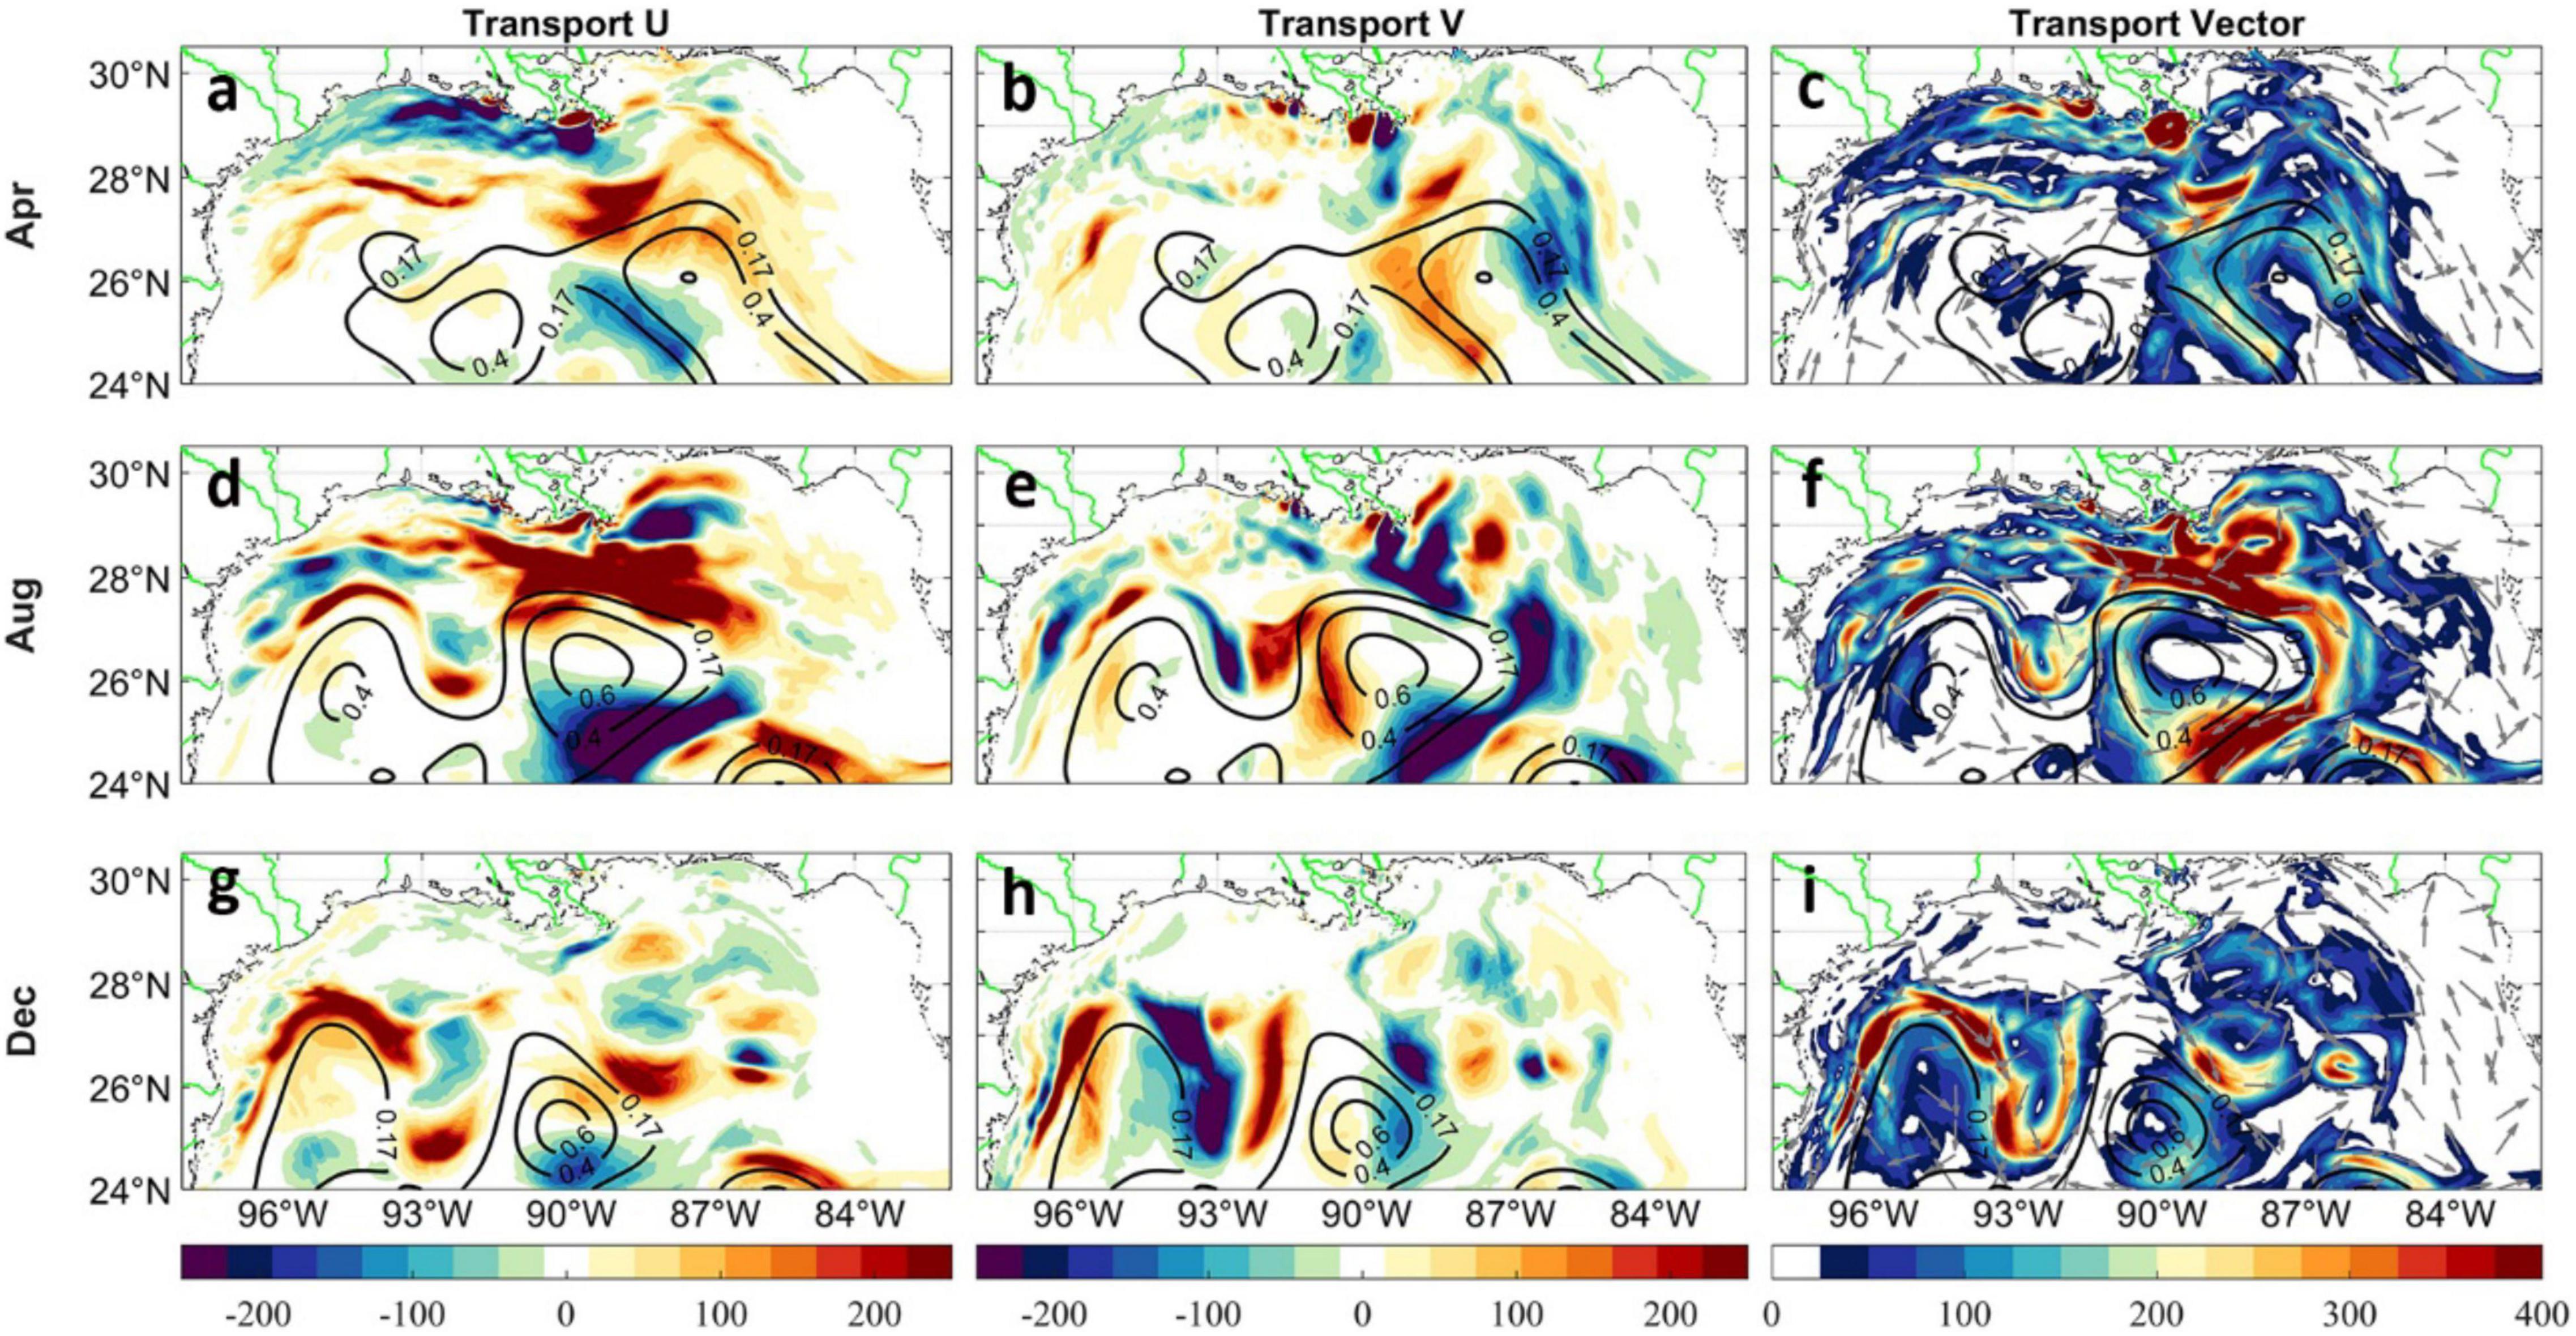
Figure 8. Monthly averaged freshwater zonal (a,d,g) and meridional (b,e,h) transport, as well as the transport vector (c,f,i) integrated over the upper 100 m in April, August, and December, 2015. The fields are obtained from the first member of the SP active ensemble. Units: m3/s. Contours show monthly averaged SSHa.
Previous studies on the offshore pathways of freshwater transport in the GoM have focused on the interactions between the LCS and MARS in summer (Schiller and Kourafalou, 2014; Androulidakis et al., 2019; Brokaw et al., 2019), following the peak of riverine discharge. Brokaw et al. (2019) identified three main pathways in summer by analyzing the surface salinity transport from 2010 to 2018, two of which are captured here and are realized by the relative positions of the LC and LC eddies with respect to the river plume. According to the first pathway, the freshwater is advected eastward from the MAFLA shelf, then southward and finally exits the GoM from the Florida Straits. The second pathway is characterized by narrow freshwater bands surrounding the LC eddies or the LC extension. This recirculation pattern advects the low-salinity waters offshore to the south, then westward and back north toward its source. The third pathway describes conditions when the Rings and the LC do not reach north enough to interact with the river plumes and no detectable interactions between the LCS and the MARS are found. This condition was relevant to portions of 2010 and 2012, when the freshwater remained distributed in the northern part of the basin with decreasing concentrations moving southward and a nearly homogenous gradient, but in the period considered here this third condition is never observed or simulated. On the other hand, a west-to-east offshore transport characterizes the summer of 2015 when two large Rings occupy the central GoM. The smaller cyclonic circulation found at about 93°W and 26°N in August acts as a bridge connecting these two anticyclones and contributes to the lateral transport of nearshore freshwaters from west to east. A similar redistribution pattern is observed also in the other two summers (Supplementary Figures 4, 5).
Our analysis indicates that the influence of the LC system on the offshore transport of freshwater extends to the winter seasons, despite its surface signature being significantly reduced. As mentioned, in winter the surface river discharge is confined to the western coastal regions due to the prevailing northerly and northeasterly winds. The low-salinity waters surrounding the LC and central LC eddies mainly originate from the confluence regions of downcoast inner shelf currents and upcoast outer shelf currents between 26 and 28°N, west of 96°W (Walker et al., 1996; Zavala-Hidalgo, 2003). The offshore transport is sustained by the jet associated with the decaying eddy or a pair of eddies usually found near the coast in this season (Zavala-Hidalgo, 2003), and seen, for example, between 93° and 96°W in Figure 3. This long-distance transport mechanism of nearshore, river-influenced waters is evident in April 2015 (Figure 8) and occurs also in 2014 and 2016 (Supplementary Figures 4, 5). Another important contribution to winter transport comes from summer coastal waters transported offshore that continue to be advected by the mesoscale field.
To expand our analysis to greater depths and fully encompass the GoM deep chlorophyll maximum located at around 100 m (e.g., Pasqueron de Fommervault et al., 2017) and the whole euphotic layer, we extended the computation of the integrated freshwater transport between 100 and 200 m (Figure 9). This calculation is relevant for the primary productivity of the basin being riverine water the main contributor to its nitrogen and phosphorus balance. Below 100 m the freshwater transport follows the boundary of the Rings and LC, with a pattern similar to that of the upper layer but overall decreased magnitude. Significantly enhanced values occur also inside/around cyclonic structures that are part of the LCS, which in August 2015 can be seen at about 94°W and 25°N in February and 93°W and 26°N.
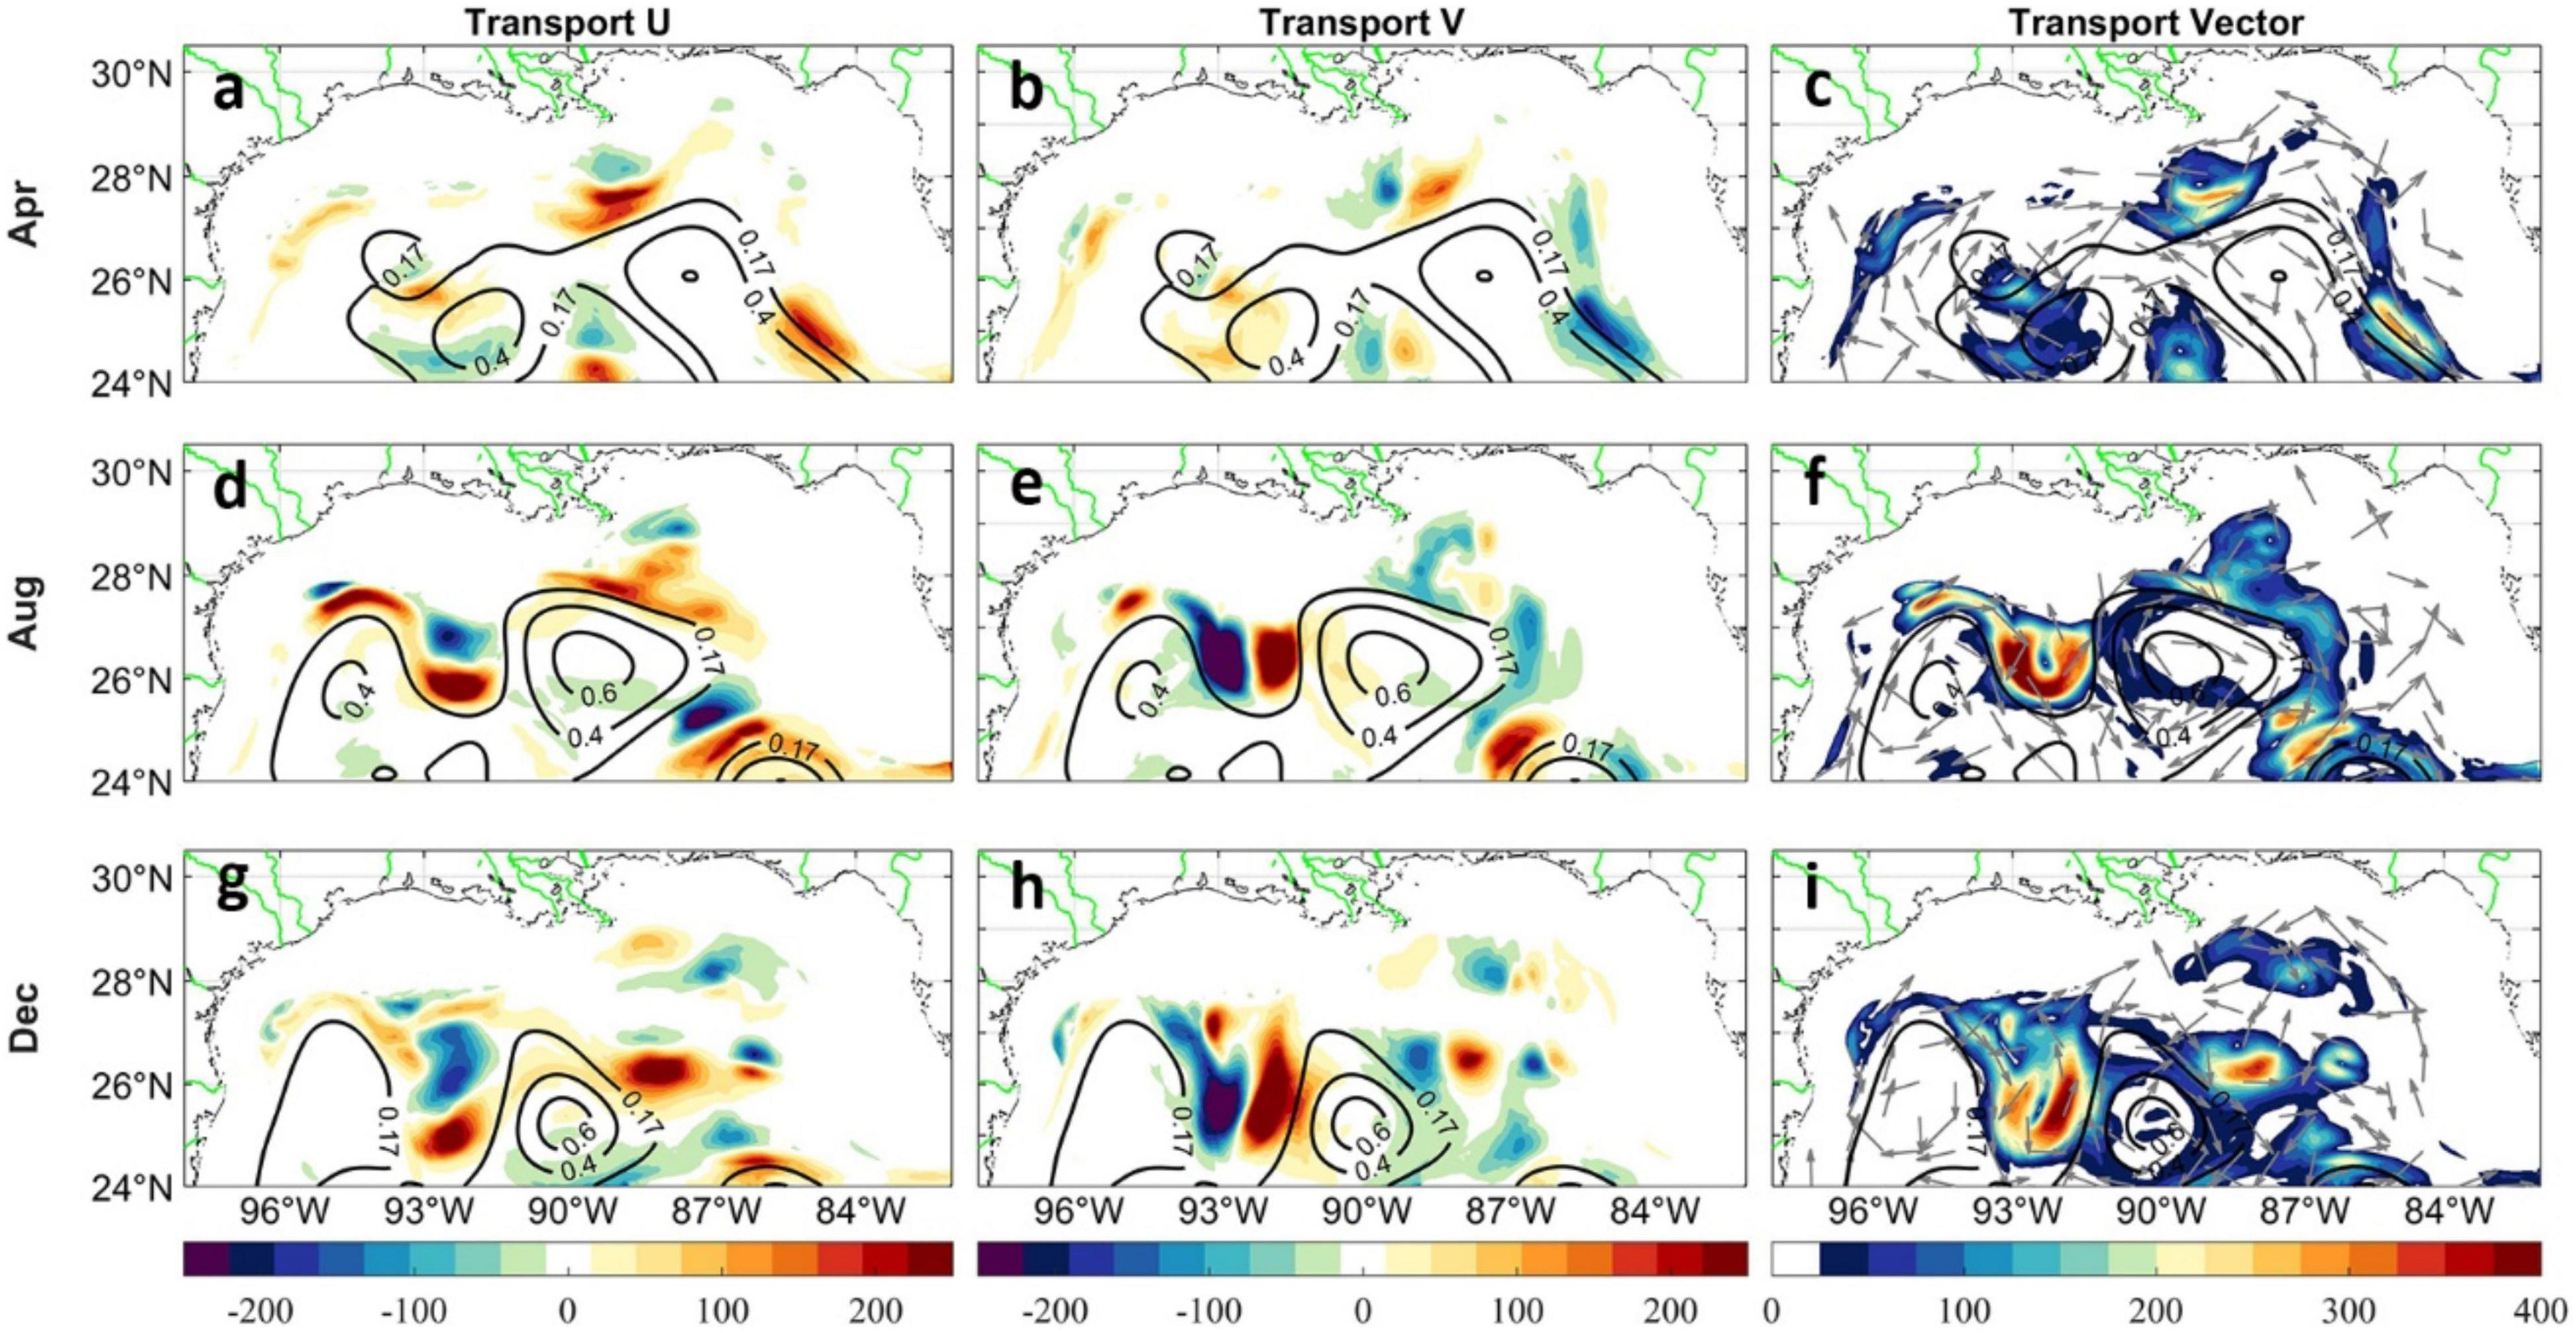
Figure 9. Monthly averaged freshwater zonal (a,d,g) and meridional (b,e,h) transport, as well as the transport vector (c,f,i) integrated between 100 and 200 m in April, August, and December 2015. The fields are obtained from the first member of the SP active ensemble. Units: m3/s.
Transport patterns and overall intensity are slightly greater in active runs than in passive configurations. This is quantified in Figure 10, where the probability density function of the transport vector is plotted for the month of August in all 3 years and two SP ensembles. Differences are small but robust, and corroborate the volume differences in low salinity waters quantified in Figure 5. Indeed, if the tails of the distributions are similar once the ensemble variability is accounted for, the core indicates greater transport in the active ensemble in the 50–300 m3/s in all members and all years. In addition, the largest transport rate identified by the flattest slope is detected in 2015 for both active and passive cases, while in 2014, the overall transport rate stays at the lowest level among all 3 years.
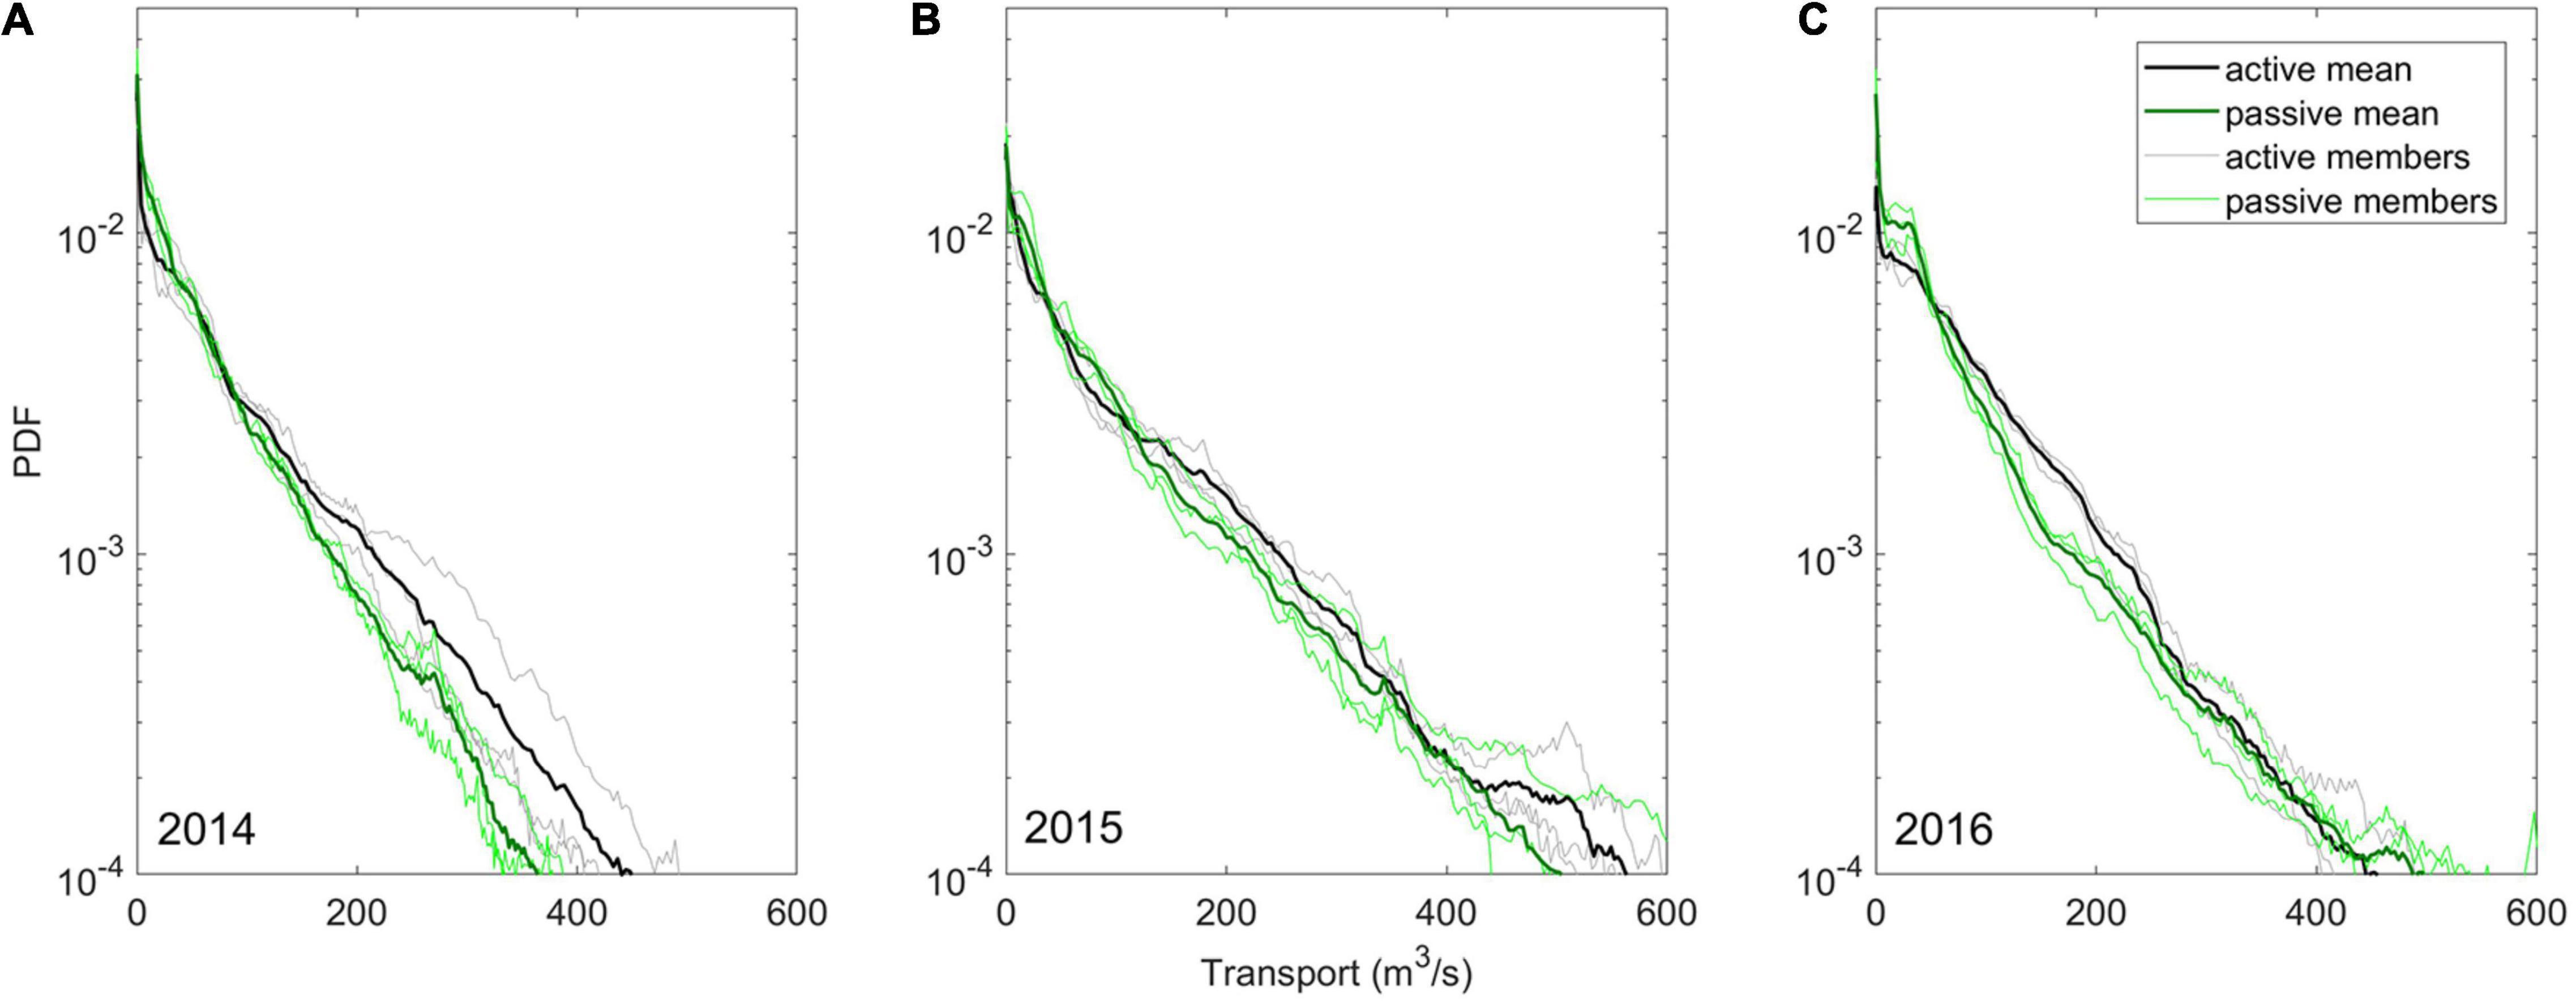
Figure 10. Probability density functions (PDFs) of active and passive transport ensembles for August of 2014 (A), 2015 (B), and 2016 (C).
Finally, the LCS controls not only the horizontal but also the vertical distribution of freshwater. In the passive configuration, the strength of the subduction around the LC and the Rings is reduced compared to the active runs. This is exemplified in Figure 11, where transects taken at latitudes ranging from 26 to 28°N are shown for June 2015. Here the choice of the month is due to the very strong similarity in the LCS in the two members considered. The contour of 1026 kg/m3 density is used to outline the position of different circulation features. The freshwater can penetrate to depths close to 600 m during summer, approaching the vertical scale of the LCS structures. The most intense vertical penetration is found at the periphery of the Rings. This feature, combined with the fact that meridional currents weaken with depth, contributes to a strong downwelling/subduction of freshwater into the deep ocean. In the northern portion of the basin, where the LC and the Rings do not intrude, the freshwater transport below the mixed layer is modest or null.
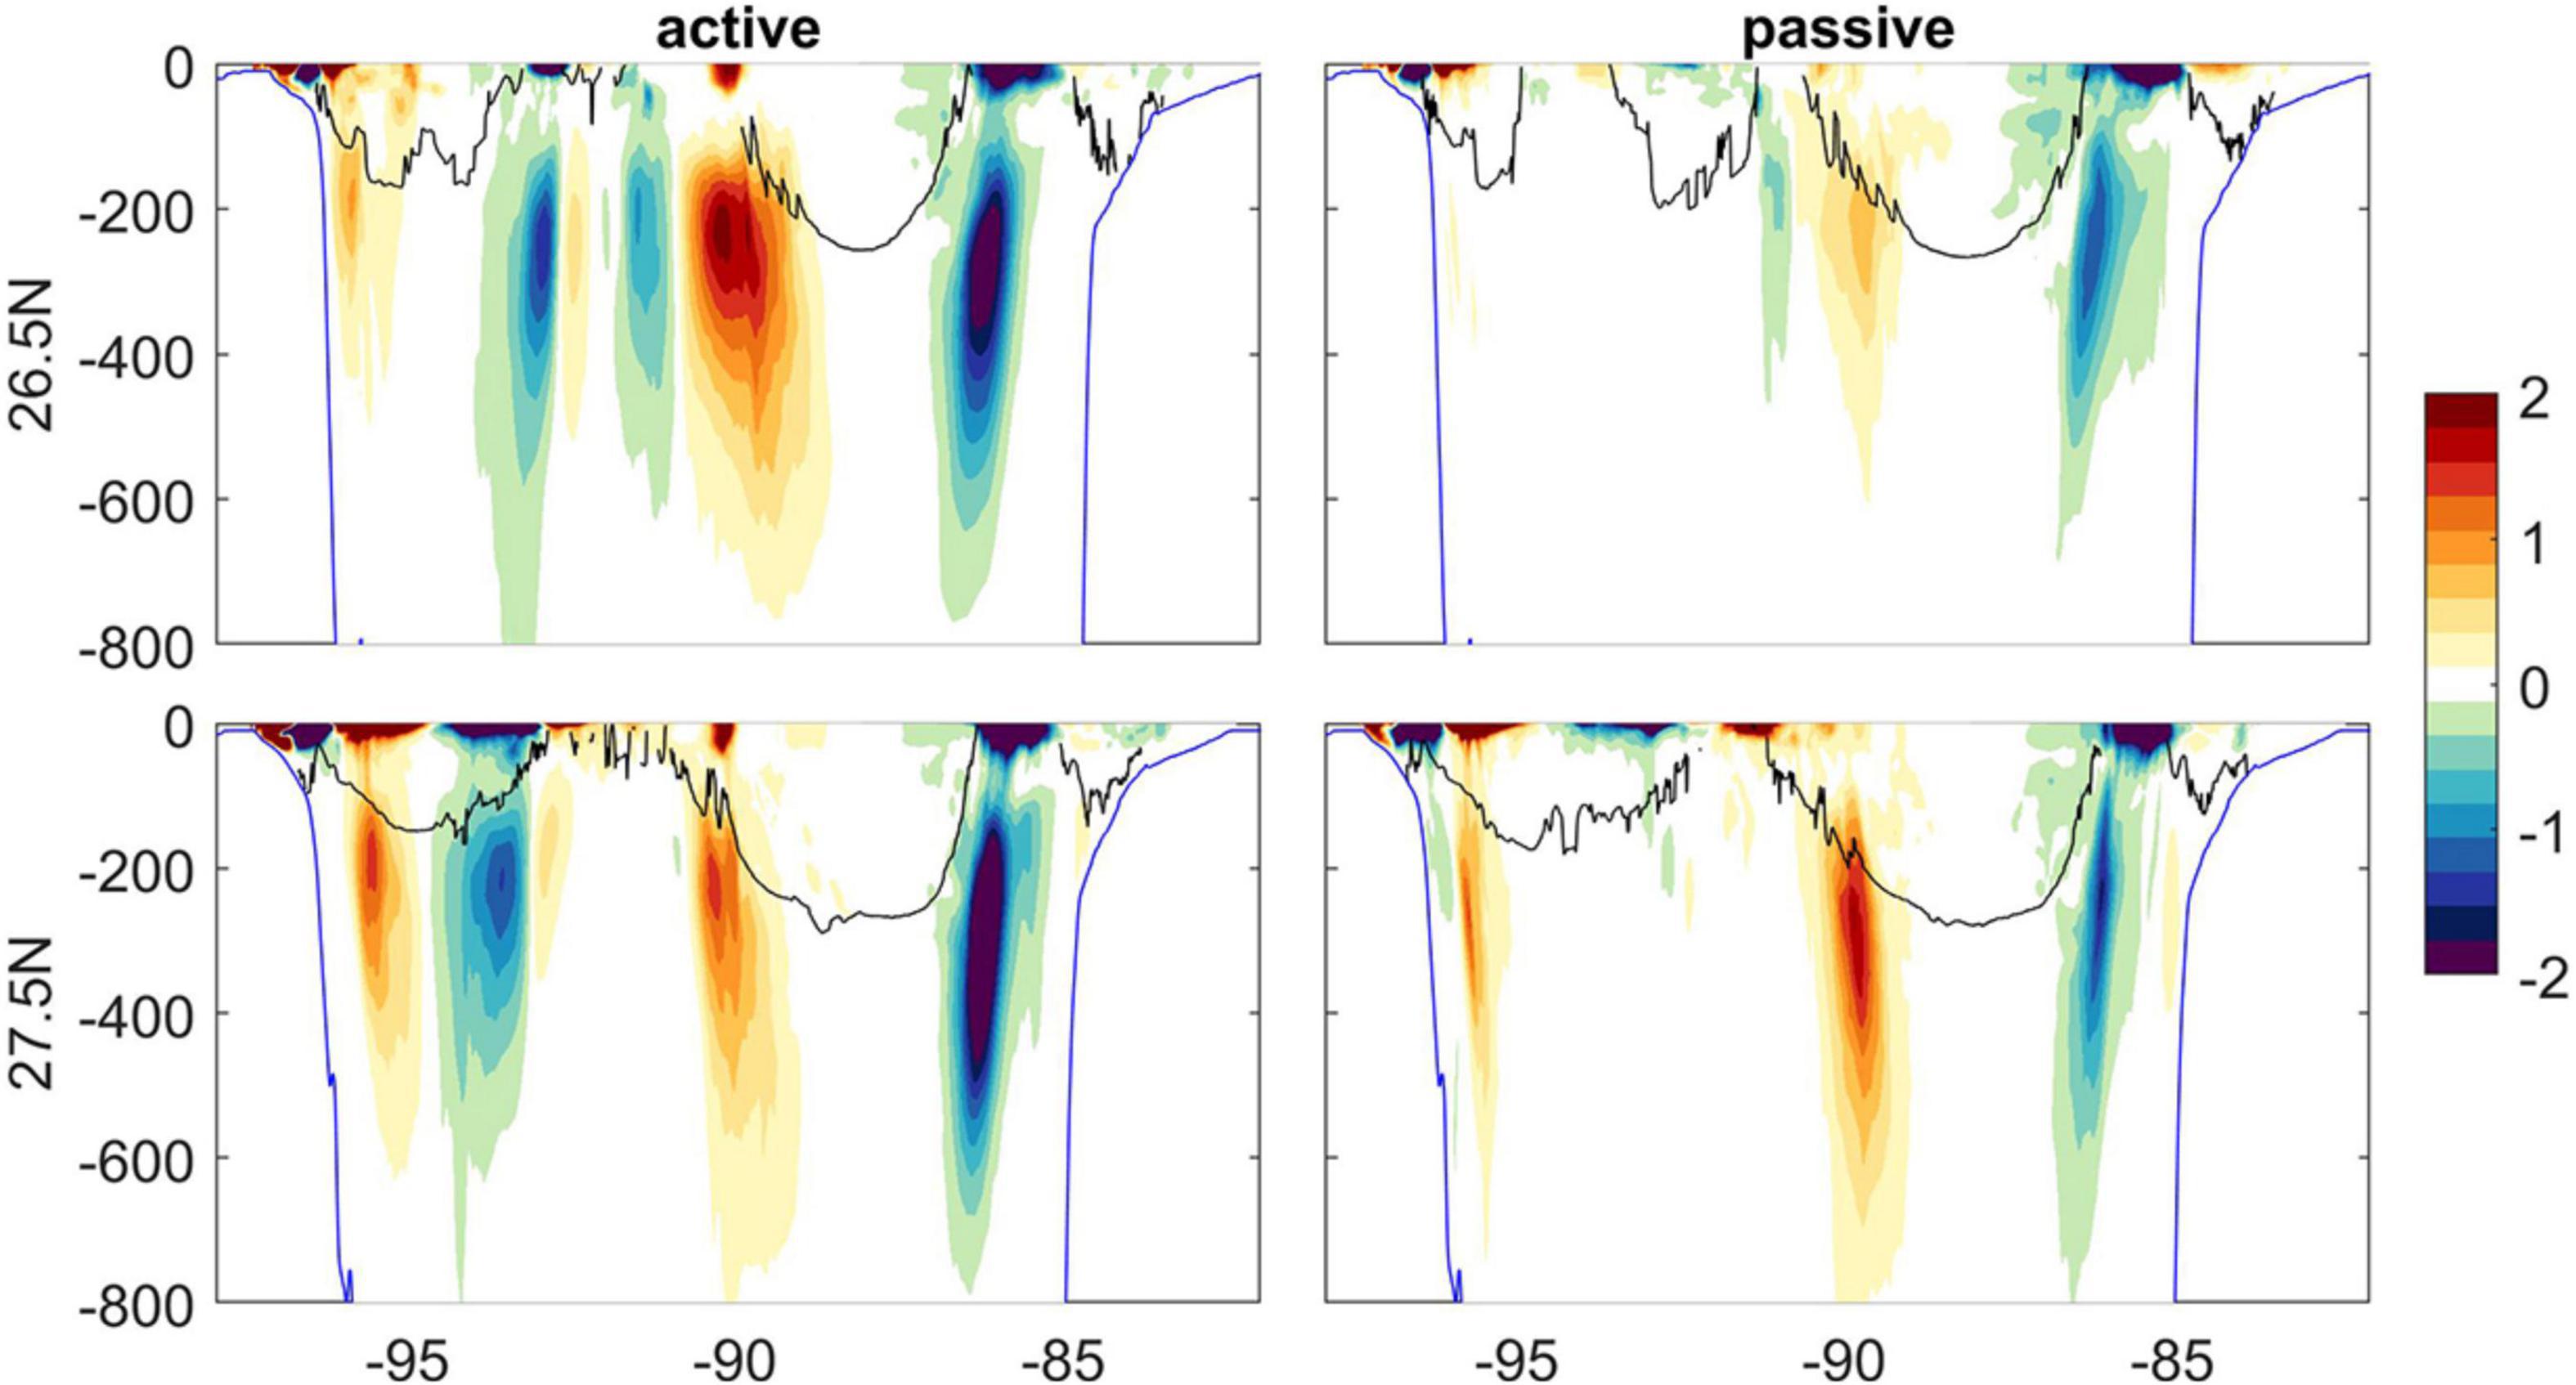
Figure 11. Monthly averaged meridional freshwater transport across different sections in June 2015 in the SP runs, active, and passive. Black line indicates the depth of density 1,026 kg/m3. Blue line provides the bathymetry information. Units: m3/s.
Conclusion
In this work we investigated the three-dimensional pathway and offshore transport of low-salinity riverine outflow in the GoM over a nearly 3-year period, using regional ocean simulations at mesoscale resolving and submesoscale permitting resolution. We extended previous studies that focused on the offshore removal process of near-surface freshwater from the MARS by exploring the intraseasonal variability of the offshore water transport. We considered simulations with different river configurations, ranging from no river inflow (no-river), to a passive configuration in which the riverine fluxes are converted to precipitation and are applied to an area extending offshore about 50 km from the river mouth, and finally to an active configuration with a point-source southward volume flux added at the mouth of each river. The passive configuration is usually preferred and has been used in several recent works showing realistic offshore extension of low-salinity waters in the GoM (Barkan et al., 2017a; Liu et al., 2021). However, the active configuration proves that converting the river discharge to a vertically decaying volume flux can increase the amount of riverine water that reaches offshore in the model runs, and its vertical extent.
It is well documented that river discharge that originated from the MARS interacts with the LC system in the summer season (Morey et al., 2003; Schiller et al., 2011; Schiller and Kourafalou, 2014; Androulidakis et al., 2019; Brokaw et al., 2019). During summer, the intrusions of the anticyclonic LC eddies entrain at their periphery freshwater from the river-influenced regions and move it toward the Gulf interior. These low-salinity waters are then transported either eastward by the LC and can exit through the Florida Straits, or westward to the central Gulf by the LC eddies. We showed that in winter the lateral transport of nearshore waters from confluence regions over the western shelf is the dominant pathway, but the southward transport of MARS waters by the LC eddies remains significant while less notable since the mixed-layer is deeper, the surface signature consequently less evident, and the amount of involved freshwater generally smaller (Figure 7).
Our analysis also provides evidence that the freshwater transport surrounding the LC and LC eddies penetrates as deep as ∼ 600 m. The low-salinity subduction processes are most prominent around the Rings and in the cyclonic circulations commonly generated when the LC eddies detach from the main current (Figures 8, 10).
On interannual timescales, the rainfall over the continental United States and the LC dynamics modulate the offshore reach of the riverine input in spring to fall, while the ENSO-induced co-variability of salinity and coastal currents in the northern GoM (Gomez et al., 2019) is the major player in winter (Munoz and Dee, 2017). Particularly, El Niño events are linked to large positive precipitation anomalies in late fall and winter, and declining values from spring onward (Lee et al., 2014, 2018). This rainfall anomaly and the associated storminess tendency that co-occur with strong El Niños, contributed to the extensive three-dimensional spread of low-salinity waters in the winter of 2016. The waters of riverine origin were more abundant and also transported to greater depths in spring 2016 compared to the spring in the other 2 years.
In addition to the dominant mesoscale LC circulations, we discussed the role of submesoscale motions in modulating the transport and distribution of freshwater in the GoM. Generally, the intensified submesoscale fronts accumulate, stretch and advect the freshwater plume (Zhong et al., 2012; D’Asaro et al., 2018). Given their abundance in the summer season, higher values of freshwater spreading area and volume are found in the SP cases in summer, following the maximum river runoff, when both mesoscale and submesoscale currents have the strongest influence on the distribution of low-salinity waters. The difference, however, is contained between 3 and 14% in area, and between 0 and 10% in volume for the offshore portion of the domain. In 2016, when the riverine inflow was large also in winter, the restratification by submesoscale eddies had a small but negative impact on the freshwater spreading, so that the overall freshwater volume found offshore is greater in the mesoscale resolving run.
In the vertical direction, submesoscale dynamics can significantly increase the vertical velocity and mixing rate within the mixed layers (Thomas and Ferrari, 2008; Thomas et al., 2008; Zhong and Bracco, 2013; Callies et al., 2015; Liu et al., 2018, 2021), and accelerate the subduction process of low-salinity waters as a result. Their offshore contribution, however, is limited in summer by the mixed-layer depth (Liu et al., 2021). As a result, the subduction in this season is mostly driven by the mesoscale circulations with comparable efficiency in the MR and SP ensembles.
Overall, differences are robust but small, with the submesoscale permitting resolution and the active river configuration contributing to the offshore spreading by making it slightly more efficient and deep reaching in most seasons. On the other hand, the predictability of offshore spreading of riverine water in all years considered is intrinsically linked to the internal (modeled) variability of the LCS and does not change significantly among ensembles. This is good news for biogeochemistry studies. While submesoscale circulations may impact the distribution and availability of nutrients, their contribution to the offshore redistribution of riverine waters remains small even in presence of very large outflows as in the case of the MARS.
Data Availability Statement
The datasets presented in this study can be found in online repositories. The names of the repository/repositories and accession number(s) can be found below: https://www.dropbox.com/sh/g5sywqcyqog0i8v/AAD2LvGMlCy2rHk-t1zQzHA8a?dl=0.
Author Contributions
AB conceived the work. DS performed the simulations. GL conducted the analyses and wrote the first draft. All authors contributed to the interpretation of the results and to the writing of the article, to the article and approved the submitted version.
Funding
This work was supported by the Gulf Research Program (GRP) of the National Academies of Sciences, Engineering, and Medicine through its Understanding Gulf Ocean Systems 2 (UGOS-2) Grant “The Loop Current and the Mississippi-Atchafalaya River System: Interactions, Variability, and Modeling Requirements.” GL and AB were partially supported by the National Science Foundation (OCE - 1658174).
Conflict of Interest
The authors declare that the research was conducted in the absence of any commercial or financial relationships that could be construed as a potential conflict of interest.
Publisher’s Note
All claims expressed in this article are solely those of the authors and do not necessarily represent those of their affiliated organizations, or those of the publisher, the editors and the reviewers. Any product that may be evaluated in this article, or claim that may be made by its manufacturer, is not guaranteed or endorsed by the publisher.
Supplementary Material
The Supplementary Material for this article can be found online at: https://www.frontiersin.org/articles/10.3389/fmars.2022.841900/full#supplementary-material
References
Androulidakis, Y., Kourafalou, V., Le Hénaff, M., Kang, H., Sutton, T., Chen, S., et al. (2019). Offshore spreading of Mississippi Waters: pathways and vertical structure under eddy influence. J. Geophys. Res. 124, 5952–5978. doi: 10.1029/2018jc014661
Barkan, R., McWilliams, J. C., Shchepetkin, A. F., Molemaker, M. J., Renault, L., Bracco, A., et al. (2017a). Submesoscale dynamics in the Northern Gulf of Mexico. Part I: Regional and seasonal characterization and the role of river outflow. J. Phys. Oceanogr. 47, 2325–2346. doi: 10.1175/jpo-d-17-0035.1
Barkan, R., McWilliams, J. C., Molemaker, M. J., Choi, J., Srinivasan, K., Shchepetkin, A. F., et al. (2017b). Submesoscale dynamics in the Northern Gulf of Mexico. Part II: Temperature–salinity relations and cross-shelf transport processes. J. Phys. Oceanogr. 47, 2347–2360. doi: 10.1175/jpo-d-17-0040.1
Bracco, A., Liu, D., and Sun. (2019). Mesoscale-submesoscale interactions in the Gulf of Mexico: From oil dispersion to climate. Chaos Solitons Fract. 119, 63–72.
Brokaw, R. J., Subrahmanyam, B., and Morey, S. L. (2019). Loop Current and eddy-driven salinity variability in the Gulf of Mexico. Geophys. Res. Lett. 46, 5978–5986. doi: 10.1029/2019gl082931
Cai, Z., and Gan, J. (2017). Formation and dynamics of a long-lived eddy train in the South China Sea: a modeling study. J. Phys. Oceanogr. 47, 2793–2810. doi: 10.1175/JPO-D-17-0002.1
Callies, J., Ferrari, R., Klymak, J. M., and Gula, J. (2015). Seasonality in submesoscale turbulence. Nat. Commun. 6:6862. doi: 10.1038/ncomms7862
Capet, X., McWilliams, J. C., Molemaker, M. J., and Shchepetkin, A. F. (2008). Mesoscale to submesoscale transition in the California Current System. Part II: Frontal processes. J. Phys. Oceanogr. 38, 44–64. doi: 10.1175/2007JPO3672.1
Cardona, Y., Ruiz-Ramos, D. V., Baums, I. B., and Bracco, A. (2016). Potential connectivity of coldwater black coral communities in the northern Gulf of Mexico. PLoS One 11:e0156257. doi: 10.1371/journal.pone.015625
Childers, D. L., Day, J. W., and Muller, R. A. (1990). Relating climatological forcing to coastal water levels in Louisiana estuaries and the potential importance of El Nino-Southern Oscillation events. Clim. Res. 1, 31–42.
Choi, J., Bracco, A., Barkan, R., Shchepetkin, A. F., McWilliams, J. C., and Molemaker, J. (2017). Submesoscale dynamics in the northern Gulf of Mexico. Part III: Lagrangian implications. Phys. Ocean 47, 2361–2376.
Cummings, J. A. (2005). Operational multivariate ocean data assimilation. Q. J. Roy. Meteorol. Soc. 131, 3583–3604. doi: 10.1256/qj.05.105
Cummings, J. A., and Smedstad, O. M. (2013). “Variational data assimilation for the global ocean,” in Data Assimilation for Atmospheric, Oceanic and Hydrologic Applications (Vol. II), eds S. K. Park and L. Xu (Berlin: Springer Berlin Heidelberg), 303–343. doi: 10.1007/978-3-642-35088-7_13
da Silva, C. E., and Castelao, R. M. (2018). Mississippi River plume variability in the Gulf of Mexico from SMAP and MODIS-Aqua observations. J. Geophys. Res. 123, 6620–6638. doi: 10.1029/2018JC014159
D’Asaro, E. A., Shcherbina, A. Y., Klymak, J. M., and Molemaker, J. (2018). Ocean convergence and the dispersion of flotsam. Proc. Natl. Acad. Sci. U.S.A. 115:1162. doi: 10.1073/pnas.1718453115
Debreu, L., Marchesiello, P., Penven, P., and Cambon, G. (2012). Two-way nesting in split-explicit ocean models: Algorithms, implementation and validation. Ocean Model. 4, 1–21. doi: 10.1016/j.ocemod.2012.03.003
Debreu, L., Vouland, C., and Blayo, E. (2008). AGRIF: Adaptive grid refinement in Fortran. Comput. Geosci. 34, 8–13. doi: 10.1016/j.cageo.2007.01.009
Donohue, K. A., Watts, D. R., Hamilton, P., Leben, R., and Kennelly, M. (2016). Loop Current Eddy formation and baroclinic instability. Dynam. Atmosph. Oceans 76, 195–216. doi: 10.1016/j.dynatmoce.2016.01.004
Feng, Y., Menemenlis, D., Xue, H., Zhang, H., Carroll, D., Du, Y., et al. (2021). Improved representation of river runoff in Estimating the Circulation and Climate of the Ocean Version 4 (ECCOv4) simulations: implementation, evaluation, and impacts to coastal plume regions. Geosci. Model. Dev. 14, 1801–1819. 2021 doi: 10.5194/gmd-14-1801-2021,
Fournier, S., Reager, J. T., Dzwonkowski, B., and Vazquez-Cuervo, J. (2019). Statistical mapping of freshwater origin and fate signatures as land/ocean “regions of influence” in the Gulf of Mexico. J. Geophys. Res. Oceans 124, 4954–4973. doi: 10.1029/2018jc014784
Gomez, F. A., Lee, S. K., Hernandez, F. J. Jr., Chiaverano, L. M., Muller-Karger, F. E., Liu, Y., et al. (2019). ENSO-induced co-variability of salinity, plankton biomass and coastal currents in the Northern Gulf of Mexico. Scient. Rep. 9:178. doi: 10.1038/s41598-018-36655-y
Hamilton, P. (2009). Topographic Rossby waves in the Gulf of Mexico. Progr. Oceanogr. 82, 1–31. doi: 10.1016/j.pocean.2009.04.019
Hamilton, P., Lugo-Fernández, A., and Sheinbaum, J. (2016). A Loop Current experiment: Field and remote measurements. Dynam. Atmosph. Oceans 76, 156–173. doi: 10.1016/j.dynatmoce.2016.01.005
Horner-Devine, A. R., Hetland, R. D., and MacDonald, D. G. (2015). Mixing and transport in coastal river plumes. Annu. Rev. Fluid Mech. 47, 569–594.
Hoskins, B. J. (1982). The Mathematical theory of frontogenesis. Annu. Rev. Fluid Mech. 14, 131–151. doi: 10.1146/annurev.fl.14.010182.001023
Hu, C., Nelson, J. R., Johns, E., Chen, Z., Weisberg, R. H., and Müller-Karger, F. E. (2005). Mississippi River water in the Florida Straits and in the Gulf Stream off Georgia in summer 2004. Geophys. Res. Lett. 32:14. doi: 10.1029/2005gl022942
Huntley, H. S., Lipphardt, B. L., Jacobs, G., and Kirwan, A. D. (2015). Clusters, deformation, and dilation: Diagnostics for material accumulation regions. J. Geophys. Res. 120, 6622–6636. doi: 10.1002/2015jc011036
Justic, D., Kourafalou, V., Mariotti, G., He, S., and Weisberg, R. (2021). A review of transport processes in the Gulf of Mexico along the river-estuary-shelf-ocean continuum: a synthesis of research from the Gulf of Mexico Research Initiative. Estuar. Coasts. 5, 1–37. doi: 10.1007/s12237-021-01005-1
Kobashi, D., and Hetland, R. (2020). Reproducibility and variability of submesoscale frontal eddies on a broad, low-energy shelf of freshwater influence. Ocean Dynam. 70, 1377–1395.
Krug, A. (1993). Drainage history and land use pattern of a Swedish river system – their importance for understanding nitrogen and phosphorus load. Hydrobiologia 251, 285–296.
Large, W. G., McWilliams, J. C., and Doney, S. C. (1994). Oceanic vertical mixing: A review and a model with a nonlocal boundary layer parameterization. Rev. Geophys. 32, 363–403. doi: 10.1029/94RG01872
Leben, R. R., and Born, G. H. (1993). Tracking Loop Current eddies with satellite altimetry. Adv. Space Res. 13, 325–333. doi: 10.1016/0273-1177(93)90235-4
Lee, S.-K., Lopez, H., Chung, E.-S., DiNezio, P., Yeh, S.-W., and Wittenberg, A. T. (2018). On the fragile relationship between El Niño and California rainfall. Geophys. Res. Lett. 45, 907–915. doi: 10.1002/2017GL076197
Lee, S.-K., Mapes, B. E., Wang, C., Enfield, D. B., and Weaver, S. J. (2014). Springtime ENSO phase evolution and its relation to rainfall in the continental U.S. Geophys. Res. Lett. 41, 1673–1680. doi: 10.1002/2013GL059137
Liu, G., Bracco, A., and Passow, U. (2018). The influence of mesoscale and submesoscale circulation on sinking particles in the northern Gulf of Mexico. Elementa 6:36. doi: 10.1525/elementa.292
Liu, G., Bracco, A., and Sitar, A. (2021). Submesoscale mixing across the mixed layer in the Gulf of Mexico. Front. Mar. Sci. 8:615066. doi: 10.3389/fmars.2021.615066
Luo, H., Bracco, A., Cardona, Y., and McWilliams, J. C. (2016). The submesoscale circulation in the Northern Gulf of Mexico: Surface processes and the impact of the freshwater river input. Ocean Model. 101, 68–82. doi: 10.1016/j.ocemod.2016.03.003
Mason, O. U., Canter, E. J., Gillies, L. E., Paise, T. K., and Roberts, B. J. (2016). Mississippi River Plume Enriches Microbial Diversity in the Northern Gulf of Mexico. Front. Microbiol. 7:1048. doi: 10.3389/fmicb.2016.01048
McWilliams, J. C. (2008). Fluid dynamics at the margin of rotational control. Environ. Fluid Mech. 8, 441–449. doi: 10.1007/s10652-008-9081-8
Morey, S. L., Martin, P. J., O’Brien, J. J., Wallcraft, A. A., and Zavala-Hidalgo, J. (2003). Export pathways for river discharged fresh water in the northern Gulf of Mexico. J. Geophys. Res. 108:3303. doi: 10.1029/2002jc001674
Munoz, S. E., and Dee, S. G. (2017). El Niño increases the risk of lower Mississippi River flooding. Scient. Rep. 7:1772. doi: 10.1038/s41598-017-01919-6
Pasqueron de Fommervault, O., Perez-Brunius, P., Damien, P., Camacho-Ibar, V. F., and Sheinbaum, J. (2017). Temporal variability of chlorophyll distribution in the Gulf of Mexico: bio-optical data from profiling floats. Biogeosciences 14, 5647–5662. doi: 10.5194/bg-14-5647-2017
Poje, A. C., Özgökmen, T. M., Lipphardt, B. L. Jr., and Haus, B. K. (2014). Submesoscale dispersion in the vicinity of the Deepwater Horizon spill. Proc. Natl. Acad. Sci. U.S.A. 111:12693. doi: 10.1073/pnas.1402452111
Renault, L., Molemaker, M. J., Gula, J., Masson, S., and McWilliams, J. C. (2016). Control and stabilization of the Gulf Stream by oceanic current interaction with the atmosphere. J. Phys. Oceanogr. 11, 3439–3453.
Schiller, R. V., and Kourafalou, V. H. (2014). Loop Current impact on the transport of Mississippi River Waters. J. Coastal Res. 298, 1287–1306. doi: 10.2112/jcoastres-d-13-00025.1
Schiller, R. V., Kourafalou, V. H., Hogan, P., and Walker, N. D. (2011). The dynamics of the Mississippi River plume: Impact of topography, wind and offshore forcing on the fate of plume waters. J. Geophys. Res. 116:C06029. doi: 10.1029/2010jc006883
Schimidt, N., Lipp, E. K., Rose, J. B., and Luther, M. E. (2001). ENSO influences on seasonal rainfall and river discharge in Florida. J. Clim. 14, 615–628.
Shchepetkin, A. F., and McWilliams, J. C. (2003). A method for computing horizontal pressure-gradient force in an oceanic model with a nonaligned vertical coordinate. J. Geophys. Res. 108:3090. doi: 10.1029/2001JC001047
Shchepetkin, A. F., and McWilliams, J. C. (2011). Accurate Boussinesq oceanic modeling with a practical, “Stiffened” Equation of State. Ocean Model. 38, 41–70. doi: 10.1016/j.ocemod.2011.01.010
Sikirić, M. D., Janeković, I., and Kuzmić, M. (2009). A new approach to bathymetry smoothing in sigma-coordinate ocean models. Ocean Model. 29, 128–136. doi: 10.1016/j.ocemod.2009.03.009
Smith, W. H. F., and Sandwell, D. T. (1997). Global sea floor topography from satellite altimetry and ship depth soundings. Science 277, 1956–1962. doi: 10.1126/science.277.5334.1956
Sun, D., Bracco, A., and Liu, G. (2021). The role of freshwater forcing on surface predictability in the Gulf of Mexico. J. Geoph. Res. Oceans arXiv:2112.10309 [preprint].
Thomas, L., and Ferrari, R. (2008). Friction, frontogenesis, and the stratification of the surface mixed layer. J. Phys. Oceanogr. 38, 2501–2518. doi: 10.1175/2008jpo3797.1
Thomas, L., Tandon, A., and Mahadevan, A. (2008). Submesoscale processes and dynamics. Ocean Modeling in an Eddying Regime, Geophys. Monogr. A. Geophys. 177, 17–38. doi: 10.1029/177GM04
Walker, N. D., Huh, O. K., Rouse, L. J. Jr., and Murray, S. P. (1996). Evolution and structure of a coastal squirt off the Mississippi River delta: Northern Gulf of Mexico. J. Geophys. Res. 101, 20643–20655. doi: 10.1029/96JC00919
Walker, N. D., Rouse, L. J. Jr., Fargion, G. S., and Biggs, D. C. (1994). The Great Flood of summer 1993: Mississippi River discharge studied, Eos. Transact. Am. Geophys. 75, 409–415. doi: 10.1029/94EO01045
Wang, T., Barkan, R., McWilliams, J. C., and Molemaker, M. J. (2021). Structure of submesoscale fronts of the Mississippi River Plume. J. Phys. Oceanogr. 51, 1113–1131. doi: 10.1175/JPO-D-20-0191.1
Zavala-Hidalgo, J. (2003). Seasonal circulation on the western shelf of the Gulf of Mexico using a high-resolution numerical model. J. Geophys. Res. 108:3389. doi: 10.1029/2003jc001879
Zeng, X., Bracco, A., and Tagklis, F. (2021). Dynamical impact of the Mekong River plume in the South China Sea. Oceans. Available as arXiv:2112.11252 [preprint].
Zhong, Y., and Bracco, A. (2013). Submesoscale impacts on horizontal and vertical transport in the Gulf of Mexico. Oceans 118, 5651–5668. doi: 10.1002/jgrc.20402
Keywords: Gulf of Mexico, freshwater offshore pathways, regional modeling, submesoscales, riverine modeling
Citation: Liu G, Bracco A and Sun D (2022) Offshore Freshwater Pathways in the Northern Gulf of Mexico: Impacts of Modeling Choices. Front. Mar. Sci. 9:841900. doi: 10.3389/fmars.2022.841900
Received: 22 December 2021; Accepted: 23 February 2022;
Published: 17 March 2022.
Edited by:
Alejandro Jose Souza, Center for Research and Advanced Studies - Mérida Unit, MexicoReviewed by:
Alejandro Orfila, Spanish National Research Council (CSIC), SpainHui Wu, East China Normal University, China
Copyright © 2022 Liu, Bracco and Sun. This is an open-access article distributed under the terms of the Creative Commons Attribution License (CC BY). The use, distribution or reproduction in other forums is permitted, provided the original author(s) and the copyright owner(s) are credited and that the original publication in this journal is cited, in accordance with accepted academic practice. No use, distribution or reproduction is permitted which does not comply with these terms.
*Correspondence: Annalisa Bracco, YWJyYWNjb0BnYXRlY2guZWR1
 Guangpeng Liu
 Annalisa Bracco
 Daoxun Sun