
94% of researchers rate our articles as excellent or good
Learn more about the work of our research integrity team to safeguard the quality of each article we publish.
Find out more
ORIGINAL RESEARCH article
Front. Mar. Sci., 24 March 2022
Sec. Coastal Ocean Processes
Volume 9 - 2022 | https://doi.org/10.3389/fmars.2022.841364
This article is part of the Research TopicOceanographic Processes Linking Nearshore, Continental Shelf, and Shelf BreakView all 34 articles
An unprecedented large-scale outbreak of harmful algae, including Karenia selliformis and Karenia mikimotoi, was reported in mid-September 2021 in the northwest Pacific Ocean off southeastern Hokkaido, Japan. It inflicted catastrophic damage on coastal fisheries in the ensuing months. To understand the spatiotemporal distribution of Karenia spp. abundance, we conducted extensive ship-based surveys across several water masses during 4–14 October, 2021 and analyzed in-situ data in combination with Sentinel-3-derived ocean color imagery with a horizontal resolution of 300 m. High chlorophyll-a concentrations (exceeding 10 mg m–3) were identified mainly in coastal shelf–slope waters of <1,000-m water depth occupied by Surface Coastal Oyashio Water or Modified Soya Warm Current Water. Karenia spp. abundance was strongly correlated with chlorophyll-a concentration, which typically had a shallow vertical maximum within the surface mixed layer. Large- and small-scale distributions of Karenia spp. abundance at the ocean surface were estimated from two satellite-imagery products: maximum line height and red-band difference. Maps generated of Karenia spp. abundance revealed snapshots of dynamic Karenia bloom distributions. Specifically, the cores of Karenia blooms were located on continental shelves, sometimes locally exceeded 104 cells mL–1, and seemed to be connected intermittently to very nearshore waters. Relatively high-abundance areas (>103 cells mL–1) of Karenia spp. on the shelf were characterized by submesoscale (i.e., 1–10 km) patch- or streak-like distributions, or both. Within a roughly 24-h period from 12 to 13 October, Karenia-spp. abundances averaged over the shelf abruptly increased more than doubled; these abundance spikes were associated with the combined effects of physical advection and algal growth. The obtained maps and features of Karenia spp. abundance will provide basic estimates needed to understand the processes and mechanisms by which algal blooms can inflict damage on regional fisheries.
Harmful algal blooms (HABs) are a critical global problem, and their increasing frequency and severity may be tied to climate change (e.g., Wells et al., 2015, 2020; Frölicher and Laufkötter, 2018; IPCC [Intergovernmental Panel on Climate Change], 2019; Trainer et al., 2019). Over the last decade, many incidents that have inflicted devastating damage on marine ecosystems and human well-being across the world’s oceans have been attributed to HABs of record-breaking scale; the HABs have been associated with basin-scale ocean and atmospheric variability, particularly anomalously high temperatures (i.e., marine heatwaves) (Lefebvre et al., 2016; McCabe et al., 2016; Ryan et al., 2017; León-Muñoz et al., 2018; Roberts et al., 2019; Bondur et al., 2021).
An unfortunate feature of large-scale HABs along open coastlines is that even if natural, healthy marine environments are maintained without artificial eutrophication, HABs can develop and progress without initially being noticed by human observers and can bloom abruptly to uncontrollable levels (e.g., Anderson et al., 2008; Vargo et al., 2008; White et al., 2014; Du et al., 2016; Crawford et al., 2021). Even in places where harmful algal species have been rarely observed, once a harmful outbreak occurs, further outbreaks can occur repeatedly in subsequent years (e.g., Kim et al., 2007; Onitsuka et al., 2010; Feki et al., 2014). Hence, it is essential to retroactively understand this spatiotemporal transition, including the development, maintenance, and decay of specific HABs, in order to mitigate the impacts of HABs on human well-being as much as possible. An important challenge that needs to be addressed before we tackle this problem is how to precisely estimate the spatiotemporal distribution of HABs by combining information from several data types.
Unprecedented large-scale HABs occurred in Pacific coastal waters off southeastern Hokkaido, Japan, in mid-September 2021, about a month after the subsidence of the most intense and extensive marine heatwaves ever recorded over the northwest Pacific Ocean (Kuroda and Setou, 2021). There had been no previous reports of large-scale events attributed to HABs over the whole of this study region, where the marine environment has largely been maintained in its natural, healthy condition. The HABs consisted of Karenia and other species and included Karenia selliformis, Karenia longicanalis, and Karenia mikimotoi (Iwataki et al., 2022). As a result, serious potential impacts on coastal ecosystems and fisheries were reported for southeast Hokkaido (see the bold magenta line in Figure 1A): sea urchins experienced mass die-offs, chum salmon died in fixed nets, and juvenile fishes died in rearing facilities. Although is unclear what level of Karenia spp. abundance causes mortality in these species, the order of magnitude of Karenia spp. abundance observed in our study (>102–104 cells mL–1) might be sufficient to cause ecological damage according to previous toxicity assessments (e.g., Shi et al., 2012; Basti et al., 2015).
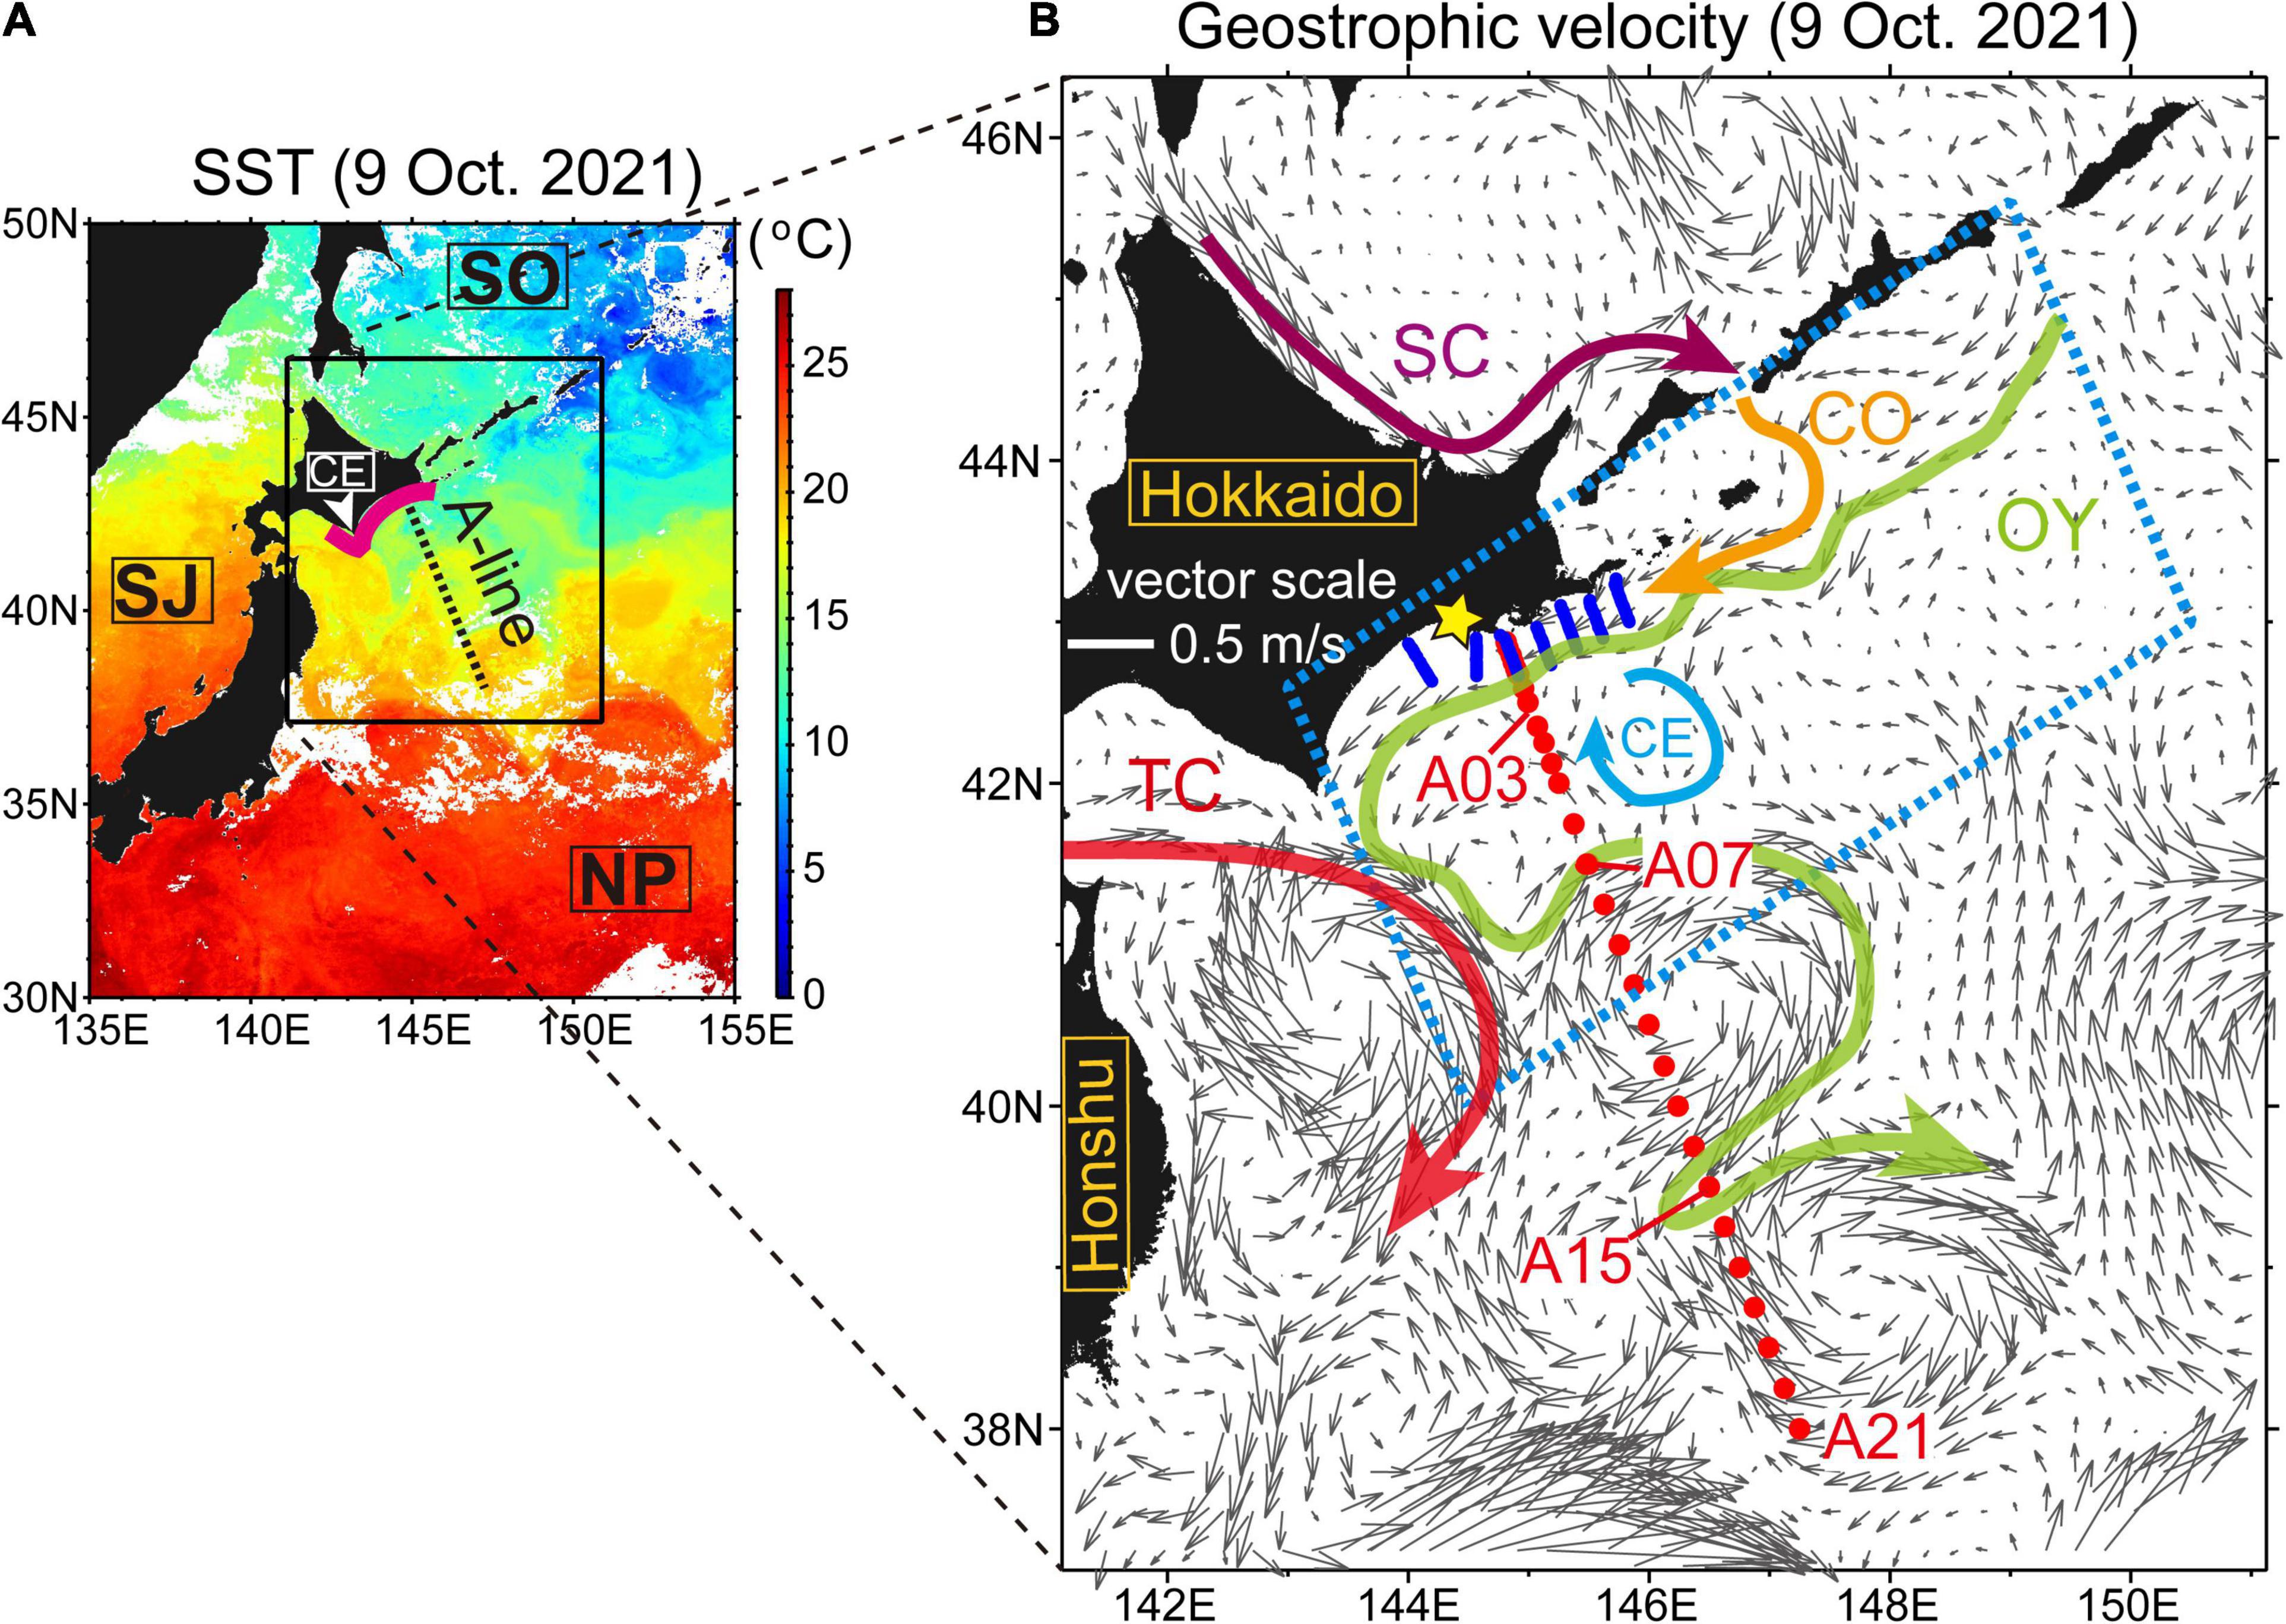
Figure 1. (A) Himawari-8-derived sea surface temperatures around Japan on 9 October, 2021. White areas denote clouds. Geographic names are enclosed in rectangles: SJ, Sea of Japan; SO, Sea of Okhotsk; NP, North Pacific; and CE, Cape Erimo. The bold magenta line roughly indicates coastal waters where fisheries experienced devastating damages that were attributable to harmful algal blooms after mid-September 2021. (B) Absolute geostrophic velocity at the sea surface, estimated from near-real-time gridded altimetry products. Closed red and blue circles indicate conductivity–temperature–depth (CTD) stations along the A Line and L lines, respectively. The star symbol indicates the location of the Katsurakoi fishery harbor. Schematic flow patterns are depicted by colored vectors: SC, Soya Warm Current; CO, Coastal Oyashio; OY, Oyashio; TC, Tsugaru Warm Current; and CE, clockwise eddy. Positions where the Oyashio crossed the A Line were determined on the basis of 5°C isotherms at 100-m depth. Daily areal extents of satellite-derived chlorophyll-a concentrations were estimated within the blue dashed square (Figure 2).
Kuroda et al. (2021a) provided an initial report on the HABs, in which they described the development of the HABs from August to September 2021 and inferred potential source areas by combining three analyses: satellite-derived chlorophyll a concentrations (SCCs) at the sea surface, a realistic high-resolution (1/50°) ocean circulation model, and particle-tracking simulations. The HABs occurred in a crossroad-like confluence zone of subarctic and subtropical waters. The areal extent of SCCs exceeding 5 or 10 mg m–3 in the study region started to slowly increase after 20 August, when the marine heatwaves subsided, intermittently exceeded the climatological daily maximum after late August, and reached record-breaking extremes in mid-to-late September (Figure 2). About 70% of the SCCs that exceeded 10 mg m–3 occurred in places where water depths were <300 m (i.e., coastal shelf waters), where small-scale submesoscale variations are expected to dominate. The high SCCs were tightly linked with low-salinity water (e.g., subarctic Oyashio and river-influenced waters), whereas high-salinity subtropical water appeared to suppress the occurrence of HABs.
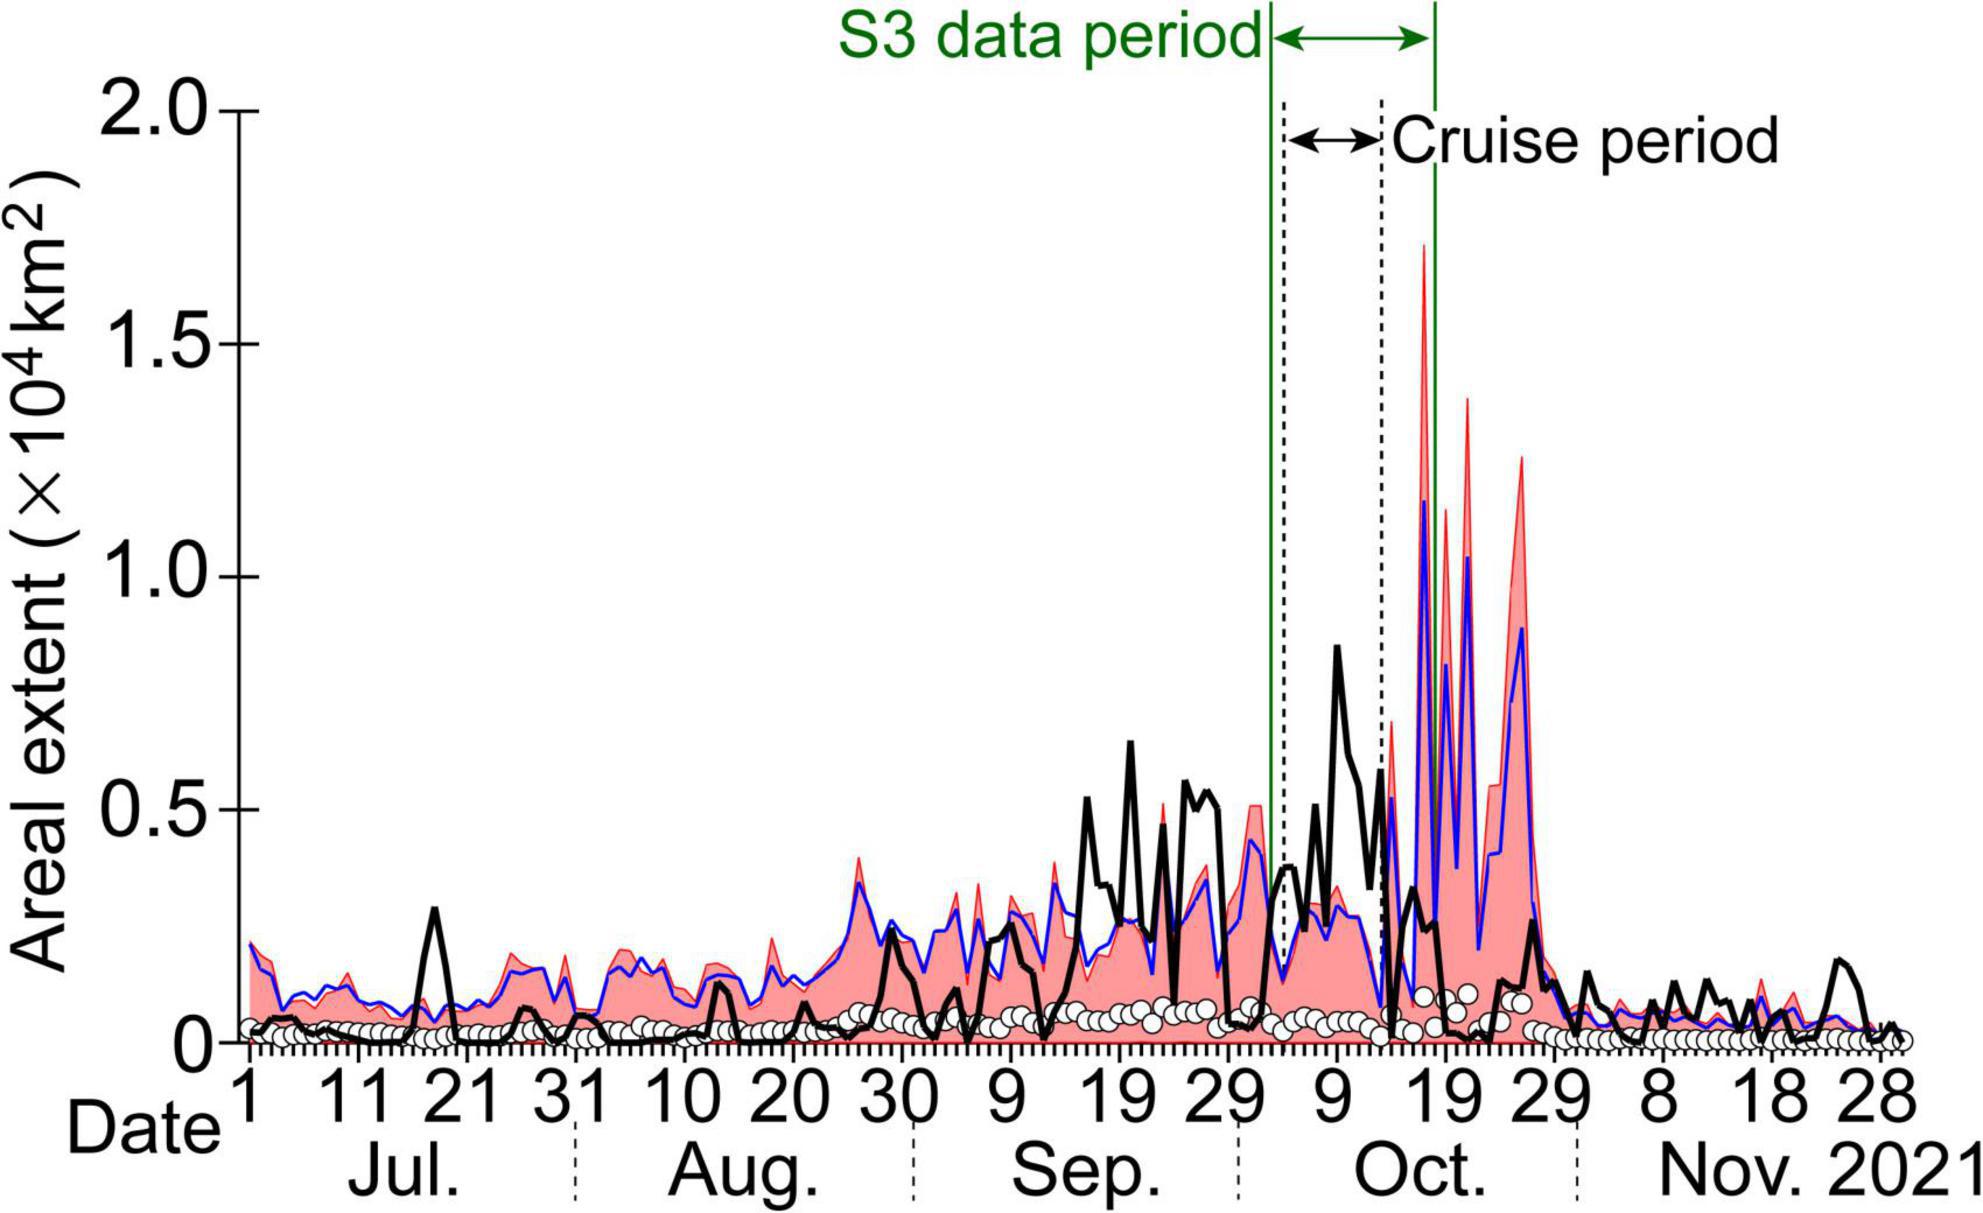
Figure 2. Daily areal extent of high satellite-derived chlorophyll-a concentrations exceeding 10 mg m–3 across the study region (i.e., within the blue dashed square in Figure 1B). The original time series published by Kuroda et al. (2021a) was extended to 30 November, 2021. The black bold line indicates the daily areal extent in 2021. White circles denote climatological daily means calculated over the previous 23 years (1998–2020), and the blue line indicates the climatological daily mean plus three standard deviations. Red shading shows the range between the lowest daily minimums and highest daily maximums recorded over the previous 23 years. Horizontal double-headed arrows represent the periods of the ship survey (black) and the Sentinel-3 data (green) that were analyzed in this study. Chlorophyll-a concentrations were based on near-real-time and reprocessed L4 products of global daily datasets with a horizontal grid of about 4 km that were created by merging sensor data from SeaWiFS, MODIS, MERIS, VIIRS-SNPP, and JPSS1 and downloaded from the European Union’s Copernicus Marine Service.
It should be emphasized that the analysis presented by Kuroda et al. (2021a) has some limitations. One limitation is that the study dealt only with the HAB developmental stage (i.e., up to late September) and did not describe the transition to full-blown HABs. The second limitation is that the study was based primarily on remote sensing and simulations, with little analysis of in-situ measurements. For instance, the use of ocean circulation model outputs entails some degree of uncertainty, and although high-SCC areas were analyzed as a metric of HAB extent, the validity of this metric needs to be verified by in-situ observations. Another limitation is that the study focused on the overall distribution of SCCs; the spatiotemporal transition of Karenia blooms in coastal shelf waters is often characterized by small-scale structures, and is difficult to understand on the basis of the overall SCC distribution.
To address these limitations, here, we analyzed the results from ship surveys conducted on 4–14 October, 2021 and spanning a wide area across several water masses in the Pacific Ocean off southeast Hokkaido. The study aimed to describe the distribution of Karenia spp. blooms together with chlorophyll-a concentrations in relation to oceanographic conditions. Moreover, to understand both large- and small-scale distributions of Karenia spp. blooms, we generated maps of Karenia spp. abundances by combining in situ measurements with Sentinel-3-derived ocean color imagery with a horizontal resolution of 300 m.
We performed extensive ship surveys from aboard R/V Hokko-maru (international gross tonnage, 1246 t; designed draft, 4.5 m) from 4 to 14 October, 2021 in the northwest Pacific off southeastern Hokkaido, Japan (Figure 1). During the surveys, we took measurements with conductivity–temperature–depth (CTD) sensors, collected water samples with a bucket and Niskin bottles, and obtained a continuous recording of near-surface temperature, salinity, and chlorophyll-a concentration along the ship track.
Surveys were first carried out along the A Line during 4–10 October (Figure 1B, closed red circles) and then along the L lines during 10–14 October (Figure 1B, closed blue circles). The A Line, which extends about 500-km southeast from the Hokkaido coast, is a regular monitoring transect that has been used by the Japan Fisheries Research and Education Agency to monitor the state of the Oyashio (with a focus on its mesoscale variability) since 1987 (e.g., Kuroda et al., 2017, 2019). For our study, CTD measurements were obtained at 28 stations along the A Line (i.e., in order from north to south, Stns. B01, A01, B02–B04, A02, A025, A03, A035, A04, A045, and A05–A21). The L-lines consist of seven cross-shelf transects (i.e., lines L1–L7 in order from east to west), each with 15–17 stations spaced about 2 km apart and located mainly on the Pacific shelf; these transects have been used to capture submesoscale variability in association with the Coastal Oyashio on the shelf (e.g., Sakamoto et al., 2010; Kusaka et al., 2016; Kuroda et al., 2021b). It should be noted that the ship survey was not used to observe very nearshore waters of depth <20 m, where low-salinity river discharge is expected to dominate (e.g., Kuroda et al., 2021a), because the research vessel could not enter shallow waters without significant risk of stranding.
Conductivity–Temperature–Depth sensors combined with dissolved oxygen, fluorescence, and turbidity sensors were lowered to the vicinity of the seafloor or to 3,100 dbar for the A Line, and to 490 dbar for the L lines. At all CTD stations, a bucket was also used to sample water from a depth of a few dozen centimeters, and the temperature, salinity, and chlorophyll-a concentration of the sampled water were also obtained. Subsurface waters at standard depths (10, 20, 30, 40, 50, 60, 80, 100, 125, 150, 200, 300, 400, 500, 600, 800, 1,000, 1,250, 1,500, 2,000, 2,500, and 3,000 dbar in the case of the A Line) were also sampled by using Niskin bottles on a CTD–rosette sampler system. The sampled water was aliquoted into smaller bottles on deck for transport to a shore-based laboratory, where we obtained measurements of conductivity/salinity (in 200- or 250-mL subsamples), chlorophyll a concentration (100 mL from the standard depths above 200 m), and Karenia spp. abundance (250 mL for the L lines at 10-m depth or 1,000 mL for the A Line).
Moreover, along the track of R/V Hokko-maru, near-surface temperatures, salinities, chlorophyll-a concentrations, and geolocations were continuously recorded at intervals of 1 min by digital sensors and a global positioning system receiver. Ship speeds ranged from 0.0 to 14.9 knots during the period of analysis; the mean was 4.9 knots. The spatial resolution of the ship-track data therefore changed from 0 to 460 m, with an average of 151 m; this indicated that the ship-track data could be used to capture submesoscale variations with a typical scale of 0.1–10 km (McWilliams, 2016; Kuroda and Toya, 2020).
In a shore-based laboratory of Fisheries Resources Institute (Kushiro Station), salinity/conductivity was measured with high accuracy by using a Guildline Model 8400B “Autosal” Laboratory Salinometer, Smith Falls, ON, Canada.
Chlorophyll-a concentrations were measured manually by using the procedures described by Kasai et al. (1998). Water samples were filtered onto 25-mm Whatman GF/F glass fiber filters immediately after sampling and preserved in N, N-dimethylformamide as described by Suzuki and Ishimaru (1990). Samples and filters were frozen onboard R/V Hokko-maru and stored in the dark until they could be measured with a fluorometer (Model 10AU, Turner Designs, San Jose, CA, United States) in a shore-based laboratory.
For enumeration of Karenia spp., water samples of 250 or 1,000 mL were fixed and preserved with acid Lugol’s solution (final concentration, 4%) at 5°C. Samples were concentrated to a volume of 25–50 mL by reverse filtration through 2-μm pore-size filters (Dodson and Thomas, 1964). A 0.2–0.5-mL sample of the concentrated algal cells was settled in a chamber (SCS N04, Matsunami, Osaka, Japan) and counted under an inverted microscope (ECLIPSE TE300, Nikon, Tokyo, Japan). Karenia spp. were taxonomically identified on the basis of the results of Iwataki et al. (2022).
Conductivity–Temperature–Depth-derived raw data were processed and averaged at 1-dbar intervals. Profiles of CTD-based salinity and chlorophyll a were corrected by using a linear regression between CTD-based sensor values and values manually measured from sampled waters. Moreover, erroneous temperature, salinity, and chlorophyll-a values recorded at depths of 0–4 m by the CTD were replaced by values obtained by linear interpolation between the 0-m bucket sample and a CTD measurement at 5-m depth. Interpolation errors were mostly negligible because the surface mixed layer was formed near the sea surface (typically, 20–25 m) throughout the period of our ship survey.
Near-surface temperature, salinity, and chlorophyll-a concentration along the ship track were corrected by using a linear regression against the temperature (R2 = 0.995), salinity (R2 = 0.996), and chlorophyll a concentration (R2 = 0.737) of the bucket-sampled water.
After mid-September 2021 (when Karenia blooms were first observed), surface water samples were collected daily around the Katsurakoi fishery harbor (144°26.77′E, 42°56.81′N; indicated by the star symbol in Figure 1B). Samples were collected from three fixed sites within a few hundred meters of the harbor. Buckets were used for sample collection at two of the sites, and an automated seawater intake to our shore-based laboratory was used at the other site. Water samples were filtered onto 25-mm Whatman GF/F glass fiber filters immediately after sampling to measure chlorophyll-a concentrations with a fluorometer. For enumeration of Karenia spp., water samples were fixed and preserved at 5°C with acid Lugol’s solution (final concentration, 4%) for measurements conducted prior to 28 September, and with Hepes-buffered paraformaldehyde and glutaraldehyde (Katano et al., 2009) for subsequent measurements. Karenia spp. abundances (cells mL–1) were estimated from 46 randomly selected samples collected during 21 September–22 October, 2021.
Ocean color imagery based on Sentinel-3A/3B Ocean and Land Color Imager Level-2 Full Resolution were downloaded from Copernicus Online Data Access. The horizontal resolution was about 300 m, and the time interval between images was near-daily. The data period analyzed was from 3 October to 18 October, 2021 (Supplementary Table 1), roughly corresponding to the time period of the ship survey. For analysis, we selected imagery with a relatively small ratio of cloud coverage (< 20%) over the shelf off southeastern Hokkaido. We used normalized water-leaving reflectance (ρw[λ]) for a wavelength band centered at λ and chlorophyll-a concentrations that were derived from one of two algorithms: a neural network-based approach (hereafter, “NN”) for optically complex waters (Doerffer and Schiller, 2007) and a maximum band ratio semi-analytical algorithm (hereafter, “OC4ME”) for open oceans (Morel et al., 2007; Cherif et al., 2021; Moutzouris-Sidiris and Topouzelis, 2021).
Chlorophyll-a estimates obtained from NN and OC4ME had limited accuracy on the Pacific shelf (see section “Maps of Chlorophyll-a Concentration” for details), where there was considerable submesoscale variability in areas of high chlorophyll-a concentration (>20 mg m–3). Therefore, reflectance-based maximum line height (MLH; Smith and Bernard, 2020) was used instead of NN and OC4ME to estimate chlorophyll-a concentrations at the sea surface.
Surface abundances of Karenia spp. were estimated from satellite-derived reflectance-based variables by using two methods. One method directly estimated Karenia spp. abundances through a combination of reflectance-based red band difference (RBD; Jordan et al., 2021) and in-situ Karenia spp. abundance. The other method entailed two steps: in the first step, chlorophyll-a concentrations were estimated by using a combination of MLH and in-situ chlorophyll a concentrations, as mentioned above, and in the second step, chlorophyll-a concentrations were converted into Karenia spp. abundances by using an observed relationship between them.
RBD and MLH are defined as follows:
where LH(λ) is defined as follows:
Relationships between the spectral properties of Karenia spp. and the Sentinel-3 spectral bands are illustrated in the schematic diagram in Supplementary Figure 1. Calculations of RBD and MLH were both based on the 665–753-nm spectral band, as opposed to OC4ME, which is based on the 443–560-nm spectral band. The 665–753-nm spectral band has an important advantage over the spectral band used in OC4ME in that the former is not strongly influenced by the absorption associated with colored dissolved organic matter (e.g., at around 440 nm), which is frequently found in the coastal waters of our study area (e.g., Isada et al., 2021).
Red band difference is frequently used for detecting and monitoring Karenia spp. blooms (e.g., Amin et al., 2009; Wolny et al., 2020; Jordan et al., 2021). LH(λ), which is similar to fluorescence line height (Gower et al., 1999), with a baseline formed by the reflectance between 665 and 753 nm, was applied to all spectra (Smith and Bernard, 2020). MLH was expected to be appropriate for detecting both low (<about 20 mg m–3) chlorophyll-a concentrations and the high (>about 20 mg m–3) chlorophyll-a concentrations associated with red tides, because the reflectance peak at 681 nm is generally related to chlorophyll-a fluorescence emissions; however, at higher biomass this peak shifts to longer wavelengths owing to the combined effects of increased phytoplankton absorption and backscattering, as well as pure water absorption (e.g., Gower et al., 1999, 2005; Gower, 2016).
Finally, after generating maps of Karenia spp. abundance, we estimated specific rates of change (hereafter, “growth rate”), assuming exponential algal growth, from two maps of satellite-derived Karenia spp. abundance. Specifically, growth rate was estimated as r = [ln (Kt2) − ln (Kt1)]/△t, where △t is the time interval between satellite images and Kt1 and Kt2 represent Karenia spp. abundances estimated in a given region at times t1 and t2, respectively (i.e., △t = t2 − t1). This estimation method was based on the work of Stumpf et al. (2008), who developed the method for satellite-derived chlorophyll-a imagery.
The oceanographic conditions in our study area during the cruise can be seen from satellite-based data captured on 9 October, 2021 (Figure 1). The northern part of the A Line was occupied by cold waters, and the southern part was occupied by warm waters (Figure 1A). In the cold-water area, the Oyashio flowed southwestward along the continental slope off southeastern Hokkaido, came in contact with the Tsugaru Warm Current south of Cape Erimo, formed a sharp thermal front, and then flowed along the edge of anticyclonic mesoscale eddies, with several meanders (Figure 1B). A part of the Oyashio then crossed the A Line again near Stn. A15.
Inshore of the Oyashio, the Coastal Oyashio flowed along the Pacific shelf off southeastern Hokkaido as a downstream extension of the Soya Warm Current in the Sea of Okhotsk. The Coastal Oyashio crossed several L lines. As explained in the subsequent section “Field Measurements,” the Coastal Oyashio transported Modified Soya Warm Current Water, which is formed by the mixing of a subtropical water mass referred to as Soya Warm Current Water that outflows from the Sea of Okhotsk with surrounding subarctic waters on the Pacific shelf.
In terms of large-scale variability along the shelf (i.e., on a scale of ∼500 km), as briefly mentioned in the section “Introduction,” the areal extent of SCCs exceeding 10 mg m–3 around the study region (Figure 1B, blue dashed square) reached a record-breaking level in mid-to-late September 2021 (Figure 2), which was roughly comparable to the climatological mean plus six standard deviations. During the first half of our study period (i.e., 3–18 October), this record-breaking level was further maintained. The maximum areal extent of SCCs in 2021 was observed on 9 October. However, during the second half of our study, the areal extent decreased rapidly. Hence, we examined both the maintenance and decay periods of algal blooms.
Along the ship track, temperatures, salinities, and chlorophyll-a concentrations changed dramatically as the research vessel repeatedly crossed subarctic and subtropical water masses, as well as water masses created by mixture of the two (Figure 3). Roughly speaking, cold (warm) waters corresponded to low-salinity (high-salinity) waters. Cold low-salinity subarctic (warm high-salinity subtropical) waters corresponded to high (low) concentrations of chlorophyll a with high (low) spatial variability. Along the ship track around the L lines on the Pacific shelf during 10–14 October, chlorophyll-a concentrations reached particularly high values, typically >10 mg m–3, intermittently exceeded 20 mg m–3, and even reached up to 35 mg m–3. High chlorophyll-a concentrations >20 mg m–3 were distributed as patch-like local maxima along the ship track (Figure 4). The spatial scale of local maxima >20 mg m–3 was not more than about a few kilometers and was therefore associated with submesoscale variability (Figure 4B). In addition, high chlorophyll-a concentrations roughly corresponded to high abundances of Karenia spp., as is described below.
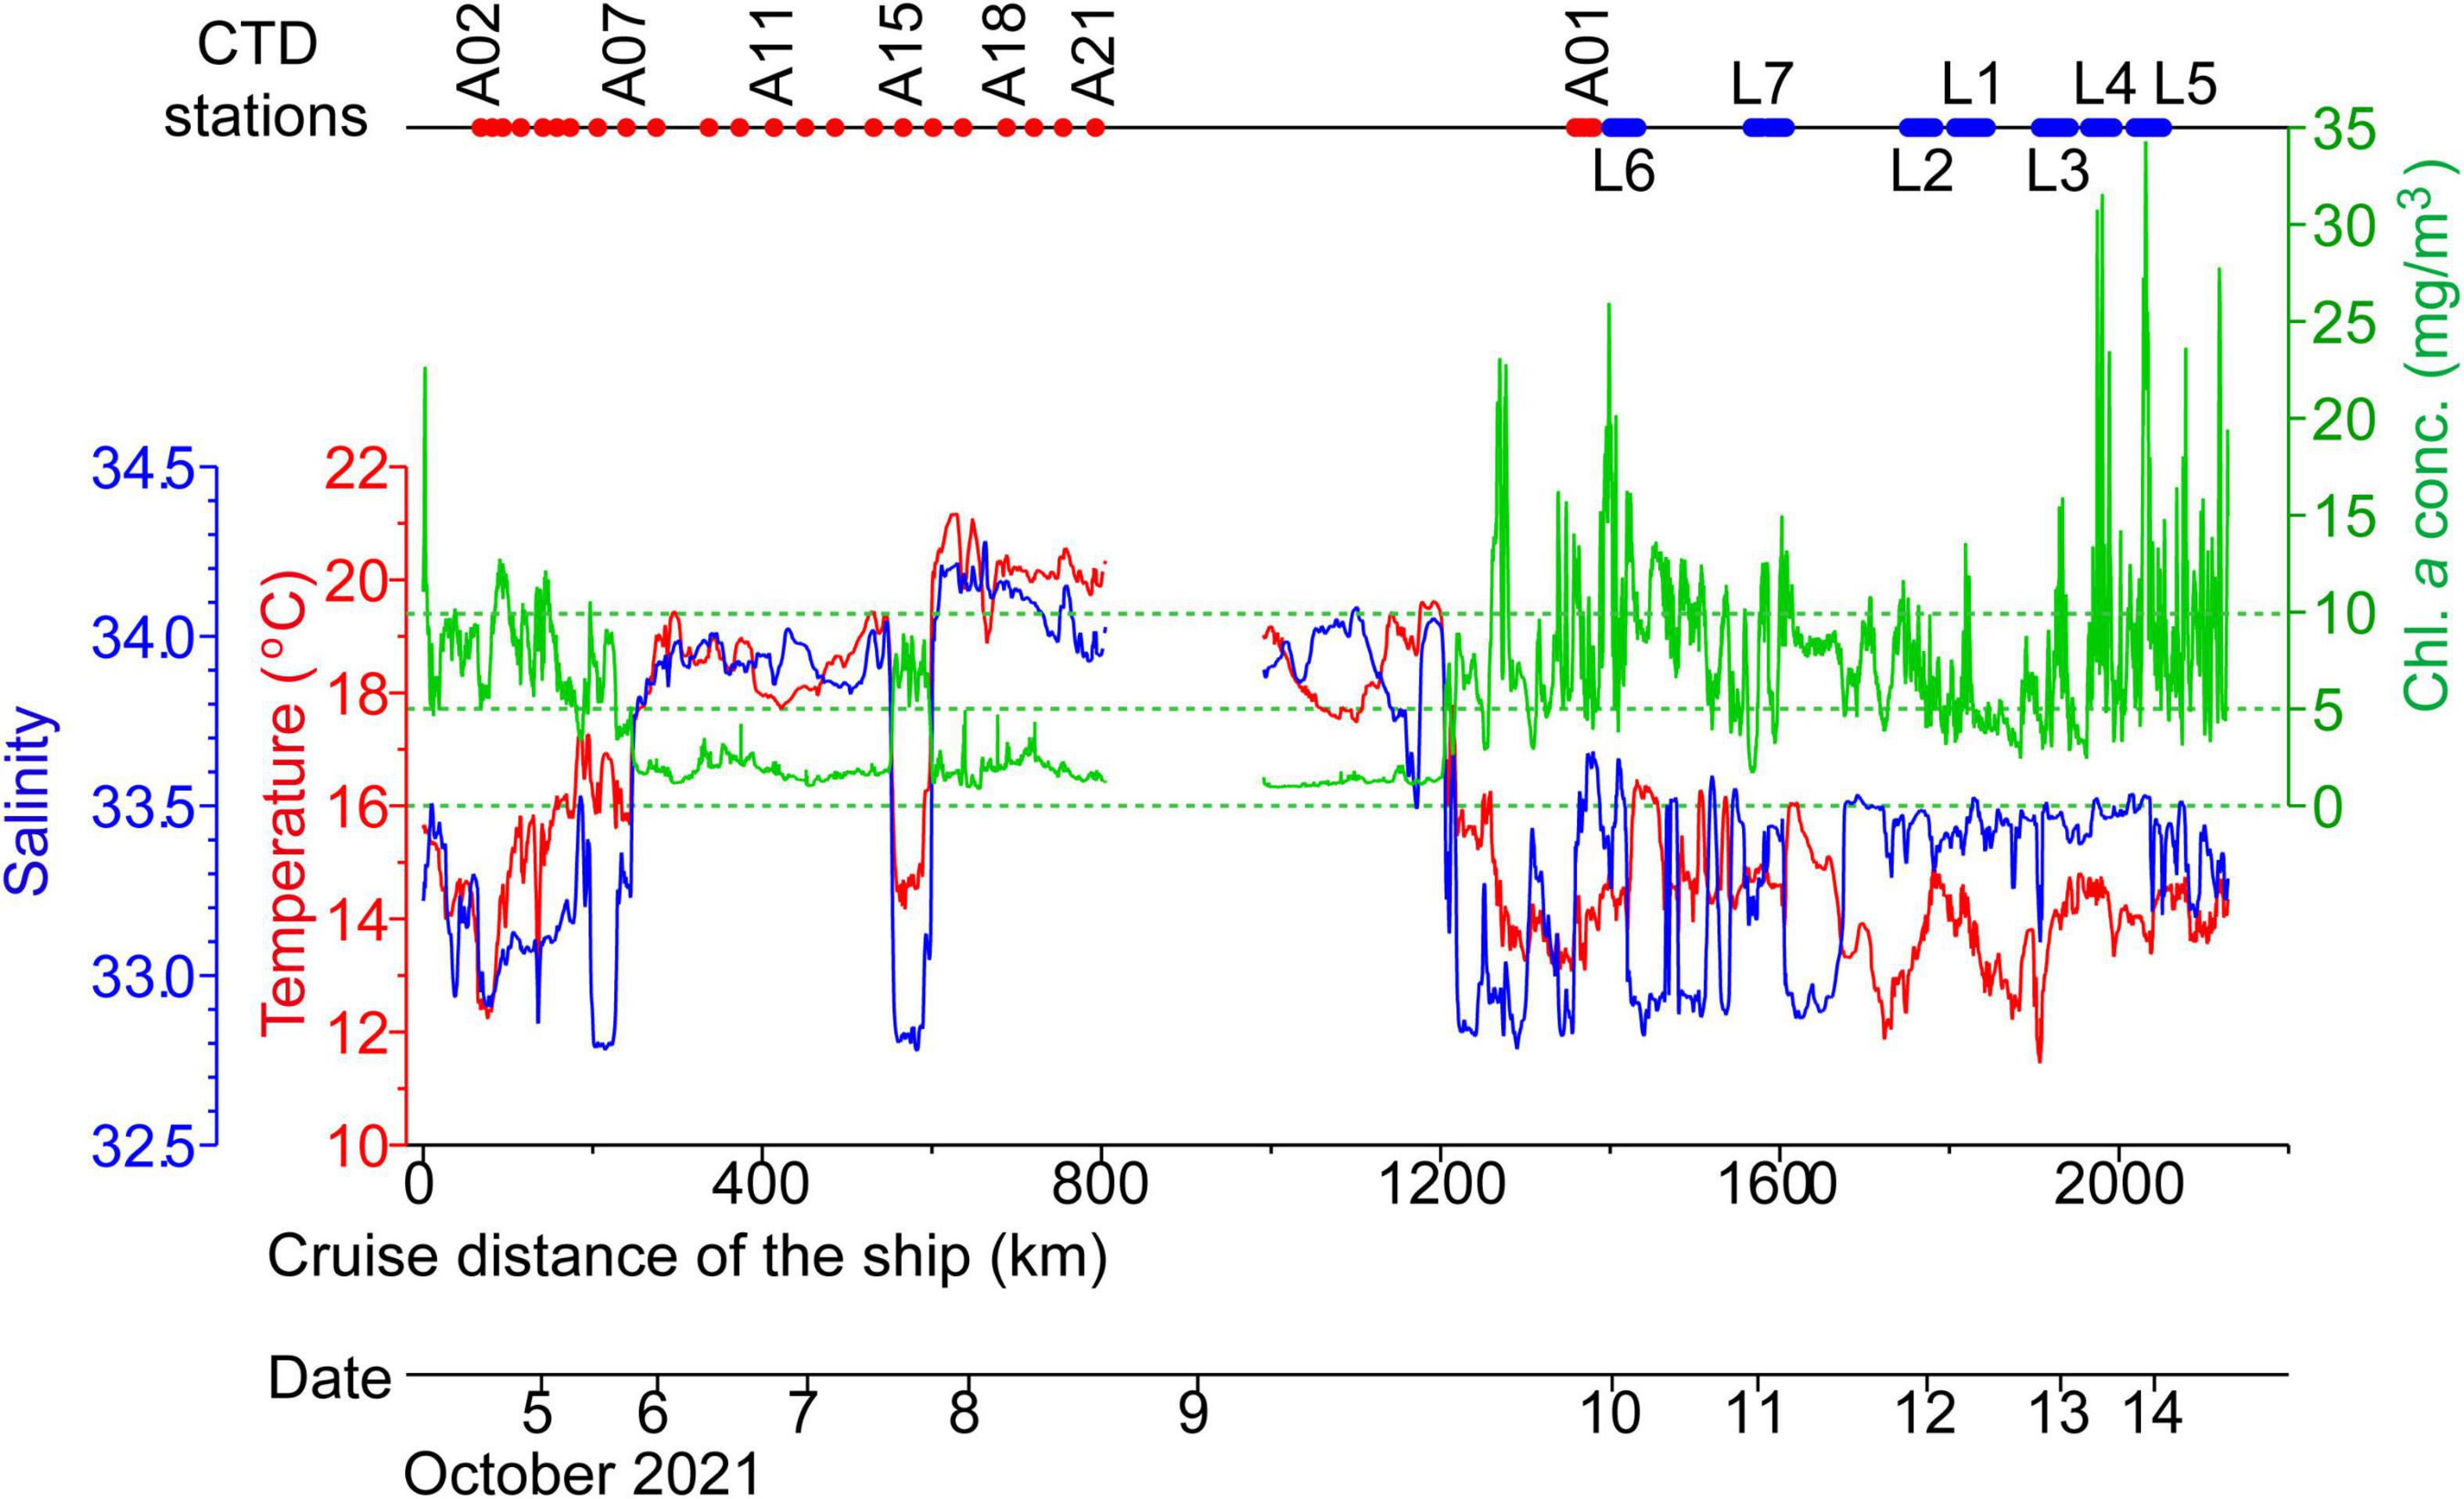
Figure 3. Sea-surface temperatures (red line, corresponding to the red left-hand axis), salinities (blue line, corresponding to the blue left-hand axis), and chlorophyll-a concentrations (green line, corresponding to the green right-hand axis) along the ship track during 4–14 October, 2021. The upper horizontal axis denotes the timing of conductivity–temperature–depth (CTD) measurements.
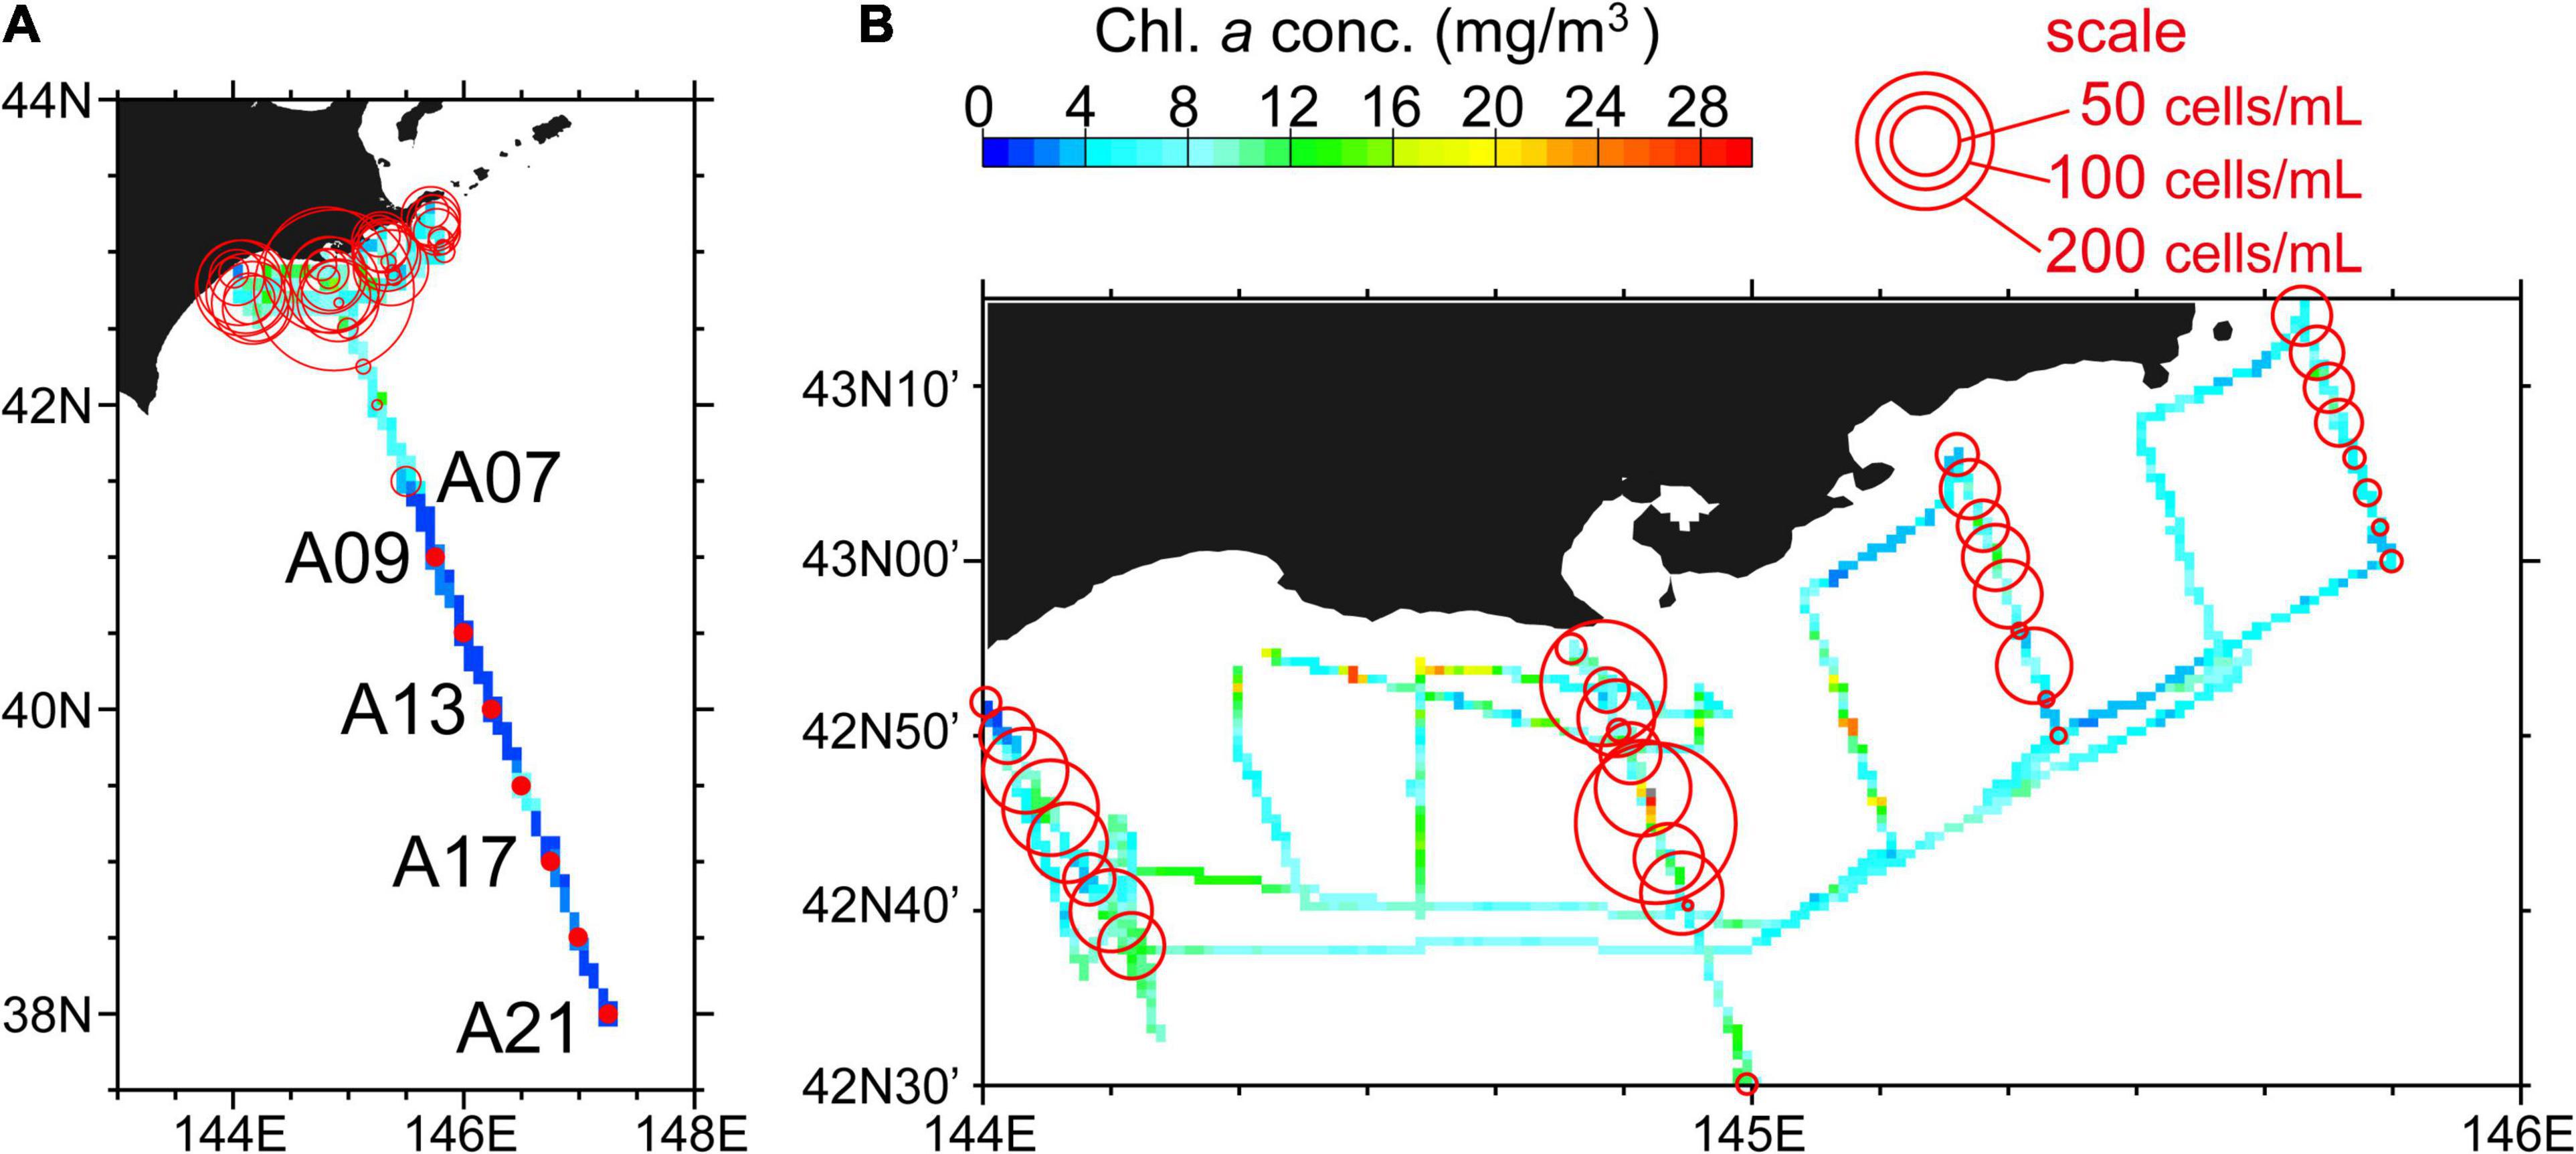
Figure 4. Surface chlorophyll-a concentrations (colored grid cells) along the ship track during 4–14 October, 2021. Grid cells shows averages across (A) 5′ (longitude) × 5′ (latitude) (i.e., an approximately 7 × 9 km rectangle) and (B) 45″ (longitude) × 30″ (latitude) (i.e., an approximately 1 × 1 km rectangle). Karenia spp. abundance at a depth of 10 m is also shown by the area of red circles. Red closed circles indicate that Karenia spp. were not found.
On the Pacific shelf around the L lines, salinities were persistently lower than 33.6, and temperatures were in the range 11.0–17.0°C (Figure 3). These water masses were classified as Modified Soya Current Water (generally defined by temperatures >7.0°C and salinities of 33.0–33.7 on the Pacific shelf off southeastern Hokkaido) and Surface Coastal Oyashio Water (temperatures >2.0°C and salinities of 32.0–33.0) (Oguma et al., 2008; Kusaka et al., 2013). Hence, subarctic water masses and modified subtropical waters with particularly high chlorophyll-a concentration were present simultaneously on the Pacific shelf.
Surface chlorophyll-a concentrations were examined in relation to three environmental variables: water depth, sea surface salinity, and temperature (Figure 5). Some 83% of chlorophyll-a concentration measurements exceeding 10 mg m–3 were obtained in places where the water depth was <1,000 m, i.e., primarily coastal shelf–slope waters (Figures 5A,B). These high chlorophyll-a concentrations were also associated with two different surface salinities (Figure 5C), with local peaks at salinities of 32.9–33.0 and 33.4–33.5. The lower and higher salinity peaks corresponded to Surface Coastal Oyashio Water and Modified Soya Warm Current Water, respectively. However, the high chlorophyll-a concentrations in the two water masses were not associated with different sea-surface temperatures (i.e., the frequency distribution of temperature showed a single mode) (Figure 5D). Chlorophyll-a concentrations for salinities >33.7 and temperatures >17.5°C were mostly lower than 3 mg m–3, which suggests that massive algal blooms were much less common in pure subtropical waters. The above relationships were qualitatively consistent with those of SSCs as a function of simulated variables (Kuroda et al., 2021a), except for the marked in-situ discrimination between Surface Coastal Oyashio Water and Modified Soya Warm Current Water, and missing measurements of river-discharge-influenced waters with salinity <32.0 near the coast.
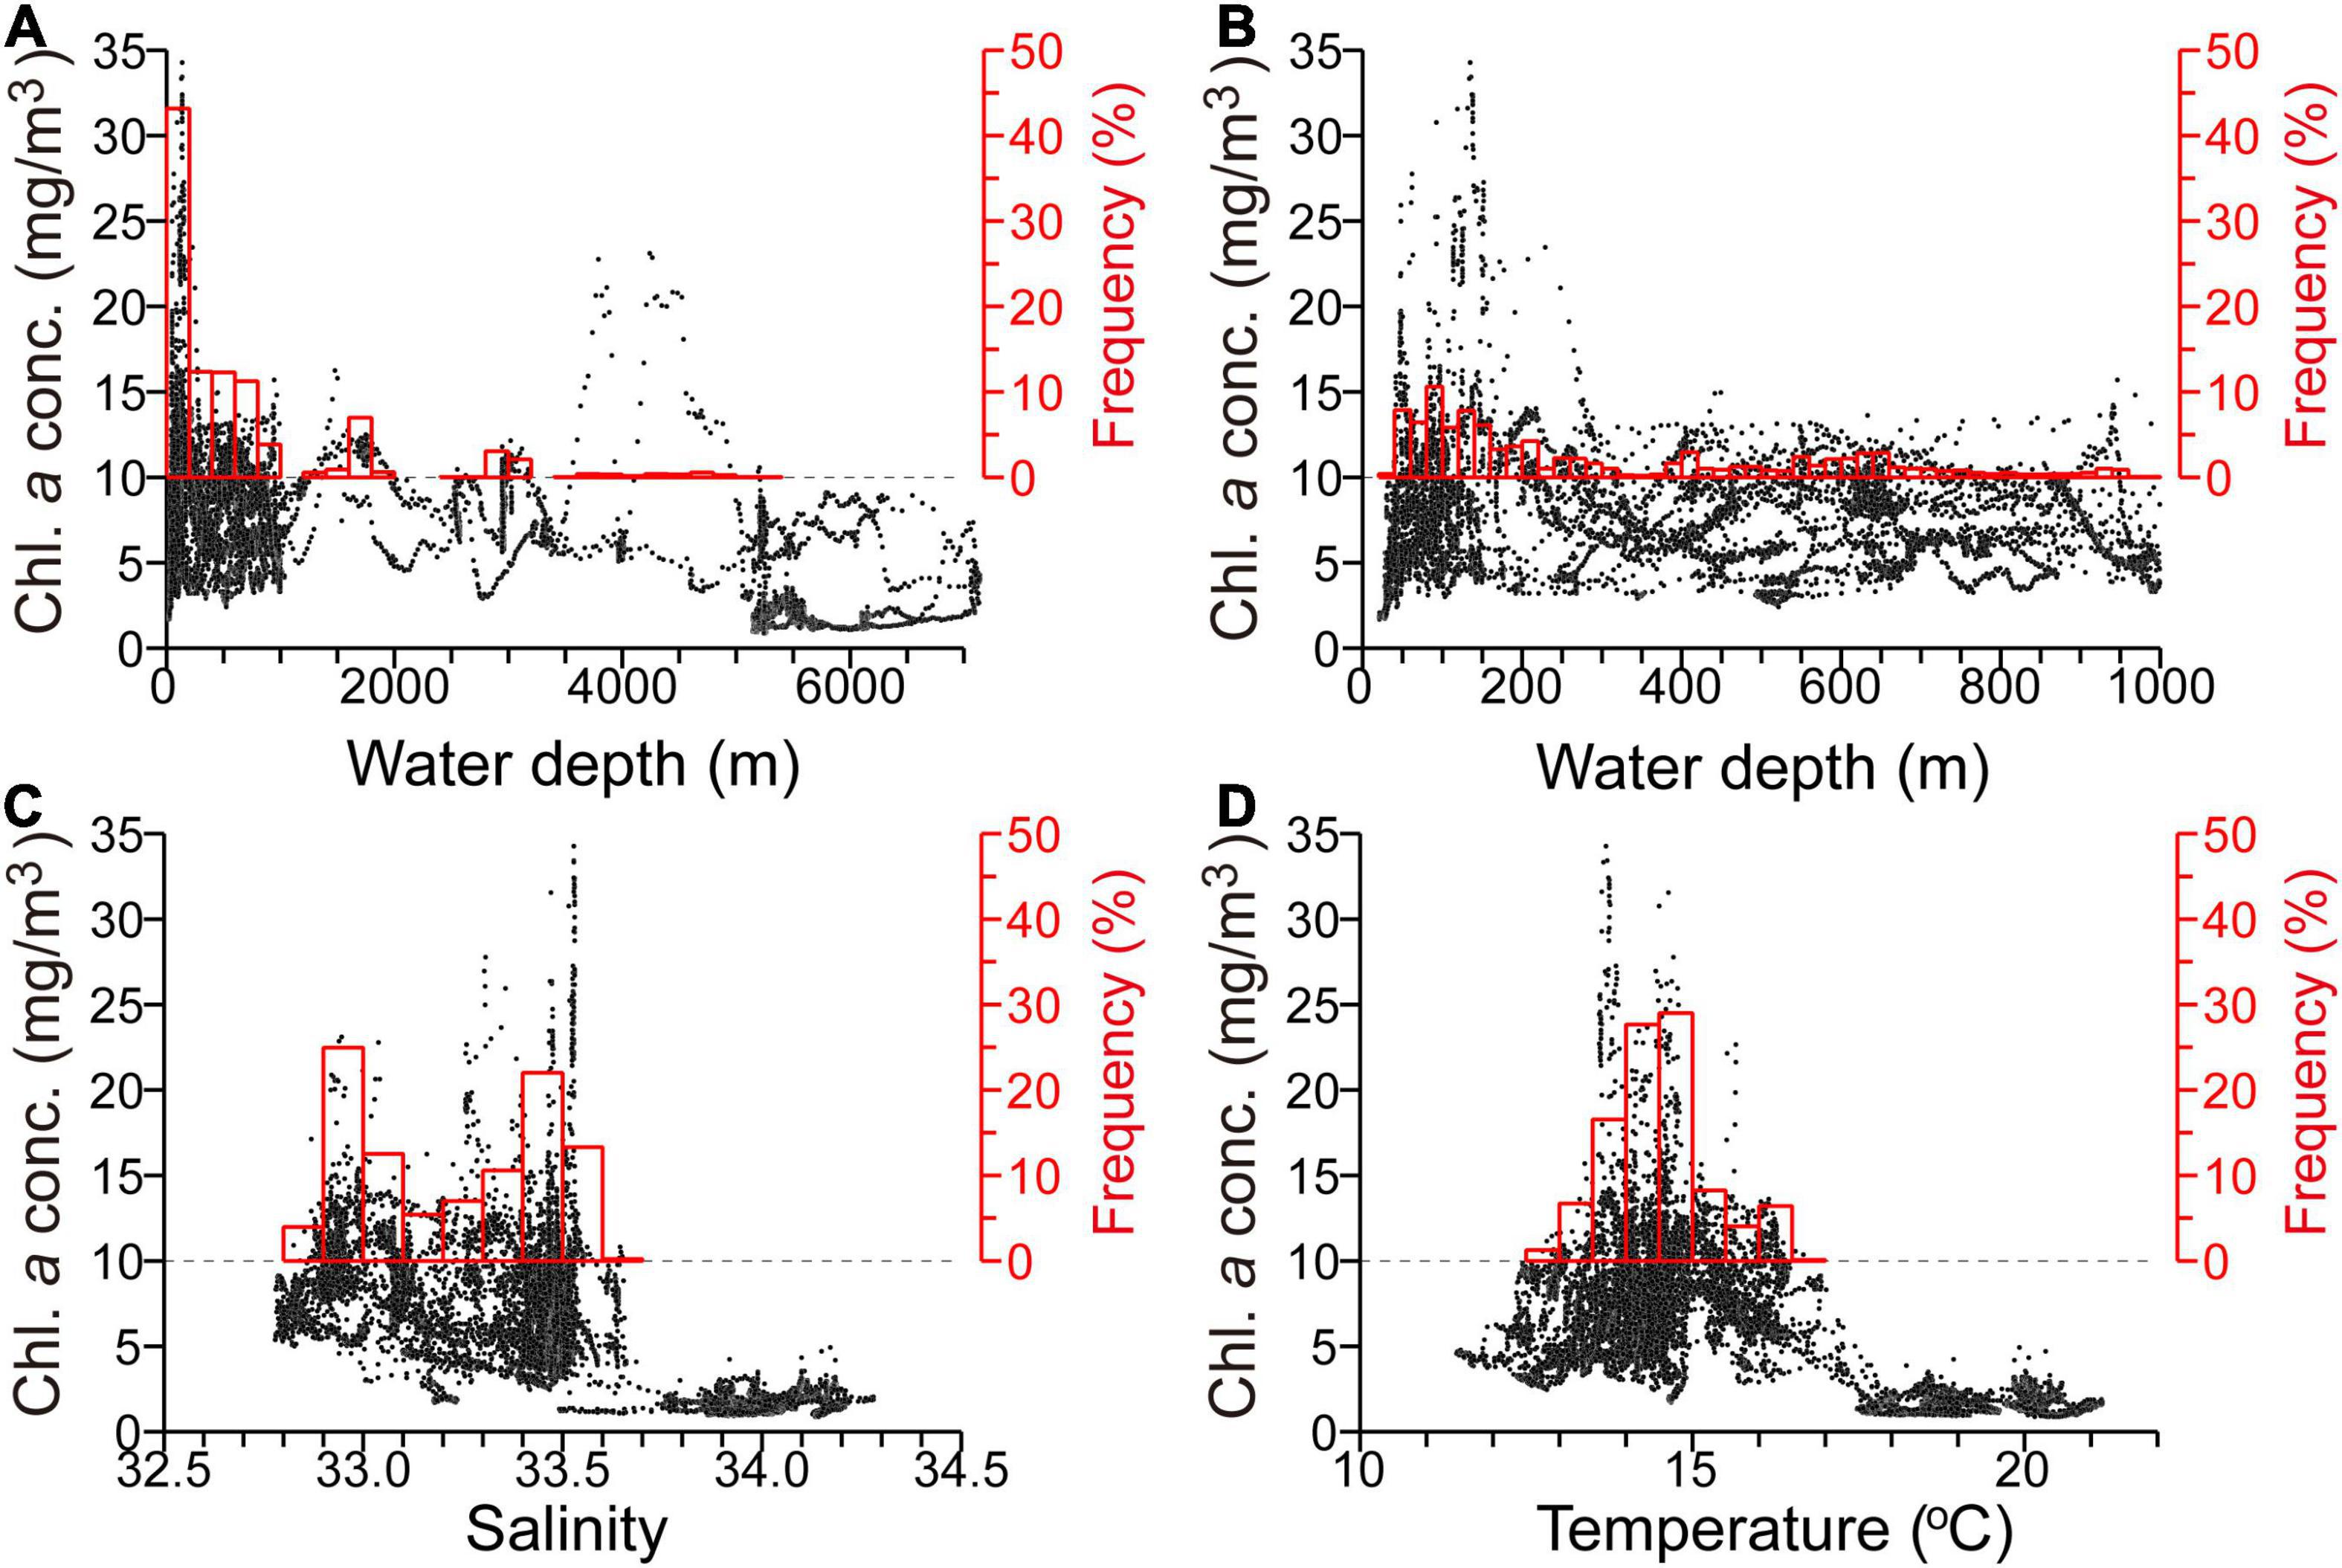
Figure 5. Scatter plots of surface chlorophyll-a concentration along the ship track versus (A) water depth (for all measured depths), (B) water depth (for depths <1,000 m), (C) sea-surface salinity, and (D) sea-surface temperature. For each panel, frequency distributions of chlorophyll-a concentrations exceeding 10 mg m–3 are denoted by red bars, corresponding to the red right-hand axis (%).
At CTD stations, vertical profiles of chlorophyll-a concentration tended to show a vertical maximum at the surface (Figure 6A). Also, at most of the CTD stations, the surface mixed-layer depth ranged from 1 to 54 m (Figure 6B). The modal mixed-layer depth was 20–25 m. Namely, algal blooms were not homogeneous within the surface mixed layer but were intensified at the sea surface. Mixed-layer depths were weakly correlated with the surface chlorophyll-a concentration (Figure 6C). This indicates that satellite measurements of the sea surface could appropriately capture the distribution of algal blooms during the period of the ship survey, despite the seasonal development of a surface mixed layer.
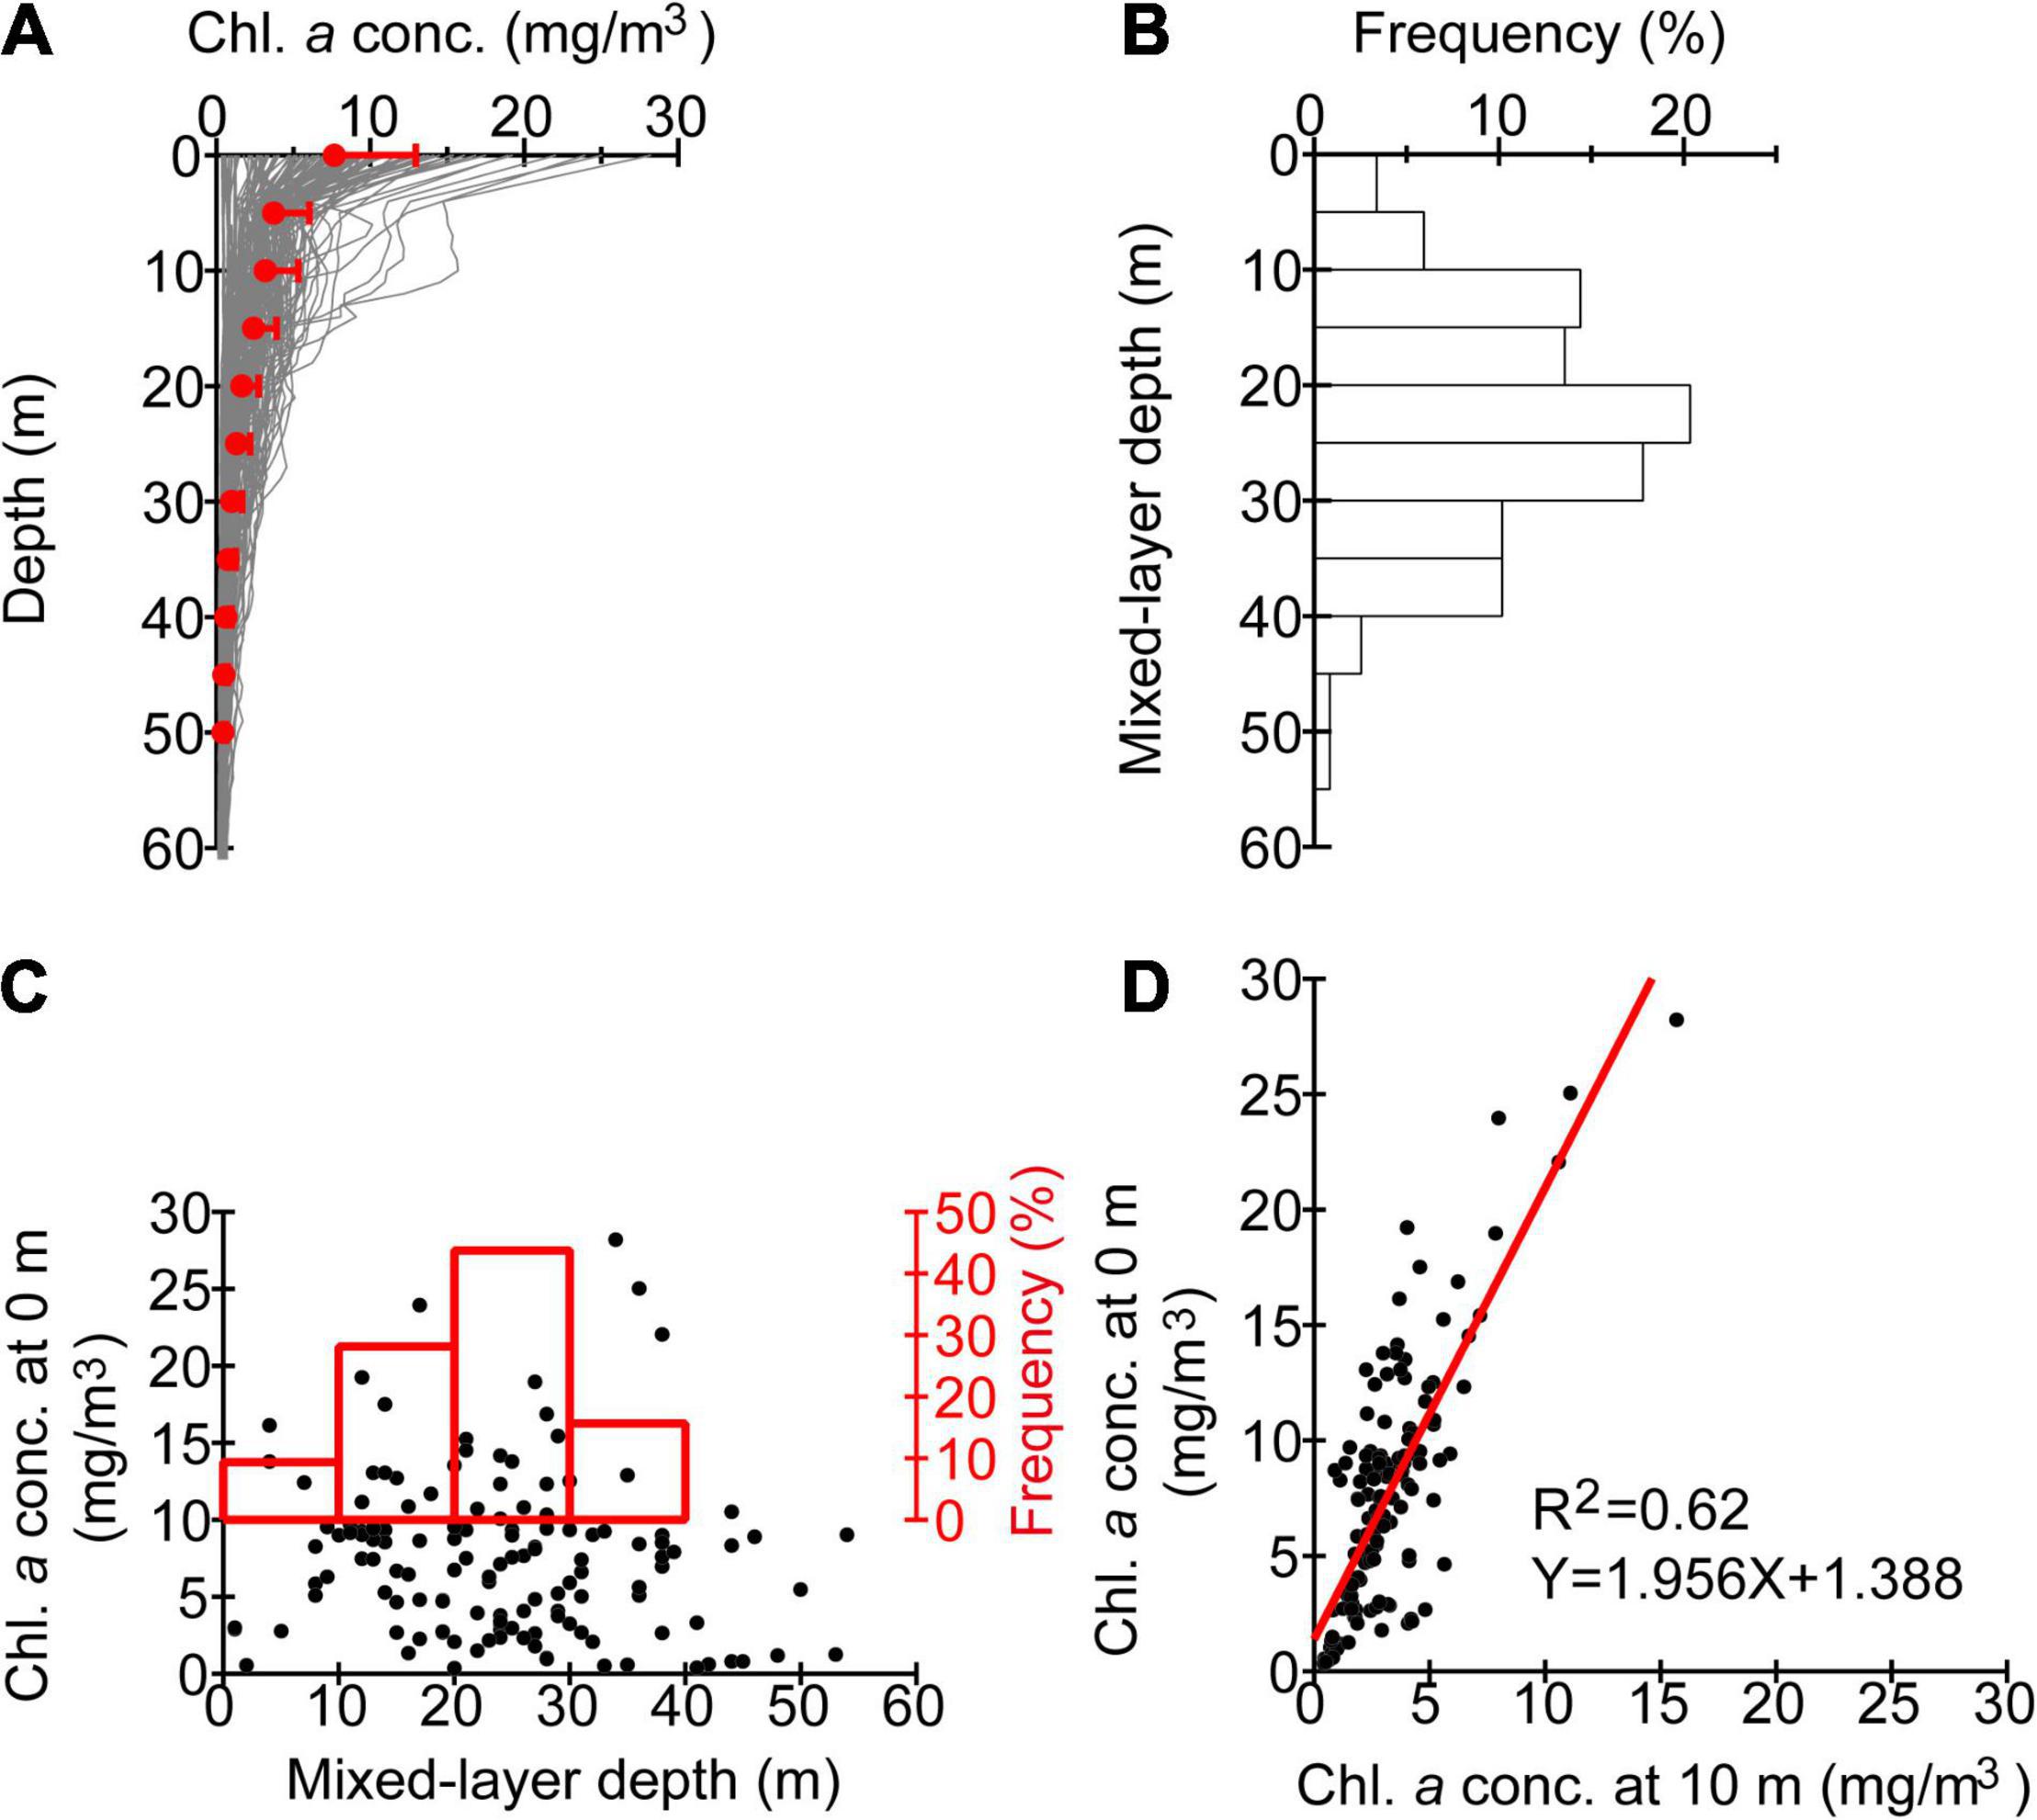
Figure 6. (A) Profiles of chlorophyll-a concentrations based on conductivity–temperature–depth (CTD) measurements. Bin-averages and standard deviations are indicated by closed red circles and horizontal bars, respectively. (B) Frequency distribution of mixed-layer depths based on CTD measurements. (C) The same as Figure 5, but for chlorophyll-a concentrations as a function of mixed-layer depths at CTD stations. (D) Scatter plots of chlorophyll-a concentrations at 0 versus 10 m at CTD stations.
Interestingly, chlorophyll-a concentrations at depths of 0 and 10 m were correlated with each other (Figure 6D). The ratio of chlorophyll a at 0 m to that at 10 m was averaged over all profiles and estimated as 2.4 (Figure 6A); this value was used to scale Karenia spp. abundances that were sampled at 10-m depth.
Karenia spp. abundance at 10-m depth was examined in relation to the surface chlorophyll-a concentration along the ship track (Figure 4, open red circles). Measured abundances ranged from 0 to 277 cells mL–1 during the period of the ship survey. High Karenia spp. abundance was most common in the northern part of the A Line and along sections of the L lines with high chlorophyll-a concentrations. Meanwhile, Karenia spp. were wholly absent in the southern A Line (i.e., Stns. A09–A21), which was occupied by subtropical waters, except at Stn. A15. At 10-m depth, Karenia spp. abundance was positively correlated with the chlorophyll-a concentration (Figure 7, closed red circles) after log10(x + 0.1) transformation of both variables. This indicates that, to a first-order approximation, chlorophyll-a concentration can be regarded as an index of Karenia spp. abundance off southeastern Hokkaido, at least during autumn 2021.
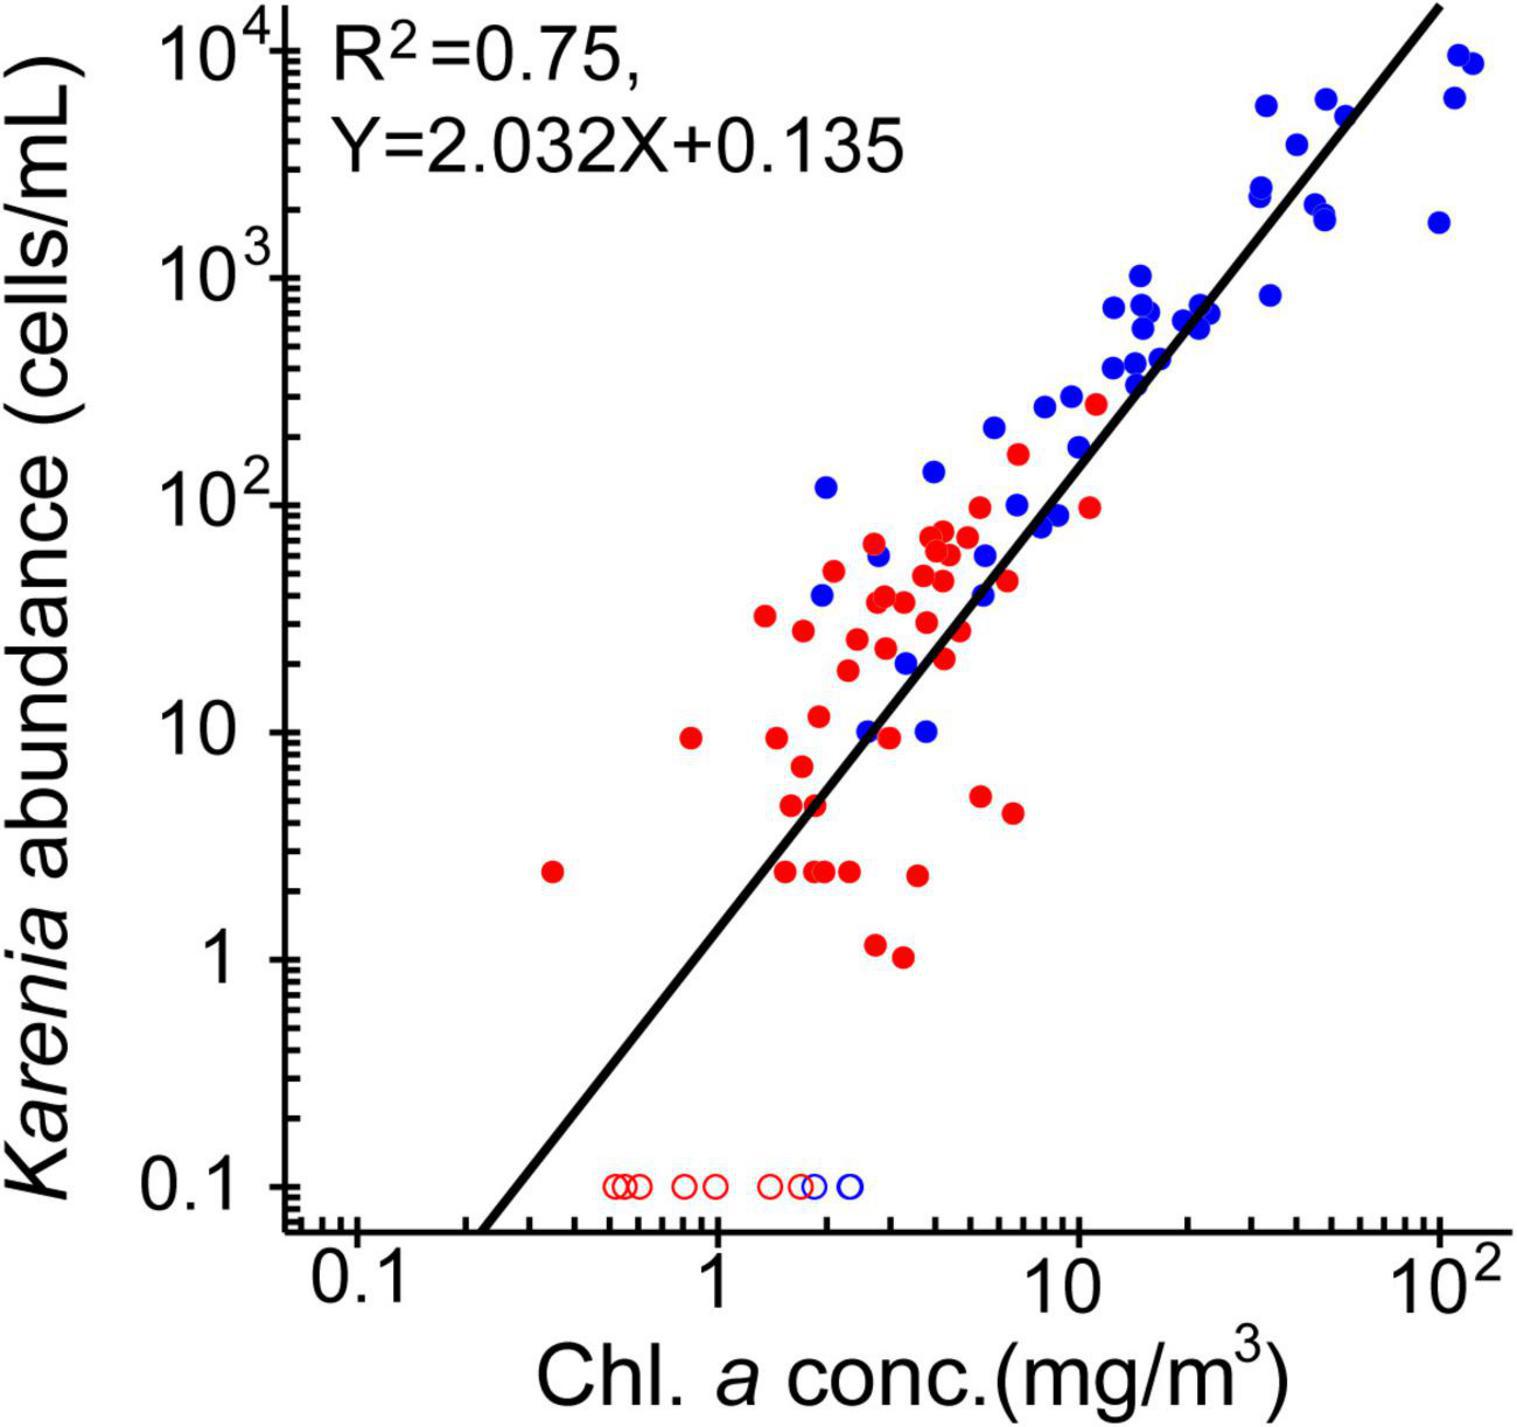
Figure 7. Scatter plots of Karenia spp. abundance versus chlorophyll-a concentration based on in-situ observations. The two variables were transformed by log10(x + 0.1). Red and blue closed circles indicate data points from the ship survey at 10-m depth and from the vicinity of the Katsurakoi fishery harbor at the sea surface, respectively. Open circles denote that abundance is equal to zero. The thick black line shows the log–log regression line.
To obtain a more robust statistical relationship between chlorophyll-a concentration and Karenia spp. abundance, we also examined the data collected from the Katsurakoi fishery harbor (Figure 7, closed blue circles). Karenia spp. abundances (chlorophyll-a concentrations) from the harbor ranged from 0 to 9,600 cells mL–1 (1.75–123.20 mg m–3), which was markedly higher than those obtained from the ship survey. By combining the two data sources, we obtained a robust log–log regression line spanning a wide range of values of both variables (R2 = 0.75).
To estimate maps of chlorophyll-a concentration as accurately as possible, we first compared satellite-derived variables measured at 0029–0035 coordinated universal time (UTC) on 9 October with in-situ chlorophyll-a concentrations at the sea surface along the ship track during 0300–2,400 (UTC) on the same day (Figure 8). On that day, the research vessel traversed a considerable distance along the A Line from south to north (Figure 8A, magenta line). OC4ME-based chlorophyll-a concentrations were most-closely correlated to in-situ measurements, although the original OC4ME estimates included some noise around clouds as well as overestimated chlorophyll-a concentrations (R2 = 0.78; Figure 8B). Estimates of NN more frequently included noise around clouds and were strongly polarized, but there was still a strong correlation with in-situ measurements (R2 = 0.57; Figure 8C). MLH and RBD estimates were quite similar and were strongly correlated with in-situ measurements (Figures 8D,E). These large positive correlations (Figures 8B–E) were attributed to the large-scale differences in chlorophyll-a concentrations between coastal-shelf and offshore waters; i.e., the presence of algal blooms in the subarctic northern A Line and the absence of blooms in the subtropical southern stations (Figures 8A, 9A). However, for areas of relatively low chlorophyll-a concentration (<3 mg m–3), chlorophyll a derived from RBD and MLH were positively biased and noisier than those derived from OC4ME; this reduced the correlations obtained (Figure 9A).
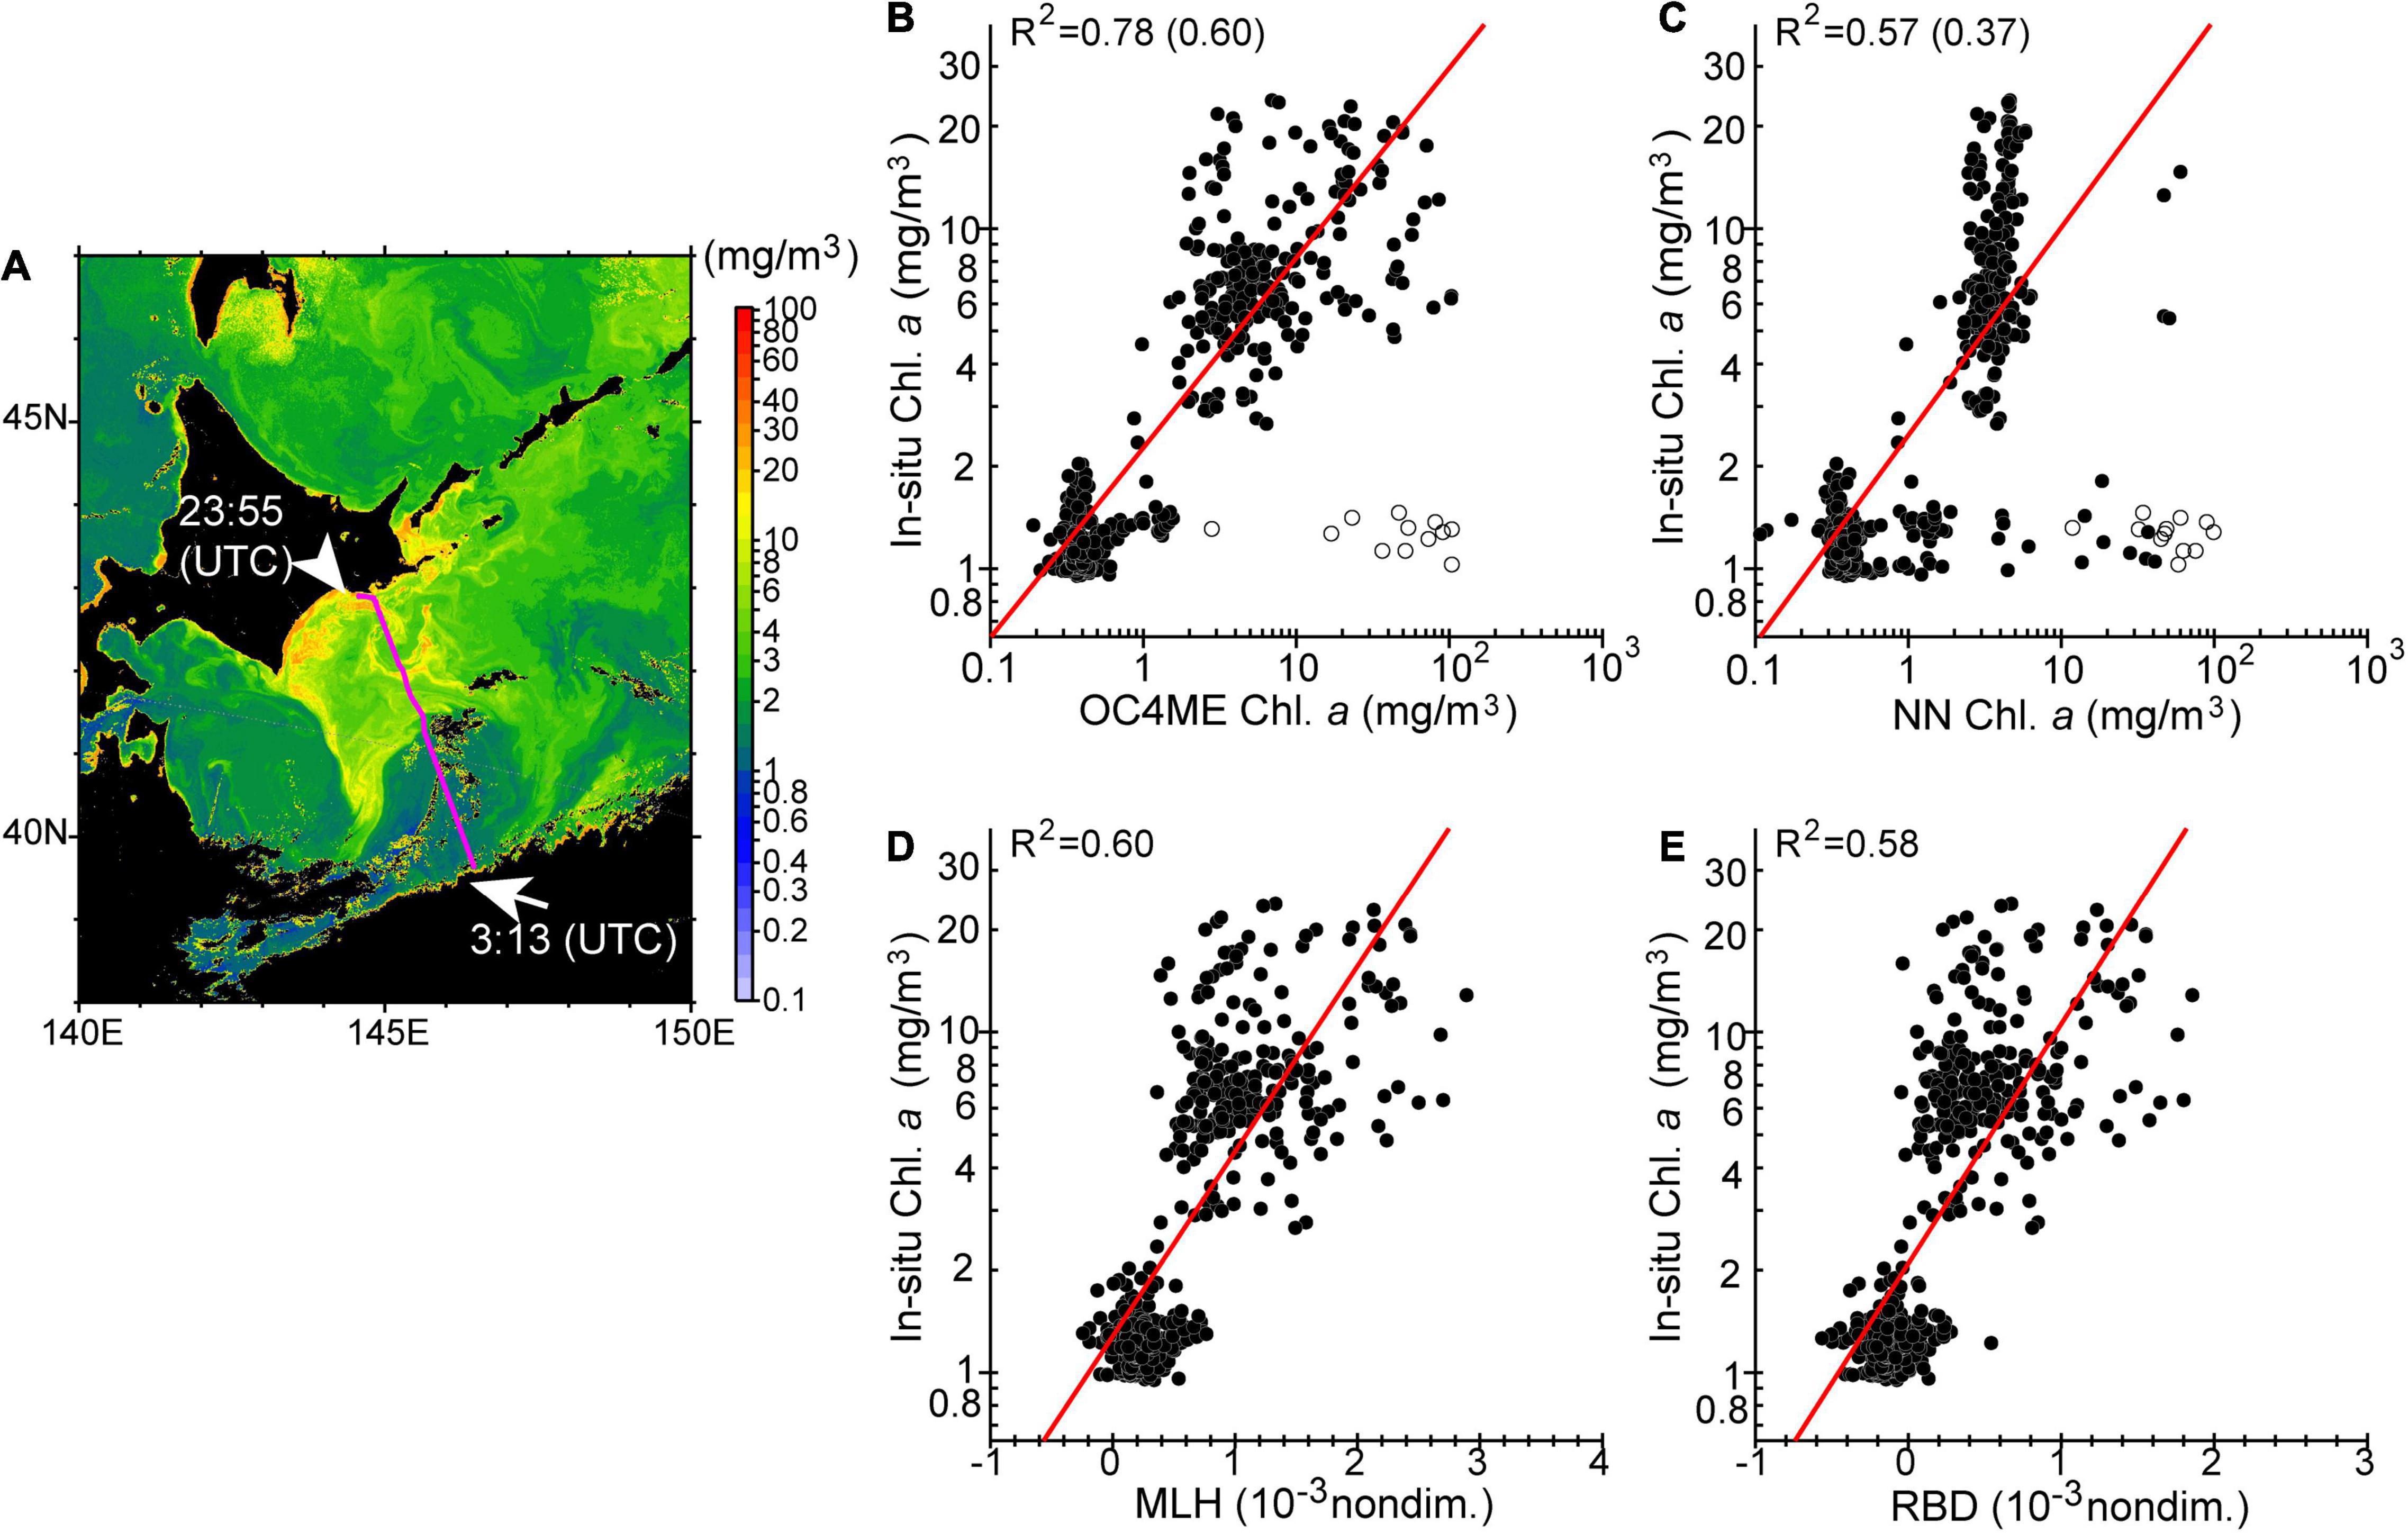
Figure 8. (A) Chlorophyll-a concentrations on 9 October, 2021, derived from the maximum band ratio semi-analytical algorithm (OC4ME) and corrected by the regression equation shown in Table 1. The magenta line represents the ship track from 0313 (UTC) to 2355 (UTC) on the same day. Scatter plots show surface chlorophyll-a concentrations along the ship track versus (B) OC4ME-derived chlorophyll-a concentrations, (C) Neural network (NN)-derived chlorophyll-a concentrations, (D) maximum line height (MLH), and (E) red-band difference (RBD). Coefficients of determination are shown in the top left-hand corner of each panel. For (B,C), coefficients of determination shown in parenthesis were estimated when data points with large deviations around the edges of clouds (indicated by open circles) were not excluded.
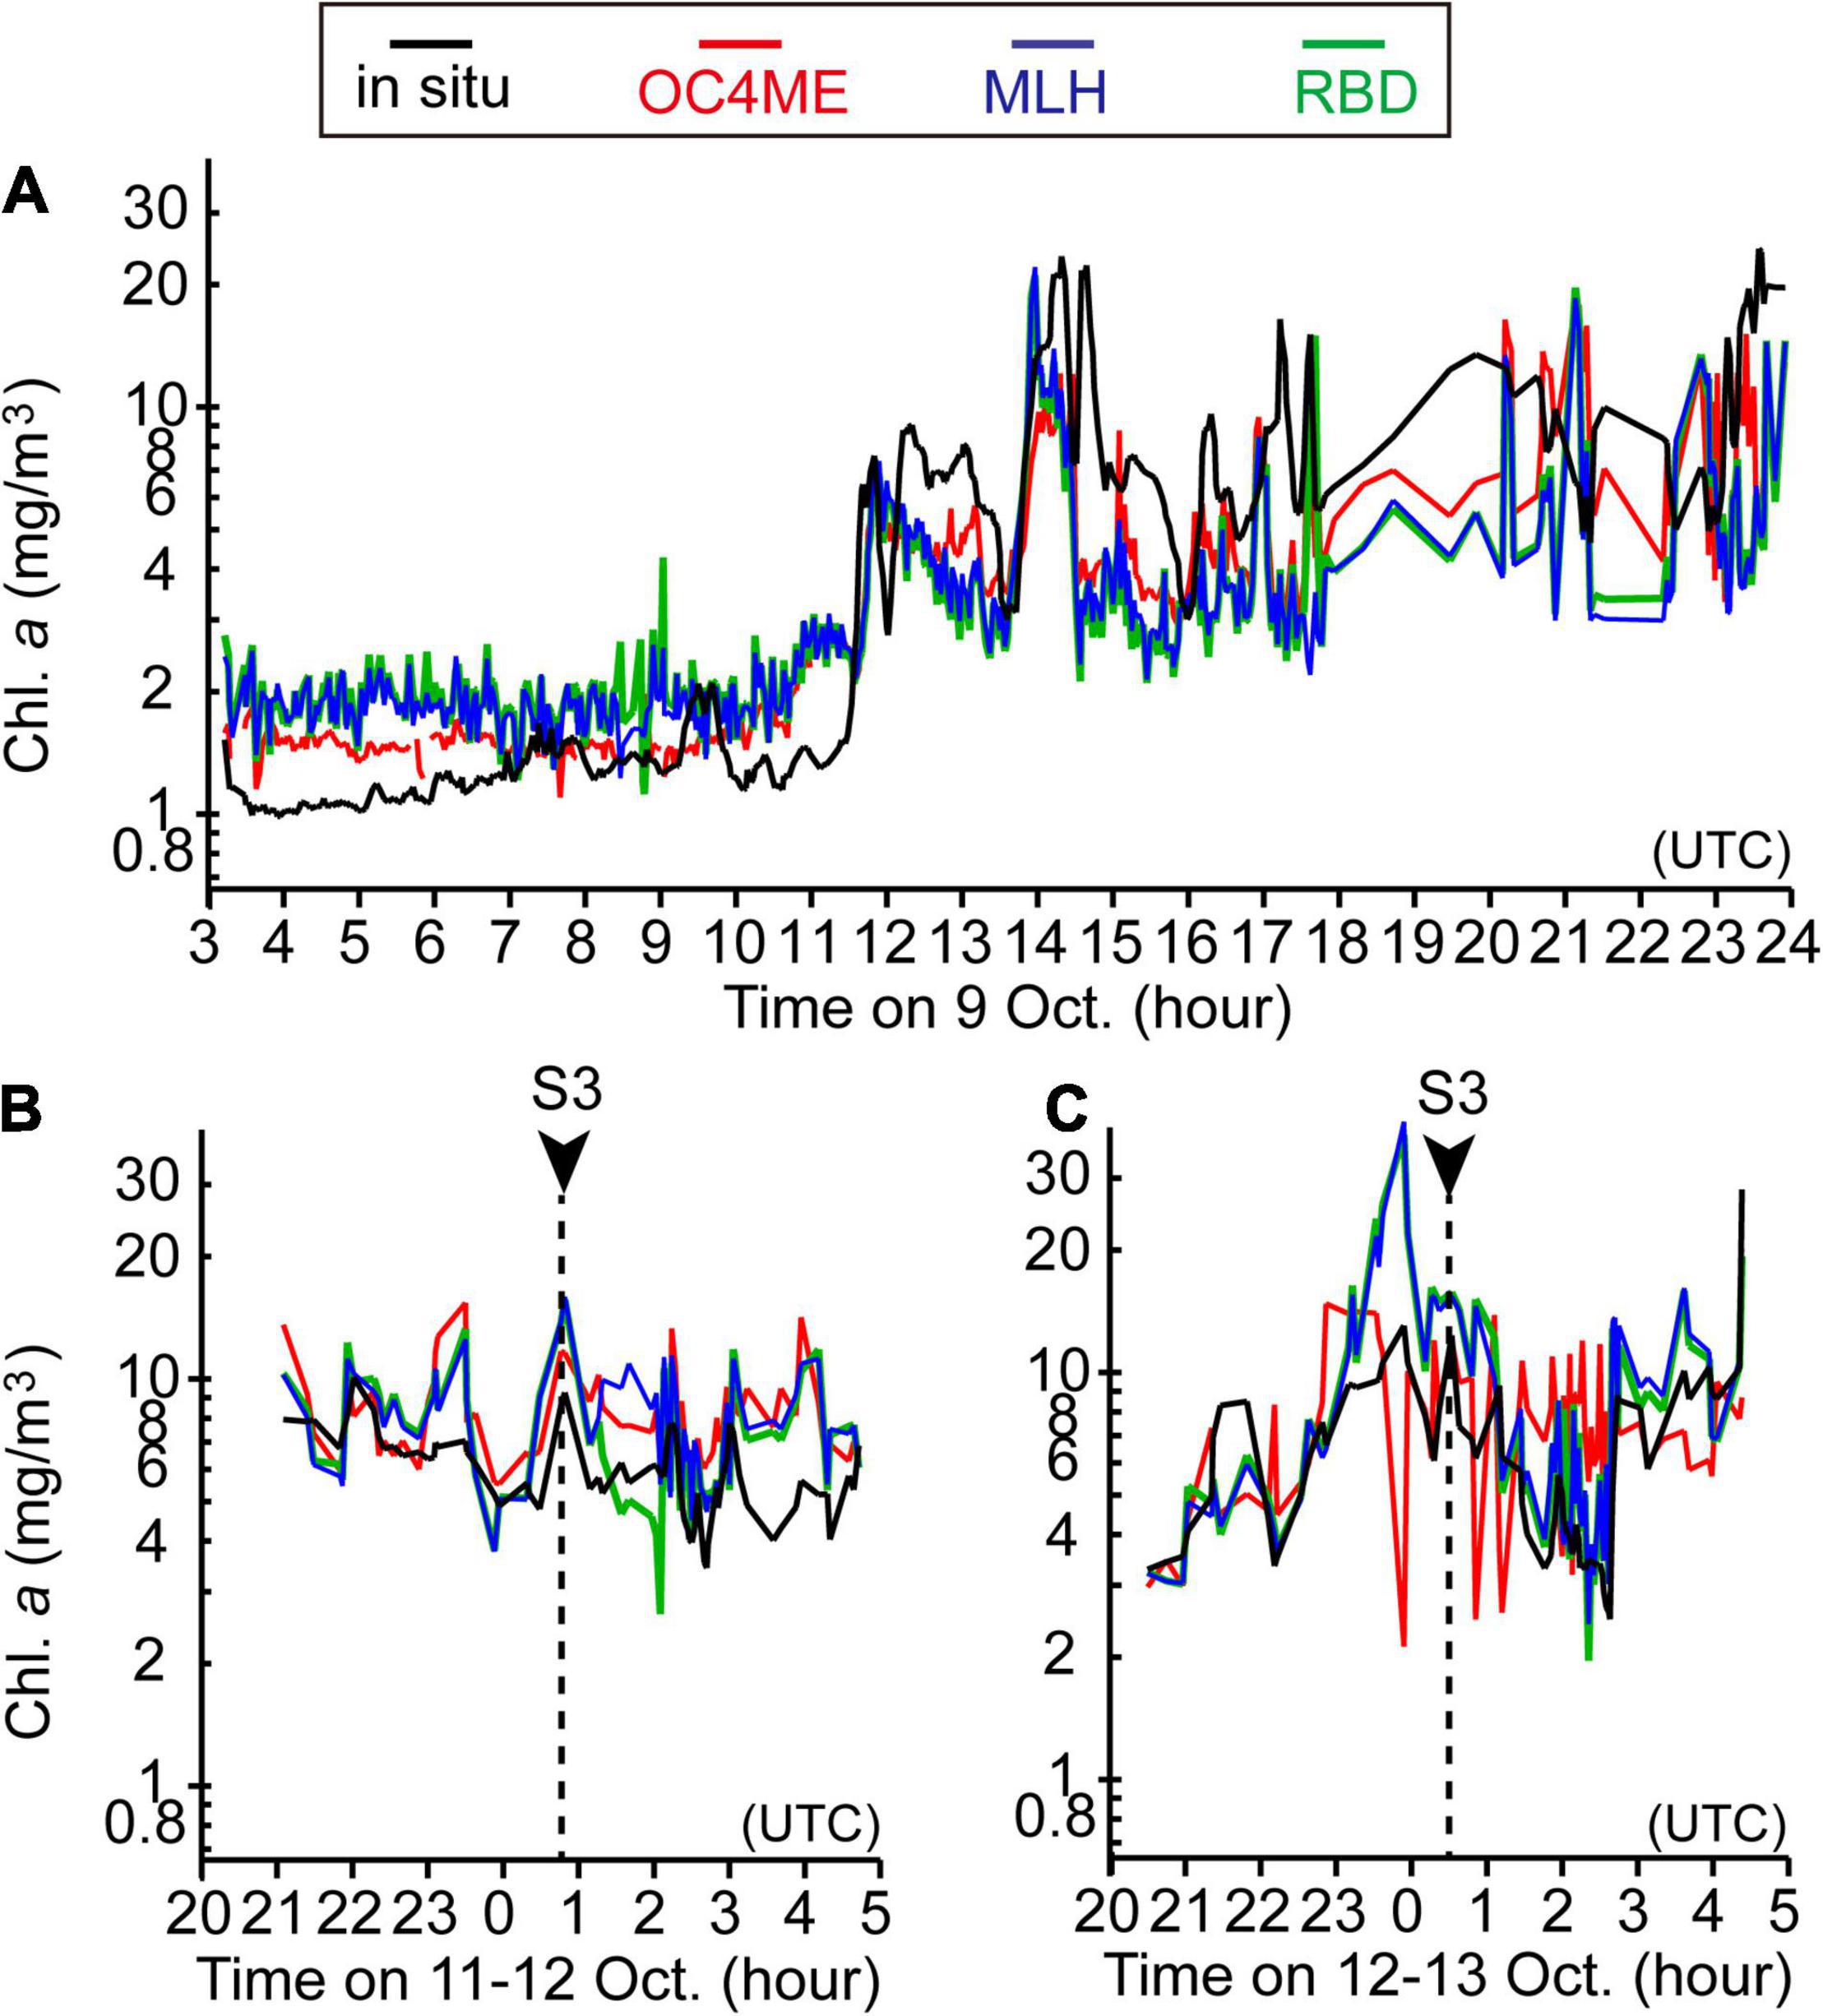
Figure 9. Time series of surface chlorophyll-a concentrations based on in-situ measurements (black lines), maximum band ratio semi-analytical algorithm (OC4ME)-derived estimates (red lines), maximum line height (MLH)-derived estimates (blue lines), and red-band difference (RBD)-derived estimates (green lines) that were corrected by using the regression equations listed in Table 1. The Sentinel-3 data shown in panels (A–C) correspond to images obtained on 9 October 0029–0032 (UTC), 12 October 0052–0055, and 13 October 0025–0028, respectively. For panels (B,C), in-situ chlorophyll-a concentrations were compared during the 4 h before or after the Sentinel-3 observations.
To test the validity of satellite-derived estimates on the shelf (where harmful blooms were most intense) at the submesoscale, we compared satellite-based variables measured at 0052–0055 (UTC) on 12 October and 0025–0028 (UTC) on 13 October with in-situ surface chlorophyll-a concentrations along the ship track that were measured during the above time periods ±4 h (Figures 9B,C). Chlorophyll-a concentrations based on MLH and RBD changed most synchronously with those obtained from in-situ measurements, whereas OC4ME-based estimates were less representative of small-scale variations in chlorophyll a (Figure 10), particularly on 13 October (Figure 9C), when small-scale noise was apparent. Therefore, we concluded that MLH and RBD were best suited to describing the spatial variability of chlorophyll-a concentrations on the Pacific shelf. We also estimated regression lines between satellite-derived variables and in-situ chlorophyll-a concentrations for the combined data obtained on 9, 11–12, and 12–13 October (Table 1).
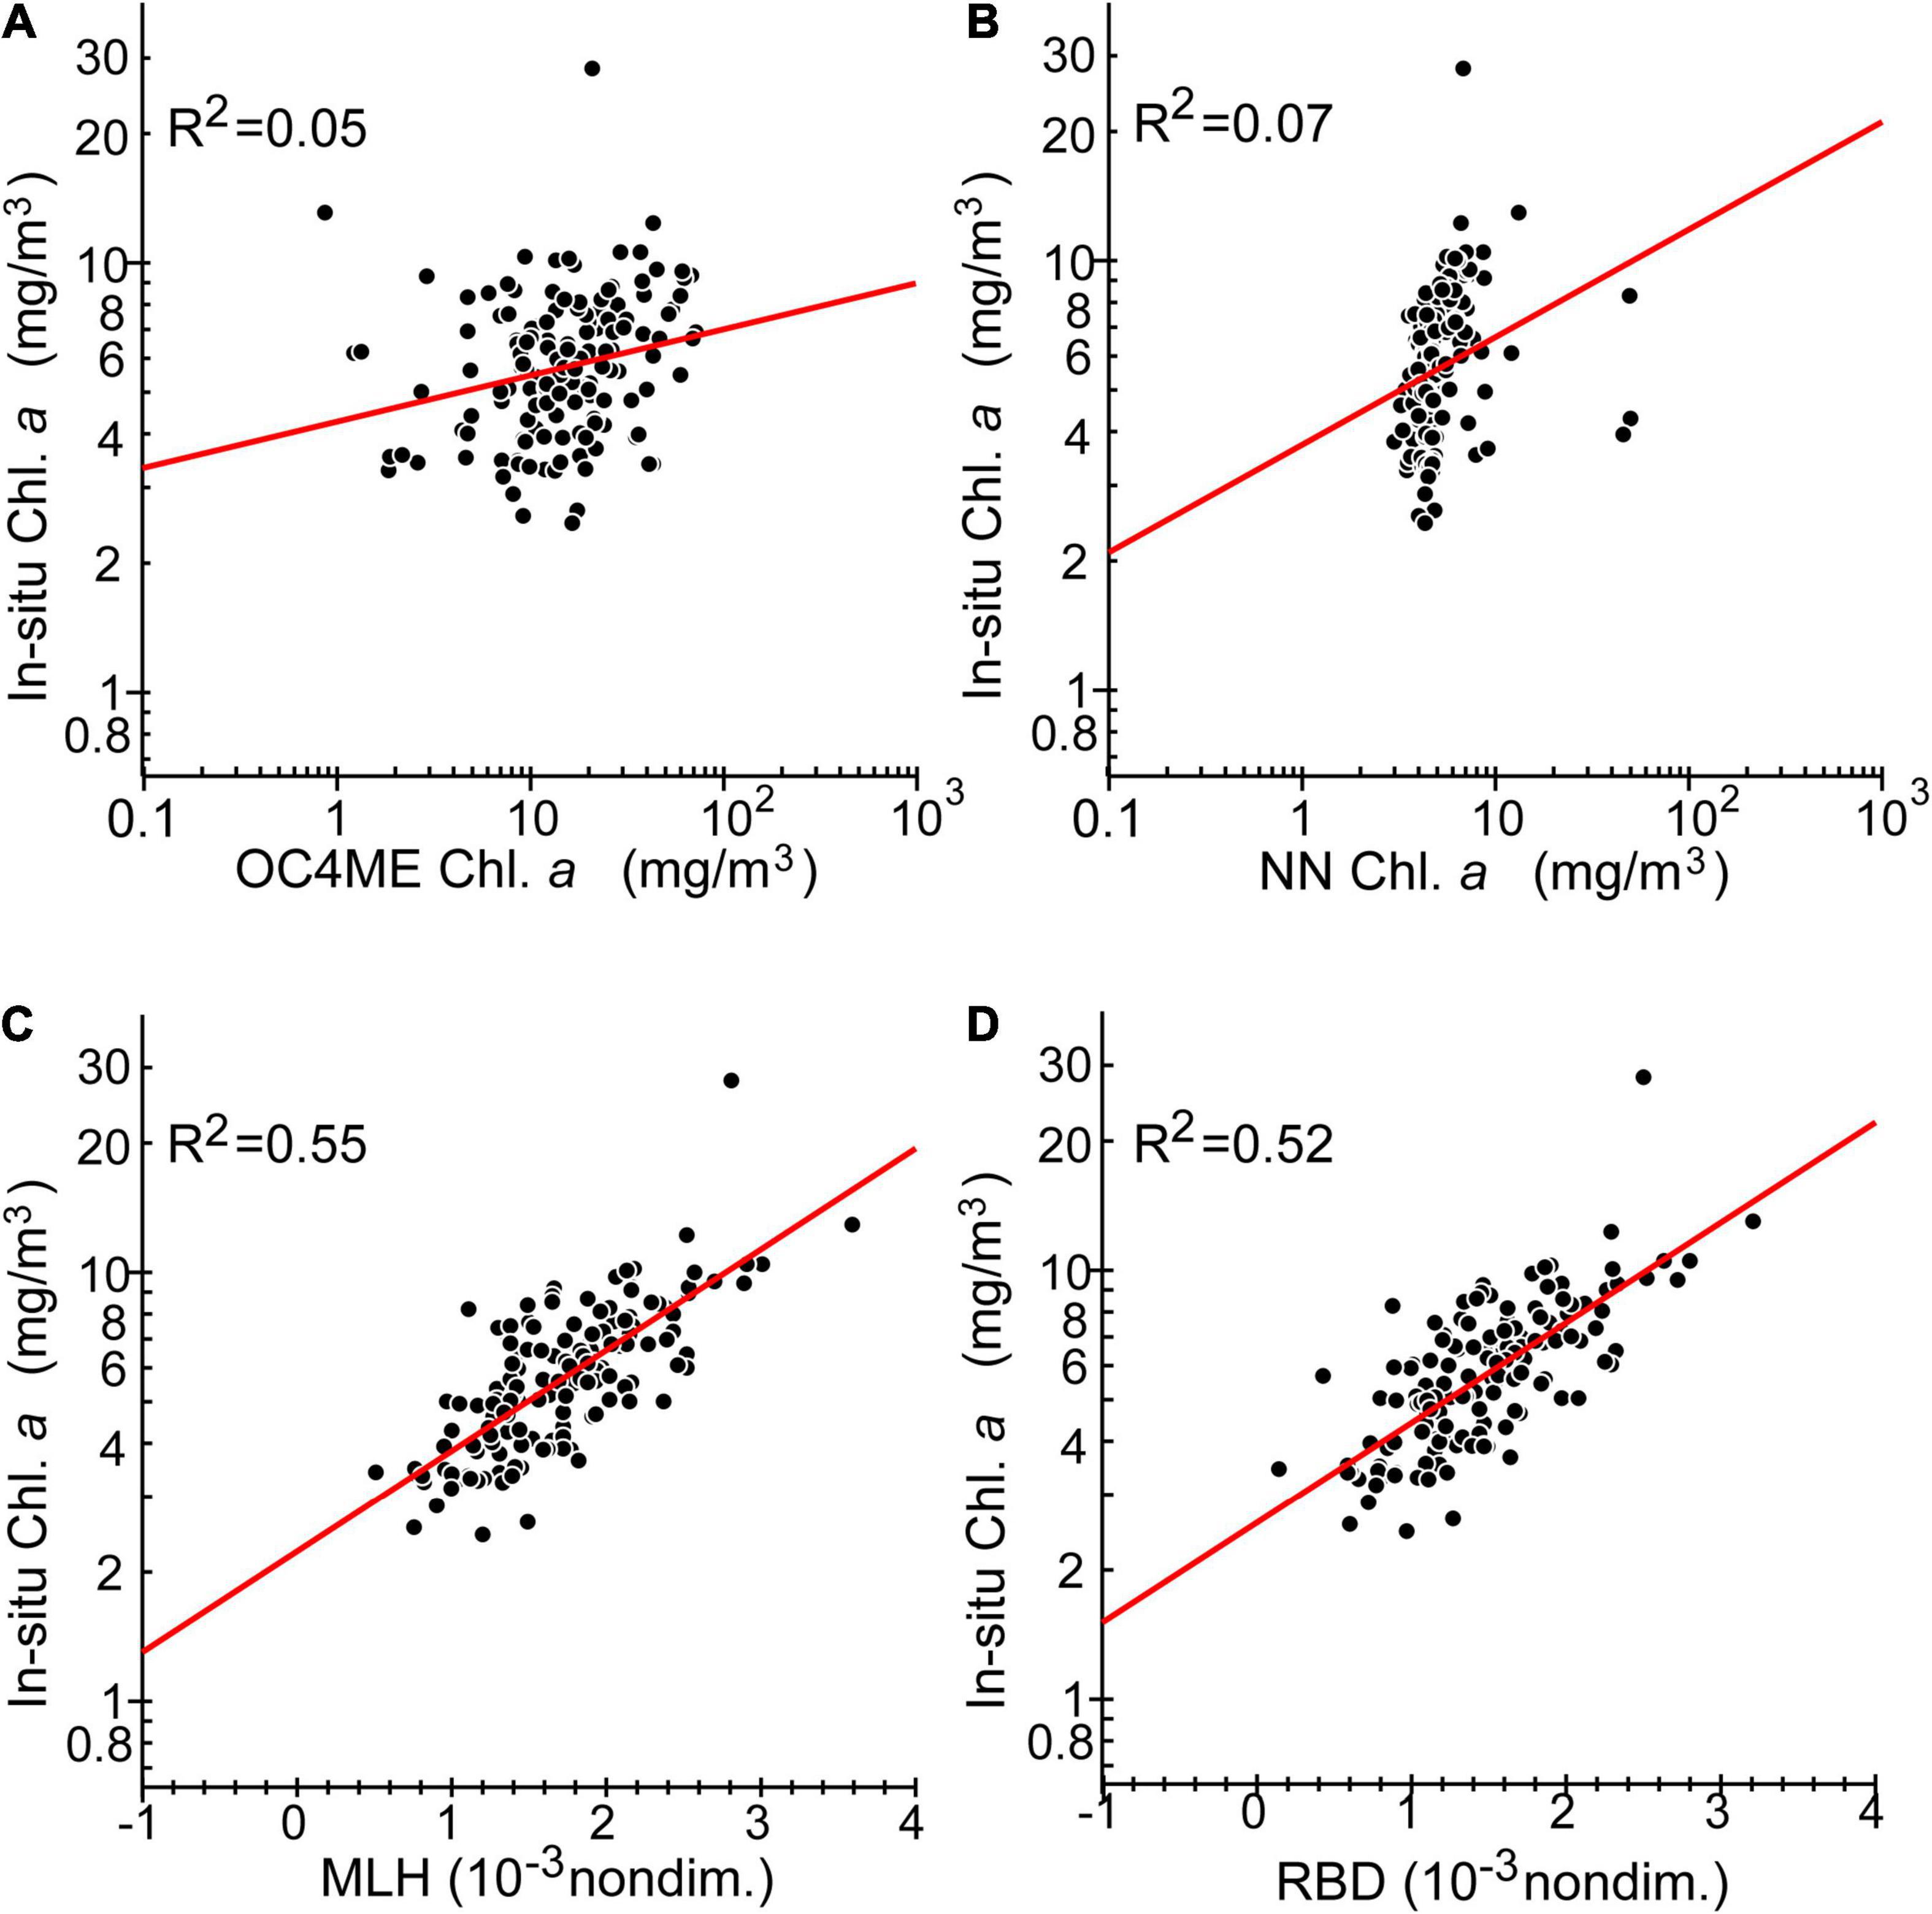
Figure 10. Panels (A–D) are the same as Figures 8B–E, respectively, but only for data points collected during the 4 h before or after the Sentinel-3 observations on 12 and 13 October, 2021.
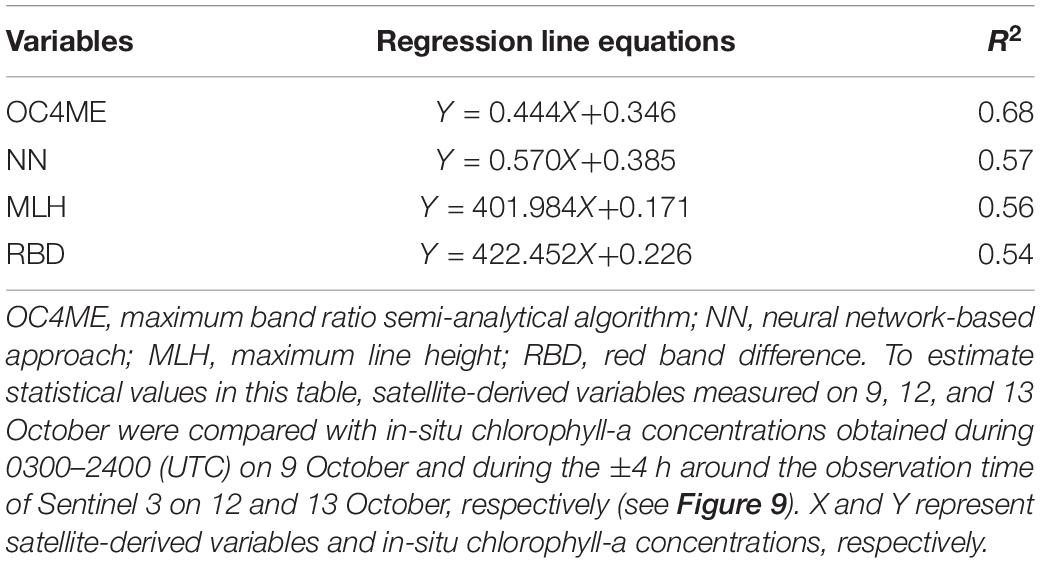
Table 1. Equations and determination coefficients of regression lines for in-situ chlorophyll-a concentrations and satellite-derived variables.
Note that MLH and RBD tended to overestimate chlorophyll-a concentrations on the shelf (Figures 9B,C). For the ±4 h relative to the satellite observation time on 12 and 13 October, mean chlorophyll-a concentrations based on MLH and RBD were estimated as 10.7 and 6.6 mg m–3, respectively—higher than the 5.6 mg m–3 measured in situ. Moreover, correlations declined if the time window was expanded beyond ±4 h of the satellite observation time (data not shown). This suggests that algal-bloom frontal structures changed rapidly spatiotemporally at the submesoscale, as is indicated by a previous analysis of thermal fronts on the Pacific shelf (Kuroda and Toya, 2020).
First, we generated maps of surface Karenia spp. abundance by combining satellite-derived surface RBD with in-situ Karenia spp. abundance at a depth of 10 m. In-situ Karenia spp. abundance was positively correlated with satellite-derived RBD once the abundance was log-transformed (Figure 11). Satellite-derived RBD was converted to Karenia spp. abundance by using a log–linear regression (Figure 11). We assumed that the average ratio (i.e., 2.4) of chlorophyll-a concentrations between the two depths (Figure 6A) was identical to that of Karenia spp. abundances, and estimated Karenia spp. abundance at a depth of 10 m was converted to that at the surface.
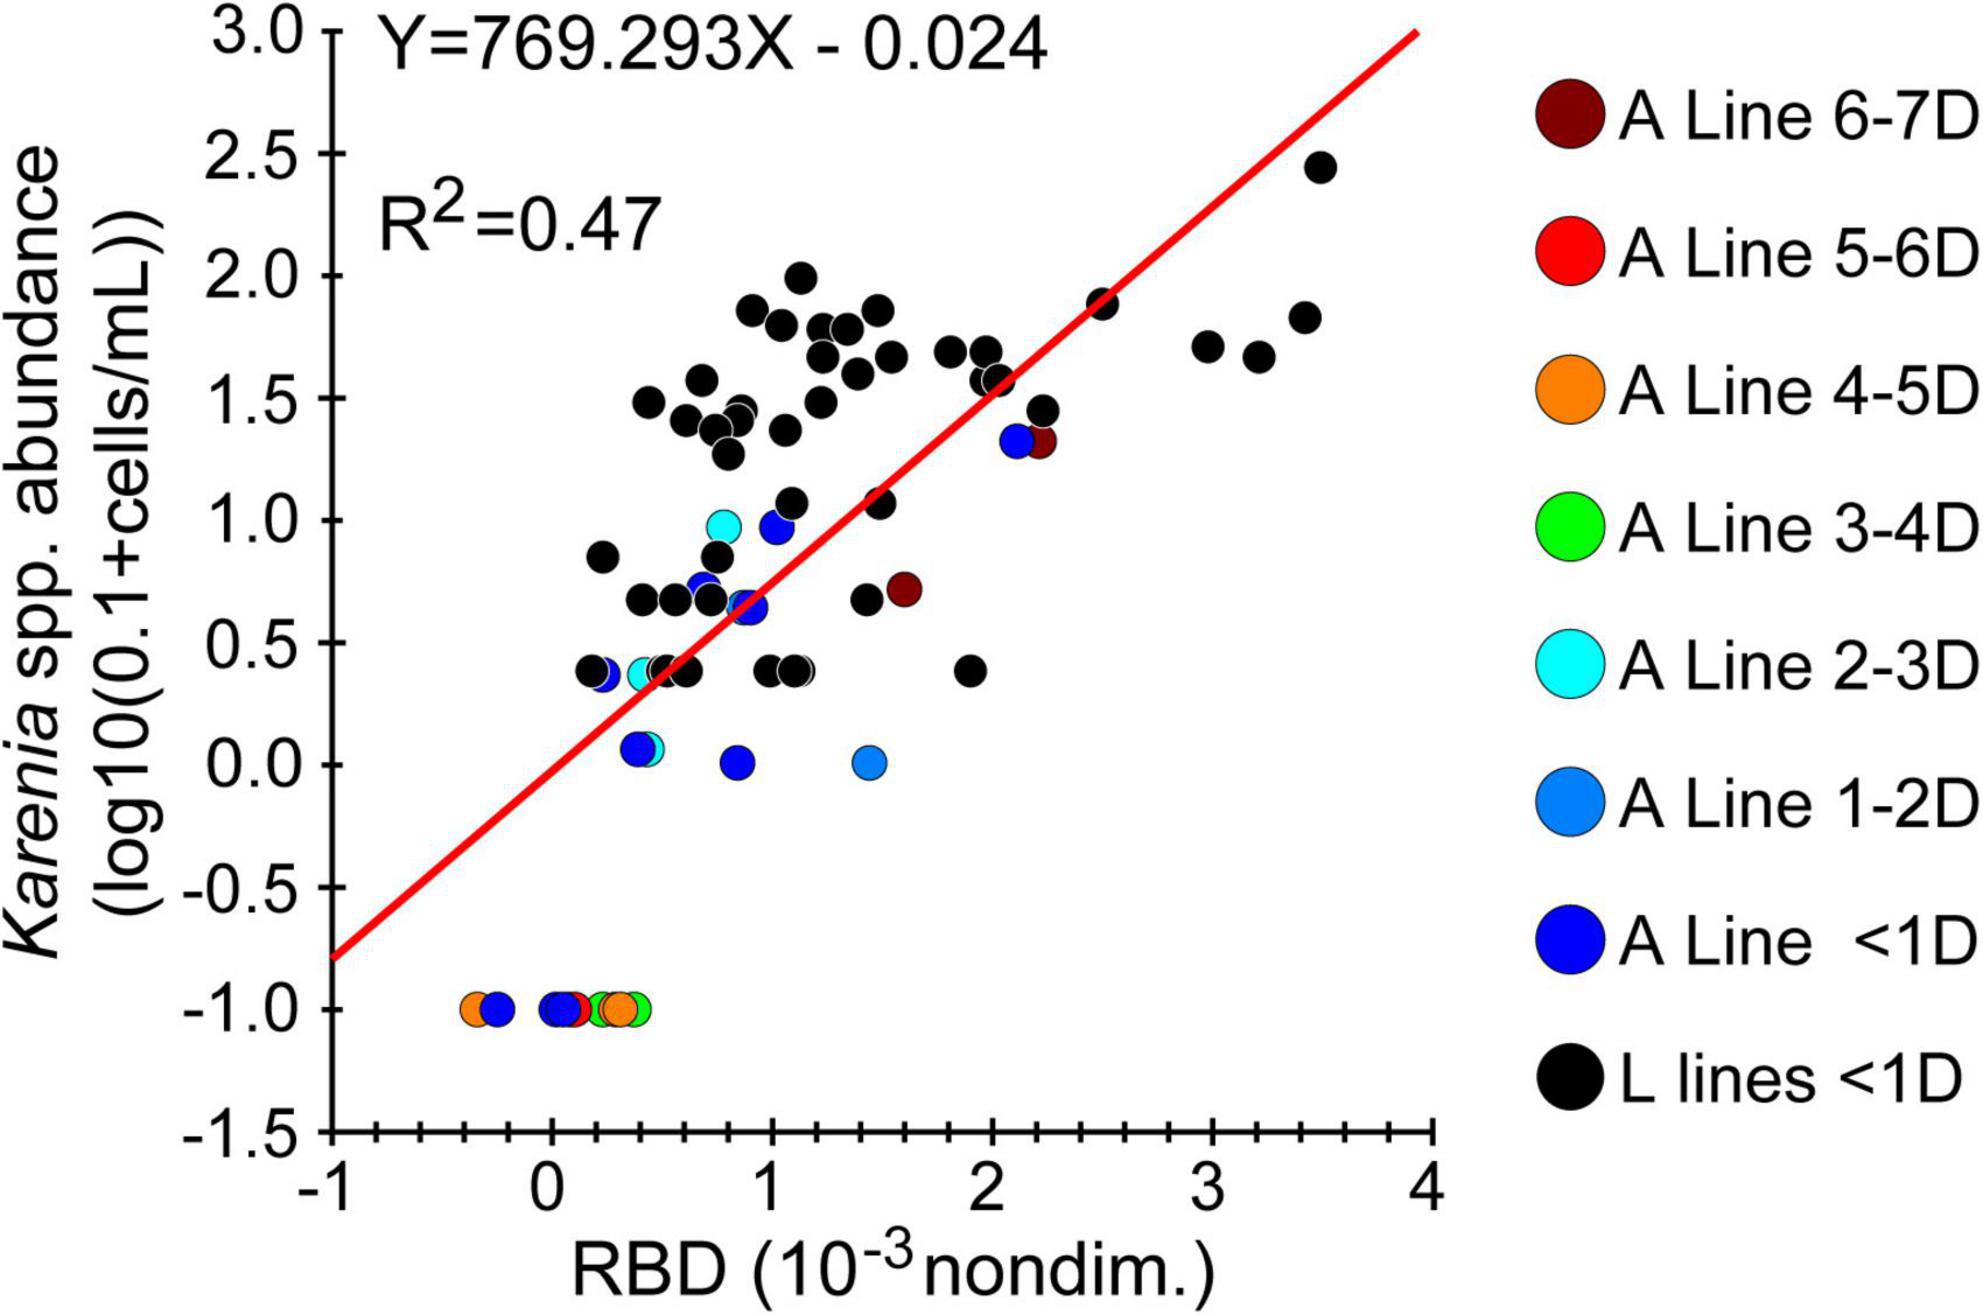
Figure 11. Scatter plots of Karenia abundance at 10-m depth along the A Line and L lines. Data collected from the L lines (black closed circles) were measured within 1 day (“<1D”) of an observation by Sentinel 3. Data collected from the A Line are colored according to time interval (in days) between the abundance measurement and an observation by Sentinel 3, where the longest interval was 7 day.
Second, we also generated maps of Karenia spp. abundance from maps of chlorophyll-a concentration. We used MLH to estimate chlorophyll-a concentration for this analysis, mainly because MLH performed well in matching the spatial variability of chlorophyll-a concentrations on the Pacific shelf (see the preceding section “Maps of Chlorophyll-a Concentration”) and MLH was most prone to underestimating chlorophyll-a concentrations in coastal waters where harmful algal blooms were not reported. This suggested that MLH-based chlorophyll-a concentrations most reduced contamination associated with colored dissolved organic matter in coastal waters (Supplementary Figure 2).
Maximum line height-derived chlorophyll-a concentrations were estimated by using the regression equation in Table 1 and converted into Karenia spp. abundances by using the regression equation in Figure 7. We assumed that Karenia spp. were absent at chlorophyll-a concentrations <2.2 mg m–3, a threshold that corresponds to the maximum in-situ surface chlorophyll-a concentration at which Karenia spp. were not identified (Figure 7).
Maps generated by using the two methods for 9 October, 2021 were largely consistent with each other, particularly for large- and small-scale structures of Karenia spp. abundance. However, the second method tended to generate higher estimates (Figures 12A,B). The bias was about 0.3 log10(cells mL–1) over the whole study region, which means that there was an approximately 2-fold difference in estimated Karenia abundances between the first and second methods. Possible reasons for this bias are discussed in section “Uncertainties of Estimated Karenia spp. Abundance.”
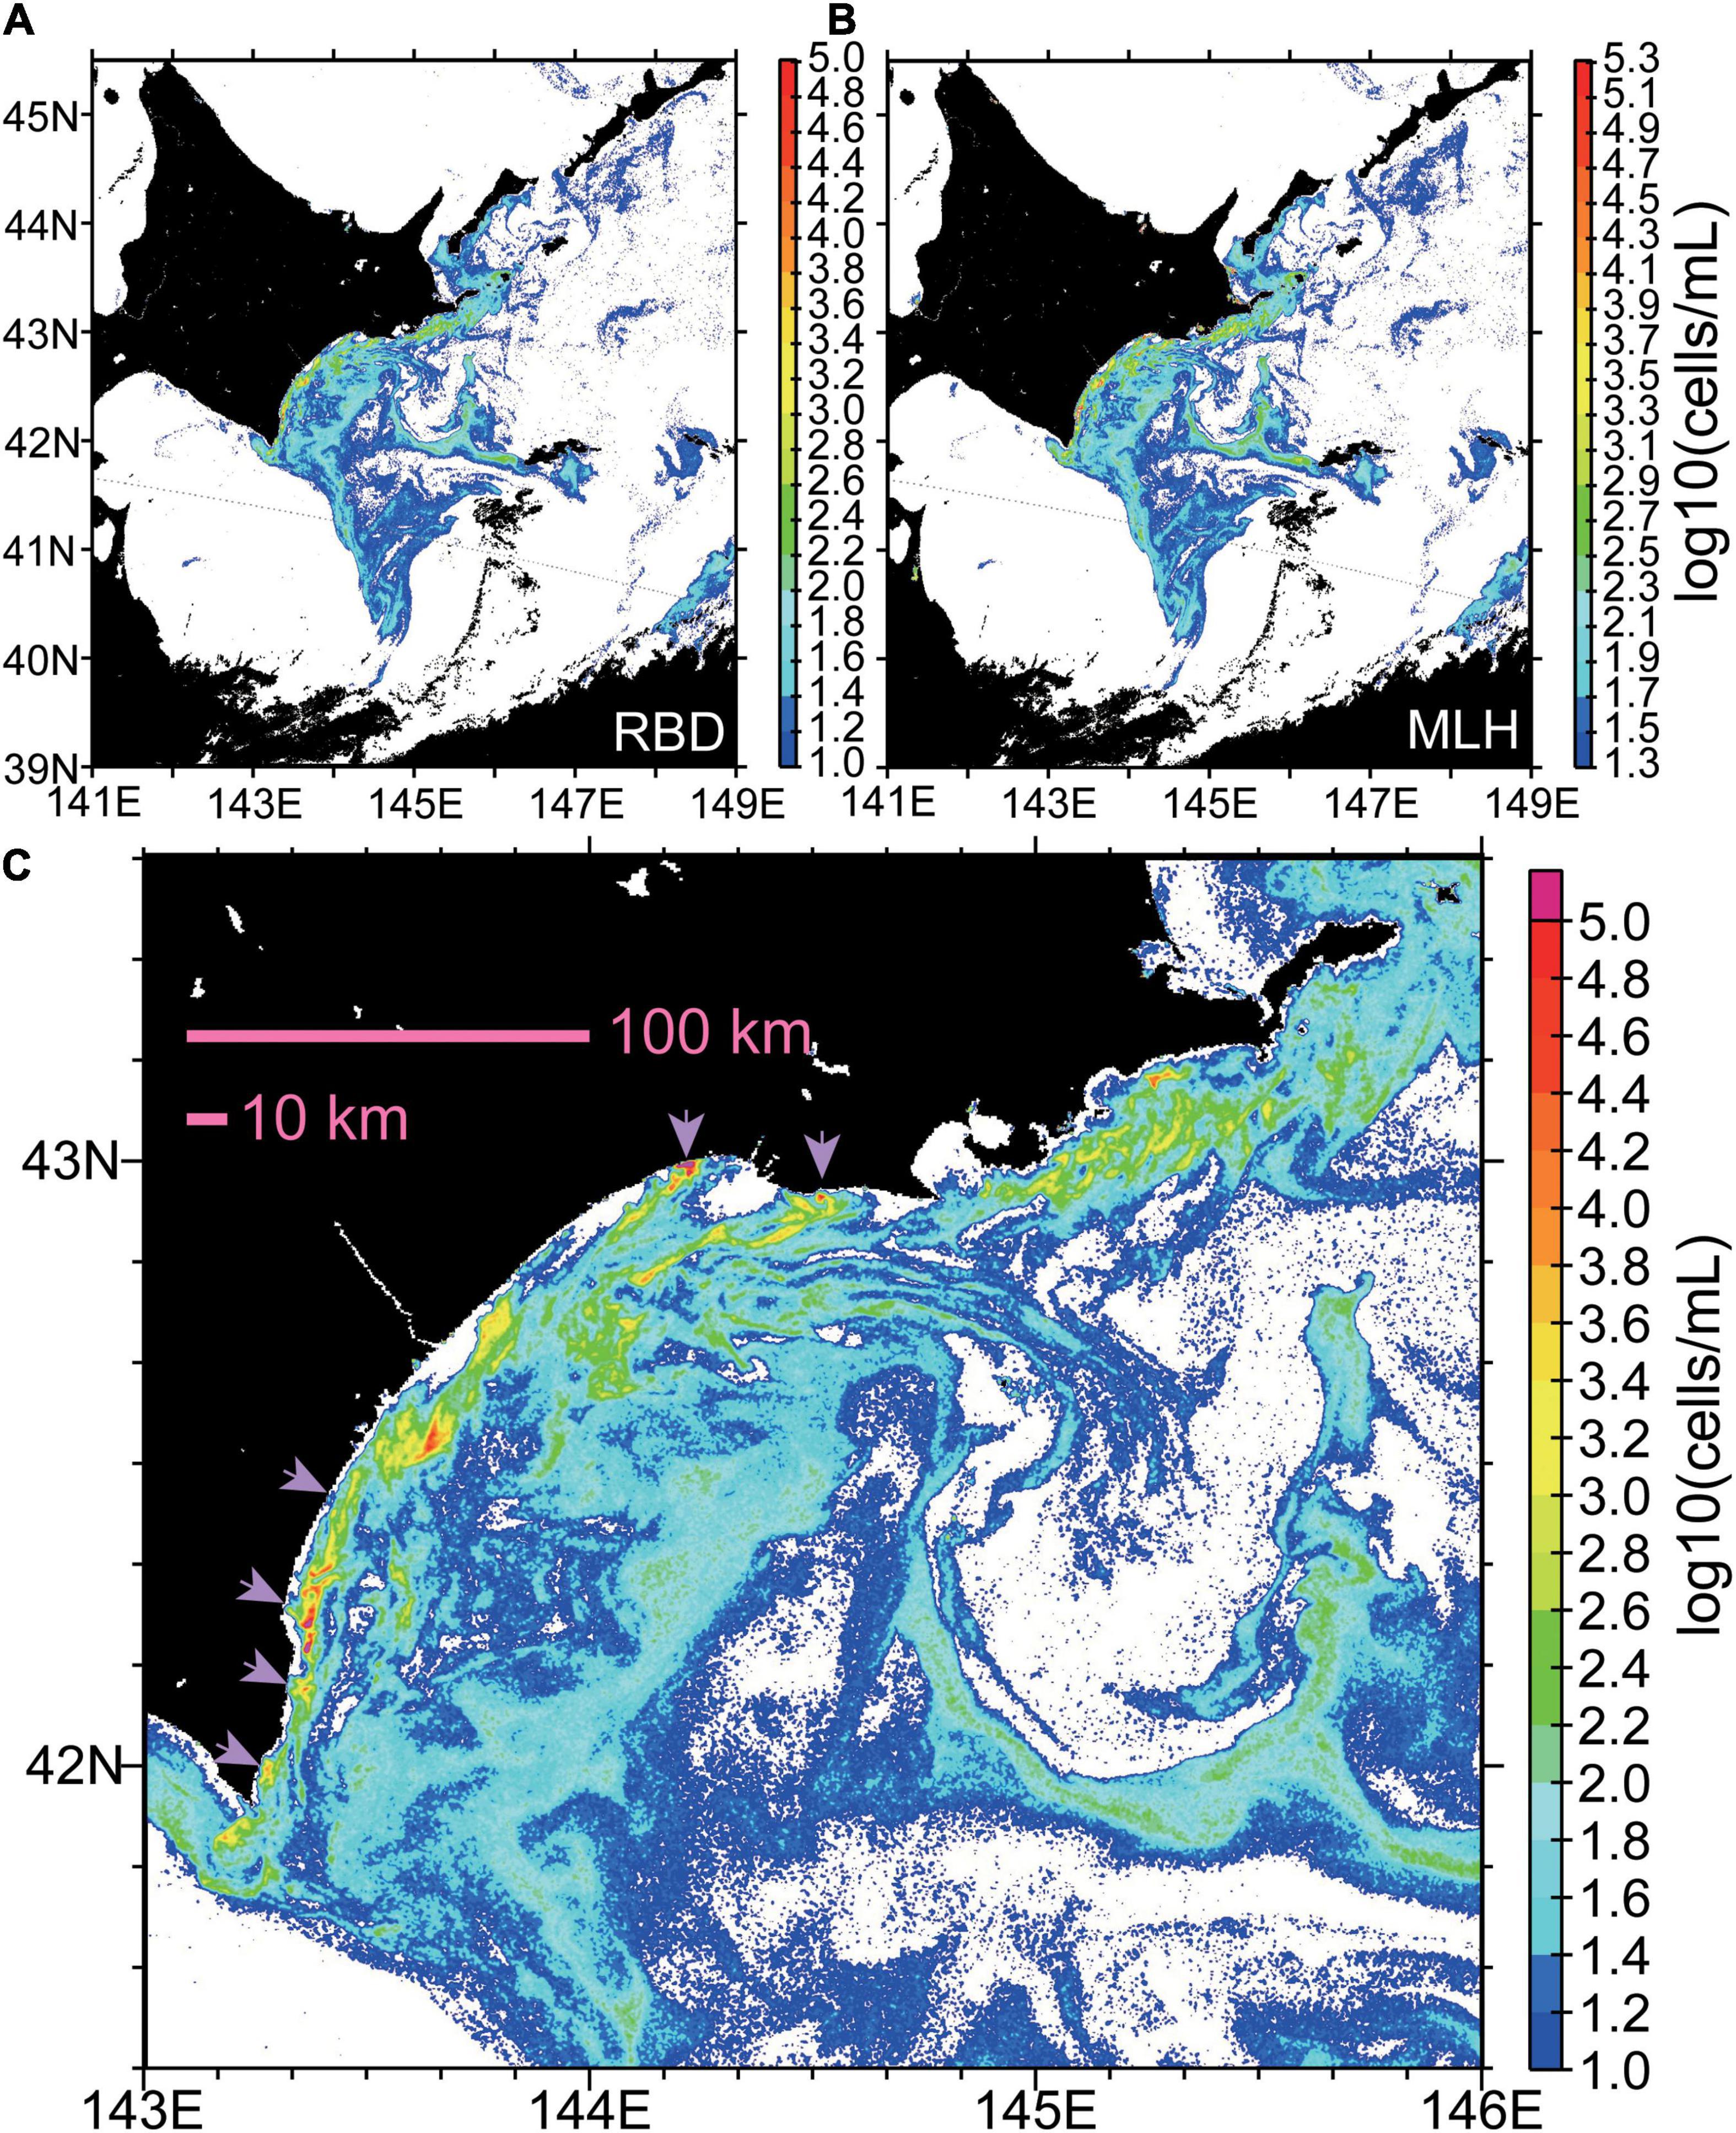
Figure 12. Maps of Karenia abundance (log10[cells mL–1]) on 9 October 2021, estimated (A) directly from red-band difference (RBD) or (B) indirectly from maximum line height (MLH) and estimated chlorophyll-a concentrations. The color scale of panel (B) is offset from that of panel (A) by 0.3, which corresponds to about a 2-fold difference [i.e., 100.3∼2]. (C) The same as panel (A), but for a smaller area. Light purple arrows indicate high abundances in very nearshore waters.
On 9 October, the core of the Karenia bloom appears to have been primarily located on the shelf (Figure 12C); Karenia abundances exceeding 103 cells mL–1 on the shelf (Figure 12C, yellow colors) tended to exhibit streak-like structures of width <10 km, which were associated with submesoscale filaments. The streak-like filaments extended roughly in parallel to the coastline, rather than normal to it. Moreover, particularly high abundances exceeding 104 cells mL–1 (Figure 12C, red colors) were distributed in a patch-like manner on the shelf. These small, surface-level structures are also identifiable in the ship-track data as patch-like localized chlorophyll-a maxima of up to a few kilometers in scale (Figure 4B).
Karenia spp. abundances on the continental slope were lower overall than those on the shelf. However, relatively high abundances on the slope (∼102 cells mL–1; Figure 12C, green colors) occurred along the edge of a mesoscale clockwise eddy with a diameter of about 100 km (Figure 1B, light blue eddy).
Karenia spp. abundances in very nearshore waters were typically on the order of <101 cells mL–1 (Figure 12C, white) and were clearly lower than those on the shelf. However, this might have been caused by estimation biases in the data from Sentinel 3. Despite this possible bias, high abundances exceeding 103 cells mL–1 were distributed locally near the coast (Figure 12C, light purple arrows) and were connected to high-abundance patches on the shelf by streak-like filaments.
On the basis of the RBD-derived Karenia spp. abundances for 3–18 October, the above-described features were common throughout our study period, although the spatiotemporal distribution of Karenia spp. blooms changed greatly (Figure 13). In particular, dynamic changes became apparent within a single day from 12 to 13 October (Figures 13C,D). Karenia spp. abundances on the shelf increased abruptly, and high-abundance patches also expanded to the vicinity of the coastline. Streak-like structures with high abundances exceeding 103 cells mL–1 were more apparent on 13 October, particularly in the western half of the study region. When Karenia spp. abundances were averaged over the shelf (Figure 13A, pink polygon), the rate of increase in abundance was estimated to be 2.1- and 2.6-fold per day for RBD- and MLH-derived estimates (Figure 13F), respectively. The rate of increase of Karenia abundance exceeded that of chlorophyll-a concentrations (∼1.5-fold per day). Moreover, on 18 October, when algal blooms over the Pacific shelf decayed gradually (Figure 2), a streak-like structure became highly intensified along the coastline just east of Cape Erimo, where Karenia abundances exceeded 104 cells mL–1 (Figure 13E). Hence, a western-intensified structure became more apparent during the decay period of the algal blooms over the shelf.
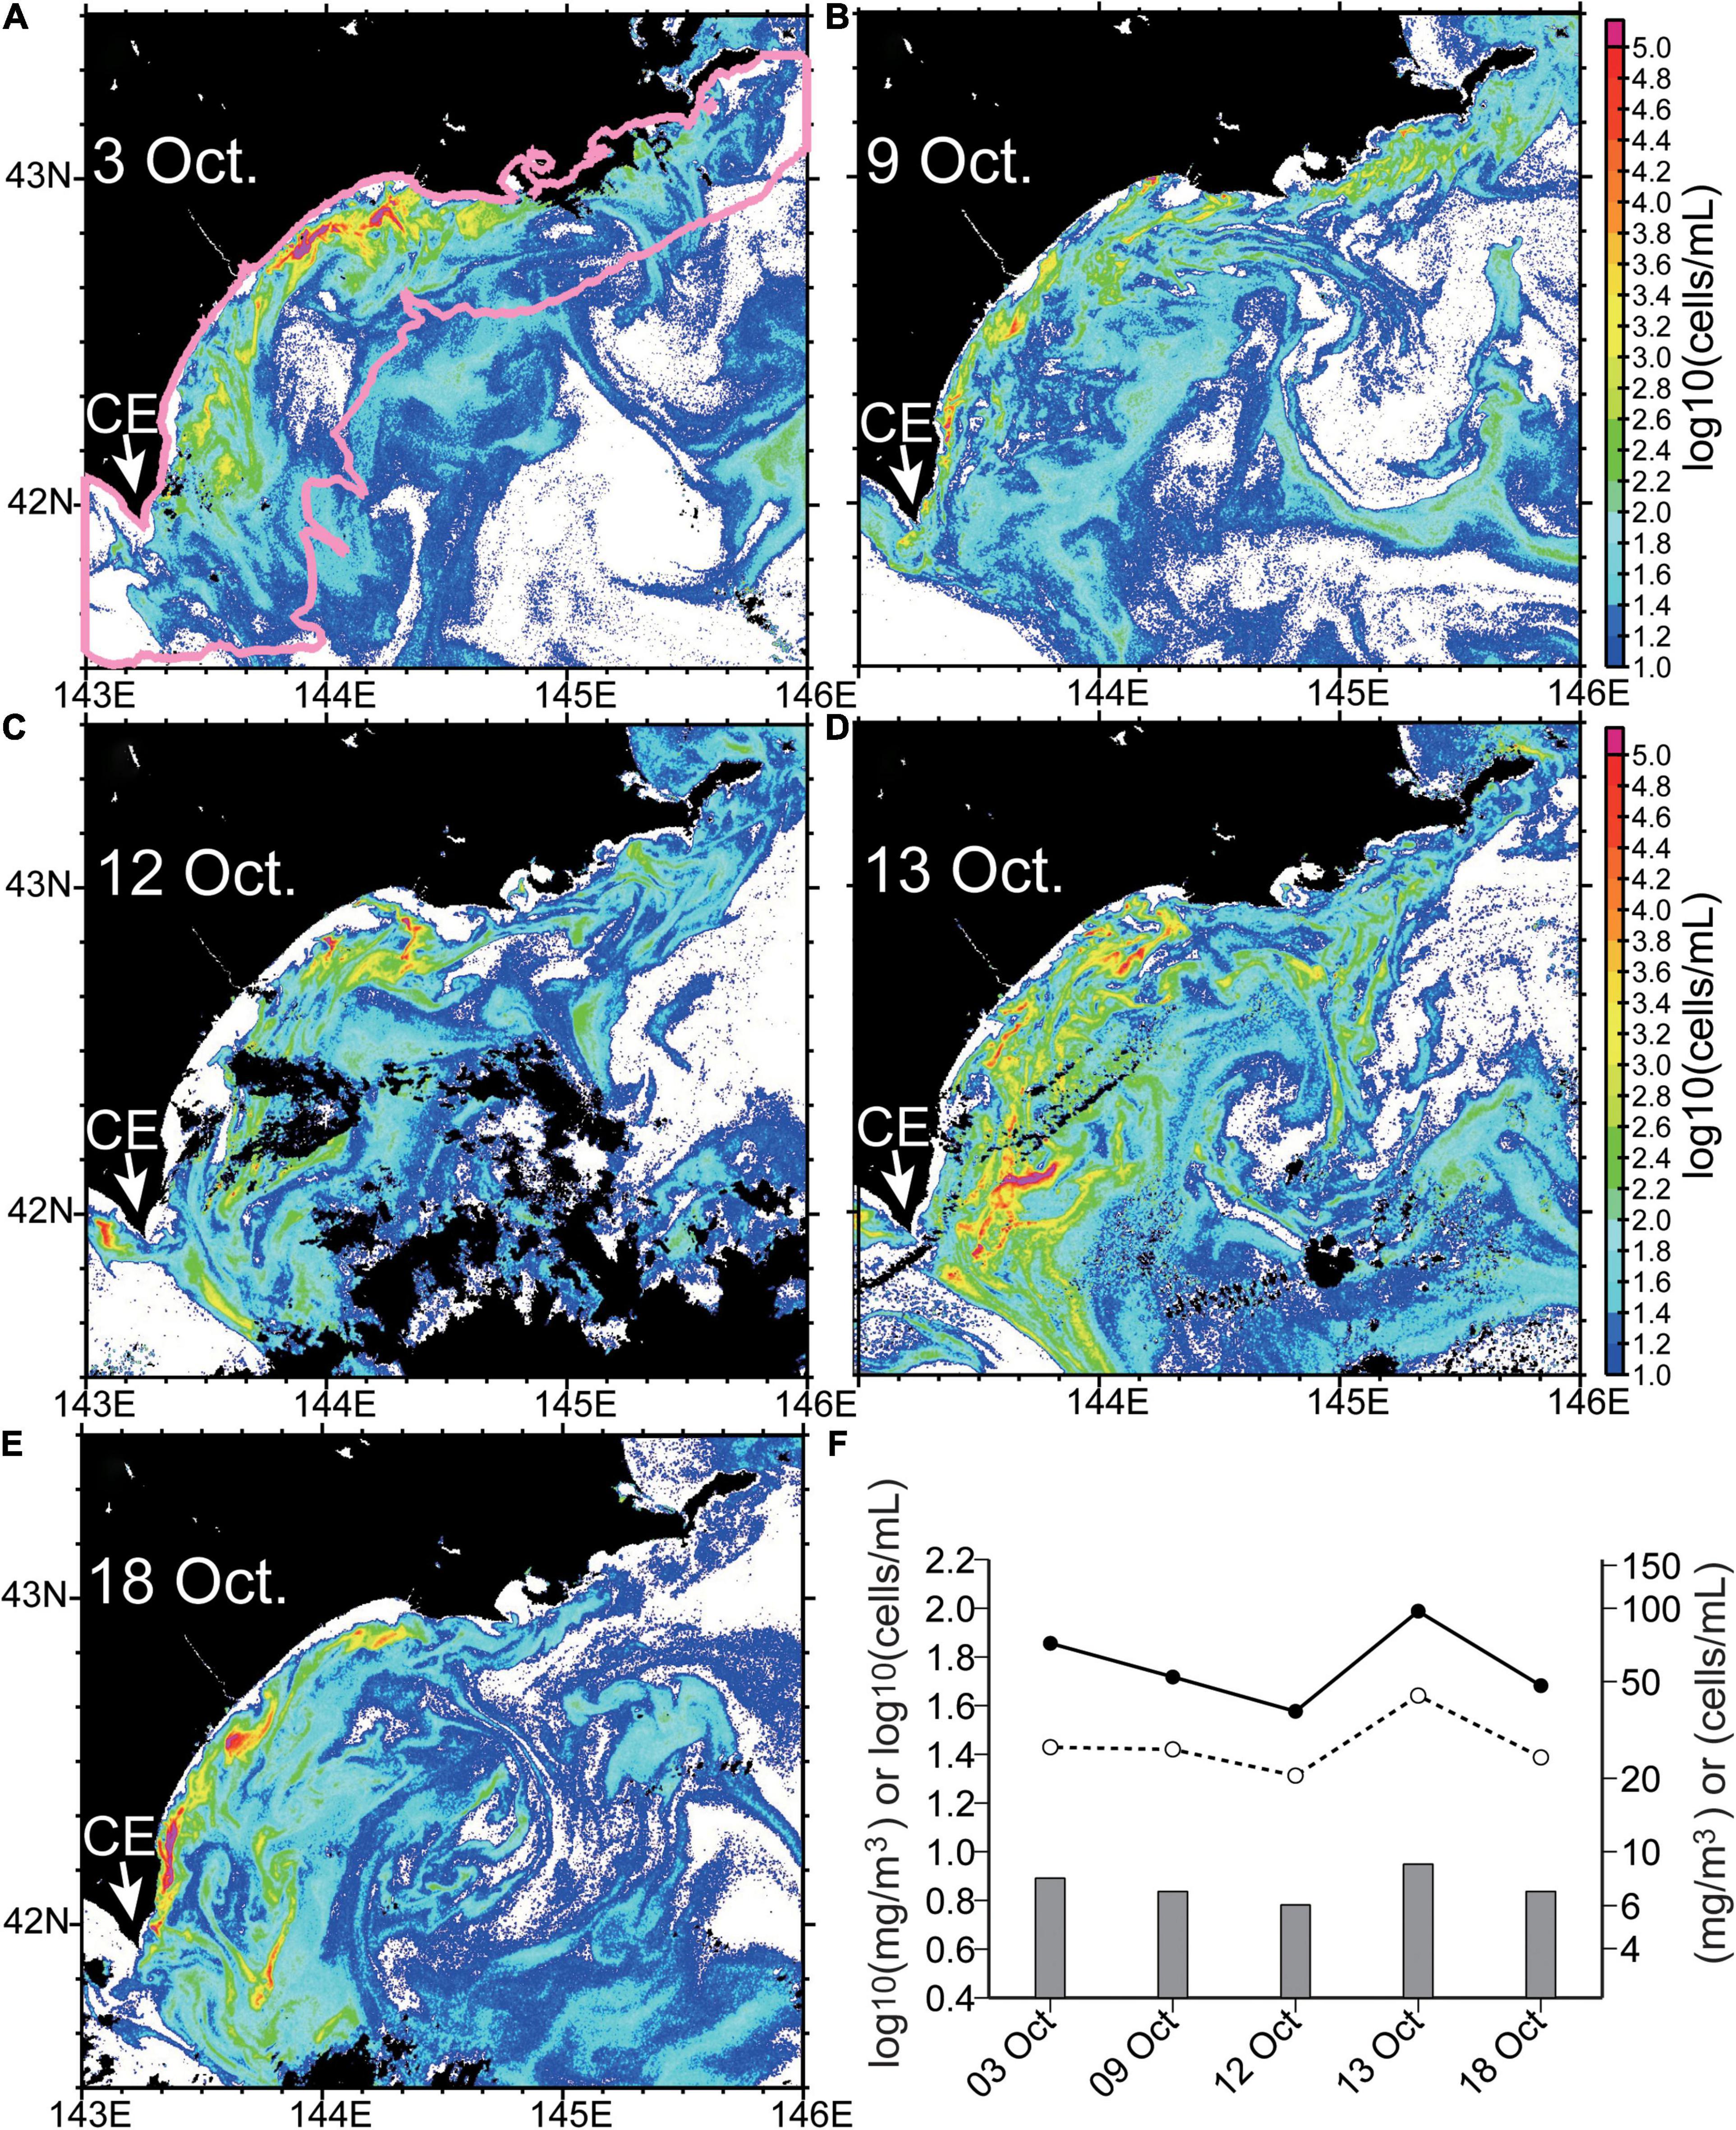
Figure 13. (A–E) The same as Figure 12C (units: log10[cells mL–1]), but for (A) 3, (B) 9, (C) 12, (D) 13, and (E) 18 October, 2021. CE, Cape Erimo. (F) Karenia abundance (lines) and chlorophyll-a concentration (bars) averaged over shelf–slope regions with water depth <1,000 m [i.e., the pink polygon in panel (A)] and derived from red-band difference (dashed line, open circles) and maximum line height (solid line, closed circles). Estimated chlorophyll-a concentrations were based on maximum line height and a regression equation (Table 1).
In this study, we generated maps of estimated Karenia spp. abundance by using two methods, the first based on RBD and the second on MLH. The MLH-derived abundances were about twice as high as those derived from RBD. First, we discuss the possible reasons for this difference below.
There are at least three weaknesses associated with the RBD-based estimation, in which RBD was directly converted into Karenia spp. abundance. First, in-situ Karenia spp. abundances measured during our ship survey ranged from 0 to 277 cells mL–1 (Figure 11). Therefore, RBD-derived estimates of abundance >277 cells mL–1 (before conversion to abundance at 0-m depth) were determined by extrapolating the regression line between RBD and in-situ Karenia spp. abundance (Figure 11). This extrapolation is likely associated with some degree of error. Second, the sample size (n = 68) used to estimate the regression line itself was somewhat small (Figure 11), especially in comparison with the sample size of surface chlorophyll-a concentrations along the ship track (Figures 8, 10). Third, the period of observation differed between Karenia spp. abundances determined from water samples and those determined from satellite measurements. We permitted a maximum time difference of 6.9 days for the A Line and 1 day for the L lines (Figure 11); if we had used a smaller maximum time difference, the number of data points available would have been further reduced.
Likewise, there are at least two weaknesses associated with the MLH-based estimation, in which MLH was used indirectly to estimate Karenia spp. abundance. First, although small-scale variations of chlorophyll-a concentrations on the shelf were reasonably well reproduced by MLH-derived estimates, MLH-based chlorophyll-a concentrations on the Pacific shelf were positively biased in comparison with in-situ chlorophyll-a concentrations (Figures 9B,C). This bias could be attributable to centimeter-scale vertical heterogeneities of chlorophyll a near the sea surface, which are captured differently by satellite imagery and in-situ surveys (e.g., Harvey, 1966; Mitchell and Fuhrman, 1989). Second, as with RBD, very high MLH-derived chlorophyll-a concentrations (exceeding 123.20 mg m–3) were determined by extrapolation of a regression line (Table 1). The threshold of 123.20 mg m–3 corresponds to an abundance of 104.4 (∼25,000) cells mL–1 (Figure 7).
At present, it is difficult to determine which of the two methods more closely matched the actual Karenia spp. abundances. We therefore chose to apply both methods and evaluate the two resultant sets of Karenia spp. abundances while taking the uncertainties of each method into account. In future work, these weaknesses could be mitigated by increasing the sample size for the regressions used in each method. This could be accomplished by incorporating in-situ measurements of Karenia spp. abundance obtained by other organizations.
There were large uncertainties in RBD- and MLH-derived abundances near the southeast coast of Hokkaido, and these methods may have underestimated in-situ Karenia spp. abundances in this region. To examine this in more detail, we extended the analysis period of Sentinel-3 data and extracted RBD- and MLH-derived Karenia spp. abundances from the 300-m grid cell that was closest to the Katsurakoi fishery harbor. On 21 September, when the second-largest in-situ Karenia spp. abundance (103.9 cells mL–1) was recorded, RBD- and MLH-derived abundances were estimated to be 103 and 103.9 cells mL–1, respectively. Although the MLH-derived value was reasonable, the RBD-derived value underestimated the in-situ abundance by about one order of magnitude. Interestingly, in-situ Karenia spp. abundances from the fishery harbor differed greatly among the three monitoring sites established at that location, which were all within a few hundred meters of each other. On 23 September, when Sentinel-3 imagery and in-situ Karenia spp. abundances from all three sites were available, we obtained in-situ abundances of 103.4, 102.9, and 102.4 cells mL–1 from the three harbor sites and RBD- and MLH-derived abundances of 102.3 and 102.6 cells mL–1, respectively. Thus, satellite-derived estimates failed to reproduce the highest observed in-situ abundance on that day. This indicates that the spatial distribution of in-situ Karenia spp. abundances near the coast can change drastically, even within a few hundred meters. Hence, further work is needed to evaluate the accuracy of satellite-derived abundances near the coast by examining very-nearshore in-situ Karenia spp. abundances from additional coastal sites. Simultaneously, it will be important to use ocean-color images with a finer spatial resolution. Although Sentinel-2 ocean-color imagery (which has a horizontal resolution of 10, 20, or 60 m) might be feasible (e.g., Caballero et al., 2020), some methodological changes will be required because Sentinel 2 does not capture the 681-nm spectral band.
It is noteworthy that the satellite-derived Karenia spp. abundances estimated in this study are still imperfect; they will need to be refined to accurately monitor the presence or absence of Karenia spp. or to precisely detect signs of impending Karenia spp. blooms from weak reflectance signals. A preliminary evaluation of these use cases was conducted by using Sentinel-3 images from July 2017 to October 2021 (Supplementary Figure 3). Our tentative results indicate that MLH-derived Karenia spp. abundances overestimated the true abundances in some cases, despite the likely absence of Karenia blooms in 2017–2020, particularly during massive spring diatom blooms and autumn blooms off the southeast coast of Hokkaido (e.g., Okamoto et al., 2010; Suzuki et al., 2011; Isada et al., 2019; Kuroda et al., 2019). This overestimation was likely caused by the fact that the MLH-based estimate relates Karenia spp. abundances to chlorophyll-a concentrations. A similar pattern of overestimation in spring and autumn was also identified for RBD-derived Karenia spp. abundance, although the estimated abundances during 2017–2020 never exceeded the record-breaking abundances reached in October 2021. Hence, more sophisticated algorithms are still needed to precisely discriminate harmful Karenia blooms from non-harmful algal blooms by using satellite data, e.g., Siswanto et al. (2013), El-Habashi et al. (2016), El-Habashi et al. (2019), and Martinez-Vicente et al. (2020).
To identify Karenia blooms more precisely, it is necessary to estimate the reflectance spectral properties of Karenia spp. (in particular, K. selliformis, the properties of which have not yet been reported) and the other dominant species in our study area. It should be remembered that the RBD method that we employed was originally proposed by Amin et al. (2009) for Karenia brevis and non-K. brevis species (mainly diatoms) along the west coast of Florida (Supplementary Figure 1). In fact, our cell enumeration data (not shown) revealed that diatoms existed in mixture with Karenia spp. off the Hokkaido coast and that the abundance of diatoms relative to Karenia spp. tended to increase as Karenia spp. abundance declined. This tendency can be also seen in Figure 7; deviations of Karenia spp. abundance from the log–log regression line tended to decrease as in-situ chlorophyll-a concentrations increased (i.e., as Karenia spp. abundance increased). Moreover, note that the dominant diatom species and their spectral properties probably differ between the west coast of Florida and our study area. Hence, further work is needed to identify the dominant diatom species from long-term monitoring data along the A Line and to precisely measure the spectral properties of Karenia spp. and non-Karenia spp. associated with the dominant diatoms in our study area.
We successfully generated maps of Karenia spp. abundance and described the spatiotemporal variations in abundance from 3 to 18 October, 2021 (Figure 13). However, the possible physico-biochemical dynamics responsible for spatiotemporal changes in Karenia spp. abundance remain largely unexamined. Here, we focus on the 24-h period from 12 to 13 October, when Karenia spp. abundances averaged over the shelf abruptly increased over 2-fold (Figures 13C,D). Throughout this period, as is indicated in Figures 13C,D, our study area had few clouds along the shelf, suggesting that light conditions were favorable for algal growth.
In general, any enhancement of algal abundance can be caused by biological growth, physical advection, or a combination of the two (e.g., Richardson, 1997; Stumpf et al., 2008; Thyng et al., 2013). If the abrupt increase of Karenia app. abundance from 12 to 13 October were caused solely by algal growth, the growth rate would have been 0.74 and 0.96 day–1 for RBD- and MLH-derived abundances, respectively. These growth rates exceed the growth rates or maximum growth rates of Karenia species reported by previous studies, which range from 0.04 to 0.41 day–1 for K. selliformis (Medhioub et al., 2009; Mardones et al., 2020), and from 0.216 to 0.727 day–1 for K. mikimotoi (Shen et al., 2016; Zhao et al., 2017). This discrepancy indicates that physical advection might also have contributed to the abrupt abundance increase, as suggested by the interpretation of Stumpf et al. (2008).
Physical advection can occur on a variety of spatiotemporal scales. At the shelf scale (defined here by the pink polygon in Figure 13A), horizontal onshore-offshore advection probably had a negligible effect on the abrupt increase in Karenia spp. abundance during the 24-h period, because Karenia spp. abundances were higher on the shelf than on the offshore slope. At the shelf scale, therefore, we need to primarily consider sources of vertical advection such as wind-induced upwelling, which might uplift pre-existing Karenia spp. populations from the subsurface or concentrate Karenia spp. near the sea surface through a shoaling of the mixed layer/pycnocline (e.g., Pitcher et al., 1998). However, high-resolution mesoscale model data from the Japan Meteorological Agency’s weather forecast system (Saito et al., 2006) indicate that northeasterly winds with a velocity of 3.2–6.2 m s–1 predominated at 2 m above the sea surface over the shelf throughout 12 October. This wind regime would have favored coastal downwelling, rather than upwelling. Therefore, Karenia spp. abundance increased at the sea surface in spite of gentle downwelling-favorable winds, particularly on the western shelf.
Regarding physical advection at finer scales, the streak- and patch-like submesoscale structures we observed are likely to be among the key elements for understanding any physical-biological coupling that occurred. Streak-like filaments are also frequently identified in maps of satellite-derived chlorophyll-a concentration (e.g., Malanotte-Rizzoli et al., 2014; Shulman et al., 2015; Lehahn et al., 2017). Filamentary structures are generally interpreted as Lagrangian coherent structures, which are attributed mainly to horizontal advection (Lehahn et al., 2007; Hernández-Carrasco et al., 2018, 2020). However, this interpretation is likely to be complicated in our case, because Karenia spp. growth could have been superimposed on purely Lagrangian transport processes, and strong vertical advection induced by submesoscale variations could have contributed to the abrupt shelf-scale increase of Karenia spp. abundance (e.g., Meng et al., 2020). Further research will be needed to examine how small-scale submesoscale variations combined with algal growth contributed to the abrupt shelf-scale increase of Karenia spp. abundance, including the observed western intensification of Karenia blooms. Unfortunately, although clarification of these physical–biochemical processes is urgently needed, this is beyond the scope of our study.
Unprecedented outbreaks of harmful Karenia algae were reported in mid-September 2021 in the northwest Pacific Ocean off of southeastern Hokkaido, Japan, and inflicted catastrophic damage on coastal fisheries in the ensuing months. To understand the distribution of Karenia spp. blooms, we conducted extensive ship surveys and analyzed in-situ data in combination with Sentinel-3-derived ocean-color imagery. High chlorophyll-a concentrations (exceeding 10 mg m–3) were detected mainly in coastal shelf–slope waters <1,000 m deep that were occupied by Surface Coastal Oyashio Water and Modified Soya Warm Current Water, and Karenia blooms occurred around the confluence of subtropical and subarctic waters. Abundances of Karenia spp. were correlated with chlorophyll-a concentrations, which typically had a vertical maximum at the surface within the homogeneous surface mixed layer (typical mixed-layer depths were around 20–25 m). Moreover, large- and small-scale distributions of Karenia spp. abundances at the ocean surface were estimated by using two methods based on Sentinel-3-derived MLH and RBD. The two methods provided consistent spatial maps of Karenia spp. abundances, except in very nearshore waters. In addition, MLH-derived abundances were about twice as high as RBD-derived abundances, primarily because of uncertainties attributable to limited sample ranges and sample sizes of in-situ Karenia spp. abundances, which can be improved by the addition of more in-situ Karenia abundance data to our regression models.
Our estimates of Karenia spp. abundance revealed the spatiotemporal distributions and dynamic features of Karenia blooms on the Pacific shelf off southeastern Hokkaido. The cores of Karenia blooms (typically > 103 cells mL–1) were generally confined to the shelf. High-abundance areas were characterized by streak-like structures (>103 cells mL–1) associated with submesoscale filaments that tended to be oriented parallel to the coastline, as well as by patch-like structures (>104 cells mL–1). In very nearshore waters, Karenia spp. blooms were local, intermittent, and connected to blooms in shelf waters by streak-like structures. We also observed a greater-than 2-fold increase in Karenia spp. abundance within roughly 24 h from 12 to 13 October; this was associated with the combined effects of physical advection and algal growth. Our findings illustrate the impossibility of using ship surveys to capture the overall spatial structure of Karenia blooms, which change on an hour-to-hour basis, off southeastern Hokkaido. Hence, the maps of RBD- and MLH-derived Karenia spp. abundances generated in our study can provide the basic information needed to understand the processes and mechanisms by which harmful algal blooms during late summer–autumn 2021 caused damage to regional fisheries.
The gridded level-4 chlorophyll concentration data from ocean color sensors used for Figure 2 were downloaded from the Copernicus Marine Environment Monitoring Service (CMEMS) (ftp://my.cmems-du.eu and https://nrt.cmems-du.eu, accessed on 2 December 2021). The near-real-time absolute dynamic topography used for Figure 1B was also downloaded from CMEMS (ftp://nrt.cmems-du.eu, accessed on 1 November 2021). Sea-surface temperatures based on Himawari 8 data for Figure 1A were obtained from the Japan Aerospace Exploration Agency P-tree system (ftp://ftp.ptree.jaxa.jp, accessed on 1 November 2021). Sentinel-3A/3B Ocean and Land Color Imager Level-2 data were obtained from Copernicus Online Data Access (https://coda.eumetsat.int, accessed on 1 November 2021). For hydrographic data obtained during in situ surveys, please contact the corresponding author.
HK summarized the ideas and wrote the manuscript through discussions with co-authors. YT conducted ship surveys and sampling and analyzed measurements. TW and NH conducted sampling around the Katsurakoi fishery harbor and analyzed water samples. TA checked and modified the manuscript with respect to physical oceanography. NH also led the project. All authors contributed to the article and approved the submitted version.
This study was supported by funds provided by the Japan Fisheries and Education Agency.
The A Line monitoring program was supported by the Fisheries Agency, Japan, but the content of this study does not necessarily reflect the views of the Fisheries Agency.
The authors declare that the research was conducted in the absence of any commercial or financial relationships that could be construed as a potential conflict of interest.
All claims expressed in this article are solely those of the authors and do not necessarily represent those of their affiliated organizations, or those of the publisher, the editors and the reviewers. Any product that may be evaluated in this article, or claim that may be made by its manufacturer, is not guaranteed or endorsed by the publisher.
We express our deepest gratitude to the captains, officers, and crew of R/V Hokko-maru, as well as to our collaborators during the monitoring of the A and L lines.
The Supplementary Material for this article can be found online at: https://www.frontiersin.org/articles/10.3389/fmars.2022.841364/full#supplementary-material
Amin, R., Zhou, J., Gilerson, A., Moshary, F., and Ahmed, S. (2009). Novel optical techniques for detecting and classifying toxic dinoflagellate Karenia brevis blooms using satellite imagery. Opt. Express 17, 9126–9144. doi: 10.1364/oe.17.009126
Anderson, D. M., Burkholder, J. M., Cochlan, W. P., Glibert, P. M., Gobler, C. J., Heil, C. A., et al. (2008). Harmful algal blooms and eutrophication: examining linkages from selected coastal regions of the United States. Harmful Algae 8, 39–53. doi: 10.1016/j.hal.2008.08.017
Basti, L., Nagai, S., Go, J., Okano, S., Nagai, K., Watanabe, R., et al. (2015). Differential inimical effects of Alexandrium spp. and Karenia spp. on cleavage, hatching, and two larval stages of Japanese pearl oyster Pinctada fucata martensii. Harmful Algae 43, 1–12. doi: 10.1016/j.hal.2014.12.004
Bondur, V., Zamshin, V., Chvertkova, O., Matrosova, E., and Khodaeva, V. (2021). Detection and analysis of the causes of intensive harmful algal bloom in Kamchatka based on satellite data. J. Mar. Sci. Eng. 9:1092. doi: 10.3390/jmse9101092
Caballero, I., Fernández, R., Eccalante, O. M., Mamán, L., and Navarro, G. (2020). New capabilities of Sentinel-2A/B satellites combined with in situ data for monitoring small harmful algal blooms in complex coastal waters. Sci. Rep. 10:8743. doi: 10.1038/s41598-020-65600-1
Cherif, E. K., Mozetič, P., Francé, J., Flander-Putrle, V., Franeli-Pucer, J., and Vodopivec, M. (2021). Comparison of in-situ chlorophyll-a time series and Sentinel-3 Ocean and Land Color Instrument data in Slovenia national waters (Gulf of Trieste, Adriatic Sea). Water 13:1903. doi: 10.3390/w13141903
Crawford, D. W., Montero, P., and Daneri, G. (2021). Blooms of Alexandrium catenella in coastal waters of Chilean Patagonia: is subantarctic surface water involved? Front. Mar. Sci. 8:612628. doi: 10.3389/fmars.2021.612628
Dodson, A. N., and Thomas, W. H. (1964). Concentrating plankton in a gentle fashion. Limnol. Oceanogr. 9, 455–456. doi: 10.4319/lo.1964.9.3.0455
Doerffer, R., and Schiller, H. (2007). The MERIS Case 2 water algorithm. Int. J. Remote Sens. 28, 517–535. doi: 10.1080/01431160600821127
Du, X., Peterson, W., Fisher, J., Hunter, M., and Peterson, J. (2016). Initiation and development of a toxic and persistent pseudo-nitzschia bloom off the Oregon coast in spring/summer 2015. PLoS One 11:e0163977. doi: 10.1371/journal.pone.0163977
El-Habashi, A., Ahmed, S., Ondrusek, M. E., and Lovko, V. (2019). Analyses of satellite ocean color retrievals show advantage of neural network approaches and algorithms that avoid deep blue bands. J. Appl. Remote Sen. 13:024509. doi: 10.1117/1.JRS.13.024509
El-Habashi, A., Ioannou, I., Tomlinson, M. C., Stumpf, R. P., and Ahmed, S. (2016). Satellite retrievals of Karenia brevis harmful algal blooms in the West Florida Shelf using neural networks and comparisons with other techniques. Remote Sens. 8:377. doi: 10.3390/rs8050377
Feki, W., Hamza, A., Frossard, V., Abdennadher, M., Hannachi, I., Jacquot, M., et al. (2014). What are the potential drivers of blooms of the toxic dinoflagellate Karenia selliformis? A 10-year study in the Gulf of Gabes, Tunisia, southwestern Mediterranean Sea. Harmful Algae 23, 8–18. doi: 10.1016/j.hal.2012.12.001
Frölicher, T. L., and Laufkötter, C. (2018). Emerging risks from marine heat waves. Nat. Commun. 9:650. doi: 10.1038/s41467-018-03163-6
Gower, J. (2016). On the use of satellite-measured chlorophyll fluorescence for monitoring coastal waters. Int. J. Remote Sens. 37, 2077–2086. doi: 10.1080/01431161.2015.1111542
Gower, J. F. R., Doerffer, R., and Borstad, G. A. (1999). Interpretation of the 685 nm peak in water-leaving radiance spectra in terms of fluorescence, absorption and scattering, and its observation by MERIS. Int. J. Remote Sens. 20, 1771–1786. doi: 10.1080/014311699212470
Gower, J., King, S., Borstad, G., and Brown, L. (2005). Detection of intense plankton blooms using the 709nm band of the MERIS imaging spectrometer. Int. J. Remote Sens. 26, 2005–2012. doi: 10.1080/01431160500075857
Harvey, G. W. (1966). Microlayer collection from the sea surface: a new method and initial results. Limnol. Oceanogr. 11, 608–613. doi: 10.4319/lo.1966.11.4.0608
Hernández-Carrasco, I., Alou-Font, E., Dumont, P.-A., Cabornero, A., Allen, J., and Orfila, A. (2020). Lagrangian flow effects on phytoplankton abundance and composition along filament-like structures. Prog. Oceanogr. 189:102469. doi: 10.1016/j.pocean.2020.102469
Hernández-Carrasco, I., Orfila, A., Rossi, V., and Garçon, V. (2018). Effect of small scale transport processes on phytoplankton distribution in coastal seas. Sci. Rep. 8:8613. doi: 10.1038/s41598-018-26857-9
IPCC [Intergovernmental Panel on Climate Change] (2019). IPCC Special Report on the Ocean and Cryosphere in a Changing Climate. Geneva: IPCC.
Isada, T., Abe, H., Kasai, H., and Nakaoka, M. (2021). Dynamics of nutrients and colored dissolved organic matter absorption in a wetland-influenced subarctic coastal region of northeastern Japan: contributions from mariculture and eelgrass meadows. Front. Mar. Sci. 8:711832. doi: 10.3389/fmars.2021.711832
Isada, T., Hattori-Saito, A., Saito, H., Kondo, Y., Nishioka, J., Kuma, K., et al. (2019). Responses of phytoplankton assemblages to iron availability and mixing water masses during the spring bloom in the Oyashio region, NW Pacific. Limnol. Oceanogr. 64, 197–216. doi: 10.1002/lno.11031
Iwataki, M., Lum, W. M., Kuwata, K., Takahashi, K., Arima, D., Kuribayashi, T., et al. (2022). Morphological variation and phylogeny of Karenia selliformis (Gymnodiniales, Dinophyceae) in an intensive cold-water algal bloom in eastern Hokkaido, Japan in September–November 2021. bioRxiv [Preprint] doi: 10.1101/2021.12.13.472515
Jordan, C., Cusack, C., Tomlinson, M. C., Meredith, A., McGeady, R., Salas, R., et al. (2021). Using the red band difference algorithm to detect and monitor a Karenia spp. bloom off the south coast of Ireland, June 2019. Front. Mar. Sci. 8:638889. doi: 10.3389/fmars.2021.638889
Kasai, H., Saito, H., and Tsuda, A. (1998). Estimation of standing stock of chlorophyll a and primary production from remote-sensed ocean color in the Oyashio region, the western subarctic Pacific, during the spring bloom in 1997. J. Oceanogr. 54, 527–537. doi: 10.1007/BF02742454
Katano, T., Yoshida, M., Lee, J., Han, M.-S., and Hayami, Y. (2009). Fixation of Chattonella antiqua and C. marina (Raphidophyceae) using Hepes-buffered paraformaldehyde and glutaraldehyde for flow cytometry and light microscopy. Phycologia 48, 473–479. doi: 10.2216/08-102.1
Kim, C.-J., Kim, H.-G., Kim, C.-H., and Oh, H.-M. (2007). Life cycle of the ichthyotoxic dinoflagellate Cochlodinium polykrikoides in Korean coastal waters. Harmful Algae 6, 104–111. doi: 10.1016/j.hal.2006.07.004
Kuroda, H., and Setou, T. (2021). Extensive marine heatwaves at the sea surface in the northwestern Pacific Ocean in summer 2021. Remote Sens. 13:3989. doi: 10.3390/rs13193989
Kuroda, H., and Toya, Y. (2020). High-resolution sea surface temperatures derived from Landsat 8: a study of submesoscale frontal structures on the Pacific shelf off the Hokkaido coast, Japan. Remote Sens. 12:3326. doi: 10.3390/rs12203326
Kuroda, H., Azumaya, T., Setou, T., and Hasegawa, N. (2021a). Unprecedented outbreak of harmful algae in Pacific coastal waters off southeast Hokkaido, Japan, during late summer 2021 after record-breaking marine heatwaves. J. Mar. Sci. Eng. 9:1335. doi: 10.3390/jmse9121335
Kuroda, H., Taniuchi, Y., Kasai, H., Nakanowatari, T., and Setou, T. (2021b). Co-occurrence of marine extremes induced by tropical storms and an ocean eddy in summer 2016: anomalous hydrographic conditions in the Pacific shelf waters off southeast Hokkaido, Japan. Atmosphere 12:888. doi: 10.3390/atmos12070888
Kuroda, H., Toya, Y., Watanabe, T., Nishioka, J., Hasegawa, D., Taniuchi, Y., et al. (2019). Influence of Coastal Oyashio water on massive spring diatom blooms in the Oyashio area of the North Pacific Ocean. Prog. Oceanogr. 175, 328–344. doi: 10.1016/j.pocean.2019.05.004
Kuroda, H., Wagawa, T., Kakehi, S., Shimizu, Y., Kusaka, A., Okunishi, T., et al. (2017). Long-term mean and seasonal variation of altimetry-derived Oyashio transport across the A-line off the southeastern coast of Hokkaido, Japan. Deep Sea Res. I 121, 95–109. doi: 10.1016/j.dsr.2016.12.006
Kusaka, A., Azumaya, T., and Kawasaki, Y. (2013). Monthly variations of hydrographic structures and water mass distribution off the Doto area, Japan. J. Oceanogr. 69, 295–312. doi: 10.1007/s10872-013-0174-8
Kusaka, A., Shimizu, Y., Sato, T., and Yoshida, J. (2016). Temporal variations in the current structure and volume transport of the Coastal Oyashio revealed by direct current measurement. J. Oceanogr. 72, 601–615.
Lefebvre, K. A., Quakenbush, L., Frame, E., Huntington, K. B., Sheffield, G., Stimmelmayr, R., et al. (2016). Prevalence of algal toxins in Alaskan marine mammals foraging in a changing arctic and subarctic environment. Harmful Algae 55, 13–24. doi: 10.1016/j.hal.2016.01.007
Lehahn, Y., d’Ovidio, F., and Koren, I. (2017). A satellite-based Lagrangian view on phytoplankton dynamics. Ann. Rev. Mar. Sci. 10, 99–119. doi: 10.1146/annurev-marine-121916-063204
Lehahn, Y., d’Ovidio, F., Lévy, M., and Heifetz, E. (2007). Stirring of the northeast Atlantic spring bloom: a Lagrangian analysis based on multisatellite data. J. Geophys. Res. 112:C08005. doi: 10.1029/2006JC003927
León-Muñoz, J., Urbina, M. A., Garreaud, R., and Iriarte, J. L. (2018). Hydroclimatic conditions trigger record harmful algal bloom in western Patagonia (summer 2016). Sci. Rep. 8:1330. doi: 10.1038/s41598-018-19461-4
Malanotte-Rizzoli, P., Artale, V., Borzelli-Eusebi, G. L., Brenner, S., Crise, A., Gacic, M., et al. (2014). Physical forcing and physical/biochemical variability of the Mediterranean Sea: a review of unresolved issues and directions for future research. Ocean Sci. 10, 281–322. doi: 10.5194/os-10-281-2014
Mardones, J. I., Norambuena, L., Paredes, J., Fuenzalida, G., Dorantes-Aranda, J. J., Lee Chang, K. J., et al. (2020). Unraveling the Karenia selliformis complex with the description of a non-gymnodimine producing Patagonian phylotype. Harmful Algae 98:101892. doi: 10.1016/j.hal.2020.101892
Martinez-Vicente, V., Kurekin, A., Sá, C., Brotas, V., Amorim, A., Veloso, V., et al. (2020). Sensitivity of a satellite algorithm for harmful algal bloom discrimination to the use of laboratory bio-optical data for training. Front. Mar. Sci. 7:582960. doi: 10.3389/fmars.2020.582960
McCabe, R. M., Hickey, B. M., Kudela, R. M., Lefebvre, K. A., Adams, N. G., Bill, B. D., et al. (2016). An unprecedented coastwide toxic algal bloom linked to anomalous ocean conditions. Geophys. Res. Lett. 43, 10366–10376. doi: 10.1002/2016GL070023
McWilliams, J. C. (2016). Submesoscale currents in the ocean. Proc. Math. Phys. Eng. Sci. 472:20160117. doi: 10.1098/rspa.2016.0117
Medhioub, A., Medhioub, W., Amzil, Z., Sibat, M., Bardouil, M., Benneila, I., et al. (2009). Influence of environmental parameters on Karenia selliformis toxin content in culture. Cah. Biol. Mar. 50, 333–342.
Meng, Q., Xuan, J., Zhang, W., Zhou, F., Hao, Q., Zhao, Q., et al. (2020). Impact of submesoscale vertical advection on primary productivity in the southern East China Sea. J. Geophys. Res. Biogeosci. 125:e2019JG005540. doi: 10.1029/2019JG005540
Mitchell, J. G., and Fuhrman, J. A. (1989). Centimeter scale vertical heterogeneity in bacteria and chlorophyll a. Mar. Ecolo. Prog. Ser. 54, 141–148. doi: 10.3354/meps054141
Morel, A., Gentili, B., Claustre, H., Babin, M., Bricaud, A., Ras, J., et al. (2007). Optical properties of the “clearest” natural waters. Limnol. Oceanogr. 52, 217–229. doi: 10.1364/AO.20.000177
Moutzouris-Sidiris, I., and Topouzelis, K. (2021). Assessment of chlorophyll-a concentration from Sentinel-3 satellite images at the Mediterranean Sea using CMEMS open source in situ data. Open Geosci. 13, 85–97. doi: 10.1515/geo-2020-0204
Oguma, S., Ono, T., Kusaka, A., Kasai, H., Kawasaki, Y., and Azumaya, T. (2008). Isotopic tracers for water masses in the coastal region of eastern Hokkaido. J. Oceanogr. 64, 525–539. doi: 10.1007/s10872-008-0044-y
Okamoto, S., Hirawake, T., and Saitoh, S. (2010). Interannual variability in the magnitude and timing of the spring bloom in the Oyashio region. Deep Sea Res. II 57, 1608–1617. doi: 10.1016/j.dsr2.2010.03.005
Onitsuka, G., Miyahara, K., Hirose, N., Watanabe, S., Semura, H., Hori, R., et al. (2010). Large-scale transport of Cochlodinium polykrikoides blooms by the Tsushima Warm Current in the southwest Sea of Japan. Harmful Algae 9, 390–397. doi: 10.1016/j.hal.2010.01.006
Pitcher, G. C., Boyd, A. J., Horstman, D. A., and Mitchell-Innes, B. A. (1998). Subsurface dinoflagellate populations, frontal blooms and the formation of red tide in the southern Benguela upwelling system. Mar. Ecol. Prog. Ser. 172, 253–264. doi: 10.3354/meps172253
Richardson, K. (1997). “Harmful or exceptional phytoplankton blooms in the marine ecosystem,” in Advances in Marine Biology, eds J. H. S. Blaxter and A. J. Southward (Cambridge, MA: Academic Press), 301–385. doi: 10.1016/S0065-2881(08)60225-4
Roberts, S. D., Van Ruth, P. D., Wilkinson, C., Bastianello, S. S., and Bansemer, M. S. (2019). Marine heatwave, harmful algae blooms and an extensive fish kill event during 2013 in South Australia. Front. Mar. Sci. 6:610. doi: 10.3389/fmars.2019.00610
Ryan, J. P., Kudela, R. M., Birch, J. M., Blum, M., Bowers, H. A., Chavez, F. P., et al. (2017). Causality of an extreme harmful algal bloom in Monterey Bay, California, during the 2014–2016 northeast Pacific warm anomaly. Geophys. Res. Lett. 44, 5571–5579. doi: 10.1002/2017GL072637
Saito, K., Fujita, T., Yamada, Y., Ishida, J., Kumagai, Y., Aranami, K., et al. (2006). The operational JMA nonhydrostatic mesoscale model. Mon. Wea. Rev. 134, 1266–1298. doi: 10.1175/MWR3120.1
Sakamoto, K., Tsujino, H., Nishikawa, S., Nakano, H., and Motoi, T. (2010). Dynamics of the Coastal Oyashio and its seasonal variation in a high-resolution western North Pacific Ocean model. J. Phys. Oceanogr. 40, 1283–1301. doi: 10.1175/2010JPO4307.1
Shen, A., Ma, Z., Jiang, K., and Li, D. (2016). Effects of temperature on growth, photophysiology, rubisco gene expression in Prorocentrum donghaiense and Karenia mikimotoi. Ocean Sci. J. 51, 581–589. doi: 10.1007/s12601-016-0056-2
Shi, F., McNabb, P., Rhodes, L., Holland, P., Webb, S., Adamson, J., et al. (2012). Toxic effects of three dinoflagellate species from the genus Karenia on invertebrate larvae and finfish. N. Z. J. Mar. Freshw. Res. 46, 149–165. doi: 10.1080/00288330.2011.616210
Shulman, I., Penta, B., Richman, J., Jacobs, G., Anderson, S., and Sakalaukus, P. (2015). “Are the satellite-observed narrow, streaky chlorophyll filaments locally intensified by the submesoscale processes?,” in Proceedings of the SPIE 9459 (Ocean Sensing and Monitoring VII) 94590K (Baltimore, MD), doi: 10.1117/12.2177569
Siswanto, E., Ishizaka, J., Tripathy, S. C., and Miyamura, K. (2013). Detection of harmful algal blooms of Karenia mikimotoi using MODIS measurements: a case study of Seto-Inland Sea, Japan. Remote Sen. Environ. 129, 185–196. doi: 10.1016/j.rse.2012.11.003
Smith, M. E., and Bernard, S. (2020). Satellite ocean color based harmful algal bloom indicators for aquaculture decision support in the southern Benguela. Front. Mar. Sci. 7:61. doi: 10.3389/fmars.2020.00061
Stumpf, R. P., Litaker, R. W., Lanerolle, L., and Tester, P. A. (2008). Hydrodynamic accumulation of Karenia off the west coast of Florida. Cont. Shelf Res. 28, 189–213. doi: 10.1016/j.csr.2007.04.017
Suzuki, K., Kuwata, A., Yoshie, N., Shibata, A., Kawanobe, K., and Saito, H. (2011). Population dynamics of phytoplankton, heterotrophic bacteria, and viruses during the spring bloom in the western subarctic Pacific. Deep Sea Res. I 58, 575–589. doi: 10.1016/j.dsr.2011.03003
Suzuki, R., and Ishimaru, T. (1990). An improved method for the determination of phytoplankton chlorophyll using N, N-dimethylformamide. J. Oceanogr. Soc. Japan 46, 190–194. doi: 10.1007/BF02125580
Thyng, K. M., Hetland, R. D., Ogle, M. T., Zhang, X., Chen, F., and Campbell, L. (2013). Origins of Karenia brevis harmful algal blooms along the Texas coast. Limnol. Oceanogr. Fluid Environ. 3, 269–278. doi: 10.1215/21573689-2417719
Trainer, V. L., Moore, S. K., Hallegraeff, G., Kudela, R. M., Clement, A., Mardones, J. I., et al. (2019). Pelagic harmful algal blooms and climate change: lessons from nature’s experiments with extremes. Harmful Algae 91:101591. doi: 10.1016/j.hal.2019.03.009
Vargo, G. A., Heil, C. A., Fanning, K. A., Dixon, L. K., Neely, M. B., Lester, K., et al. (2008). Nutrient availability in support of Karenia brevis blooms on the central West Florida Shelf: what keeps Karenia blooming? Cont. Shelf Res. 28, 73–98. doi: 10.1016/j.csr.2007.04.008
Wells, M. L., Karlson, B., Wulff, A., Kudela, R., Trick, C., Asnaghi, V., et al. (2020). Future HAB science: directions and challenges in a changing climate. Harmful Algae 91:101632. doi: 10.1016/j.hal.2019.101632
Wells, M. L., Trainer, V. L., Smayda, T. J., Karlson, B. S. O., Trick, C. G., Kudela, R. M., et al. (2015). Harmful algal blooms and climate change: learning from the past and present to forecast the future. Harmful Algae 49, 68–93. doi: 10.1016/j.hal.2015.07.009
White, A. E., Watkins-Brandt, K. S., McKibben, S. M., Wood, A. M., Hunter, M., Forster, Z., et al. (2014). Large-scale bloom of Akashiwo sanguinea in the Northern California current system in 2009. Harmful Algae 37, 38–46. doi: 10.1016/j.hal.2014.05.004
Wolny, J. L., Tomlinson, M. C., Schollaert Uz, S., Egerton, T. A., McKay, J. R., Meredith, A., et al. (2020). Current and future remote sensing of harmful algal blooms in the Chesapeake Bay to support the shellfish industry. Front. Mar. Sci. 7:337. doi: 10.3389/fmars.2020.00337
Keywords: harmful algal bloom, Karenia, northwestern Pacific Ocean, in-situ measurement, Sentinel 3
Citation: Kuroda H, Taniuchi Y, Watanabe T, Azumaya T and Hasegawa N (2022) Distribution of Harmful Algae (Karenia spp.) in October 2021 Off Southeast Hokkaido, Japan. Front. Mar. Sci. 9:841364. doi: 10.3389/fmars.2022.841364
Received: 22 December 2021; Accepted: 01 February 2022;
Published: 24 March 2022.
Edited by:
Hiroaki Saito, The University of Tokyo, JapanReviewed by:
Eko Siswanto, Japan Agency for Marine-Earth Science and Technology (JAMSTEC), JapanCopyright © 2022 Kuroda, Taniuchi, Watanabe, Azumaya and Hasegawa. This is an open-access article distributed under the terms of the Creative Commons Attribution License (CC BY). The use, distribution or reproduction in other forums is permitted, provided the original author(s) and the copyright owner(s) are credited and that the original publication in this journal is cited, in accordance with accepted academic practice. No use, distribution or reproduction is permitted which does not comply with these terms.
*Correspondence: Hiroshi Kuroda, a3Vyb2NhbkBhZmZyYy5nby5qcA==
Disclaimer: All claims expressed in this article are solely those of the authors and do not necessarily represent those of their affiliated organizations, or those of the publisher, the editors and the reviewers. Any product that may be evaluated in this article or claim that may be made by its manufacturer is not guaranteed or endorsed by the publisher.
Research integrity at Frontiers

Learn more about the work of our research integrity team to safeguard the quality of each article we publish.