
94% of researchers rate our articles as excellent or good
Learn more about the work of our research integrity team to safeguard the quality of each article we publish.
Find out more
ORIGINAL RESEARCH article
Front. Mar. Sci. , 10 March 2022
Sec. Deep-Sea Environments and Ecology
Volume 9 - 2022 | https://doi.org/10.3389/fmars.2022.838201
This article is part of the Research Topic 16th Deep-Sea Biology Symposium View all 27 articles
 Severin A. Korfhage1*
 Sven Rossel2
 Saskia Brix3
 Catherine S. McFadden4
 Steinunn Hilma Ólafsdóttir5
 Pedro Martínez Arbizu1,2
Cold-water corals build up reef structures or coral gardens and play an important role for many organisms in the deep sea. Climate change, deep-sea mining, and bottom trawling are severely compromising these ecosystems, making it all the more important to document the diversity, distribution, and impacts on corals. This goes hand in hand with species identification, which is morphologically and genetically challenging for Hexa- and Octocorallia. Morphological variation and slowly evolving molecular markers both contribute to the difficulty of species identification. In this study, a fast and cheap species delimitation tool for Octocorallia and Scleractinia, an order of the Hexacorallia, of the Northeast Atlantic was tested based on 49 specimens. Two nuclear markers (ITS2 and 28S rDNA) and two mitochondrial markers (COI and mtMutS) were sequenced. The sequences formed the basis of a reference library for comparison to the results of species delimitation based on proteomic fingerprinting using MALDI-TOF MS. The genetic methods were able to distinguish 17 of 18 presumed species. Due to a lack of replicates, using proteome fingerprinting only 7 species were distinguishable. Species that could not be distinguished from one another still achieved good signals of spectra but were not represented by enough specimens for comparison. Therefore, it is predicted that with an extensive reference library of proteome spectra for Scleractinia and Octocorallia, MALDI-TOF MS may provide a rapid and cost-effective alternative for species discrimination in corals.
Octocorallia and Scleractinia of the subclass Hexacorallia are two of the major groups of cnidarians with continuous or discontinuous calcium carbonate or horn-like skeletons that are commonly known as corals. In addition to Octocorallia and Scleractinia, the hexacorallian orders Antipatharia and Zoantharia, and the Hydrozoa families Stylasteridae, Milleporidae, and Hydractiniidae also include skeletonized, colonial corals (Cairns, 2007). Members of Scleractinia precipitate a solid calcareous skeleton with external soft tissue. Cup-like calyces are secreted by the epidermal cells at the base of the polyps and are subdivided by calcareous septa into which the polyp can retract for protection (Daly et al., 2007). The order Scleractinia encompasses approximately 1,300 extant species (Cairns, 1999). Scleractinian classification has traditionally been based on morphological characters of the skeleton, including those that can be assessed in fossil genera (Wells, 1956; Daly et al., 2007). Molecular phylogenetic analyses have, however, revealed many of these characters to be homoplasies e.g., the presence of fenestrate septa and synapticulae in complex and robust corals (Fukami et al., 2008). Subsequent integrative taxonomic studies combining morphological and molecular data have identified new microskeletal characters that are congruent with molecular evidence, leading to widespread reinterpretation of species boundaries and recognition of cryptic taxa in many scleractinian genera e.g., (Keshavmurthy et al., 2013; Arrigoni et al., 2016a,b, 2020). The taxonomy of Octocorallia, a group encompassing approximately 3,500 extant species of soft corals, sea pens, and gorgonians, is even less well understood (McFadden et al., 2010). Octocorallia are defined by their eight pinnate tentacles and eight internal mesenteries. In contrast to Scleractinia, the polyps and soft tissues are relatively invariant in Octocorallia, and taxonomic classification has historically been based on the shape of colonies and the morphology of sclerites (microscopic calcareous skeletal elements) (Fabricius and Alderslade, 2001). As in Scleractinia, molecular studies have revealed widespread homoplasy of these characters, as well as many cryptic taxa (McFadden et al., 2006, 2010). Morphological characters congruent with the molecular data have been more difficult to identify in octocorals, however, with the result that some species can be distinguished by molecular characters alone (e.g., Pante et al., 2015; McFadden et al., 2017).
Despite the importance of molecular data for species identification in both Scleractinia and Octocorallia, species discrimination using traditional DNA barcoding genes such as COI (Hebert et al., 2003) has lagged behind other metazoan groups because of the relatively slow rate of evolution of mitochondrial genes in Anthozoa (Huang et al., 2008; Shearer and Coffroth, 2008; Bucklin et al., 2011). No “universal” barcoding gene has been identified for Scleractinia, and mitochondrial markers routinely fail to discriminate species reliably (Shearer and Coffroth, 2008). In Octocorallia, the mitochondrial protein-coding gene mtMutS, which occurs uniquely in the octocorallian mitochondrial genome, has been widely used for species discrimination, often in conjunction with COI or the nuclear 28S rDNA gene (McFadden et al., 2011, 2014). However, these markers, used separately or in combination, do not discriminate all octocoral species reliably (Baco and Cairns, 2012; McFadden et al., 2014; Pante et al., 2015; Quattrini et al., 2019). Reduced representation sequencing methods such as RADseq and target-enrichment of exons and ultraconserved elements show promise for species delimitation in both scleractinians and octocorals (Quattrini et al., 2019; Arrigoni et al., 2020; Quek and Huang, 2021), but remain expensive relative to Sanger sequencing of single-locus methods and especially of more suitable multilocus approaches.
Here, a new method of coral species discrimination is presented using a proteomic approach, the matrix-assisted laser desorption/ionization time-of-flight mass spectrometry (MALDI-TOF MS). This method analyzes the variability in composition of peptides and small proteins. In microorganisms it was shown to measure a variety of ribosomal proteins next to other, mainly intracellular peptides and smaller housekeeping proteins (Singhal et al., 2015). However, for application in metazoan species discrimination, so far, only few studies tried to assign analyzed masses to actual, known protein. For example, in a study on Drosophila species, due to size comparison with a database, a protein involved in the male reproductive system was identified as a candidate for one of the analyzed molecule masses (Feltens et al., 2010). However, most studies neglect looking into actual peptide- and protein identities and focus on the mere, discriminative power of the proteome fingerprint. Thus, only little is known about the direct effect of sequence variability on resulting mass spectra. Due to their size, molecules are prone to destruction by laser radiation. That is why during the preparation for MALDI-TOF MS measurements, the samples are mixed with an energy-absorbing organic compound called matrix. The solution dries on a target plate while the matrix and the enclosed sample co-crystallize. A laser beam evaporates the matrix absorbing large parts of the radiation, and individual analytes are protonated. The protonated ions are separated according to their mass-to-charge ratio (m/z) by accelerating these toward a detector through a time-of-flight tube. The m/z of an ion is measured by determining the time it takes the ion to travel the length of a flight tube. This results in a characteristic spectrum for the analytes in the sample (Singhal et al., 2015). MALDI-TOF MS is a widely used method in species discrimination for fungi (Patel, 2019), viruses (Calderaro et al., 2014), and bacteria (Yang et al., 2018). Successful species discrimination has also been shown for insects (Ulrich et al., 2017), fish (Mazzeo et al., 2008), crustaceans (Rossel and Martínez Arbizu, 2019; Paulus et al., 2021; Kürzel et al., 2022), and some cnidarians, such as Staurozoa (Holst et al., 2019).
In this study, we examine the coral assemblages around Iceland and compare the discrimination power of genetic and proteomic methods for species identification.
The specimens were collected by the ROV Kiel 6000 between 19th June and 27th July 2020 in Icelandic waters during the IceAGE 3 cruise SO276/MerMet17-6 (with RV SONNE) and by the ROV PHOCA during the IceAGE RR cruise MSM75 between 29th June and 8th August 2018 (RV MS MERIAN). Stations were located around Iceland, in the Norwegian Basin, the Norwegian Sea, and the Reykjanes Ridge in 207.1 to 2,040.8 m depth (Figure 1 and Supplementary Material 1). The collected corals were photographed with an HD camera system of the ROV Kiel 6000 in the habitat and with a DSLR camera system (Canon EOS 5D Mark IV with Canon MP-E 65 mm f/2.8 1–5× Macro Photo lens and Canon Compact-Macro Lens EF 50 mm 1:25) on board. Samples were preserved in 96% undenatured ethanol which was changed after 24 h on board. Larger samples were preserved in 3% formal solution where subsamples were taken and preserved in 96% undenatured ethanol. Samples were stored at −20°C at the German Centre for Marine Biodiversity Research (DZMB) in Hamburg, Germany.
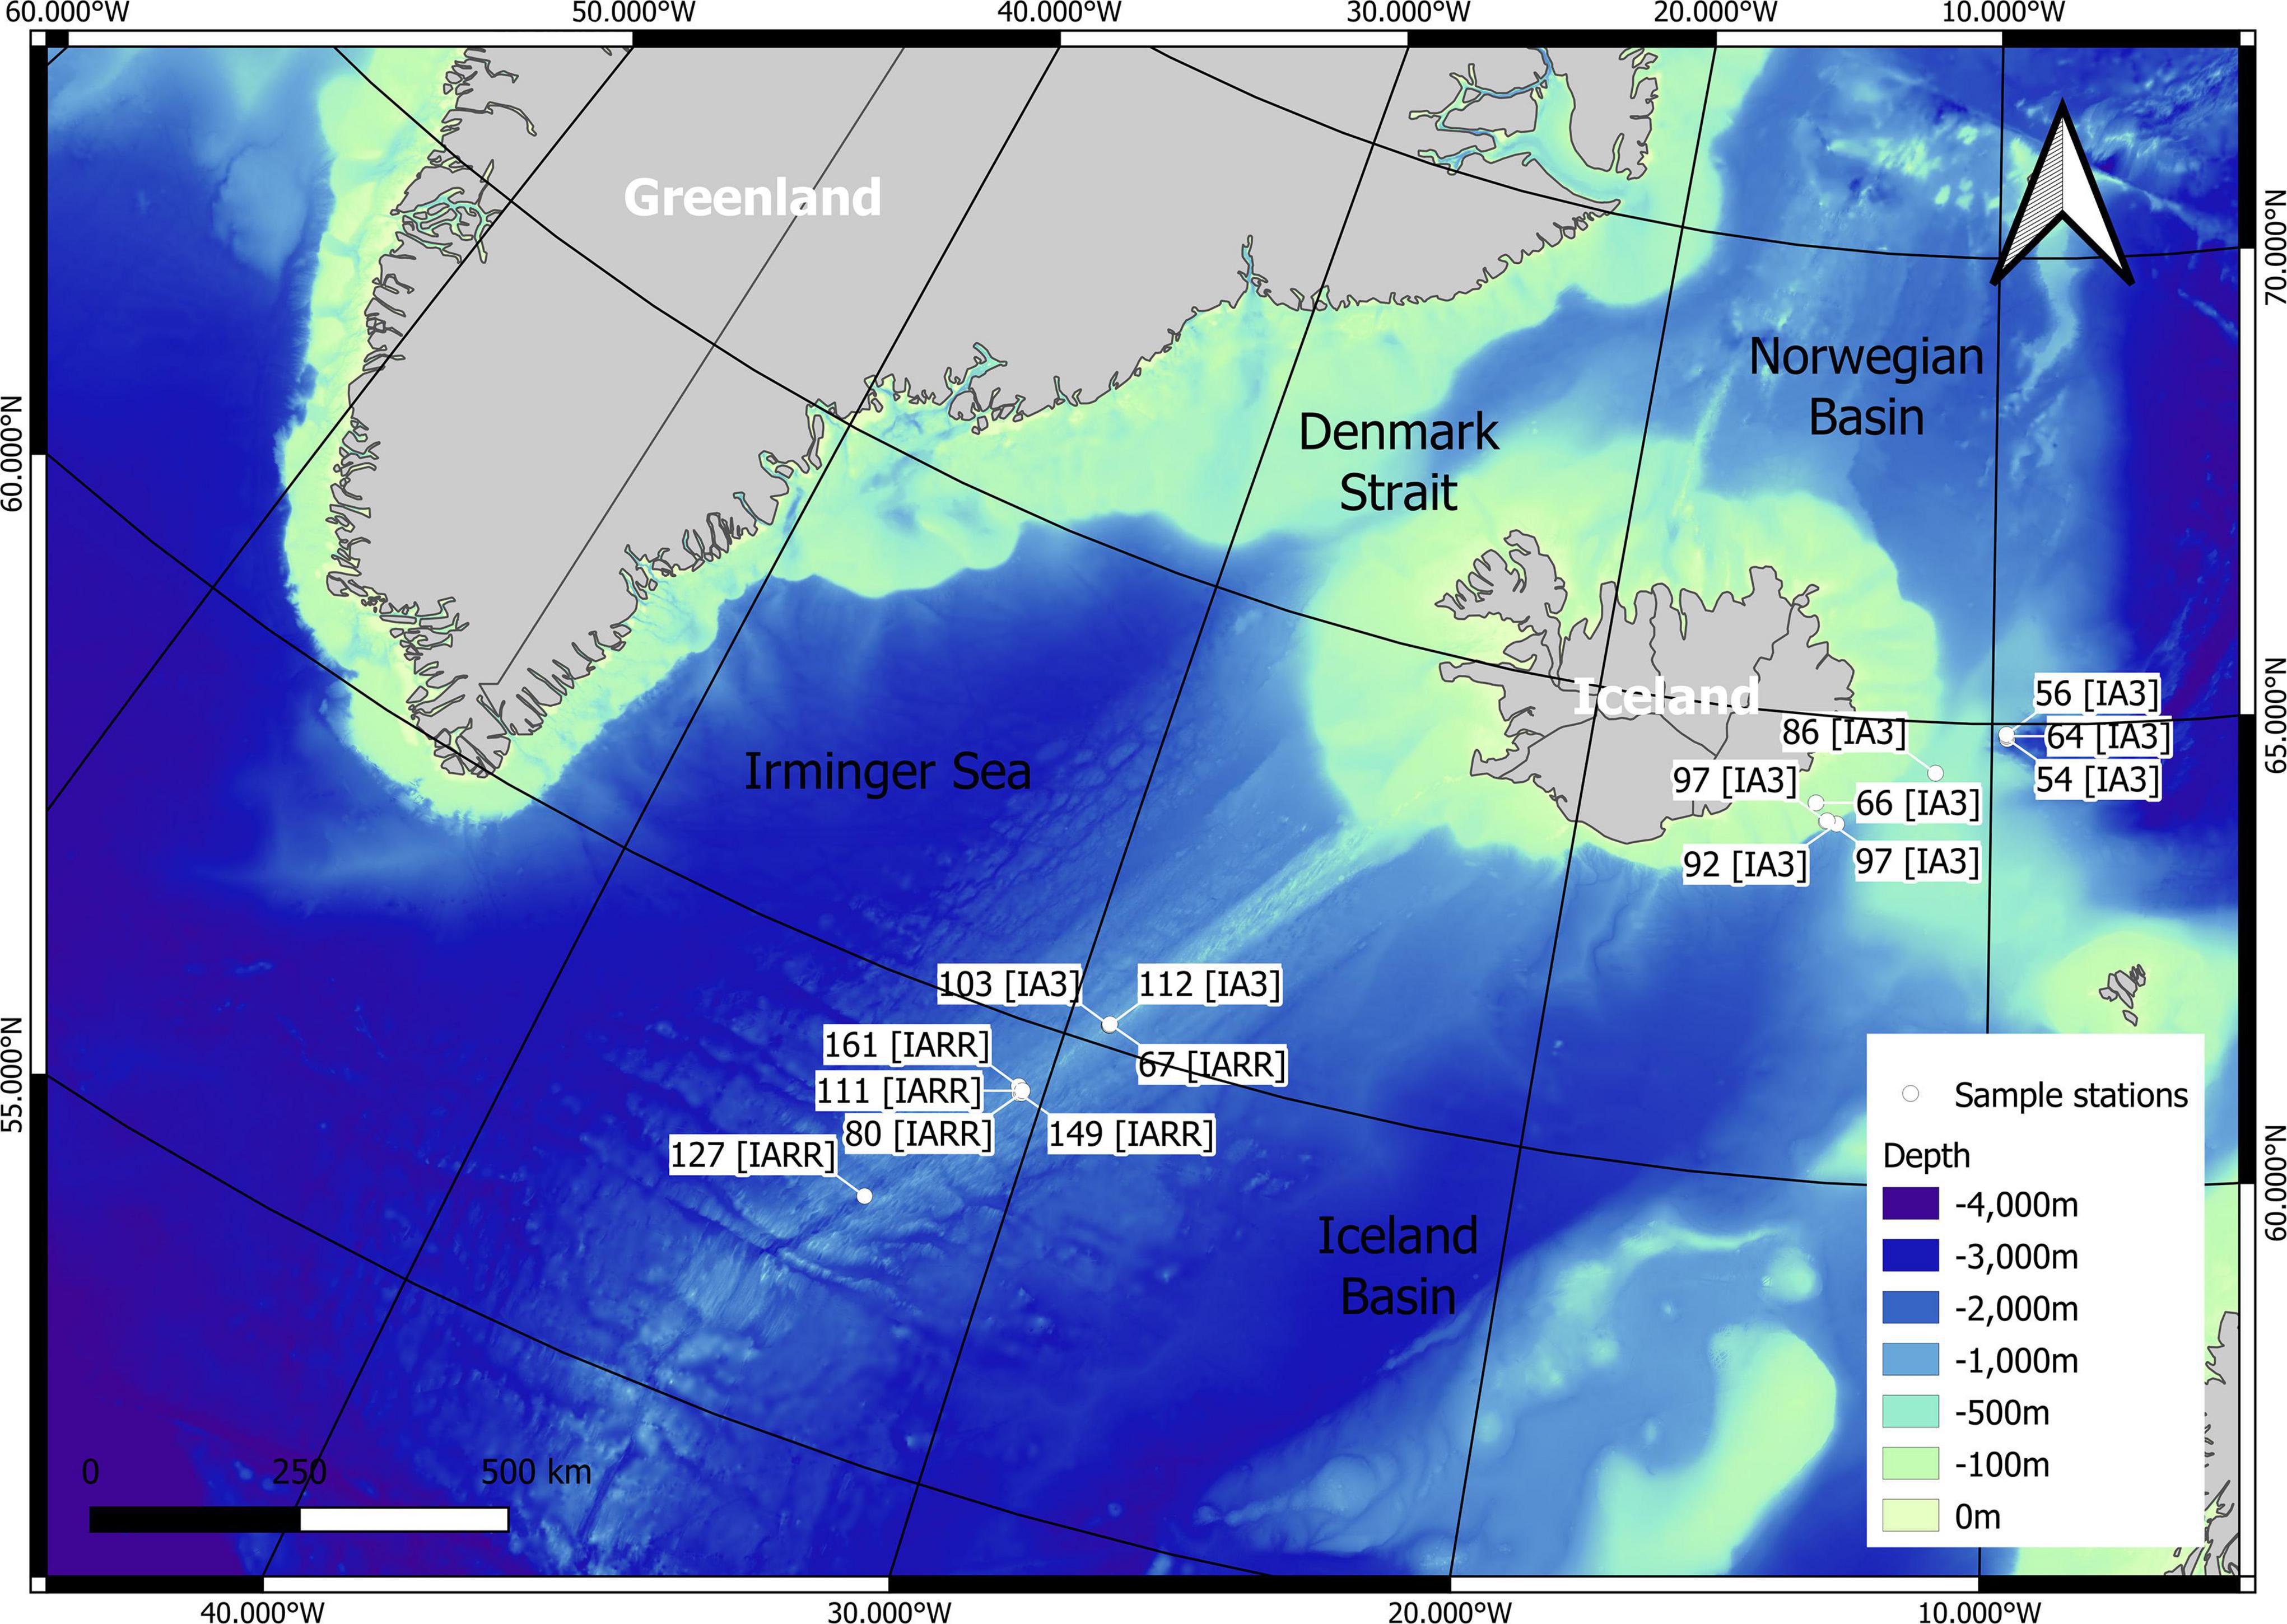
Figure 1. Map showing the stations of the sampled specimens from research cruise IceAGE 3 (IA3) and IceAGE RR (IARR).
The polyps were taken by a sterile tweezer for DNA extraction. The DNA extraction was carried out with the E.Z.N.A. Tissue DNA Kit (Omega Bio-tek, Inc.). According to the protocol, approximately 30 mg of coral tissue from the polyps were added to 200 μl TL Buffer and 25 μl proteinase K. The lysates were incubated for at least 3 h or overnight at 55°C. Further steps of the DNA extractions were performed according to the protocol of the kit. The polymerase chain reactions (PCRs) were performed using the protocols in Table 1 with the primers in Table 2. All reactions were carried out with 12.5 μl AccuStart GelTrack PCR SuperMix (ThermoFisher Scientific), 9.5 μl nuclease-free H2O, 0.5 μl forward primer, and 0.5 μl reverse primer. In this study, one mitochondrial (COI) and two nuclear gene segments (28S, ITS2) were amplified for Hexacorallia and two mitochondrial (mtMutS, COI) and two nuclear gene segments (28S, ITS2) were amplified for Octocorallia, respectively. The mitochondrial gene segments COI amplified a length of approximately ∼648 bp and mtMutS amplified a length of approximately ∼870 bp. Furthermore, the nuclear gene, the internal transcribed spacer 2 (ITS2), was amplified with a length of ∼1,500 bp. For the last amplified gene segment, the 28S rDNA, two different reverse primers (Table 2) were used. These gene fragments amplified a length of ∼800 and ∼650 bp, respectively. To check if the amplification was successful, gel electrophoresis was carried out using 3 μl of each product on 1% agarose/TAE gel containing 1% GelRed™. To eliminate primers and dNTPs before sequencing, 10 μl of each PCR product was purified with 4 μl ExoSAP-IT Express (ThermoFisher Scientific) at 37°C for 4 min followed by incubation at 80°C for 1 min. Purified PCR products were sent to Macrogen, Amsterdam for sequencing.
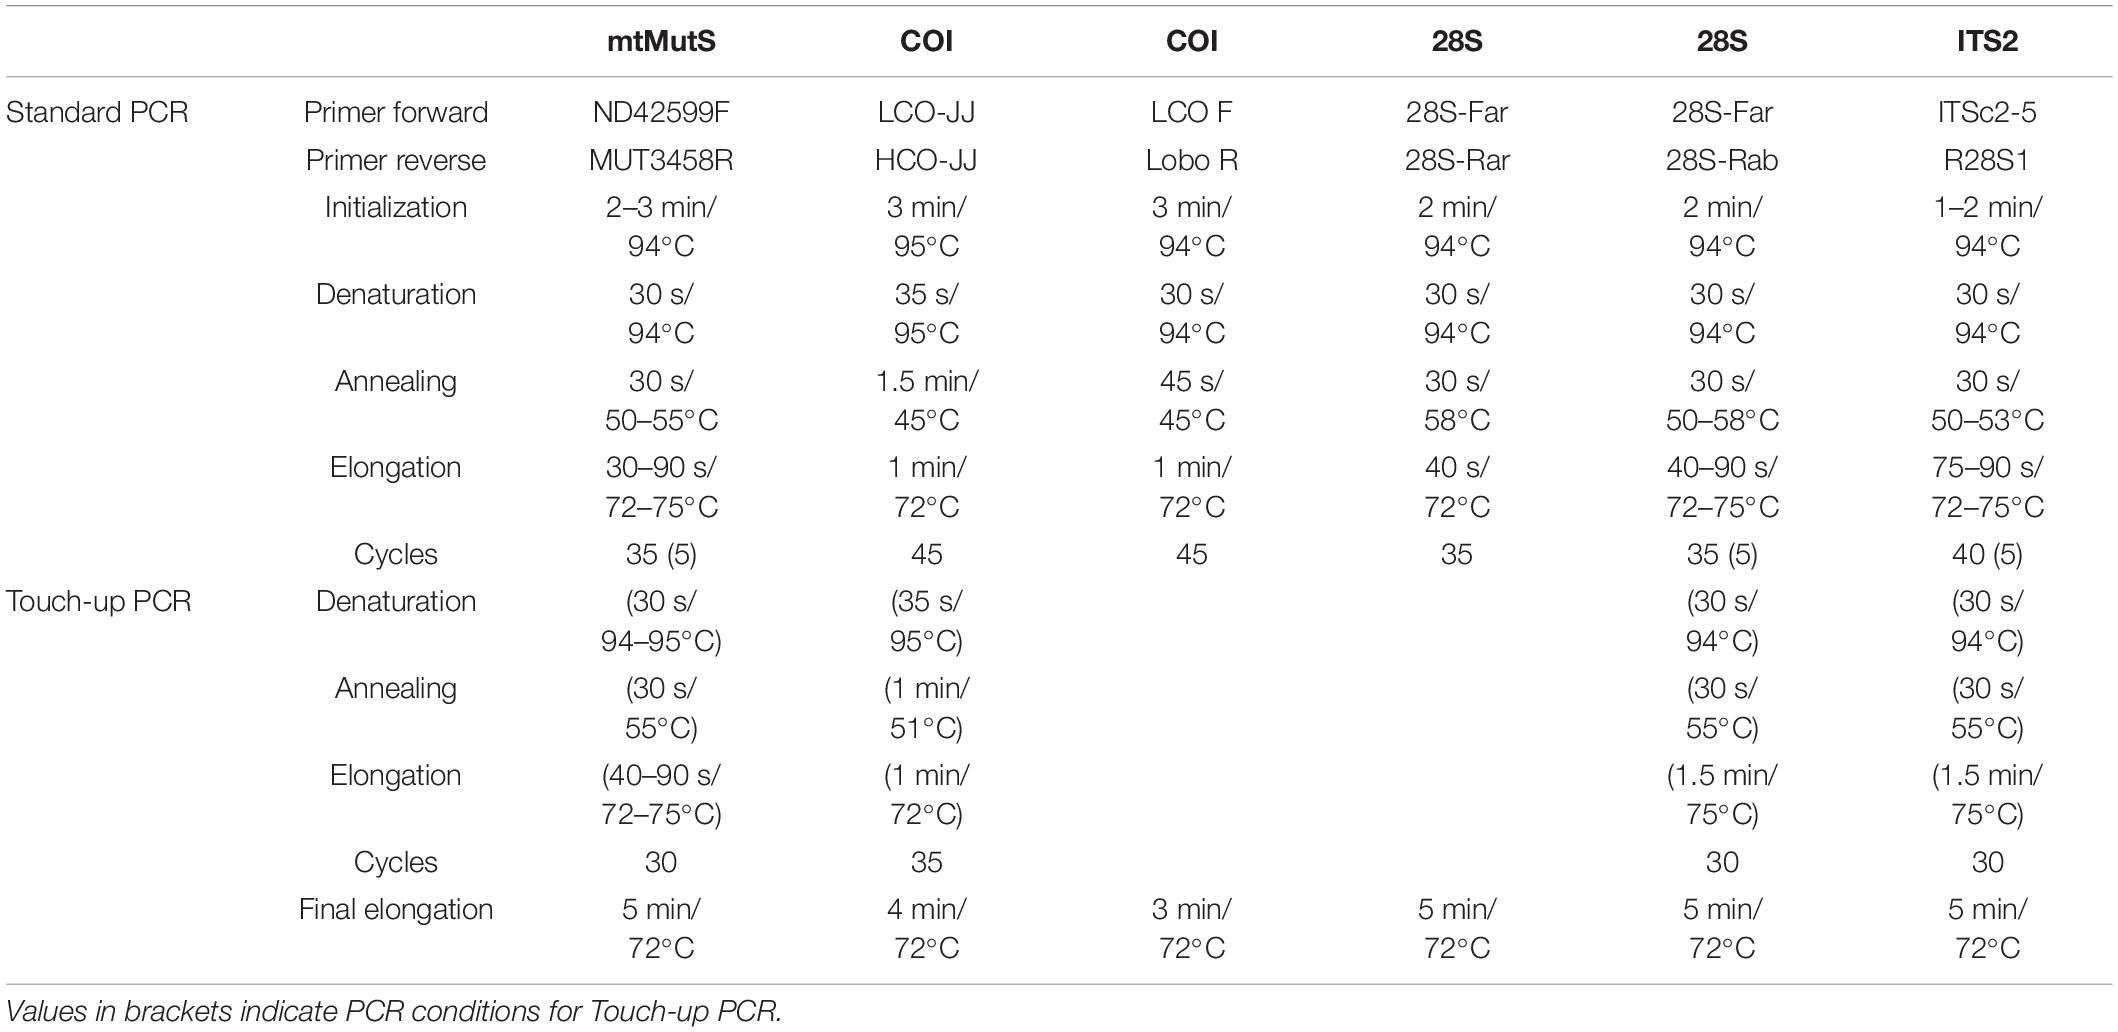
Table 1. PCR protocols used in this study.
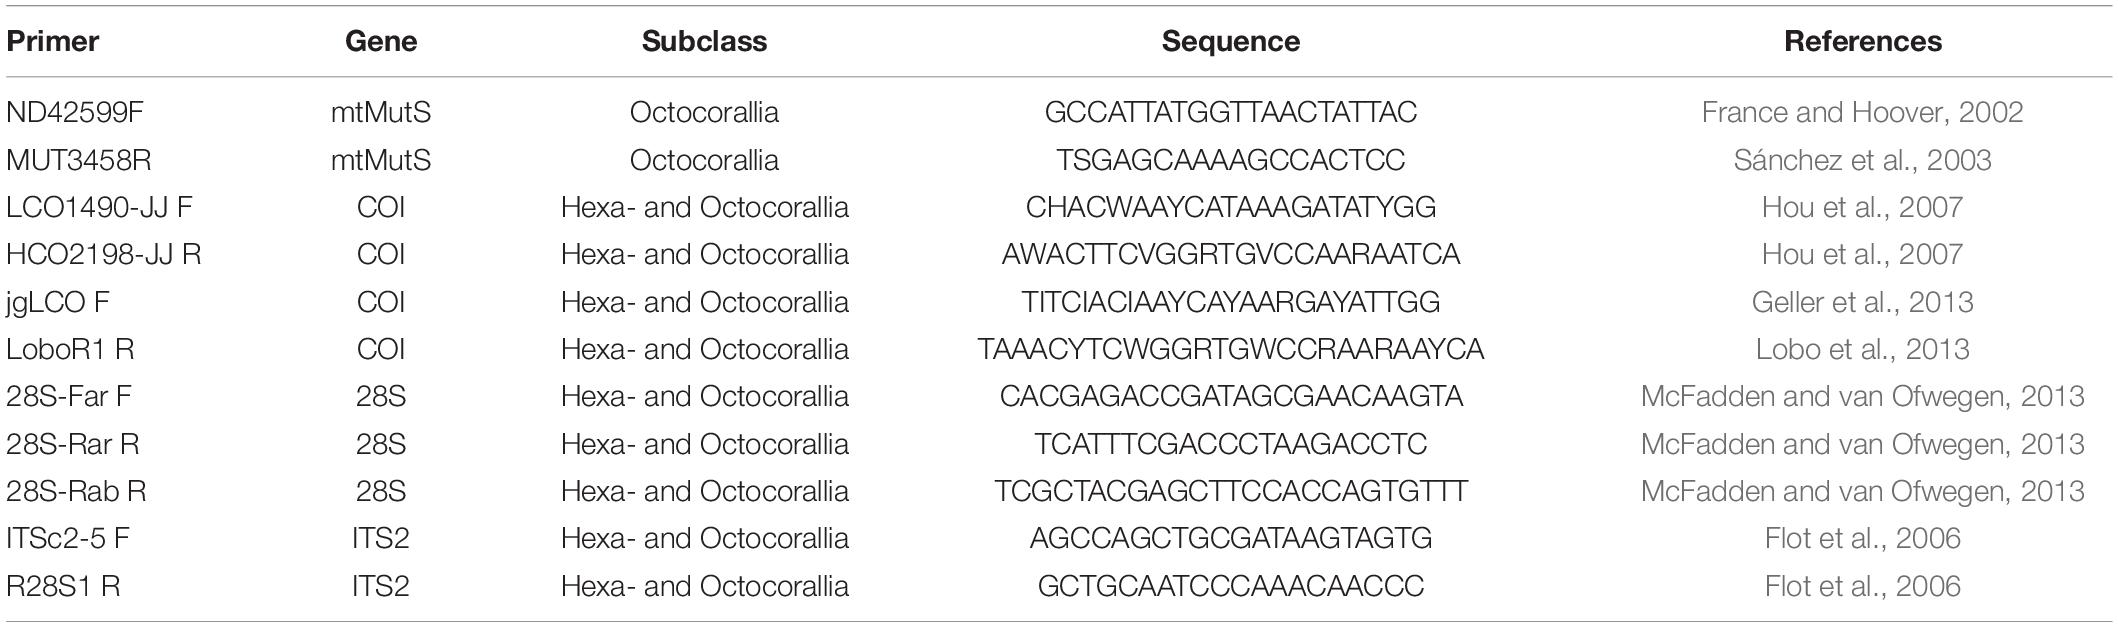
Table 2. Primers used for the amplification of the mitochondrial and nuclear genes in this study.
Sequence chromatograms were assembled and trimmed in Geneious 7.1.91. Sequences were aligned with the L-INS-i method in MAFFT (Katoh et al., 2009) by using the plugin in Geneious software. The sequences of the protein-coding genes (mtMutS and COI) were translated to amino acids to ensure that there were no stop codons. However, in the following steps, the nucleotide sequences were analyzed. The mtMutS and COI alignments were concatenated, and a partition-homogeneity test was carried out with PAUP 4 (Swofford, 2003) to ensure that there was no lack of congruence. Because of a lack of congruence between the mitochondrial and the nuclear genes, two separate gene trees were generated, one for the 28S rDNA and ITS2 nuclear DNA (nDNA) and another one for the mtMutS and COI mitochondrial DNA (mtDNA). Concatenation of the two mitochondrial sequences of mtMutS and COI of Octocorallia had no effect on the COI sequences of Hexacorallia, since only this one mitochondrial gene sequence is sequenced here. For both the nDNA and mtDNA data sets, a Maximum Likelihood (ML) tree and Bayesian analysis were constructed. The most appropriate evolutionary model for nucleotide substitution was determined by JModeltest 2.1.10 (Guindon and Gascuel, 2003; Darriba et al., 2012). The determined model was the GTR + G model with a gamma shape of 0.347 for the concatenated mtDNA alignment and the HKY + G model with a gamma shape of 0.401 for the concatenated nDNA alignment. The Bayesian analysis was accomplished by BEAUti 1.8.3 (Drummond and Rambaut, 2007) to generate an xml input file with a Yule speciation tree (Yule, 1925) with a length of chain of 10 million. The created xml file was imported in BEAST 1.8.3 (Drummond and Rambaut, 2007) and was run with a random number seed of 10 million. All Effective Sample Size (ESS) values were calculated with MCMC Trace Analysis Tool (Tracer v1.5.0) software (Drummond and Rambaut, 2007). Thereafter, TreeAnnotator 1.8.3 (Drummond and Rambaut, 2007) was used to discard 25% of the trees and choose the best tree. The ML trees were generated with IQ-tree (Nguyen et al., 2015) using bootstrap values of 1,000 replicates. The Bayesian and ML trees were checked and edited in FigTree 1.4.4 (Rambaut and Drummond, 2012).
All DNA sequences were searched against GenBank nucleotide database by using the Basic Local Alignment Search Tool (BLASTN) (Altschul et al., 1990). In situ images, colony shape, BLASTN matches, and metadata of the samples were used for species identification. In most cases, the species identified by BLAST varied with different markers. In these cases, the species was chosen which was most likely to be found in the area or the species identification was downgraded to family level. Two different methods were used to discriminate species: the General Mixed Yule Coalescent (GMYC) model and the Automatic Barcode Gap Detection (ABGD).
To calculate the GMYC model, a newick file was generated in FigTree and imported in R (version 3.5.0 2018) by using the package “splits” (Fujisawa and Barraclough, 2013). GMYC is a species delimitation method based on branching events. The speciation and coalescence within species are assessed as two categories. It is assumed that species are monophyletic. The simple threshold approach assumes that there is a threshold time i. Prior to i, all nodes provide diversification events (interspecific). After i, all nodes are evaluated as coalescence events (intraspecific). Thus, the species number is estimated by i (Fujisawa and Barraclough, 2013).
The online version of the ABGD method2 was used to calculate the barcoding gaps and the prior thresholds for different loci. The parameters were set as follows: Pmin = 0.001, Pmax = 0.1, Steps = 10, X = 1.5, Nb bins = 20 and the Kimura 2-parameter model was selected.
In total, one square millimeter of tissue of 49 ethanol-preserved individuals were separated into 1.5 ml microcentrifuge tubes. After ethanol evaporation, 1.5 μl of a matrix solution containing α-Cyano-4-hydroxycinnamic acid (HCCA) as a saturated solution in 50% acetonitrile, 47.5% molecular grade water, and 2.5% trifluoroacetic acid was added. The solution was incubated for at least 5 min and was applied to one spot for crystallization on the target plate. The Microflex LT/SH System (Bruker Daltonics) measured the samples by using the flexControl 3.4. (Bruker Daltonics) software. Masses were measured from 2 to 20 k Dalton. A centroid peak detection algorithm was carried out for peak evaluation by analyzing the mass peak range from 2 to 20 k Dalton. Furthermore, peak evaluation was carried out by a signal-to-noise threshold of two and a minimum intensity threshold of 600 with a peak resolution higher than 400. To validate fuzzy control, the proteins/oligonucleotide method was employed by maximal resolution of ten times above the threshold. The obtained dataset was analyzed as described by Rossel and Martínez Arbizu (2018a) in R, version 1.4.1106 (R Core Team, 2020) using the packages MALDIquant (Gibb and Korbinian, 2012) and MALDIquantForeign (Gibb, 2015). Protein mass spectra were trimmed to an identical range from 2,000 to 20,000 m/z and smoothed by using the Savitzky-Golay method (Savitzky and Golay, 1964) with half window size (HWS) of 10. The SNIP baseline estimation method (Ryan et al., 1988) was applied to remove the baseline, and the TIC method in MALDIquant was used to normalize the spectra. A signal-to-noise ratio (SNR) of 5 was applied to reduce the noise of the spectra, and a half window size of 10 was used for peak detection. The peaks of the spectra were binned several times by using the function binpeaks in MALDIquant with a tolerance of 0.002 in a strict approach. To apply further analysis, a Hellinger transformation (Legendre and Gallagher, 2001) was applied to the resulting intensity matrix. A dendrogram was generated by hierarchical cluster analysis with Ward’s D clustering algorithm (Ward and Joe, 1963), Euclidean distances, and 1,000 bootstrap repeats.
Furthermore, a RandomForest (RF) model (Breiman, 2001) using R-package randomForest (Liaw and Wiener, 2002) was generated to investigate applicability of mass spectra in classification approaches. The RF analysis is based on an intensity matrix by using bins as predictors and species names as multi-level target factors. The RF analysis was carried out on Hellinger transformed data (Legendre and Gallagher, 2001) using 35 predictors (mtry) and 2,000 trees. A t-SNE plot (Van der Maaten and Hinton, 2008), based on the raw data matrix probability of each specimen was applied. Here, the R-package t-SNE (Krijthe and Van der Maaten, 2015) was used. The t-SNE plot was constructed by using a perplexity of 10 and a number of iterations of 4,000.
A total of 49 specimens were sampled belonging to 17 species as identified by in situ images, colony shape, BLASTN matches and metadata of the samples. The sampled species belong to 11 families and at least 12 genera (Supplementary Material 2).
The alignment of the mitochondrial data included 25 sequences of mtMutS and 35 sequences of COI. The length of the acquired fragments varied between 883 and 935 bp for mtMutS and 436 and 724 bp for the COI sequences. Furthermore, a total of 39 sequences for ITS2 and 40 sequences for 28S rDNA were obtained. The length of the nuclear fragments varied from 628 to 730 bp for ITS2, and 421 to 750 bp for 28S rDNA. The concatenated alignment for the two mitochondrial loci was 1,659 bp and the concatenated alignment of the nuclear loci was 1,480 bp.
The species delimitation methods GMYC and ABGD were able to differentiate 17 species, considering missing sequence data for some specimens and locus-specific variation. The results of GMYC and ABGD are presented as black and gray bars, respectively, in Figures 2, 3. The calculated maximum likelihood of the GMYC model in the mitochondrial tree was 243.2908 and significantly higher (p-value = ≤ 0.05) than the likelihood of the null model (L0 = 227.8115). The GMYC model calculated 15 clusters with a confidence interval of 15–16. This model did not distinguish between Acanthogorgia sp. Gray, 1857 and Paramuricea placomus (Linnaeus, 1758). It should be noted that the identification was based on BLASTN results and general morphological characteristics. The mtMutS sequence of Acanthogorgia specimens was compared in GenBank with other mtMutS sequences of Acanthogorgia specimens. Except for unknown nucleotides, we could not detect any differences between these sequences. The specimens of these two species were grouped in one cluster. The specimens of Desmophyllum dianthus (Esper, 1794) and Desmophyllum pertusum (Linnaeus, 1758) were also grouped in one cluster (Figure 2, black bars). The ABGD generated robust results for the mtMutS sequences (Figure 2, dark gray bars) at a prior maximal distance (P) of 0.0028 to 0.0599, which was consistent with the grouping of the GMYC model. A lower prior maximal distance (< 0.0028) generated a separate group for Acanthogorgia sp. (cor527). The ABGD of the COI sequence data showed a robust result of nine groups at a prior maximal distance of 0.0078 to 0.0359. The grouping differed concerning the cluster of the genus Gersemia Marenzeller, 1878, where all specimens of the genus were grouped in one cluster, except the missing data of cor39 (Figure 2, light gray bars). Lower prior maximal distances (< 0.0078) resulted in the separation of the D. pertusum cluster but did not result in discrimination of the species D. dianthus and D. pertusum.
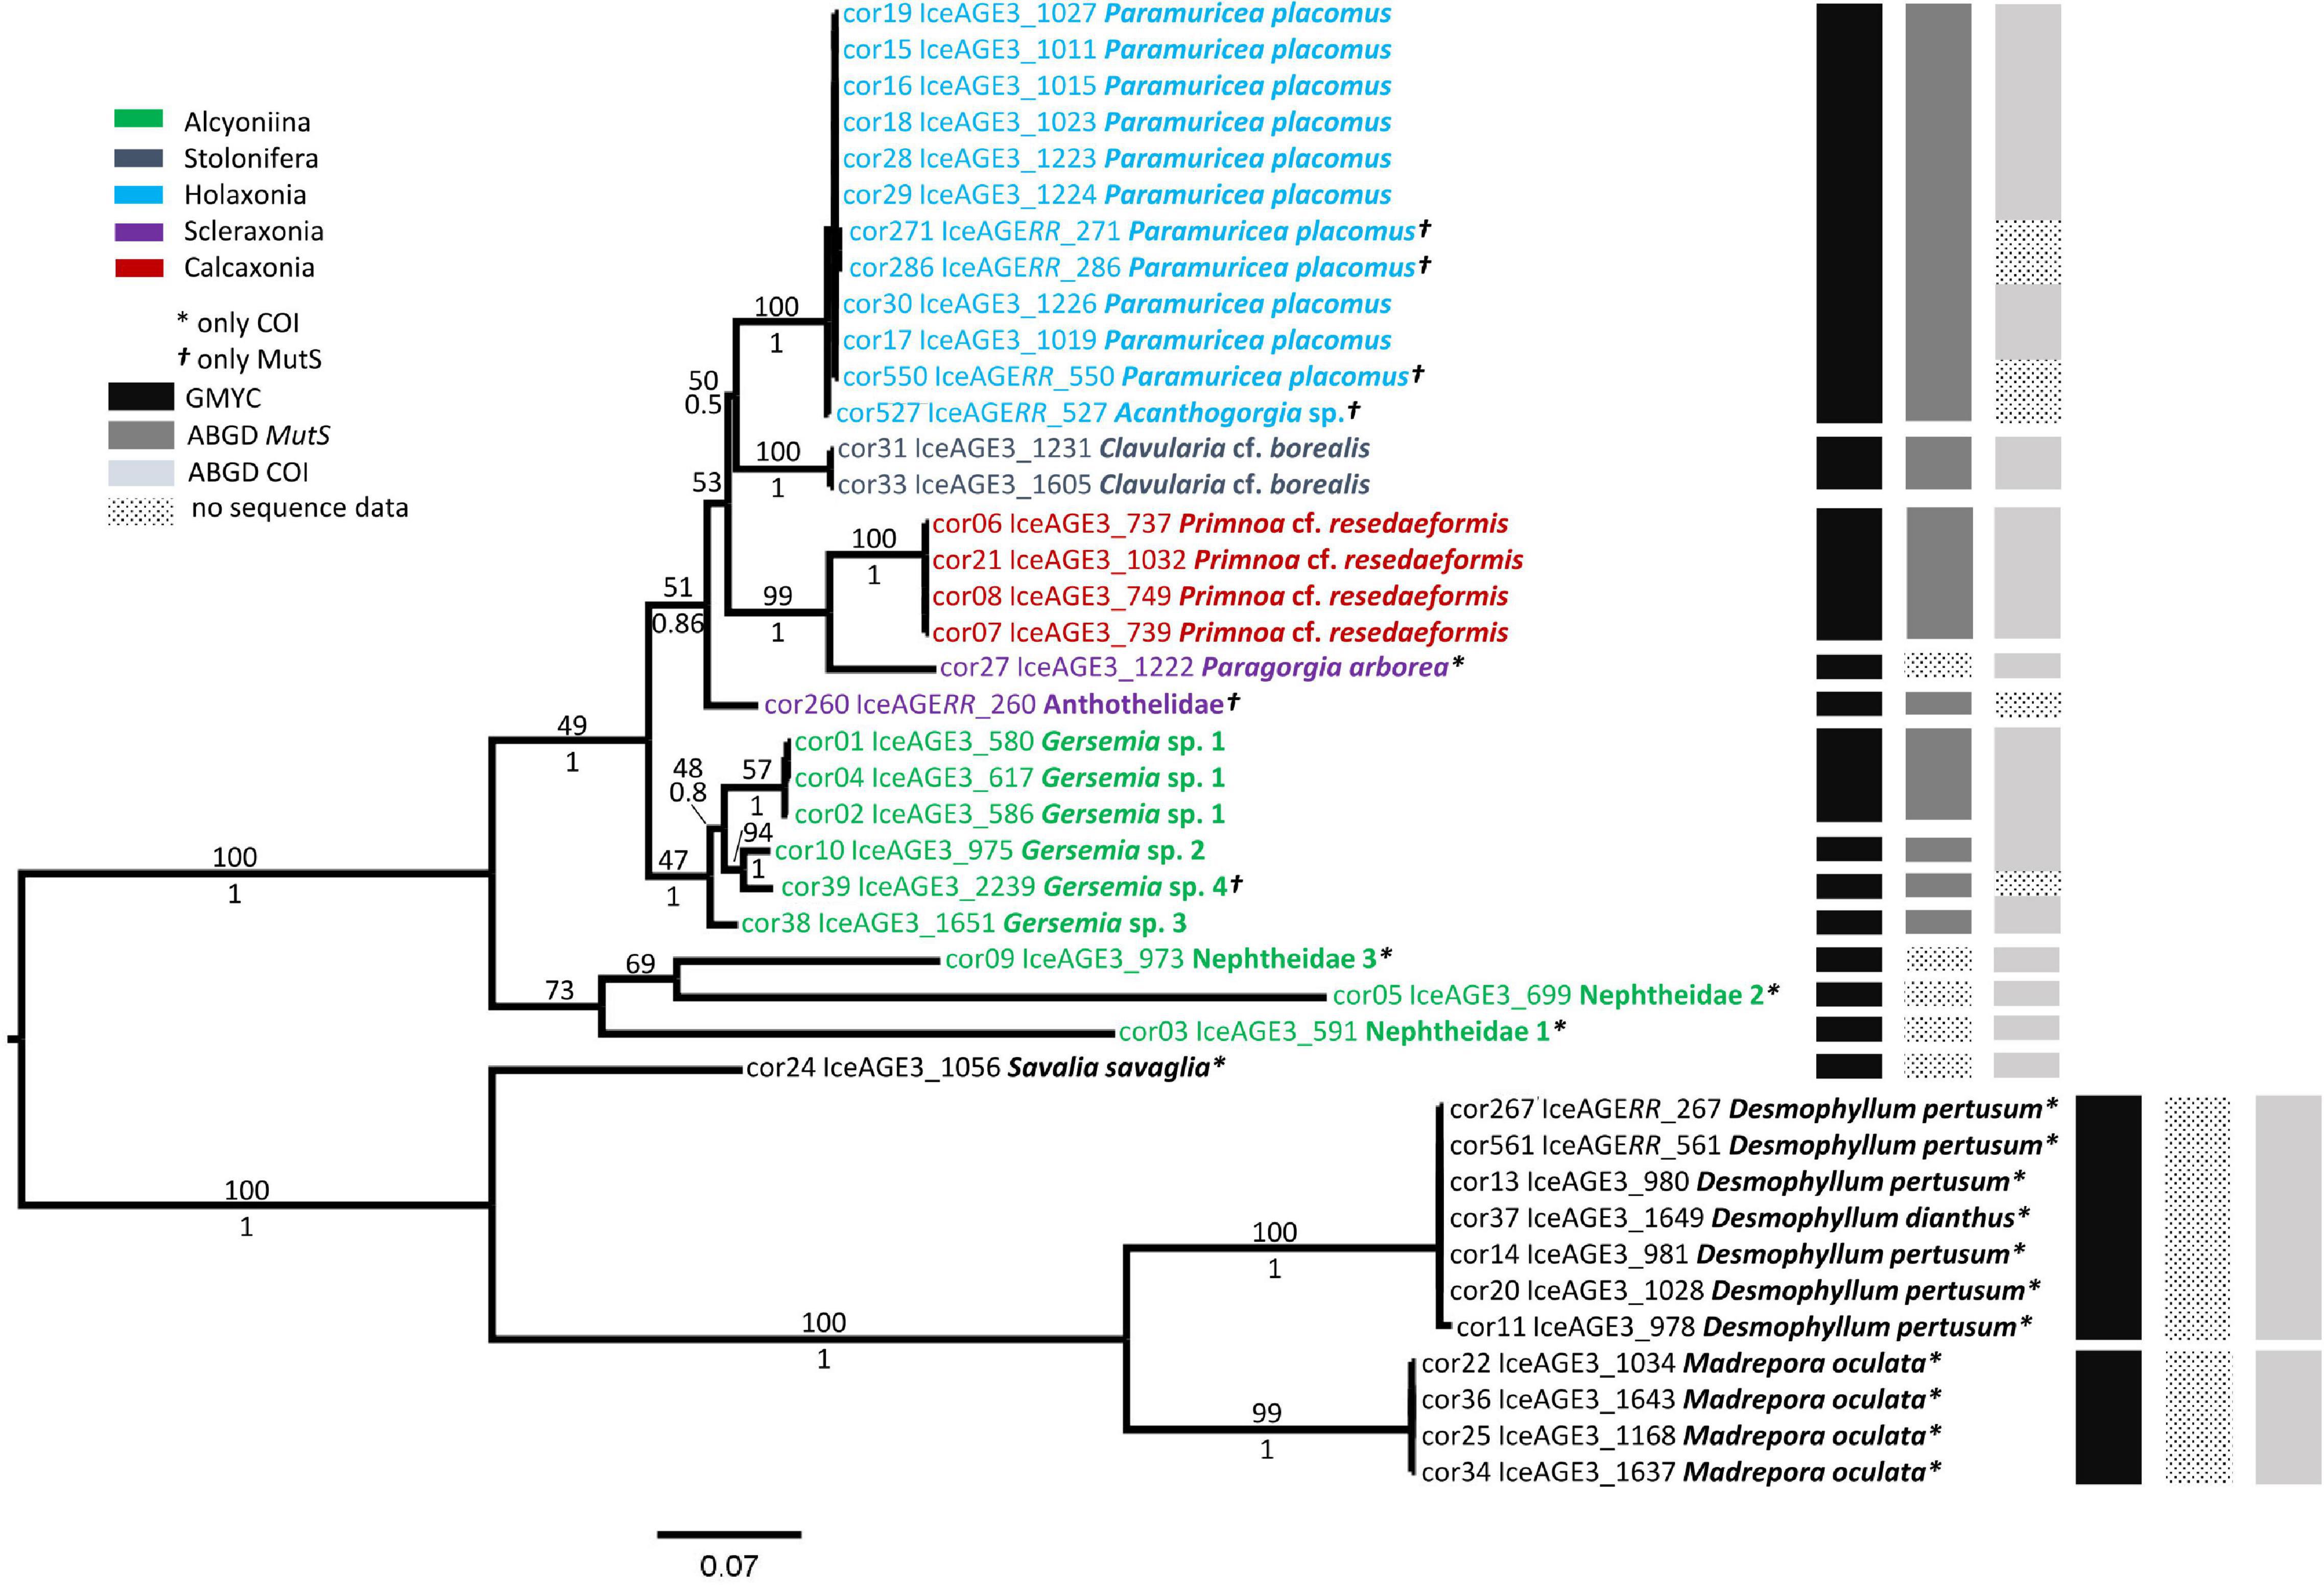
Figure 2. The phylogenetic tree of the Octocorallia and the Scleractinia based on the Maximum Likelihood (ML) analysis of concatenated sequence data from 41 specimens for the mitochondrial gene mtMutS and COI. Bootstrap percentages of the ML analysis are given above the branches. Bayesian posterior probabilities are located below the branches. The black and gray bars on the right show the results of the GMYC and ABGD species discrimination methods, respectively. The GMYC model was achieved with the concatenated sequence data. ABGD method was performed with single alignment data for each locus.
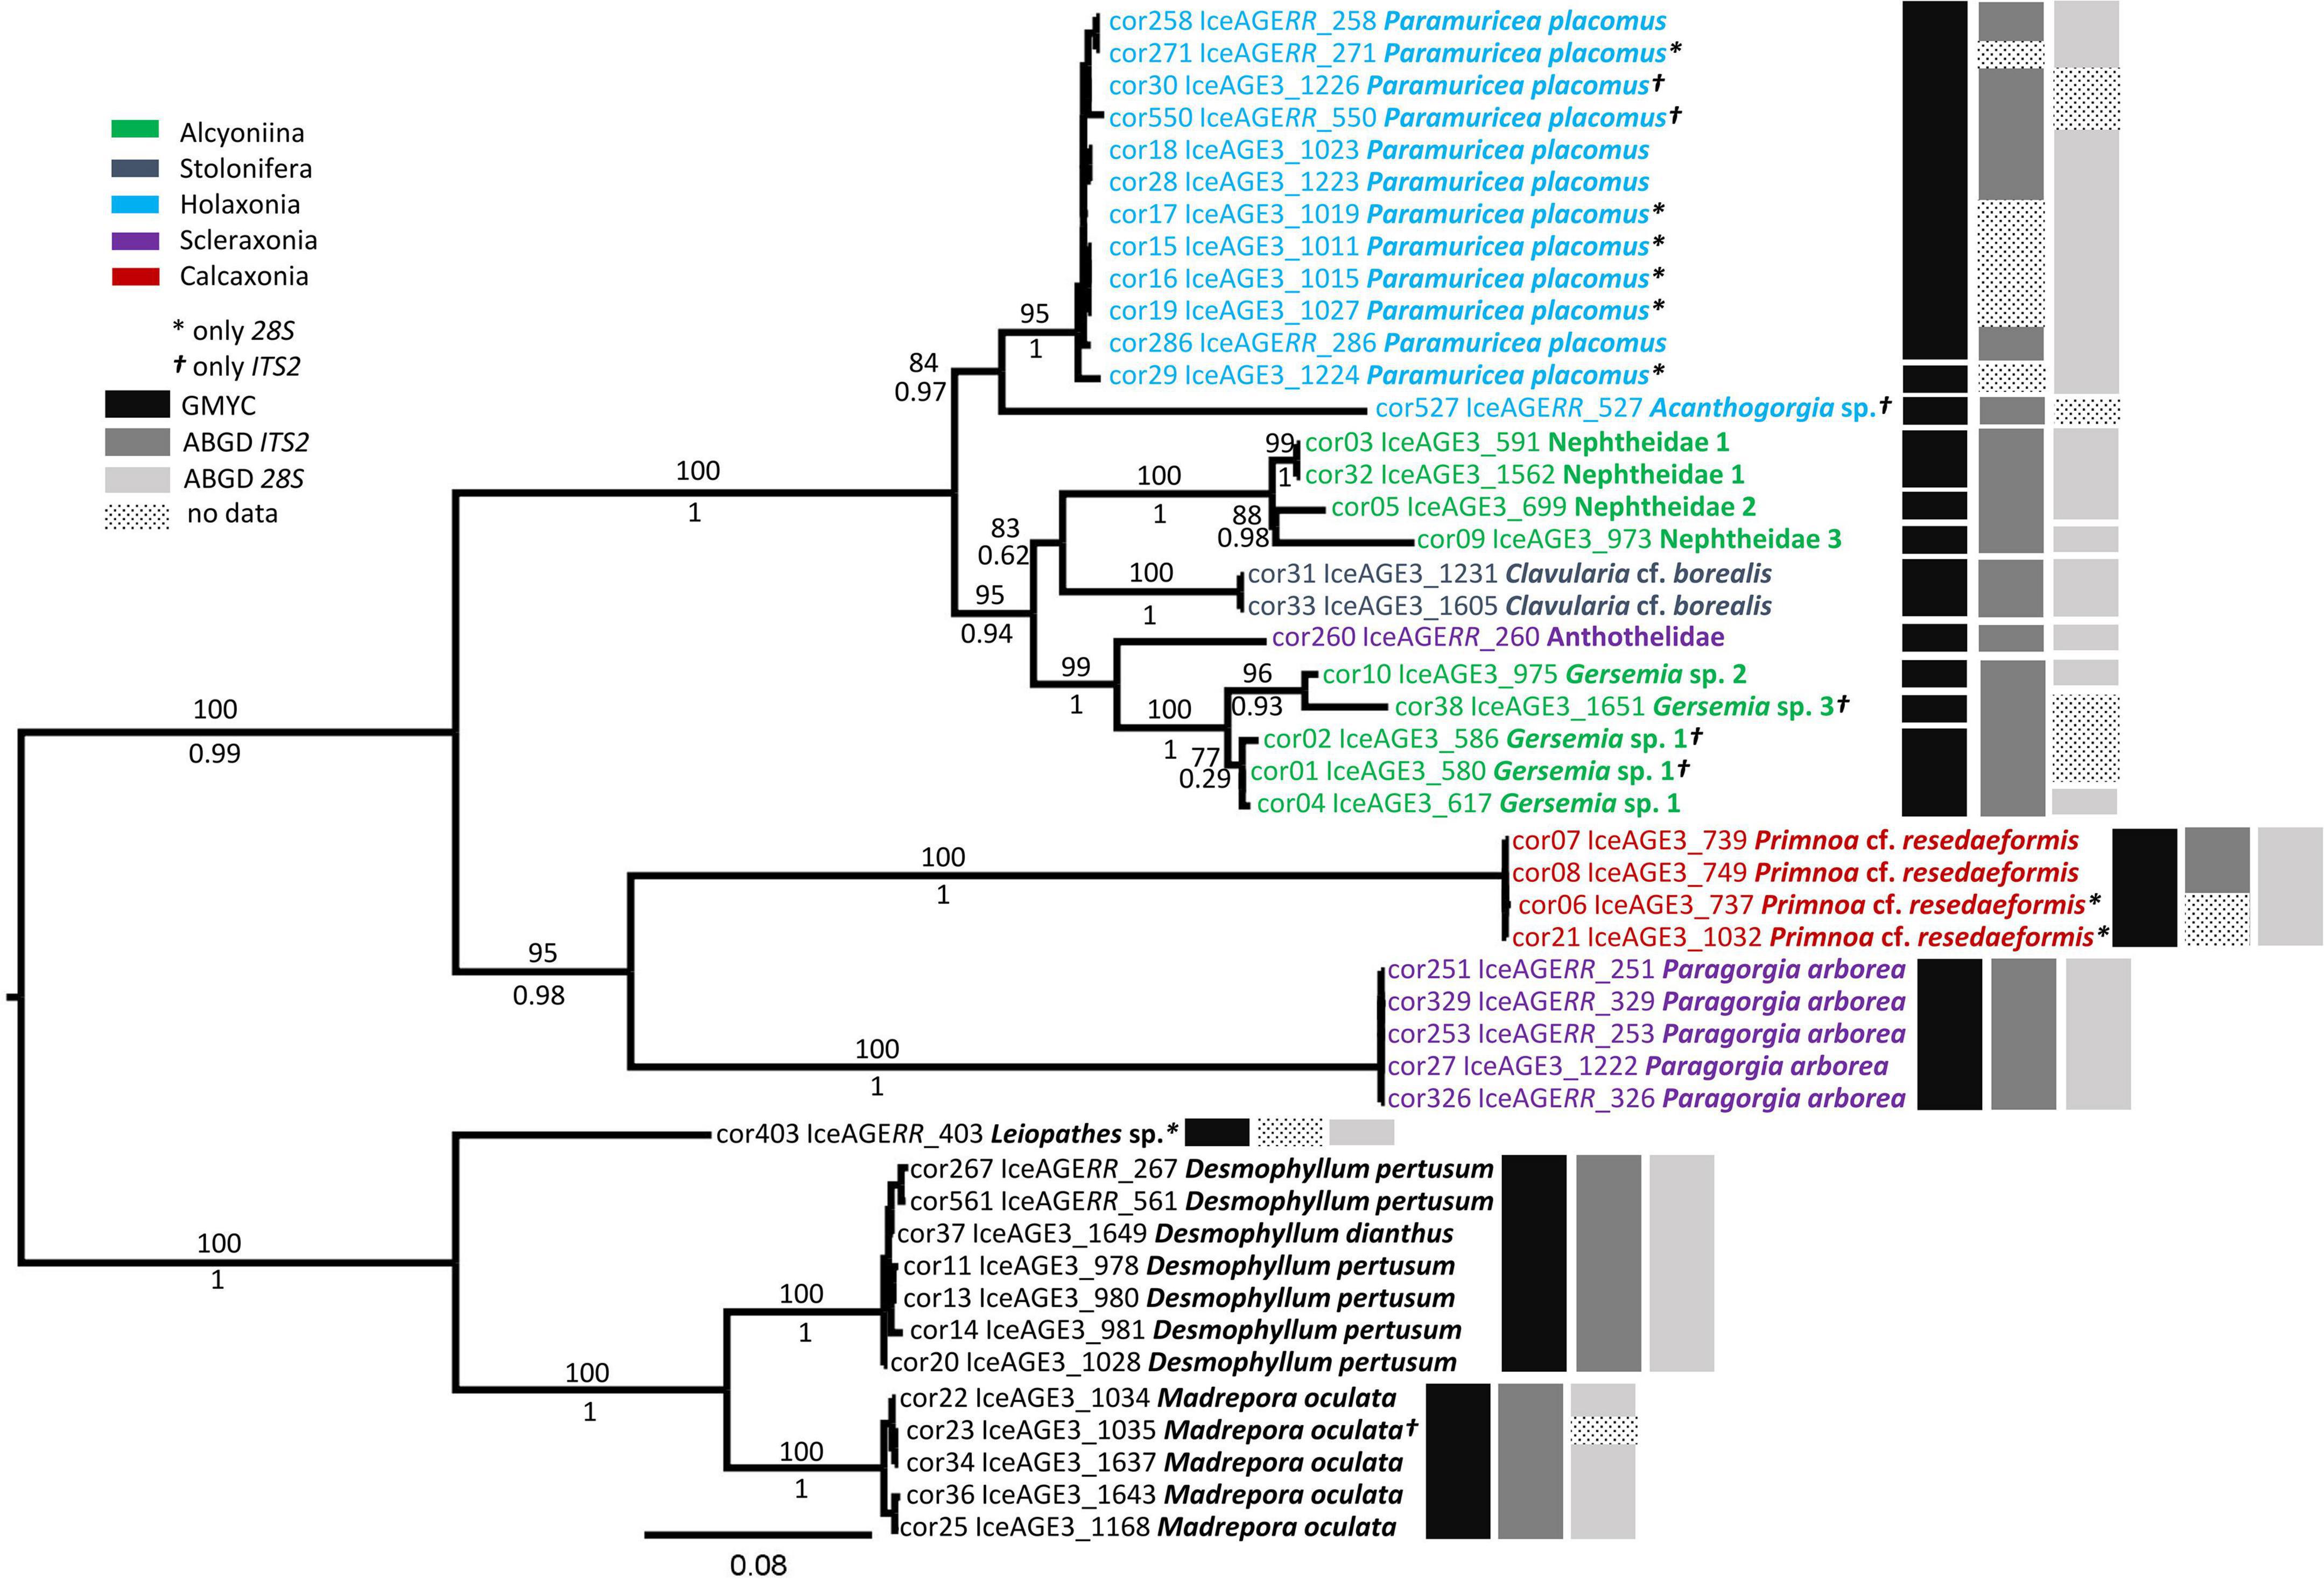
Figure 3. The phylogenetic tree of the Octocorallia and the Scleractinia based on the Maximum Likelihood (ML) analysis of concatenated sequence data from 47 specimens for the nuclear gene ITS2 and 28S rDNA. Bootstrap percentages of the ML analysis are given above the branches. The black and gray bars on the right show the results of the GMYC and ABGD species discrimination methods, respectively. The GMYC model was achieved with the concatenated sequence data. ABGD method was performed with single alignment data for each locus.
In the nuclear gene tree, the calculated maximum likelihood of the GMYC model was 283.2054 and significantly higher (p-value = ≤ 0.05) than the likelihood of the null model (L0 = 273.4672). Here, 16 clusters were calculated with a confidence interval of 15–17. Groupings of nuclear sequences differed from mitochondrial sequences in the separation of specimens cor29 and cor527 from the rest of the cluster of Paramuricea Kölliker, 1865 (Figure 3, black bars). ABGD resulted in the differentiation of 10 groups for the ITS2 sequences (P = ≥ 0.0077). The species Acanthogorgia sp. was separated from the Paramuricea cluster. However, the unidentified specimens of the family Nephtheidae, as well as the specimens of the genus Gersemia were clustered (Figure 3, dark gray bars). At a lower prior maximal distance (< 0.0077), the specimens of Madrepora oculata Linnaeus, 1758 were split into two groups (data not shown). For the 28S rDNA sequences, ABGD showed a robust result of 12 groups by a prior maximal distance between 0.0028 and 0.0599. Here, all specimens of P. placomus were represented in one group but Nephtheidae 1 and Nephtheidae 2 were also clustered in one group (Figure 3, light gray bars). Lower prior maximal distances (< 0.0028) resulted in a separation of the Paramuricea group.
Bayesian and ML analysis resulted in slightly different tree topologies for the mitochondrial gene tree (Figure 2). Specimens were assigned mostly to the same clades, but in some cases, there was a difference in relative support of nodes. Moreover, nuclear and mitochondrial gene trees were largely congruent in resulting clades but differed in the order of branching of the deeper nodes (Figures 2, 3).
Both gene trees (nuclear and mitochondrial) showed high support for the clades of Octocorallia and Hexacorallia (Figures 2, 3). Within the Hexacorallia clade, the mitochondrial tree had strong support for the discrimination of Zoantharia (cor24) and Scleractinia (Figure 2). On the other hand, the nuclear gene tree had high support for clades of Antipatharia (cor403) and Scleractinia (Figure 3). The genera Madrepora Linnaeus, 1758 and Desmophyllum Ehrenberg, 1834 were well separated and supported by high bootstrap percentages and posterior probabilities. However, neither the mitochondrial gene trees nor the nuclear gene trees were able to separate the species D. pertusum and D. dianthus.
In the mitochondrial gene tree, the ML analysis divided Octocorallia into two main clades where one clade encompassed the unidentified specimens (1–3) of the family Nephtheidae, for which only COI sequences were obtained; these were grouped in external branches in the Bayesian analysis (Supplementary Material 3). The other clade was divided into four subclades: The first one encompassed the holaxonians P. placomus and Acanthogorgia sp. and was sister to the second clade of Clavularia cf. borealis Koren & Danielssen, 1883. The specimen Acanthogorgia sp. and three individuals of P. placomus were only represented with mtMutS sequence data and were not distinguishable (Figure 2). Comparisons of the uncorrected p-distances of the mtMutS sequence data for both species showed a distance of only 0.04%. The third clade included the calcaxonian Primnoa cf. resedaeformis (Gunnerus, 1763) and the scleraxonian Paragorgia arborea (Linnaeus, 1758). Paragorgia arborea was also represented only by COI sequences. Comparisons of the COI sequence data resulted in a maximum uncorrected p-distance of at least 7.6% including several non-synonymous nucleotide substitutions. The unidentified species of the family Anthothelidae (cor260) was sister to the first three subclades. No COI sequence data were obtained for this species. The fourth subclade was formed by the genus Gersemia, which was separated into four species. Specimens of Gersemia sp. 1 showed a p-distance of 0.5% for mtMutS sequence data. The highest p-distance for mtMutS was 7.7% between Gersemia sp. 1 (cor04) and Gersemia sp. 2 (cor10). The p-distance between Gersemia sp. 3 and other representatives of the genus was slightly lower than that between cor04 and cor10.
The nuclear gene tree divided Octocorallia among three different clades (Figure 3). Like the mitochondrial gene tree, the first clade encompassed Acanthogorgia sp. and P. placomus. The genera Paramuricea, and Acanthogorgia were distinguished by a highly different nucleotide sequence that placed Acanthogorgia sister to Paramuricea. This clade was sister to the second clade which comprised the unidentified species of the family Nephtheidae, the species of Gersemia, Clavularia Blainville, 1830, and Anthothelidae. The third clade was represented by the calcaxonian P. cf. resedaeformis and the scleraxonian P. arborea. These two species were distinguished by a 16 bp insertion in the ITS2 sequence of P. arborea. The bootstrap percentages and posterior probabilities for the third clade were similar to the second clade. The first and second clades formed a sister branch to the third clade.
The hierarchical cluster analysis of the 146 measurements, summarized in 47 averaged spectra, indicated seven species-specific clusters (Figure 4). However, single specimens of Paramuricea (cluster C1), Madrepora (C3) and Gersemia (C5) were also found in cluster CX along with 10 specimens belonging to species for which only a single specimen was measured. Due to the lack of replicate measurements for these species, the species-specificity of these mass spectra could not be validated.
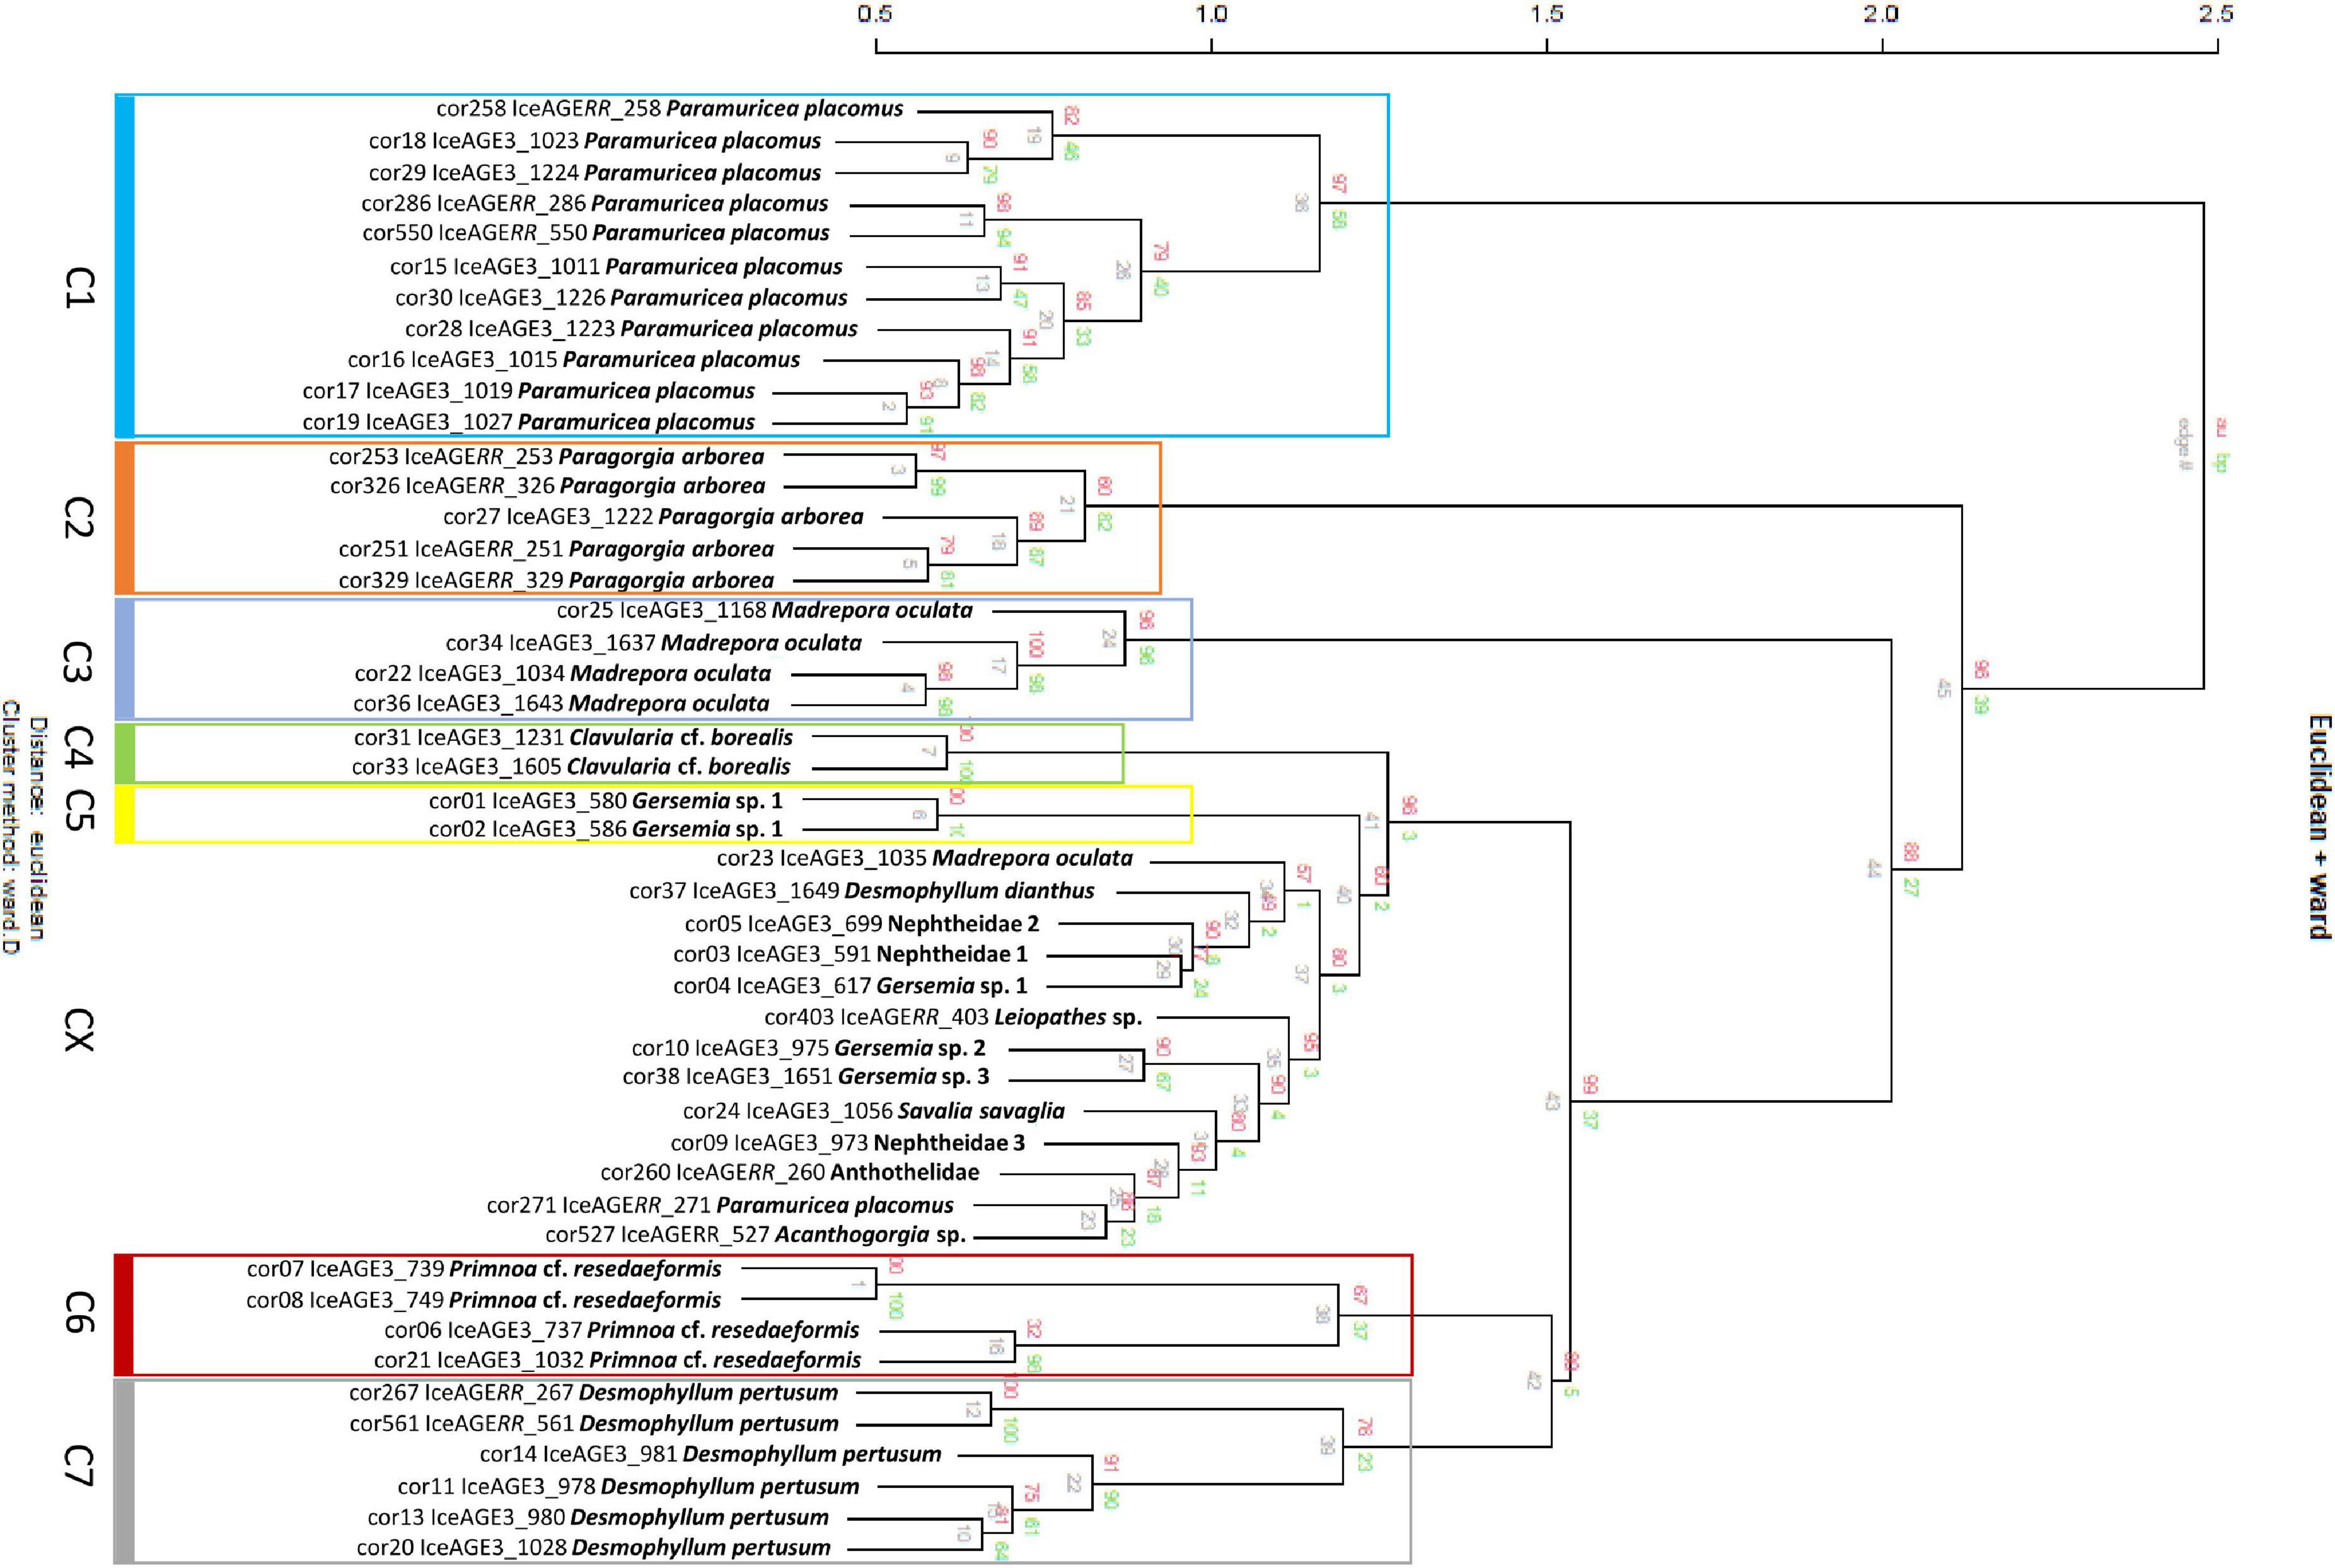
Figure 4. Hierarchical clustering of 47 individual Octocorallia and Hexacorallia samples resulting in seven well-supported clusters with discriminated species. The clusters of discriminated species are framed in color. Cluster CX shows singletons and unassignable specimens.
The random Forest model based on species with at least two specimens in the analysis supports the specificity of the mass spectra. Repeated RF analyses resulted mostly in models with stable classes showing a class error of 0. However, occasionally for the species Gersemia sp. 1 and M. oculata, single specimens were misassigned (Table 3) resulting in class errors of 0.2 and 0.3, respectively.
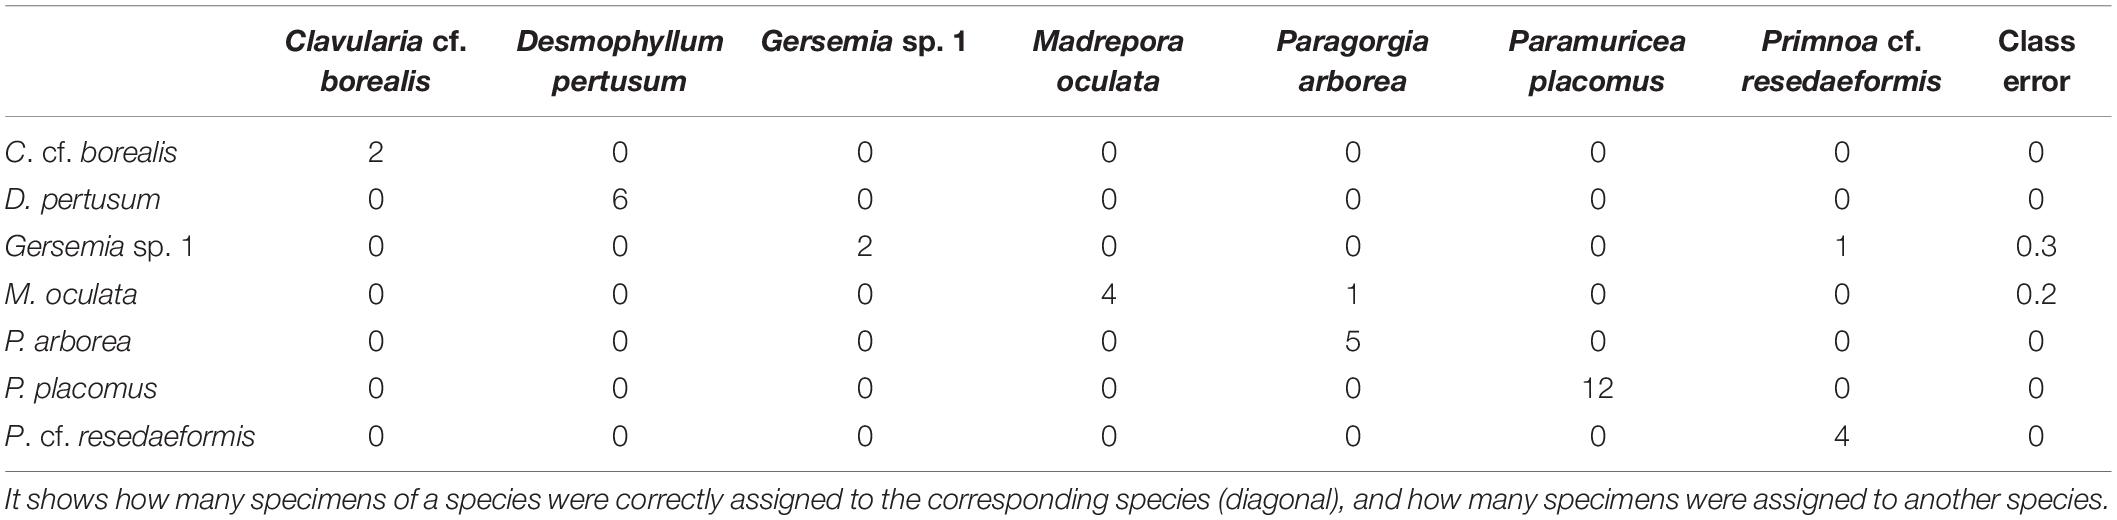
Table 3. Confusion matrix of the Random Forest analysis.
The t-distributed stochastic neighbor plot (Figure 5) depends on this RF model. One M. oculata specimen is depicted as an outlier. This specimen was also located in the miscellaneous cluster CX (Figures 4, 5, arrow on light blue square). Another outlier occurred in the group of Gersemia sp. 1; this specimen was also located in the CX cluster (Figures 4, 5, arrow on yellow triangle).
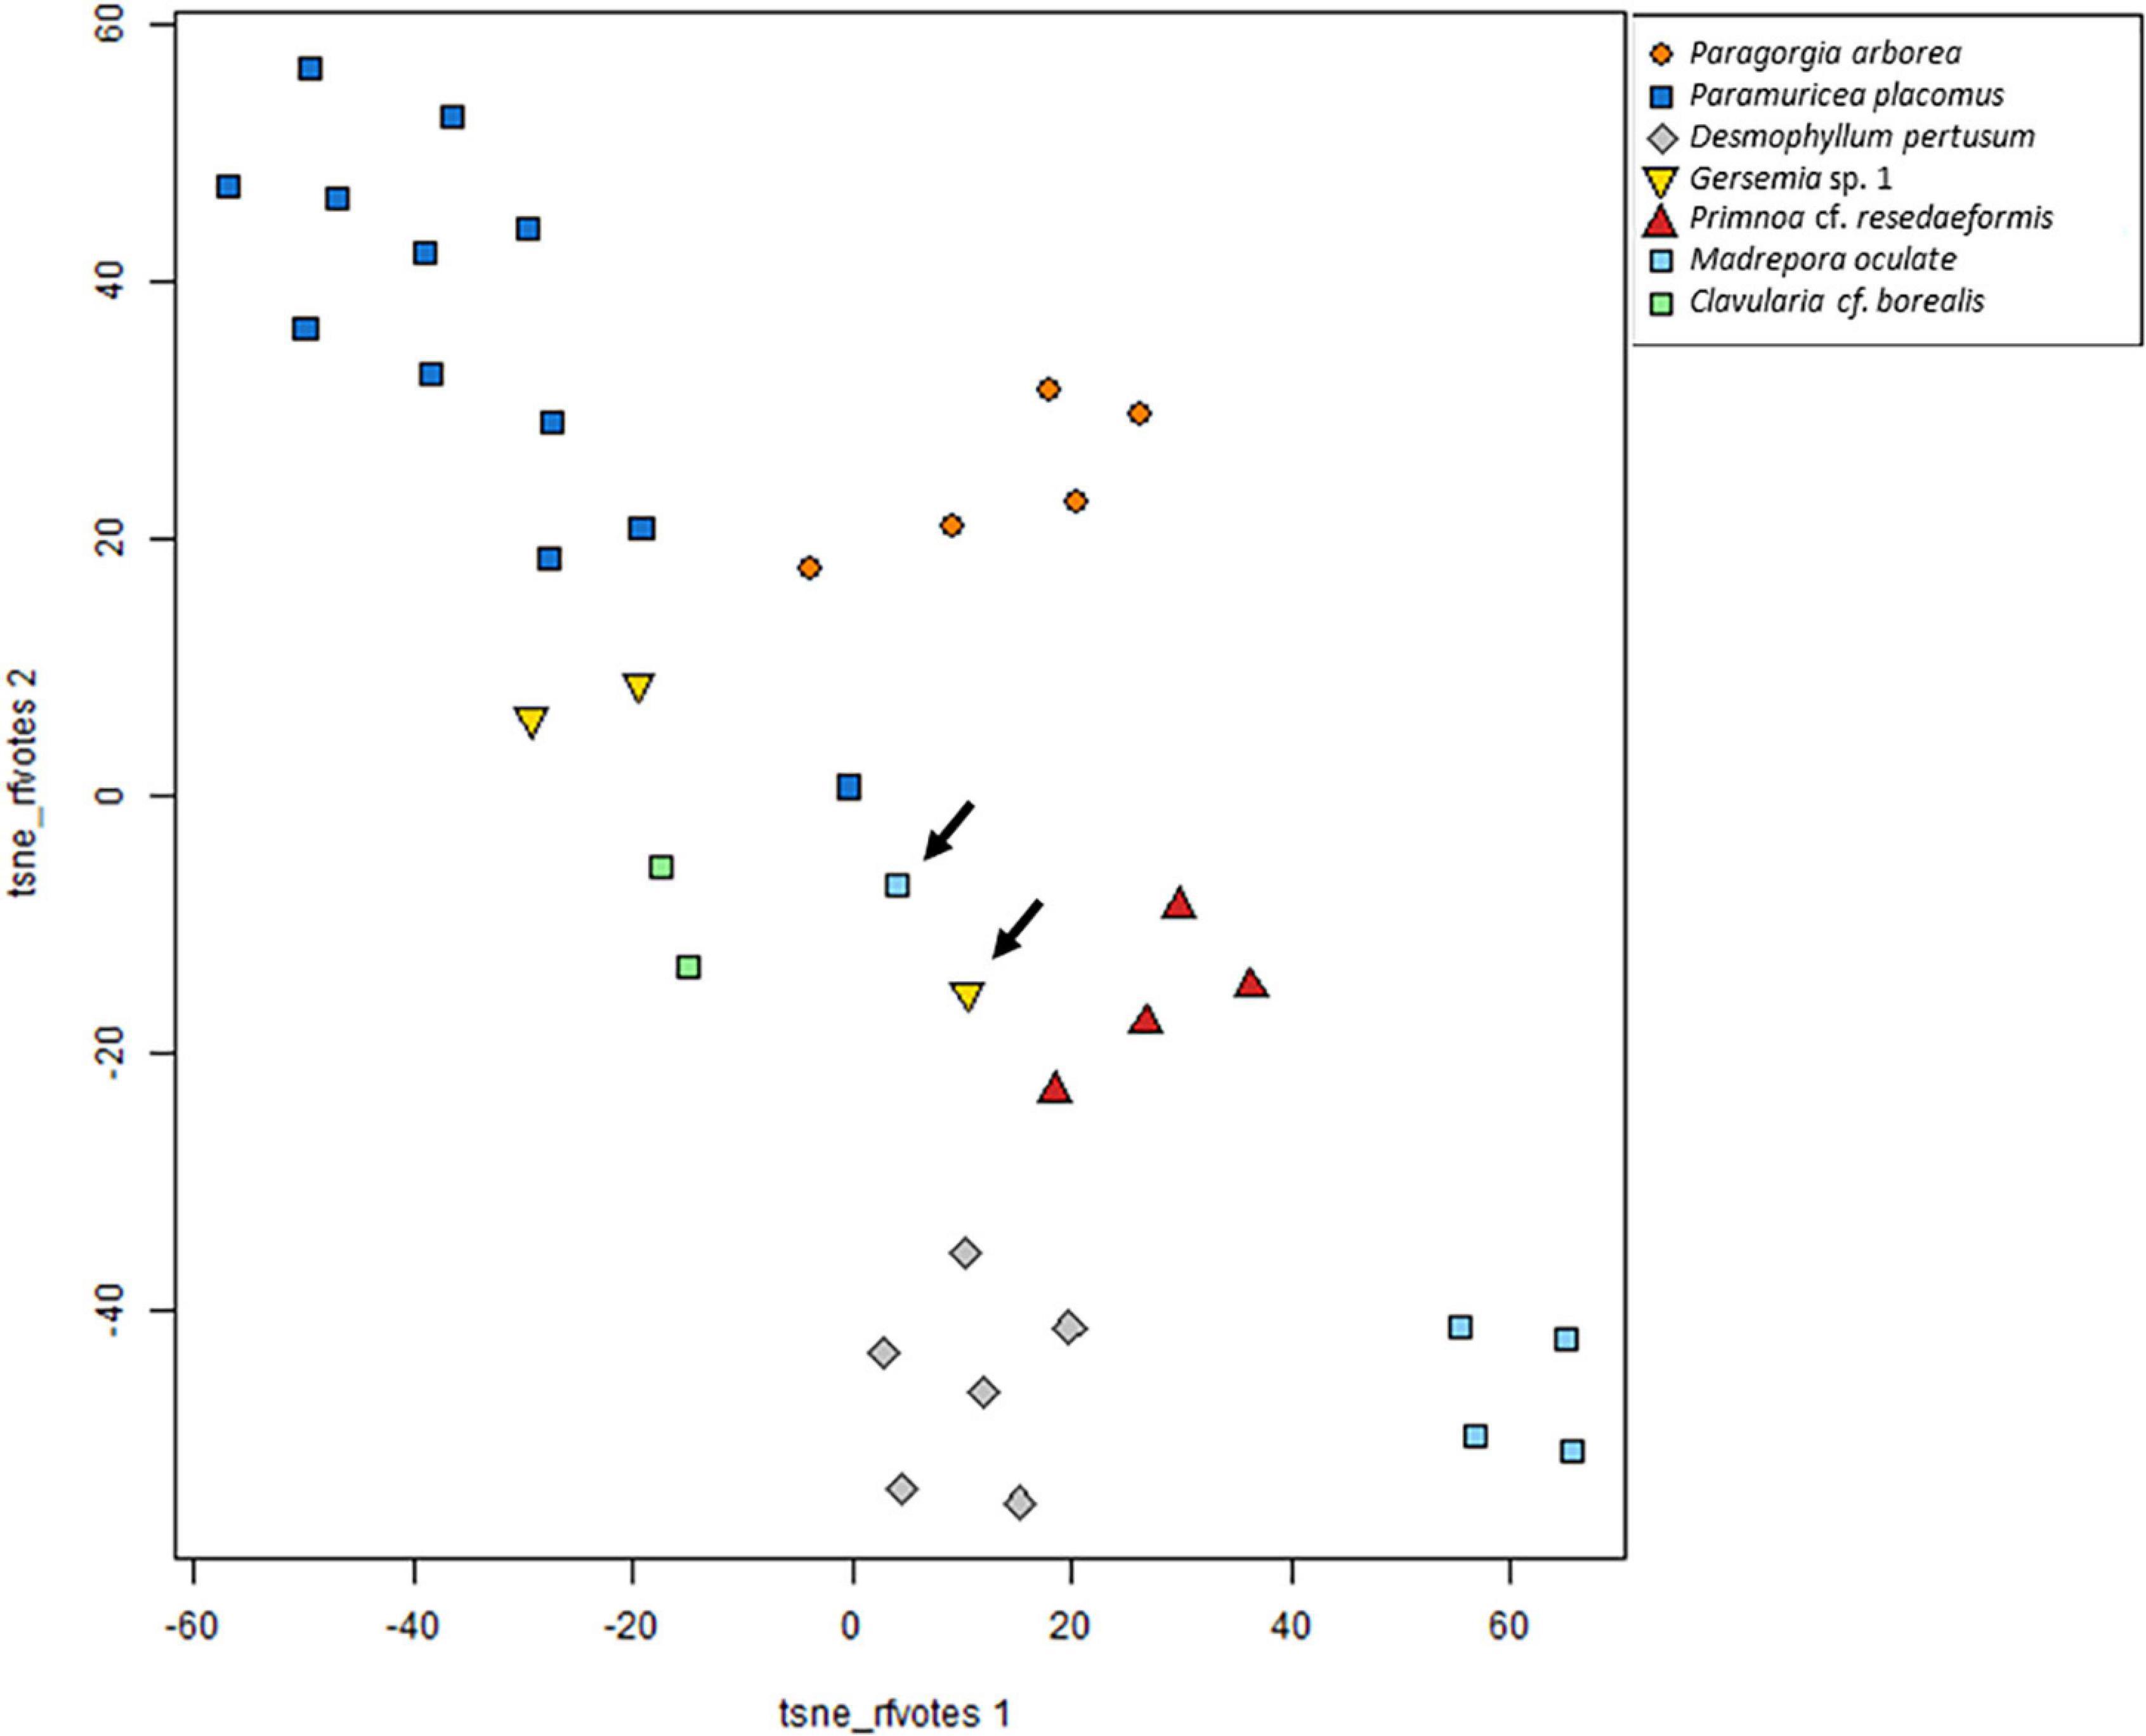
Figure 5. t-SNE plot of Hellinger transformed raw data including species for which at least two specimens were analyzed. In the graph, most species are concerted. Specimens located further away from conspecifics are also supported in hierarchical cluster analysis. Arrows indicate outliers of Madrepora oculata and Gersemia sp. 1.
In contrast to genetic methods, using proteome fingerprinting it was possible to distinguish between D. dianthus and D. pertusum (Figure 4). However, because D. dianthus was represented by only a single specimen, this difference would need to be further validated with additional data. Nevertheless, inspection of mass spectra by eye shows clear differences between the mass spectra for these two species (Figures 6A,B), which, in contrast to other ambiguously-clustering species, cannot be attributed to differences in mass spectra quality (Figures 6C,D).
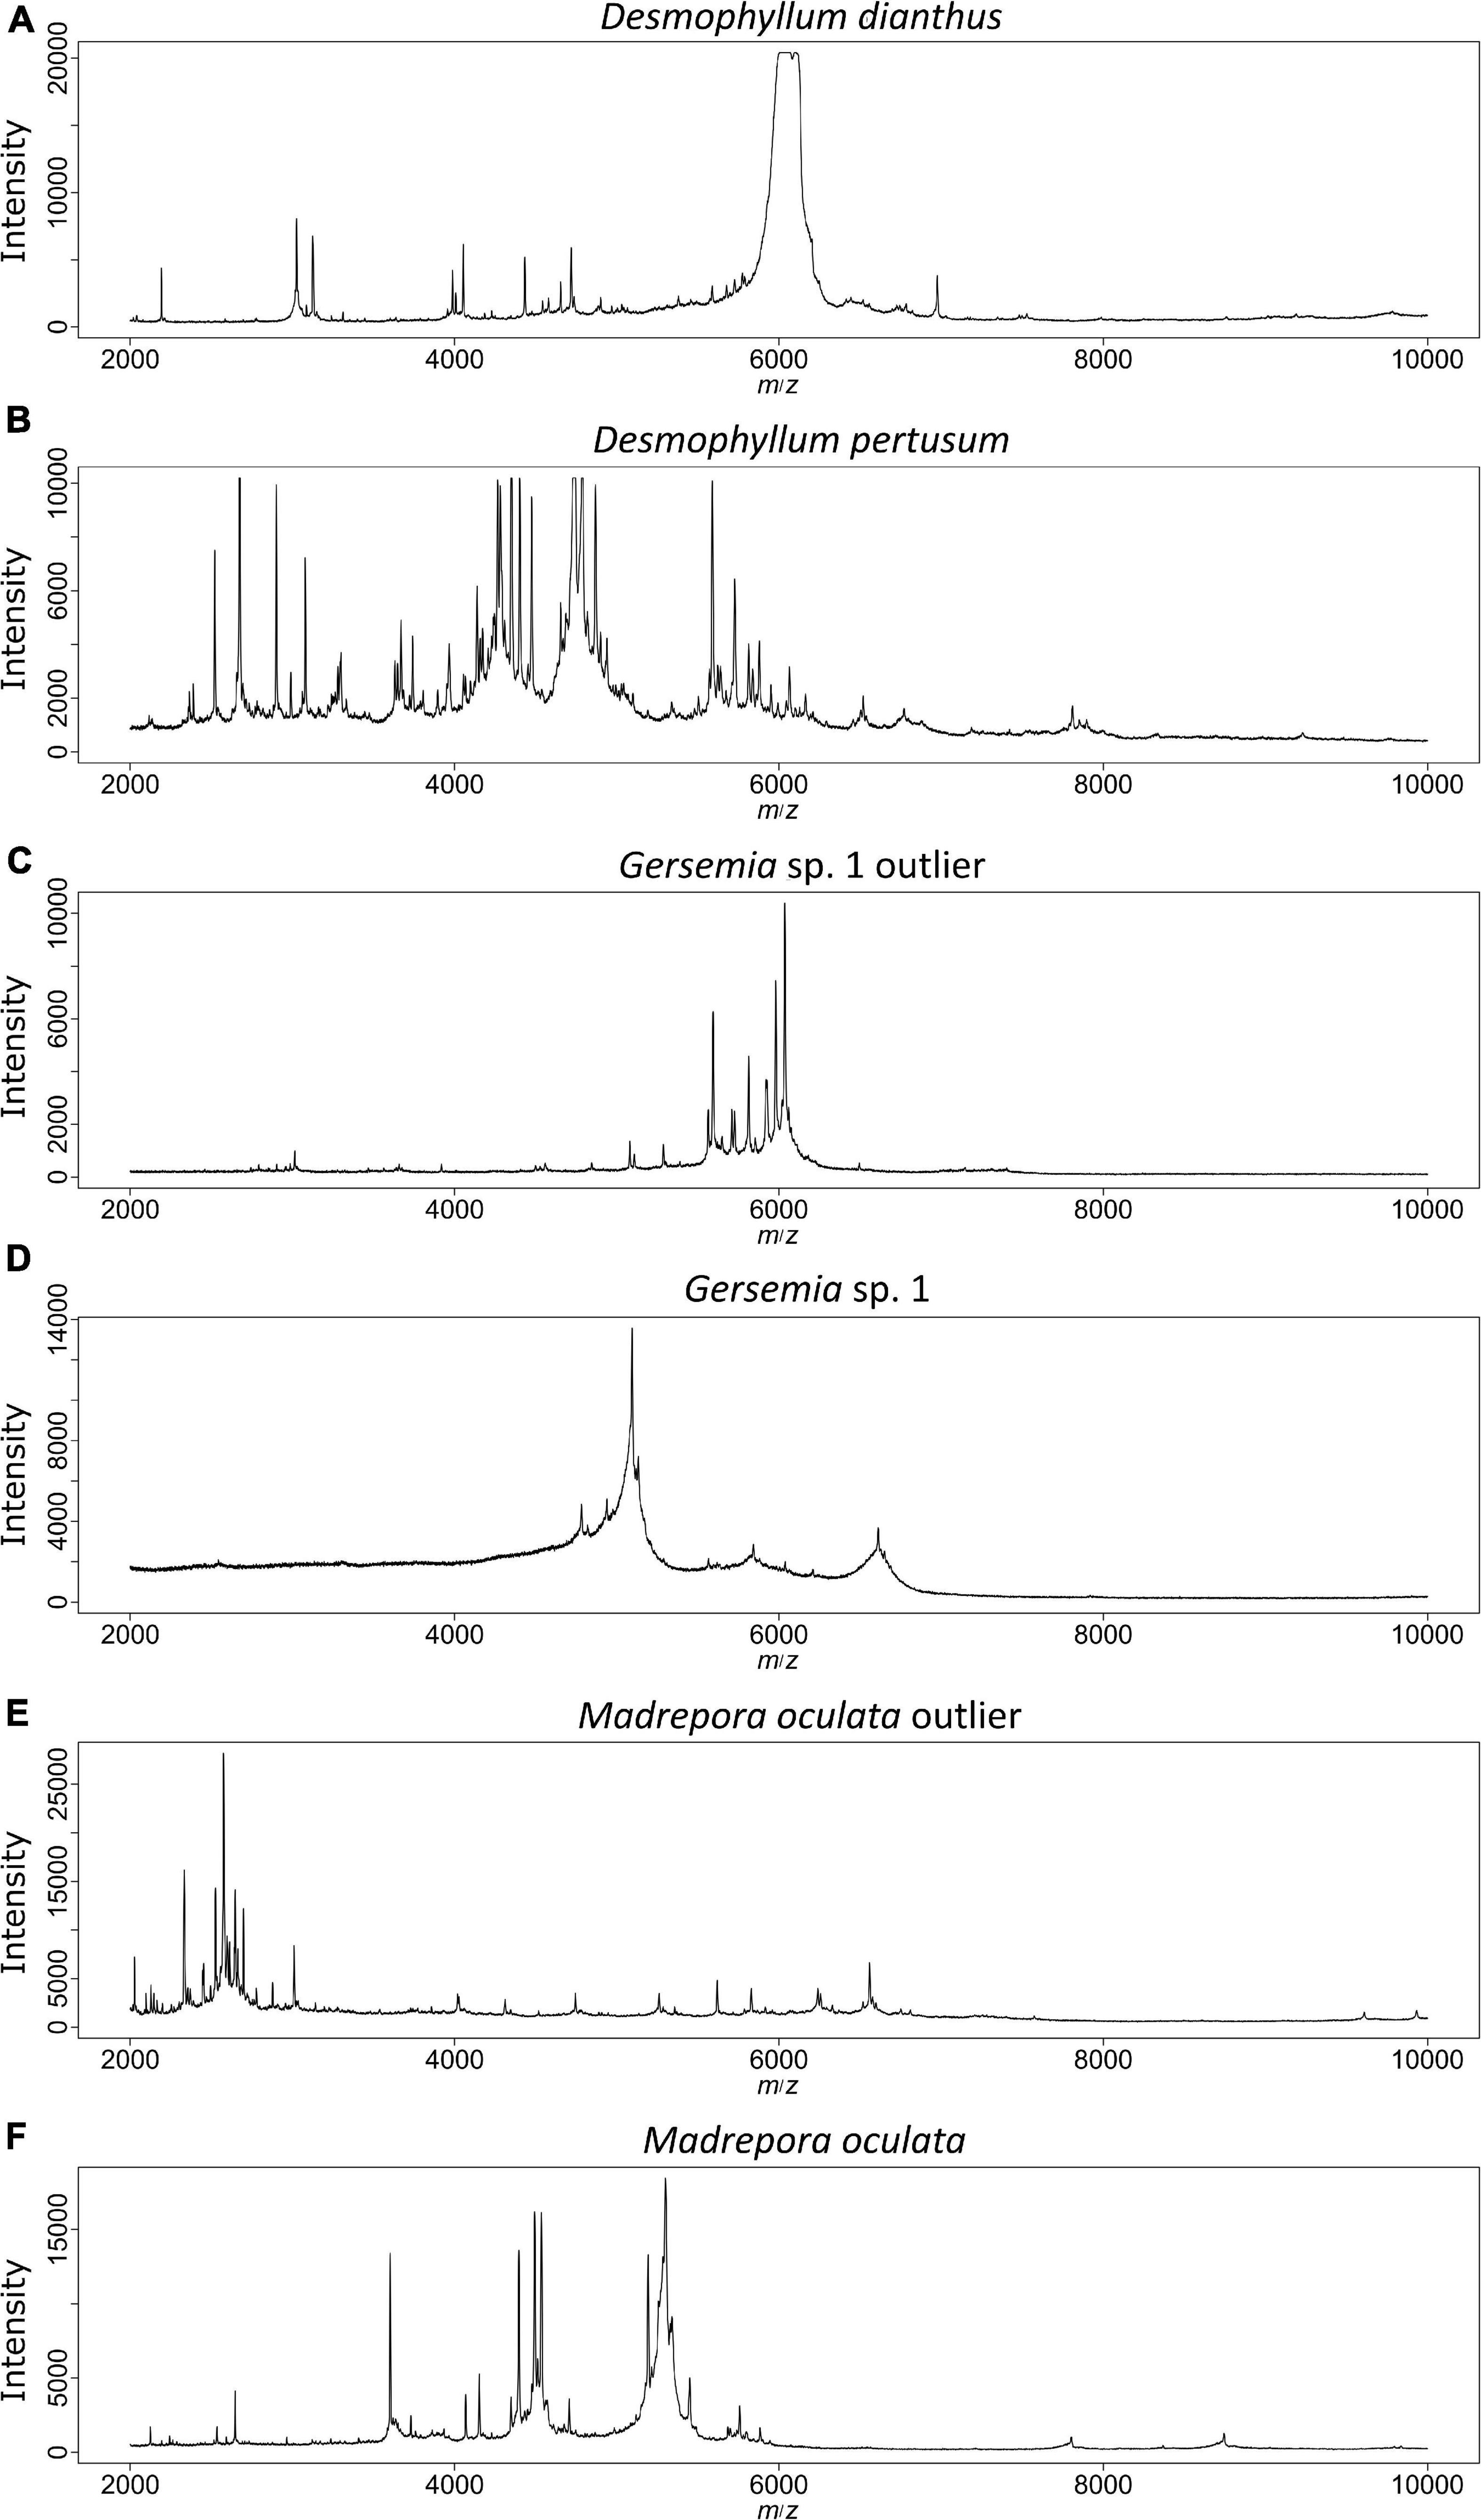
Figure 6. MALDI-TOF mass spectra for selected specimens. Panels (A,B) were obtained from the different Desmophyllum species emphasizing clear differences between species. Panels (C,D) are derived from Gersemia sp. 1 and panels (E,F) from M. oculata. For these species, outliers were detected (C,E), which compared to the remaining conspecifics (D,F), show higher quality signals. This probably caused problems in clustering and occasionally in RF models.
With this study, we aimed to answer the question of whether the proteomic MALDI-TOF MS analysis can serve as an alternative method for species discrimination of hexa- and octocorallian specimens. Therefore, sequences of mitochondrial (mtMutS and COI) and nuclear (ITS2 and 28S rDNA) genes were collected, uncorrected p-distances (data not shown) were compared, phylogenetic trees were generated by ML and Bayesian analyses, and species delimitations methods were performed. The molecular sequence analysis was used as a reference for the proteomic approach. Genetic and proteomic approaches led to successful species discrimination considering the available data.
The GMYC and ABGD species delimitation methods were unable to discriminate all morphospecies. The mtMutS sequence, which is reported to be more variable than the COI sequence (France and Hoover, 2002; McFadden et al., 2011), was insufficient for distinguishing Acanthogorgia sp. (cor527) from P. placomus for the species delimitation models. It is known that there are at least two different lineages within the genus Acanthogorgia, which differ by different mitochondrial sequences (McFadden et al., 2006). This complicates interspecific differentiation by mitochondrial DNA analyses and may reflect a lack of interspecific differentiation for the genera Paramuricea and Acanthogorgia. However, since we analyzed only one specimen of Acanthogorgia, we cannot confirm this assumption. The species studied here were assigned based on BLASTN results and general morphological characters. Therefore, it should be considered that both the specimen and the species identification method have an impact on the affiliation of this specimen. However, it should be noted that the interspecific divergence between Acanthogorgia sp. and P. placomus was below the interspecific divergence threshold (< 0.5%, uncorrected p-distance) commonly suggested for the marker (McFadden et al., 2011). Indeed, the low variability within the mitochondrial genome has been a difficult problem to solve in the search for a barcoding marker for Octocorallia since the problem of insufficient variation in the mtMutS gene is known from many different genera such as Primnoa Lamouroux, 1812 and Narella Gray, 1870 (Cairns and Baco, 2007; Cairns and Bayer, 2009). The ABGD results for the COI sequences showed lower resolution of species delimitation compared to the mtMutS sequences for the genus Gersemia, since the uncorrected p-distances between species (< 1.4%) were significantly lower than for the mtMutS sequences (< 7.7%). The slow rate of evolution of COI may also be the reason for the lack of species discrimination between D. pertusum and D. dianthus, which could not be discriminated by either ABGD or GMYC. The ABGD analyses were based on the individual alignments of the marker, whereas the GMYC analysis was based on the concatenated alignments. Therefore, the results of the GMYC analysis for species delimitation were considered to be more robust.
For the nuclear markers, the species delimitation methods gave slightly different results. This is due to the in general higher evolutionary rate of nuclear DNA, which makes these makers particularly useful for population genetics. This also makes the proposed delimitation more sensitive to intraspecific variation, which may lead to misinterpretation. However, in the case of the genus Gersemia and the members of the family Nephtheidae 1 and 2, species were not discriminated by the ABGD analysis of the ITS2 marker, although they were for the mitochondrial markers and 28S rDNA. Calderón et al. (2006) suggested that a lack of concerted evolution in ITS2 may be a potential problem that would disqualify this marker for phylogenetic and barcoding studies. It can be concluded that the markers mtMutS and 28S rDNA are the most suitable barcodes for genetic species discrimination, which is consistent with the conclusions of McFadden et al. (2017).
The amplification of mtMutS sequences was problematic for P. arborea and the three unidentified specimens of the family Nephtheidae, which we were unable to amplify using primers ND42599F (France and Hoover, 2002) and MUT3458R (Sánchez et al., 2003). Divergent gene order is known for the genus Paragorgia Milne Edwards, 1857 (Figueroa and Baco, 2014), and explains the failure to amplify mtMutS with these particular primers. It is supposed that all unidentified Nephtheidae belong to the genera Drifa Danielssen, 1887 and Duva Koren & Danielssen, 1883, but the available photographs are not sufficient for a concrete determination. These nephtheid species may also have mitochondrial genome rearrangements, and it has been suggested that they may lack the mtMutS gene (Muthye et al., 2022). The missing mtMutS sequences for these unidentified species of Nephtheidae may have contributed to the different tree topologies recovered from the ML and Bayesian analyses of the mitochondrial gene tree.
After the study of Holst et al. (2019), this is the second study employing MALDI-TOF MS for delimitation of cnidarians. Along with the results in that previous study, our study supports the successful use of MALDI-TOF MS for cnidarian species with strong, species-specific signals.
The clades from the molecular sequence analysis were also recovered in the hierarchical cluster analysis based on MALDI-TOF mass spectra. Here, P. placomus, P. arborea, M. oculata, C. cf. borealis, two specimens of Gersemia sp. 1, as well as P. cf. resedaeformis and D. pertusum were found in distinct clusters. Thus, a library with a sufficient number of spectra for all species, respectively, would probably also allow the supervised identification of unknown specimens using either reference library based approaches such as RF or factory delivered software such as the Bruker Biotyper as was shown in previous studies on metazoans with high success rates (Bode et al., 2017; Kaiser et al., 2018; Rossel and Martínez Arbizu, 2019; Rossel et al., 2019, 2021; Wilke et al., 2020; Paulus et al., 2021; Renz et al., 2021). Unfortunately, some species in our analysis were represented with an insufficient number of specimens, resulting in a mixed cluster of species that lacked conspecifics for comparison (Figure 4, cluster CX). However, the mixed cluster CX also contained species that were represented with multiple specimens in the other clusters. In previous studies it was observed that different developmental stages and especially signal alteration due to fixation, storage and thus quality issues may be reflected in cluster analyses by specimens being placed in clusters aside of the main-species clusters (e.g., Karger et al., 2012; Laakmann et al., 2013; Steinmann et al., 2013; Rossel and Martínez Arbizu, 2018b,2019). Changes due to quality loss may, however, remain unrecognized as long as overall spectrum quality still meets basic quality measures such as low noises and good signal intensities. However, in previous studies, even though quality issues may have affected clustering, changes were found stable across several conspecific specimens (Rossel and Martínez Arbizu, 2019). One of these unmatched specimens was cor23 (Figure 6E), belonging to M. oculata. Whereas the spectrum seems to be of high quality, it appears very different compared to the spectra of the remaining specimens (Figure 6F). So far, these differences remain unexplainable to us. Aside from mass spectra-quality differences, some authors have shown that different tissue types result in different protein mass spectra, and thus cluster by tissue type rather than species (Vega-Rúa et al., 2018). Even though we attempted to use the same tissue type for each spectrum, this may explain the observed differences.
The adverse effect of storage under suboptimal conditions has been investigated several times, and authors report significant changes in detected mass peaks, intensities and identification scores (Mathis et al., 2015; Nebbak et al., 2017; Rossel and Martínez Arbizu, 2018b; Vega-Rúa et al., 2018; Wendel et al., 2021). Even though specimens were stored correctly to the best of our knowledge, signal degeneration was observed in Gersemia sp. 1 resulting in one specimen with a signal that was different from the others. However, the outlier specimen (Figure 6C) shows a good quality signal whereas the others resulted in less pronounced mass peaks and lower numbers of peaks (Figure 6D). Thus, the outlying specimen is likely the one showing higher quality. At the same time, this implies a common degeneration of spectra for different specimens of the same species.
Interestingly, the analysis was able to find differences in the signals between the specimens of D. pertusum and the singleton of D. dianthus, cor37. Even though D. dianthus is only represented with one specimen, the results suggest MALDI-TOF MS may discriminate between these two species. Addamo et al. (2016) showed that the mitochondrial genomes of D. dianthus and D. pertusum are 99.88% similar, which makes it difficult to discriminate them. They were not able to distinguish between these two species with genetic methods. Here, MALDI-TOF MS may be a more reliable tool than the molecular methods so far, but further specimens must be tested to evaluate these suggestions. However, the analysis with the MALDI-TOF MS does not allow evolutionary inferences of the different species. To date, referring to proteome fingerprinting of metazoans, only a single study reported to have found some kind of phylogenetic signal. However, in the study on Drosophila species, it was also reported that this was only true for a fraction of the analyzed species (Feltens et al., 2010). Therefore, the cluster analysis and the t-SNE plot do not distinguish between Hexa- and Octocorallia. For a valid species delimitation by the MALDI-TOF MS more individuals of the species must be tested and compared. In addition, the protocols should be refined to see if the different tissue types of corals influence the spectra, and thus on the results of this analysis.
Nevertheless, MALDI-TOF MS offers an attractive method for species delimitation, particularly due to its cost-effectiveness. Rossel et al. (2019) compared this method with COI barcoding in terms of costs and found that MALDI-TOF MS is more than ten times cheaper than COI barcoding. While MALDI-TOF MS costs about 0.42€ to analyze a sample, analysis by COI barcoding costs about 5.65€. While absolute numbers have to be taken with caution, the general cost-effectiveness was shown by several studies (e.g., Tan et al., 2012 and Tran et al., 2015). For pure biodiversity surveys this method could be more suitable, especially in times of limited funding and resources.
In this study, 17 of the 18 morphospecies that were identified could be differentiated by genetic methods. For this, two mitochondrial gene segments (mtMutS and COI), as well as two nuclear gene segments (ITS2 and 28S rDNA) were used. The resulting gene trees are for the most part congruent. The proteomic analysis could distinguish seven species with certainty and did not contradict the genetic results. Sample sizes were problematic for some species so references were lacking, and the species-specificity of signals for unique or low abundance species could not be confirmed. In conclusion, this proteomic analysis is a promising tool for species discrimination of hexa- and octocorals, but a sufficiently large number of specimens is needed to provide good reference spectra. In addition, genetic and morphological approaches are still needed to verify species differentiation with confidence. In the future, however, once reference databases of spectra are available species differentiation may be accomplished by MALDI-TOF MS alone, and mismatched specimens would still be able to be identified by genetic methods. MALDI-TOF MS would then allow much faster and cheaper species differentiation than molecular and morphological methods.
The datasets presented in this study can be found in online repositories. The names of the repository/repositories and accession number(s) can be found below: https://datadryad.org/stash, 10.5061/dryad.hdr7sqvk0; https://boldsystems.org/, 10.5883/DS-PGCNA.
SK, SR, SB, and PM conceived and designed the study. SK and SB collected specimens. SK and SR conducted laboratory activities, analyzed the data, and did the illustrations. SK wrote the manuscript. SR, SB, CM, SÓ, and PM contributed essential parts of the manuscript. All authors read and approved the manuscript.
SB received funding for collecting and processing samples during the expeditions MSM75 (IceAGE_RR) under grant no MerMet17-15 via the German Science Foundation (DFG) and SO279 (IceAGE3; MerMet17-06) via the DFG and the Federal Ministry of Education and Research (BMBF).
The authors declare that the research was conducted in the absence of any commercial or financial relationships that could be construed as a potential conflict of interest.
All claims expressed in this article are solely those of the authors and do not necessarily represent those of their affiliated organizations, or those of the publisher, the editors and the reviewers. Any product that may be evaluated in this article, or claim that may be made by its manufacturer, is not guaranteed or endorsed by the publisher.
We would like to thank the crew of the research vessels MS MERIAN and SONNE, as well as the pilots of the ROV Kiel 6000 and ROV Phoca for all the efforts in taking the samples. Furthermore, Angelina Eichsteller from the DZMB is acknowledged for the support of the laboratory work. We would also like to thank Guðmundur Guðmundson from the Natural History Museum (Reykjavik) for sending our samples from Iceland and taking care of the museum storage of the coral samples from the IceAGE expeditions in Iceland. This is publication number 83 from the Senckenberg am Meer Metabarcoding and Molecular Laboratory and number 17 from the Senckenberg am Meer Proteomic Laboratory.
The Supplementary Material for this article can be found online at: https://www.frontiersin.org/articles/10.3389/fmars.2022.838201/full#supplementary-material
Addamo, A. M., Vertino, A., Stolarski, J., García-Jiménez, R., Taviani, M., and Machordom, A. (2016). Merging scleractinian genera: the overwhelming genetic similarity between solitary Desmophyllum and colonial Lophelia. BMC Evol. Biol. 16:108. doi: 10.1186/s12862-016-0654
Altschul, S. F., Gish, W., Miller, W., Myers, E. W., and Lipman, D. J. (1990). Basic local alignment search tool. J. Mol. Biol. 215, 403–410. doi: 10.1016/S0022-2836(05)80360-2
Arrigoni, R., Benzoni, F., Huang, D., Fukami, H., Chen, C. A., Berumen, M. L., et al. (2016a). When forms meet genes: revision of the scleractinian genera Micromussa and Homophyllia (Lobophylliidae) with a description of two new species and one new genus. Contrib. Zool. 85, 387–422. doi: 10.1163/18759866-08504002
Arrigoni, R., Berumen, M. L., Chen, C. A., Terraneo, T. I., Baird, A. H., Payri, C., et al. (2016b). Species delimitation in the reef coral genera Echinophyllia and Oxypora (Scleractinia, Lobophylliidae) with a description of two new species. Mol. Phylogen. Evol. 105, 146–159. doi: 10.1016/j.ympev.2016.08.023
Arrigoni, R., Berumen, M. L., Mariappan, K. G., Beck, P. S., Hulver, A. M., Montano, S., et al. (2020). Towards a rigorous species delimitation framework for scleractinian corals based on RAD sequencing: the case study of Leptastrea from the Indo-Pacific. Coral Reefs 39, 1001–1025. doi: 10.1007/s00338-020-01924-8
Baco, A. R., and Cairns, S. D. (2012). Comparing molecular variation to morphological species designations in the deep-sea coral Narella reveals new insights into seamount coral ranges. PLoS One 2012:45555. doi: 10.1371/journal.pone.0045555
Bode, M., Laakmann, S., Kaiser, P., Hagen, W., Auel, H., and Cornils, A. (2017). Unravelling diversity of deep-sea copepods using integrated morphological and molecular techniques. J. Plankton Res. 39, 600–617. doi: 10.1093/plankt/fbx031
Bucklin, A., Steinke, D., and Blanco-Bercial, L. (2011). DNA barcoding of marine metazoa. Annu. Rev. Mar. Sci. 3, 471–508. doi: 10.1146/annurev-marine-120308-080950
Cairns, S. D. (1999). Species richness of recent Scleractinia. Atoll Res. Bull. 459, 1–46. doi: 10.5479/si.00775630.459.1
Cairns, S. D. (2007). Deep-water corals: an overview with special reference to diversity and distribution of deep-water scleractinian corals. Bull. Mar. Sci. 81, 311–322.
Cairns, S. D., and Baco, A. (2007). Review and five new Alaskan species of the deep-water octocoral Narella (Octocorallia: Primnoidae). Syst. Biodivers. 5, 391–407. doi: 10.1017/S1477200007002472
Calderaro, A., Arcangeletti, M.-C., Rodighiero, I., Buttrini, M., Gorrini, C., Motta, F., et al. (2014). Matrix-assisted laser desorption/ionization time-of-flight (MALDI-TOF) mass spectrometry applied to virus identification. Sci. Rep. 4, 1–10. doi: 10.1038/srep06803
Calderón, I., Garrabou, J., and Aurelle, D. (2006). Evaluation of the utility of COI and ITS markers as tools for population genetic studies of temperate gorgonians. J. Exp. Mar. Biol. Ecol. 336, 184–197. doi: 10.1016/j.jembe.2006.05.006
Daly, M., Brugler, M. R., Cartwright, P., Collins, A. G., Dawson, M. N., Fautin, D. G., et al. (2007). The phylum Cnidaria: a review of phylogenetic patterns and diversity 300 years after Linnaeus. Zootaxa 1668, 127–182. doi: 10.5281/zenodo.180149
Darriba, D., Taboada, G. L., Doallo, R., and Posada, D. (2012). jModelTest 2: more models, new heuristics and parallel computing. Nat. Methods 9, 772–772. doi: 10.1038/nmeth.2109
Drummond, A. J., and Rambaut, A. (2007). BEAST: Bayesian evolutionary analysis by sampling trees. BMC Evol. Biol. 7:214. doi: 10.1186/1471-2148-7-214
Fabricius, K., and Alderslade, P. (2001). Soft corals and sea fans: a comprehensive guide to the shallow-water genera of the central–west Pacific, the Indian Ocean and the Red Sea. Townsville: Australian Institute of Marine Science.
Feltens, R., Görner, R., Kalkhof, S., Gröger-Arndt, H., and von Bergen, M. (2010). Discrimination of different species from the genus Drosophila by intact protein profiling using matrix-assisted laser desorption ionization mass spectrometry. BMC Evol. Biol. 10:1. doi: 10.1186/1471-2148-10-95
Figueroa, D. F., and Baco, A. R. (2014). Complete mitochondrial genomes elucidate phylogenetic relationships of the deep-sea octocoral families Coralliidae and Paragorgiidae. Deep-Sea Res. II: Top. Stud. Oceanogr. 99, 83–91. doi: 10.1016/j.dsr2.2013.06.001
Flot, J. F., Tillier, A., Samadi, S., and Tillier, S. (2006). Phase determination from direct sequencing of length-variable DNA regions. Mol. Ecol. Notes 6, 627–630. doi: 10.1111/j.1471-8286.2006.01355.x
France, S. C., and Hoover, L. L. (2002). DNA sequences of the mitochondrial COI gene have low levels of divergence among deep-sea octocorals (Cnidaria: Anthozoa). Hydrobiologia 471, 149–155. doi: 10.1023/A:1016517724749
Fujisawa, T., and Barraclough, T. G. (2013). Delimiting species using single-locus data and the Generalized Mixed Yule Coalescent approach: a revised method and evaluation on simulated data sets. Syst. Biol. 62, 707–724. doi: 10.1093/sysbio/syt033
Fukami, H., Chen, C. A., Budd, A. F., Collins, A., Wallace, C., Chuang, Y.-Y., et al. (2008). Mitochondrial and nuclear genes suggest that stony corals are monophyletic but most families of stony corals are not (Order Scleractinia, Class Anthozoa, Phylum Cnidaria). PloS one 3:e3222. doi: 10.1371/journal.pone.0003222
Geller, J., Meyer, C., Parker, M., and Hawk, H. (2013). Redesign of PCR primers for mitochondrial cytochrome c oxidase subunit I for marine invertebrates and application in all-taxa biotic surveys. Mol. Ecol. Resour. 13, 851–861. doi: 10.1111/1755-0998.12138
Gibb, S. (2015). MALDIquantForeign: Import/Export Routines for MALDIquant. A Package for R. Available online at: https://CRAN.R-project.org/package=MALDIquantForeign (accessed June 10, 2021).
Gibb, S., and Korbinian, S. (2012). MALDIquant: a versatile R package for the analysis of mass spectrometry data. Bioinformatics 28, 2270—-2271. doi: 10.1093/bioinformatics/bts447
Guindon, S., and Gascuel, O. (2003). A simple, fast, and accurate algorithm to estimate large phylogenies by maximum likelihood. Syst. Biol. 52, 696–704. doi: 10.1080/10635150390235520
Hebert, P. D., Cywinska, A., Ball, S. L., and Dewaard, J. R. (2003). Biological identifications through DNA barcodes. Proc. Royal Soc. B 270, 313–321. doi: 10.1098/rspb.2002.2218
Holst, S., Heins, A., and Laakmann, S. (2019). Morphological and molecular diagnostic species characters of Staurozoa (Cnidaria) collected on the coast of Helgoland (German Bight, North Sea). Mar. Biodivers. 49, 1775–1797. doi: 10.1007/s12526-019-00943-1
Hou, Z., Fu, J., and Li, S. (2007). A molecular phylogeny of the genus Gammarus (Crustacea: Amphipoda) based on mitochondrial and nuclear gene sequences. Mol. Phylogen. Evol. 45, 596–611. doi: 10.1016/j.ympev.2007.06.006
Huang, D., Meier, R., Todd, P. A., and Chou, L. M. (2008). Slow mitochondrial COI sequence evolution at the base of the metazoan tree and its implications for DNA barcoding. J. Mol. Evol. 66, 167–174. doi: 10.1007/s00239-008-9069-5
Kaiser, P., Bode, M., Cornils, A., Hagen, W., Martínez Arbizu, P., Auel, H., et al. (2018). High-resolution community analysis of deep-sea copepods using MALDI-TOF protein fingerprinting. Deep-Sea Res. I: Oceanogr. Res. Pap. 138, 122–130. doi: 10.1016/j.dsr.2018.06.005
Karger, A., Kampen, H., Bettin, B., Dautel, H., Ziller, M., Hoffmann, B., et al. (2012). Species determination and characterization of developmental stages of ticks by whole-animal matrix-assisted laser desorption/ionization mass spectrometry. Ticks Tick Borne Dis. 3, 78–89. doi: 10.1016/j.ttbdis.2011.11.002
Katoh, K., Asimenos, G., and Toh, H. (2009). Multiple alignment of DNA sequences with MAFFT in Bioinformatics for DNA sequence analysis. Berlin: Springer, 39–64.
Keshavmurthy, S., Yang, S.-Y., Alamaru, A., Chuang, Y.-Y., Pichon, M., Obura, D., et al. (2013). DNA barcoding reveals the coral “laboratory-rat”, Stylophora pistillata encompasses multiple identities. Sci. Rep. 3, 1–7. doi: 10.1038/srep01520
Krijthe, J. H., and Van der Maaten, L. (2015). Rtsne: T-distributed stochastic neighbor embedding using Barnes-Hut implementation. R package version 0.13.
Kürzel, K., Kaiser, S., Lorz, A.-N., Rossel, S., Paulus, E., Peters, J., et al. (2022). Correct Species Identification and Its Q12 Implications for Conservation Using Haploniscidae (Crustacea, Isopoda) in Icelandic Waters as a Proxy. Front. Mar. Sci. 2022:79519O6. doi: 10.3389/fmars.2021.795196
Laakmann, S., Gerdts, G., Erler, R., Knebelsberger, T., Martínez Arbizu, P., and Raupach, M. J. (2013). Comparison of molecular species identification for North Sea calanoid copepods (Crustacea) using proteome fingerprints and DNA sequences. Mol. Ecol. Resour. 13, 862–876. doi: 10.1111/1755-0998.12139
Legendre, P., and Gallagher, E. D. (2001). Ecologically meaningful transformations for ordination of species data. Oecologia 129, 271–280. doi: 10.1007/s004420100716
Lobo, J., Costa, P. M., Teixeira, M. A., Ferreira, M. S., Costa, M. H., and Costa, F. O. (2013). Enhanced primers for amplification of DNA barcodes from a broad range of marine metazoans. BMC Ecol. 13, 1–8. doi: 10.1186/1472-6785-13-34
Mathis, A., Depaquit, J., Dvořák, V., Tuten, H., Bañuls, A. L., Halada, P., et al. (2015). Identification of phlebotomine sand flies using one MALDI-TOF MS reference database and two mass spectrometer systems. Parasit. Vect. 8:266. doi: 10.1186/s13071-015-0878-2
Mazzeo, M. F., Giulio, B. D., Guerriero, G., Ciarcia, G., Malorni, A., Russo, G. L., et al. (2008). Fish authentication by MALDI-TOF mass spectrometry. J. Agric. Food Chem. 56, 11071–11076. doi: 10.1021/jf8021783
McFadden, C. S., Benayahu, Y., Pante, E., Thoma, J. N., Nevarez, P. A., and France, S. C. (2011). Limitations of mitochondrial gene barcoding in Octocorallia. Mol. Ecol. Resour. 11, 19–31. doi: 10.1111/j.1755-0998.2010.02875.x
McFadden, C. S., France, S. C., Sánchez, J. A., and Alderslade, P. (2006). A molecular phylogenetic analysis of the Octocorallia (Cnidaria: Anthozoa) based on mitochondrial protein-coding sequences. Mol. Phylogen. Evol. 41, 513–527. doi: 10.1016/j.ympev.2006.06.010
McFadden, C. S., Haverkort-Yeh, R., Reynolds, A. M., Halàsz, A., Quattrini, A. M., Forsman, Z. H., et al. (2017). Species boundaries in the absence of morphological, ecological or geographical differentiation in the Red Sea octocoral genus Ovabunda (Alcyonacea: Xeniidae). Mol. Phylogen. Evol. 112, 174–184. doi: 10.1016/j.ympev.2017.04.025
McFadden, C. S., Brown, A. S., Brayton, C., Hunt, C. B., and van Ofwegen, L. P. (2014). Application of DNA barcoding to biodiversity studies of shallow-water octocorals: molecular proxies agree with morphological estimates of species richness in Palau. Coral Reefs 33, 275–286. doi: 10.1007/s00338-013-1123-0
McFadden, C. S., Sánchez, J. A., and France, S. C. (2010). Molecular phylogenetic insights into the evolution of Octocorallia: a review. Integr. Comp. Biol. 50, 389–410. doi: 10.1093/icb/icq056
McFadden, C. S., and van Ofwegen, L. P. (2013). A second, cryptic species of the soft coral genus Incrustatus (Anthozoa: Octocorallia: Clavulariidae) from Tierra del Fuego, Argentina, revealed by DNA barcoding. Helgol. Mar. Res. 67, 137–147. doi: 10.1007/s10152-012-0310-7
Muthye, V., Mackereth, C. D., Stewart, J. B., and Lavrov, D. V. (2022). Large dataset of octocoral mitochondrial genomes provides new insights into mt-mutS evolution and function. DNA Repair 110:103273. doi: 10.1016/j.dnarep.2022.103273
Nebbak, A., El Hamzaoui, B., Berenger, J.-M., Bitam, I., Raoult, D., Almeras, L., et al. (2017). Comparative analysis of storage conditions and homogenization methods for tick and flea species for identification by MALDI-TOF MS. Med. Vet. Entomol. 31, 438–448. doi: 10.1111/mve.12250
Nguyen, L.-T., Schmidt, H. A., Von Haeseler, A., and Minh, B. Q. (2015). IQ-TREE: a fast and effective stochastic algorithm for estimating maximum-likelihood phylogenies. Mol. Biol. Evol. 32, 268–274. doi: 10.1093/molbev/msu300
Pante, E., Abdelkrim, J., Viricel, A., Gey, D., France, S., Boisselier, M.-C., et al. (2015). Use of RAD sequencing for delimiting species. Heredity 114, 450–459.
Patel, R. (2019). A moldy application of MALDI: MALDI-ToF mass spectrometry for fungal identification. J. Fungi 5:4. doi: 10.3390/jof5010004
Paulus, E., Brix, S., Siebert, A., Martínez Arbizu, P., Rossel, S., Peters, J., et al. (2021). Recent speciation and hybridization in Icelandic deep-sea isopods: an integrative approach using genomics and proteomics. Mol. Ecol. 2021:16234. doi: 10.1111/mec.16234
Quattrini, A. M., Wu, T., Soong, K., Jeng, M.-S., Benayahu, Y., and McFadden, C. S. (2019). A next generation approach to species delimitation reveals the role of hybridization in a cryptic species complex of corals. BMC Evol. Biol. 19, 1–19. doi: 10.1186/s12862-019-1427-y
Quek, Z. R., and Huang, D. (2021). Application of phylogenomic tools to unravel anthozoan evolution. Coral Reefs 2021, 1–21. doi: 10.1007/s00338-021-02072-3
Renz, J., Markhaseva, E. L., Laakmann, S., Rossel, S., Martinez Arbizu, P., and Peters, J. (2021). Proteomic fingerprinting facilitates biodiversity assessments in understudied ecosystems: a case study on integrated taxonomy of deep sea copepods. Mol. Ecol. Resour. 2021:13405. doi: 10.1111/1755-0998.13405
Rossel, S., and Martínez Arbizu, P. (2019). Revealing higher than expected diversity of Harpacticoida (Crustacea: Copepoda) in the North Sea using MALDI-TOF MS and molecular barcoding. Sci. Rep. 9, 1–14. doi: 10.1038/s41598-019-45718-7
Rossel, S., Barco, A., Kloppmann, M., Martínez Arbizu, P., Huwer, B., and Knebelsberger, T. (2021). Rapid species level identification of fish eggs by proteome fingerprinting using MALDI-TOF MS. J. Proteom. 231:103993. doi: 10.1016/j.jprot.2020.103993
Rossel, S., Khodami, S., and Martínez Arbizu, P. (2019). Comparison of rapid biodiversity assessment of meiobenthos using MALDI-TOF MS and metabarcoding. Front. Mar. Sci. 6:659. doi: 10.3389/fmars.2019.00659
Rossel, S., and Martínez Arbizu, P. (2018a). Automatic specimen identification of Harpacticoids (Crustacea: Copepoda) using Random Forest and MALDI-TOF mass spectra, including a post hoc test for false positive discovery. Methods Ecol. Evol. 9, 1421–1434. doi: 10.1111/2041-210X.13000
Rossel, S., and Martínez Arbizu, P. (2018b). Effects of sample fixation on specimen identification in biodiversity assemblies based on proteomic data (MALDI-TOF). Front. Mar. Sci. 5:149. doi: 10.3389/fmars.2018.00149
Ryan, C., Clayton, E., Griffin, W., Sie, S., and Cousens, D. (1988). SNIP, a statistics-sensitive background treatment for the quantitative analysis of PIXE spectra in geoscience applications. Nucl. Instrum. Methods Phys. Res. B 34, 396–402. doi: 10.1016/0168-583X(88)90063-8
Sánchez, J., McFadden, C., France, S., and Lasker, H. (2003). Molecular phylogenetic analyses of shallow-water Caribbean octocorals. Mar. Biol. 142, 975–987. doi: 10.1007/s00227-003-1018-7
Savitzky, A., and Golay, M. J. (1964). Smoothing and differentiation of data by simplified least squares procedures. Anal. Chem. 36, 1627–1639.
Shearer, T., and Coffroth, M. (2008). DNA BARCODING: Barcoding corals: limited by interspecific divergence, not intraspecific variation. Mol. Ecol. Resour. 8, 247–255. doi: 10.1111/j.1471-8286.2007.01996.x
Singhal, N., Kumar, M., Kanaujia, P. K., and Virdi, J. S. (2015). MALDI-TOF mass spectrometry: an emerging technology for microbial identification and diagnosis. Front. Microbiol. 6:791. doi: 10.3389/fmicb.2015.00791
Steinmann, I. C., Pflüger, V., Schaffner, F., Mathis, A., and Kaufmann, C. (2013). Evaluation of matrix-assisted laser desorption/ionization time of flight mass spectrometry for the identification of ceratopogonid and culicid larvae. Parasitology 140, 318–327. doi: 10.1017/S0031182012001618
Swofford, D. L. (2003). PAUP*. Phylogenetic analysis using parsimony (* and other methods). Version 4.
Tan, K. E., Ellis, B. C., Lee, R., Stamper, P. D., Zhang, S. X., and Carroll, K. C. (2012). Prospective evaluation of a matrix-assisted laser desorption ionization-time of flight mass spectrometry system in a hospital clinical microbiology laboratory for identification of bacteria and yeasts: A bench-by-bench study for assessing the impact on time to identification and cost-effectiveness. J. Clin. Microbiol. 50, 3301–3308. doi: 10.1128/JCM.01405-12
Tran, A., Alby, K., Kerr, A., Jones, M., and Gilligan, P. H. (2015). Cost savings realized by implementation of routine microbiological identification by matrix-assisted laser desorption ionization-time of flight mass spectrometry. J. Clin. Microbiol. 53, 2473–2479. doi: 10.1128/JCM.00833-15
Ulrich, S., Kühn, U., Biermaier, B., Piacenza, N., Schwaiger, K., Gottschalk, C., et al. (2017). Direct identification of edible insects by MALDI-TOF mass spectrometry. Food Contr. 76, 96–101. doi: 10.1016/j.foodcont.2017.01.010
Van der Maaten, L., and Hinton, G. (2008). Visualizing data using t-SNE. J. Mach. Learn. Res. 2008:9.
Vega-Rúa, A., Pagès, N., Fontaine, A., Nuccio, C., Hery, L., Goindin, D., et al. (2018). Improvement of mosquito identification by MALDI-TOF MS biotyping using protein signatures from two body parts. Parasit. Vect. 11:574.
Ward, J., and Joe, H. (1963). Hierarchical grouping to optimize an objective function. J. Am. Stat. Assoc. 58, 236–244. doi: 10.1080/01621459.1963.10500845
Wells, J. W. (1956). “Scleractinia,” in Treatise on Invertebrate Paleontology: Coelenterata, 1 Edn, ed. R. C. Moore (Lawrence: Geological Society of America and University of Kansas Press), 328–443.
Wendel, T. P., Feucherolles, M., Rehner, J., Poppert, S., Utzinger, J., Becker, S. L., et al. (2021). Evaluating Different Storage Media for Identification of Taenia saginata Proglottids Using MALDI-TOF Mass Spectrometry. Microorganisms 9:2006. doi: 10.3390/microorganisms9102006
Wilke, T., Renz, J., Hauffe, T., Delicado, D., and Peters, J. (2020). Proteomic Fingerprinting Discriminates Cryptic Gastropod Species. Malacologia 63, 131–137. doi: 10.4002/040.063.0113
Yang, Y., Lin, Y., and Qiao, L. (2018). Direct MALDI-TOF MS identification of bacterial mixtures. Anal. Chem. 90, 10400–10408. doi: 10.1021/acs.analchem.8b02258
Keywords: COI, 28S rDNA, mtMutS, GMYC, MALDI-TOF MS, Anthozoa
Citation: Korfhage SA, Rossel S, Brix S, McFadden CS, Ólafsdóttir SH and Martínez Arbizu P (2022) Species Delimitation of Hexacorallia and Octocorallia Around Iceland Using Nuclear and Mitochondrial DNA and Proteome Fingerprinting. Front. Mar. Sci. 9:838201. doi: 10.3389/fmars.2022.838201
Received: 17 December 2021; Accepted: 15 February 2022;
Published: 10 March 2022.
Edited by:
Alexandra Anh-Thu Weber, Swiss Federal Institute of Aquatic Science and Technology, SwitzerlandReviewed by:
Ingo Burghardt, Australian Museum, AustraliaCopyright © 2022 Korfhage, Rossel, Brix, McFadden, Ólafsdóttir and Martínez Arbizu. This is an open-access article distributed under the terms of the Creative Commons Attribution License (CC BY). The use, distribution or reproduction in other forums is permitted, provided the original author(s) and the copyright owner(s) are credited and that the original publication in this journal is cited, in accordance with accepted academic practice. No use, distribution or reproduction is permitted which does not comply with these terms.
*Correspondence: Severin A. Korfhage, c2V2ZXJpbi5rb3JmaGFnZUB1bmktb2xkZW5idXJnLmRl
Disclaimer: All claims expressed in this article are solely those of the authors and do not necessarily represent those of their affiliated organizations, or those of the publisher, the editors and the reviewers. Any product that may be evaluated in this article or claim that may be made by its manufacturer is not guaranteed or endorsed by the publisher.
Research integrity at Frontiers
Learn more about the work of our research integrity team to safeguard the quality of each article we publish.