
95% of researchers rate our articles as excellent or good
Learn more about the work of our research integrity team to safeguard the quality of each article we publish.
Find out more
ORIGINAL RESEARCH article
Front. Mar. Sci. , 26 April 2022
Sec. Aquatic Physiology
Volume 9 - 2022 | https://doi.org/10.3389/fmars.2022.836610
This article is part of the Research Topic Feeding a Sustainable Blue Revolution: The Physiological Consequences of Novel Ingredients on Farmed Fish View all 15 articles
 Ivan Viegas1*†
 Ludgero C. Tavares2,3†
 Elisabeth Plagnes-Juan4
 Emanuel Silva1
 João Rito1,2Lucie Marandel4
 Mariana Palma1†
 Rodrigo O. A. Ozório5†
 Leonardo J. Magnoni5†‡Stéphane Panserat4†
Glycerol is a 3-carbon sugar alcohol successfully employed as an alternative feed ingredient for land-farmed animals and more recently for farmed fish. While most studies address zootechnical performance, few have delved into the metabolic utilization of dietary glycerol. A growth trial was performed using diets with increasing levels of glycerol (0, 2.5 and 5%) on two relevant species for aquaculture: rainbow trout (8-week trial; 3 tank per diet/25 fish per tank, on a 15 ± 1°C flow-through freshwater system); and European seabass (6-week trial; 5 tank per diet/6-8 fish per tank on a 21°C indoor saltwater RAS system). After this period, fish were subjected to a metabolic trial consisting of a 6-day residence in deuterated water (2H2O). Measurements of blood glucose and hepatic glycogen 2H-enrichments through Nuclear Magnetic Resonance, complemented by mRNA levels of key-enzymes for intermediary metabolism were used to evaluate the catabolic pathways of dietary glycerol. Dietary glycerol had no impact on plasma glucose, but hepatic glycogen levels increased significantly with increasing dietary glycerol levels in both species. While trout was able to regulate circulating glycerol plasma, seabass presented elevated levels on the glycerol-supplemented diets. Despite revealing some significant differences between sampling time (6 and 24 h), none of the enzymes’ mRNA levels responded to the dietary treatment. In trout, the main source of blood glucose was not labeled with 2H (~60%, likely from diet) while other contributors did not differ with glycerol supplementation. In seabass, the unlabeled contribution was approximately half of that observed in trout (~30%), accompanied by a significant increase of gluconeogenic contributions at the triose-phosphate level to the blood glucose with increasing dietary glycerol. In trout, labeling from 2H2O into hepatic glycogen revealed significant differences, with the contribution from the indirect pathway at the triose-phosphate level increasing with increased dietary glycerol. No such differences were found in seabass’ glycogen pool. These findings suggest that fish species are able to retain, catabolize glycerol and incorporate it into carbohydrates. The gluconeogenic utilization of exogenous glycerol differed between species and affected the synthesis of hepatic glycogen in trout and the appearance of blood glucose in seabass.
Aquaculture remains highly dependent on fishmeal protein and its procurement still relies on exploiting wild fisheries, a concern heightened by an increasing production of carnivorous fish species. For intensive fish farming, the provision of alternative ingredients that reduce dependence on fishmeal protein yields economic and environmental benefits while improving the sustainability and overall public perception of the industry (Hua et al., 2019). Under the scope of circular economy and zero waste (European Commission, 2020) new purposes have been equated to industrial by-products being used as raw materials for aquafeeds. Glycerol (1,2,3-propanetriol or glycerine; ChEBI: 17754) is the by-product of biodiesel production, which is projected to increase from 36 bln L in 2017 to 39 bln L by 2027 (OECD/FAO, 2019). This water-soluble, almost colorless, odorless, viscous, hygroscopic 3-carbon sugar alcohol is abundant, affordable and available for different purposes. These include pharmaceuticals, cosmetics (Ayoub and Abdullah, 2012), chemical feedstock and animal feeds (Yang et al., 2012). It has been successfully used as an alternative feed ingredient for land-farmed animals including swine (Lammers et al., 2008; Mendoza et al., 2010; Carvalho P.L.D.O. et al., 2012; Oliveira et al., 2014), poultry (Cerrate et al., 2006; Min et al., 2010) and cattle (Chung et al., 2007; Donkin, 2008; Carvalho E.R. et al., 2012).
Its potential as an alternative ingredient for farmed fish feed has been thoroughly assessed in Nile tilapia (Oreochromis niloticus) (Neu et al., 2013; Gonçalves et al., 2015; Moesch et al., 2016; Costa et al., 2017; Santos et al., 2019) and occasionally in other fish species like channel catfish (Ictalurus punctatus) (Li et al., 2010), rainbow trout (Oncorhynchus mykiss) (Menton et al., 1986; Magnoni et al., 2021), gilthead seabream (Sparus aurata) (Silva et al., 2012) or from the genus Rhadmia (Balen et al., 2014; Theisen et al., 2020). While addressing zootechnical performance, few of these studies delved into the actual metabolic utilization of dietary glycerol, an endogenous metabolite at the crossroad of several metabolic pathways. Once absorbed and converted to glycerol-3-phosphate (G3P) by glycerol kinase, glycerol intersects with the glycolytic, gluconeogenic or lipogenic pathways with putative metabolic implications.
When compared with control diets, glycerol-supplemented diets in fish affect glycemia in a species-specific manner with often erratic, non-dose-dependent patterns (if compared at 24 h after last meal). In rainbow trout, while no alterations were reported in inclusions up to 5% glycerol (Panserat et al., 2020), 6% inclusions provoked a significant increase in glycemia (Menton et al., 1986). In channel catfish, glycemia increased at 5% inclusion but remained at control levels up to 20% inclusion (Li et al., 2010). On the contrary, in curimbatá (Prochilodus lineatus), glycemia actually decreased at 4% inclusion and then sustained control levels up to 20% inclusion (Balen et al., 2017). Finally, inclusions up to 10% glycerol resulted in unaltered glycemia in Nile tilapia (Neu et al., 2013). To our knowledge, it is only recently that there has been some insight into the molecular and nutritional regulation of hepatic glycerol-related enzymes in fish (Panserat et al., 2020). However, the homeostatic mechanisms triggered in response to circulating dietary glycerol are yet to be addressed, namely the down-stream alterations into a metabolic rearrangement of the energetic substrates to regulate glycemia and store hepatic glycogen.
The use of deuterated water (2H2O) is a safe, practical and reliable method to, not only demonstrate the metabolic utilization of glycerol as energy substrate, but also discriminate the metabolic pathways involved. By adding 2H2O directly to the tank water, deuterium (2H) is rapidly incorporated into the fish body water (Viegas et al., 2011). Then, following well-defined metabolic steps, 2H is incorporated into pathway-dependent stereospecific positions of hepatic glucose 6-phosphate (G-6-P), generating unique labeling patterns, as described in Viegas et al. (2015). This method, when paired with the evaluation of mRNA abundance of the key enzymes involved in hepatic intermediary metabolism, has provided a better understanding of how fish can more efficiently use novel carbohydrate-rich diets (Viegas et al., 2015; Viegas et al., 2016). With this study, we aimed to describe how dietary glycerol affects glycemia, the pathways involved in blood glucose appearance and subsequent rearrangement in the storage of excess glucose as hepatic glycogen. For this purpose, we used as model two representative species of European aquaculture, freshwater rainbow trout (Oncorhynchus mykiss) and marine European seabass (Dicentrarchus labrax).
This study was conducted under the supervision of accredited experts in laboratory animal science by the Portuguese Veterinary Authority (1005/92, DGAV-Portugal, following FELASA category C recommendations), according to the guidelines on the protection of animals used for scientific purposes from the European directive 2010/63/UE.
Three isoproteic (49% crude protein), isolipid (17% crude lipid) and isoenergetic (~23 kJ kg− 1) extruded diets were formulated while fulfilling the known nutritional requirements of both species (Sparos Lda., Olhão, Portugal). An early study with rainbow trout (Menton et al., 1986) reported that 6% supplementation of free glycerol was enough to significantly increase plasma glucose. Hence, a control diet with no glycerol (D0); and two experimental diets, supplemented with 2.5% (D2.5) or 5.0% (D5) glycerol. Further details can be found in Table 1. Even if the formulation was the same for both species, for the sake of clarity and context, D0, D2.5 and D5 will hereafter be referred to T0, T2.5, T5 or S0, S2.5, S5, when addressing the rainbow trout or European seabass experiment, respectively.
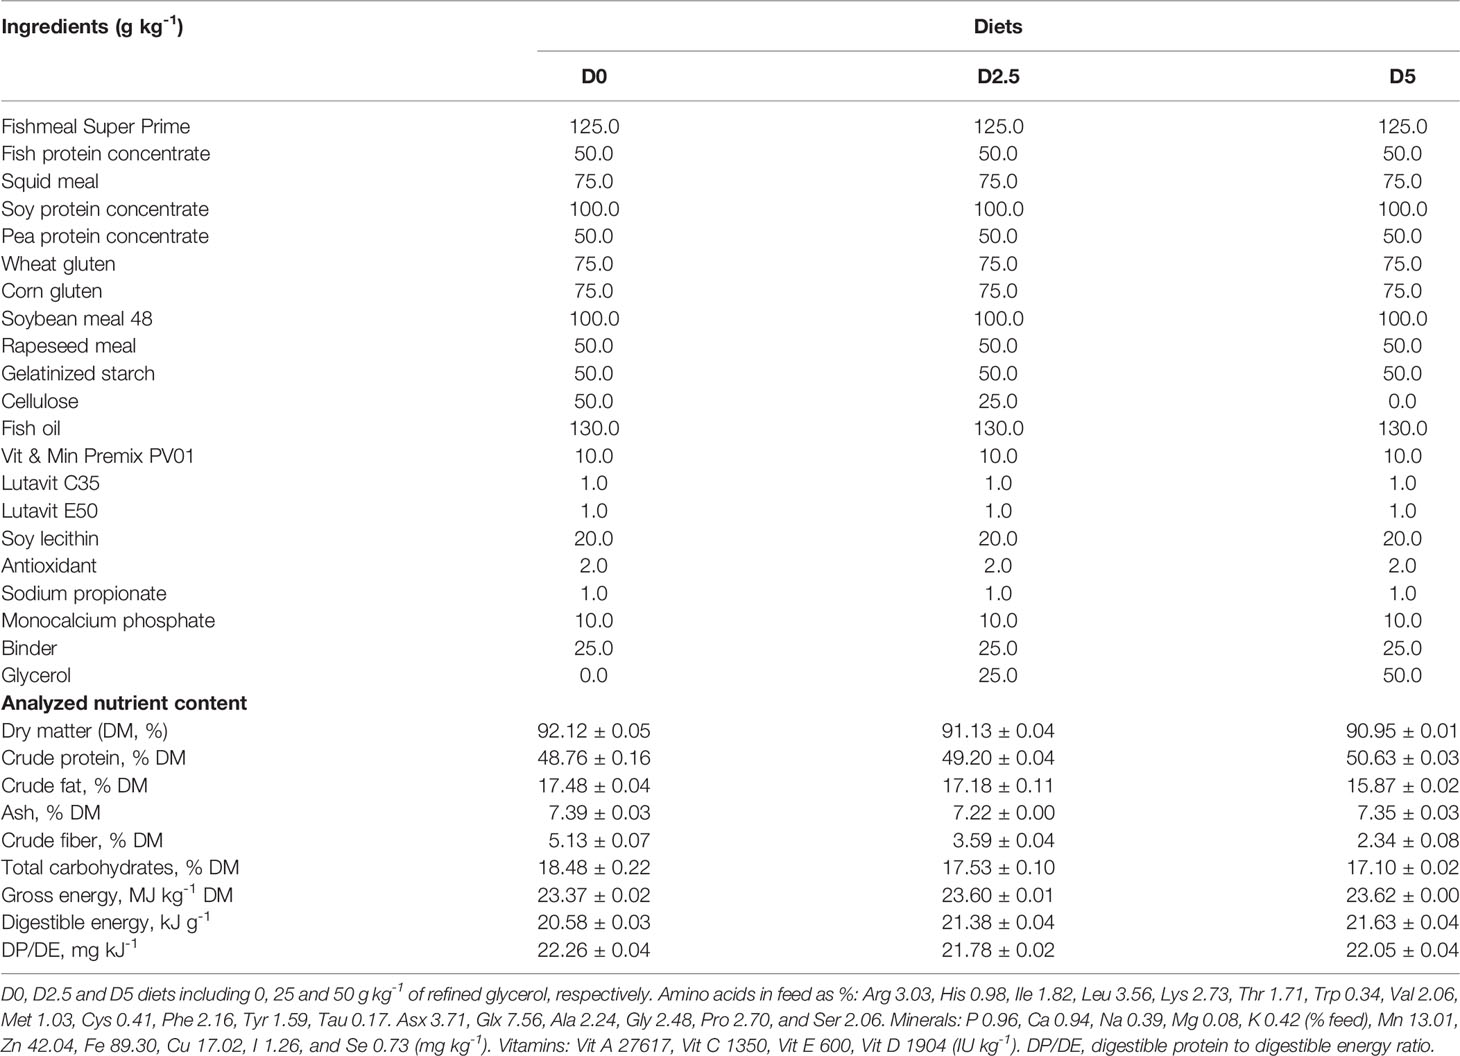
Table 1 Ingredients and nutrient content of the diets.
Rainbow trout (hereafter trout; Oncorhynchus mykiss) experiments were carried out at the Experimental Research Station of the University of Trás-os-Montes e Alto Douro (UTAD, Vila Real, Portugal). The growth trial was started with individuals of 20.2 ± 0.1 g in weight and lasted 8 weeks. Further detail can be found in Magnoni et al. (2021). European seabass (hereafter seabass; Dicentrarchus labrax) experiments were carried out at the Interdisciplinary Centre of Marine and Environmental Research (CIIMAR, Porto, Portugal). The growth trial was started with individuals of 51.4 ± 2.6 g in weight and lasted 6 weeks. Further detail can be found in Palma et al. (2019). A summary for both growth trials is presented in Table 2.
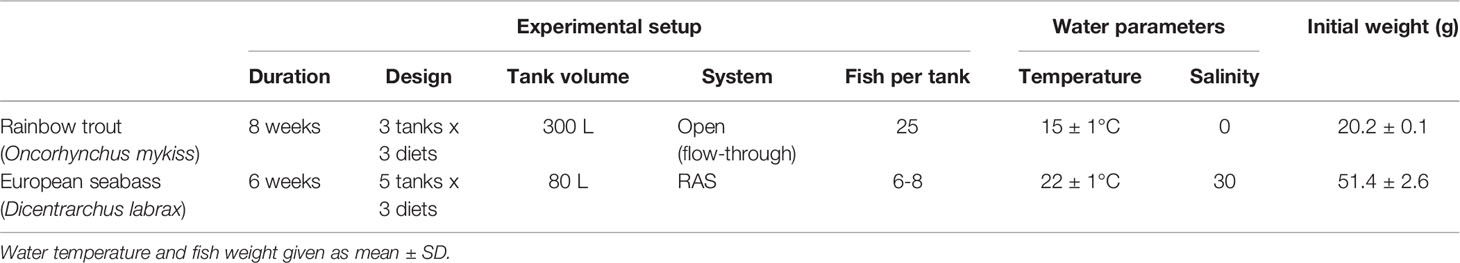
Table 2 Experimental setup and water parameters for the growth trials performed with rainbow trout (O. mykiss) and European seabass (D. labrax) fed with different levels of glycerol (0, 2.5, and 5%).
At the end of the growth trial, two to three fish per tank were sampled at 6 h and 24 h (n=8 trout and n=7 seabass, per diet, per sampling time) after last meal. Last meal was administered at 08:00, 10 min apart for each tank to compensate for time dedicated to sampling. This is particularly relevant for synchronizing the sampling 6 h after last meal. Fish were anesthetized using well-aerated water from the rearing system containing MS-222 (3-aminobenzoic acid ethyl ester, 0.1 g L−1), buffered with NaHCO3 (0.2 g L−1). Anesthetized fish were weighed, and blood was immediately obtained from the caudal region using heparinized syringes. Fish were euthanized by cervical section, the liver was dissected, weighed, freeze-clamped in liquid nitrogen and stored at −80°C until further analysis. Plasma was separated by centrifugation (3000g, 10 min) and stored at −20°C for quantification with commercial kits of glucose (Glucose RTU; BioMerieux), triglycerides (TRG050; Sobioda) and glycerol (MAK117; Sigma-Aldrich), respectively, according to the recommendations of each manufacturer. Glycogen measures were performed in liver as previously detailed in Song et al. (2018).
The relative gene mRNA level was determined by real-time quantitative polymerase chain reaction (qPCR). Liver samples were homogenized using Precellys®24 (Bertin Technologies, Montigny-le-Bretonneux, France) in tubes containing Trizol reagent (Invitrogen, Carlsbad, CA, USA). Total RNA was then extracted according to the manufacturer’s instructions. The total RNA concentration was determined using the spectrophotometer NanoDrop 2000 whereas the total RNA quality was determined by migration on a 1% agarose gel electrophoresis. Total RNA (1 μg) was used for cDNA synthesis. The Super-Script III RNAse H-Reverse transcriptase kit (Invitrogen, Carlsbad, California, USA) was used with random primers (Promega) to synthesize cDNA. The primer sequences used in real-time qPCR assays for glucose metabolism gene analysis are presented in Supplementary Tables S1, S2 for trout and seabass, respectively. The mRNA level for enzymes of glycolysis (gck, glucokinase EC 2.7.1.2; pk, pyruvate kinase EC. 2.7.1.40) and gluconeogenesis (g6pc, glucose-6-phosphatase EC 3.1.3.9; fbp, fructose-1,6-bisphosphatase EC 3.1.3.11; pck, phosphoenolpyruvate carboxykinase EC 4.1.1.32) were analyzed. Elongation factor-1 alpha (ef1α) was used as the reference gene. As shown in previous studies, ohnologues genes were mostly regulated at the transcription level in the same way (Marandel et al., 2015) so a set of primers that amplify both g6pcb1 and g6pcb2 genes (called “glob”, respectively) were used. For real-time qPCR assays, the Roche Lightcycler 480 system was used (Roche Diagnostics, Neuilly-sur-Seine, France). The assays were performed using a reaction mix of 6 μL per sample, each containing 2 μL of diluted cDNA template (1:76 for the postprandial and nutritional experiment; 1:25 for ontogenesis experiment), 0.24 μL of each primer (10 μmol L−1) and 3 μL Light Cycler 480 SYBR® Green I Master mix (Roche Diagnostics). The PCR protocol was initiated at 95°C for 10min for initial denaturation of the cDNA and hot-start enzyme activation and continued with 45 cycles of a three-step amplification program (15 s at 95°C followed by 10 s 60°C, for primer hybridization, and 15 s at 72°C to extend DNA). Melting curves were systematically monitored (temperature gradient at 0.11°C/s from 65 to 97°C; five acquisitions/°C) at the end of the last amplification cycle to confirm the specificity of the amplification reaction. Each PCR run included replicate samples (duplicate of reverse transcription and duplicate of PCR amplification) and negative controls (reverse transcriptase-free samples, RNA-free samples).
The fish remaining from the growth trials (n=24 per diet for both species) were transferred to a closed recirculated system consisting of 3 x 150 L tanks for the metabolic trials. Tank water (TW) contained ~4% 2H-enriched water, achieved by the addition of 99%-enriched 2H2O (CortecNet, France) to water from the system where the respective growth trial took place as previously described (Viegas et al., 2011). This water was maintained within previous parameters with an independent closed filtering system (EHEIM eXperience 350) and UV unit (EHEIM reeflexUV 800) as previously described (Palma et al., 2019; Magnoni et al., 2021). Tank water 2H-enrichment was assessed at the beginning and end of the metabolic trials, lasting 6 days for each species. During the 6-day residence in 2H-enriched TW, fish were fed once a day (ad libitum) and euthanized 24 h after last meal on day 5. Fish were anesthetized, euthanized and sampled for blood and liver as previously described in section 2.4. An aliquot of plasma was processed as described above for quantification with commercial kits of glucose (I.S.E. S.r.l.; ref. A-R0100000601), triglycerides (I.S.E. S.r.l.; A-R0100000901) and glycerol (Sigma-Aldrich; ref. MAK117), as well as assessment of body water (BW) 2H-enrichment. In order to ensure samples that yielded 2H Nuclear Magnetic Resonance (NMR) spectra with high signal-to-noise ratios, blood and liver from two fish were pooled (for a final n=12). The blood was deproteinized by the addition of 0.3 M ZnSO4 and 0.15 M Ba(OH)2, followed by centrifugation (3500g, 15 min). The supernatant was desalted by passage through sequential columns containing Dowex® 50WX8 (hydrogen form; Sigma-Aldrich) and Amberlite® IRA-67 (free base, Fluka; Sigma-Aldrich), and lyophilized as previously described (Viegas et al., 2013). Liver was ground with N2-chilled mortar and pestle and hepatic glycogen was extracted by precipitation with 70% ethanol following an alkaline tissue hydrolysis, as previously described (Viegas et al., 2012). Glycogen was hydrolyzed to glucose by amyloglucosidase from Aspergillus niger (glucose-free preparation; Sigma-Aldrich) as described previously (Viegas et al., 2012). In order to optimize the signal resolution of the NMR spectra, glucose (isolated from blood) and glycosyl units (obtained from hepatic glycogen hydrolysis with amyloglucosidase) were converted into their derivative monoacetone glucose (MAG), as previously described (Viegas et al., 2012).
Proton-decoupled 2H NMR spectra were obtained with a Bruker Avance III HD 500 spectrometer using a 2H-selective 5 mm probe incorporating a 19F-lock channel. To quantify fish body water (BW) and tank water (TW) 2H-enrichments, duplicates of 10 μL samples were added to 450 μL of calibrated acetone as previously described (Jones et al., 2001) with the addition of 50 μL of hexafluorobenzene (Sigma-Aldrich H8706, Spain) to detect 19F-lock (analyzed in duplicate). MAG samples were resuspended in 0.5 mL 90% acetonitrile/10% 2H-depleted water with the addition of 50 μL of hexafluorobenzene. 2H NMR spectra were obtained following the acquisition parameters described in Rito et al. (2018). Estimation of blood glucose and hepatic glycogen sources from 2H2O derive from unique labeling patterns created by their common precursor G-6-P, following the metabolic model for positional 2H-labeling shown in Figure 1 and described in detail in Palma et al. (2020). The positional 2H-enrichments were quantified by using the MAG methyl signals (MAG-CH3) as intramolecular standard (Nunes and Jones, 2009) (representative spectrum is presented in Supplementary Figure S1). Briefly, all gluconeogenic (=indirect pathway, in the case of glycogen synthesis) contributions are calculated from the 2H-enrichment in position 5 (2H5; Figure 1 in orange) relative to tank water as follows:
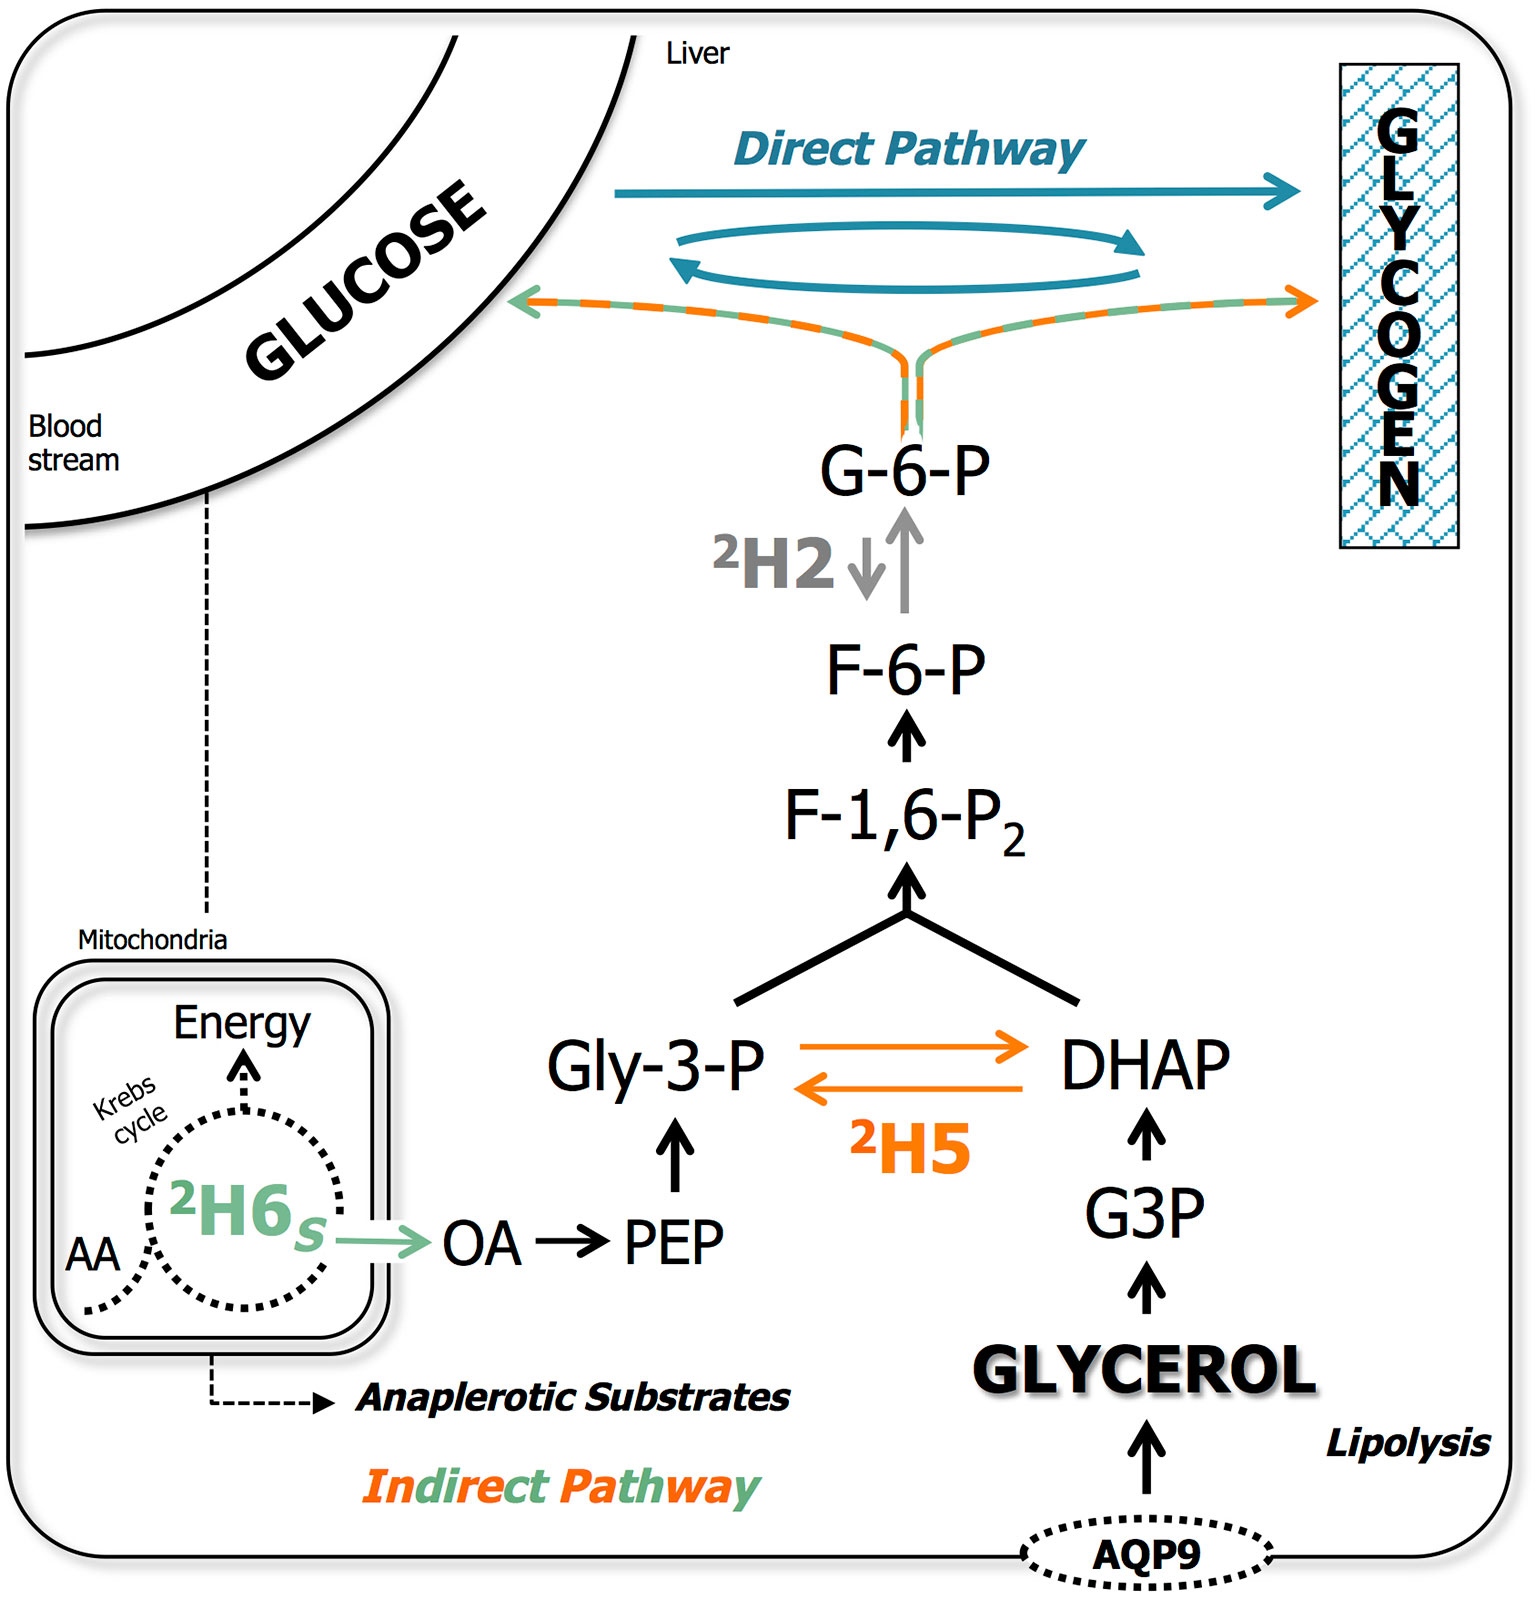
Figure 1 Metabolic model representing metabolic pathways for blood glucose and hepatic glycogen synthesis. Gluconeogenesis/indirect pathway includes: i) precursors that are metabolized via the anaplerotic pathways of Krebs cycle (i.e., pyruvate and glucogenic amino acids); ii) glycerol from lipolysis and imported from the blood stream via aquaporin 9 (AQP9); and iii) pyruvate derived from glucose, as indicated by the dashed arrow. Metabolic model for 2H-enrichment sites of glucose/glycosyl molecule from 2H2O: position 2 (2H2; in grey) via glucose-6-phosphate isomerase; position 5 (2H5; in orange) via triose phosphate isomerase; and position 6S (2H6S; in green) via fumarase in the Krebs cycle. Several metabolic intermediates were omitted for clarity. G-6-P, glucose-6-phosphate; Gly-3-P, glyceraldehyde-3-phosphate; G3P, glycerol-3-phosphate; DHAP, dihydroxyacetone phosphate; OA, oxaloacetate; PEP, phosphoenolpyruvate; AA, amino acids.
G-6-P synthesized from Krebs cycle precursors, is enriched in both positions 5 and 6 while G-6-P derived from substrates entering glycogenesis at the level of triose phosphates, such as glycerol released via lipolysis, is only enriched in position 5. Thus, gluconeogenic contributions from the Krebs cycle are calculated from the 2H-enrichment in position 6S (2H6S; Figure 1 in green) relative to tank water as follows:
Gluconeogenic contributions from triose phosphates are estimated as the difference between position 5 and 6S enrichments relative to tank water:
The remaining hepatic glycogen may stem from various sources whose provenance is unreliable to further resolve under the present metabolic model. These include pre-existing glycogen (direct or indirect origin is unknown), cycled glycogen via G-6-P, or glycogen derived from the direct pathway (Figure 1 in blue) and were calculated relatively to eq. 1 as:
Blood glucose originating from glycogenolysis (or cycled from glycogen) would not be labeled in 2H5, being then calculated as:
2H-enrichment of endogenous G-6-P in position 2 (2H2) is obligatory in gluconeogenesis while dependent on the interconversion between G-6-P and fructose-6-phosphate (F-6-P) by G-6-P isomerase in glycogenolysis. Even if partially incomplete (Martins et al., 2013), labeling in 2H2 (Figure 1 in grey) is still the most reliable approximation to the labeling of endogenous G-6-P, calculated as
As blood glucose is likely to undergo full turnover in both species within the 6-day residence in 2H2O (Garin et al., 1987; Haman and Weber, 1996), the unlabeled contributions, were considered to be from dietary sources and calculated as:
Data are presented as mean ± SD. All spectra were processed in the ACD/NMR Processor Academic Edition from ACD\Labs 12.0 software (Advanced Chemistry Development, Inc.) applying: zero-filling to 65k, line broadening of 1.0 Hz, phasing and baseline correction. For the parameters evaluated following the growth trial, such as final body weight, plasma and hepatic parameters and mRNA levels of carbohydrate-related enzymes, the effects of sampling time and diet were analyzed by two-way ANOVA, with time (6 h and 24 h) and glycerol level (D0, D2.5 and D5) as variables. In the case of significant interactions, one-way ANOVA was performed for each sampling time separately. For the parameters evaluated following the metabolic trial, such as plasma, hepatic parameters and metabolic flux calculations were analyzed by one-way ANOVA. In the case of detecting significant differences through the one-way ANOVA, a Tukey multiple range test was performed to discriminate differences between diets. Statistical analysis was performed in GraphPad Prism software (GraphPad Software, La Jolla, CA, USA) and differences were considered statistically significant at p<0.05.
Tank water (TW) 2H-enrichment was 3.9% and 3.5% for trout and seabass, respectively. Body water (BW) enrichment, assessed using plasma water content as proxy, was consistent with TW with no differences between dietary treatments for both species. Since fish BW and TW enrichments equilibrate within less than 6 h for seabass (Viegas et al., 2011), BW 2H-enrichment level was considered to reflect that of a constant 2H-precursor enrichment level over the 6-day residence time of both species in 2H2O.
After the growth trial, no differences in the final body weight for both diet (T0, T2.5, T5) and sampling time (6 h vs. 24 h after last meal) were observed. It was not the case for glucose and glycerol levels in the plasma. These parameters were not significantly affected by diet but responded to the postprandial timing, being significantly higher at 6 h than 24 h. However, since significant interactions were obtained for plasma glycerol, a one-way ANOVA was performed separately for each variable revealing no further differences between diets in fish 24 h after the last meal. On the contrary, hepatic glycogen was not altered by sampling time but significantly increased alongside dietary levels of glycerol. The hepatosomatic index (HSI) reflected differences from both variables, being significantly higher at 6 h compared with 24 h as expected from a postprandial absorption pattern. Also, and in agreement with the observed increasing hepatic glycogen levels, HSI increased with increasing dietary levels of glycerol. After the metabolic trial, fish were euthanized 24 h after the last meal and the same parameters were measured with the exception of glycogen levels (the liver tissue assigned for the glycogen assay was poorly maintained and this parameter was not measured). HSI did not reveal statistical differences but final body weight, plasma glucose and glycerol followed the same statistical trend as in the growth trial at 24 h postprandial. The results from both trials in trout are summarized in Table 3.
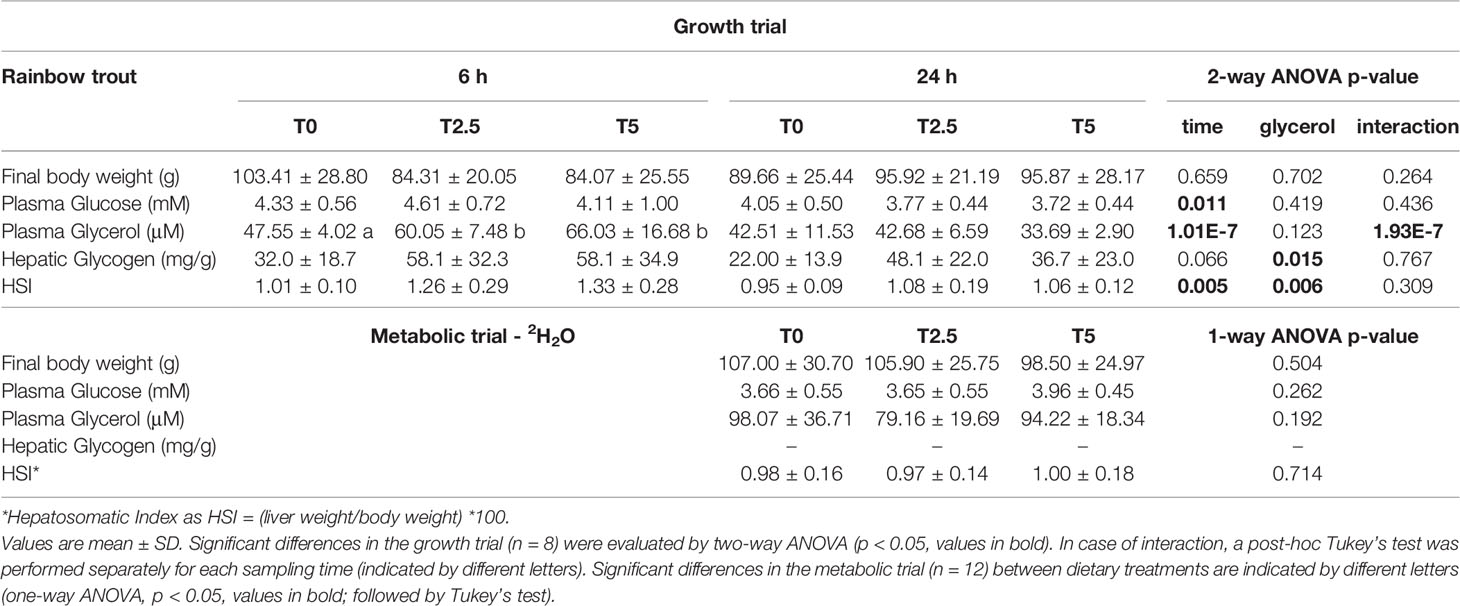
Table 3 Final weight, blood and liver parameters for rainbow trout (Oncorhynchus mykiss) fed with different levels of glycerol (0, 2.5, and 5%) for 8 weeks sampled at the end of the growth trial at 6 h and 24 h after last meal and the metabolic trial (6-day residence in 2H-enriched water) 24 h after last meal.
In order to assess the impact of glycerol-supplemented diets on hepatic metabolism, mRNA levels of key enzymes involved in the regulation of carbohydrate metabolism were assessed after the growth trial at two different sampling times after last meal (6 and 24 h) by real-time qPCR (Figure 2).
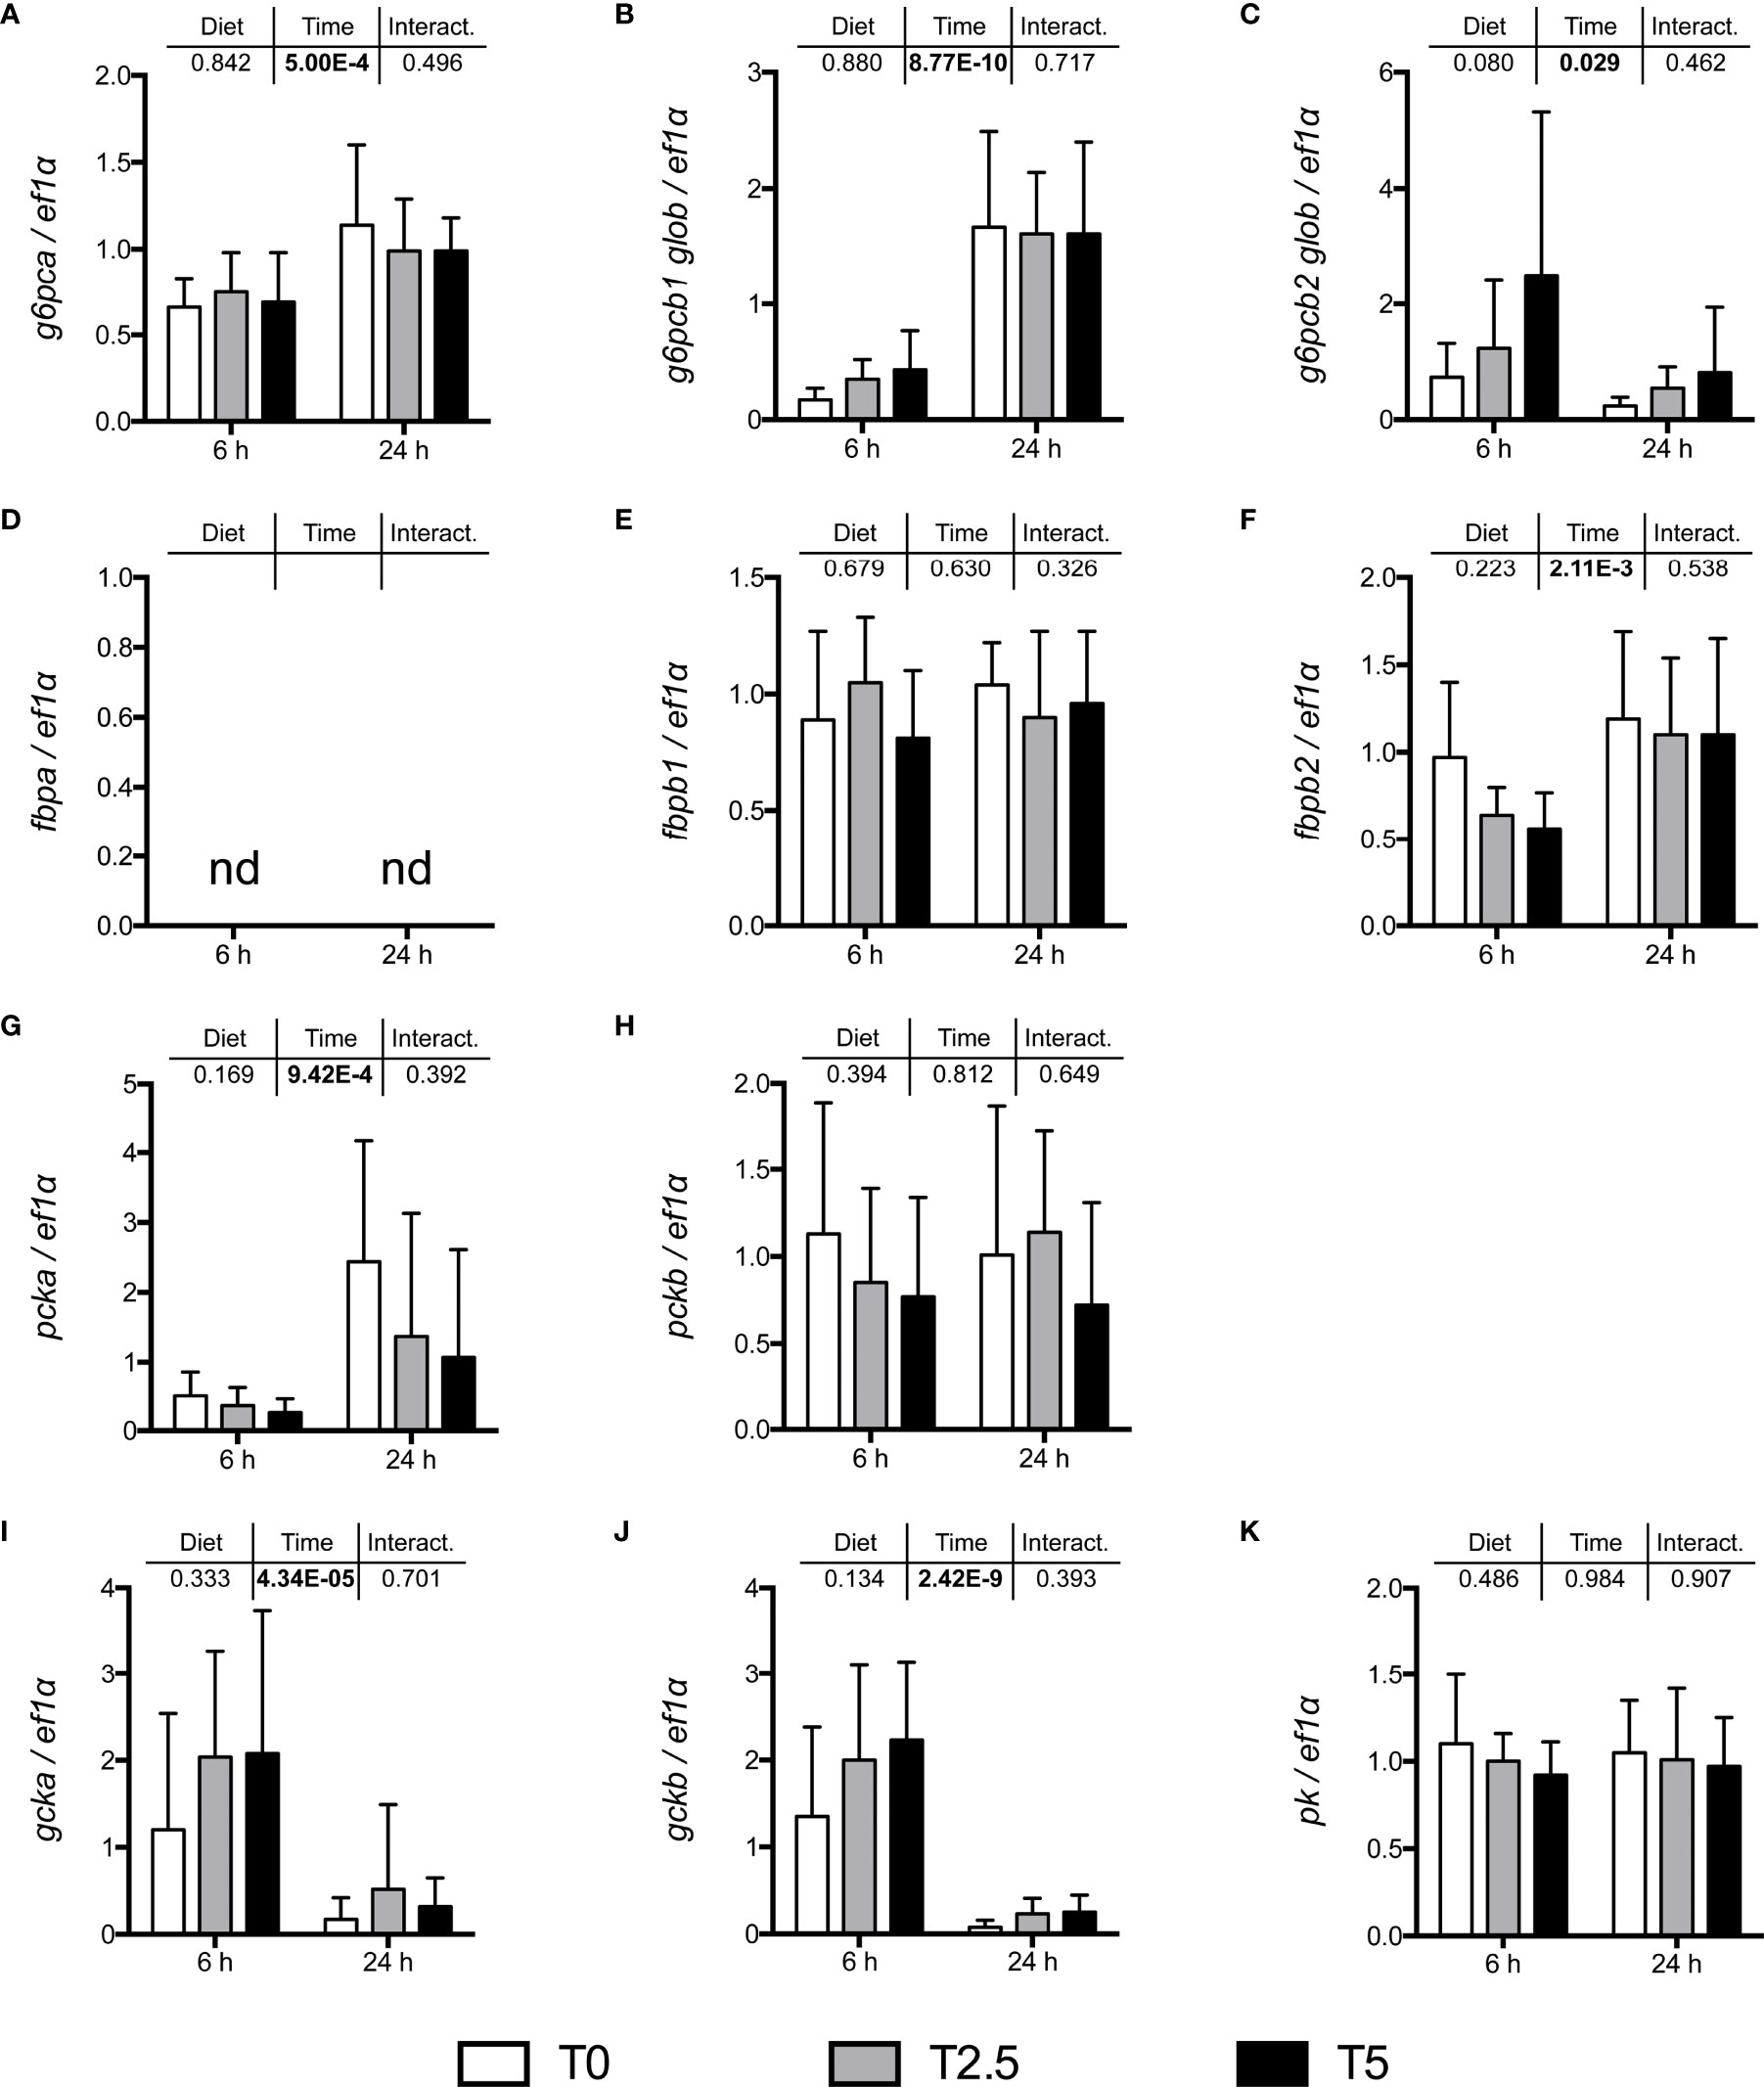
Figure 2 mRNA levels of selected gluconeogenic enzymes (A) g6pca, (B) g6pcb1, (C) g6pcb2 (glucose-6-phosphatase paralogs), (D) fbpa, (E) fbpb1, (F) fbpb2 (fructose-1,6-bisphosphatase paralogs), (G) pcka, (H) pckb (phosphoenolpyruvate carboxykinase paralogs); and glycolytic enzymes (I) gcka, (J) gckb (glucokinase paralogs) and (K) pk (pyruvate kinase), in the liver of rainbow trout (Oncorhynchus mykiss) fed with different levels of glycerol (0, 2.5, and 5%) for 8 weeks. Values are mean ± SD (n = 8); nd, not detected. Significant differences were evaluated by two-way ANOVA (p < 0.05, values in bold).
None of analyzed transcripts responded significantly to the different levels of dietary glycerol. At 6 h after last meal, and as expected in a postprandial setting, some gluconeogenic enzymes had decreased mRNA levels, namely glucose-6-phosphatase paralogs g6pca and g6pcb1, fructose-1,6-bisphosphatase paralog fbp1b2 and phosphoenolpyruvate carboxykinase paralog pck1. Curiously, the glucose 6-phosphatase paralog g6pcb2 was up-regulated at 6 h after last meal. On the other hand, but also consistent with a postprandial setting, the mRNA levels for the glycolytic glucokinase paralogs were significantly down-regulated at 6 h after last meal.
A deeper insight into the impact of glycerol-supplemented diets on hepatic metabolism was achieved through the labeling of blood glucose and hepatic glycogen with 2H2O. This approach revealed no differences between diets for the sources of blood glucose pool (Figure 3), the majority of which (approximately 60%) were not labeled with 2H. From the labeled fraction, which corresponded to the remaining 40%, we were able to determine their source from the positional 2H-enrichment. Most of it, at an average for all dietary treatments of 33% out of total blood glucose, came from gluconeogenic substrates. From this fraction, 57% gluconeogenic substrates came from Krebs cycle and 43% gluconeogenic substrates from triose-phosphate. Only a small fraction, at an average of 6% for all dietary treatments, was derived from the breakdown of hepatic glycogen to total blood glucose. On the other hand, labeling from 2H2O revealed significant differences between diets for hepatic glycogen synthesis (Figure 4). The majority of the glycogen pool, at an average of 70% for all dietary treatments, derived from pre-existing, cycled or G-6-P directly derived from blood glucose. The contribution from the indirect pathway at the triose-phosphate level statistically increased alongside levels of dietary glycerol from 8.8% at T0 to 17.2% at T5. Apparently this happened at the shared expense of the other fractions since neither the direct contribution (including pre-existing and cycled G-6-P) nor indirect contribution from Krebs cycle revealed statistical differences.
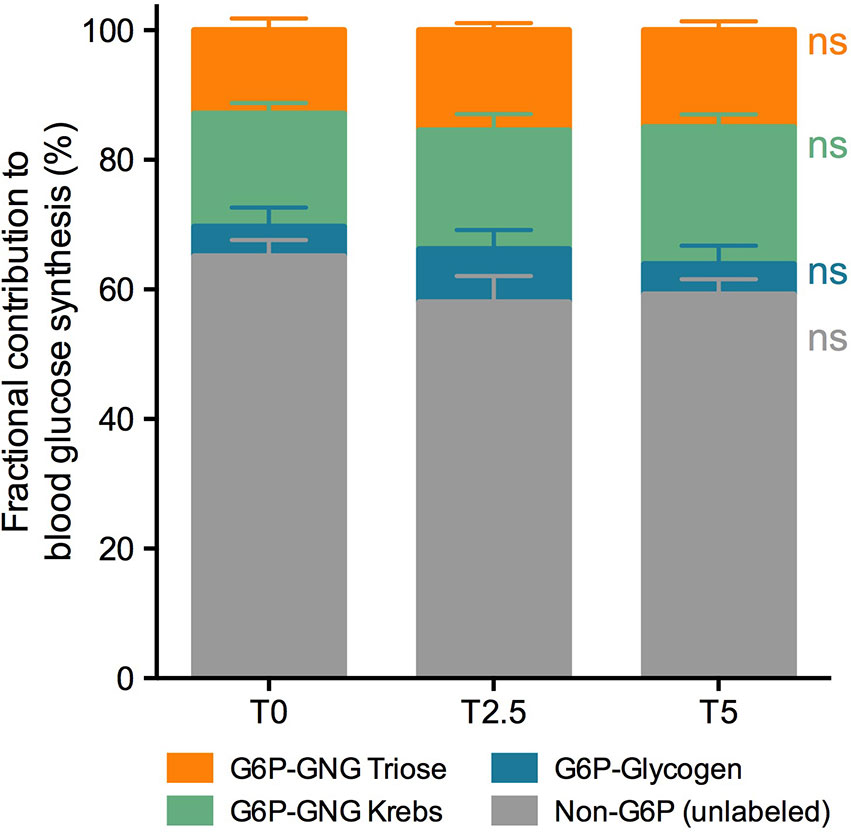
Figure 3 Fractional contribution to blood glucose synthesis of rainbow trout (Oncorhynchus mykiss) fed with different levels of glycerol (0, 2.5, and 5%) for 8 weeks. Contributions are represented as percentage of total (%). Values are mean ± SEM (n = 12; one-way ANOVA; followed by Tukey for p < 0.05; ns, not significant). The color scheme corresponds to metabolic pathways depicted in Figure 1.
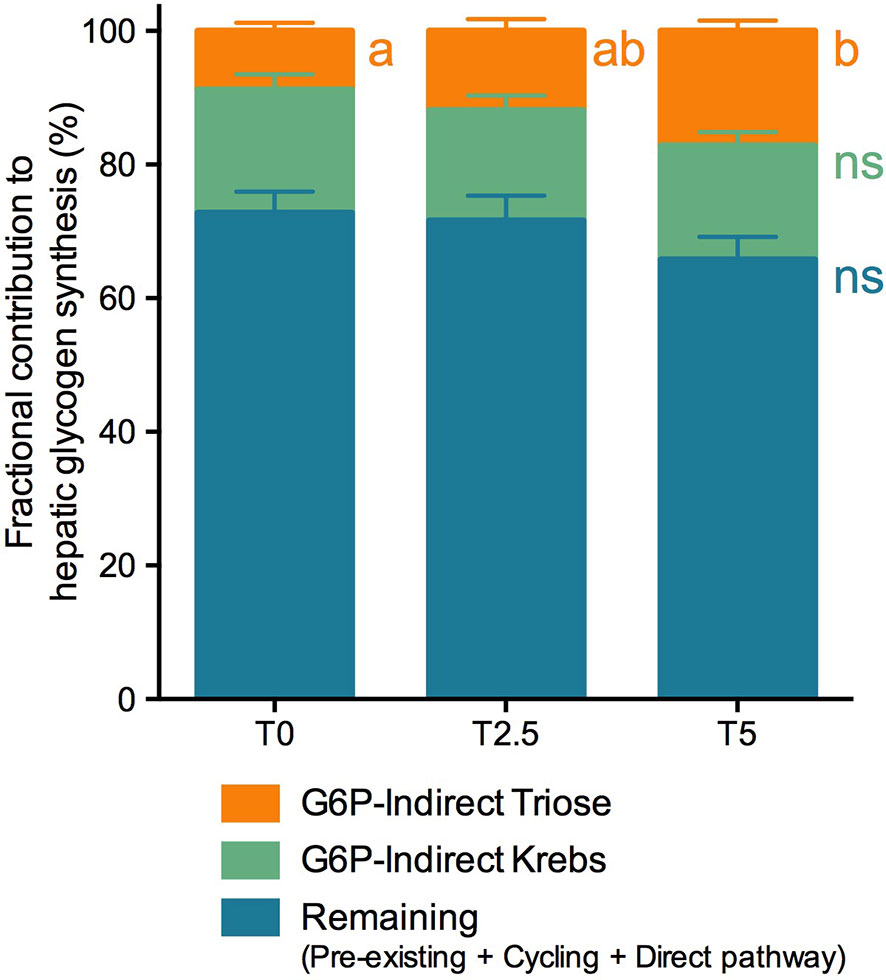
Figure 4 Fractional contribution to hepatic glycogen synthesis of rainbow trout (Oncorhynchus mykiss) fed with different levels of glycerol (0, 2.5, and 5%) for 8 weeks. Contributions are represented as percentage of total (%). Values are mean ± SEM (n = 12). Significant differences are indicated by different letters (one-way ANOVA; followed by Tukey for p < 0.05; ns, not significant). The color scheme corresponds to metabolic pathways depicted in Figure 1.
After the growth trial, no differences in the final body weight and plasma glucose were observed between diets (S0, S2.5, S5) and sampling time (6 h, 24 h after last meal). In fact, none of the parameters assessed were sensitive to postprandial alterations. On the other hand, plasma glycerol increased alongside dietary levels of glycerol, a trend also observed at the metabolic trial. In the growth trial, hepatic glycogen decreased with increasing dietary levels of glycerol but with no observable repercussions in HSI, the results for these same parameters after the metabolic trial revealed another pattern. Glycogen levels were not significantly altered while HSI increased with dietary levels of glycerol. The results from both trials in seabass are summarized in Table 4.
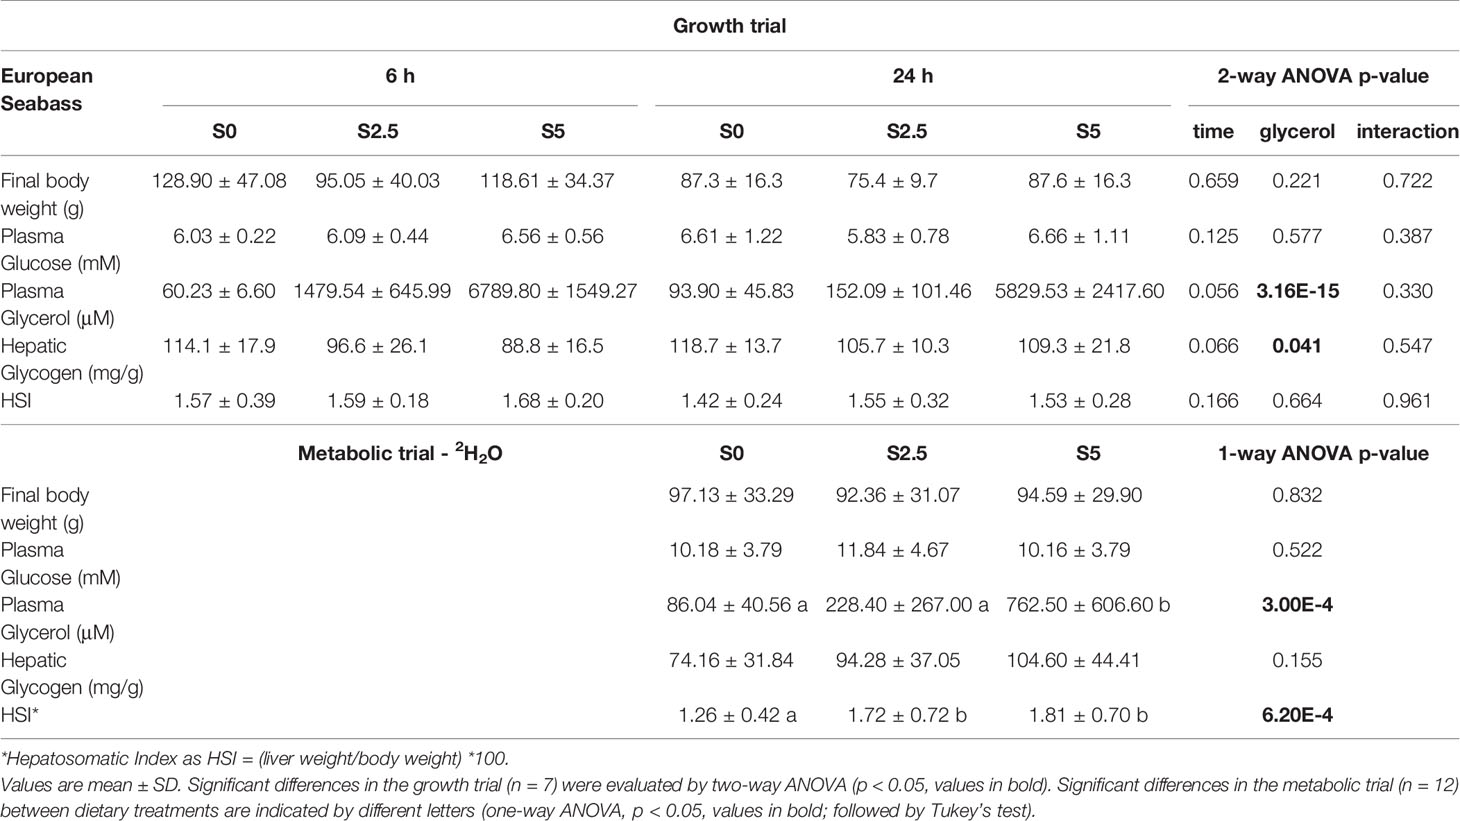
Table 4 Final weight, blood and liver parameters for European seabass (Dicentrarchus labrax) fed with different levels of glycerol (0, 2.5, and 5%) for 6 weeks sampled at the end of the growth trial at 6 h and 24 h after last meal and the metabolic trial (6-day residence in 2H-enriched water) 24 h after last meal.
Similar to what was observed in trout, mRNA levels of key enzymes involved in the regulation of carbohydrate metabolism did not respond significantly to the different levels of dietary glycerol (Figure 5). At 6 h after last meal, and as expected in a postprandial setting, the glycolytic enzymes gck and pk had increased mRNA levels. In the case of gck, despite the barely significant interactions found, post-hoc analysis done separately within each sampling time found no differences. For the mRNA levels of gluconeogenic enzymes, only fbp1 was significantly different and only when considering sampling time.
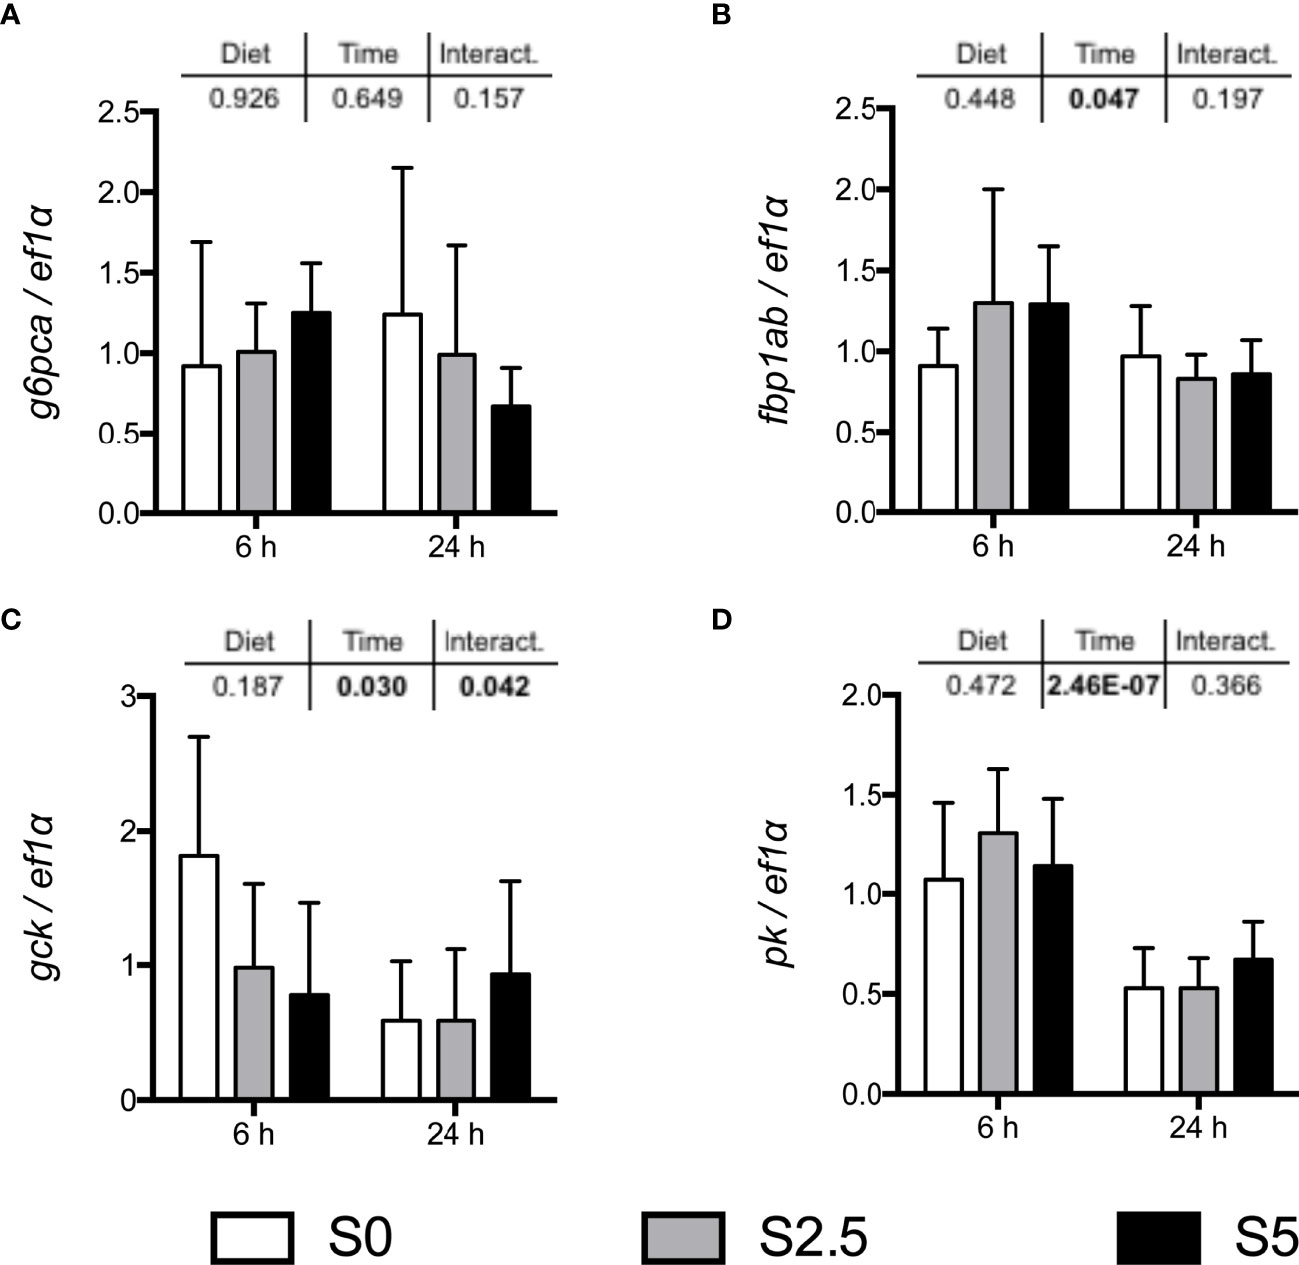
Figure 5 mRNA levels of selected gluconeogenic enzymes (A) g6pca (glucose-6-phosphatase a), (B) fbp1ab (fructose-1,6-bisphosphatase with paralogs fbp1a and fbp1b); and glycolytic enzymes (C) gck (glucokinase) and (D) pk (pyruvate kinase), in the liver of European seabass (Dicentrarchus labrax) fed with different levels of glycerol (0, 2.5, and 5%) for 6 weeks. Values are mean ± SD (n = 7). Significant differences were evaluated by two-way ANOVA (p < 0.05, values in bold).
Labeling of blood glucose and hepatic glycogen with 2H2O resulted in opposite results to those found in trout. Sources of blood glucose differed substantially between diets (Figure 6), while sources of hepatic glycogen did not (Figure 7). Taking into consideration the gluconeogenic substrates the contribution to blood glucose from Krebs cycle decreased, while from triose-phosphate there was an increase as dietary glycerol levels increased. If taken together (Krebs cycle plus triose-phosphate), the contribution of gluconeogenic substrates to blood glucose was significantly lower at S2.5 than with S0 but not statistically different from S5. On the other hand, the contribution from the breakdown of hepatic glycogen significantly increased from 46.7% at S0 to 59.3% at S5. This was accompanied by a significant decrease from 30.0% at S0 to 19.9% at S5 in the unlabeled fraction.
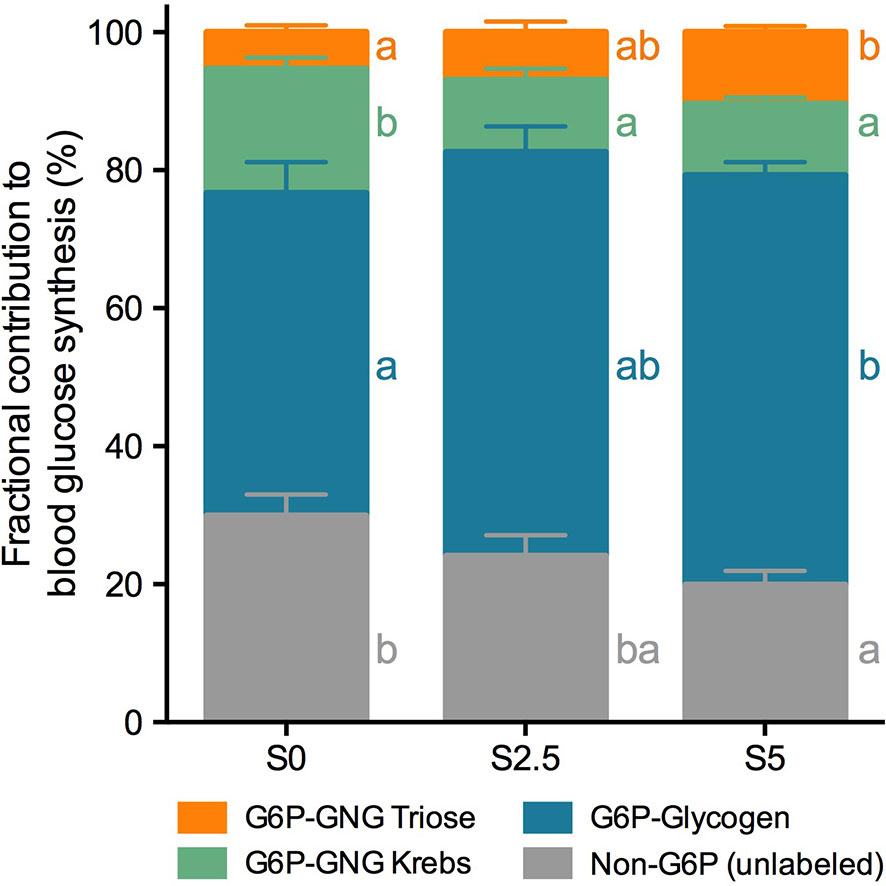
Figure 6 Fractional contribution to blood glucose synthesis of European seabass (Dicentrarchus labrax) fed with different levels of glycerol (0, 2.5, and 5%) for 6 weeks. Contributions are represented as percentage of total (%). Values are mean ± SEM (n = 12). Significant differences are indicated by different letters (one-way ANOVA; followed by Tukey for p < 0.05; ns, not significant). The color scheme corresponds to metabolic pathways depicted in Figure 1.
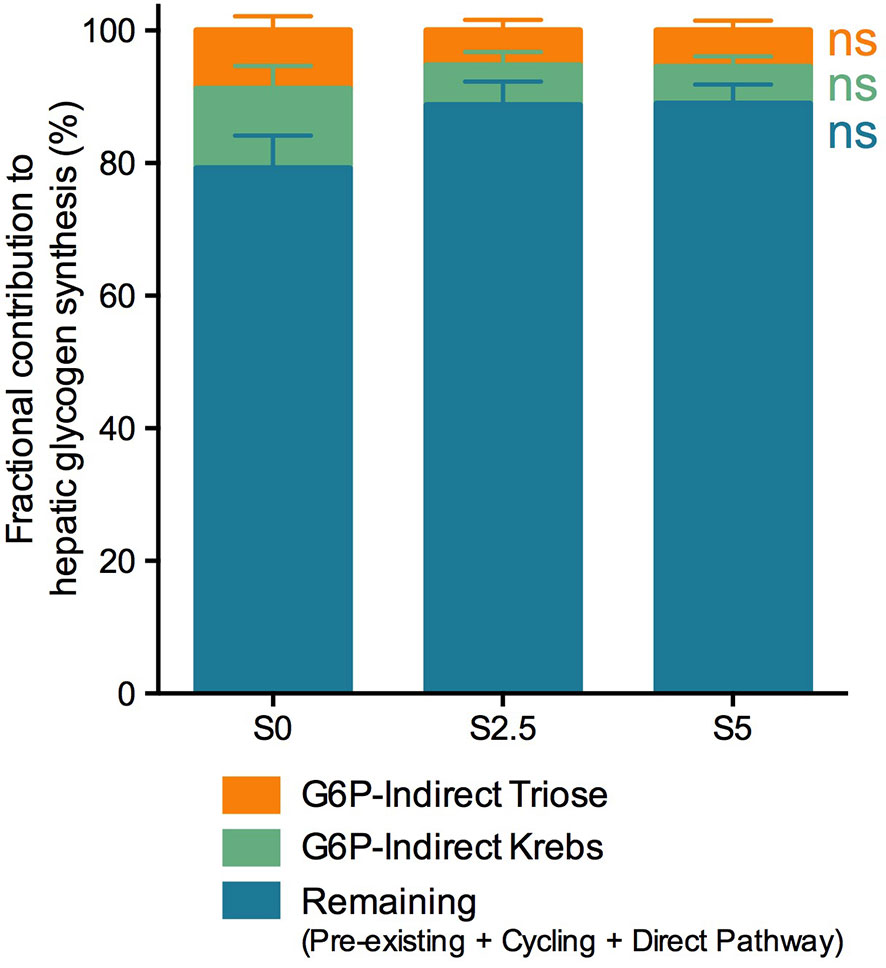
Figure 7 Fractional contribution to hepatic glycogen synthesis of European seabass (Dicentrarchus labrax) fed with different levels of glycerol (0, 2.5, and 5%) for 6 weeks. Contributions are represented as percentage of total (%). Values are mean ± SEM (n = 12; one-way ANOVA; followed by Tukey for p < 0.05; ns, not significant). The color scheme corresponds to metabolic pathways depicted in Figure 1.
As observed in trout, the majority of the glycogen pool derived from pre-existing, cycled or G-6-P directly derived from blood glucose. Even if reduced to half, from 20% in S0 to 10% in both glycerol-supplemented diets, no statistical differences were found in the indirect contribution, probably due to high variability amongst individuals.
Both species revealed evidence that carnivorous fish are able to catabolize glycerol as well as retain and incorporate it into carbohydrates. However, whether this incorporation would just add to gluconeogenesis rather than effectively competing with gluconeogenic amino acids for glucose synthesis is yet to be addressed. The latter would potentially spare amino acids for growth, while reducing the conversion of amino acid nitrogen moieties to ammonia with important impact on water quality. In carnivorous fish, gluconeogenic catabolism of amino acids accounts for most endogenous glucose production (Viegas et al., 2012; Viegas et al., 2013). Amongst alternative non-nitrogenous energetic substrates, glycerol is currently recognized as a safe food additive by the main food safety agencies (EFSA et al., 2017; FDA, 2021), thus virtually nontoxic to vertebrate health when administered at physiological levels such as when applied for animal feed. The quantity of nitrogen retained by rainbow trout decreased when fed diets with increasing glycerol levels, showing a lower protein retention. This was reflected as well in higher excretion rates of ammonia (Magnoni et al., 2021). In contrast, the same dietary levels of glycerol inclusion fed to European seabass did not generate differences in excreted ammonia between dietary treatments (Louvado et al., 2020).
Normally, the main source of circulating glycerol originates from triacylglycerol de-esterification in adipose tissue which under normal circumstances should be considerably low as was observed in the control fish (~50 μM). However, if provided in the diet, it is necessary to understand the underlying metabolic fluxes that control glycerol utilization. In the present study, the plasma glycerol levels, and its patterns changed substantially between species. In rainbow trout, plasma glycerol levels increased overall 6 h after meal, and did so in response to glycerol supplementation, but returned to control levels regardless of the diet at 24 h. In seabass, the dietary supplementation significantly affected plasma glycerol levels at 6 h with lasting effects at 24 h after last meal, and with values for S5 diet reaching more than 5 mM. After ingestion, glycerol transport across membranes occurs through trans-membrane proteins belonging to a subfamily of the aquaporin (AQP) designated as aquaglyceroporins. These include AQP3, 7, 9 and 10, which are permeable to small solutes such as glycerol and urea as well as water. As such, aquaglyceroporins are involved in salinity acclimation and osmoregulation in fish (Deane and Woo, 2006; Giffard-Mena et al., 2007; Tipsmark et al., 2010). The distribution pattern of aquaglyceroporins along the esophagus, stomach and intestine/midgut (Cutler et al., 2007; Tipsmark et al., 2010; Finn and Cerdà, 2011; Madsen et al., 2014) aligns with water recovery capability from the digestive tract, but at the same time may justify the rapid appearance of dietary glycerol circulating in blood after 6 h. High renal expression of AQP3 in saltwater fish, including seabass (Giffard-Mena et al., 2007), also allows reabsorption of large volumes of water in order to compensate for osmotic water loss. The mechanism of glycerol conduction in aquaglyceroporins is driven by an inherent competition between water and glycerol for hydrogen bonds with specific residues. Accordingly, water is essential for glycerol transport at physiological glycerol concentrations (Jensen et al., 2001), allowing for quick, high absorption rates in seabass compared with freshwater trout. Curiously, in most studies using glycerol-supplemented diets in fish, plasma glycerol levels are not reported. From basal 80 μM, a glycerol intraperitoneal injection of 2 g kg−1 in seabass led to an increase in plasma glycerol levels to more than 1 mM even 48 h after the injection in both fed and fasted fish (Rito et al., 2019). However, the most extreme increases in plasma glycerol are described in the adaptation of rainbow smelt (Osmerus mordax) to cold environments, reaching from 200 to 500 mM (Driedzic et al., 2006; Hall et al., 2015). Once in the bloodstream, the liver has the capacity to import glycerol through AQP9, the major hepatic aquaglyceroporin isoform (Deane and Woo, 2006; Hamdi et al., 2009; Gambardella et al., 2012).
The liver is the primary site for the de novo synthesis of glycerol so several metabolic pathways can mobilize and utilize its three carbons. The gene expressions for aqp9b during embryogenesis in trout does not appear along the setup of the primitive liver and hepatic portal vein, but rather at a later stage just before the first feeding (Panserat et al., 2020). Similar to that reported in trout, the present glycerol-supplemented diets had no effect on the mRNA levels of AQP9 in juvenile seabass liver at both 6 and 24 h (unpublished). Short-term fasting (48 h) followed by refeeding also had no effect in hepatic AQP9 mRNA levels in juvenile trout (Panserat et al., 2020). On the other hand, the presence and distribution of AQP9 in the membrane of seabass hepatocytes increased in long-term (35 d) fasted fish followed by a decrease in refed fish (Gambardella et al., 2012). As gluconeogenesis is the principal source of endogenous glucose production and a significant contributor to blood glucose levels during fasting in seabass (Viegas et al., 2013), increased imports of glycerol to the liver would allow for hepatic glycogen replenishment during refeeding. This process is dominated by indirect pathway fluxes (Viegas et al., 2012), a pathway to which glycerol is a precursor to the triose-phosphate. In fact, a glycerol load was responsible for 40% of blood glucose and 28% of hepatic glycogen appearance in fasted seabass. These contributions fall substantially in fed seabass highlighting how lipolysis-derived glycerol carbons are essential gluconeogenic contributors during food deprivation (Rito et al., 2019). Besides, the capacity of the liver to remove glycerol from blood circulation by other mechanisms of disposal should not be ignored. In rainbow smelt, AQP9 is also abundant in red blood cells (RBC) (Hall et al., 2015). In the scenario of cold adaptation mentioned above, a differentially higher glycerol uptake rate by RBC at higher temperatures (4-fold higher at 8°C than at 1.2°C) has been observed, along with a brutal increase in plasma glycerol (Clow and Driedzic, 2012). The loss of glycerol to water by passive diffusion should also not be disregarded and is worthy of further studies (Ditlecadet et al., 2011). The presence of AQP in gill, skin, and kidney (Finn and Cerdà, 2011) underline the possibility of processes for glycerol loss to water and that such mechanisms could affect freshwater and marine fish differently. Glycerol loss through the skin and gills may impact the bacterial community associated with fish mucus. Interestingly, Louvado et al. (2020) have shown an increased diversity and evenness of the gut microbiota of seabass that have been fed diets with increasing glycerol levels (0, 2.5 and 5%).
Upon entrance in the liver, glycerol kinase catalyzes the initial phosphorylation of glycerol into G3P, which intersects with gluconeogenic/glycolityc pathways after being oxidized into dihydroxyacetone phosphate (DHAP) by G3P dehydrogenase. Both glycerol kinase and G3P dehydrogenase were poorly regulated by dietary glycerol levels in trout (Panserat et al., 2020) and Nile tilapia (Costa et al., 2015); even if G3P dehydrogenase and G3P phosphatase (reverse reaction of glycerol kinase) were deemed essential for cold adaptation in rainbow smelt (Driedzic et al., 2006). However, in trout the kinetics of postprandial regulation of glycerol-related enzymes (at first feeding stage and juvenile stage) when fed glycerol-supplemented diets (Panserat et al., 2020) was similar to the previously reported glycolytic and gluconeogenic genes when fed high-carbohydrate diets (Panserat et al., 2019). This suggests that glycerol metabolism could be poorly regulated on its own and heavily dependent on the nutritional status. This seems to be corroborated by the mRNA levels of intermediary metabolism enzymes evaluated for both species since most were significantly altered by the time of sampling, but not by dietary treatment. Dietary glycerol supplementation at the expenses of corn in Nile tilapia resulted in lower hyperglycemic peaks at 90 min after last meal and a quicker return to baseline values at higher glycerol concentrations. Despite being a species more tolerant to carbohydrates, Nile tilapia revealed the weak potential of dietary glycerol to induce acute hyperglycemic reactions (Santos et al., 2019). This was not the case for trout where alterations in glycemia were considerably higher at 6 h than at 24 h. Postprandial glycemia in trout significantly increases with carbohydrate-rich diets at 8 h after last meal when compared with control (Kamalam et al., 2012). In contrast, seabass glycemia did not differ between sampling times, even though overall, this species presented higher glycemia when compared with trout. Seabass sampled 6 h after last meal with different starch levels (10, 20 and 30%) and different sources (native, waxy and pregelatinized maize starch) (Enes et al., 2006; Moreira et al., 2008) presented no differences in glycemia relative to control. However, metabolic flux models also based in the use of 2H2O revealed that digestible starch significantly contributes to endogenous glucose fluxes, even in the absence of differences in glycemia. These contributions shift from gluconeogenesis towards contributions of unlabeled (dietary) carbohydrates (Viegas et al., 2015). Nonetheless, if compared with trout, the glucose uptake in this species should still be considered sluggish, as corroborated by the fraction of glucose derived from the diet (unlabeled) observed in the present study. In seabass, the unlabeled fraction of glucose appearance was ~30%, which was approximately half of the fraction found in trout (~60%). Besides, while in trout this contribution was not conditioned by dietary glycerol, in seabass it decreased with increasing glycerol inclusion. This was compensated by the heightened contribution from gluconeogenesis at the trioses phosphate level where glycerol is able to participate, along with glycogenolysis-derived glucose. In agreement with this compensation, and even though considerably higher contributions were found in fasted fish, a IP-injected glycerol load was responsible for 10% of blood glucose appearance in fed seabass (Rito et al., 2019).
Contrary to previous reports on trout (Menton et al., 1986), hepatic glycogen levels significantly increased with glycerol supplementation. This was reinforced by a significant increase in HSI in the growth trial. This had already been the case with crude glycerin supplementation in Nile tilapia (Mewes et al., 2016) or channel catfish at levels above 15% (Li et al., 2010). Using radioactive isotopes, 14C-glycerol incorporation into liver glycogen was described several decades ago in rainbow trout (Lech, 1970) and lampreys (Lampetra fluviatilis) (Savina and Wojtczak, 1977). In a more recent study (Costa et al., 2017) a significantly higher amount of radiolabel from a 5% 14C-glycerol diet was recovered from a fraction defined as “non-protein, non-lipid fraction”, from which we speculate most was glycogen. Glycerol utilization for glycogen synthesis has also been observed in gilthead seabream muscle accompanied by an increased energetic status (Silva et al., 2012). Curiously, it has also been observed that the plasma glycerol increases during cold adaptation in rainbow smelt was synthesized primarily from glycogen (Ditlecadet and Driedzic, 2013). On the contrary, during late winter/early spring, plasma glycerol levels decrease accompanied by an increase in glycogen (Driedzic and Short, 2007). A different scenario was revealed in seabass with hepatic glycogen decreasing with increasing levels of glycerol in the growth trial, which was not corroborated in the metabolic trial. In fact, HSI measured in the metabolic trial actually presented the opposite trend raising the question of the metabolic utilization of glycerol. The actual contribution of glycerol as carbon source for gluconeogenesis, which in the context of glycogenesis would be via the indirect pathway (at the triose-phosphate level), significantly increased in trout while no alterations were observed in seabass. In seabass an IP-injected glycerol load was responsible for only 2% of hepatic glycogen appearance in fed seabass (Rito et al., 2019). It is worth mentioning that regardless of the levels of hepatic glycogen at the time fish are placed in 2H2O, this metabolic model evaluates the fractional contribution. In the present study the overall contributions of the indirect pathway for glycogen synthesis were on average 30% in trout and 14% in seabass. The reliability of this estimate lies in the fact that labeling in 2H5 is mandatory (Jones et al., 2006; Soares et al., 2012) and, in the present study, this estimate was further refined by using 2H6S to distinguish Krebs cycle-derived carbons incorporating 2H2O at the level of fumarase (fumarate hydratase) in the Krebs cycle. This is extremely useful to evaluate the contributions of glycerol, but it is unable to discriminate the remaining contributions from direct pathway, pre-existing and cycled glycogen. This cycling is difficult to discriminate from 2H2O but with the assistance of 13C-labeled glucose this was considered extensive (Rito et al., 2018) with the additional technical advantage that NMR spectroscopy allows for convenient analysis of both isotopes in a same sample. In previous versions of the labeling model, regularly fed seabass presented a very low glycogen turnover (Viegas et al., 2012; Viegas et al., 2015).
In conclusion, we present evidence for gluconeogenic utilization of exogenous glycerol by rainbow trout in the synthesis of hepatic glycogen. In seabass, and despite no clear changes observed in glycemia, metabolic flux calculations confirmed that dietary glycerol was significantly involved in the appearance of blood glucose. The findings of the present study suggest that fish species are able to catabolize glycerol as well as retain and incorporate it into carbohydrates. With the use of stable isotopes, we demonstrate that this incorporation fails to substantially spare gluconeogenic amino acids for hepatic G-6-P synthesis.
The original contributions presented in the study are included in the article/Supplementary Material. Further inquiries can be directed to the corresponding author.
The animal study was reviewed and approved by Portuguese Veterinary Authority (1005/92, DGAV-Portugal, according to the guidelines on the protection of animals used for scientific purposes from the European directive 2010/63/UE.
IV, LJM, and SP: conceptualization and supervision. LJM, RO, ES, JR, LT, MP, and IV: growth and metabolic trials. SP, EP-J, and LM: molecular analysis of enzymes. JR, LT, ES, MP, and IV: NMR spectral acquisition and processing. IV, LJM, and SP: data treatment and writing of the original draft. IV and LJM: funding acquisition, project administration, and resources. All authors contributed to the article and approved the submitted version.
This work was supported by Fundação para a Ciência e Tecnologia (FCT; Portugal) through national funds with co- funding from ERDF/FEDER, within the PT2020 Partnership Agreement, and COMPETE 2020: research grant to IV (PTDC/CVT-NUT/2851/2014, PTDC/BAA-AGR/3550/2020); individual grant to MP through Centro2020 (ReNATURE; Centro-01-0145-FEDER-000007); and structural funds to Center for Neuroscience and Cell Biology (UID/NEU/04539/2013) and Centre for Functional Ecology (UID/BIA/04004/2019) and Interdisciplinary Centre of Marine and Environmental Research (UID/Multi/04423/2019; UIDB/04423/2020; UIDP/04423/2020). UC- NMR facilities (REEQ/481/QUI/2006, RECI/QEQ-QFI/0168/2012, Centro-07-CT62-FEDER-002012) and Rede Nacional de Ressonância Magnética Nuclear (RNRMN).
The handling Editor declared past co-authorship with IV, MP and LCT.
The remaining authors declare that the research was conducted in the absence of any commercial or financial relationships that could be construed as a potential conflict of interest.
All claims expressed in this article are solely those of the authors and do not necessarily represent those of their affiliated organizations, or those of the publisher, the editors and the reviewers. Any product that may be evaluated in this article, or claim that may be made by its manufacturer, is not guaranteed or endorsed by the publisher.
We acknowledge John Jones for the expertise and technical support, and are very grateful for the technical support provided by Paulo Rema, Sara Basto & Sara Jorge (UTAD) and Francisca Silva-Brito & Thais Oliveira (CIIMAR).
The Supplementary Material for this article can be found online at: https://www.frontiersin.org/articles/10.3389/fmars.2022.836610/full#supplementary-material
2H, deuterium; 2H2O, deuterated water; AQP, aquaporin; BW, body water; F-6-P, fructose 6-phosphate; fbp, fructose-1,6-bisphosphatase (EC 3.1.3.11); G3P, glycerol-3-phosphate; G-6-P, glucose 6-phosphate; g6pc, glucose-6-phosphatase (EC 3.1.3.9); gck, glucokinase (EC 2.7.1.2); HSI, hepatosomatic index; MAG, monoacetone glucose; pck, phosphoenolpyruvate carboxykinase (EC 4.1.1.32); pk, pyruvate kinase (EC. 2.7.1.40); RAS, recirculated aquatic system; TW, tank water.
Ayoub M., Abdullah A. Z. (2012). Critical Review on the Current Scenario and Significance of Crude Glycerol Resulting From Biodiesel Industry Towards More Sustainable Renewable Energy Industry. Renewable Sustain. Energy Rev. 16, 2671–2686. doi: 10.1016/j.rser.2012.01.054
Balen R. E., Junior G. B., Colpini L. M. S., Bombardelli R. A., Silva L. C. R., Meurer F. (2017). Energia Digestível E Inclusão Da Glicerina Bruta Em Dietas Para Juvenis De Curimbatá Concentrations of Ammonia. B. Inst. Pesca São Paulo 43347 (3), 347–357. doi: 10.20950/1678-2305.2017v43n3p347
Balen R. E., Tetu P. N., Bombardelli R. A., Pozza P. C., Meurer F. (2014). Digestible Energy of Crude Glycerol for Pacu and Silver Catfish. Ciec. Rural 44, 1448–1451. doi: 10.1590/0103-8478cr20131426
Carvalho P. L. D. O., Moreira I., Martins E. N., Piano L. M., Toledo J. B., Costa Filho C. D. L. (2012). Crude Glycerine in Diets for Piglets. Rev. Bras. Zootecnia 41, 1654–1661. doi: 10.1590/S1516-35982012000700014
Carvalho E. R., Schmelz-Roberts N. S., White H. M., Wilcox C. S., Eicher S. D., Donkin S. S. (2012). Feeding Behaviors of Transition Dairy Cows Fed Glycerol as a Replacement for Corn. J. Dairy Sci. 95, 7214–7224. doi: 10.3168/jds.2010-3584
Cerrate S., Yan F., Wang Z., Coto C., Sacakli P., Waldroup P. W. (2006). Evaluation of Glycerine From Biodiesel Production as a Feed Ingredient for Broilers. Int. J. Poultry Sci. 5, 1001–1007. doi: 10.3923/ijps.2006.1001.1007
Chung Y. H., Rico D. E., Martinez C. M., Cassidy T. W., Noirot V., Ames A., et al. (2007). Effects of Feeding Dry Glycerin to Early Postpartum Holstein Dairy Cows on Lactational Performance and Metabolic Profiles. J. Dairy Sci. 90, 5682–5691. doi: 10.3168/jds.2007-0426
Clow K. A., Driedzic W. R. (2012). Glycerol Uptake is by Passive Diffusion in the Heart But by Facilitated Transport in RBCs at High Glycerol Levels in Cold Acclimated Rainbow Smelt (Osmerus Mordax). Am. J. Physiol. - Regulatory Integr. Comp. Physiol. 302, R1012–R1021. doi: 10.1152/ajpregu.00645.2011
Costa D. V. D., Dias J., Colen R., Rosa P. V., Engrola S. (2017). Partition and Metabolic Fate of Dietary Glycerol in Muscles and Liver of Juvenile Tilapia. Arch. Anim. Nutr. 71, 165–174. doi: 10.1080/1745039X.2017.1281579
Costa D. V. D., Paulino R. R., Okamura D., Oliveira M. M. D., Rosa P. V. E. (2015). Growth and Energy Metabolism of Nile Tilapia Juveniles Fed Glycerol. Pesquisa Agropecuária Bras. 50, 347–354. doi: 10.1590/S0100-204X2015000500001
Cutler C. P., Martinez A.-S., Cramb G. (2007). The Role of Aquaporin 3 in Teleost Fish. Comp. Biochem. Physiol. Part A: Mol. Integr. Physiol. 148, 82–91. doi: 10.1016/j.cbpa.2006.09.022
Deane E. E., Woo N. Y. S. (2006). Tissue Distribution, Effects of Salinity Acclimation, and Ontogeny of Aquaporin 3 in the Marine Teleost, Silver Sea Bream (Sparus Sarba). Marine Biotechnol. 8, 663–671. doi: 10.1007/s10126-006-6001-0
Ditlecadet D., Driedzic W. R. (2013). Glycerol-3-Phosphatase and Not Lipid Recycling is the Primary Pathway in the Accumulation of High Concentrations of Glycerol in Rainbow Smelt (Osmerus Mordax). Am. J. Physiol. - Regulatory Integr. Comp. Physiol. 304, R304–R312. doi: 10.1152/ajpregu.00468.2012
Ditlecadet D., Short C. E., Driedzic W. R. (2011). Glycerol Loss to Water Exceeds Glycerol Catabolism via Glycerol Kinase in Freeze-Resistant Rainbow Smelt (Osmerus Mordax). Am. J. Physiol. - Regulatory Integr. Comp. Physiol. 300, R674–R684. doi: 10.1152/ajpregu.00700.2010
Donkin S. S. (2008). Glycerol From Biodiesel Production: The New Corn for Dairy Cattle. Rev. Bras. Zootecnia 37, 280–286. doi: 10.1590/S1516-35982008001300032
Driedzic W. R., Clow K. A., Short C. E., Ewart K. V. (2006). Glycerol Production in Rainbow Smelt (Osmerus Mordax) May Be Triggered by Low Temperature Alone and Is Associated With the Activation of Glycerol-3-Phosphate Dehydrogenase and Glycerol-3-Phosphatase. J. Exp. Biol. 209, 1016. doi: 10.1242/jeb.02086
Driedzic W. R., Short C. E. (2007). Relationship Between Food Availability, Glycerol and Glycogen Levels in Low-Temperature Challenged Rainbow Smelt Osmerus Mordax. J. Exp. Biol. 210, 2866. doi: 10.1242/jeb.003749
EFSA, Panel on Food Additives Nutrient Sources Added to Food, Mortensen A., Aguilar F., Crebelli R., Domenico A. D., et al. (2017). Re-Evaluation of Glycerol (E 422) as a Food Additive. EFSA J. 15 (3), 4720. doi: 10.2903/j.efsa.2017.4720
Enes P., Panserat S., Kaushik S., Oliva-Teles A. (2006). Effect of Normal and Waxy Maize Starch on Growth, Food Utilization and Hepatic Glucose Metabolism in European Sea Bass (Dicentrarchus Labrax) Juveniles. Comp. Biochem. Physiol. Part A: Mol. Integr. Physiol. 143, 89–96. doi: 10.1016/j.cbpa.2005.10.027
European Commission. (2020). Circular Economy Action Plan: for a Cleaner and More Competitive Europe. (Brussels: Directorate-General for Communication, Publications Office). Available at: https://data.europa.eu/doi/10.2779/717149
FDA. (2021). Electronic Code of Federal Regulations - Title 21, Volume 6, Part 582, Subpart B–General Purpose Food Additives Sec. §582.1320 Glycerin. Available at: http://www.accessdata.fda.gov/scripts/cdrh/cfdocs/cfcfr/CFRSearch.cfm?fr=182.1320 (Accessed 10/02/2021 2021).
Finn R. N., Cerdà J. (2011). Aquaporin Evolution in Fishes. Front. Physiol. 2. doi: 10.3389/fphys.2011.00044
Gambardella C., Gallus L., Amaroli A., Terova G., Masini M. A., Ferrando S. (2012). Fasting and Re-Feeding Impact on Leptin and Aquaglyceroporin 9 in the Liver of European Sea Bass (Dicentrarchus Labrax). Aquaculture 354-355, 1–6. doi: 10.1016/j.aquaculture.2012.04.043
Garin D., Rombaut A., Fréminet A. (1987). Determination of Glucose Turnover in Sea Bass Dicentrarchus Labrax. Comparative Aspects of Glucose Utilization. Comp. Biochem. Physiol. Part B: Biochem. Mol. Biol. 87, 981–988. doi: 10.1016/0305-0491(87)90422-6
Giffard-Mena I., Boulo V., Aujoulat F., Fowden H., Castille R., Charmantier G., et al. (2007). Aquaporin Molecular Characterization in the Sea-Bass (Dicentrarchus Labrax): The Effect of Salinity on AQP1 and AQP3 Expression. Comp. Biochem. Physiol. Part A: Mol. Integr. Physiol. 148, 430–444. doi: 10.1016/j.cbpa.2007.06.002
Gonçalves L. U., Cerozi B. D. S., Silva T. S. C., Zanon R. B., Cyrino J. E. P. (2015). Crude Glycerin as Dietary Energy Source for Nile Tilapia. Aquaculture 437, 230–234. doi: 10.1016/j.aquaculture.2014.12.004
Hall J. R., Clow K. A., Rise M. L., Driedzic W. R. (2015). Cloning and Characterization of Aquaglyceroporin Genes From Rainbow Smelt (Osmerus Mordax) and Transcript Expression in Response to Cold Temperature. Comp. Biochem. Physiol. Part B: Biochem. Mol. Biol. 187, 39–54. doi: 10.1016/j.cbpb.2015.05.004
Haman F., Weber J. M. (1996). Continuous Tracer Infusion to Measure In Vivo Metabolite Turnover Rates in Trout. J. Exp. Biol. 199, 1157–1162. doi: 10.1242/jeb.199.5.1157
Hamdi M., Sanchez M. A., Beene L. C., Liu Q., Landfear S. M., Rosen B. P., et al. (2009). Arsenic Transport by Zebrafish Aquaglyceroporins. BMC Mol. Biol. 10, 104. doi: 10.1186/1471-2199-10-104
Hua K., Cobcroft J. M., Cole A., Condon K., Jerry D. R., Mangott A., et al. (2019). The Future of Aquatic Protein: Implications for Protein Sources in Aquaculture Diets. One Earth 1, 316–329. doi: 10.1016/j.oneear.2019.10.018
Jensen M.Ø., Tajkhorshid E., Schulten K. (2001). The Mechanism of Glycerol Conduction in Aquaglyceroporins. Structure 9, 1083–1093. doi: 10.1016/S0969-2126(01)00668-2
Jones J. G., Fagulha A., Barosa C., Bastos M., Barros L., Baptista C., et al. (2006). Noninvasive Analysis of Hepatic Glycogen Kinetics Before and After Breakfast With Deuterated Water and Acetaminophen. Diabetes 55, 2294–2300. doi: 10.2337/db06-0304
Jones J. G., Merritt M., Malloy C. (2001). Quantifying Tracer Levels of 2H2O Enrichment From Microliter Amounts of Plasma and Urine by 2H NMR. Magnetic Resonance Med. 45, 156–158. doi: 10.1002/1522-2594(200101)45:1<156::AID-MRM1020>3.0.CO;2-Z
Kamalam B. S., Médale F., Kaushik S., Polakof S., Skiba-Cassy S., Panserat S. (2012). Regulation of Metabolism by Dietary Carbohydrates in Two Lines of Rainbow Trout Divergently Selected for Muscle Fat Content. J. Exp. Biol. 215, 2567–2578. doi: 10.1242/jeb.070581
Lammers P. J., Kerr B. J., Weber T. E., Dozier W. A. III, Kidd M. T., Bregendahl K., et al. (2008). Digestible and Metabolizable Energy of Crude Glycerol for Growing Pigs. J. Anim. Sci. 86, 602–608. doi: 10.2527/jas.2007-0453
Lech J. J. (1970). Glycerol Kinase and Glycerol Utilization in Trout (Salmo Gairdneri) Liver. Comp. Biochem. Physiol. 34, 117–124. doi: 10.1016/0010-406X(70)90058-7
Li M. H., Minchew C. D., Oberle D. F., Robinson E. H. (2010). Evaluation of Glycerol From Biodiesel Production as a Feed Ingredient for Channel Catfish, Ictalurus Punctatus. J. World Aquaculture Soc. 41, 130–136. doi: 10.1111/j.1749-7345.2009.00320.x
Louvado A., Coelho F. J. R. C., Palma M., Tavares L. C., Ozorio R. O. A., Magnoni L., et al. (2020). Effect of Glycerol Feed-Supplementation on Seabass Metabolism and Gut Microbiota. Appl. Microbiol. Biotechnol. 104, 8439–8453. doi: 10.1007/s00253-020-10809-3
Madsen S. S., Bujak J., Tipsmark C. K. (2014). Aquaporin Expression in the Japanese Medaka (Oryzias Latipes) in Freshwater and Seawater: Challenging the Paradigm of Intestinal Water Transport? J. Exp. Biol. 217, 3108. doi: 10.1242/jeb.105098
Magnoni L., Rema P., Silva-Brito F., Rito J., Palma M., Ozorio R., et al. (2021). Dietary Glycerol Inclusion Decreases Growth Performance and Nitrogen Retention Efficiency in Rainbow Trout (Oncorhynchus Mykiss). Aquaculture 535, 736383. doi: 10.1016/j.aquaculture.2021.736383
Marandel L., Seiliez I., Véron V., Skiba-Cassy S., Panserat S. (2015). New Insights Into the Nutritional Regulation of Gluconeogenesis in Carnivorous Rainbow Trout (Oncorhynchus Mykiss): A Gene Duplication Trail. Physiol. Genomics 47, 253–263. doi: 10.1152/physiolgenomics.00026.2015
Martins F. O., Rito J., Jarak I., Viegas I., Pardal M. A., Macedo M. P., et al. (2013). Disposition of [U-2H7]Glucose Into Hepatic Glycogen in Rat and in Seabass. Comp. Biochem. Physiol. Part A: Mol. Integr. Physiol. 166, 316–322. doi: 10.1016/j.cbpa.2013.07.002
Mendoza O. F., Ellis M., Mckeith F. K., Gaines A. M. (2010). Metabolizable Energy Content of Refined Glycerin and its Effects on Growth Performance and Carcass and Pork Quality Characteristics of Finishing Pigs. J. Anim. Sci. 88, 3887–3895. doi: 10.2527/jas.2010-2873
Menton D. J., Slinger S. J., Hilton J. W. (1986). Utilization of Free Glycerol as a Source of Dietary Energy in Rainbow Trout (Salmo Gairdneri). Aquaculture 56, 215–227. doi: 10.1016/0044-8486(86)90337-6
Mewes J. K., Meurer F., Tessaro L., Buzzi A. H., Syperreck M. A., Bombardelli R. A. (2016). Diets Containing Crude Glycerin Damage the Sperm Characteristics and Modify the Testis Histology of Nile Tilapia Broodstock. Aquaculture 465, 164–171. doi: 10.1016/j.aquaculture.2016.08.035
Min Y. N., Yan F., Liu F. Z., Coto C., Waldroup P. W. (2010). Glycerin - A New Energy Source for Poultry. Int. J. Poultry Sci. 9, 1–4. doi: 10.3923/ijps.2010.1.4
Moesch A., Meurer F., Zadinelo I. V., Carneiro W. F., Da Silva L. C. R., Dos Santos L. D. (2016). Growth, Body Composition and Hepatopancreas Morphology of Nile Tilapia Fingerlings Fed Crude Glycerol as a Replacement for Maize in Diets. Anim. Feed Sci. Technol. 219, 122–131. doi: 10.1016/j.anifeedsci.2016.05.009
Moreira I. S., Peres H., Couto A., Enes P., Oliva-Teles A. (2008). Temperature and Dietary Carbohydrate Level Effects on Performance and Metabolic Utilisation of Diets in European Sea Bass (Dicentrarchus Labrax) Juveniles. Aquaculture 274, 153–160. doi: 10.1016/j.aquaculture.2007.11.016
Neu D. H., Furuya W. M., Boscolo W. R., Potrich F. R., Lui T. A., Feiden A. (2013). Glycerol Inclusion in the Diet of Nile Tilapia (Oreochromis Niloticus) Juveniles. Aquaculture Nutr. 19, 211–217. doi: 10.1111/j.1365-2095.2012.00968.x
Nunes P. M., Jones J. G. (2009). Quantifying Endogenous Glucose Production and Contributing Source Fluxes From a Single 2H NMR Spectrum. Magnetic Resonance Med. 62, 802–807. doi: 10.1002/mrm.22062
OECD/FAO (2019). “Chapter 9: Biofuels,” in OECD-FAO Agricultural Outlook (Edition 2019) (Rome: OECD Publishing, Paris/Food and Agriculture Organization of the United Nations), 191 – 206.
Oliveira L., Madrid J., Ramis G., Martínez S., Orengo J., Villodre C., et al. (2014). Adding Crude Glycerin to Nursery Pig Diet: Effect on Nutrient Digestibility, Metabolic Status, Intestinal Morphology and Intestinal Cytokine Expression. Livestock Sci. 167, 227–235. doi: 10.1016/j.livsci.2014.05.013
Palma M., Tavares L. C., Rito J., Henriques L. F., Silva J. G., Ozório R., et al. (2019). Metabolic Effects of Dietary Glycerol Supplementation in Muscle and Liver of European Seabass and Rainbow Trout by 1H NMR Metabolomics. Metabolites 9, 202. doi: 10.3390/metabo9100202
Palma M., Trenkner L.H., Rito J., Tavares L.C., Silva E., Glencross B.D., et al. (2020). Limitations to Starch Utilization in Barramundi (Lates calcarifer) as Revealed by NMR-Based Metabolomics. Frontiers in Physiology 11, 205. doi: 10.3389/fphys.2020.00205
Panserat S., Marandel L., Seiliez I., Skiba-Cassy S. (2019). New Insights on Intermediary Metabolism for a Better Understanding of Nutrition in Teleosts. Annu. Rev. Anim. Biosci. 7, 195–220. doi: 10.1146/annurev-animal-020518-115250
Panserat S., Plagnes-Juan E., Gazzola E., Palma M., Magnoni L. J., Marandel L., et al. (2020). Hepatic Glycerol Metabolism-Related Genes in Carnivorous Rainbow Trout (Oncorhynchus Mykiss): Insights Into Molecular Characteristics, Ontogenesis, and Nutritional Regulation. Front. Physiol. 11. doi: 10.3389/fphys.2020.00882
Rito J., Viegas I., Pardal M. A., Metón I., Baanante I. V., Jones J. G. (2018). Disposition of a Glucose Load Into Hepatic Glycogen by Direct and Indirect Pathways in Juvenile Seabass and Seabream. Sci. Rep. 8, 464. doi: 10.1038/s41598-017-19087-y
Rito J., Viegas I., Pardal M.Â., Metón I., Baanante I. V., Jones J. G. (2019). Utilization of Glycerol for Endogenous Glucose and Glycogen Synthesis in Seabass (Dicentrarchus Labrax): A Potential Mechanism for Sparing Amino Acid Catabolism in Carnivorous Fish. Aquaculture 498, 488–495. doi: 10.1016/j.aquaculture.2018.08.066
Santos L. D. D., Zadinelo I. V., Moesch A., Bombardelli R. A., Meurer F. (2019). Crude Glycerol in Diets for Nile Tilapia in the Fattening Stage. Pesquisa Agropecuária Bras. 54, e00460. doi: 10.1590/S1678-3921.pab2019.v54.00460
Savina M. V., Wojtczak A. B. (1977). Enzymes of Gluconeogenesis and the Synthesis of Glycogen From Glycerol in Various Organs of the Lamprey (Lampetra Fluviatilis). Comp. Biochem. Physiol. Part B: Comp. Biochem. 57, 185–190. doi: 10.1016/0305-0491(77)90141-9
Silva T. S., Matos E., Cordeiro O. D., Colen R., Wulff T., Sampaio E., et al. (2012). Dietary Tools to Modulate Glycogen Storage in Gilthead Seabream Muscle: Glycerol Supplementation. J. Agric. Food Chem. 60, 10613–10624. doi: 10.1021/jf3023244
Soares A., Carvalho R., Veiga F., Alves M., Viegas I., González J., et al. (2012). Restoration of Direct Pathway Glycogen Synthesis Flux in the STZ-Diabetes Rat Model by Insulin Administration. Am. J. Physiol. - Endocrinol. Metab. 303, E875–E885. doi: 10.1152/ajpendo.00161.2012
Song X., Marandel L., Skiba-Cassy S., Corraze G., Dupont-Nivet M., Quillet E., et al. (2018). Regulation by Dietary Carbohydrates of Intermediary Metabolism in Liver and Muscle of Two Isogenic Lines of Rainbow Trout. Front. Physiol. 9. doi: 10.3389/fphys.2018.01579
Theisen M. T., Bombardelli R. A., Meurer F., Ferreira R. L., Da Silva L. C. R. (2020). Crude Glycerol Inclusion in Diets for Post-Larvae Rhamdia Voulezi and Rhamdia Branneri. Aquaculture Res. 51, 1313–1316. doi: 10.1111/are.14465
Tipsmark C. K., Sørensen K. J., Madsen S. S. (2010). Aquaporin Expression Dynamics in Osmoregulatory Tissues of Atlantic Salmon During Smoltification and Seawater Acclimation. J. Exp. Biol. 213, 368. doi: 10.1242/jeb.034785
Viegas I., Jarak I., Rito J., Carvalho R. A., Metón I., Pardal M. A., et al. (2016). Effects of Dietary Carbohydrate on Hepatic De Novo Lipogenesis in European Seabass (Dicentrarchus Labrax L.). J. Lipid Res. 57, 1264–1272. doi: 10.1194/jlr.M067850
Viegas I., Mendes V. M., Leston S., Jarak I., Carvalho R. A., Pardal M.Â., et al. (2011). Analysis of Glucose Metabolism in Farmed European Sea Bass (Dicentrarchus Labrax L.) Using Deuterated Water. Comp. Biochem. Physiol. Part A: Mol. Integr. Physiol. 160, 341–347. doi: 10.1016/j.cbpa.2011.06.029
Viegas I., Rito J., González J. D., Jarak I., Carvalho R. A., Metón I., et al. (2013). Effects of Food-Deprivation and Refeeding on the Regulation and Sources of Blood Glucose Appearance in European Seabass (Dicentrarchus Labrax L.). Comp. Biochem. Physiol. Part A: Mol. Integr. Physiol. 166, 399–405. doi: 10.1016/j.cbpa.2013.07.013
Viegas I., Rito J., Jarak I., Leston S., Caballero-Solares A., Metón I., et al. (2015). Contribution of Dietary Starch to Hepatic and Systemic Carbohydrate Fluxes in European Seabass (Dicentrarchus Labrax L.). Br. J. Nutr. 113, 1345–1354. doi: 10.1017/S0007114515000574
Viegas I., Rito J., Jarak I., Leston S., Carvalho R. A., Metón I., et al. (2012). Hepatic Glycogen Synthesis in Farmed European Seabass (Dicentrarchus Labrax L.) is Dominated by Indirect Pathway Fluxes. Comp. Biochem. Physiol. Part A: Mol. Integr. Physiol. 163, 22–29. doi: 10.1016/j.cbpa.2012.04.023
Keywords: 2H NMR, aquaculture, blood glucose, circular economy, deuterated water, glycerol, hepatic glycogen
Citation: Viegas I, Tavares LC, Plagnes-Juan E, Silva E, Rito J, Marandel L, Palma M, Ozório ROA, Magnoni LJ and Panserat S (2022) On the Utilization of Dietary Glycerol in Carnivorous Fish - Part I: Insights Into Hepatic Carbohydrate Metabolism of Juvenile Rainbow Trout (Oncorhynchus mykiss) and European Seabass (Dicentrarchus labrax). Front. Mar. Sci. 9:836610. doi: 10.3389/fmars.2022.836610
Received: 15 December 2021; Accepted: 09 March 2022;
Published: 26 April 2022.
Edited by:
Brett Glencross, University of Stirling, United KingdomReviewed by:
Min Xue, Feed Research Institute (CAAS), ChinaCopyright © 2022 Viegas, Tavares, Plagnes-Juan, Silva, Rito, Marandel, Palma, Ozório, Magnoni and Panserat. This is an open-access article distributed under the terms of the Creative Commons Attribution License (CC BY). The use, distribution or reproduction in other forums is permitted, provided the original author(s) and the copyright owner(s) are credited and that the original publication in this journal is cited, in accordance with accepted academic practice. No use, distribution or reproduction is permitted which does not comply with these terms.
*Correspondence: Ivan Viegas, aXZpZWdhc0B1Yy5wdA==
†ORCID: Ivan Viegas, orcid.org/0000-0003-2589-2212
Ludgero C. Tavares, orcid.org/0000-0002-2324-1259
Leonardo J. Magnoni, orcid.org/0000-0001-8449-6071
Mariana Palma, orcid.org/0000-0002-0564-8442
Rodrigo Ozório, orcid.org/0000-0002-3533-3126
Stéphane Panserat, orcid.org/0000-0002-4479-9868
‡Present address: Leonardo J. Magnoni, The New Zealand Institute for Plant and Food Research Limited, Port Nelson, Nelson, New Zealand
Disclaimer: All claims expressed in this article are solely those of the authors and do not necessarily represent those of their affiliated organizations, or those of the publisher, the editors and the reviewers. Any product that may be evaluated in this article or claim that may be made by its manufacturer is not guaranteed or endorsed by the publisher.
Research integrity at Frontiers
Learn more about the work of our research integrity team to safeguard the quality of each article we publish.