
94% of researchers rate our articles as excellent or good
Learn more about the work of our research integrity team to safeguard the quality of each article we publish.
Find out more
ORIGINAL RESEARCH article
Front. Mar. Sci., 28 July 2022
Sec. Marine Conservation and Sustainability
Volume 9 - 2022 | https://doi.org/10.3389/fmars.2022.835096
 Charlotte Aston1,2*
 Tim Langlois1,2
 Rebecca Fisher3
 Jacquomo Monk4
 Brooke Gibbons1,2
 Anita Giraldo-Ospina1,2,5
 Emma Lawrence6
 John Keesing1,7
 Ulysse Lebrec8,9
 Russ C. Babcock10
No-take marine reserves are often located in remote locations far away from human activity, limiting perceived impact on extractive users but also reducing their use for investigating impacts of fishing. This study aimed to establish a benchmark in the distribution of fished species across the Ningaloo Marine Park – Commonwealth (NMP-Commonwealth), and adjacent comparable habitats within the Ningaloo Marine Park - State (NMP-State), in Western Australia to test if there was evidence of an effect of recreational fishing, as no commercial fishing is allowed within either marine park. We also examined whether the remote location of the newly established (2018) No-take Zone (NTZ), in NMP-Commonwealth, limits its use for studying the effects of fishing. Throughout the NMP-Commonwealth and NMP-State, where recreational fishing is permitted, we expected the abundance of recreationally fished fish species to increase with increasing distance to the nearest boat ramp, as a proxy of recreational fishing effort. Conversely, we did not expect the abundance of non-fished species and overall species richness to vary in response to the proxy for human activity. Distance to the nearest boat ramp was found to be a strong predictor of fished species abundance, indicating that the effect of recreational fishing can be detected across the NMP-Commonwealth. The effect of the NTZ on fished species abundance was weakly positive, but this difference across the NTZ is expected to increase over time. Habitat composition predictors were only found to influence species richness and non-fished species abundance. This study suggests a clear footprint of recreational fishing across the NMP-Commonwealth and as a result the new NTZ, despite its remote location, can act as a control in future studies of recreational fishing effects.
There is incontrovertible evidence that marine sanctuaries protect vulnerable marine ecosystems and biodiversity, and strengthen their resilience to climate change (Edgar et al., 2014). Globally, No-Take Zones (NTZs) are being established in order to conserve biodiversity and further our understanding of marine ecosystem processes by acting as a control for the effects of fishing (Langlois & Ballantine, 2005; Costello, 2014). In Australia all waters within 5 km of the coast are managed primarily by individual states, with water further offshore up to 370 km managed at the national level as part of the Commonwealth of Australia. As of 2021, the Australian government had declared 45% of Commonwealth waters as marine parks (MPs), with the objectives of protecting and conserving biodiversity, cultural and heritage values, whilst maintaining sustainable use and enjoyment (Marine Division - DSEWPC, 2012; Parks Australia, 2019). Approximately, 20% of the Commonwealth Australian Marine Park (AMP) network is currently designated as NTZs (Phillips, 2017). Amongst extractive uses, both commercial and recreational fishing are recognised as important socio-economic values of Australia’s MPs (Young et al., 2014). During the AMP planning process, compromises were made to reduce the overlap of zones offering high levels of protection (e.g. NTZs) with extractive activities such as commercial and recreational fishing, resulting in AMPs where the newly established NTZs are remote from human activity (Buxton & Cochrane, 2015; Moore et al., 2016; Edgar et al., 2018). This is a common narrative in both NTZ and MP planning around Australia. Many of the NTZs within State waters (within 5 km of the coast) are either very remote or for those located in high human use areas, are either very small or have legalised shore fishing zones which likely undermine their potential benefits to biodiversity conservation and science (Wescott, 2006; Kellner et al., 2007; McLaren et al. 2015).
Whilst recreational fishing is an important socioeconomic value for Australia’s MPs, recreational effort and its impacts are not easily measured, especially compared to commercial fishing where detailed metrics from established sources are available (Young et al., 2014). Where both commercial and recreational fishing occur, disentangling their effects is complex and typically requires consistent data collection over large spatial scales (Brooker et al., 2020). Commercial fishing has been absent from the Ningaloo Marine Park (Commonwealth [NMP-Commonwealth]) since 1987 and so fishing pressure within the MP is almost exclusively recreational (Department of Biodiversity Conservation and Attractions, 2017). The establishment of the NTZ within the NMP-Commonwealth in 2018 provides an opportunity to investigate the impact of recreational fishing in isolation (Director of National Parks, 2018). A variety of proxies have been suggested for recreational fishing effort, with the two most prevalent being 1) distance to boat ramp (Stuart-Smith et al., 2008) and 2) human gravity, where the local human population density (Cinner et al., 2018) or rate of visitation (Brooker et al., 2020) decays with increasing distance from access points. Within the Ningaloo region, which is a popular but seasonal tourist destination, the transient nature of the human population (Smallwood et al., 2011) and lack of consistent visitation data means that any gravity metric is likely to be ineffective as a proxy for recreational fishing effort within NMP-Commonwealth. Cresswell et al. (2019) synthesis of 30 years of monitoring data of fish assemblages within the State MP further highlighted the lack of visitor information as a major limitation to distinguish patterns inside or outside established NTZ. Due to the lack of consistent visitation data in the region, we chose to use distance to boat ramp as a proxy for recreational fishing pressure. Although it is known that patterns of boat ramp use in the Ningaloo region are highly seasonal Smallwood et al. (2011); Cresswell et al. (2019) also found that the limited visitation data was insufficient to rank visitation rates or likely fishing pressure between access points. As with the majority of NTZs within the AMP network, the new NTZ within the NMP-Commonwealth is distant from existing access points for recreational fishing (Figure 1), potentially confounding its role to act as a control for the effects of fishing.
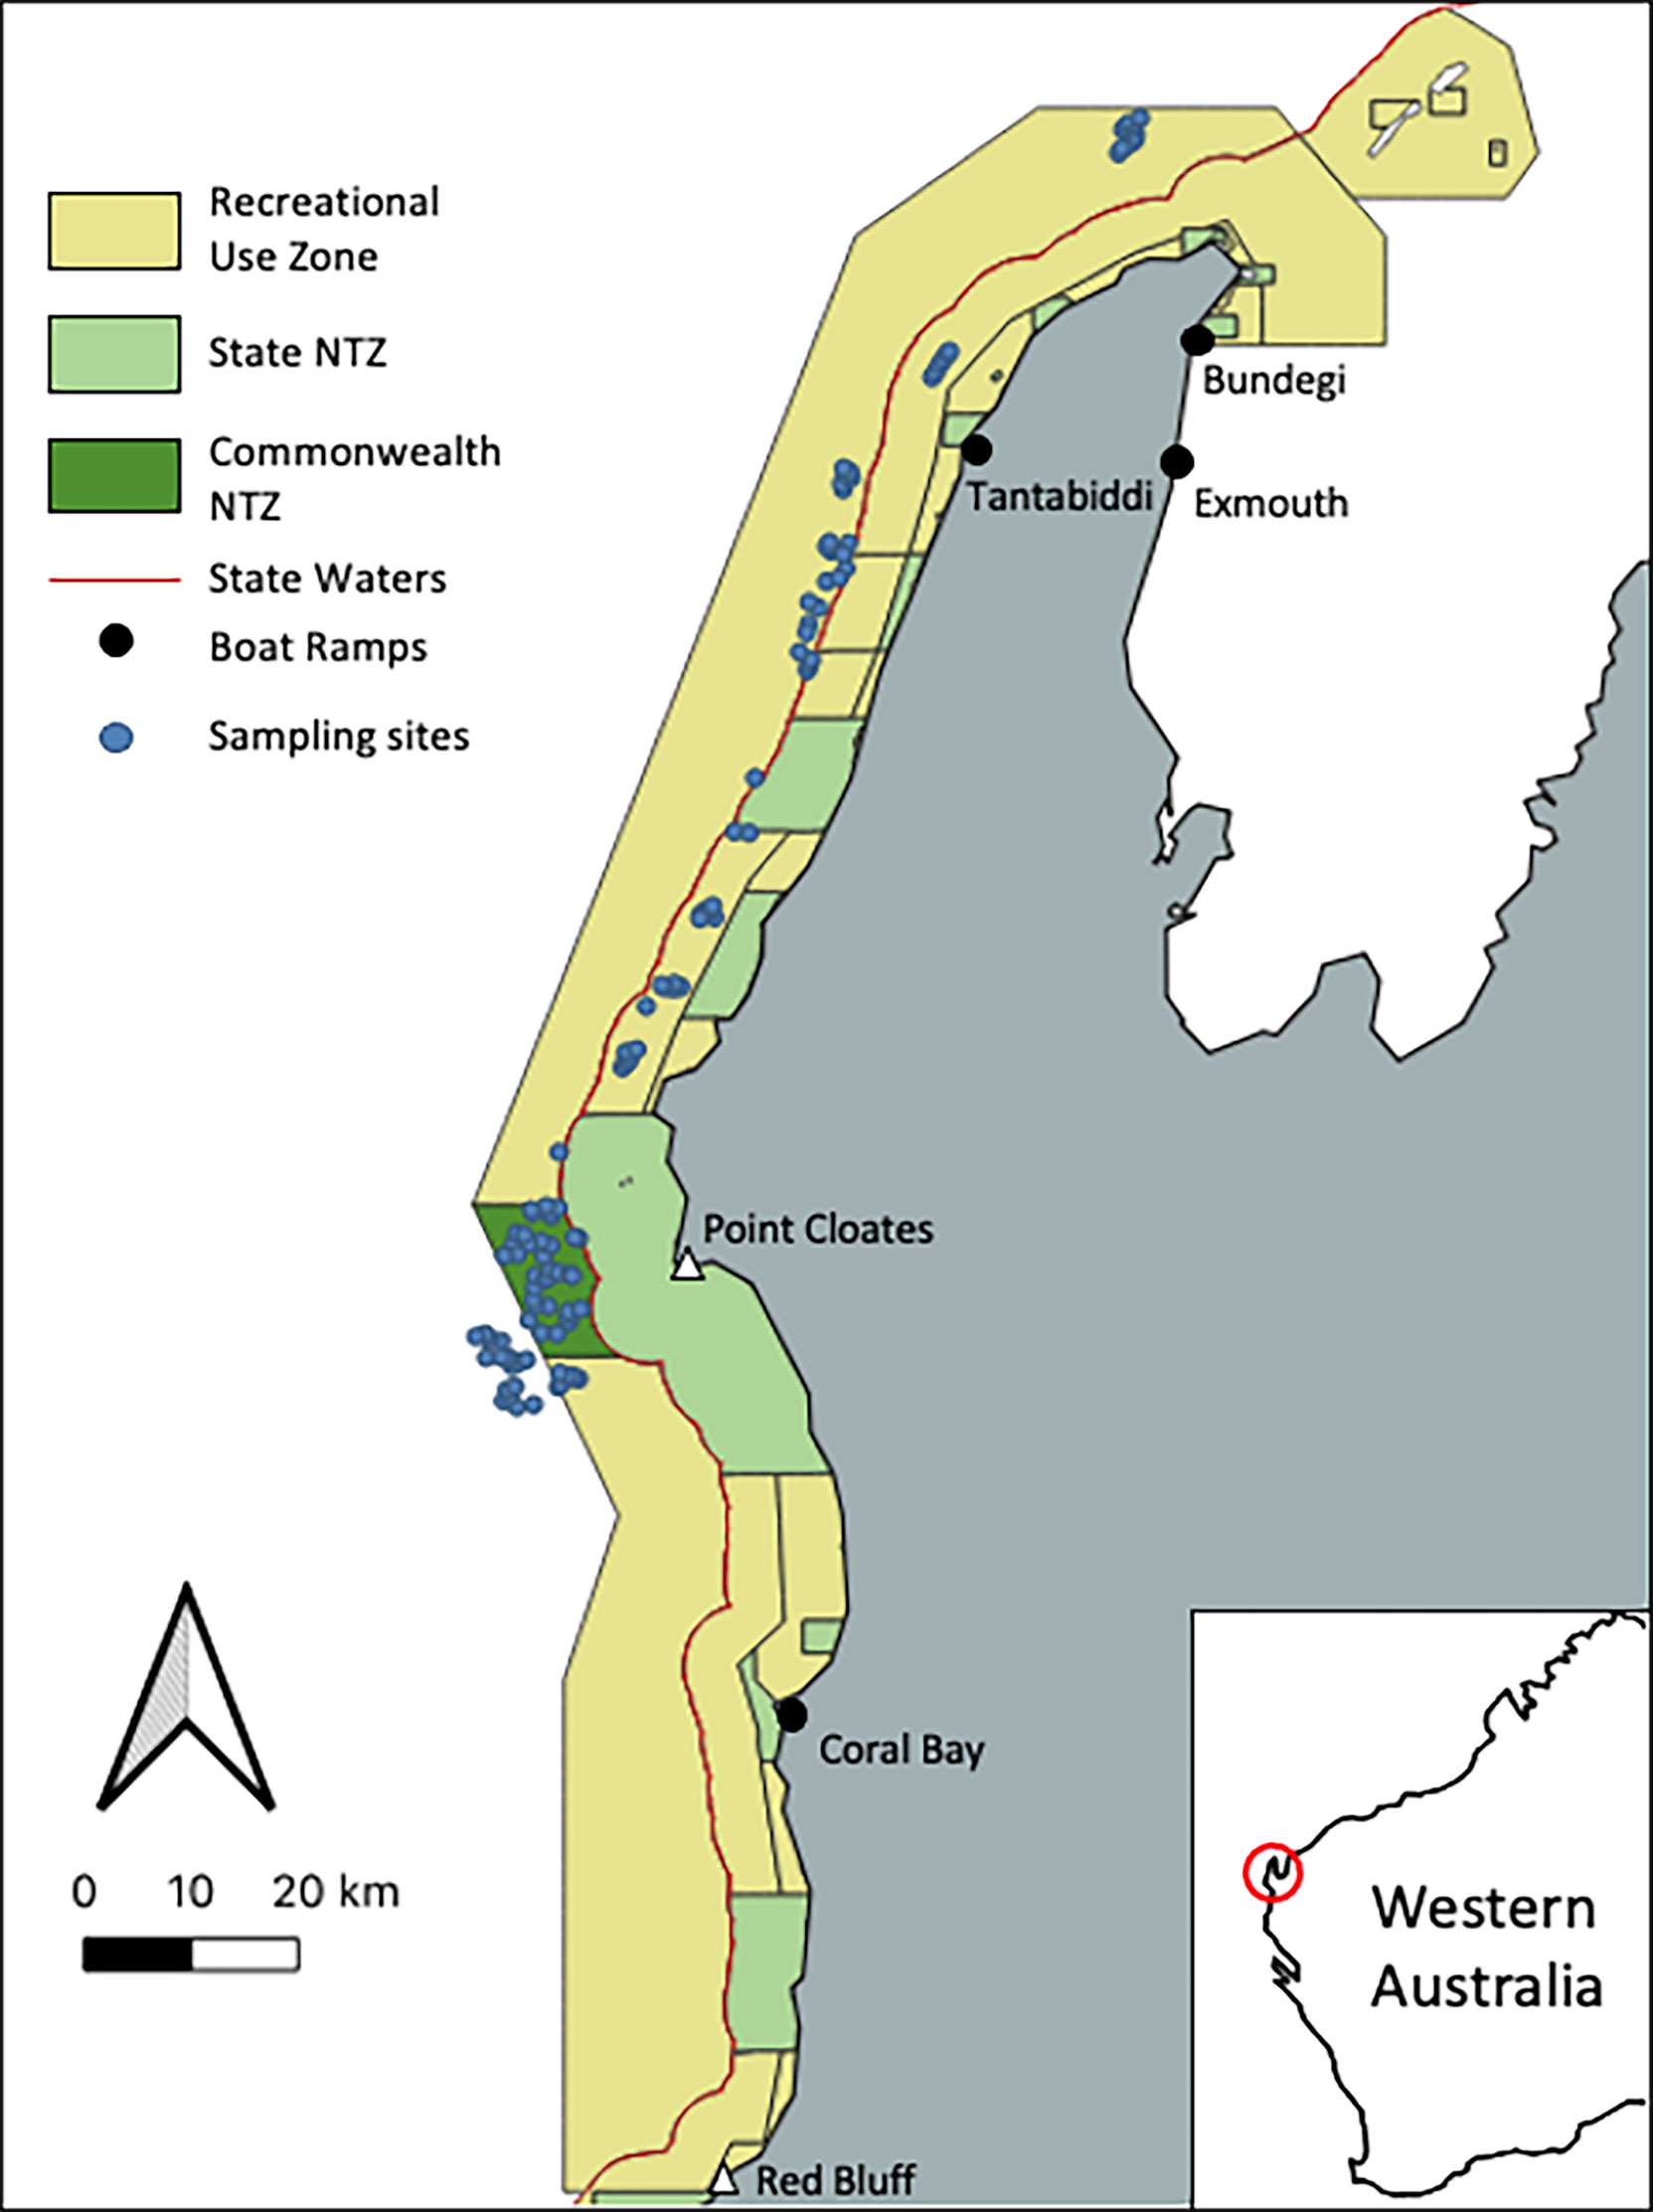
Figure 1 Map of sampling design for the NMP-Commonwealth showing the location of the 122 sampling points (blue dots), the no-take zone and the recreational use zone where recreational fishing is permitted. The black dots indicate boat ramps likely to be used by recreational fishers for access to the NMP-Commonwealth.
Underwood (1995)argued that treating management actions as testable hypotheses will improve the ability of ecological research to inform management decisions. The new NTZ in the NMP-Commonwealth provides a control for the experiment that is fishing, allowing us to test its effects (Langlois & Ballantine, 2005). Like any well-designed experiment, factors that may confound the results must be accounted for. In this case, the NTZ is situated at the furthest location from the main access points for boat based recreational fishing (Figure 1). This study aims to determine whether the role of the new NTZ to act as a control for the effects of fishing is in fact confounded by its remote location within the NMP-Commonwealth and the adjacent established inshore State NTZ in the State MP or, whether we are likely to be able to disentangle location effects (e.g. the new but remote NTZ) from recreational fishing pressure, using distance to boat ramp as a proxy for fishing effort. The abundance of fished demersal fish species greater than legal size, was used to investigate the effect of recreational fishing, as it has been successfully used to understand the impacts of NTZ’s within the shallow waters of the Ningaloo Marine Park (State waters, Haberstroh et al., 2022) and nationally as an indicator of fishing effects within other MPs (Evans & Russ, 2004; McLaren et al., 2015; Bosch et al., 2021). Indeed, the abundance of fished demersal fish species less than legal has also been suggested to be a useful metric to investigate habitat associations and potential post-release mortality impacts (Cresswell et al., 2019, Bosch et al., 2021). To distinguish trends in fish abundance and composition not associated with recreational fishing pressure across the NMP-Commonwealth, we also investigated the abundance of non-fished species and species richness.Habitat is highly influential on the abundance, distribution and assemblage structure of demersal fish species across both NTZs and fished areas (Wilson et al., 2010). Only very coarse (>250 m grid size) bathymetry data from the Australian Bathymetry and Topography Grid (Whiteway, 2009) was available for most of the planning for the AMP network and unknown strong habitat gradients may exist across the newly established NTZ (Bax, 2011; Devillers et al., 2015). To determine whether habitat availability may also be confounding the effect of the NTZ, we explored habitat information as covariates at different spatial scales. In this study we contrasted the ability of available detailed bathymetry derivatives (5 m grid size) from multibeam sonar data with and without habitat composition data from field of view classification (Langlois et al., 2020). We hypothesised that the habitat composition data from field of view classification (Collins et al., 2017) would be the most useful predictor of fish abundance and species richness.For biodiversity monitoring to provide relevant information for MP management, e.g. through an evidence based decision making framework (Hayes et al., 2019), it is not sufficient to say that fishing or the implementation of a NTZ is having an effect. This influence must be quantified and described, typically through the use of effect sizes (Rouphael et al., 2011). An effect size can be interpreted as a measure of the magnitude of the difference between two treatments (e.g. fished areas and no-take areas) or per unit change in a continuous predictor (Rouphael et al., 2011). To improve the robustness of effect size estimates, we employed Bayesian methods to calculate posterior distributions for the size of any effects detected. The use of Bayesian models for ecological inference has multiple advantages, including model validity at any sample size and no requirement of normally distributed model parameters (van de Schoot et al., 2014). Using robust estimates of effect sizes to inform management is important for MPs to achieve their overall conservation goals, as they enable managers, via monitoring and improvement frameworks, to consider what changes or trends are ecologically and socially acceptable (Underwood, 2000). The use of Bayesian methods to calculate posterior distributions for effect sizes will also enable the importance of competing predictors (e.g. distance to boat ramp and NTZ status) to be compared.
Compared to near-shore MPs, there are fewer studies exploring how to effectively assess and monitor human impacts in offshore MPs that are often both expansive and remote (Alemany et al., 2013; Lawrence et al., 2015; Perkins et al., 2017; Hill et al., 2018; Sagar et al., 2020). In the case of Australia’s remote Commonwealth MPs, the isolated location of many of the NTZs, often far away from human activity, may hinder our ability to use them as a control for fishing or determine biodiversity benefits. By establishing a benchmark fish assemblage metrics across the newly established NMP-Commonwealth, we will determine if recreational fishing, a key socio-economic value and existing pressure in this MP, has the expected impact of decreasing the abundance of fished species greater than legal sized. As the NTZ within the NMP-Commonwealth has only recently been established (2018) we would not predict that fished species would have increased substantially within its boundaries (Babcock et al., 2010). Despite the remote location of the NTZ, we hypothesised that distance from the nearest boat ramp will be a more important predictor than NTZ status, and therefore that the NTZ will still be able to provide an effective control to study the impacts of recreational fishing into the future.
The Ningaloo coastline is located in the subtropics of north-western Western Australia (WA). It is approximately 260 km long, extending from Red Bluff in the south to the North West Cape in the north and includes the largest fringing coral reef in Australia (Ningaloo Coast: World Heritage nomination, 2010). Two MPs were gazetted in 1987 to protect the region’s significant biodiversity, with all waters between three nautical miles and the high-water mark managed as part of the State Ningaloo Marine Park (NMP), and water seaward of this up to 200 nautical miles managed by the Commonwealth. Commercial fishing has been heavily restricted within both the State and Commonwealth MPs, with effectively no commercial fishing since 1987 (Department of Biodiversity Conservation and Attractions, 2017). All of the NMP-Commonwealth was designated a recreational use zone until 2018, when the park was rezoned to include a 116 km2 NTZ (Director of National Parks, 2018). The NTZ follows the IUCN’s guidelines for zoning, prohibiting all extractive activities including recreational fishing (Day et al., 2012). Seward of the NMP-Commonwealth lies the Gascoyne MP which does allow commercial fishing and this study was not able to control for edge effects on the seaward extent of the NTZ. However, evidence suggests that the level of fishing effort in the Gascoyne MP is low and therefore unlikely to significantly impact the results (Lynch et al., 2020a).
Data collection occurred between the 12th-17th of August 2019. A probabilistic, spatially balanced approach was used to develop a survey design for the area, with the probability of a site being selected for sampling being weighted according to predetermined factors, whilst maintaining adequate spatial representation (Robertson et al., 2013; Foster et al., 2018; Foster, 2021). The sites sampled included a combination of historic sites that had been previously sampled in 2006, 2009, 2013, 2014 and 2015 and new sites for this study (Figure 1). A small number of historic monitoring sites were also sampled with a view to carrying out before-after analysis however this is not the focus of this study.
Sites were selected such that samples were taken from the different zones across the NMP-Commonwealth (no-take IUCN II, recreational use IUCN IV) as well as from comparable areas in the general use zone of the state Ningaloo MP and in the Gascoyne MP offshore of the Commonwealth NMP. To ensure that the samples selected were spatially balanced, the probability that a site was selected for sampling was adjusted according to various factors. Inclusion probabilities were weighted to ensure that similar numbers of samples were taken from each of the historically sampled years and that these sites were not too densely clustered. Fish biodiversity was expected to be highest where bathymetric features such as ridges or reef platforms were present (Monk et al., 2016) and so existing bathymetric features were used to calculate a Terrain Position Index (TPI). TPI was calculated as the difference between the depth of each cell and the mean value for depth in the eight neighbouring cells following the method outlined in (Weiss, 2001). This was computed using a kernel matrix and a smoothing factor was applied to create a 25m grid of TPI for the study area. TPI was then used to categorise the area into eight groups, and inclusion probabilities were altered to ensure that equal numbers of samples were taken from each of these groups. Additionally, the samples were clustered in groups of six allowing multiple stereo-BRUV systems to be deployed, left to record for 60 minutes, and then retrieved simultaneously, maximising cost and time effectiveness. For a full description of how the sampling design was created see Keesing et al. (2021).The final sampling design included 193 sampling sites, of which samples from 117 sites were used in the final analysis.
Data on fish species composition, relative abundance and length was collected using baited remote underwater stereo video camera (stereo-BRUV) systems (Langlois et al., 2020). Each stereo-BRUV consisted of two Canon 4K HG25 cameras in plastic housings, mounted 0.7m apart and angled towards each other at 7° degrees. The angled camera allows determination of the distance and angle of the fish relative to the camera, as well as precise measurement of fish length. Each system also contained a backwards facing camera to collect additional habitat information which was combined with data from the front facing cameras. A wire mesh bait bag containing 800-1000g of pilchards (Sardinops spp.) was suspended approximately 1.2 m in front of the cameras to attract fish to the stereo-BRUV. A previous study at Ningaloo has suggested that the relative abundance of herbivores and carnivores does not substantially differ between baited and unbaited sampling methods (Langlois et al., 2010), although other studies have documented consistent biases from baited methods (Watson et al., 2010; French et al., 2021; Coghlan et al., 2017) did not find that the presence of large bodied target species substantially biased the presence or abundance of small bodied non-target species across a 60 minute deployment. Due to the logistically challenging and remote environment of the current study, in depths beyond scientific diving limits and with strong currents, stereo-BRUVs were a logistically feasible sampling method. However, baited methods have a range of recognised biases that could influence the findings of any study (Cappo et al., 2007; Whitmarsh et al., 2017). Although potential biases have likely influenced the current study in a relatively consistent fashion, as the method was used consistently across it, we recommend that future studies in such environments should endeavour to use complementary non-baited sample data (e.g. stereo Remote Operated Vehicles [ROV]) to corroborate patterns and test for consistency in any detected effects between methods.
Stereo footage from the 117 sampling sites were analysed using EventMeasure software (www.seagis.com.au/event.html). All fish were identified to the lowest taxonomic level possible. An estimate of abundance was determined by recording the maximum number of individuals of a species seen in a single frame (MaxN) and is a relative estimate due to different species being attracted to the bait from different distances (Cappo et al., 2007). Other metrics such as MeanCount and SumCount have been suggested as potentially more accurate measures of fish abundance from remote video systems (Schobernd et al., 2014), however comparative studies have shown these metrics to be broadly comparable to MaxN in practice (Campbell et al., 2015; MacNeil et al., 2020). To standardise the counts of fish between samples with different visibility or terrain, only fish up to eight metres were counted and footage where visibility was extremely low or the cameras had been tipped over were discarded from analysis. A range of 8 metres has been suggested to be a credible sample unit for reliable stereo-video length measurements (Harvey et al., 2010), and fish measured beyond this distance were immediately excluded from the dataset by the EventMeasure software. Due to the cameras being configured as a stereo system precise fork length measurements could be recorded for each individual fish (where possible) when the fish was straight and oriented at 45-90° to the cameras’ optical axes (Langlois et al., 2020).
Multibeam echosounder (MBES) bathymetry and backscatter data collected in 2008 were used to characterise depth and seafloor geomorphology in the region (Spinoccia, 2011). The processed bathymetry (Figure 2A) was then used to derive additional variables of the seafloor (Figure 2B) namely aspect (radians), slope (degrees) and roughness which were calculated for each cell based on bathymetry data from the eight neighbouring cells. These variables capture the main seafloor characteristics as well as being known to be highly influential on demersal fish habitat (Friedlander & Parrish, 1998; Pittman et al., 2007; Monk et al., 2012). Predictors such as these were used as proxies for habitat distribution in the initial zoning of the Commonwealth MPs (Bax, 2011).
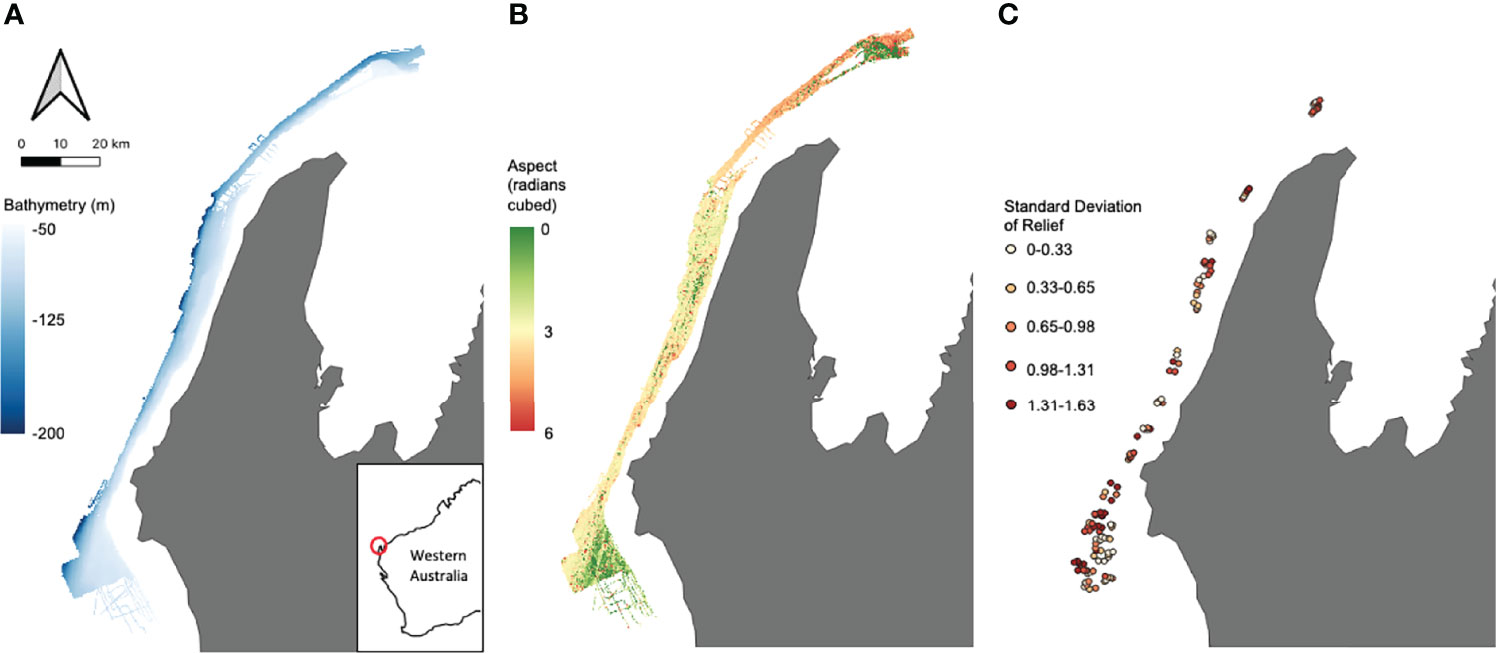
Figure 2 Examples of both broad scale seabed characteristics – (A) bathymetry (m), (B) aspect (radians cubed) – and site-specific field of view habitat characteristics – (C) standard deviation of relief – used as predictors in the models.
Habitat analysis was carried out in TransectMeasure (https://www.seagis.com.au/transect.html) using high definition images taken from the forward and backward cameras attached to the stereo-BRUV. Three Field of View (FoV) predictors were estimated using the method outlined in Langlois et al. (2020). Each image had a 4x5 grid superimposed and the dominant habitat type (by percentage) in each cell was classified using the CATAMI classification scheme (Althaus et al., 2015), with grid cells covering open water excluded from further analysis. Due to the rarity of some habitat types, classifications were collated to give a percent cover of reef for each sample. The percent cover for the forwards and backwards images from each stereo-BRUV were then summed and an overall percent cover of reef was calculated for each sample. Relief for each cell was also assessed using a 0-4 scale, with 0 indicating a flat surface and 4 indicating exceptional structural complexity in the environment. For each sample, the values for relief in each cell from both forwards and backwards camera images were averaged and the standard deviation (SD Relief) was calculated (Figure 2C).
Permutational analysis of covariance (PERMANCOVA, Anderson, 2008) was used to test if increased relief of the benthos within the field of view reduced the range at which target and non-target fish measurements were made with the stereo cameras across the study. The PERMANCOVA used 4,999 permutations, with mean relief as a covariate, target status of fish as a fixed factor and cluster as random effect, with the addition of sample identity as a random effect to respect the non-independence of multiple range measurements from a sample. No effect of mean relief was detected, but the mean range at which target species were measured (2.18 m) was found to be significantly less (p<0.001) than the mean range at which non-target species were measured (2.94 m, Supplementary Figure 9). No fish measured were more than 7 m from the stereo cameras, with the majority of measurements within 4 m.
Three fish assemblage metrics were selected for analysis: relative abundance of recreationally fished fish species greater than legal length, species richness and relative abundance of non-fished species. Eighteen recreationally fished species were used in the analysis and length measurements were used to classify individuals as greater or less than the legal minimum catch size. If no legal minimum catch size was specified, then all fish observed were considered legal size. There were inadequate numbers of fished species less than the legal minimum catch size for formal statistical analysis. Of the remaining non-recreationally fished species, small-bodied species that form large schools were removed from the analysis due to their disproportionately large effect on the outcomes of statistical testing. These species are also not site attached and are likely to move in and out of the NTZ and across habitat patches. Furthermore, despite their high abundance these species did not occur frequently across the sites sampled, leading to a high proportion of 0 counts and preventing robust statistical analysis of these species. MaxN for the remaining 126 species were used as non-fished species for analysis.
To calculate the distance from each sampled site to the nearest boat ramp, a 25 m grid of the study area was created. Euclidean distance from each grid cell to the nearest boat ramp was then calculated and a distance in kilometres was assigned to each sampled site based on the distance calculated for the cell the site was found within.
The R language for statistical computing 4.0.2 (Core Team, 2018) was used for all data manipulation (Wickham et al., 2020), analysis and graphing (Wickham, 2016). A hybrid frequentist and Bayesian workflow was used for model selection and analysis. Initially, a generalised additive mixed effects (GAMM) and full subsets modelling approach (Fisher et al., 2018) was used to select models that best explained patterns in fish assemblages in the NMP-Commonwealth. The model selection procedure was carried out with and without FoV predictors to determine whether information on site specific habitat composition improved our ability to explain patterns in fish assemblage metrics, when compared to using fine scale bathymetry data and its derivatives. The stereo-BRUV cluster from which each sample was taken was modelled as a random effect which accounts for correlation within clusters, as similar species are likely to be found together by stochastic chance. The top two models selected by the frequentist GAMM approach were then modelled within a Bayesian framework. For a full workflow of the model selection process see Supplementary Figure 1.
Data was initially assessed for outliers and collinearity of predictor variables using Pearson’s correlation index and variables that were greater than 95% correlated were removed from the analysis. Sites with missing data for any predictor variables were also removed from the data. Predictor variables were plotted, and transformations were chosen to ensure an even distribution across each variable’s range and to minimise skew. The data was also assessed for spatial autocorrelation using a variogram. In total, nine predictor variables were included in the model selection process (Table 1). Distance from each sample to the nearest boat ramp was calculated and the status of each sample was assigned according to whether the sample was taken from within the NTZ or comparable fished sites both inside and outside of the NMP-Commonwealth.
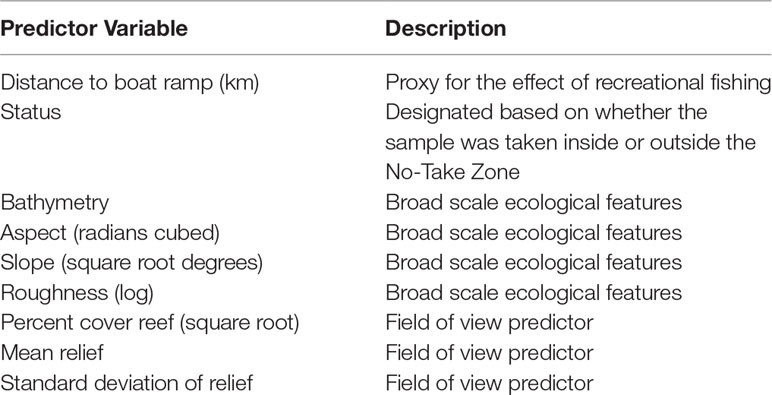
Table 1 Predictor variables for fish assemblage metrics used in the model selection process.
The model selection process was completed separately for each of the three assemblage metrics. A full subsets generalised additive modelling approach was used for model selection using the FSSgam package for R (Fisher et al., 2018). The package constructs models for all possible combinations of predictor variables, but excludes models where variables have a correlation of greater than 0.28 (Graham, 2003). Bathymetry and TPI were included in the null as TPI was used to generate the survey design and bathymetry was assumed to be a highly important predictor of fish species distribution and relative abundance. Continuous variables were fitted with smoothing splines with the number of knots limited to 5 and a poisson distribution was used for all three assemblage metrics. The gamm4 package, based on the lme4 package, was used within the FSSgam() function to generate the models, due to its ability to effectively model random effects. The models were ranked according to the Akaike Information Criterion for small sample sizes (AICc) with models that had a lower AICc ranked higher. The top two models were selected for use in further analyses providing that the second ranked model was within 2 AICc of the top model, otherwise only the highest ranked model was used. If the null model was within 2 AICc of the top model the null was selected regardless of rank, as per the principle of parsimony.
The FSSgam() function also produces a summary of the relative importance of each predictor variable across all fitted models. The importance score is calculated by summing the weight of all valid models that were fit using that predictor variable (Burnham & Anderson, 2004). The predicted response ( ± SE) was estimated using the predict.gam() function in the mgcv package (Wood, 2011).The data was then modelled within a Bayesian framework using the stan_gamm4() function in the rstanarm package (Gabry & Goodrich, 2020). An equivalent bayesian model was run for the top two models for each assemblage metric selected using the full subsets approach. A total of 41000 sampling iterations were completed but these were thinned to produce a final distribution composed of 1003 separate samples. The target average proposal probability for the No-U-Turn sampler variant of Hamiltonian Monte Carlo was increased to 0.99 to reduce the number of divergent transitions during sampling.
Predicted values for the response were calculated for each Bayesian model by sampling from the posterior distribution of the predictor variables using the posterior_predict() function. The same grid was used as with the frequentist approach but rather than producing one predicted value for each combination of predictor variables, 1003 predicted responses were calculated, one for each simulation in the initial model.
Effect sizes for both the frequentist and Bayesian models were calculated. Due to the curvilinear nature of GAMMs, effect sizes cannot be calculated using simple coefficients of the linear predictors, as can be done using standardised predictors with linear models. Instead, effect size for each predictor was calculated as the difference between the maximum and minimum values obtained for that predictor when the response across all other predictor values were averaged. This produces a single value for the effect size of each predictor variable in the model.
The Bayesian estimates of effect sizes for each predictor variable included in the top models were calculated in a similar way to the frequentist approach, except that this process was repeated for each of the 1003 simulations generated by sampling from the posterior distribution. This resulted in 1003 values for the effect size, allowing for the creation of a density plot for effect size of each predictor variable and calculation of credible intervals associated with effect size estimates using the 95% highest density interval.
A total of 3689 individual fish were identified from 45 families, representing 92 genera and 166 species. The full subsets model selection produced the top ten models ranked by AICc with and without FoV variables for each assemblage metric, and the top two models were chosen for further analyses (Table 2). Overall, R2 for the models is fairly low, ranging from 0.01 to 0.20, but models that included FoV variables consistently explained more variation in the data. Although both TPI and bathymetry were expected to be important predictors, TPI was found to be unimportant across all possible models (Supplementary Figure 2).
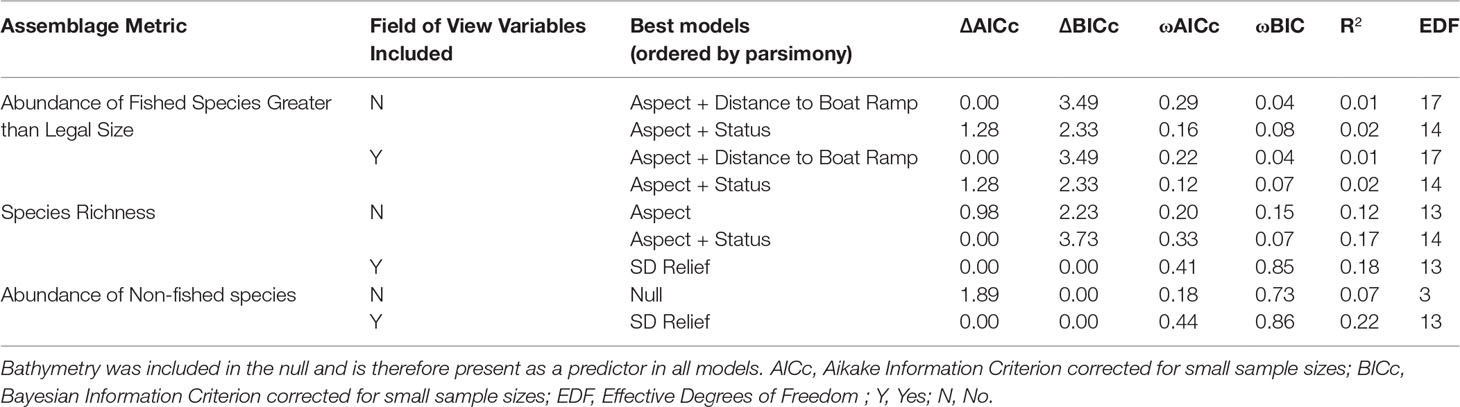
Table 2 Top two models ordered by parsimony for each assemblage metric, with and without field of view variables included.
Although different predictor variables were of different importance across the three assemblage metrics, some general trends emerged (Figure 3). As bathymetry and TPI were included in the null they were present in every model examined and so their importance scores were not calculated. Aspect (radians cubed) shows high importance across all three sets of models, however, decreases in importance when FoV variables are included in the model selection procedure. Status shows a consistent intermediate importance across all models with little difference between models with and without FoV variables. Distance to the nearest boat ramp is important only in models predicting the abundance of fished species greater than legal size, showing high importance regardless of whether FoV variables were included.
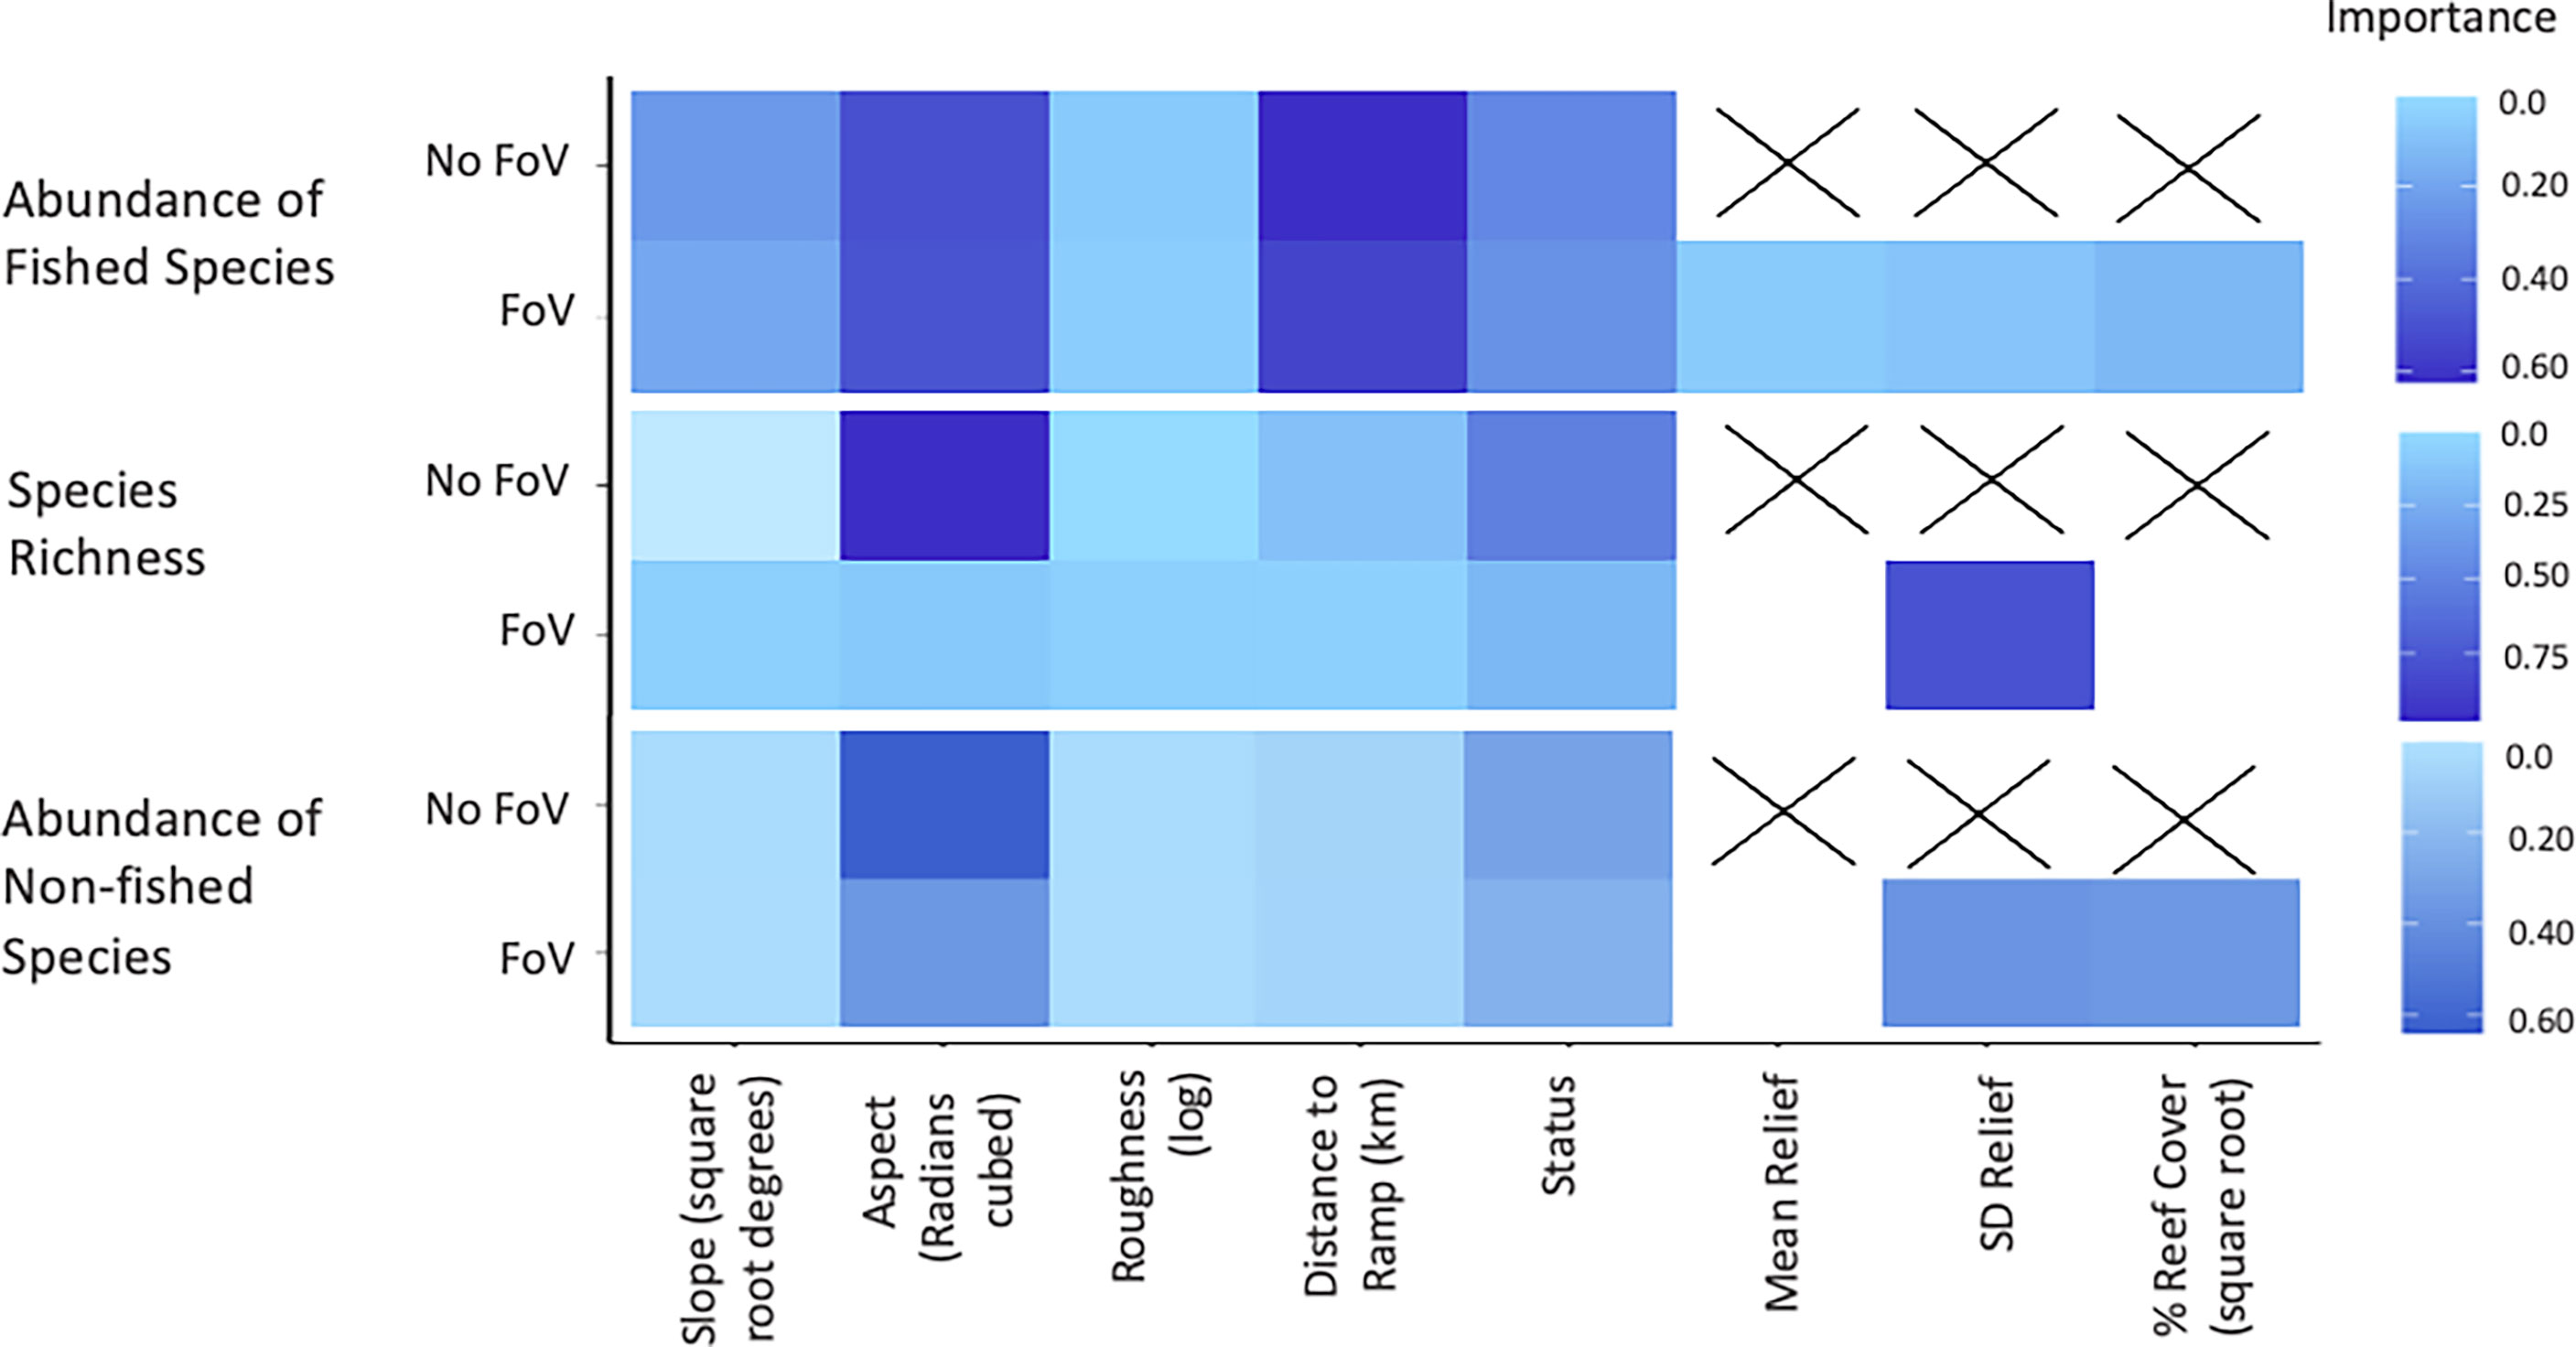
Figure 3 Importance scores for each predictor across all valid models. No field of view (FoV) indicates models which only considered fine scale bathymetry and its derivatives compared to FoV where habitat characteristics classified from images of habitat at the sample sites were considered.
Of the FoV variables the standard deviation of relief (SD relief) shows the greatest importance across all models, in particular for models predicting species richness and non-fished species abundance. FoV variables show minimal importance in predicting fished species abundance and both mean relief and the percent reef cover (square root) had importance scores of 0 for species richness models. Percent reef cover (square root) was only important in models predicting the abundance of non-fished species.
The top ranked model for each fish assemblage metric with and without FoV variables was plotted. Plots for the second ranked models and frequentist model predictions for each fish assemblage metric can be found in Supplementary Figures 3–8.
Model selection produced the same top models for predicting the abundance of fished species greater than legal size with and without FoV variables. The 1003 posterior predicted values from the Bayesian model are displayed as paler lines around the darker mean line and represent a measure of uncertainty in the predictions. The relationship between mean predicted fished species shows abundance remaining fairly constant in shallow water before dropping off past approximately 120 m depth (Figure 4A). Aspect (radians cubed) shows a distinctly humped relationship to mean fished species abundance across both models, peaking at 150 radians (cubed), however the wide range of values produced by each simulation indicates there is some degree of uncertainty in the model predictions (Figure 4B). The model predicts a gradual decrease in fished species abundance as proximity (km) to boat ramp increases (Figure 4C). Fished species abundance also shows a steep decline beyond 60 km, which may coincide with the 120 m bathome. The posterior predicted values show a variable predicted response of mean fished species abundance, suggesting fairly large uncertainty particularly at the extremes.
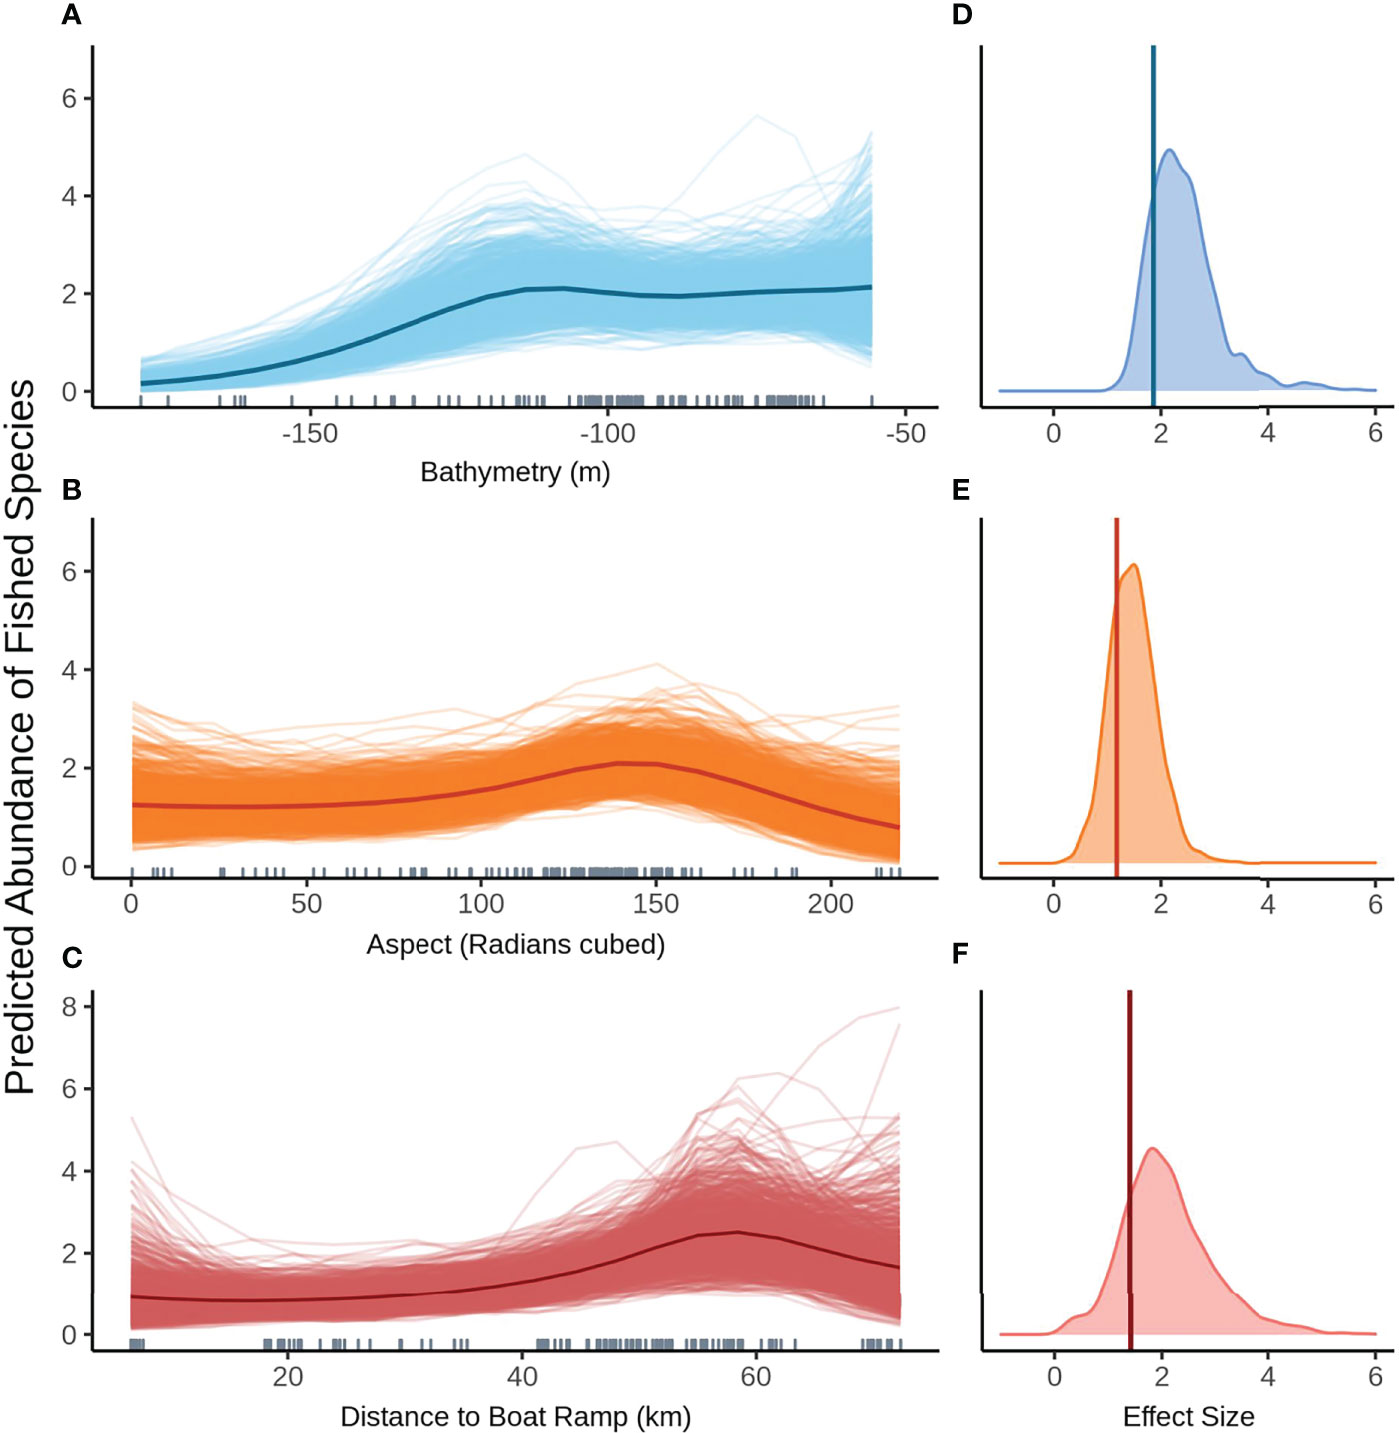
Figure 4 Predicted values for the top ranked model for abundance of fished species when field of view variables were not included - (A) bathymetry (m), (B) aspect (radians cubed), (C) distance to boat ramp (km). Density plots of effect size are also plotted for each aforementioned predictor – (D–F) respectively – with a vertical line indicating the frequentist effect size estimate.
Bathymetry has the biggest effect on the predicted mean abundance of fished species (Figure 4D), followed by aspect (radians cubed, Figure 4E). Effect sizes for both these variables show fairly narrow density plots indicating a high degree of certainty around these estimates. Distance to the nearest boat ramp has the smallest effect size as well as the widest distribution, suggesting greater uncertainty in the estimate of this effect (Figure 4F).
The second top model for fished species abundance is also presented here (rather than in the Supplementary Material) as it contains status as a predictor and is therefore relevant for answering the question of whether the NTZ can act as a control for the effects of recreational fishing. Bathymetry (Figure 5A) and aspect (radians cubed, Figure 5B) show a highly similar relationship to fished species abundance as described in the top ranked model. The model also predicts increased fished species abundance inside the NTZ when compared to the fished areas, however the predicted response is highly variable (Figure 5C). Again, bathymetry has the largest effect size (Figure 5D) with aspect (radians cubed, Figure 5E) and status (Figure 5F) having similar estimated effects. As seen with species richness, the 95% credible bounds of the effect size estimate for status cross 0, indicating status is not significant at the 95% level. The relationship between status and all three assemblage metrics must be interpreted with caution as there is only one NTZ in the NMP-Commonwealth. The results from this one area may not be representative of the effect that limiting fishing pressure may have in other areas of the park.
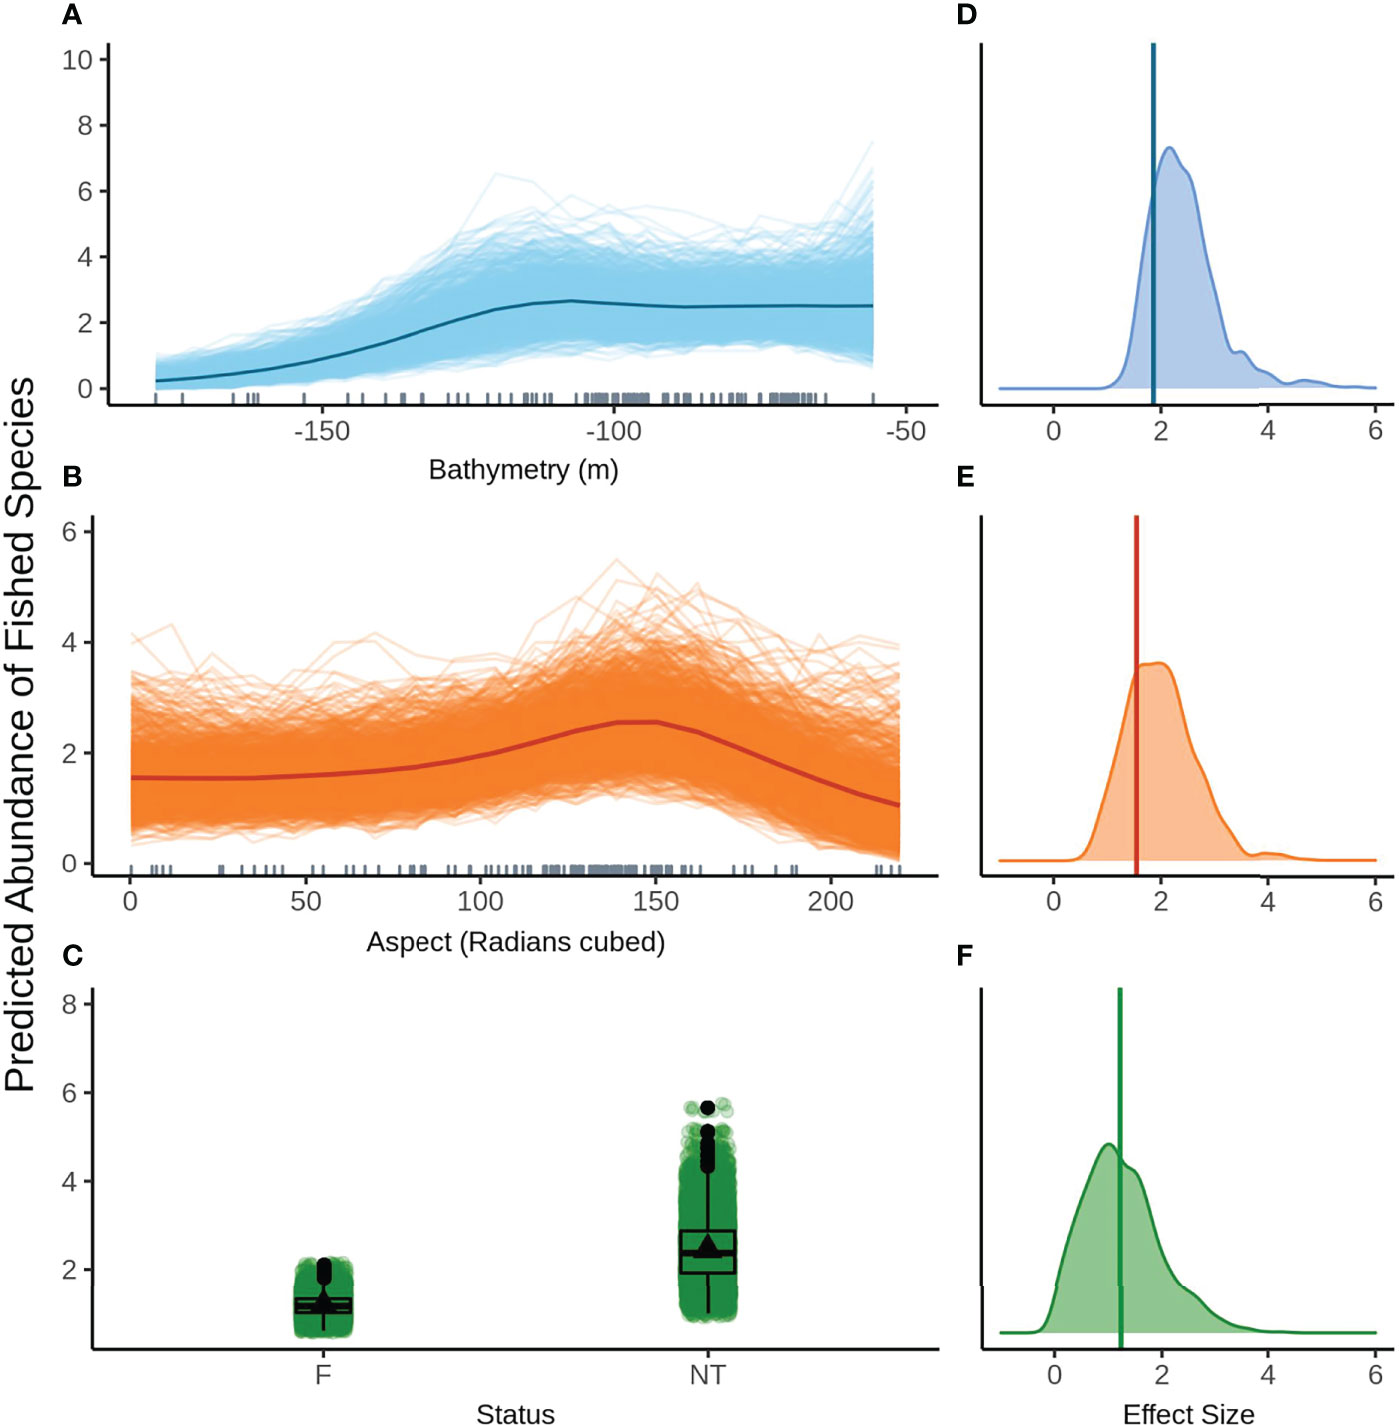
Figure 5 Predicted values for the second ranked model for abundance of fished species when field of view variables were not included - (A) bathymetry (m), (Baspect (radians cubed), (C) status (F, fished areas; NT, no take area). Density plots of effect size are also plotted for each aforementioned predictor – (D−F) respectively – with a vertical line indicating the frequentist effect size estimate.
The top model without FoV variables predicts that species richness remains fairly constant in shallow water up to approximately 80 m depth, before declining steeply with increasing depth (Figure 6A). The variation in predictions for the model without FoV variables is higher for shallow depths and decreases as depth increases, indicating higher confidence in predictions in deeper water. High mean species richness is predicted at low aspect before declining until about 90 radians (cubed) and peaking again at approximately 150 radians (cubed) (Figure 6B). The posterior predictions show relatively small variation from the mean predicted species richness for aspect, indicating a high degree of certainty in the predictions. Species richness is predicted to be greater in the NTZ than in the fished areas (Figure 6C). Although there is a clear difference in means, there is a high degree of variability in the predictions of mean species richness in both NTZ and fished zones, however variability is greater in the NTZ.
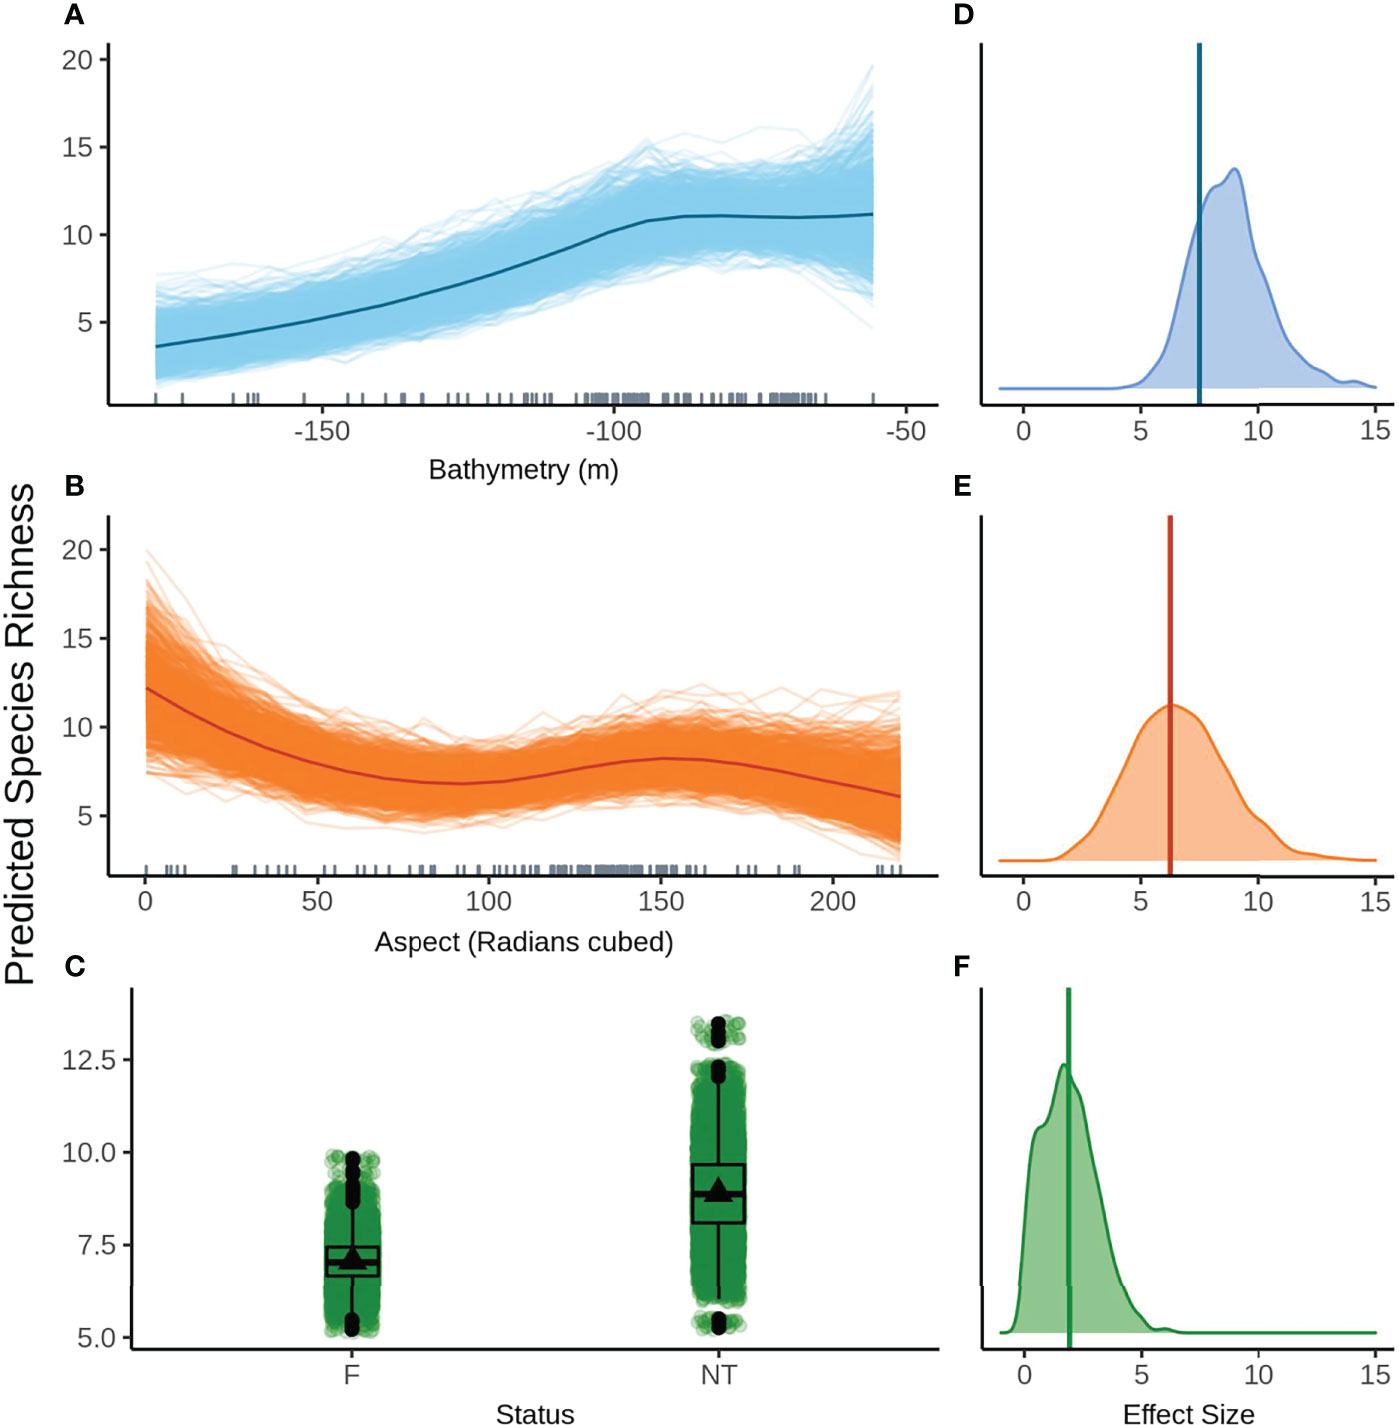
Figure 6 Predicted values for the top ranked model for species richness when field of view variables were not included - (A) bathymetry (m), (B) aspect (radians cubed), (C) status (F, fished areas; NT, no take area). Density plots of effect size are also plotted for each aforementioned predictor – (D−F) respectively – with a vertical line indicating the frequentist effect size estimate.
Bathymetry had the greatest effect size both with and without FoV variables but with a fairly wide distribution, indicating a high degree of uncertainty around the effect size estimate (Figure 6D). Aspect (radians cubed) has a similarly wide effect size distribution but a smaller effect size overall (Figure 6E). The effect size for status is small but comparatively narrower and therefore less uncertain, however the 95% credible bounds cross 0 indicating a limited effect (Figure 6F).
When FoV variables were considered, aspect (radians cubed) and status were no longer included in the top model. The predicted relationship between bathymetry and species richness remained the same as when FoV variables were not considered, however uncertainty increased in predictions across all depths (Figure 7A). SD relief has a positive effect on species richness with increasing species richness at higher SD relief (Figure 7B). The variation in posterior predicted values is fairly small, with all posterior predictions close to the mean predicted species richness across all models. SD relief had the greatest effect size but also the widest distribution of either variable, indicating a high degree of uncertainty in the estimate (Figures 7C, D).
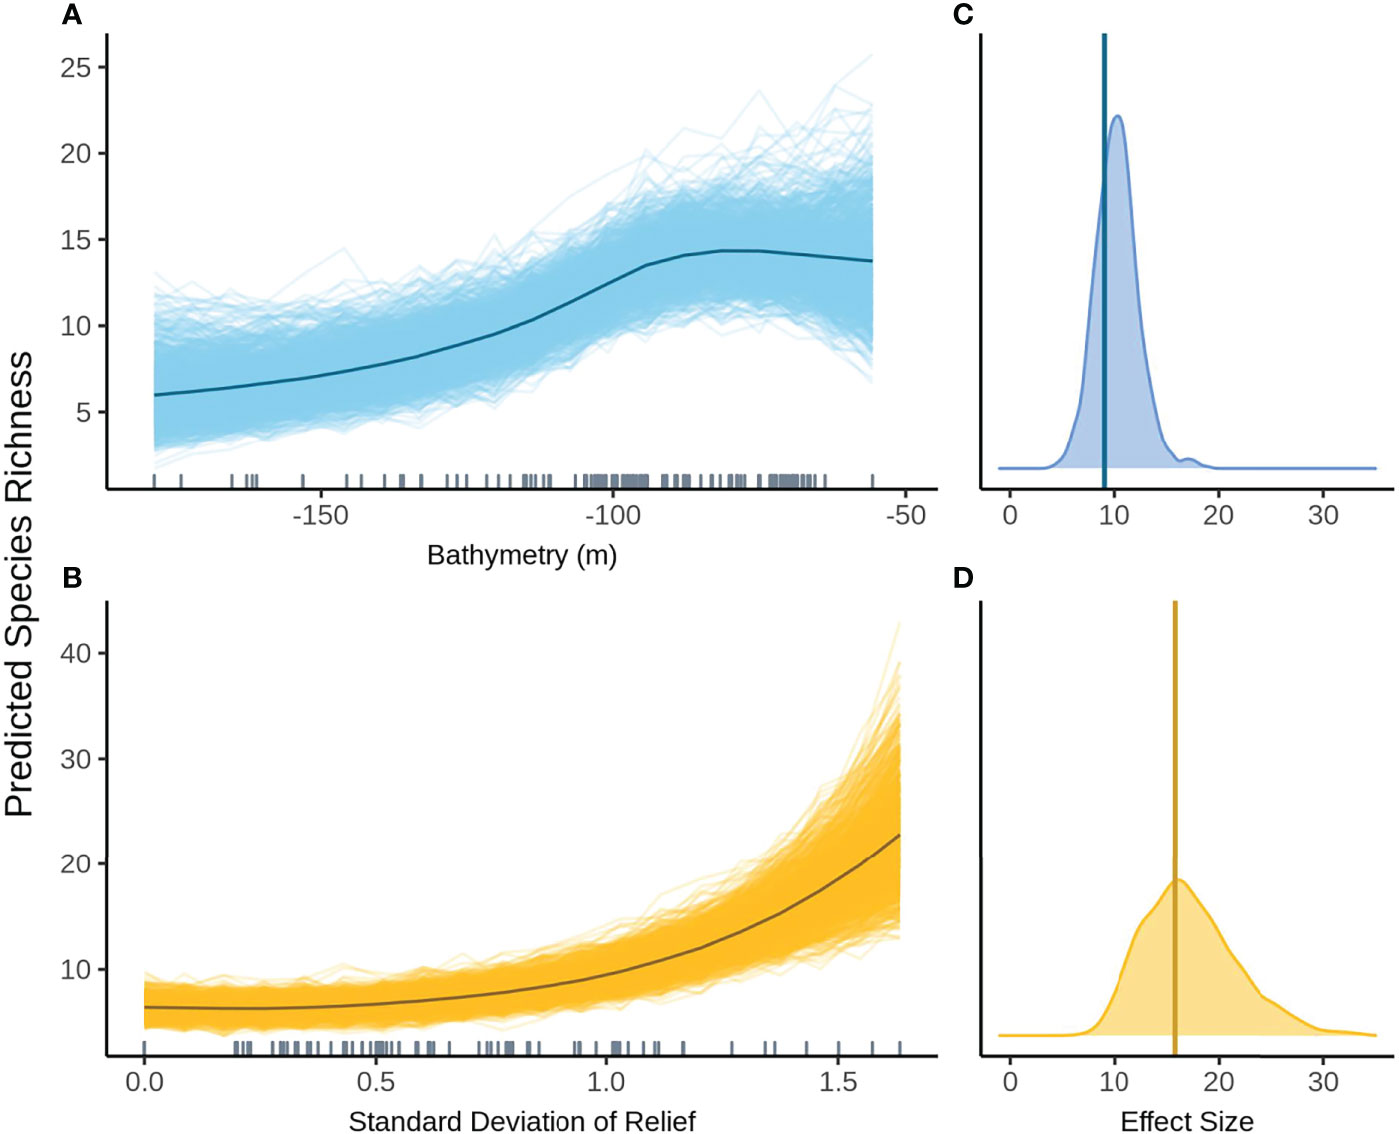
Figure 7 Predicted values for the top ranked model for species richness when field of view variables were not included - (A) bathymetry (m), (B) standard deviation of relief. Density plots of effect size are also plotted for each aforementioned predictor – (C, D) respectively – with a vertical line indicating the frequentist effect size estimate.
When FoV variables were not included in the model selection process the null model was the most parsimonious model within 2 AICc of the top model. In models where FoV variables were considered, the top model included SD relief and bathymetry. The relationship between bathymetry and non-fished species richness shows the same general trend as with the other assemblage metrics however the change in fish abundance across depths is much smaller (Figure 8A). Variation in posterior predicted values for abundance is large indicating a high degree of uncertainty. SD relief also shows the same relationship as seen with species abundance with very low abundance at low SD and rapidly increasing at high SD relief (Figure 8B). There is a high degree of certainty around the effect size for bathymetry as shown by the narrow density plot (Figure 8C). The effect size for SD relief is larger than for bathymetry but is considerably wider and therefore less certain (Figure 8D).
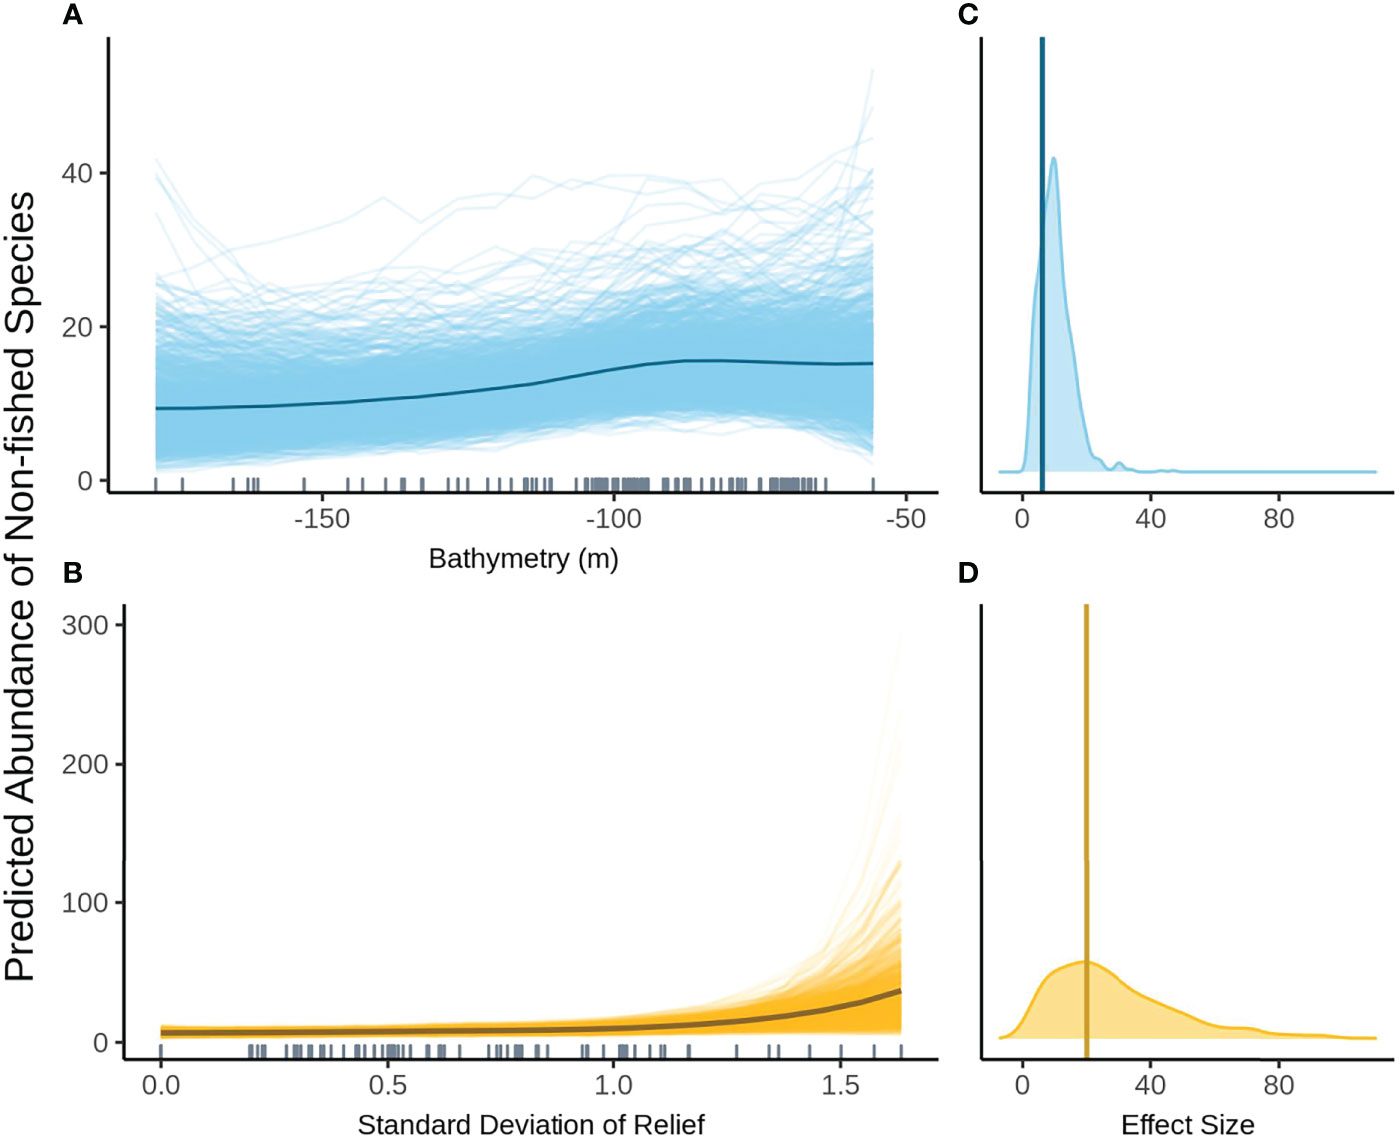
Figure 8 Predicted values for the top ranked model for the abundance of non-fished species when field of view variables were included - (A) bathymetry (m), (B) standard deviation of relief. Density plots of effect size are also plotted for each aforementioned predictor – (C, D) respectively – with a vertical line indicating the frequentist effect size estimate.
This study contributes to a larger body of evidence that in the absence of commercial harvesting, recreational fishing can on its own have significant impacts on fish populations (Denny et al., 2004; Cresswell et al., 2019; Cooke & Cowx, 2004). Distance to the nearest boat ramp was found to be a strong predictor for the abundance of fished species indicating a clear footprint of recreational fishing across the NMP-Commonwealth. Generally, recreational fishing in deeper, offshore waters is poorly understood in Australia, with much of the recreational fishing and research effort concentrated in estuaries and inshore areas (Mcphee, 2011). In particular, the way in which data is collected for recreational fishing in WA makes it difficult to disaggregate recreational catch estimates at the scale of either State or Commonwealth MPs (Lynch et al., 2020b), presenting difficulties for estimating its impact on fish populations in Commonwealth waters. The proximity of the deep NMP-Commonwealth waters to boat ramps makes it highly accessible to recreational fishers, and studies have indicated a recent shift towards increased fishing activity in the offshore waters (Lynch, 2006). As a result, it is unsurprising that we should see a decrease in the abundance of large bodied fished species along a gradient of a proxy for fishing pressure. Cinner et al. (2018) showed a similar relationship to human gravity, which uses distance to and size of nearby population centres as a proxy for human use. The deep water location of this NTZ meant that there were insufficient observations of targeted species less than legal size to identify any patterns in distribution and abundance. Despite this, we find distance to boat ramps to be a robust proxy for the effect of recreational fishing, correlating strongly with the abundance of fished species across the NMP-Commonwealth.
Sustainable use of marine resources including recreational (and commercial) fishing is a key socio-economic value of Australia’s MPs (Young et al., 2014). In an effort to balance extractive uses with biodiversity conservation, compromises were made when planning the MPs to minimise overlap between NTZs and areas of high use for extractive activities (Lynch, 2006; Fowles et al., 2011; Mitchell et al., 2018). This resulted in many of the newly established NTZs in the AMP network being located in areas far from human activity, limiting their use for studying the effects of recreational fishing. Despite the potentially confounding impact of the remote location of the newly established NTZ within the NMP-Commonwealth and the adjacent location of an established NTZ in the State MP, we demonstrate here that distance from boat ramps is a more important predictor of the distribution in the abundance of fished species than NTZ status, and by proxy adjacent location to an established NTZ. We expect that in the future, as the NTZ in the NMP-Commonwealth becomes established and fished species increase in abundance within it (Babcock et al., 2010), NTZ status will become an increasingly important predictor in future monitoring data. NTZ implementation can reveal surprising changes as ecosystems recover from the effects of fishing, which may allow us to investigate previously unrecognised emergent ecological processes (Jackson & Sala, 2001; Ballantine, 2014).The recent establishment of the NTZ in the NMP-Commonwealth provides an opportunity to collect long-term data required to further investigate the effects of fishing within this region, with the benchmark presented in this study as a starting point. When investigating the effects of fishing, using NTZs, changes in fished populations and other ecosystem components can take decades to materialise (Babcock et al., 2010; Cresswell et al., 2019). However, careful interpretation of any changes revealed by long-term data collection will have to account for the adjacent location of the established NTZ within State waters, including the potential of larval and biomass spillover from one NTZ to the other (Russ & Alcala, 2011; Hackradt et al., 2014). Cresswell et al. (2019) also highlighted that existing monitoring data of fish assemblages within the established NTZ in the NMP-State is lacking adequate information on spatial and temporal patterns in recreational fishing pressure and that this limited the interpretation of their synthesis of 30 years of monitoring data. We strongly recommend that the collection of fine scale information of the recreational fishing, as a value and pressure, within both the NMP-Commonwealth and State is needed to better inform ongoing monitoring and interpretation of observed patterns.
Due to the remote and offshore location of many of the Commonwealth MPs, there was a lack of fine scale information about species distribution and habitats for use when determining the initial spatial zoning (Lawrence et al., 2015). As a result, physical proxies for diversity (e.g. bathymetry or substrate) were the primary data used for the planning of the NTZs, which may not have captured unknown gradients in habitat that could affect demersal fish distribution (Bax, 2011). Contrary to our predictions, habitat composition data from FoV classification was not an overly important predictor to explain the abundance of large bodied fished species. Instead the larger-scale bathymetry derivatives provided adequate predictors. It should be noted that the overall R2 values for the top models are low, likely as a result of models being unable to capture all the variables and complex interactions which could affect fish abundance and species richness. As such, other fine scale habitat related variables may be important for predicting the abundance of large bodied fish species but were not included in this analysis. Conversely, non-fished species abundance and species richness were strongly correlated with habitat composition data from FoV classification. In particular SD relief showed strong importance and is a measure of habitat complexity which has been found to be critical for the maintenance of high species richness and abundance in deep reef communities (Andradi-Brown et al., 2016). In contrast to larger-bodied fished species abundance, non-fished species abundance is likely to be dominated by smaller bodied species, potentially more reliant on the small-scale habitat complexity captured in the FoV (Collins et al., 2017). High complexity provides a variety of niches to support a greater number of species than would be found in a less complex habitat (Gratwicke & Speight, 2005; Lingo and Szedelmayer, 2006). Furthermore, small-bodied fish are often greater in abundance in complex environments as they are commonly prey species and use complexity in the environment as refuge from predators (Werner et al., 1983; Scharf et al., 2006; Andradi-Brown et al., 2016).
A similar relationship with bathymetry was seen across all three fish assemblage metrics, with the highest values for each metric observed at approximately 100 m depth. The effect of bathymetry on demersal fish communities is well documented, and is strongly associated with the abundance of benthic habitat forming species which generally decrease with increasing depth (Brown & Thatje, 2014; Wellington et al., 2018). A consistent relationship was also seen with aspect (radians cubed) with a peak in species richness and fished species abundance at an approximately north west (NW) direction. This is likely due to the overall morphology of the coastline facing the NW, however this would have exposed the seafloor to scouring generated by the interaction between the Leeuwin and Ningaloo currents (Nichol & Brooke, 2011; Brooke et al., 2009; Nichol et al., 2012; Lebrec et al., 2022b). In particular, this scouring may have exposed relict shorelines along the Ningaloo coast which are Key Ecological Features (KEF) of the north-west marine region and are most prominent at 100m depth (Department of the Environment, Water, Heritage and the Arts., 2008; James et al., 2004; Lebrec et al., 2022a). The Carnarvon Shelf, which extends underneath the entirety of the Ningaloo Reef, has several rocky ridges and scoured areas seaward of Point Cloates, inside and outside the NTZ, which form part of this historic coastline (Brooke et al., 2009; Lebrec et al., 2022b). This exposed hard substrate has allowed the development of a biodiversity hotspot for sponges and other benthic fauna, providing highly complex habitat that supports a wide range of fish species (Nichol et al., 2012; Schonberg and Formont, 2012). The combination of an overall NW facing aspect and the south flowing Leeuwin Current has created optimal conditions for filter feeding organisms, small-bodied planktivorous fish and subsequently their predators which are likely large-bodied fished species (Hanson & McKinnon, 2009; Xu et al., 2015; Turner et al., 2018).The effect that seafloor characteristics have on fish assemblages is often linked to the scale at which the characteristics have been considered (Kendall et al., 2011). Here we show that different aspects of demersal fish assemblages are correlated with characteristics of the seafloor at different spatial scales. What was not explored in this study is the effect of varying the spatial scale of the same predictor on the relationship to fish assemblage metrics. Calculations of bathymetry derived seafloor characteristics such as slope or aspect often use a focal neighbourhood method, whereby the value for the characteristic in a cell is calculated based on values in a search window of neighbouring cells (Wilson et al., 2007). This search window can be increased to broaden the spatial scale at which the characteristic is calculated, in turn decreasing the detail that is captured. Studies examining the effect of changing the size of the search window have shown that while smaller windows are often more accurate when compared to in situ measurements, broad scale measurements can still be of ecological relevance to demersal fish communities (Wedding et al., 2008; Pittman and Brown, 2011). It is likely that both small- and large-scale seafloor characteristics contribute to patterns in fish assemblage metrics but that the relationship between any one characteristic and metric is likely to change across spatial scales (Kendall et al., 2011). Understanding these relationships allows seafloor characteristics to be calculated at functionally meaningful scales that can inform management objectives.The spatial scale of observation is particularly important for the TPI used to generate the sampling plan as the search radius effectively changes the type of seabed features that can be captured (Weiss, 2001). For example, a pockmark located on top of a ridge can return either a negative or a positive value depending on if the search radius is smaller or larger than the diameter of the pockmark. Such variability could explain why the TPI used in this study appeared to be an unimportant predictor: the search radius may have not been adequate to capture seabed features that impact fish communities. This suggests geomorphology studies to determine the most adequate TPI search windows (Riera et al., 2022) or the use of varying search windows TPI could help better understand the relationship between the scale of the seabed features and fish communities. However, given the wide range of seabed feature sizes and morphologies it may not be practical to find clear relationships. Alternatively, the integration of more advanced bathymetry classification based on the Benthic Terrain Modeler (Walbridge et al., 2018) or on Geomorphons (Jasiewicz & Stepinski, 2013) may provide improved results and should be further investigated. Use of a search radius inappropriate for capturing features that may influence fish abundance and diversity may have contributed to its insignificance as a predictor in this study.This study used both frequentist and Bayesian methods for model selection, prediction and calculation of effect sizes. Frequentist approaches have historically been the statistical method of choice for ecologists due to their ability to answer a range of different questions with the computing power available (e.g. hypothesis testing and model selection, Dorazio, 2015). With recent advances in computer technology, Bayesian methods have become increasingly popular within ecology and offer a variety of advantages over frequentist techniques. In particular, Bayesian frameworks offer a clear expression of uncertainty around estimates or predictions (van de Schoot et al., 2014). In this study, we utilised this advantage to calculate robust estimates of effect size with easily interpreted measures of uncertainty. In the context of MPs, management decisions may be made based on the results of statistical estimates of effect sizes which come with an inherent level of uncertainty (Agardy et al., 2003). The clear communication of this uncertainty to managers/stakeholders, who may not be scientists, is important as it can inform the allocation of resources for monitoring or management (Halpern et al., 2006). The biggest disadvantage of the Bayesian approach is that typically model selection procedures become computationally expensive. Here, the use of a hybrid approach with frequentist model selection followed by a Bayesian inference approach overcomes this issue and allows the generation of robust estimates of effect sizes. The hybrid model selection and inference procedures developed in this study may help to streamline future studies of NTZs and spatial zoning in offshore, deep water MPs.Importantly, it should be recognised that baited methods have a range of sampling biases that can have different influences depending on assemblage composition. Studies using downwards facing BRUV systems with small fields of view (as compared to horizontally facing BRUVs) have raised concerns over antagonistic behaviours from larger bodied-species preventing smaller species from entering the field of view, therefore biassing measures of species assemblage (Willis et al., 2000; Dunlop et al., 2015). Similar issues were highlighted by Klages et al. (2014) who used horizontally facing BRUVs with a wide field of view and a deployment time of 30 minutes, and found comparatively large, predatory gummy sharks (Mustelus antarcticus, Günther, 1870) to be potentially influencing the diversity and abundance sampled. Conversely, Coghlan et al. (2017), who also used horizontally facing stereo-camera systems with a wide field of view, but with a 60 minutes deployment time, found no evidence of larger-bodied species significantly biassing the presence or abundance of smaller-bodied, non-target species or the overall assemblage composition measured. Future research should investigate the effects of baited camera type, deployment length and the interactions between them on the species assemblages measured, to better identify sources of bias. Despite these known biases, the current study used stereo-BRUVs due to the logistically challenging and remote environment, in depths beyond scientific diving limits and with strong currents. Previous comparative studies in shallow waters within this region have suggested limited differences between unbaited and baited survey methods (Langlois et al., 2010), but we strongly recommend that future studies using BRUVs should endeavour to complement this data with non-baited methods (e.g. stereo Remote Operated Vehicles) to assess the consistency of the patterns observed and test the comparability in any effects identified across methods with different biases.
This study suggests a clear footprint of recreational fishing was found across the NMP-Commonwealth and so, despite its remote location the NTZ can act as a control for recreational fishing. We expect that over time, the difference in fished species abundance inside and outside the NTZ will increase, informing monitoring about the effect of recreational fishing in the MP. Whilst high resolution information about the habitats present in the park is not essential for predicting the abundance of fished species, this knowledge would aid in maximising biodiversity conservation, another key aim of the NMP-Commonwealth (Director of National Parks, 2018). In particular, given the high importance of aspect across the models presented, future studies should seek to further explore the relationship between fish communities, habitat and the seafloor features associated with changes in aspect. We have also demonstrated a hybrid model selection and inference framework which provides a pragmatic solution to model selection whilst also taking advantage of the ability to clearly represent uncertainty in the identified models of interest. The newly created NTZ and long-term absence of commercial fishing in the NMP-Commonwealth has provided a unique opportunity to understand the effects of recreational fishing in isolation. It is hoped that the benchmarks established here will enable a demonstration of how NTZs can be used to their fullest potential to control for the effects of fishing and better understand and conserve biodiversity.
The datasets presented in this study can be found in online repositories. The names of the repository/repositories and accession number(s) can be found below: GlobalArchive (Open Access - requires a free account to be created) https://globalarchive.org/geodata/data/campaign/get/1002.
The animal study was reviewed and approved by University of Western Australia Animal Ethics Committee.
CA, JM, EL, TL, and RB conceived the initial ideas. TL and BG collected the data. BG and CA developed the image analysis protocol, CA, RF, and TL analyzed the data, and CA led the writing of the manuscript. All authors contributed critically to the drafts and gave final approval for publication.
This project was supported by the Marine Biodiversity Hub, a collaborative partnership supported through the Australian Government’s National Environmental Science Programme (NESP) with additional funding from the University of Western Australia International Fee Scholarship, the Keith Sheard Travel Scholarship, Parks Australia and CSIRO.
The authors declare that the research was conducted in the absence of any commercial or financial relationships that could be construed as a potential conflict of interest.
All claims expressed in this article are solely those of the authors and do not necessarily represent those of their affiliated organizations, or those of the publisher, the editors and the reviewers. Any product that may be evaluated in this article, or claim that may be made by its manufacturer, is not guaranteed or endorsed by the publisher.
The authors would like to acknowledge the support of the Keshi Mer II for their assistance in the field. Additional support in the field came from Brooke Gibbons (UWA) and Anthea Donovan (CSIRO). The authors would also like to acknowledge the help received from BG and Dr Todd Bond during the video analysis and statistical components of this research. Finally, the authors wish to thank Dr Scott Foster of CSIRO for developing the sampling design, assistance with statistical analysis and for helping to review this paper before submission.
The Supplementary Material for this article can be found online at: https://www.frontiersin.org/articles/10.3389/fmars.2022.835096/full#supplementary-material
Agardy T., Bridgewater P., Crosby M. P., Day J., Dayton P. K., Kenchington R., et al. (2003). Dangerous Targets? Unresolved issues and ideological clashes around marine protected areas. Aquat. Conserv. 13, 353–367. doi: 10.1002/aqc.583
Alemany D., Iribarne O. O., Acha E. M. (2013). Effects of a Large-Scale and Offshore Marine Protected Area on the Demersal Fish Assemblage in the Southwest Atlantic. ICES. J. Mar. Sci. 70, 123–134. doi: 10.1093/icesjms/fss166
Althaus F., Hill N., Ferrari R., Edwards L., Przeslawski R., Schönberg C. H. L., et al. (2015). A Standardised Vocabulary for Identifying Benthic Biota and Substrata From Underwater Imagery: The CATAMI Classification Scheme. PloS One 10, e0141039. doi: 10.1371/journal.pone.0141039
Anderson M. J., Gorley R. N., Clarke K. R. (2008). PERMANOVA+ for Primer: Guide to Software and Statistical Methods (Plymouth: PRIMER-E).
Andradi-Brown D. A., Gress E., Wright G., Exton D. A., Rogers A. D. (2016). Reef Fish Community Biomass and Trophic Structure Changes Across Shallow to Upper-Mesophotic Reefs in the Mesoamerican Barrier Reef, Caribbean. PloS One 11, e0156641. doi: 10.1371/journal.pone.0156641
Australia. Department of the Environment, Water, Heritage and the Arts (2008). The North-West Marine Bioregional Plan: Bioregional Profile: A Description of the Ecosystems, Conservation Values and Uses of the North-West Marine Region/Australian Government, Department of the Environment, Water, Heritage and the Arts (ACT: The Dept Parkes).
Babcock R. C., Shears N. T., Alcala A. C., Barrett N. S., Edgar G. J., Lafferty K. D., et al. (2010). Decadal Trends in Marine Reserves Reveal Differential Rates of Change in Direct and Indirect Effects. Proc. Natl. Acad. Sci. U.S.A. 107, 18256–18261. doi: 10.1073/pnas.0908012107
Ballantine B. (2014). Fifty Years on: Lessons From Marine Reserves in New Zealand and Principles for a Worldwide Network. Biol. Conserv. 176, 297–307. doi: 10.1016/j.biocon.2014.01.014
Bax N. J. (2011). Marine Biodiversity Hub, Commonwealth Environment Research Facilities, Final Report 2007-2010 (Canberra, Australia: Department of Sustainability, Environment, Water, Population and Communities).
Bosch N. E., Monk J., Goetze J., Wilson S., Babcock R. C., Barrett N., et al. (2021). Effects of Human Footprint and Biophysical Factors on the Body-Size Structure of Fished Marine Species. Conserv. Biol36 (2), 1–13. doi: 10.1111/cobi.13807
Brooke B., Nichol S. L., Hughes M. G., Doherty P. J. (2009). Carnarvon Shelf Survey Post-Survey Report (Australia, Canberra: Geoscience).
Brooker M. A., de Lestang S., Fairclough D. V., McLean D., Slawinski D., Pember M. B., et al. (2020). Environmental and Anthropogenic Factors Affect Fish Abundance: Relationships Revealed by Automated Cameras Deployed by Fishers. Front. Mar. Sci. 7, 279. doi: 10.3389/fmars.2020.00279
Brown A., Thatje S. (2014). Explaining Bathymetric Diversity Patterns in Marine Benthic Invertebrates and Demersal Fishes: Physiological Contributions to Adaptation of Life at Depth. Biol. Rev. Camb. Philos. Soc. 89, 406–426. doi: 10.1111/brv.12061
Burnham K. P., Anderson D. R. (2004). Multimodel Inference: Understanding AIC and BIC in Model Selection. Sociol. Methods Res. 33, 261–304. doi: 10.1177/0049124104268644
Buxton C. D., Cochrane P. (2015). Commonwealth Marine Reserves Review: Report of the Bioregional Advisory Panel (Canberra: Department of the Environment).
Campbell M. D., Pollack A. G., Gledhill C. T., Switzer T. S., DeVries D. A. (2015). Comparison of Relative Abundance Indices Calculated From Two Methods of Generating Video Count Data. Fish. Res. 170, 125–133. doi: 10.1016/j.fishres.2015.05.011
Cappo M., Harvey E., Shortis M., Australian Society for Fish Biology (2007). Counting and Measuring Fish with Baited Video Techniques - An Overview. In: Cutting-edge technologies in Fish and Fisheries science. Lyle J., Furlani D., Buxton C. (eds). Australian Society for Fish Biology Workshop Proceedings, Hobart, Tasmania, August 2006. Australian Society for Fish Biology (with Hobart, Tasmania being the publisher location)
Cinner J. E., Maire E., Huchery C., MacNeil M. A., Graham N. A. J., Mora C., et al. (2018). Gravity of Human Impacts Mediates Coral Reef Conservation Gains. Proc. Natl. Acad. Sci. U.S.A. 115, E6116–E6125. doi: 10.1073/pnas.1708001115
Coghlan A. R., McLean D. L., Harvey E. S., Langlois T. J. (2017). Does Fish Behaviour Bias Abundance and Length Information Collected by Baited Underwater Video? J. Exp. Mar. Bio Ecol. 497, 143–151. doi: 10.1016/j.jembe.2017.09.005
Collins D. L., Langlois T. J., Bond T., Holmes T. H., Harvey E. S., Fisher R., et al. (2017). A Novel Stereo-Video Method to Investigate Fish–Habitat Relationships. Methods Ecol. Evol. 8, 116–125. doi: 10.1111/2041-210X.12650
Cooke S. J., Cowx I. G. (2004). The Role of Recreational Fishing in Global Fish Crises. Bioscience 54, 857–859. doi: 10.1641/0006-3568(2004)054[0857:TRORFI]2.0.CO;2
Core Team R. (2018). R: A Language and Environment for Statistical Computing (Vienna, Austria: R Foundation for Statistical Computing).
Costello M. J. (2014). Long Live Marine Reserves: A Review of Experiences and Benefits. Biol. Conserv. 176, 289–296. doi: 10.1016/j.biocon.2014.04.023
Cresswell A. K., Langlois T. J., Wilson S. K., Claudet J., Thomson D. P., Renton M., et al. (2019). Disentangling the Response of Fishes to Recreational Fishing Over 30 Years Within a Fringing Coral Reef Reserve Network. Biol. Conserv. 237, 514–524. doi: 10.1016/j.biocon.2019.06.023
Day J., Dudley N., Hockings M., Holmes G., Laffoley D., Stolton S., et al. (2012). Guidelines for Applying the IUCN Protected Area Management Categories to Marine Protected Areas (Gland, Switzerland: IUCN).
Denny C. M., Willis T. J., Babcock R. C. (2004). Rapid Recolonisation of Snapper Pagrus Auratus: Sparidae Within an Offshore Island Marine Reserve After Implementation of No-Take Status. Mar. Ecol. Prog. Ser. 272, 183–190. doi: 10.3354/meps272183
Devillers R., Pressey R. L., Grech A., Kittinger J. N., Edgar G. J., Ward T., et al. (2015). Reinventing Residual Reserves in the Sea: Are We Favouring Ease of Establishment Over Need for Protection? Aquat. Conservation.: Mar. Freshw. Ecosyst. 25, 480–504. doi: 10.1002/aqc.2445
Department of Biodiversity Conservation and Attractions (2017) Ecological Monitoring in the Ningaloo Marine Reserves 2017. Department of Biodiversity Conservation and Attractions, Perth.
Director of National Parks (2018). North-West Marine Parks Network Management Plan 2018 (Canberra: Director of National Parks).
Dorazio R. M. (2015). Bayesian Data Analysis in Population Ecology: Motivations, Methods, and Benefits. Popul. Ecol. 58, 31–44. doi: 10.1007/s10144-015-0503-4
Dunlop K. M., Marian Scott E., Parsons D., Bailey D. M. (2015). Do Agonistic Behaviours Bias Baited Remote Underwater Video Surveys of Fish? Mar. Ecol. 36, 810–818. doi: 10.1111/maec.12185.
Edgar G. J., Stuart-Smith R. D., Willis T. J., Kininmonth S., Baker S. C., Banks S., et al. (2014). Global Conservation Outcomes Depend on Marine Protected Areas With Five Key Features. Nature 506, 216–220. doi: 10.1038/nature13022
Edgar G. J., Ward T. J., Stuart-Smith R. D. (2018). Rapid Declines Across Australian Fishery Stocks Indicate Global Sustainability Targets Will Not be Achieved Without an Expanded Network of ‘No-Fishing’ Reserves. Aquat. Conserv. 28, 1337–1350. doi: 10.1002/aqc.2934
Evans R. D., Russ G. R. (2004). Larger Biomass of Targeted Reef Fish in No-Take Marine Reserves on the Great Barrier Reef, Australia. Aquat. Conserv. 14, 505–519. doi: 10.1002/aqc.631
Fisher R., Wilson S. K., Sin T. M., Lee A. C., Langlois T. J. (2018). A Simple Function for Full-Subsets Multiple Regression in Ecology With R. Ecol. Evol. 8, 6104–6113. doi: 10.1002/ece3.4134
Foster S. D. (2021). MBHdesign: An R-Package for Efficient Spatial Survey Designs. Methods Ecol. Evol. 12, 415–420. doi: 10.1111/2041-210X.13535
Foster S. D., Monk J., Lawrence E., Hayes K. R., Hosack G. R., Przeslawski R., et al. (2018). “Statistical Consideration for Monitoring and Sampling,” in Field Manuals for Marine Sampling to Monitor Australian Waters. Eds. Przeslawski R., Foster S., p23–p41.
Fowles B., Gaynor A.Others (2011). The Challenge of Creating a Scientifically-Robust Historical Description of Changing Finfish Populations in the Ningaloo Marine Park ( Studies in Western Australian History), 99.
French B., Wilson S., Holmes T., Kendrick A., Rule M., Ryan N. (2021). Comparing Five Methods for Quantifying Abundance and Diversity of Fish Assemblages in Seagrass Habitat. Ecol. Indic. 124, 107415. doi: 10.1016/j.ecolind.2021.107415
Friedlander A. M., Parrish J. D. (1998). Habitat Characteristics Affecting Fish Assemblages on a Hawaiian Coral Reef. J. Exp. Mar. Bio Ecol. 224, 1–30. doi: 10.1016/S0022-0981(97)00164-0
Graham M. H. (2003). Confronting Multicollinearity in Ecological Multiple Regression. Ecology 84, 2809–2815. doi: 10.1890/02-3114
Gratwicke B., Speight M. R. (2005). The Relationship Between Fish Species Richness, Abundance and Habitat Complexity in a Range of Shallow Tropical Marine Habitats. J. Fish. Biol. 66, 650–667. doi: 10.1111/j.0022-1112.2005.00629.x
Günther A. (1870). ‘Catalogue of the Fishes in the British Museum.’ ( British Natural History Museum: London.)
Haberstroh AJ, McLean D, Holmes TH, Langlois T (2022) Baited video, but not diver video, detects a greater contrast in the abundance of two legal-size target species between no-take and fished zones. Mar Biol 169:79
Hackradt C. W., García-Charton J. A., Harmelin-Vivien M., Pérez-Ruzafa Á, Le Diréach L., Bayle-Sempere J., et al. (2014). Response of Rocky Reef Top Predators (Serranidae: Epinephelinae) in and Around Marine Protected Areas in the Western Mediterranean Sea. PLoS One 9, e98206. doi: 10.1371/journal.pone.0098206
Halpern B. S., Regan H. M., Possingham H. P., McCarthy M. A. (2006). Accounting for Uncertainty in Marine Reserve Design. Ecol. Lett. 9, 2–11. doi: 10.1111/j.1461-0248.2005.00827.x
Hanson C. E., McKinnon A. D. (2009). Pelagic Ecology of the Ningaloo Region, Western Australia: Influence of the Leeuwin Current. J. R. Soc. West. Aust. 92, 129.
Harvey E. S., Goetze J., McLaren B., Langlois T., Shortis M. R. (2010). Influence of Range, Angle of View, Image Resolution and Image Compression on Underwater Stereo-Video Measurements: High-Definition and Broadcast-Resolution Video Cameras Compared. Mar. Technol. Soc. J. 44, 75–85. doi: 10.4031/MTSJ.44.1.3
Hayes K. R., Hosack G. R., Lawrence E., Hedge P., Barrett N. S., Przeslawski R., et al. (2019). Designing Monitoring Programs for Marine Protected Areas Within an Evidence Based Decision Making Paradigm. Front. Mar. Sci. 6, 746. doi: 10.3389/fmars.2019.00746
Hill N., Barrett N., Ford J., Peel D., Foster S., Lawrence E., et al. (2018). Developing Indicators and a Baseline for Monitoring Demersal Fish in Data-Poor, Offshore Marine Parks Using Probabilistic Sampling. Ecol. Indic. 89, 610–621. doi: 10.1016/j.ecolind.2018.02.039
Jackson J. B. C., Sala E. (2001). Unnatural Oceans. Sci. Mar. 65, 273–281. doi: 10.3989/scimar.2001.65s2273
James N. P., Bone Y., Kyser T. K., Dix G. R., Collins L. B. (2004). The Importance of Changing Oceanography in Controlling Late Quaternary Carbonate Sedimentation on a High-Energy, Tropical, Oceanic Ramp: North-Western Australia. Sedimentology51:1179–1205.
Jasiewicz J., Stepinski T. F. (2013). Geomorphons — a Pattern Recognition Approach to Classification and Mapping of Landforms. Geomorphology 182, 147–156. doi: 10.1016/j.geomorph.2012.11.005
Keesing J., Donovan A., Collings S., Langlois T., Lawrence E., Babcock R. (Eds.) (2021). Initial Baseline Survey of Deepwater Fish in the Ningaloo Marine Park (Commonwealth Waters) ( CSIRO).
Kellner J. B., Tetreault I., Gaines S. D., Nisbet R. M. (2007). Fishing the Line Near Marine Reserves in Single and Multispecies Fisheries. Ecol. Appl. 17, 1039–1054. doi: 10.1890/05-1845
Kendall M. S., Miller T. J., Pittman S. J. (2011). Patterns of Scale-Dependency and the Influence of Map Resolution on the Seascape Ecology of Reef Fish. Mar. Ecol. Prog. Ser. 427, 259–274. doi: 10.3354/meps08945
Klages J., Broad A., Kelaher B. P., Davis A. R. (2014). The Influence of Gummy Sharks, Mustelus Antarcticus, on Observed Fish Assemblage Structure. Environ. Biol. Fishes. 97, 215–222. doi: 10.1007/s10641-013-0138-2
Langlois T. J., Ballantine W. J. (2005). Marine Ecological Research in New Zealand: Developing Predictive Models Through the Study of No-Take Marine Reserves. Conserv. Biol. 19, 1763–1770. doi: 10.1111/j.1523-1739.2005.00278.x
Langlois T., Goetze J., Bond T., Monk J., Abesamis R. A., Asher J., et al. (2020). A Field and Video Annotation Guide for Baited Remote Underwater Stereo-Video Surveys of Demersal Fish Assemblages. Methods Ecol. Evol. 166, 154. doi: 10.1111/2041-210X.13470
Langlois T. J., Harvey E. S., Fitzpatrick B., Meeuwig J. J., Shedrawi G., Watson D. L. (2010). Cost-Efficient Sampling of Fish Assemblages: Comparison of Baited Video Stations and Diver Video Transects. Aquat. Biol. 9, 155–168. doi: 10.3354/ab00235
Lawrence E., Hayes K. R., Lucieer V. L., Nichol S. L., Dambacher J. M., Hill N. A., et al. (2015). Mapping Habitats and Developing Baselines in Offshore Marine Reserves With Little Prior Knowledge: A Critical Evaluation of a New Approach. PloS One 10, e0141051. doi: 10.1371/journal.pone.0141051
Lebrec U., Riera R., Paumard V., O’Leary M. J., Lang S. C. (2022b) Automatic Mapping and Characterisation of Linear Depositional Bedforms: Theory and Application Using Bathymetry from the North West Shelf of Australia. Remote Sensing 14.
Lebrec U., Riera R., Paumard V., O’Leary M. J., Lang S. C. (2022a) Morphology and Distribution of Submerged Alaeoshorelines: Insights from the North West Shelf of Australia. Earth-Sci. Rev. 224:103864.
Lingo M. E., Szedlmayer S. T. (2006). The Influence of Habitat Complexity on Reef Fish Communities in the Northeastern Gulf of Mexico. Environ. Biol. Fishes. 76, 71–80. doi: 10.1007/s10641-006-9009-4
Lynch T. P. (2006). Incorporation of Recreational Fishing Effort Into Design of Marine Protected Areas. Conserv. Biol. 20, 1466–1476. doi: 10.1111/j.1523-1739.2006.00509.x
Lynch T. P., Smallwood C. B., Ochwada-Doyle F. A., Lyle J., Williams J., Ryan K. L., et al. (2020a). A Cross Continental Scale Comparison of Australian Offshore Charter Boat Recreational Fisheries Research and its Applications to Marine Park and Fisheries management. CSIRO. 1–74 doi: 10.1093/icesjms/fsz092
Lynch T. P., Smallwood C. B., Ochwada-Doyle F. A., Lyle J., Williams J., Ryan K. L., et al. (2020b). A Cross Continental Scale Comparison of Australian Offshore Recreational Fisheries Research and its Applications to Marine Park and Fisheries Management. ICES. J. Mar. Sci. 77, 1190–1205. doi: 10.1093/icesjms/fsz092
MacNeil M. A., Chapman D. D., Heupel M., Simpfendorfer C. A., Heithaus M., Meekan M., et al. (2020). Global Status and Conservation Potential of Reef Sharks. Nature 583, 801–806. doi: 10.1038/s41586-020-2519-y
Marine Division - DSEWPC (2012). Completing the Commonwealth Marine Reserves Network: Regulatory Impact Statement (Environment, Water, Population and Communities: Department of Sustainability).
McLaren B. W., Langlois T. J., Harvey E. S., Shortland-Jones H., Stevens R. (2015). A Small No-Take Marine Sanctuary Provides Consistent Protection for Small-Bodied by-Catch Species, But Not for Large-Bodied, High-Risk Species. J. Exp. Mar. Bio Ecol. 471, 153–163. doi: 10.1016/j.jembe.2015.06.002
Mcphee D. (2011). Marine Park Planning and Recreational Fishing: Is the Science Lost at Sea? Case Studies From Australia ( The International Journal of Science and Society 2).
Mitchell J. D., McLean D. L., Collin S. P., Taylor S., Jackson G., Fisher R., et al. (2018). Quantifying Shark Depredation in a Recreational Fishery in the Ningaloo Marine Park and Exmouth Gulf, Western Australia. Mar. Ecol. Prog. Ser. 587, 141–157. doi: 10.3354/meps12412
Monk J., Barrett N. S., Hill N. A., Lucieer V. L., Nichol S. L., Siwabessy P. J. W., et al. (2016). Outcropping Reef Ledges Drive Patterns of Epibenthic Assemblage Diversity on Cross-Shelf Habitats. Biodivers. Conserv. 25, 485–502. doi: 10.1007/s10531-016-1058-1
Monk J., Ierodiaconou D., Harvey E., Rattray A., Versace V. L. (2012). Are We Predicting the Actual or Apparent Distribution of Temperate Marine Fishes? PloS One 7, e34558. doi: 10.1371/journal.pone.0034558
Moore C. H., Radford B. T., Possingham H. P., Heyward A. J., Stewart R. R., Watts M. E., et al. (2016). Improving Spatial Prioritisation for Remote Marine Regions: Optimising Biodiversity Conservation and Sustainable Development Trade-Offs. Sci. Rep. 6, 32029. doi: 10.1038/srep32029
Nichol S. L., Anderson T. J., Battershill C., Brooke B. (2012). “Submerged Reefs and Aeolian Dunes as Inherited Habitats, Point Cloates, Carnarvon Shelf, Western Australia,” in Seafloor Geomorphology as Benthic Habitat. Eds. Harris P., Baker E. (Amsterdam, Netherlands: Elsevier), 397–407.
Nichol S. L., Brooke B. P. (2011). Shelf Habitat Distribution as a Legacy of Late Quaternary Marine Transgressions: A Case Study From a Tropical Carbonate Province. Cont. Shelf. Res. 31, 1845–1857. doi: 10.1016/j.csr.2011.08.009
Ningaloo Coast: World Heritage nomination (2010). Department of the Environment, Water, Heritage and the Arts.
Parks Australia (2019) Australian Marine Parks. Available at: https://parksaustralia.gov.au/marine/parks/ (Accessed 30 September 2019).
Perkins N. R., Foster S. D., Hill N. A., Marzloff M. P., Barrett N. S. (2017). Temporal and Spatial Variability in the Cover of Deep Reef Species: Implications for Monitoring. Ecol. Indic. 77, 337–347. doi: 10.1016/j.ecolind.2017.02.030
Phillips N. (2017). Australia Cuts Conservation Protections in Marine Parks. Nature. doi: 10.1038/nature.2017.22369
Pittman S. J., Brown K. A. (2011). Multi-Scale Approach for Predicting Fish Species Distributions Across Coral Reef Seascapes. PloS One 6, e20583. doi: 10.1371/journal.pone.0020583
Pittman S. J., Christensen J. D., Caldow C., Menza C., Monaco M. E. (2007). Predictive Mapping of Fish Species Richness Across Shallow-Water Seascapes in the Caribbean. Ecol. Modell. 204, 9–21. doi: 10.1016/j.ecolmodel.2006.12.017
Riera R., Paumard V., de Gail M., Saqab M. M., Lebrec U., Lang S. C., Lane A. (2022). Origin of Seafloor Pockmarks Overlying Submarine Landslides: Insights from Semi-Automated Mapping of 3D Seismic Horizons (North West Shelf, Australia). Mar. Pet. Geol. 136:105453.
Robertson B. L., Brown J. A., McDonald T., Jaksons P. (2013). BAS: Balanced Acceptance Sampling of Natural Resources. Biometrics 69, 776–784. doi: 10.1111/biom.12059
Rouphael A. B., Abdulla A., Said Y. (2011). A Framework for Practical and Rigorous Impact Monitoring by Field Managers of Marine Protected Areas. Environ. Monit. Assess. 180, 557–572. doi: 10.1007/s10661-010-1805-9
Russ G. R., Alcala A. C. (2011). Enhanced Biodiversity Beyond Marine Reserve Boundaries: The Cup Spillith Over. Ecol. Appl. 21, 241–250. doi: 10.1890/09-1197.1
Sagar S., Falkner I., Dekker A. G., Huang Z., Przeslawski R. (2020). Earth Observation for Monitoring of Australian Marine Parks and Other Off-Shore Marine Protected Areas ( Geoscience Australia).
Scharf F. S., Manderson J. P., Fabrizio M. C. (2006). The Effects of Seafloor Habitat Complexity on Survival of Juvenile Fishes: Species-Specific Interactions With Structural Refuge. J. Exp. Mar. Bio Ecol. 335, 167–176. doi: 10.1016/j.jembe.2006.03.018
Schobernd Z. H., Bacheler N. M., Conn P. B. (2014). Examining the Utility of Alternative Video Monitoring Metrics for Indexing Reef Fish Abundance. Can. J. Fish. Aquat. Sci. 71, 464–471. doi: 10.1139/cjfas-2013-0086
Schönberg C. H. L., Fromont J. (2012). Sponge Gardens of Ningaloo Reef (Carnarvon Shelf, Western Australia) are Biodiversity Hotspots. Hydrobiologia 687, 143–161. doi: 10.1007/s10750-011-0863-5
Smallwood C. B., Beckley L. E., Moore S. A., Kobryn H. T. (2011). Assessing Patterns of Recreational Use in Large Marine Parks: A Case Study From Ningaloo Marine Park, Australia. Ocean. Coast. Manag. 54, 330–340. doi: 10.1016/j.ocecoaman.2010.11.007
Stuart-Smith R. D., Barrett N. S., Crawford C. M., Frusher S. D., Stevenson D. G., Edgar G. J. (2008). Spatial Patterns in Impacts of Fishing on Temperate Rocky Reefs: Are Fish Abundance and Mean Size Related to Proximity to Fisher Access Points? J. Exp. Mar. Bio Ecol. 365, 116–125. doi: 10.1016/j.jembe.2008.08.002
Turner J. A., Babcock R. C., Hovey R., Kendrick G. A. (2018). AUV-Based Classification of Benthic Communities of the Ningaloo Shelf and Mesophotic Areas. Coral. Reefs. 37, 763–778. doi: 10.1007/s00338-018-1700-3
Underwood A. J. (1995). Ecological Research and (and Research Into) Environmental Management. Ecol. Appl. 5, 232–247. doi: 10.2307/1942066
Underwood A. J. (2000). Importance of Experimental Design in Detecting and Measuring Stresses in Marine Populations. J. Aquat. Ecosyst. Stress Recovery. 7, 3–24. doi: 10.1023/A:1009983229076
van de Schoot R., Kaplan D., Denissen J., Asendorpf J. B., Neyer F. J., van Aken M. A. G. (2014). A Gentle Introduction to Bayesian Analysis: Applications to Developmental Research. Child Dev. 85, 842–860. doi: 10.1111/cdev.12169
Walbridge S., Slocum N., Pobuda M., Wright D. J. (2018). Unified Geomorphological Analysis Workflows With Benthic Terrain Modeler. Geosci. J. 8, 94. doi: 10.3390/geosciences8030094
Watson D. L., Harvey E. S., Fitzpatrick B. M., Langlois T. J., Shedrawi G. (2010). Assessing Reef Fish Assemblage Structure: How do Different Stereo-Video Techniques Compare? Mar. Biol. 157, 1237–1250. doi: 10.1007/s00227-010-1404-x
Wedding L. M., Friedlander A. M., McGranaghan M., Yost R. S., Monaco M. E. (2008). Using Bathymetric Lidar to Define Nearshore Benthic Habitat Complexity: Implications for Management of Reef Fish Assemblages in Hawaii. Remote Sens. Environ. 112, 4159–4165. doi: 10.1016/j.rse.2008.01.025
Wellington C. M., Harvey E. S., Wakefield C. B., Langlois T. J., Williams A., White W. T., et al. (2018). Peak in Biomass Driven by Larger-Bodied Meso-Predators in Demersal Fish Communities Between Shelf and Slope Habitats at the Head of a Submarine Canyon in the South-Eastern Indian Ocean. Cont. Shelf. Res. 167, 55–64. doi: 10.1016/j.csr.2018.08.005
Werner E. E., Gilliam J. F., Hall D. J., Mittelbach G. G. (1983). An Experimental Test of the Effects of Predation Risk on Habitat Use in Fish. Ecology 64, 1540–1548. doi: 10.2307/1937508
Wescott G. (2006). The Long and Winding Road: The Development of a Comprehensive, Adequate and Representative System of Highly Protected Marine Protected Areas in Victoria, Australia. Ocean. Coast. Manag. 49, 905–922. doi: 10.1016/j.ocecoaman.2006.08.001
Whiteway (2009). Australian Bathymetry and Topography Grid, June 2009 (Record 2009/021) Geosciences Australia, Canberra, ATC, Australia.
Whitmarsh S. K., Fairweather P. G., Huveneers C. (2017). What is Big BRUVver Up to? Methods and uses of baited underwater video. Rev. Fish. Biol. Fish. 27, 53–73. doi: 10.1007/s11160-016-9450-1
Willis T. J., Millar R. B., Babcock R. C. (2000). Detection of Spatial Variability in Relative Density of Fishes: Comparison of Visual Census, Angling, and Baited Underwater Video. Mar. Ecol. Prog. Ser. 198, 249–260. doi: 10.3354/meps198249
Wilson S. K., Fisher R., Pratchett M. S., Graham N. A. J., Dulvy N. K., Turner R. A., et al. (2010). Habitat Degradation and Fishing Effects on the Size Structure of Coral Reef Fish Communities. Ecol. Appl. 20, 442–451. doi: 10.1890/08-2205.1
Wilson M. F. J., O’Connell B., Brown C., Guinan J. C., Grehan A. J. (2007). Multiscale Terrain Analysis of Multibeam Bathymetry Data for Habitat Mapping on the Continental Slope. Mar. Geod. 30, 3–35. doi: 10.1080/01490410701295962
Wood SN (2011) Fast Stable Restricted Maximum Likelihood and Marginal Likelihood Estimation of Semiparametric Generalized Linear Models. J R Stat Soc 73:3–36.
Xu J., Lowe R. J., Ivey G. N., Jones N. L., Brinkman R. (2015). Observations of the Shelf Circulation Dynamics Along Ningaloo Reef, Western Australia During the Austral Spring and Summer. Cont. Shelf. Res. 95, 54–73. doi: 10.1016/j.csr.2014.12.013
Keywords: marine parks, no-take zones, recreational fishing, Bayesian, Ningaloo
Citation: Aston C, Langlois T, Fisher R, Monk J, Gibbons B, Giraldo-Ospina A, Lawrence E, Keesing J, Lebrec U and Babcock RC (2022) Recreational Fishing Impacts in an Offshore and Deep-Water Marine Park: Examining Patterns in Fished Species Using Hybrid Frequentist Model Selection and Bayesian Inference. Front. Mar. Sci. 9:835096. doi: 10.3389/fmars.2022.835096
Received: 14 December 2021; Accepted: 03 June 2022;
Published: 28 July 2022.
Edited by:
Trevor Willis, Stazione Zoologica Anton Dohrn Napoli, ItalyReviewed by:
Jorge M. S. Gonçalves, University of Algarve, PortugalCopyright © 2022 Aston, Langlois, Fisher, Monk, Gibbons, Giraldo-Ospina, Lawrence, Keesing, Lebrec and Babcock. This is an open-access article distributed under the terms of the Creative Commons Attribution License (CC BY). The use, distribution or reproduction in other forums is permitted, provided the original author(s) and the copyright owner(s) are credited and that the original publication in this journal is cited, in accordance with accepted academic practice. No use, distribution or reproduction is permitted which does not comply with these terms.
*Correspondence: Charlotte Aston, Y2hhcmxvdHRlLmFzdG9uQHJlc2VhcmNoLnV3YS5lZHUuYXU=
Disclaimer: All claims expressed in this article are solely those of the authors and do not necessarily represent those of their affiliated organizations, or those of the publisher, the editors and the reviewers. Any product that may be evaluated in this article or claim that may be made by its manufacturer is not guaranteed or endorsed by the publisher.
Research integrity at Frontiers
Learn more about the work of our research integrity team to safeguard the quality of each article we publish.