
94% of researchers rate our articles as excellent or good
Learn more about the work of our research integrity team to safeguard the quality of each article we publish.
Find out more
ORIGINAL RESEARCH article
Front. Mar. Sci. , 24 March 2022
Sec. Coastal Ocean Processes
Volume 9 - 2022 | https://doi.org/10.3389/fmars.2022.834953
This article is part of the Research Topic Eutrophication, Algal Bloom, Hypoxia and Ocean Acidification in Large River Estuaries View all 11 articles
 Shichao Tian1*
 Birgit Gaye1
 Jianhui Tang2
 Yongming Luo2,3
 Niko Lahajnar1Kirstin Dähnke4
 Tina Sanders4
 Tianqi Xiong5
 Weidong Zhai5
 Kay-Christian Emeis1,4
The Yellow Sea (YS) is an epicontinental sea framed by the densely populated mainland of China and the Korean peninsula. Human activities over the last decades resulted in heavily increasing discharge of reactive nitrogen into the YS, which created numerous ecological problems. To elucidate the role of central YS in the cycling of reactive nitrogen, specifically the Yellow Sea Cold Water Mass (YSCWM), we determined nutrient concentrations, dual stable isotopes of nitrate (δ15N- and δ18O-), and stable isotopes of particulate and sedimentary nitrogen in spring and summer, i.e., in biologically inactive and active periods. The nitrate concentration in spring was higher than that in summer in the northern part of the YSCWM, Nitrate increased in the southern part accompanied by a decrease in δ15N- and δ18O-, which are indicative of nitrification that was a significant source of recycled nitrate in the south part of YSCWM. To quantify this regenerated nitrate, we use a mixing model with end members of preformed nitrate in spring and regenerated nitrate in summer, both with their distinct dual isotope values. The results suggest that only 35% nitrate was a residual of nitrate preformed in spring and 65% in summer in the southern branch of YSCWM was regenerated. The northern part of YSCWM has low concentrations of dissolved inorganic nitrogen, mainly because of denitrification in sediments. In contrast, the southern pool of YSCWM is a growing reservoir of regenerated terrestrial reactive nitrogen, the addition of which compensates the removal by co-occurring sediment denitrification. In consequence, the southern branch of YSCWM is facing a higher ecological risk than the northern branch, when excess reactive nitrogen discharge from Changjiang River continues at present levels or even increases.
The small area of the coastal seas compared to the vast open ocean hosts around 20% of all marine primary production (Jahnke, 2010) and plays a key role in processing nutrients and contaminants that enter the ocean via continental runoff and rivers (Levin et al., 2015). River input and atmospheric deposition are the largest contributors and supply more than half of the reactive nitrogen (Nr) to the coastal sea areas (Voss et al., 2013). Anthropogenic activities have doubled or tripled Nr supply from natural processes at a global scale (Galloway et al., 2013), so that human activities on land are more and more impacting ecosystems in marginal seas (Levin et al., 2015). An example are the seas bordering mainland China. The contribution of Chinese major estuaries to global coastal seas has been estimated at 5.4 Tg N yr–1 (Gu et al., 2015), which is about 10% of the global river input for dissolved inorganic nitrogen (DIN) (Smith et al., 2003; Liu S. et al., 2009). The increased input of anthropogenic Nr in the last decade resulted in a shift from N-deficiency to P-deficiency in the coastal area of Yellow Sea (YS) and East China Sea (ECS) (Wei et al., 2015; Moon et al., 2021).
The YS with an area of about 3.8 × 10⁵ km2 and an average depth of 44 m is a semi-closed marginal sea surrounded by mainland China and the Korean peninsula. It connects to the Bohai Sea in the northwest by the narrow Bohai Strait and with the ECS in the south. Changjiang River (Yangtze River), the largest river in China, discharges on average 9.25 × 10¹¹ m3 of water per year into the ECS, of which about 20% is advected into the YS (Fan and Song, 2014; Liu et al., 2020). Changjiang Diluted Water (CDW) is a main nutrient source of YS in summertime, while Yellow Sea Warm Current water (YSWC), the sub-branch of the Kuroshio Current, in wintertime is another major source (Jin et al., 2013).
The concentrations of nitrate and DIN in the south YS have been continuously increasing from the 1980s (Li et al., 2015; Wei et al., 2015; Wang et al., 2020b). The most rapid increase of NO3– and DIN occurred after the mid-1990s (Wei et al., 2015) and the level of the annual NO3– concentration in 2012 was over 5 times that of 1984 (Li et al., 2015). A large upward spike in the N/P ratio was apparent in 2008, and the dissolved oxygen (DO) concentration decreased sharply in the same year (Li et al., 2015). The increase of N input has been held responsible for increasing incidences of harmful algae blooms and macroalgal blooms in recent years (Li et al., 2017b; Wang et al., 2018; Xiao et al., 2019).
The Yellow Sea Cold Water Mass (YSCWM) fills the central YS trough and forms due to the unique basin topography and the impact of both the seasonal evolution of the thermocline and the circulation system in the YS (Zhang S. et al., 2008). YSCWM forms by subsidence of winter cold water (Lee and Beardsley, 1999; Zhang S. et al., 2008), and water of YSCWM could not be distinguished from other ambient waters based on the oxygen isotope of seawater (Kang et al., 1994). It is isolated from the direct influence of major river inputs so that the internal remineralized nutrients would play important roles instead (Chen et al., 2012; Sun et al., 2013; Li et al., 2017a). A strong linkage of hypoxia and acidification with organic matter mineralization and stratification was observed in the YSCWM (Guo J. et al., 2020). This water mass is a significant pool of nutrients, supplying them to the south YS by vertical diffusion/upwelling processes (Su et al., 2013; Wei et al., 2016; Wang et al., 2020c). Loss of nitrate was reported in the YSCWM (Liu S. et al., 2003; Duan et al., 2016) which was due to benthic processes rather than to water column denitrification (Zhang et al., 2018).
Up to now, inputs of rivers (Liu S. et al., 2009; Jin et al., 2013; Fan and Song, 2014; Liu et al., 2018, 2020; Wang Y. et al., 2021), submarine ground water (SGD) (Liu J. A. et al., 2017), sewage (Yang et al., 2018), atmospheric deposition (Shi et al., 2012; Qi et al., 2013, 2020; Yang et al., 2018), and marine or on-land aquaculture (Li et al., 2015; Wang et al., 2020a) to the YS were quantified. Nutrient budgets (Liu S. et al., 2003; Liu S. M. et al., 2017), long-term variation of nutrients (Li et al., 2015; Wei et al., 2015; Yang et al., 2018; Wang J. et al., 2021; Zheng and Zhai, 2021), deoxygenation and acidification (Zhai, 2018; Guo J. et al., 2020; Xiong et al., 2020), harmful algal blooms (HABs) (Fu et al., 2012; He et al., 2013; Xiao et al., 2019; Wang J. et al., 2021) and green tides (Li et al., 2015, 2017b; Song et al., 2018) have drawn attention to the ecological consequences associated with growing anthropogenic input into the ecosystem in the YS.
However, the portions of regenerated nitrate in the YSCWM have not been quantified, and the dynamics of internal nitrogen cycling are not clear. The internal cycling generally includes the assimilation and remineralization (including ammonification and nitrification) of Nr (Sigman and Boyle, 2000; Brandes and Devol, 2002). In the euphotic layer, DIN is assimilated by phytoplankton, and the organic detritus is decomposed below the euphotic layer. During decomposition, ammonium is first released and subsequently transformed to nitrite and nitrate via nitrification. These biogeochemical processes can be traced by stable isotopes due to their unique fractionation effect (Altabet, 2006; Casciotti, 2016; Liu S. M. et al., 2017; Wang et al., 2017; Sigman and Fripiat, 2019; Wu et al., 2019). In our study, we measured the nutrients, dual stable isotopes of nitrate, and stable N-isotope composition of particulate and sedimentary nitrogen in two seasons in the YS. Results of the isotopic investigation quantify the shares of preformed and newly regenerated nitrate in the YSCWM. Seasonal comparison of DIN quantity and isotopic character in the northern and southern YSCWM furthermore give insights into how the regional and global nutrient sources affect the YSCWM in the central YS trough.
Research cruises were carried out by R/V Dongfanghong 2 in spring and summer 2018 with 42 sampling sites in April and 45 sites in August, respectively (Figure 1). Water samples were taken from several depths by 12 L Niskin bottles attached to a CTD rosette (911plus, Seabird, United States). The water samples for nutrient and isotope analysis were filtered using nucleopore polycarbonate filters (0.4 μm) with plastic Nalgene filtration units. The filtered water was collected in Falcon PE tubes (45 mL), frozen immediately (−20°C) and kept frozen until analyses in the home laboratory. For suspended particulate matter (SPM) and organic particle analysis, between 0.5 and 8 L of water were filtered through pre-weighed GF/F filters (0.7 μm, Φ = 47 mm, Sigma-Aldrich) which had been pre-combusted at 450°C for 4 h. The filters were subsequently dried on board at 45°C for 24 h. Surface sediments were taken with a box corer and surface samples were frozen at −20°C and were kept frozen until analysis in the home lab.
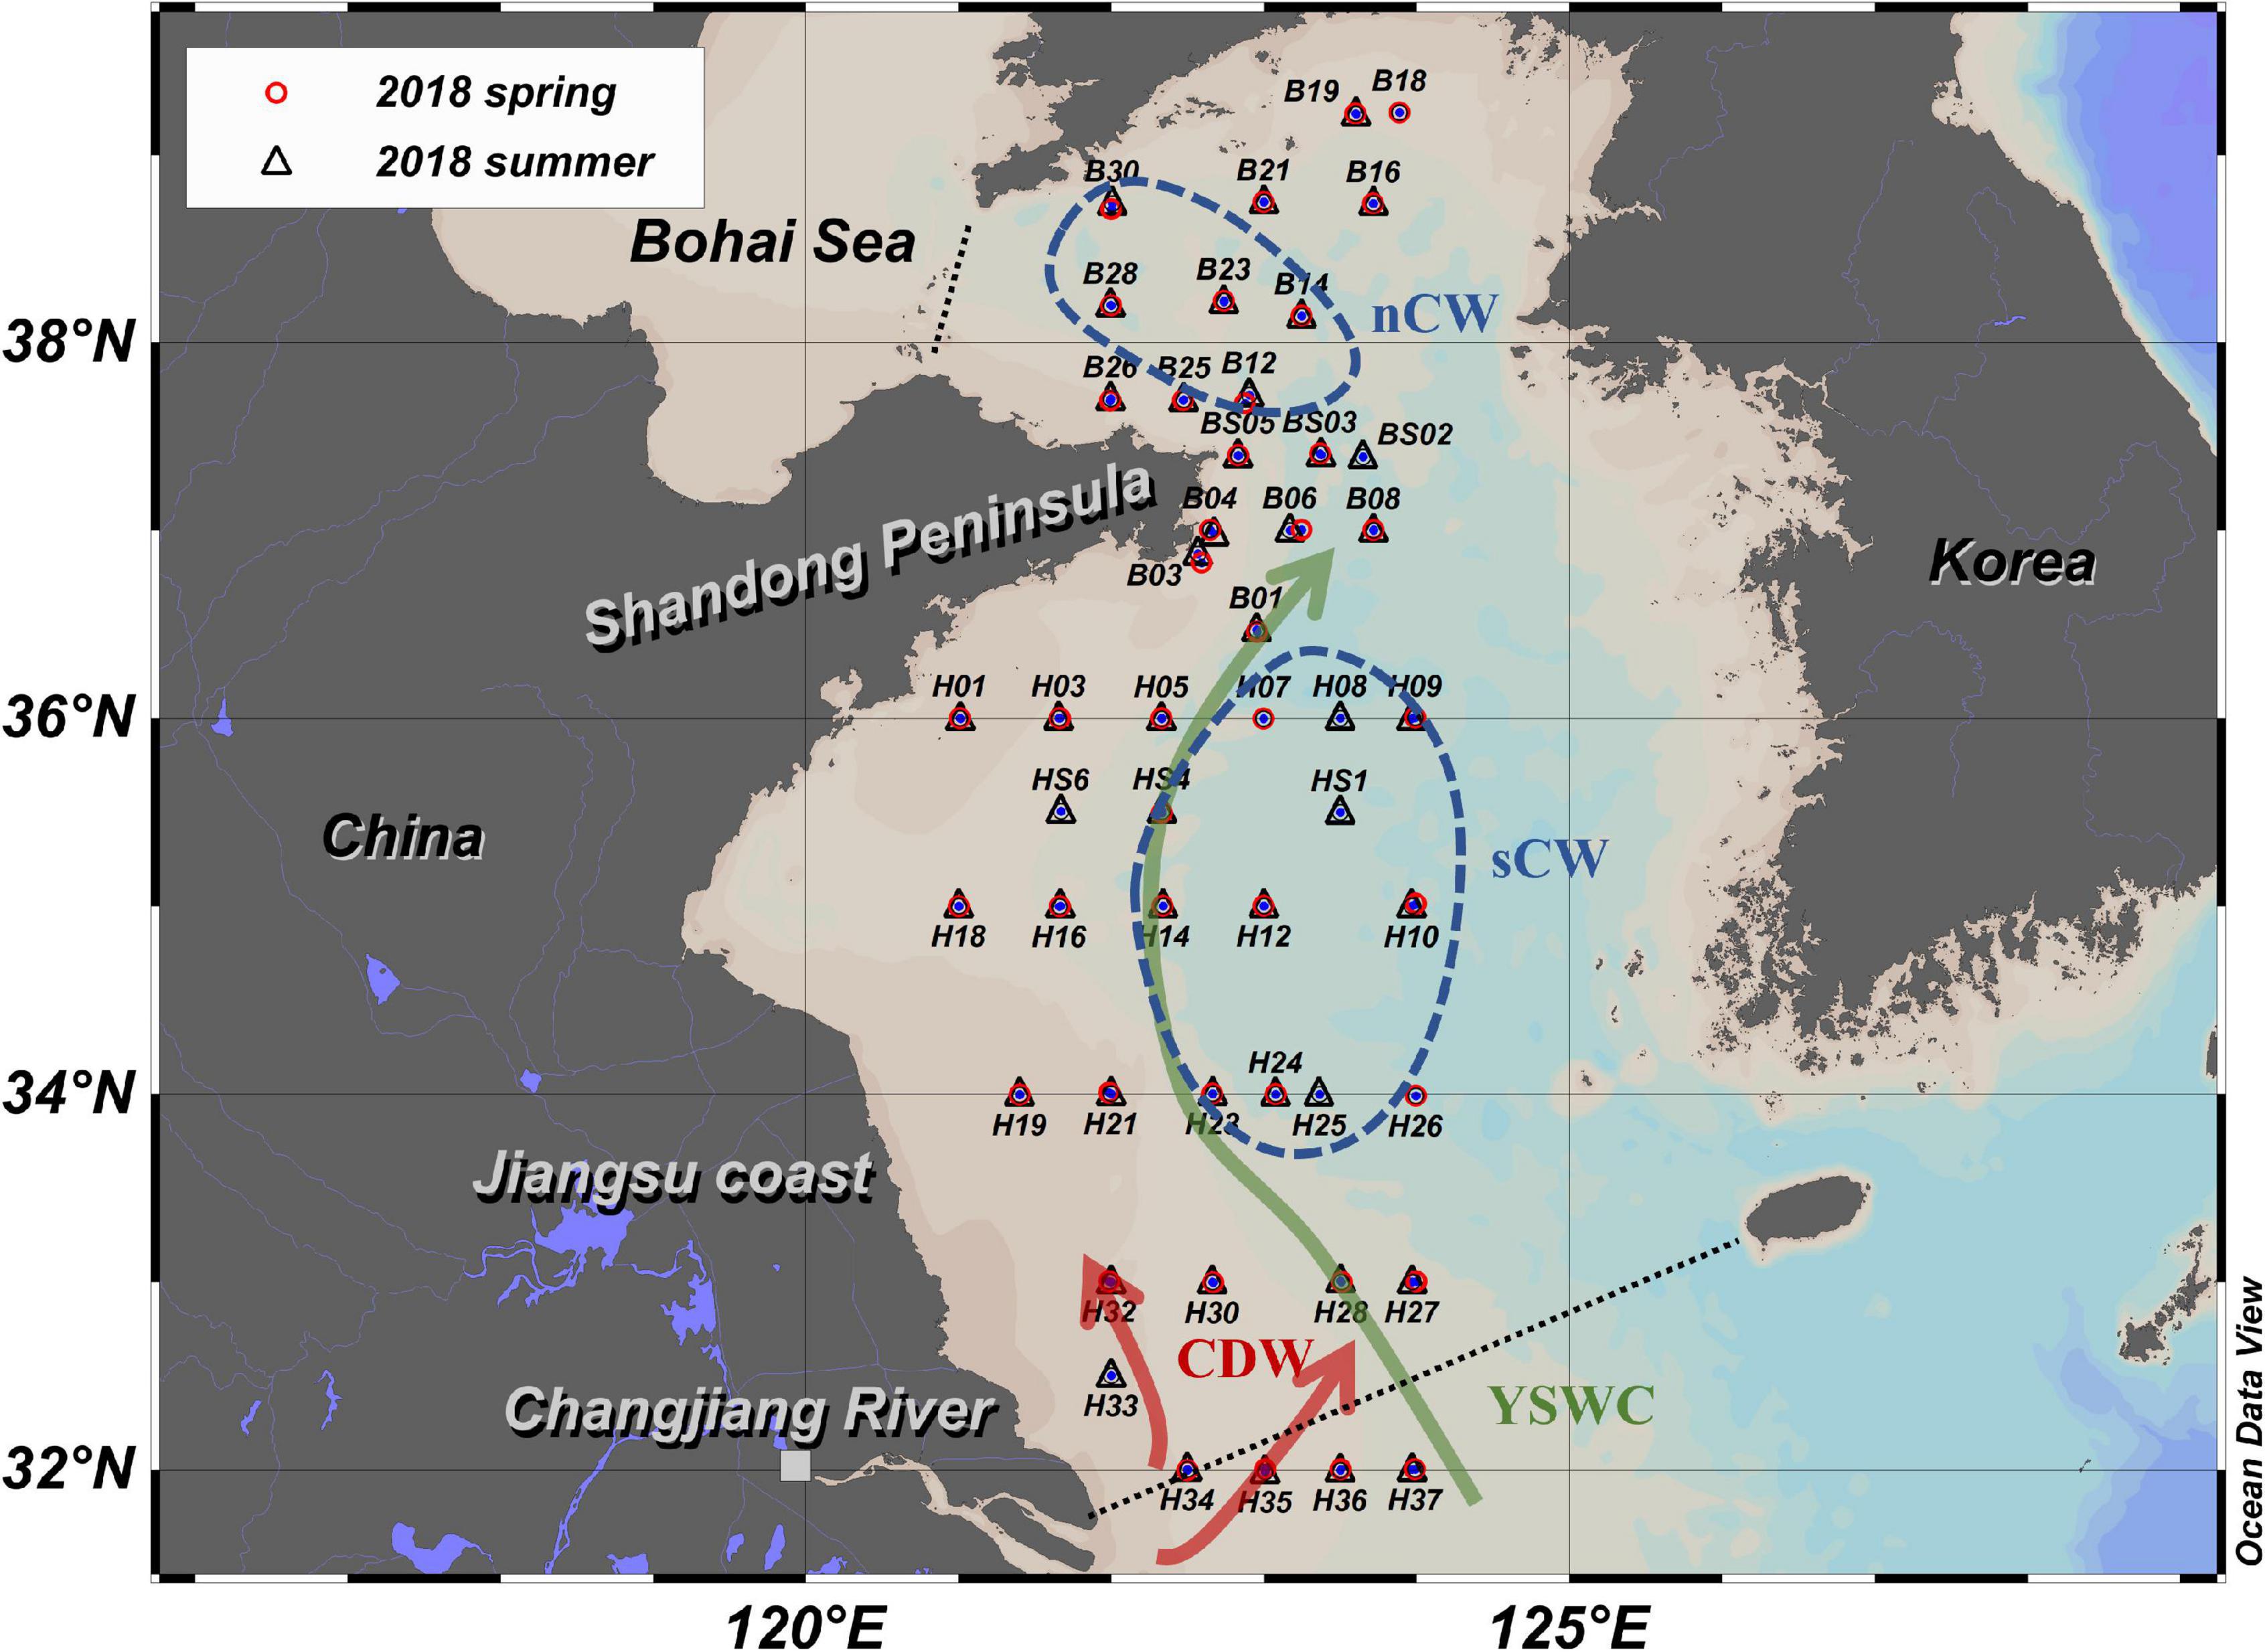
Figure 1. Sampling stations of spring and summer cruises are marked by red circles and black triangles, respectively. Note that most of the stations were sampled on both expeditions. The southern and northeastern boundary of the Yellow Sea is marked by the black dashed line. Yellow Sea Warm Current (YSWC) and Changjiang Diluted Water (CDW) are important external waters in spring and summer, respectively. These currents are drawn according to their general positions and our data of 2018. Sampling stations clustering in the north Cold Water mass (nCW) and south Cold Water (sCW) stations are marked by blue dashed lines, nCW and sCW are water masses defined in this study, they both are part of the Yellow Sea Cold Water Mass (YSCWM). (base map sourced by Ocean Data View, Schlitzer, Reiner, Ocean Data View, https://odv.awi.de, 2021).
Nutrient concentrations were measured with an AutoAnalyzer 3 system (Seal Analytics) using standard colorimetric methods (Grasshoff et al., 2009). The relative error of duplicate sample measurements was below 1.5% for NOx and phosphate concentrations, below 0.3% for ammonium. The detection limit was <0.05 μmol L–1 for NOx, >0.01 μmol L–1 for , and >0.013 μmol L–1 for ammonium. The pooled standard deviation is 0.004 μmol L–1 for NOx, 0.006 μmol L–1 for , and 0.01 μmol L–1 for ammonium.
δ15N and δ18O of nitrate (δ15N = [(15N/14N)sample/ (15N/14N)standard−1] × 1000‰, δ18O = [(18O/ 16O)sample/(18O/16O)standard − 1] × 1000‰) were determined with the denitrifier method (Sigman et al., 2001; Casciotti et al., 2002). Only the samples with nitrate concentrations >1.7 μmol L–1 were analyzed and δ15N and δ18O were analyzed in one sample run. Water samples were injected into a suspension of the denitrifier Pseudomonas aureofaciens with injection volumes adjusted to yield 10 nmol N2O. The N2O gas was purged by helium into a GasBench 2 (Thermo Finnigan) for purification. Afterward the N2O gas was analyzed by a Delta V Advantage and a Delta V Plus mass spectrometer. Samples were measured in duplicate and the two international standards IAEA-N3 (δ15N-NO3– = +4.7‰, δ18O-NO3– = +25.6‰) and USGS-34 (δ15N-NO3– = −1.8‰, δ18O-NO3– = −27.9‰) and an internal potassium nitrate standard were measured in each batch. The data were corrected by applying a bracketing correction (Sigman et al., 2009) and the standard deviations of the international and in-house standards was found to be ≤0.2‰ for δ15N and ≤0.5‰ for δ18O. The standard deviations of duplicate samples were in the same range. Nitrite affects the results and was removed following the protocol of Granger and Sigman (2009) whenever [NO2–] exceeded 5% of the NOx pool. In all other cases, we report combined (nitrite + nitrate) values.
Loaded filters were weighed to calculate the amount of SPM per liter of water. Total carbon and nitrogen concentrations in SPM and sediment samples were measured by a Euro EA 3000 (Euro Vector SPA) Elemental Analyzer. Organic carbon was measured after acidifying samples for three times. The precision of total and organic carbon determination is 0.05%, that of nitrogen is 0.005%, and the standard deviations are less than 0.08 for total and organic carbon and 0.02 for nitrogen. Nitrogen isotope ratios were determined with a FlashEA 1112 coupled to a MAT 252 (Thermo Fisher Scientific) isotope ratio mass spectrometer. The precision of nitrogen isotope analyses is better than 0.2‰, and the standard deviation less than 0.03.
The dissolved oxygen (DO) samples were collected, fixed, and titrated on board following the Winkler procedure at an uncertainty level of <0.5% (Xiong et al., 2020). A small quantity of NaN3 was added during subsample fixation to remove possible interferences from nitrite (Wong, 2012). The DO saturation was calculated from field−measured DO concentration divided by the DO concentration at equilibrium with the atmosphere which was calculated from temperature, salinity and local air pressure, as per the Benson and Krause (1984) equation.
A remineralization stoichiometry of 150 O2:1 :16 (Anderson, 1995) is used to estimate the regenerated nutrients (Rafter et al., 2013; Wu et al., 2019). The regenerated nitrate () can be calculated following Eq. 1 and Eq. 2, Apparent Oxygen Utilization (AOU) and in these equations with subscript sp and sm stand for data of spring and summer, respectively. The seasonal variation of nitrate () is calculated by Eq. 3.
In spring the water column in the YS was vertically well mixed with salinity and temperature both decreasing northwards. The Yellow Sea Warm Current (YSWM) entered from the outer shelf northwestward into the central YS trough, transporting relatively warm and saline water (T > 7.0°C, S > 32.5) and its northernmost tip reached 37°N (station B08) (Figures 1, 2A–D). The coastal water in the south YS (sYS) was characterized by relatively high temperatures and low salinities (T > 8.0°C, S < 32.5). In the north YS (nYS), temperatures decreased to around 4.0 to 6.0°C and salinities were in the range of 32.2 to 32.5. Sea water in the YS can thus be roughly considered as a mixture of nutrient depleted nYS water with nutrient abundant YSWC and sYS coastal water (Figure 3).
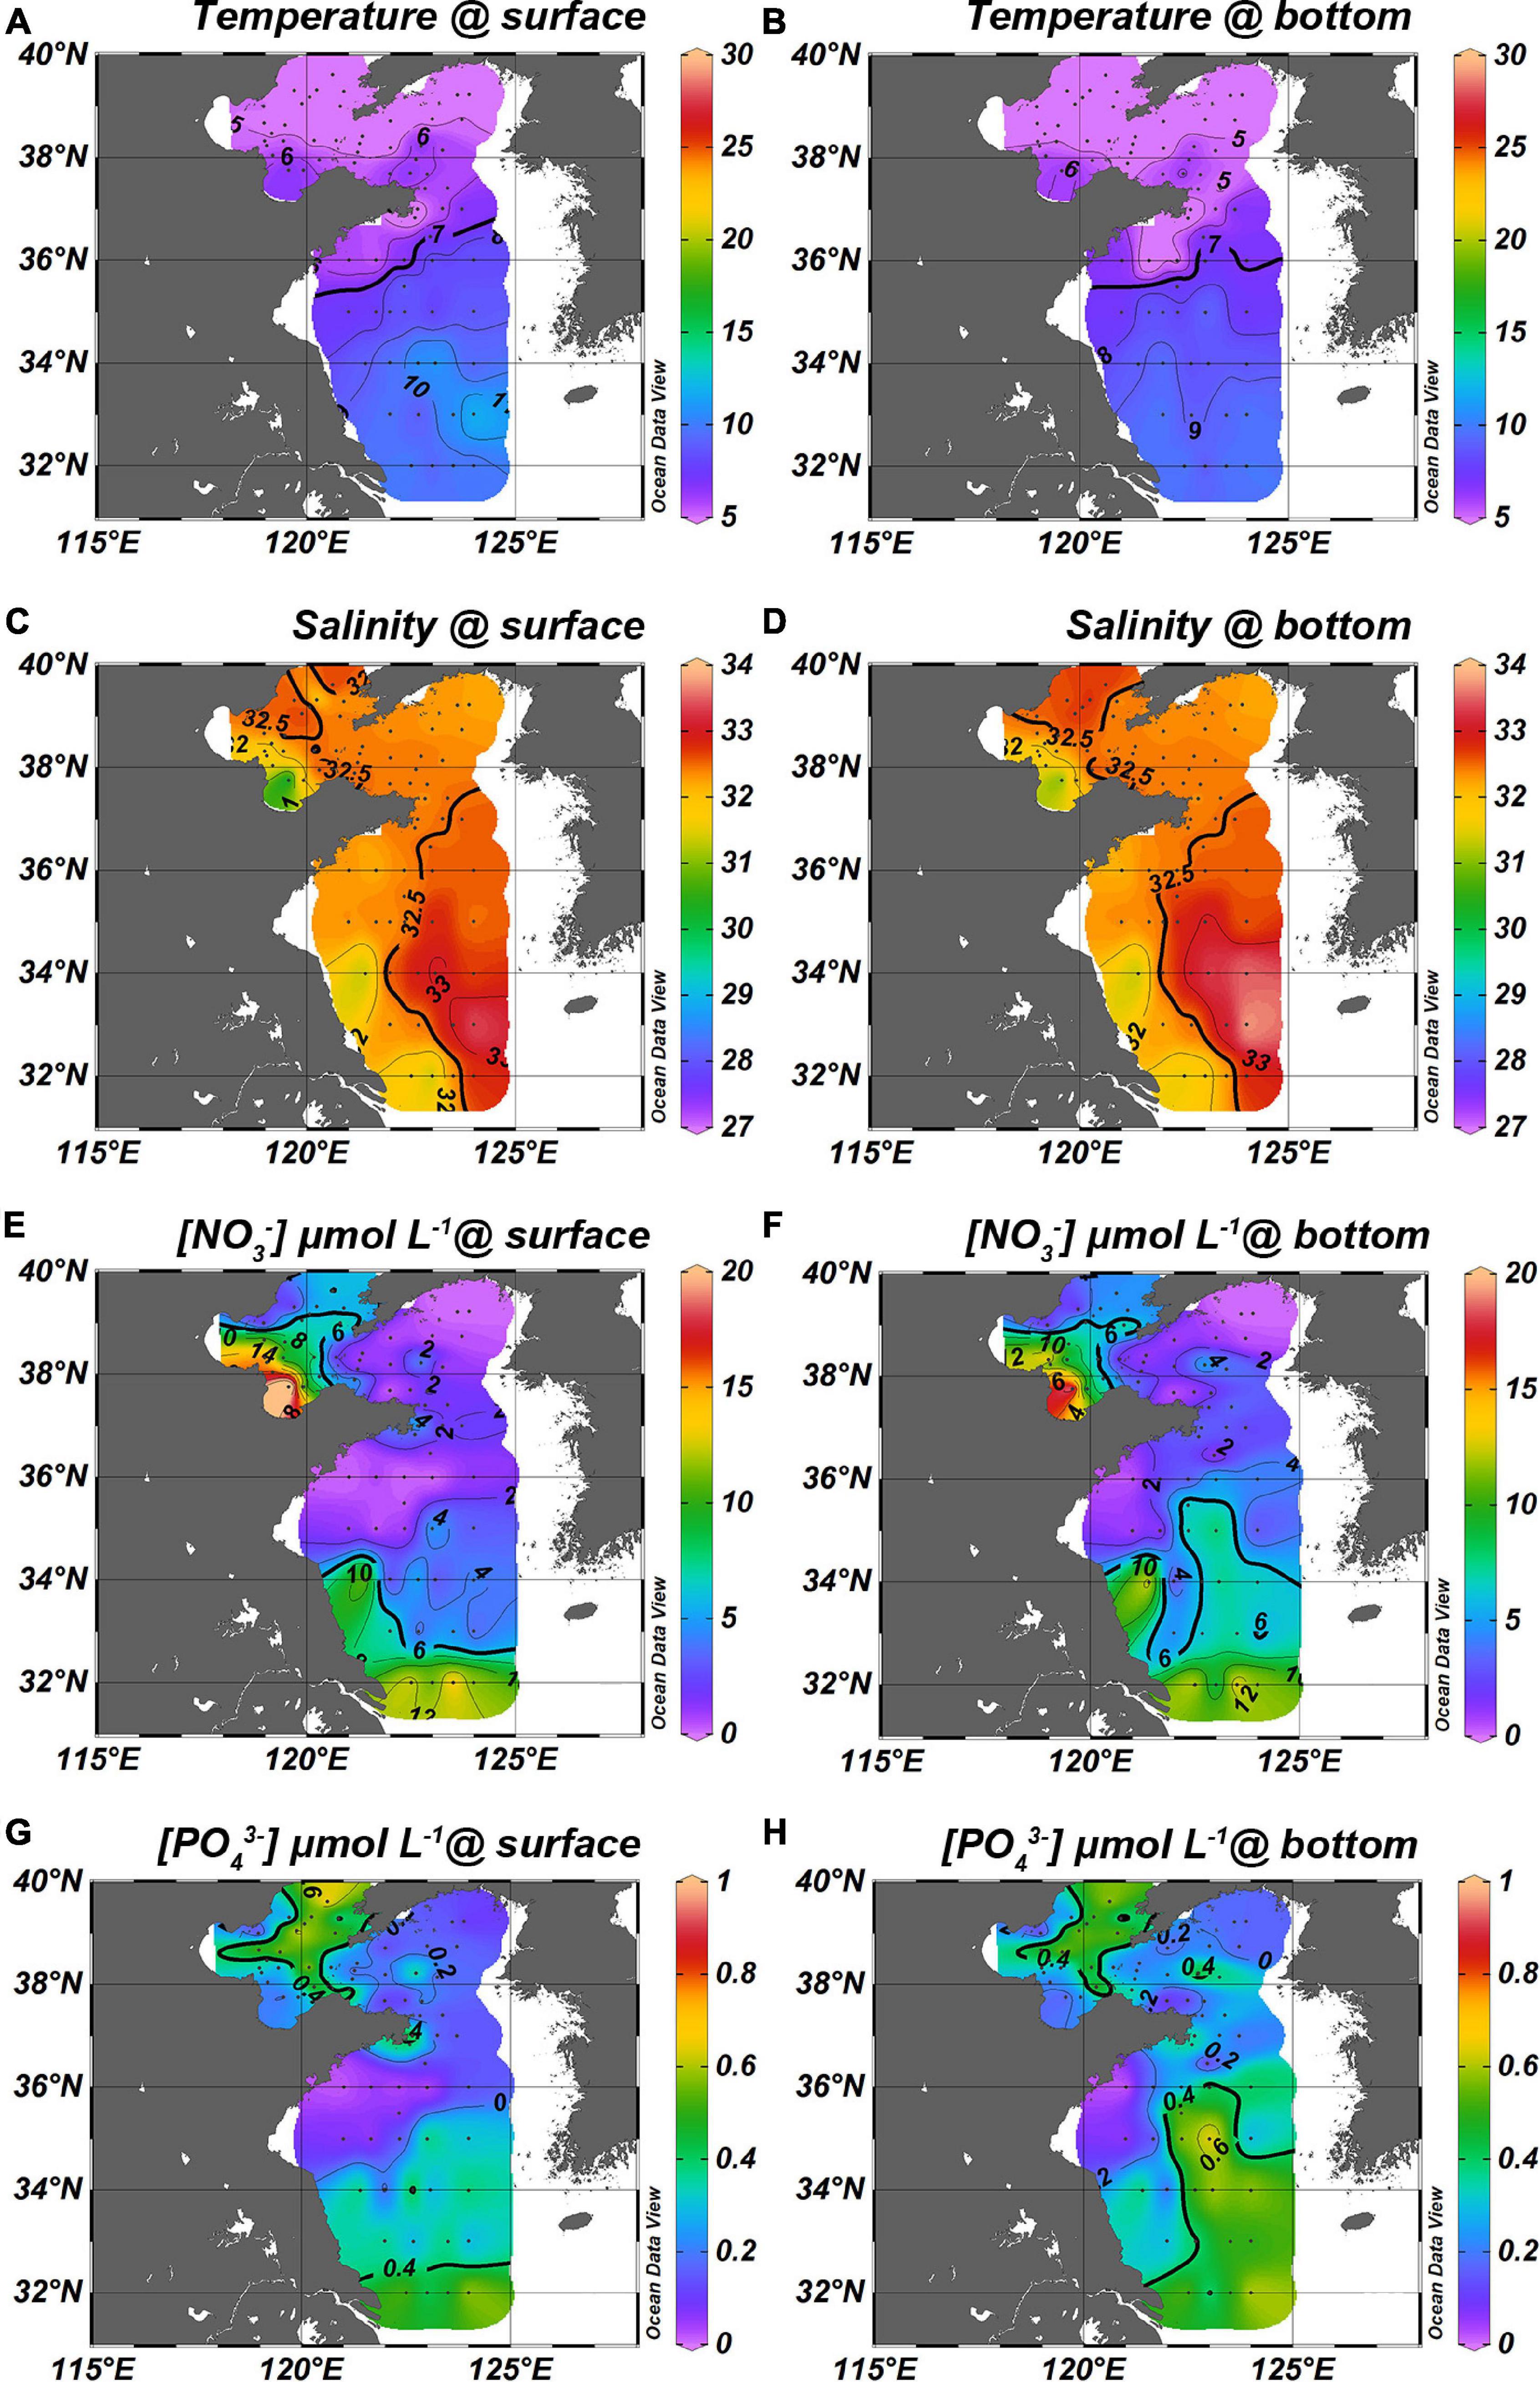
Figure 2. Patterns of temperature, salinity, nitrate and phosphate in spring. The left column (A,C,E,G) are surface layers while the right column (B,D,F,H) is the bottom layers [data of the Bohai Sea shown in this figure were sampled in the same campaigns with the Yellow Sea, more details are in Tian et al. (2020), 10.5194/bg-2020-471].
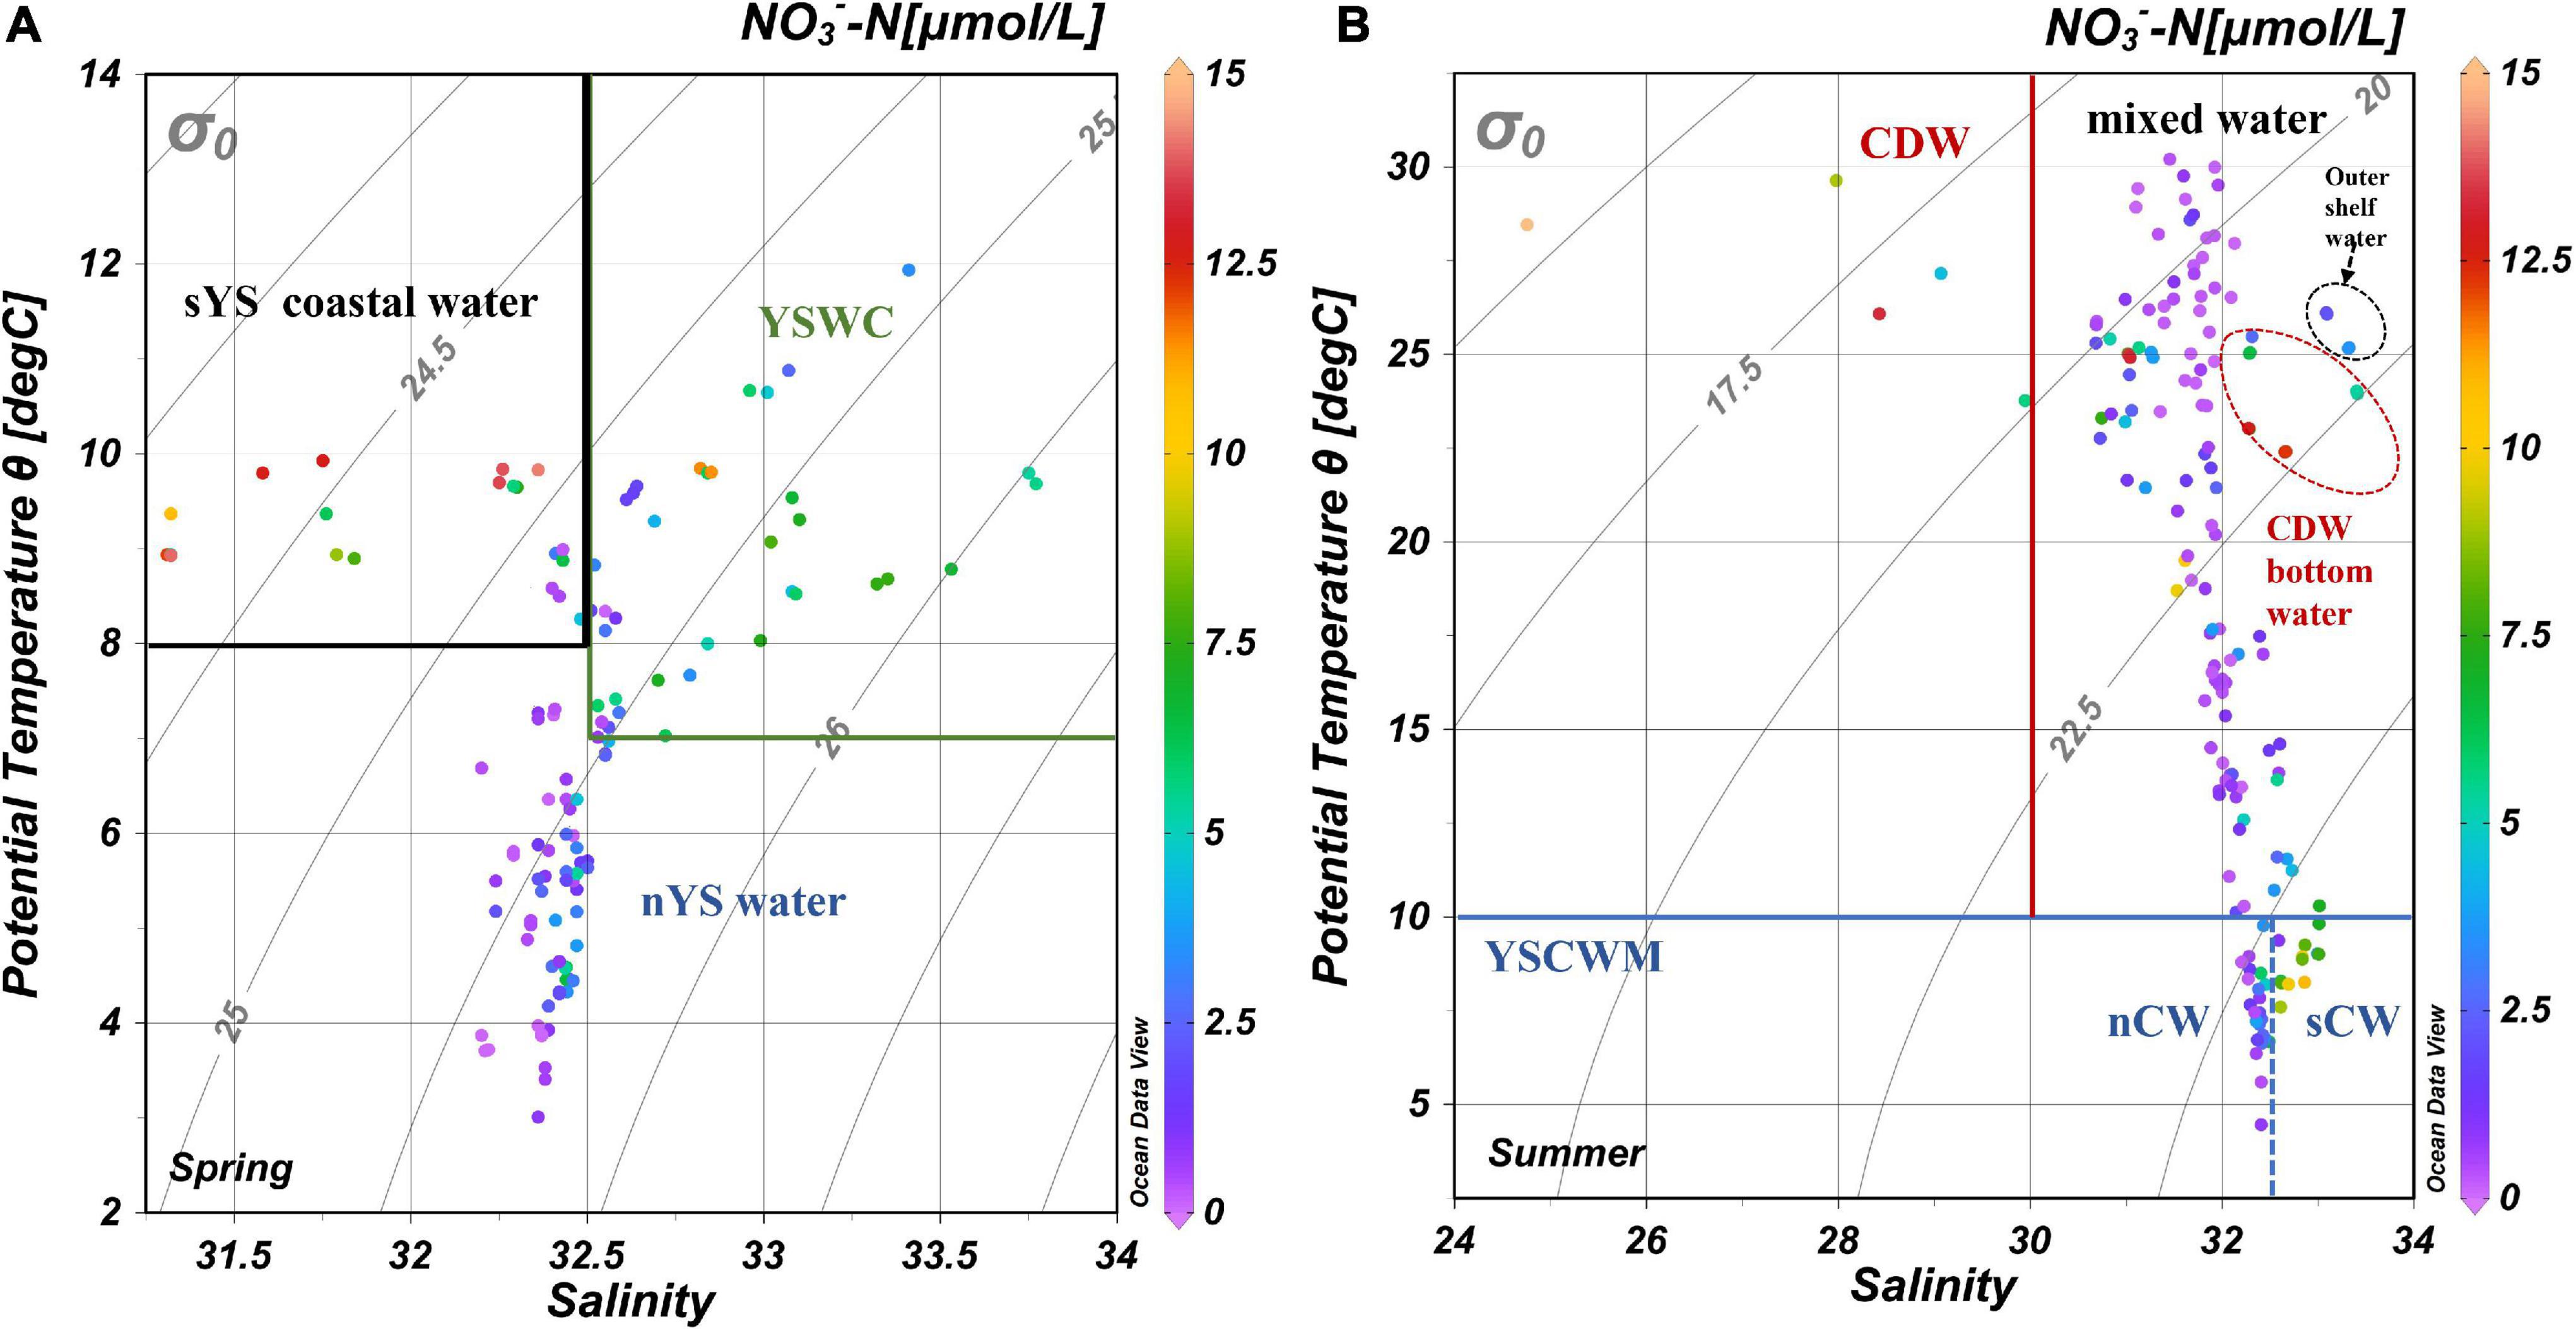
Figure 3. Water masses in the Yellow Sea in spring (A) and summer (B), note that the ranges of axes for spring and summer are different. sYS, south Yellow Sea; nYS, north Yellow Sea; YSWC, Yellow Sea Warm Current; CDW, Changjiang Diluted Water; YSCWM, Yellow Sea Cold Water Mass. nCW, north Cold Water mass; sCW, south Cold Water mass. In summer, the YSCWM can be divided into nCW and sCW located in nYS and sYS, respectively, with nitrate in nCW being lower than in sCW.
In summer, the water column was stratified. The Yellow Sea Cold Water Mass (YSCWM; T < 10.0°C) was found beneath the thermocline in the deep trough of the central YS (Figure 4B). The YSCWM can be divided into the northern Cold Water (nCW, 32.0 < S < 32.5) and southern Cold Water (sCW, 32.5 < S < 33.0) (Figure 3). While the nCW is mostly derived from the spring nYS water, the sCW inherited the features of the YSWC water (Supplementary Figure 1). The upper layer of the YSCWM had relatively low salinities (31.0 < S < 32.0) and high temperatures (23.0°C < T < 30.0°C). Changjiang Diluted Water (CDW) in the southwest YS is characterized by low salinities and high temperatures (S < 30.0, T > 25.0) and appeared in the north and northeast of the Changjiang estuary.
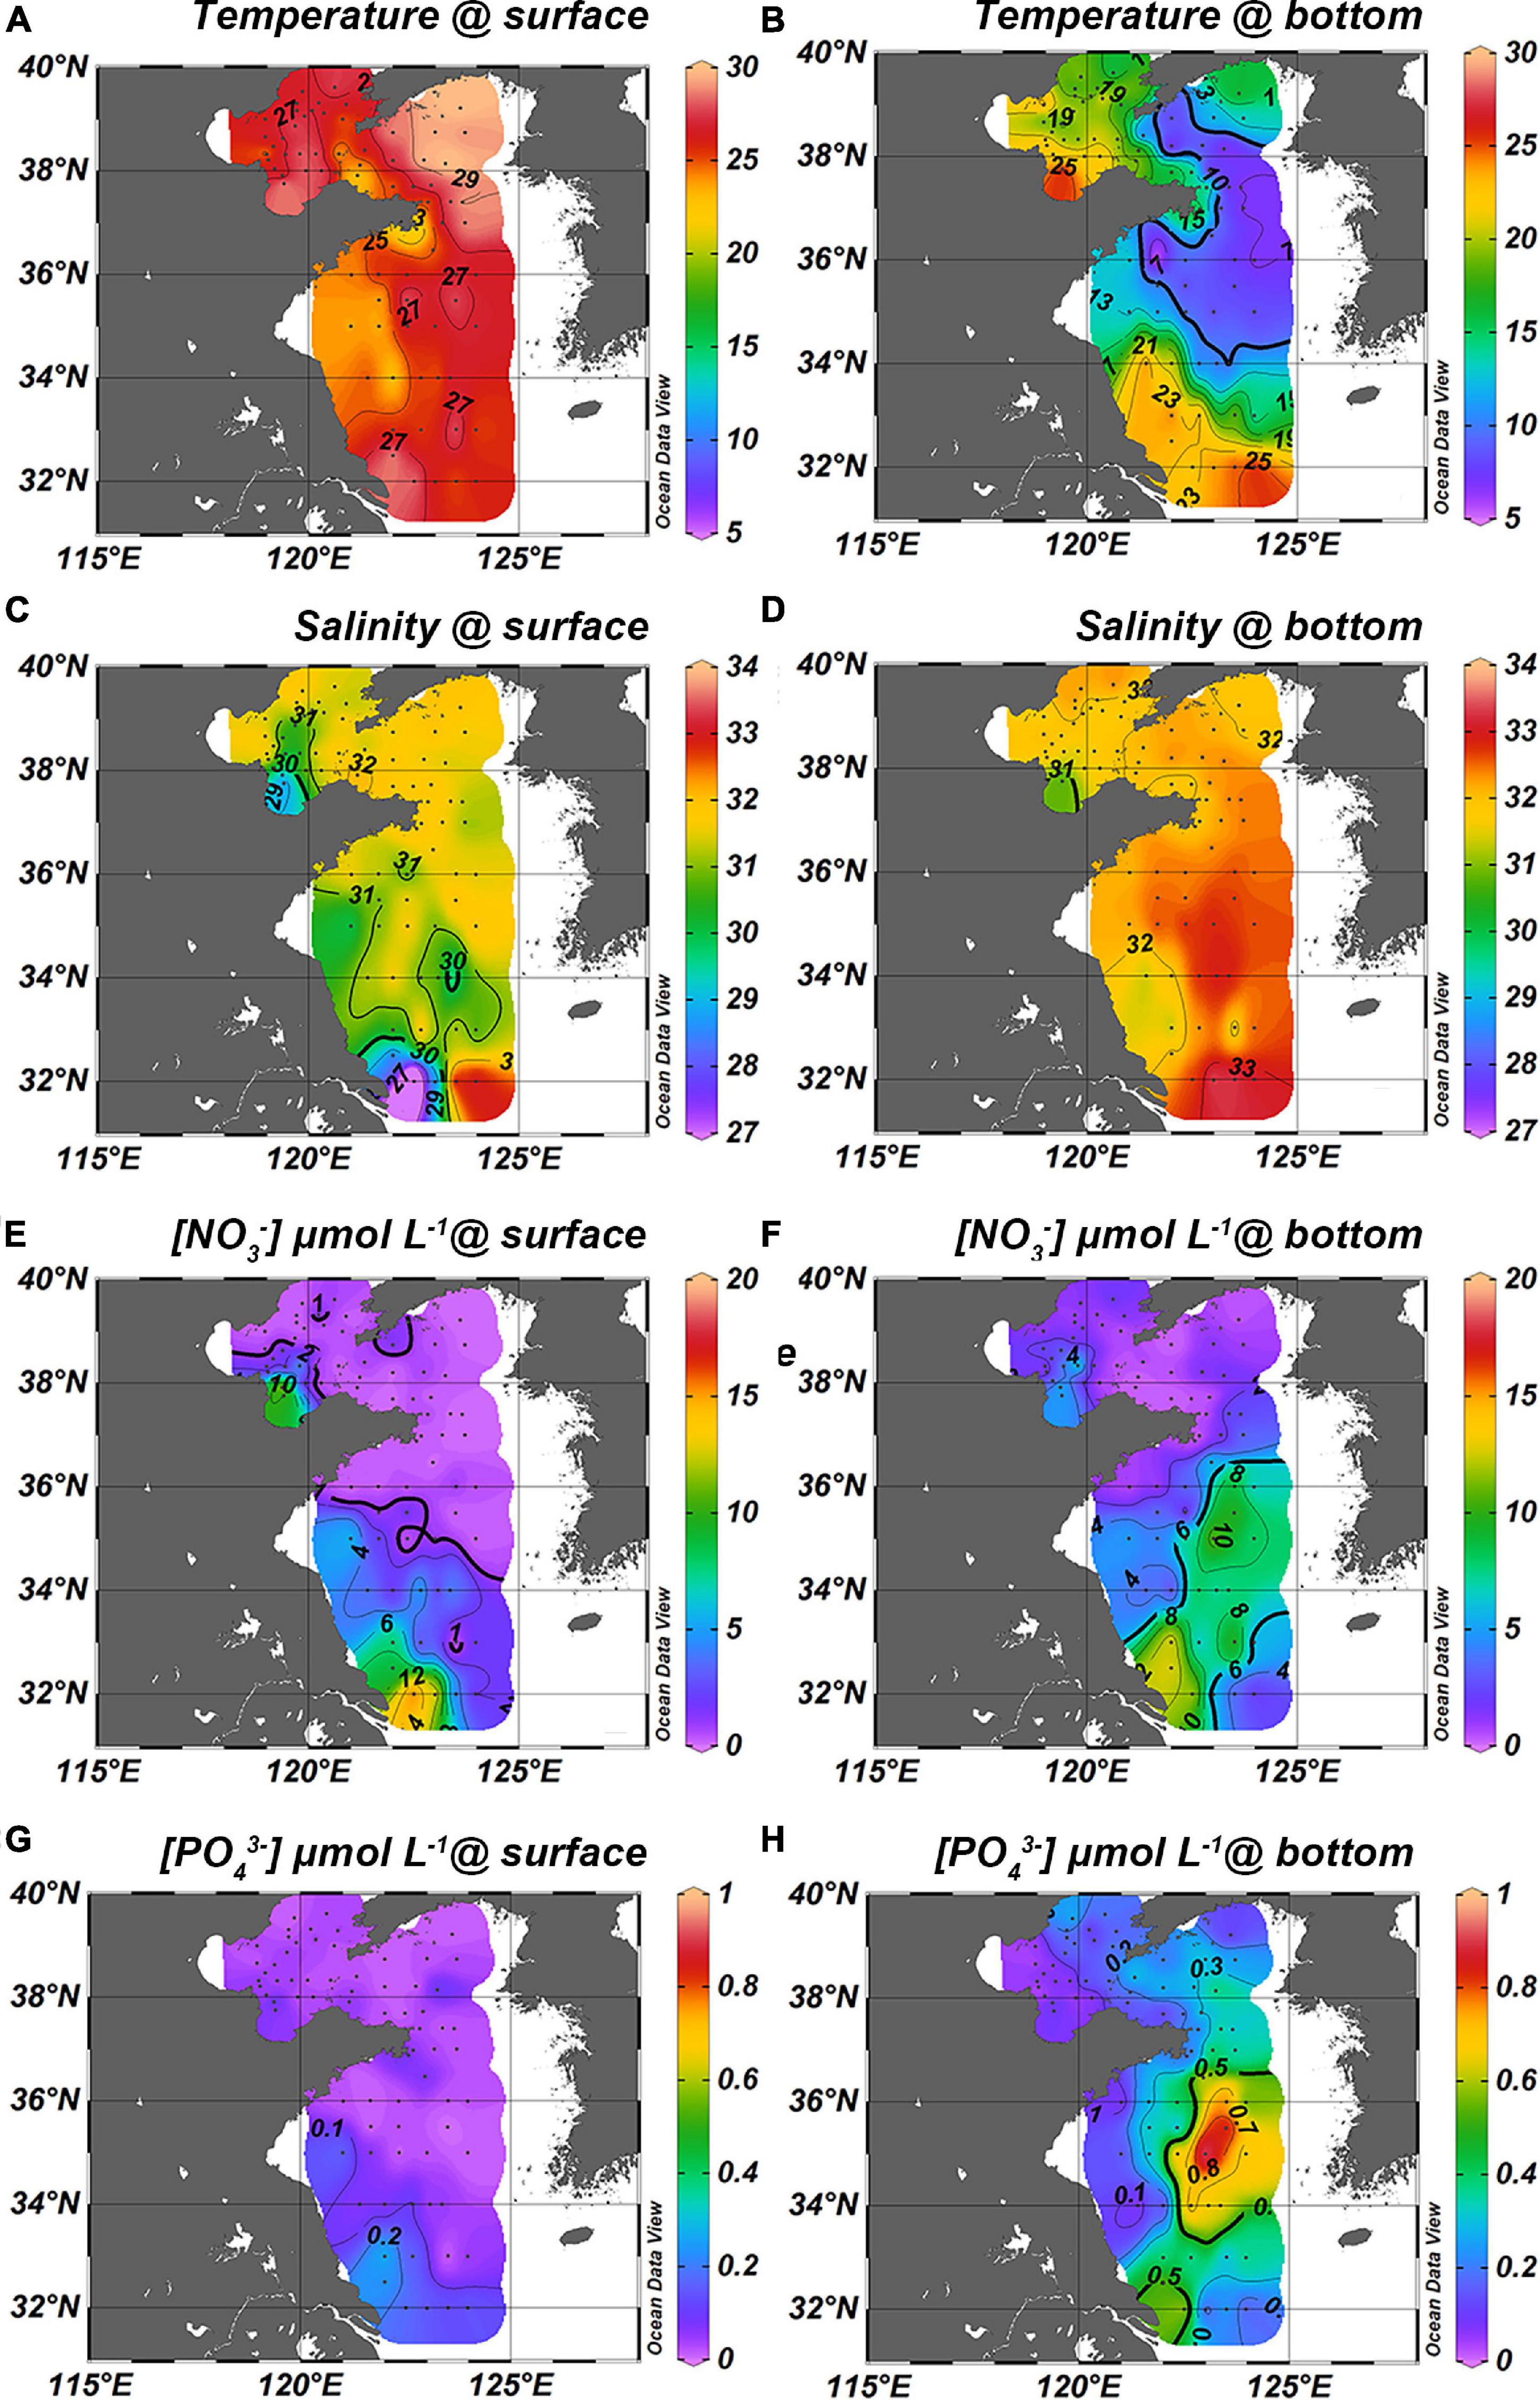
Figure 4. Patterns of temperature, salinity, nitrate and phosphate in summer. The left column (A,C,E,G) are surface layers while the right column (B,D,F,H) is the bottom layers [data of the Bohai Sea shown in this figure were sampled in the same campaigns with the Yellow Sea, more details are in Tian et al. (2020), 10.5194/bg-2020-471].
The maxima of nitrate and phosphate in bottom waters ([] > 6 μmol L–1, [] > 0.4 μmol L–1) in spring match the tongue of YSWC (Figures 2D,F,H). Nitrate and phosphate were enriched ([] > 6 μmol L–1, [] > 0.4 μmol L–1) along the south most transect at 32° N. sYS coastal water found further north than 34° N near Jiangsu coast was relatively nutrient depleted ([] < 4 μmol L–1, [] < 0.1 μmol L–1), probably due to a lack of external replenishment of nutrients in spring. In nYS, nitrate and phosphate concentrations were high in the central area (stations B14 and B23) whereas they were depleted in the northern part (stations B16, B18, and B19) (Figures 2E–H).
In summer, nutrients were depleted of the upper layer of the YS, except for the CDW and in the coastal areas of Jiangsu province. CDW had nitrate concentrations > 14 μmol L–1 at phosphate concentrations of only around 0.2 μmol L–1 in the surface (stations H34 and H35), but nitrate decreased to 12 μmol L–1 and phosphate increased to 0.4 μmol L–1 in the bottom water. Nitrate and phosphate were enriched in the sCW ([NO3] > 6 μmol L–1 and [] > 0.5 μmol L–1) but remarkably, nitrate was depleted in the nCW ([NO3] < 1.0 μmol L–1 and [] > 0.2 μmol L–1) (Figures 4F,H).
We divide the YSCWM into nCW and sCW as described in Section “Hydrological Conditions” for a seasonal comparison of nutrient dynamics. Although YSCWM was not formed in spring, temperature and salinity was almost constant in the central YS basin during these two seasons (Supplementary Figure 1). This is in line with the origin of YSCWM that forms by subsidence of winter cold water (Lee and Beardsley, 1999; Zhang S. et al., 2008), and makes the following seasonal comparison feasible. The spring samples were grouped in the same way as summer samples, although the YSCWM had not formed yet in spring. Nitrate concentration of sCW increased from spring to summer, whereas nitrate of nCW decreased (Figure 5). Considering that the hydrological properties of nCW and sCW are quite similar, these differing seasonal alterations of nitrate (or DIN) concentrations are remarkable and suggest different modes of operation of these two basins with respect to reactive nitrogen recharge. Ammonium concentration of sCW were relatively low in both seasons (Figure 5) and accounted for 6 and 4% of DIN in spring and summer, respectively. In the nCW, on the other hand, ammonium accounted for 15–57% of DIN in spring and summer, respectively. Nitrite concentrations were low with average concentrations <0.30 μmol L–1 accounting for less than 6% of DIN (Figure 5 and Table 1) in both seasons. Phosphate average concentrations were almost uniform in the bottom waters in both seasons except slight increases in the sCW (Table 1). The phosphate concentration of sCW was significantly higher than that of the nCW (p < 0.05, ANOVA). The average values of DIN/P ratio were relatively high in the sCW (Table 1). In the nCW, our results are lower than the historical data in the two seasons but are in accord with the decreasing trend of DIN and nitrate from spring to summer. Likewise, in the sCW, our results are lower than the previous results, but consistent with the increasing tendency from spring to autumn (Table 2). The relatively low concentrations in the year of 2018 were probably affected by the annual nutrient fluctuation (Wei et al., 2015; Yang et al., 2018; Wang et al., 2020b).
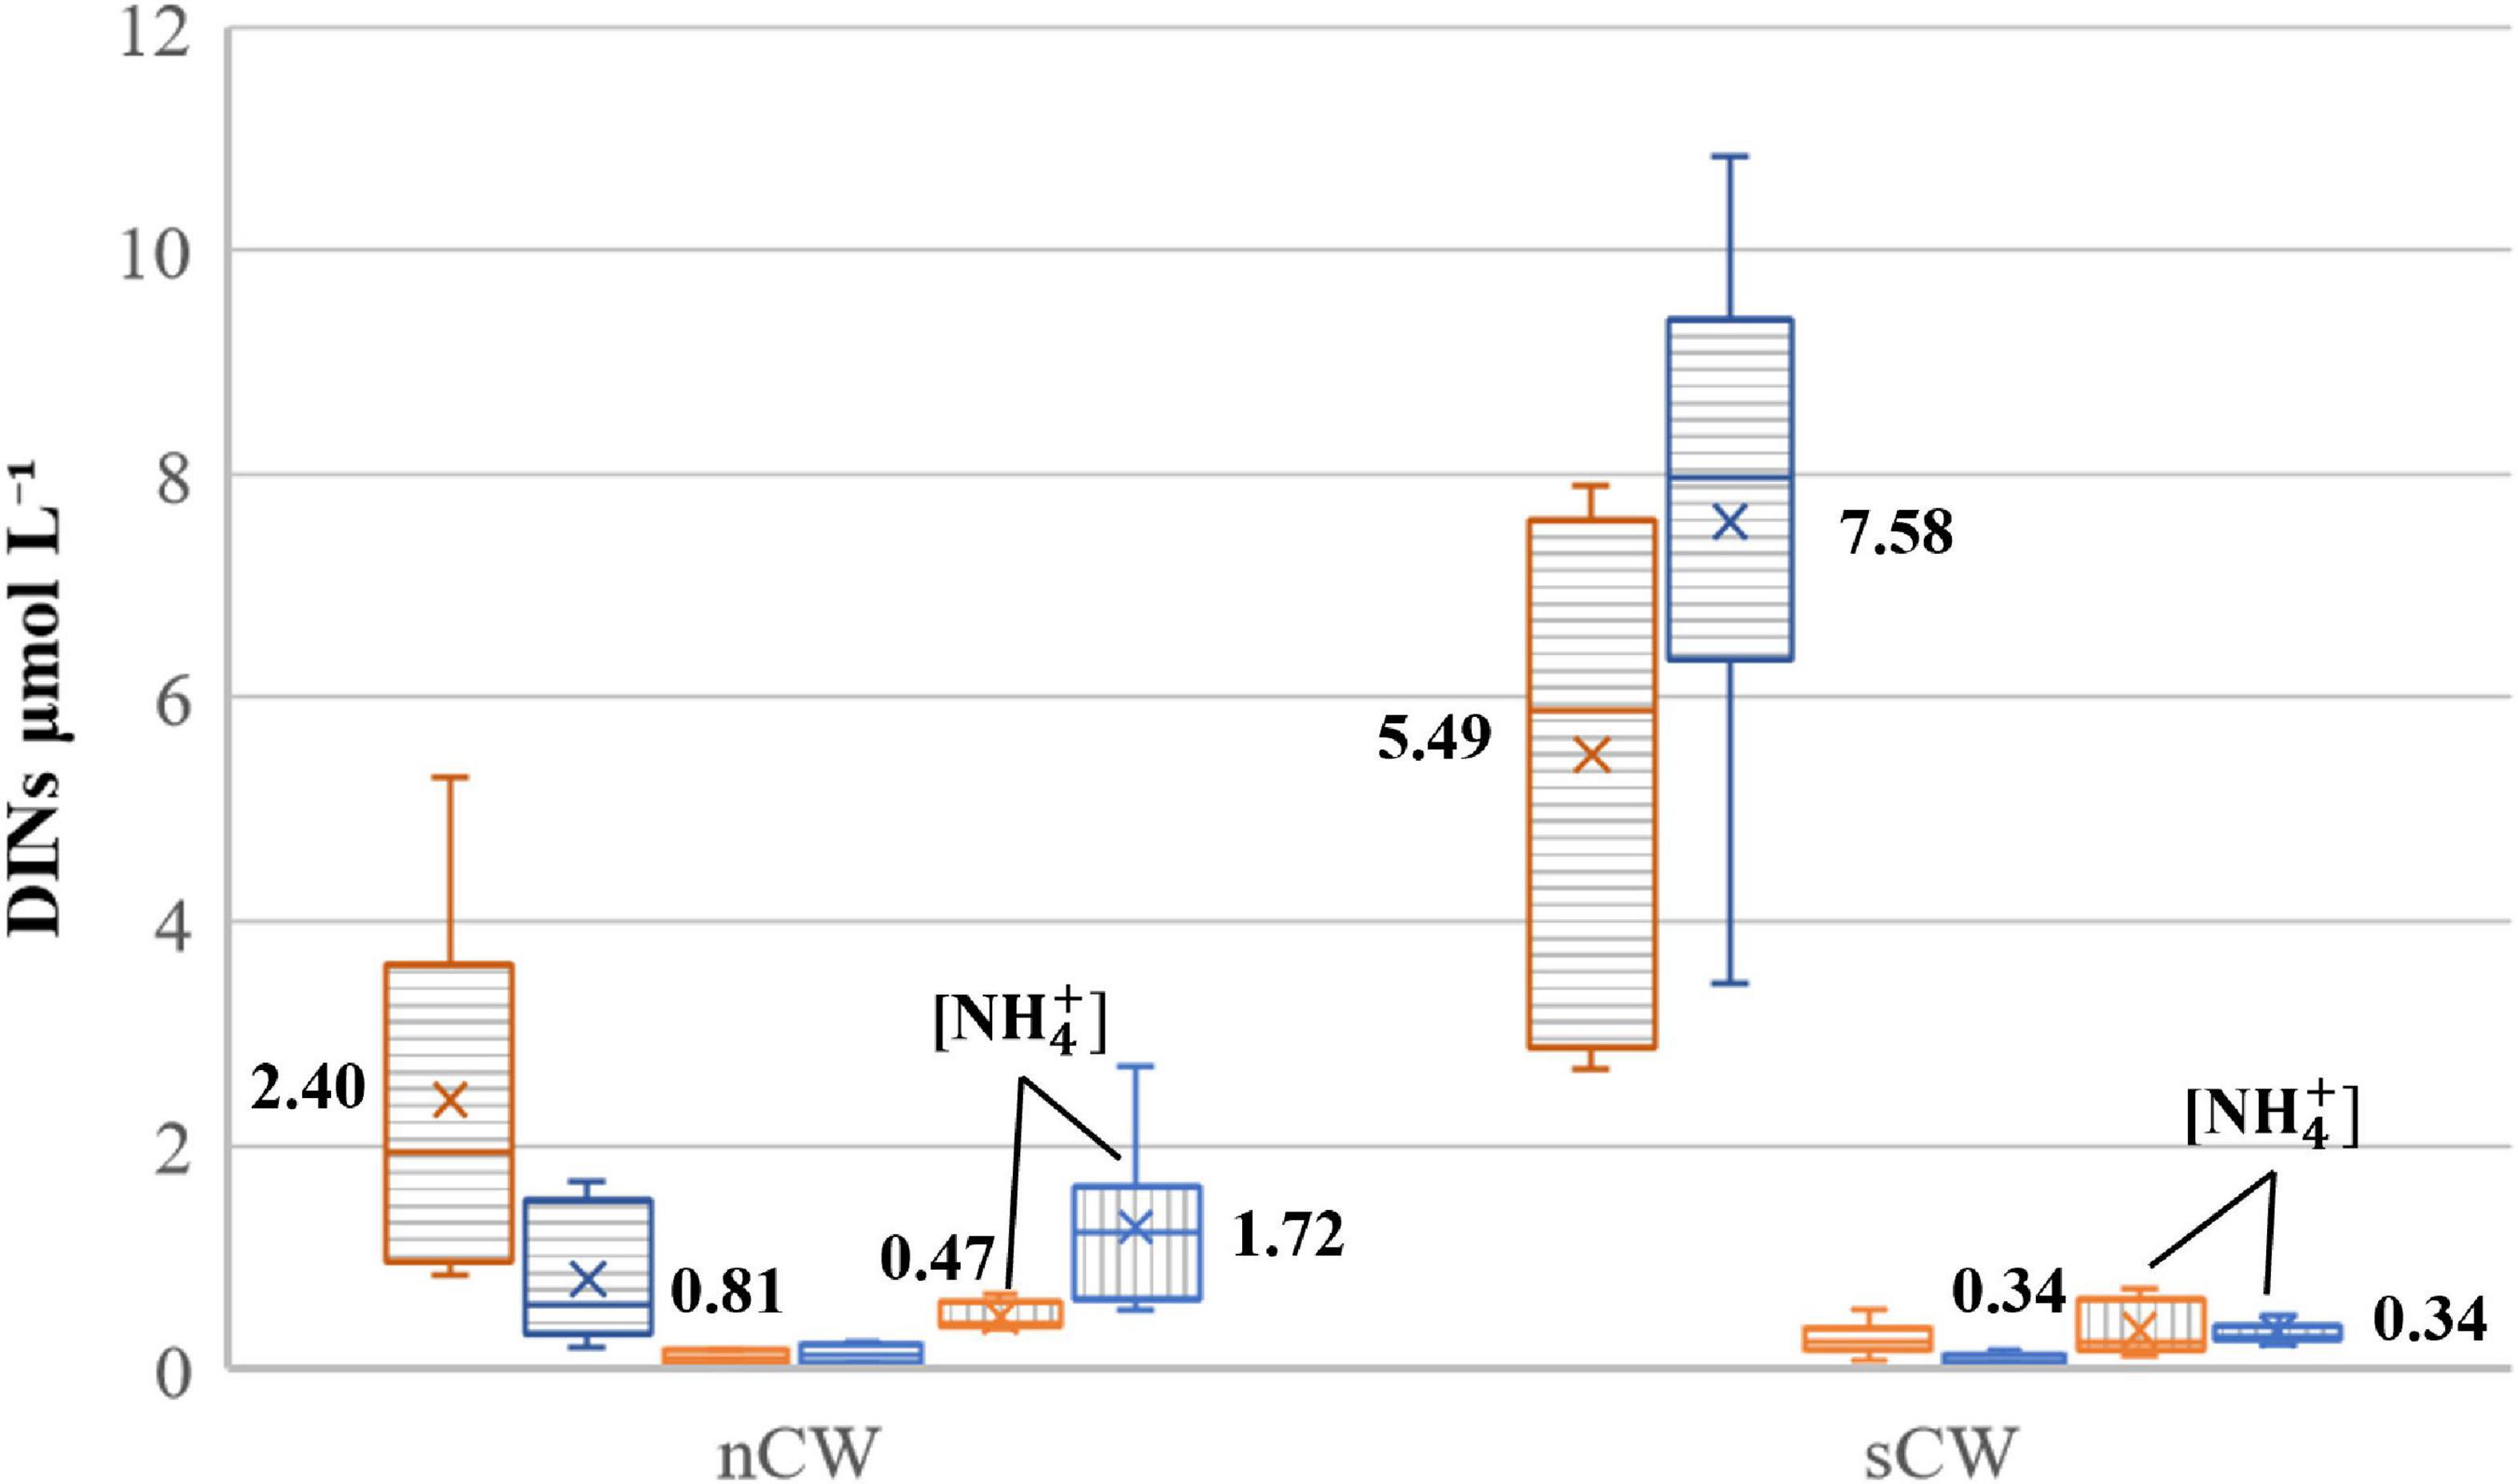
Figure 5. Box and whisker plots of DIN variations in different water masses in the central Yellow Sea bottom water. [] and [] are marked by horizontal and vertical stripes, respectively. DINs concentrations of spring and summer are in orange and blue, respectively. The crosses and numbers represent the average values of each compound, averages of nitrite were not marked due to space restriction. The lines in the boxes are the medians, the upper and lower boxes denote the corresponding quartiles, whiskers denote the maxima and minima.
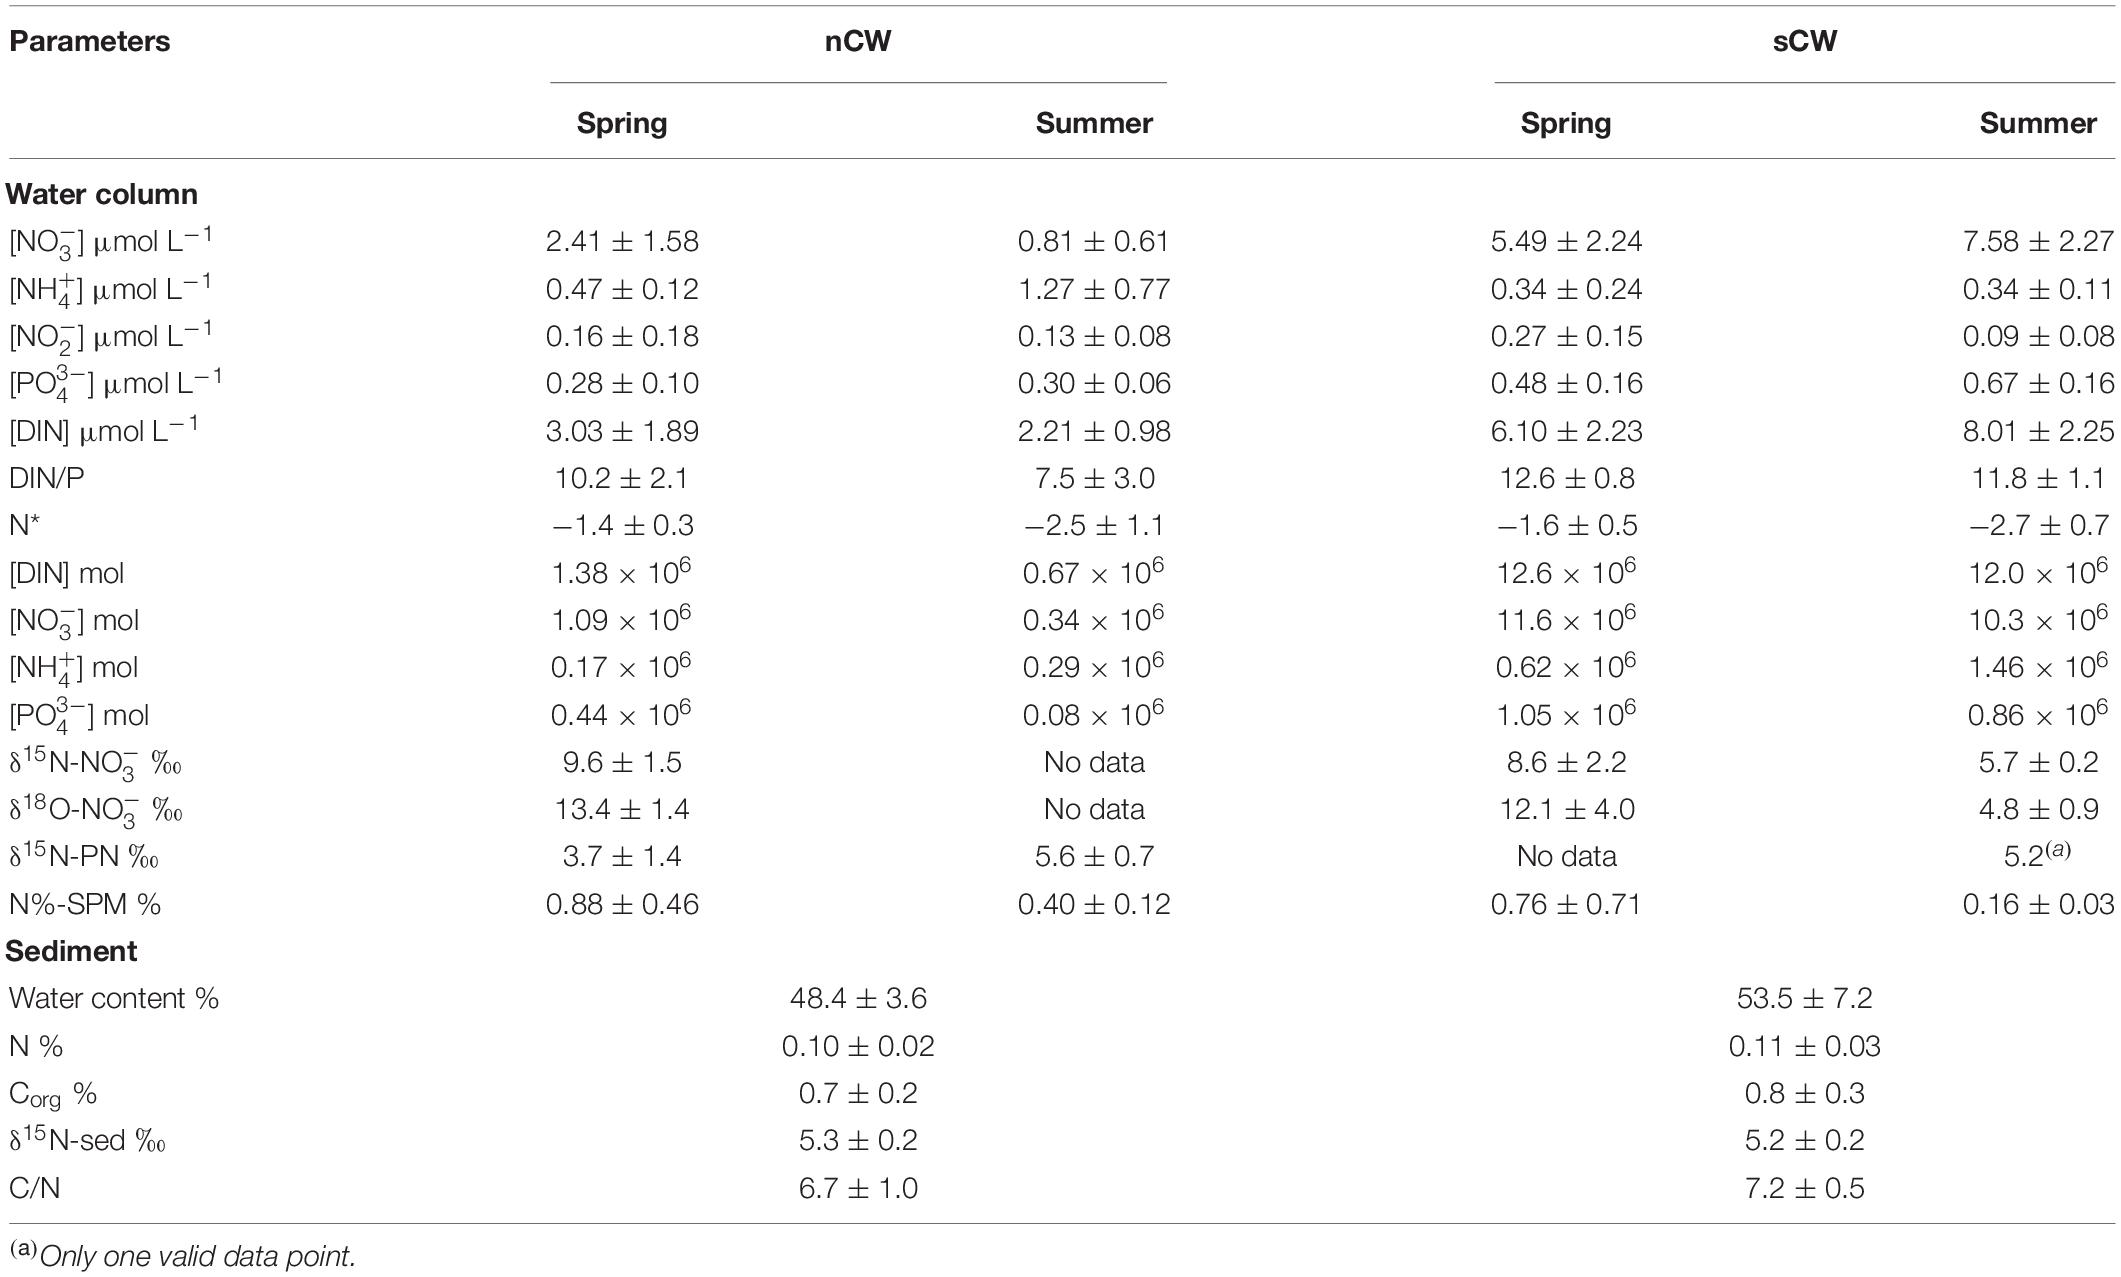
Table 1. Important parameters in central bottom waters in the Yellow Sea.
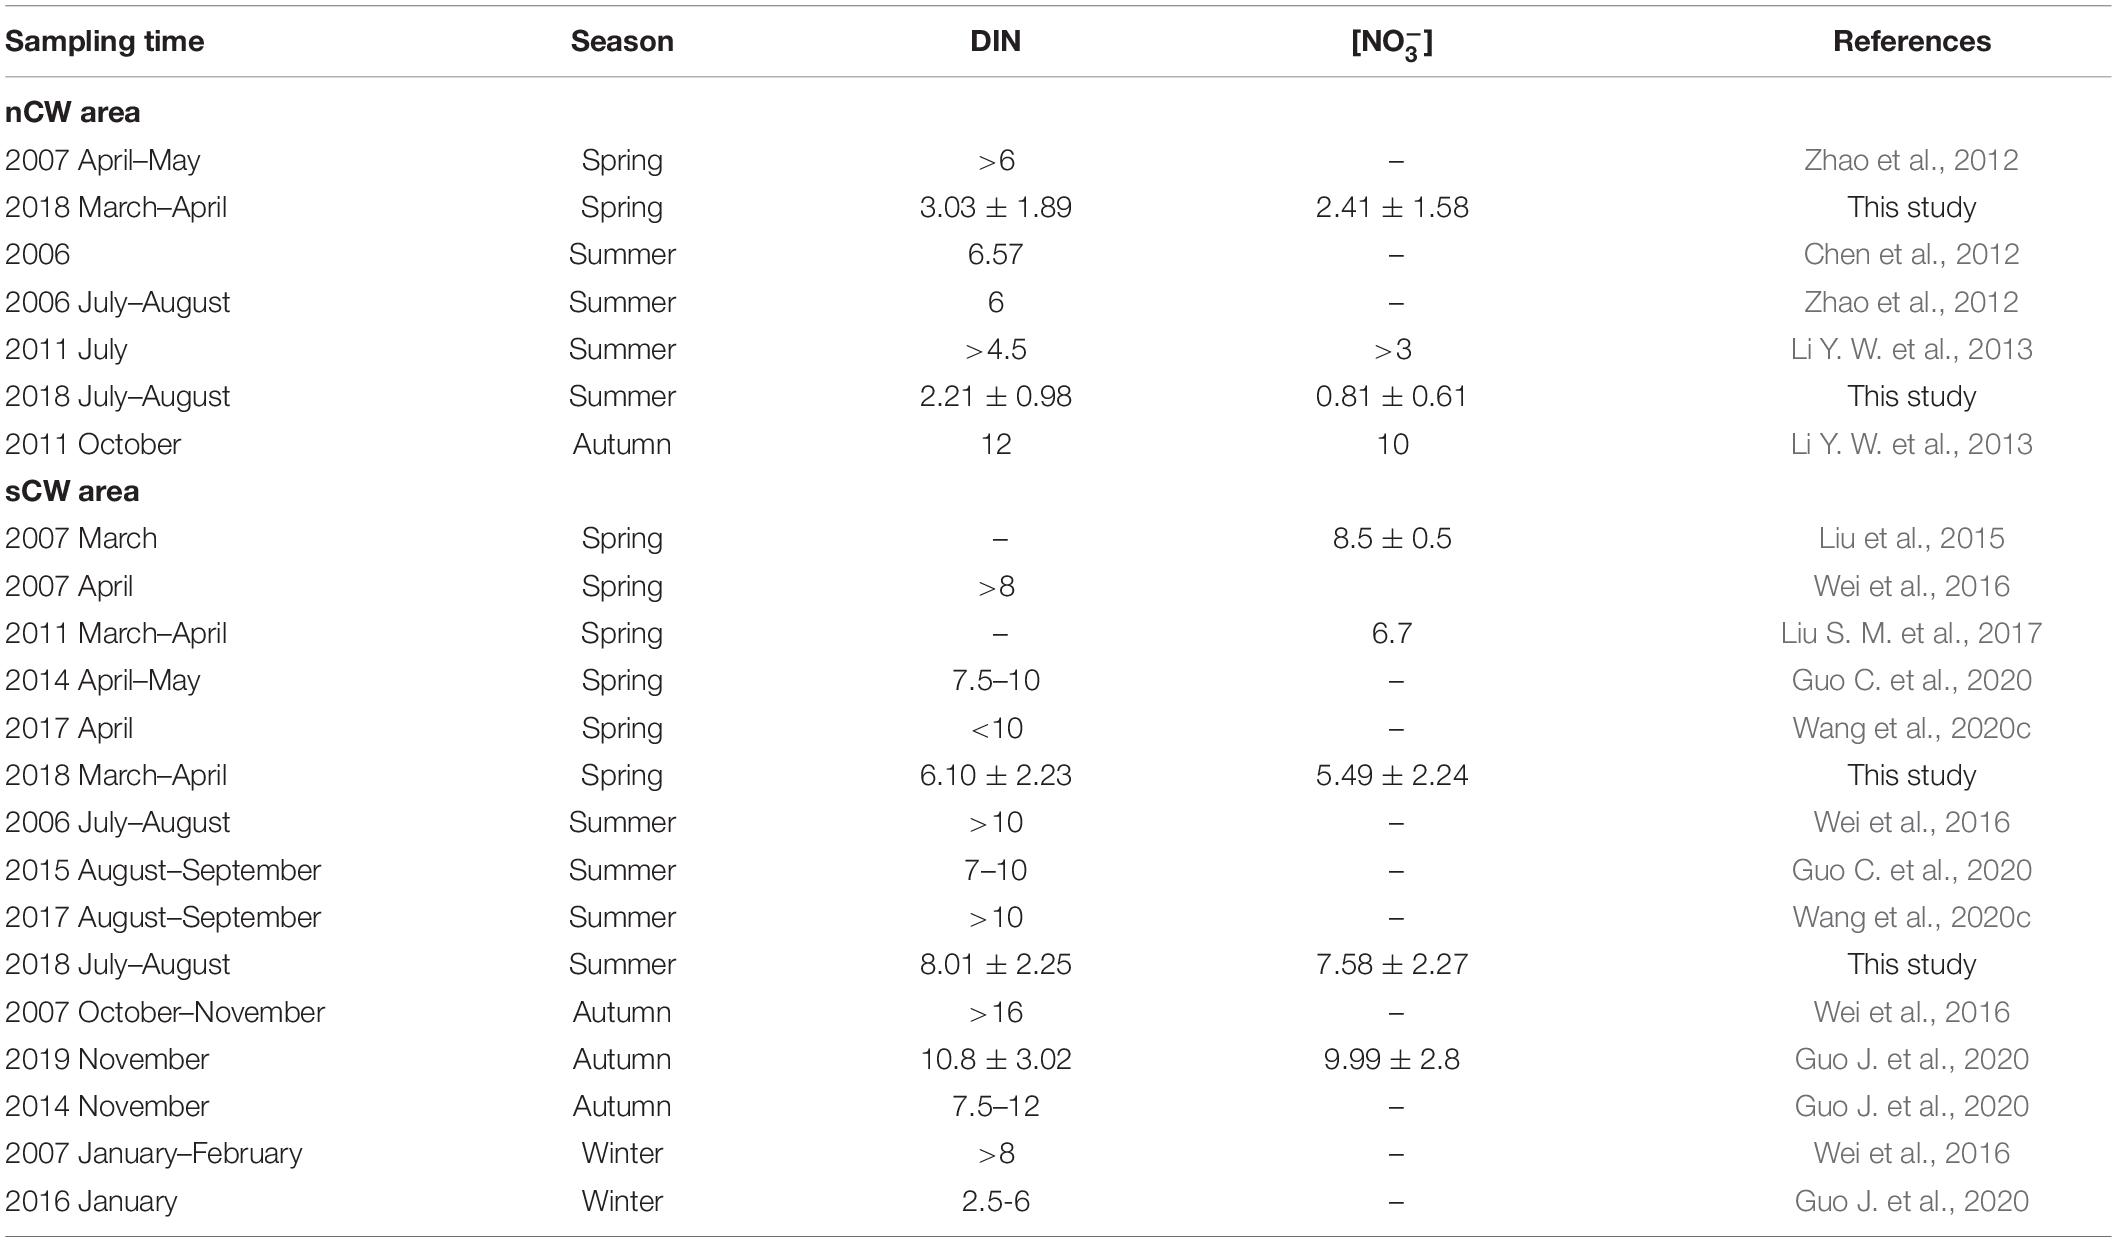
Table 2. Comparison of DIN and nitrate concentration (μmol L–1) in the nCW and sCW areas.
The variable and water-mass specific patterns of N/P suggest different mechanisms of N-cycling for the two branches of the deep water mass. N* is a tracer that reflects the combined effects of denitrification and nitrogen fixation, atmospheric deposition and river inflow on the ratio of N to P (Gruber and Sarmiento, 1997). The simplest expression of (Deutsch and Weber, 2012) represents the excess of [] over 16[], the most commonly used stoichiometric ratio of these two essential nutrients for phytoplankton assimilation. This tracer was first used in studies of the open ocean where nitrate is predominant, whereas nitrite and ammonium have to be accounted for as well in our study area (Zheng and Zhai, 2021), so that here . N* decreased from spring to summer in the nCW and sCW from −1.4 ± 0.3 to −2.5 ± 1.1 and from −1.6 ± 0.5 to −2.7 ± 0.7, respectively. The decrease in N* suggests that DIN is lost in both nCW and sCW between the spring and summer sampling campaigns by mechanisms different from phytoplankton assimilation.
Nutrient distribution was affected by vertical mixing in spring and by stratification of the water column in summer. Water column integration for nutrients can help us to compare the seasonal variations of inventories by eliminating the effect of stratification. In our study, nCW and sCW areas are 7.9 × 10³ km2 and 37.5 × 10³ km2, respectively, in the proportions of 2 and 10% of the whole YS. Water column integration for total DIN, nitrate, ammonium and phosphate were carried out for every individual station, following interpolation by a gridding method (by ArcGIS). The amount of DIN, nitrate, ammonium and phosphate are shown in Table 1. DIN, nitrate and phosphate decreased by 52, 69, and 82%, respectively, in summer in the nCW and ammonium increased by 69%, reflecting loss of DIN and phosphate to biomass and sediment from spring to summer, and their partial recycling. In the sCW, DIN, nitrate and phosphate in summer decreased by 5, 11, and 18%, respectively, whereas ammonium increased by 137%. These estimates indicate that although DIN is lost in the whole water column, this loss was compensated by production of DIN in the sCW. Less relative loss of nitrate in sCW than in the nCW points to nutrient replenishment from external sources (see Section “Sources of Excess Nitrogen in the Southern Part of Central Yellow Sea Bottom Water”).
The δ15N of nitrate (δ15N-) in spring was on average 8.3‰ ± 2.2‰ and ranged from 3.6 to 14.2‰, and the corresponding δ18O of nitrate (δ18O-) averaged 12.3‰ ± 3.5‰ and ranged from 7.1 to 20.6‰. High values of δ15N- and δ18O- (δ15N- > 10.0‰, δ18O- > 15.0‰) were observed in the surface layer of the YSWC, but δ15N- and δ18O-were relatively low (δ15N- = 7.0–8.5‰, δ18O- = 9.0‰) in bottom water. Southern coastal water had the lowest δ15N- values (δ15N- < 7.5‰). In summer, δ15N- was on average 7.9‰ ± 3.3‰ (range of 1.1–18.1‰) and δ18O- was on average 8.7‰ ± 4.7‰ (range of 2.2–22.8‰). Low values of δ15N- and δ18O- characterized the sCW (δ15N- = 5.7 ± 0.2‰, δ18O- = 4.8 ± 0.9‰), whereas coastal water masses typically had high values (Table 1).
N % of SPM in spring was on average 1.15% ± 1.03% and YSWC surface water and nYS surface water had the highest N % (N % > 2.0%), whereas suspended particulate matter in southern coastal water had the lowest N-concentrations (N % < 0.5%). N % of SPM in summer was on average 0.40% ± 0.21% with N % in surface layer higher than those in the bottom layer. In summer the CDW area had highest values (N % > 0.8%). The N % of bottom waters in summer were lower than in spring, indicating stronger decomposition of organic particles, resuspension is less likely the major reason because the weaker water mixing in summer. Average N % of sCW (N % = 0.16% ± 0.03%) was significantly lower than nCW (p < 0.05) (Table 1), probably indicating strong remineralization of particles in the sCW.
δ15N of particulate nitrogen (δ15N-PN) in spring was on average 4.3‰ ± 1.8‰. YSWC water had the lowest values (δ15N-PN < 3.0‰) whereas nYS had the highest values (δ15N-PN > 5.0‰). In the sea surface, incomplete phytoplankton assimilation results in increased δ15N in the residual nitrate pool, and produces organic particles with relatively low δ15N (Sigman and Boyle, 2000; DiFiore et al., 2009). Studies in the YS and ECS proposed an isotope fractionation factor of approximately 5‰ during phytoplankton assimilation (Umezawa et al., 2013; Liu S. M. et al., 2017; Wu et al., 2019; Liu et al., 2020). The corresponding high N %, high values of nitrate dual isotopes and low δ15N-PN suggest phytoplankton assimilation of nitrate and its conversion to biomass in the surface of YSWC. In summer, δ15N-PN was on average 4.7‰ ± 1.5‰, but the range of values of δ15N-PN in the surface was quite wide due to co-occurrence of diverse processes, such as phytoplankton assimilation and nitrification. Assimilation and nitrification were both revealed by nitrate isotopes in this area (Liu S. M. et al., 2017; Wu et al., 2019), which is the likely reason for the wide range of δ15N. The values converged to between 4 and 6‰ with increasing water depth and at >40 m water depth approached the δ15N of nitrate and sediment (Table 1).
The sediment under different water masses are characterized by similar water content, nitrogen content (N %), organic carbon content (Corg %) and δ15N (δ15N-sed) of sediment under nCW and sCW. There are no statistically significant differences between other groups of sediments due to low sample numbers, but the distribution (Supplementary Figure 2) and average values suggest that the sediment under coastal water masses had relative low water content, N %, Corg %, and δ15N-sed, whereas they had relatively high C/N ratio.
The inter-seasonal variations of nitrate and ammonium are different for the two branches of deep water in the Yellow Sea (nCW and sCW), although DIN and nitrate loss occurred in both water masses. Nitrate concentration decreased in the nCW in summer, whereas it increased in the sCW. In contrast, ammonium concentrations increased in the nCW, but decreased in the sCW. In the following, we aim to explain and quantify DIN and nitrate loss in the central YS bottom water and shed light on different seasonal dynamics of nitrate and ammonium cycling in nCW and sCW. The key processes, namely denitrification and nitrification, are discussed and the proportion of regenerated nitrate in summer is quantified by an isotope mass balance approach in the sCW. The excess nitrate in sCW compared to the nCW is analyzed as well to elucidate its sources.
The decrease of DIN in the water columns of both nCW and sCW areas from spring to summer (Table 1) requires an N loss process such as denitrification or sedimentation of organic matter and associated reactive N.
The YSCWM with its two offshore water masses considered here (nCW and sCW) is isolated from any euphotic assimilation by summer stratification. As these cold water masses are located below the thermocline there is no air-sea exchange of oxygen, and DO is continuously consumed once the thermocline is formed. Thus, Apparent Oxygen Utilization (AOU) represents the net change due to respiration (Xiong et al., 2020). In the YS, approximately 90% of the organic carbon derived from primary productivity is decomposed in the water column (Song et al., 2016; Zheng and Zhai, 2021) and the positive AOU values in summer indeed suggest that respiration is the dominant process. The expected in nCW and sCW from AOU is higher than the actually measured between summer and spring sampling (Table 3), implying that regenerated nitrate was removed from the water masses.
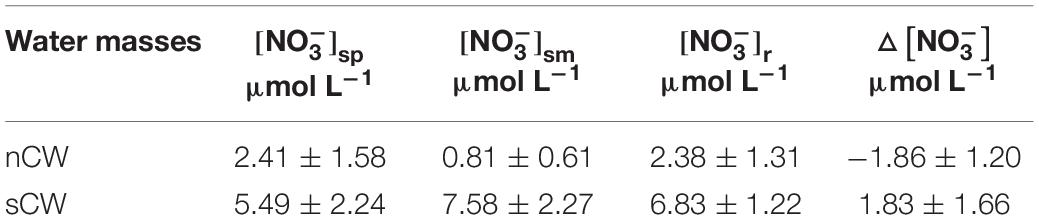
Table 3. Comparison of regenerated and observed nitrate in nCW and sCW.
A likely reason for nitrate loss in both the nCW and sCW is denitrification. Water column denitrification can be ruled out, because the lowest value of DO in nCW and sCW was 218.3 μmol L–1 (station HS1, at 73 m) in summer, which is much too high to allow denitrification in the water column that can only proceed when DO is below 5 μmol L–1 (Altabet, 2006). In addition, the dual isotope values of residual nitrate in that case must show the fractionation effect that enriches 15N and 18O during water column denitrification (Wankel et al., 2006), which is not observed in our data. Instead, the dual nitrate isotope ratios were lower in summer than in spring (Table 1).
Sedimentary denitrification is a strong candidate for the observed nitrate loss in the nCW and sCW. Continental shelf sediment are reported to account for >50% of global nitrate and DIN loss (Bohlen et al., 2012), and sediment denitrification normally is associated with little or no isotope fractionation due to the limitation of nitrate supply to the reactive sediment zones (Brandes and Devol, 1997; Lehmann et al., 2004; Devol, 2015). In the sediments of YS, nitrate is transported from the sediments to the overlying water at most sampling stations, whereas transport into the sediments was observed in the YSCWM area (Liu S. M. et al., 2017; Wu et al., 2019).
In the sediment of the YS, denitrification is a dominant process compared with anammox as evident by abundance of corresponding genes (Gao et al., 2017; Zhang et al., 2018; Cai et al., 2019). For instance, denitrification removes 54–98% N in the BHS and nYS (Zhang et al., 2018). In the surface sediment of the YS, richness and diversity of denitrifiers in mud deposition zones of YS (i.e., in the area of sCW in our study) were lower than the ones in the Yangtze Estuary (Zheng et al., 2015), and higher than the ones in the surface sediment of the South China Sea (Katsuyama et al., 2008; Li M. et al., 2013; Gao et al., 2017).
High concentration of organic matter facilitates the enrichment of denitrifiers (Hill and Cardaci, 2004) and other heterotrophic bacteria (Ren et al., 2020). In the YS, the mud sedimentation area (under nCW and sCW) has relatively high organic carbon content (Corg%). Previous studies revealed that Corg% is positively correlated with the abundance of the functional genes of denitrification (Gao et al., 2017; Zhang et al., 2018), implying that N loss in nCW and sCW is prominently driven by microorganisms.
In the nYS, the abundance of denitrifiers was higher in summer than in spring and autumn, and denitrification flux in summer was about 2 times higher than those in spring and autumn (Chen et al., 2011). All this is in accord with significant N loss to denitrification during summer in the nCW. In the sYS, the bacterial production in summer was on average 3 times that of spring, and the YSCW area had the highest bacterial production (Zhao et al., 2010), probably associated with the N loss in CWs in summer.
The assimilation of nitrate by benthic foraminifera and subsequent intercellular denitrification has been proposed as one reason for N loss in the sCW in summer (Xu et al., 2017; Wu et al., 2019). The distribution of benthic foraminifera was correlated to the median grain size of the sediment and it was abundant in the mud area in the central YS trough (Sun et al., 2009). Sediment denitrification is thus the most plausible reason for the observed nitrate loss in the sCW. The conversion of ammonia and nitrite to N2 by the anammox process cannot be excluded based on our data in hand, but denitrification likely is predominant (Zhang et al., 2018).
Another possible reason of nitrate loss is nitrate vertical diffusion. Upwelling at the boundaries of the YSCWM (Wei et al., 2016) and vertical diffusion can both supply nutrients from deep water to the euphotic layer (Su et al., 2013). Vertical diffusion from the near bottom water in summer has been estimated to supply 4,945 μmol m–2 d–1 of DIN and 236 μmol m–2 d–1 of P to the thermocline in the sCW (Su et al., 2013). Although the upwelling is generally not considered as a cause for changes in the stoichiometry of nutrients, the N:P ratio of the diffusion flux of 21 implies that DIN is consumed more than P.
In summary, the nutrients were regenerated from sinking organic matter or sediments in summer in both the nCW and sCW. However, nitrate concentrations in summer were much lower than the AOU-based estimate of regenerated in both nCW and sCW. Denitrification is the main factor resulting in nitrate loss in the nCW and sCW, and stronger N depletion in the nCW compared to the sCW was observed.
The regenerated nitrate is an important source of YSCWM in summer, the proportion can be estimate by its distinctive δ18O value. δ15N of newly nitrified nitrate bears the signal of the particulate nitrogen (PN) source and the fractionation effect nitrate cycling to PN and back to nitrate. Differing from this, δ18O- is a good tracer of nitrification because δ18O of newly nitrified nitrate bears the signal of ambient water and dissolved oxygen without contribution of preformed nitrate, regardless of its origin from particulate or dissolved organic nitrogen. For quantification of the portions of preformed and regenerated nitrate in summer, a simple mixing model can be set up between newly nitrified and preformed nitrate with distinctive δ18O values of each source. The portion of preformed nitrate in spring and newly nitrified nitrate in summer can be calculated following Eq. (4) and Eq. (5). The calculations below are only based on the sCW due to the fact that nitrate dual isotopes in the nCW were near the detection limit.
where and denote the concentrations of the residual portion of the preformed nitrate in spring and of the residual portion of regenerated nitrate in summer, respectively. denotes the nitrate concentration of sCW. δ18Ontr denotes the delta-value of newly nitrified nitrate. If δ18Ontr is given, and can be quantified.
The values of δ18Ontr was not documented for the YS before, but its range can be constrained: (1) The average value of δ18O-H2O of YS is −0.7 ± 0.3‰ (n = 9) (Schmidt et al., 1999), this must be the lower limit of δ18O-H2O for newly nitrified nitrate. (2) Assuming that 5/6 of oxygen atoms are from water (Mayer et al., 2001) and the remaining 1/6 has a δ18O-O2 of 23.5‰ (Kroopnick and Craig, 1972) the δ18Ontr can be expected to be 3.3 ± 0.2‰. (3) In the open ocean, δ18Ontr is around 1.1‰ higher than in the ambient water (Sigman et al., 2009). Assuming the same systematic difference would result in δ18Ontr of 0.4‰ in the YS. In summary, the δ18Ontr is theoretically in the range of −0.7 to 3.3‰ in the YS.
To further constrain the value of δ18Ontr, an iterative mixing simulation is employed based on our observed data. This mixing model can be simplified by several assumptions: (1) Reaction rates of nitrification and denitrification in sCW are stable during the study period. (2) Nitrate concentration in sCW is the function of time (in days). As our spring and summer cruises were in April and August, the whole simulation period is about 120 days. (3) Nitrification, mixing and removal of nitrate proceed simultaneously. Because decomposition of organic particulate nitrogen in the water column accounted for around 90% of total nitrogen loss, the predominant nitrate flux should be directed from water to the sediment so that water column nitrification probably supplies nitrate for sediment denitrification. Ammonium assimilation in the sCW is not implemented in the simulation due to the fact that most of it occurs in the euphotic layer. Thus, the mixing model can be simplified, as nitrate is a mixture of preformed and newly nitrified nitrate, which afterward is removed by denitrification or diffusion (Eq. 6 and Eq. 7). δ18Oloss in Eq. 7 can be calculated by Eq. 8 to Eq. 10.
where n denotes the number of steps (=days) of the simulation (in d, 1 ≤ n ≤ 120). and 18On denote the nitrate concentration and δ18O in sCW of day n, respectively. When the simulation starts (i.e., n = 1), and 18On values are equivalent to the corresponding observed values of spring. When the simulation ends (i.e., n = 120), and 18On values are equivalent to the corresponding observed values of summer. denotes the reaction rate of nitrification ( = /120 μmol L–1 d–1), denotes the reaction rate of denitrification and nitrate diffusion together (μmol L–1 d–1, μmol L–1 d–1).
The result of the mixing model is shown in Figure 6. 18Ontr is 0.9‰ and in good agreement with our initial assumption. Combining this value with Eq. 4 and Eq. 5 suggests that nitrate in summer in the sCW consists of 35% preformed and 65% regenerated nitrate. Furthermore, the δ15N of regenerated nitrate (15Nr) is 3.3‰ that was calculated following Eq. 11. Different from the result of 18Ontr, the value of 3.3‰ for 15Nr reflects not only the δ15N of regenerated nitrate, but also the potential fractionation effects on N cycling.
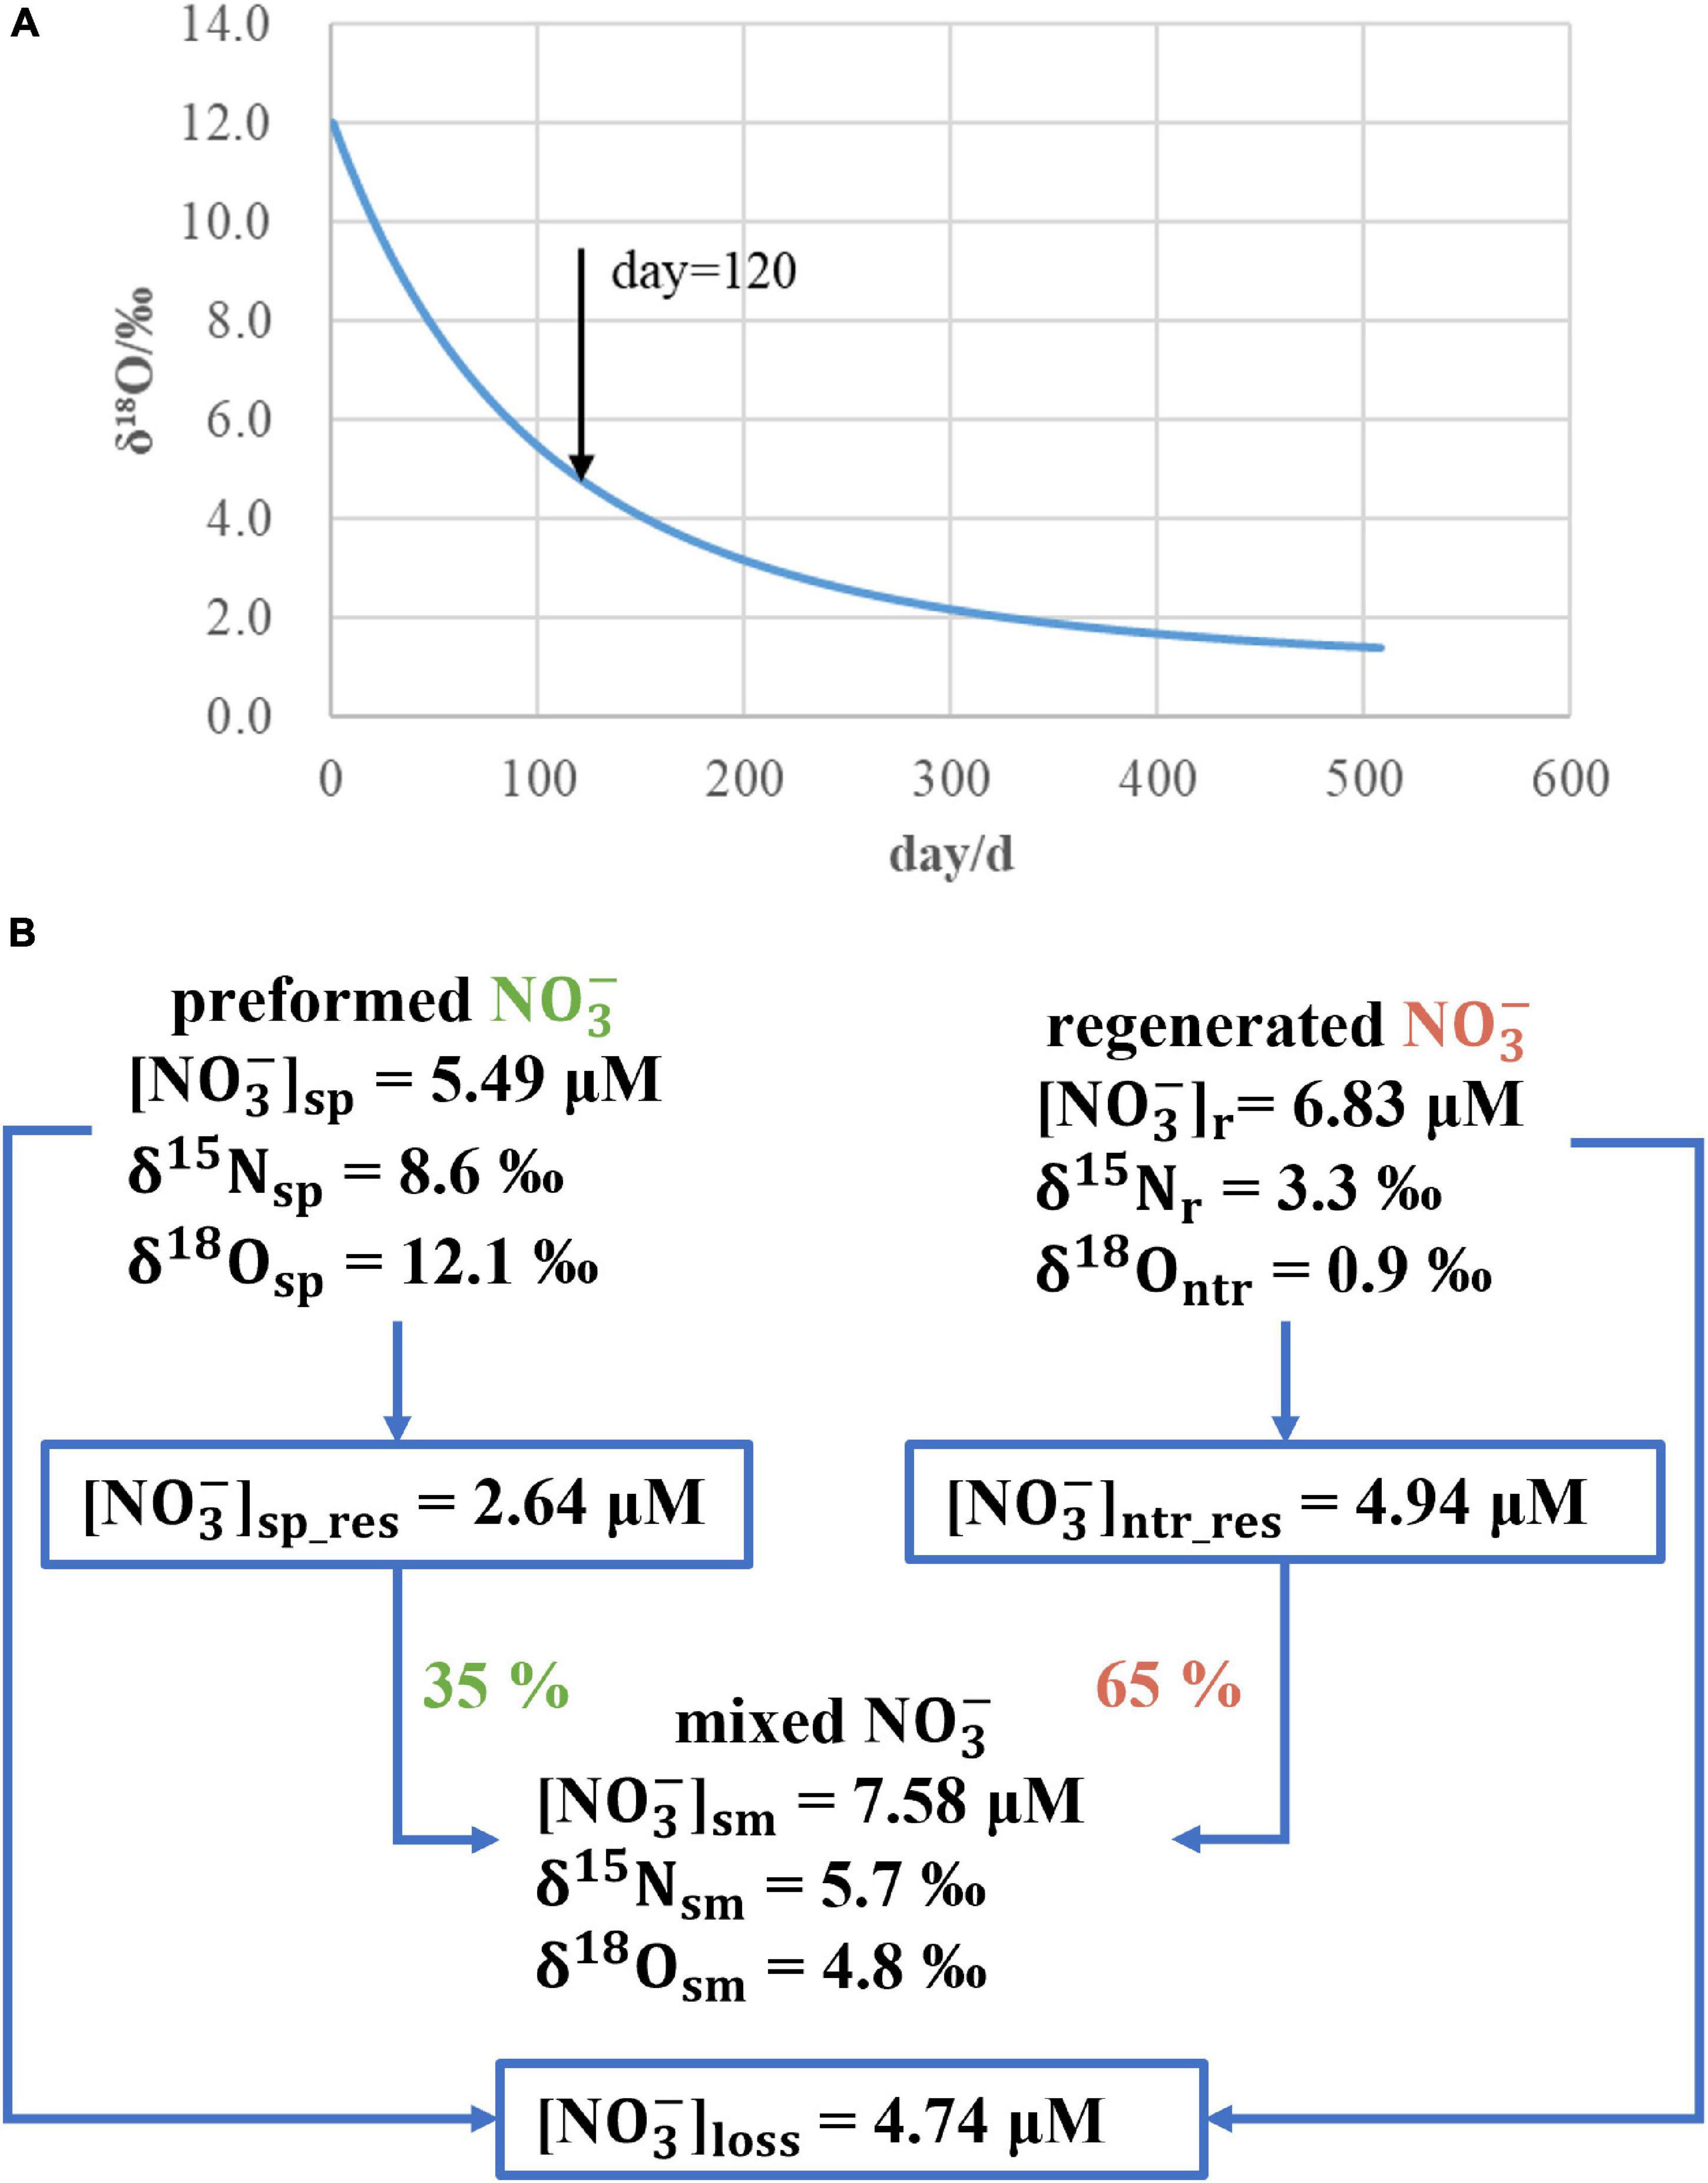
Figure 6. Simulation results of the mixing model for the sCW: δ18O- decreases along with simulation time when δ18Ontr is set to 0.9‰ (A). Schematic diagram of the mixing model, in which the sCW nitrate pool consists of 35% preformed and 65% regenerated nitrate in summer (B).
Overall, regenerated nitrate had a δ15Nr of 3.3‰ and an δ18Ontr of 0.9‰ and contributed 65% to the nitrate pool of sCW. Because nitrate is depleted in the upper layer in summer, 10.3 × 10⁶ mol nitrate of the sCW water column (Table 1) can be considered as the inventory of the sCW. This means that 3.6 × 10⁶ mol nitrate were performed in spring and 6.7 × 10⁶ mol nitrate was regenerated.
In the sCW, lower N % and higher AOU than those of nCW suggest that the decomposition of particulate nitrogen was stronger. The low levels of ammonium and accumulation of nitrate imply that nitrification converting ammonium to nitrate is a major process in the sCW. To our knowledge, there has not been research on nitrification in the YS water column. On the other hand the distribution of two ammonia-oxidizing microorganisms was positively correlated with δ15N-sed in sediment of the southern YS (Yu et al., 2016), which is consistent with the relatively high δ15N-sed of the nCW and sCW. We interpret this as evidence for a fundamental role of microbiological nitrification in the nCW and sCW.
We introduce the molar ratio of nitrate/DIN ([]/[DIN]) for simply representing the degree of nitrification. As nitrification proceeds, ammonium is converted to nitrate, resulting in increased []/[DIN] ratios approaching unity. The []/[DIN] in nCW and sCW was 0.35 ± 0.20 and 0.94 ± 0.24, respectively; it was significantly higher in the sCW (p < 0.05) indicating stronger nitrification. δ15N- in bottom layer of the whole sYS has a negative linear relationship with []/[DIN] (R2 = 0.80, Figure 7) and converged to 5.7‰ in sCW.
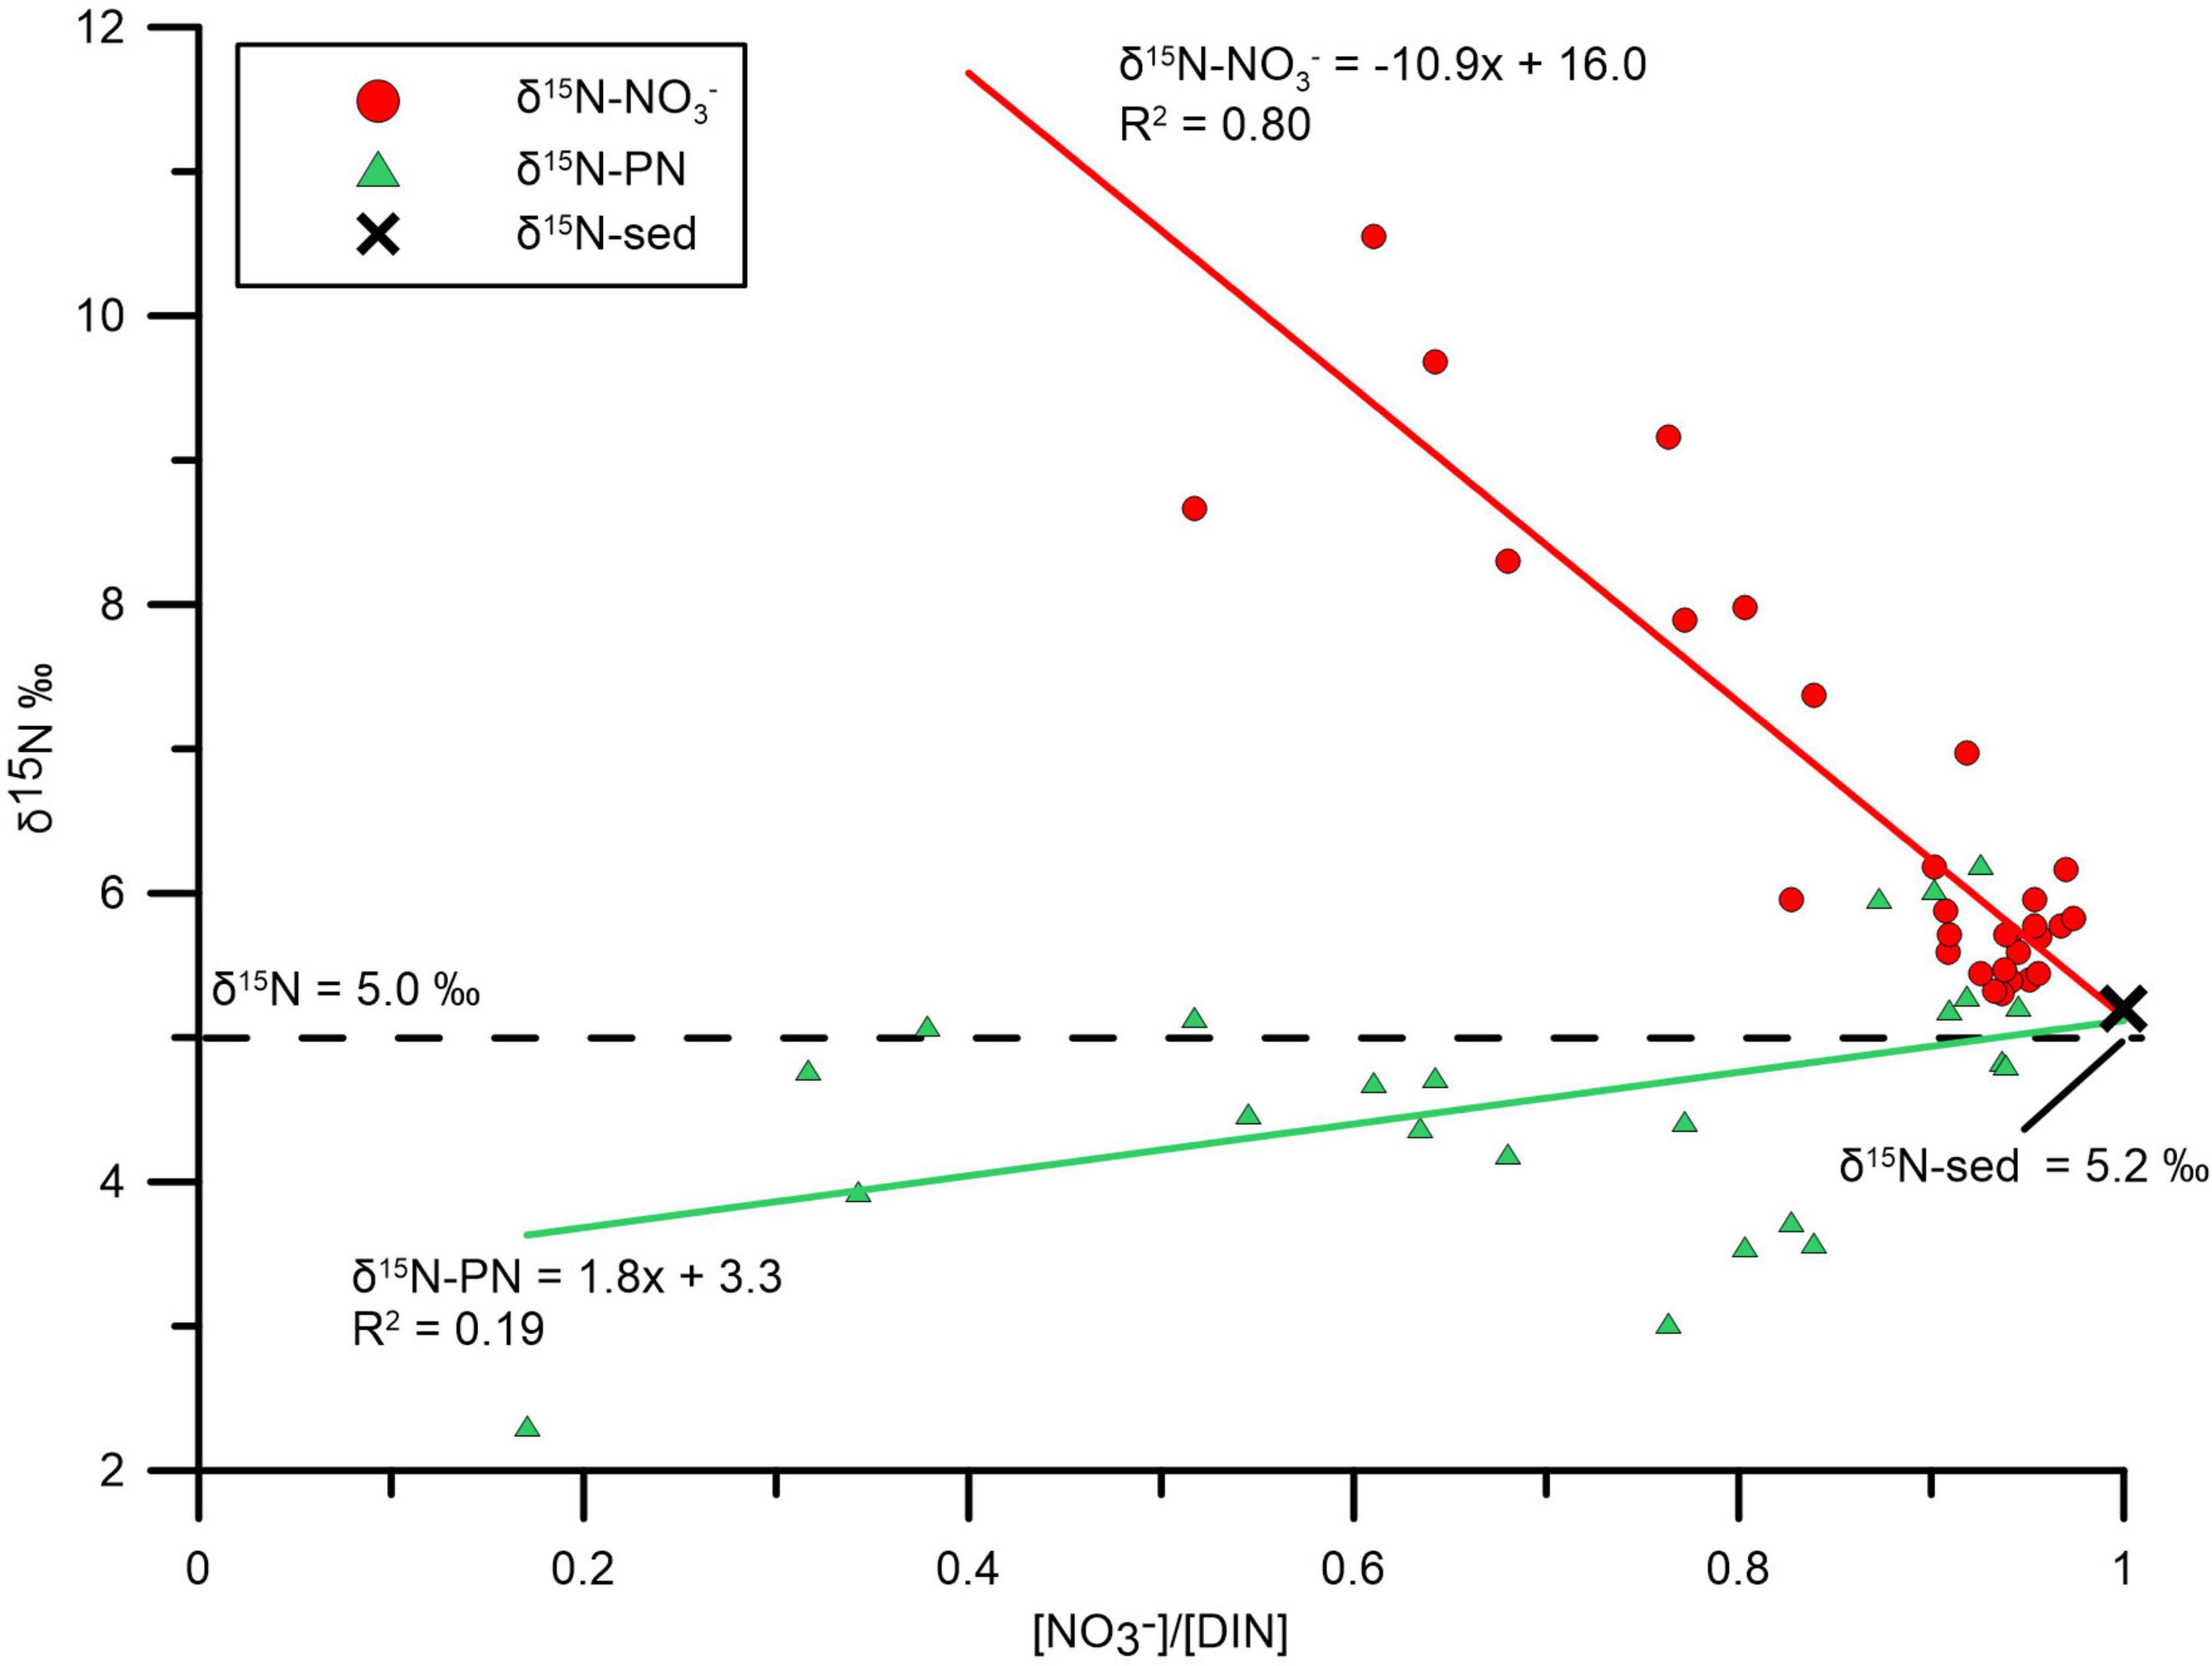
Figure 7. []/[DIN] vs. δ15N- and []/[DIN] vs. δ15N-PN sampled from sYS. With proceeding nitrification, the values of δ15N-, δ15N-PN and δ15N-sed are converging. δ15N-sedi marked by a black cross is the average value for sediment of the sCW.
According to our discussion above, remineralization of PN was the major original source of nitrate in the bottom waters. δ15N-PN versus []/[DIN] of sYS bottom layer presented a weak positive linear relationship (R2 = 0.19, Figure 7). The likely reason for the weak correlation is that the relationship between δ15N-PN and []/[DIN] is indirect and combines PN ammonification and ammonium nitrification. In consequence it is only reliable when []/[DIN] is close to 1 due to decreasing importance of intermediate products (ammonium and nitrite). Setting []/[DIN] = 1 results in similar values of δ15N-PN = 5.1‰ and δ15N- = 5.0‰, indicating that nitrification forces δ15N-PN and δ15N- to become similar. This finding in the sYS bottom water is in agreement with results in the ocean interior, where nitrate regeneration by nitrification dictates δ15N- to be similar to δ15N-PN (Sigman et al., 2009; Buchwald et al., 2012; Casciotti, 2016). The same is evident in the values of δ15N- in the sYs of 5.0‰ in autumn before winter mixing (Wu et al., 2019). Besides, sediment nitrogen isotope under the sCW was also close to isotope values of particles and nitrate (δ15N-sed = 5.2‰), these similar delta-values imply that the fractionation of δ15N of PN, nitrate and sediment nitrogen was almost in equilibrium. Further data like phytoplankton abundance, Chl a and dissolved organic nitrogen will be helpful for constructing the internal nitrogen cycling in the area.
Atmospheric deposition is probably responsible for much of the increase of nitrate concentrations in the YS and in the northwest Pacific Ocean in recent decades (Kim et al., 2011; Moon et al., 2021). This input contributed more than 2 times the nitrate flux of rivers to the YS (Liu S. M. et al., 2017). Sporadic events like dust storms accompanied by precipitation have been observed to stimulate phytoplankton blooms in the YS (Shi et al., 2012). It has been estimated that atmospheric nitrogen approximately supported 17–37% of the annual new production in the YS (Chung et al., 1998). The flux of atmospheric deposition of nitrate was around 23.4 × 10⁹ mol year–1 which contributed 47% of external sources (atmospheric depositions and riverine influx) (Han et al., 2013). Other estimates quantify the share of nitrate atmospheric deposition among external inputs (atmospheric deposition, river input, and water exchange) to 71% (appr. 25.4 × 10⁹ mol year–1) (Zhang et al., 2007; Liu S. M. et al., 2017), which was more than 2 times the nitrate flux of rivers to the YS (Liu S. M. et al., 2017).
The ratios of N:P of atmospheric deposition in the YS was 119 to 832 (Zhang et al., 2007), which is much higher than that in the sea water. Besides, during the last two decades, atmospheric deposition accounted for 71% of the increase of N excess in the YS (Zheng and Zhai, 2021). However, the atmospheric deposition would not reach the CWs before they are assimilated in the euphotic layer.
There are no directly measured data of nitrate isotopes in atmospheric deposition in the YS. δ15N-of precipitation in northern China and the Japan Sea ranged from −2.5 to +0.9‰ (Zhang Y. et al., 2008; Chang et al., 2019; Kim et al., 2019; Li et al., 2019), whereas δ15N- values of PM2.5 (fine particulate matter suspended in the air) ranged from 3.5 to 17.8‰ in northern China (Zong et al., 2017; Fan et al., 2019; Zhang et al., 2019; Song et al., 2020). The ratio of wet to dry nitrogen deposition is close to 1:1 in China on land (Yu et al., 2019) and 1.9:1 in the eastern YS (Kim et al., 2010). Taking the δ15N value of 8.2‰ reported from in Bohai Strait for dry deposition (Zong et al., 2017), and the δ15N value of 2.35‰ for precipitation (Chang et al., 2019) results in an estimate for the δ15N- of nitrate deposited from the atmosphere of 1.3–2.9‰. These values are slightly lower but similar to the 3.3‰ of δ15Nr, implying that atmospheric deposition is an important external nitrate source to the sCW from the perspective of nitrate isotopes. Likewise, if we take the δ18O- of 65.0 ± 5.8‰ for dry deposition (Zong et al., 2017) and 57.80 ± 4.23‰ for precipitation (Chang et al., 2019) then the δ18O- for total deposition is 60.3–61.4‰. δ18O of newly nitrified nitrate, however, only bears the signal of ambient water and dissolved oxygen, so that the high δ18O is not suitable for tracing the atmospheric deposition to δ18O- in the bottom water. Nevertheless, the high δ18O of atmospheric deposition may enhance the δ18O in the upper layer and may subsequently change the δ18O in the whole water column if vertical mixing is more intense, like in spring.
Most of the studies considered the difference of the atmospheric deposition between the nYS and sYS as not significant (Zhang et al., 2007, 2010; Shi et al., 2012; Han et al., 2013; Qi et al., 2013). We surmise that atmospheric deposition is an important external nitrate source to the YS, but less likely to be the reason for the higher nitrate concentration in the sCW.
In spring, nitrate concentrations in the sCW were higher than those in the nCW. The reason is the strong impact of the YSWC, the sub-branch of Kuroshio Current, on the sCW area, reflected in higher concentrations in the south and low nutrient concentrations near 36° N before reaching the nYS in spring (Figure 2). The δ15N- in the water column correspondingly increased northward due to the fractionation effect during nitrate assimilation when YSWC flows northward (Umezawa et al., 2013; Liu S. M. et al., 2017). Specifically, δ15N- of Kuroshio Current to the east of Taiwan, the upstream of the Kuroshio Current, was in the range of 4.9–6.7‰ (Wang et al., 2016), while δ15N- and δ18O- of the Kuroshio Subsurface water downstream (200 m < depth < 300 m) was 5.5–6.0‰ and 3.5–4.0‰, respectively (Umezawa et al., 2013). Before reaching sYS, the Kuroshio invasion water (200 m < depth < 400 m) has δ15N- and δ18O- of 5.5 ± 2.0‰ and 3.4 ± 0.5‰, respectively (Liu et al., 2020). These data indicate that the δ15N- of the Kuroshio Current before mixing with the continental water mass in the YS is almost stable in the range from 5 to 6‰. δ15N- of sCW and nCW had higher values of 8.6 ± 2.2 and 9.6 ± 1.5‰, respectively.
In summer 2018, Changjiang River discharged 8.0 × 10¹¹ m3 of fresh water into the YS and ECS (MWR, 2019) and approximately 14–28% of the waters from Changjiang enter the southern YS during summer by the northward transported CDW which dominated surface circulation (Liu S. et al., 2003; Fan and Song, 2014). Historical nitrate concentration in the Changjiang Estuary was 20.5 μmol L–1 in the 1960s (Zhou et al., 2008), but reached 66.1–84.1 μmol L–1 in recent decades (Liu X. et al., 2009; Li et al., 2010; Yu et al., 2015; Wang et al., 2016; Zhong et al., 2020). During the longer period of 1900–2010, the Changjiang River N input to the YS and ECS increased from 337 to 5,896 Gg N year–1 (i.e., 0.3 and 5.9 Tg N year–1) according to a recent model simulation (Liu et al., 2018). The area of highest nutrient concentrations emerged in the south or southwestern part of the southern YS during the 1980s–2012 (Li et al., 2017b). The supply of CDW is suggested to lead to major oxygen consumption and even hypoxia, inducing up to 70% of the total DO consumption of the Changjiang River estuary (Zhou et al., 2021). Besides, it also partially accounts for the magnitude of macroalgal blooms in the southern YS in recent years (Li et al., 2017b). DIN/P ratios of CDW in the range of 48.3–106.4 (in the salinity range from 24.8 to 28.4) during our survey were much higher than those of sCW. Formation of the thermocline prevents CDW from being a direct nutrient source to the bottom water. In the northeastward CDW frontal area, nitrate concentration increased with water depth, whereas nitrate isotope values and N % of particles decreased. This indicated a CDW-sourced nitrate supply to the sCW by the production and subsequent decomposition of sinking particles and nitrate regeneration.
δ15N- in the Changjiang and its estuary have δ15N values in range of 2.0–6.6‰ (Liu X. et al., 2009; Chen et al., 2013; Yu et al., 2015; Wang et al., 2016; Liu et al., 2020; Zhong et al., 2020). Taking 5.8 ± 2.0‰ as the end member of the Changjiang River (Liu et al., 2020) the calculated value above from the mixing model of regenerated nitrate of δ15Nr3.3‰ is lower. Two possible reasons should account for this difference: (1) during decomposition of PN CDW there is a fractionation effect, and (2) there are other external sources with lower δ15N- values.
In the nCW the river influence on the N-pool was low. Yalu River has an annual average water discharge of 3.20 × 10⁸ m3 (Li et al., 2017a) which is about 89% of river input from the Liaodong Peninsula (Chen et al., 2012). It was restricted to the coastal area northwest of the nYS (Duan et al., 2016; Yang et al., 2018). Although 70–80% of this input occurs during the flood season (July and August) (Li et al., 2017a), resulting in a negative correlation between DIN and salinity in coastal area of nYS (Duan et al., 2016), there was no low salinity water during our survey, so that the influence of rivers to central nYS must have been quite limited. The difference of river impact on nYS and sYS in summer is the reason for higher nitrate concentration in sCW.
In addition, the organic carbon content, nitrogen content and δ15N of sediments in central areas of both the nYS and sYS are very similar (Table 1), sediments in both nYS and sYS are mostly clayey silt (Qiao et al., 2017). This implies that reflux from sediment probably did not account for the different nitrate concentration in nCW and sCW, specifically as 90% of organic particles are decomposed in the water column.
Overall, the higher nitrate concentration in the sCW compared to the nCW is due to the stronger inflow of nitrate via YSWC to the sYS in spring, and more river input via the Changjiang River in summer (Figure 8). Atmospheric deposition is an important source of the YS, but it is not the reason for higher nitrate concentrations in the sCW. The δ15N value of newly regenerated nitrate to the sCW of 3.3‰ combines the isotope fingerprints of nitrate from Changjiang River and atmospheric deposition.
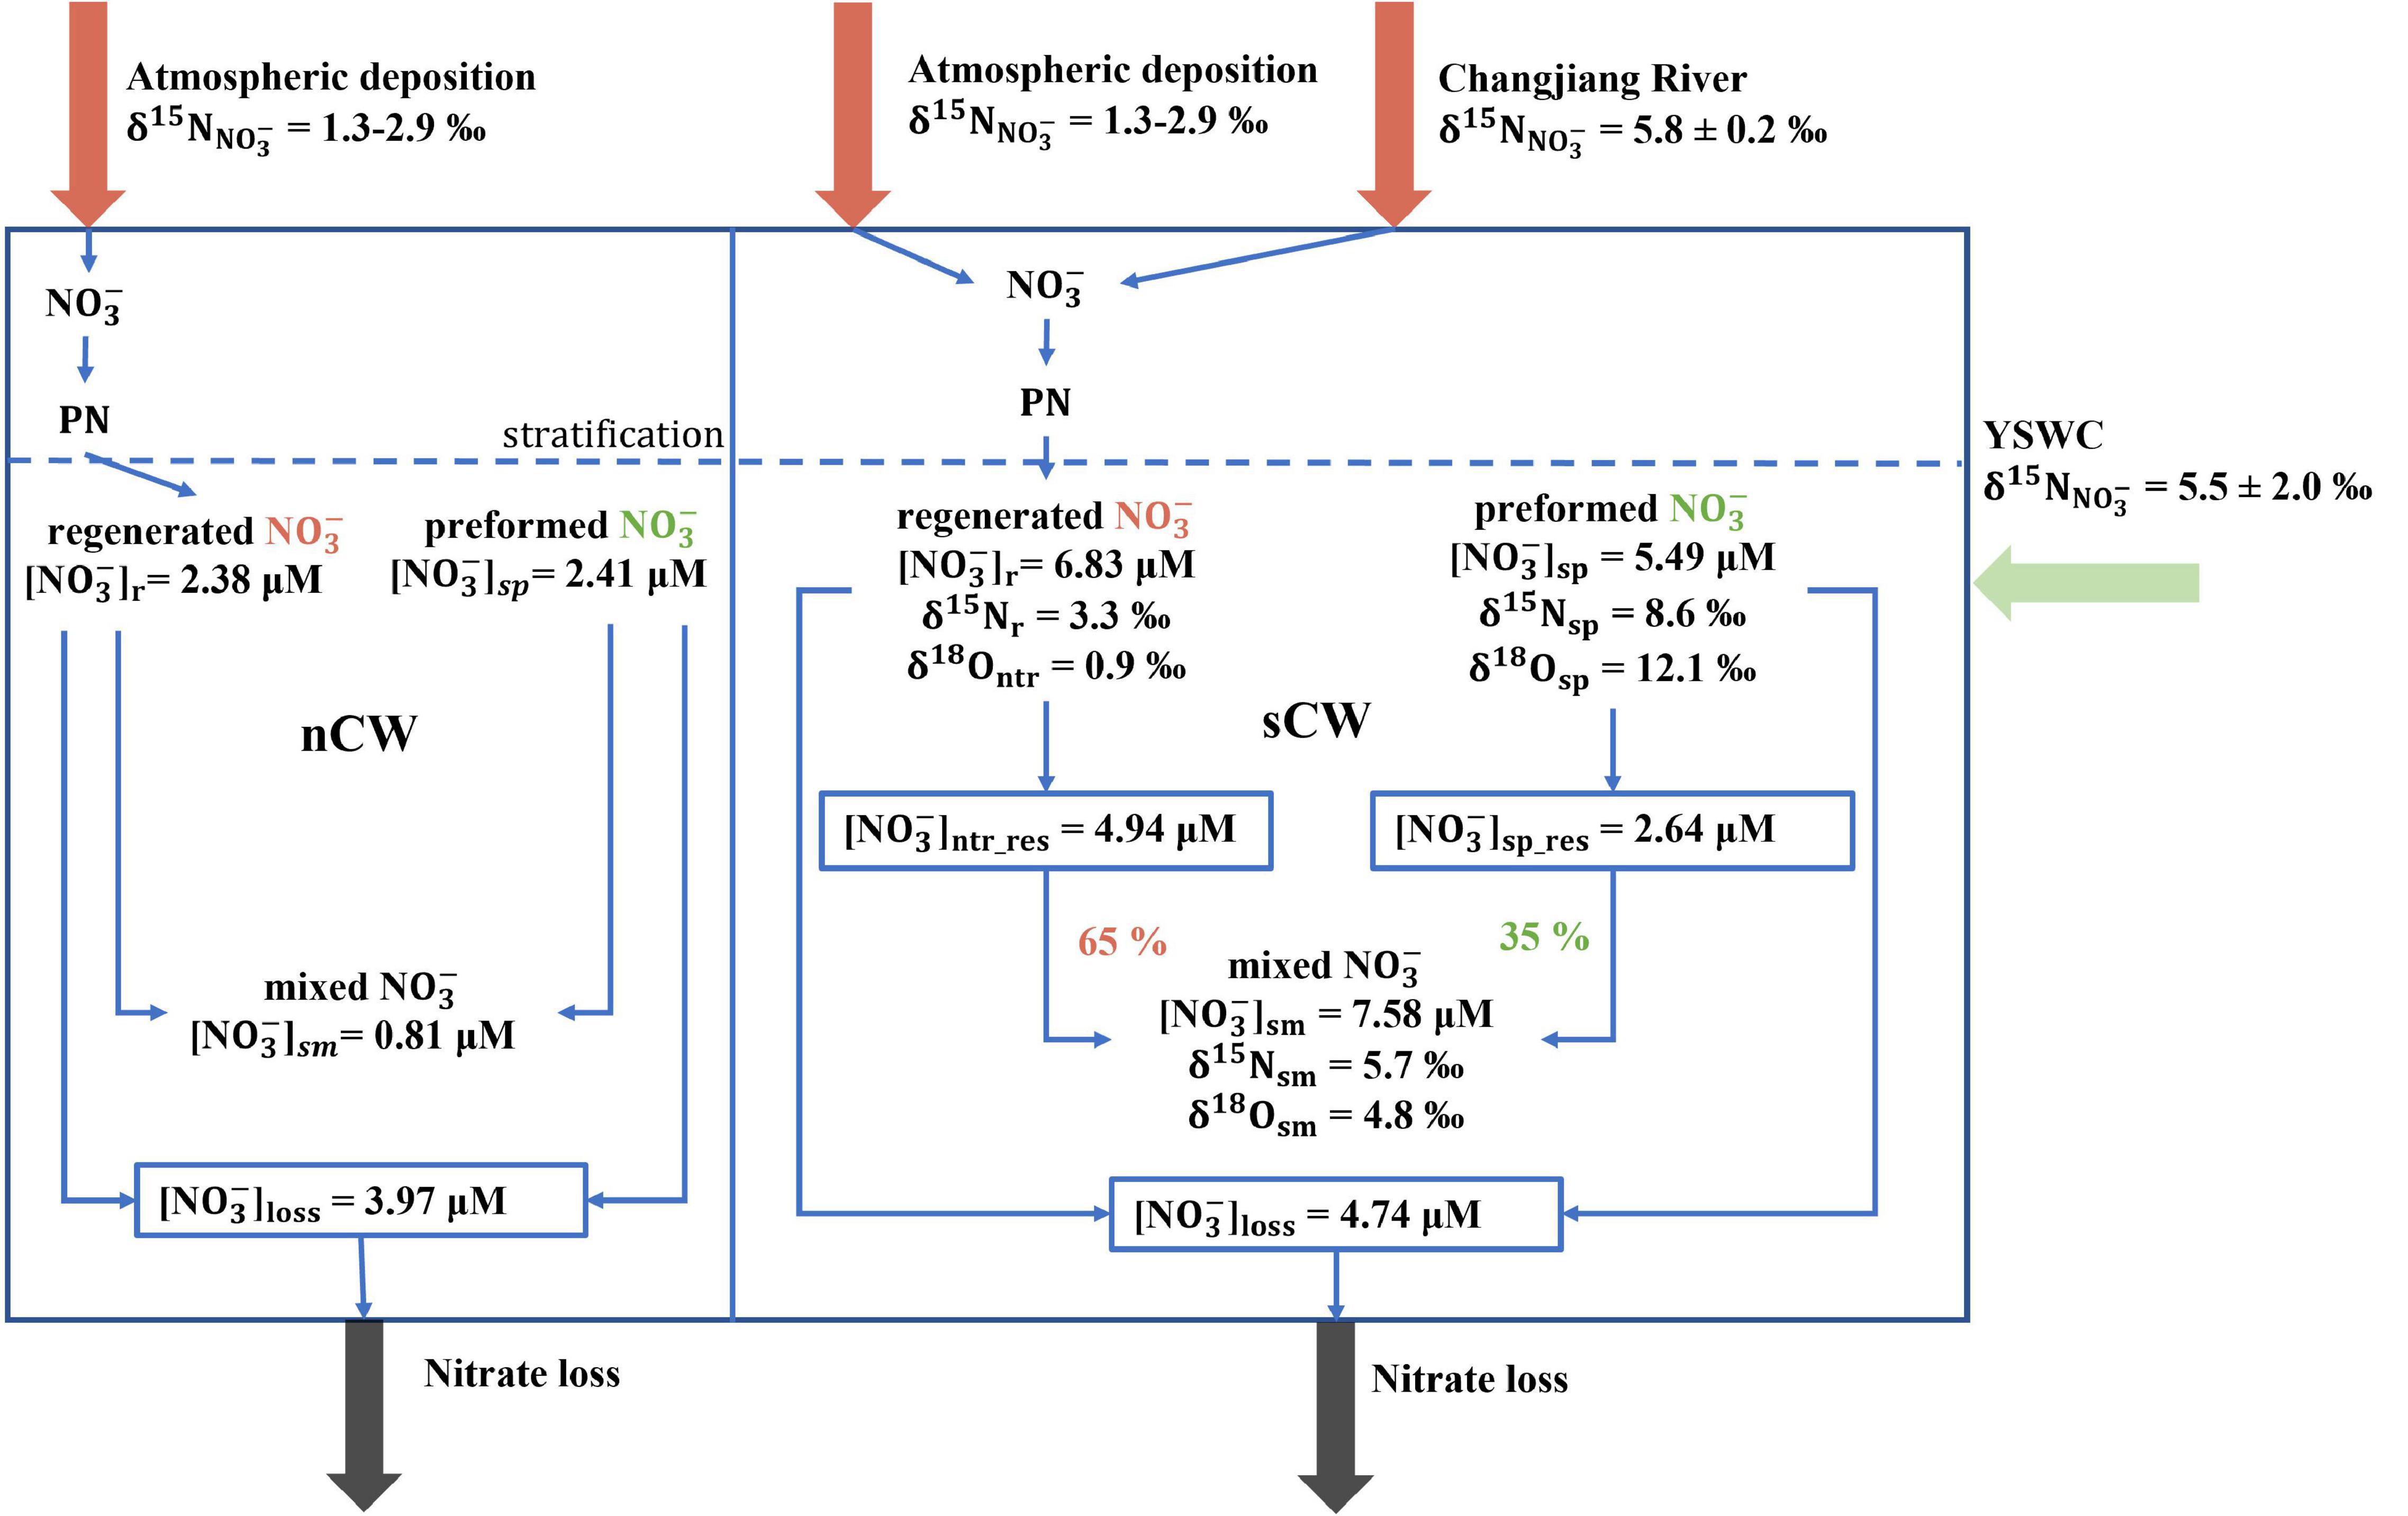
Figure 8. Different nitrate budgets in the nCW and sCW. In both water masses, nitrate consists of the preformed nitrate and regenerated nitrate. The sCW is impacted by the inflow of Yellow Sea Warm Current (YSWC) in spring, the input from atmospheric deposition and inflow of the Changjiang River in summer, while nitrate is lost mainly to benthic denitrification. The nCW is impacted by the input of nitrate by atmospheric deposition only and nitrate loss mainly to benthic denitrification, the prevalence of which makes the area filled by nCW a net sink for nitrate in summer. Proportions for regenerated and preformed nitrate are estimated by the isotopic mixing only for the sCW because of a lack of isotope values in the nCW. [], δ15N and δ18O are labeled by different subscript, “sp,” “sm” denotes the corresponding average values observed in spring and summer, respectively, “r/ntr” and “loss” denotes regeneration and loss, respectively, “ntr_res” and “sp_res” denotes the residual portion of the preformed nitrate in spring and of the residual portion of regenerated nitrate in summer, respectively.
The ecosystem of the YS has responded to this excess nitrogen in the past decades. Red tides have been observed 36 times covering areas of up to 1,460 km2 in 2018 (MEE, 2019). A positive relationship was reported between the mean HAB frequency and DIN concentration in the coastal areas of China (Xiao et al., 2019). The most eutrophic seawaters are found in the large estuaries, including the Changjiang River (Wang Y. et al., 2021), and correspondingly, the HABs occurred most frequently in coastal water (Fu et al., 2012), especially in the Zhejiang and Guangdong coastal area where Changjiang River and Pearl River discharge into the sea (He et al., 2013; Xiao et al., 2019). Because the imbalance of nutrients induced by excess N, HAB occurrence in the coastal area of China may increase in the future (Wang J. et al., 2021). On the other side, reduced ammonium loads from rivers led to a decrease of HAB frequency on a decadal scale in the Laizhou Bay, Bohai Sea (Jiang et al., 2018).
Green tides in the YS have been reported since 2007 (Xia et al., 2009; Liu et al., 2013), covering areas of 18,237 km2 in the YS in 2018 (MEE, 2019). These green tides generally appeared in the Jiangsu coast and drift northwards (Song et al., 2018). Because the occurrence of green tides has a positive correlation with DIN concentration (Liu et al., 2013; Li et al., 2017b), the central YS is less affected than the coastal area so far. Although the impact of human perturbations on the YS was mainly concentrated in the coastal areas in the sYS, the nYS and the central part of sYS will face a higher risk of eutrophication if nitrogen input continuously increases.
Based on analyses of nutrient concentrations and nitrate isotope composition in water, particulate matter and sediments in spring and summer, we distinguish differences in nitrogen cycling in two prominent sub-thermocline water masses in the Yellow Sea. Although the hydrographic conditions were quite similar in the northern part (nCW) and southern part (sCW) of the YSCWM, nitrate concentrations of nCW were much lower than those in the sCW in both spring and summer. In spring, nitrate concentrations of nCW were lower than in sCW due to weakening northward transport of YSWC that is expressed as a nutrient gradient between the nYS and the sYS. In summer, the influx of nitrate with Changjiang Diluted Water (CDW), its assimilation into biomass and subsequent nitrification enhanced the nitrate in sCW, but the central area of nYS was hardly impacted by terrestrial influx. DIN pool decreased by 52 and 5% in nCW and sCW, respectively, sediment denitrification and vertical diffusion accounted for DIN loss in the central YS bottom water. However, substantial nitrification in sCW was revealed by dual nitrate isotopes, resulted in DIN in sCW increased in summer opposite to the nCW, A simple mixing model based on δ18O- suggested that nitrate of sCW in summer is the mixture of nitrate preformed in spring and regenerated nitrate in summer, co-occurring with DIN loss. Preformed and regenerated nitrate was estimated to amount to 35 and 65% of the total nitrate in the sCW, respectively. Sedimentary denitrification proceeded beneath both water masses gradually reduced the pool of DIN in nCW, whereas higher rates of nitrate regeneration than of denitrification increased the sub-thermocline nitrate pool in sCW. These diverging trends suggest that the sYS is more sensitive to deoxygenation than the nYS. Although the bottom water is still oxic in the south-central YS, the ecological risk of continued and rising excess nitrogen from Changjiang River should not be ignored.
The raw data supporting the conclusions of this article will be made available by the authors, without undue reservation.
BG and K-CE designed the study. ST collected the samples on board. JT and YL supported the sampling on cruises and field trips. ST, NL, and TS analyzed samples. TX and WZ supplied the dissolved oxygen data. ST, BG, K-CE, and KD interpreted the data. ST prepared the manuscript with input from all co-authors. All authors contributed to the article and approved the submitted version.
The study was part of the project FINGBOYEL (03F07686B) carried out within the MEGAPOL consortium and financed by the German Federal Ministry of Education and Research (BMBF).
The authors declare that the research was conducted in the absence of any commercial or financial relationships that could be construed as a potential conflict of interest.
All claims expressed in this article are solely those of the authors and do not necessarily represent those of their affiliated organizations, or those of the publisher, the editors and the reviewers. Any product that may be evaluated in this article, or claim that may be made by its manufacturer, is not guaranteed or endorsed by the publisher.
We thank the crew of the Chinese research vessel Dongfanghong 2 for their support of our work on board. We thank Markus Ankele and Frauke Langenberg for their support of the nutrient and stable isotope analyses. We also thank Chuancheng Fu from Yantai Institute of Coastal Zone Research for help on the using of ArcGIS.
The Supplementary Material for this article can be found online at: https://www.frontiersin.org/articles/10.3389/fmars.2022.834953/full#supplementary-material
Altabet, M. A. (2006). “Isotopic tracers of the marine nitrogen cycle: present and past,” in Marine Organic Matter: Biomarkers, Isotopes and DNA, ed. J. Volkman (Berlin: Springer), 251–293. doi: 10.1007/698_2_008
Anderson, L. A. (1995). On the hydrogen and oxygen content of marine phytoplankton. Deep Sea Res. Part I Oceanogr. Res. Pap. 42, 1675–1680. doi: 10.1016/0967-0637(95)00072-E
Benson, B. B., and Krause, D. Jr. (1984). The concentration and isotopic fractionation of oxygen dissolved in freshwater and seawater in equilibrium with the atmosphere 1. Limnol. Oceanogr. 29, 620–632. doi: 10.4319/lo.1984.29.3.0620
Bohlen, L., Dale, A. W., and Wallmann, K. (2012). Simple transfer functions for calculating benthic fixed nitrogen losses and C:N:P regeneration ratios in global biogeochemical models. Glob. Biogeochem. Cycles 26:GB3029. doi: 10.1029/2011GB004198
Brandes, J. A., and Devol, A. H. (1997). Isotopic fractionation of oxygen and nitrogen in coastal marine sediments. Geochim. Cosmochim. Acta 61, 1793–1801. doi: 10.1016/s0016-7037(97)00041-0
Brandes, J. A., and Devol, A. H. (2002). A global marine-fixed nitrogen isotopic budget: implications for Holocene nitrogen cycling. Glob. Biogeochem. Cycles 16, 67-1–67-14.
Buchwald, C., Santoro, A. E., McIlvin, M. R., and Casciotti, K. L. (2012). Oxygen isotopic composition of nitrate and nitrite produced by nitrifying cocultures and natural marine assemblages. Limnol. Oceanogr. 57, 1361–1375. doi: 10.4319/lo.2012.57.5.1361
Cai, Y., Zhang, X., Li, G., Dong, J., Yang, A., Wang, G., et al. (2019). Spatiotemporal distributions and environmental drivers of diversity and community structure of nosZ-type denitrifiers and anammox bacteria in sediments of the Bohai Sea and North Yellow Sea, China. J. Oceanol. Limnol. 37, 1211–1228. doi: 10.1007/s00343-019-8200-3
Casciotti, K. L. (2016). Nitrogen and oxygen isotopic studies of the marine nitrogen cycle. Ann. Rev. Mar. Sci. 8, 379–407. doi: 10.1146/annurev-marine-010213-135052
Casciotti, K. L., Sigman, D. M., Hastings, M. G., Böhlke, J., and Hilkert, A. (2002). Measurement of the oxygen isotopic composition of nitrate in seawater and freshwater using the denitrifier method. Anal. Chem. 74, 4905–4912. doi: 10.1021/ac020113w
Chang, Y., Zhang, Y. L., Li, J., Tian, C., Song, L., Zhai, X., et al. (2019). Isotopic constraints on the atmospheric sources and formation of nitrogenous species in clouds influenced by biomass burning. Atmos. Chem. Phys. 19, 12221–12234. doi: 10.5194/acp-19-12221-2019
Chen, F., Chen, J., Jia, G., Jin, H., Xu, J., Yang, Z., et al. (2013). Nitrate δ 15 N and δ 18 O evidence for active biological transformation in the Changjiang Estuary and the adjacent East China Sea. Acta Oceanol. Sin. 32, 11–17. doi: 10.1007/s13131-013-0294-4
Chen, P., Lu, Z., Shi, X. Y., and Zhang, C. S. (2012). Estimated Nutrients Contribution of the North Yellow Sea Cold Water(Yc) Mass in Summer. Qingdao: Periodical of Ocean University of China.
Chen, X., Yu, J., Wang, X., Zhao, G., and Wang, C. (2011). Seasonal variation of denitrifying bacteria and denitrification rate in the sediment of the northern Yellow Sea (in Chinese). Mar. Sci. 35, 48–51.
Chung, C. S., Hong, G. H., Kim, S. H., Lim, J. H., and Yang, D. B. (1998). Shore based observation on wet deposition of inorganic nutrients in the Korean Yellow Sea coast. Yellow Sea 4, 30–39.
Deutsch, C., and Weber, T. (2012). Nutrient ratios as a tracer and driver of ocean biogeochemistry. Annu. Rev. Mar. Sci. 4, 113–141. doi: 10.1146/annurev-marine-120709-142821
Devol, A. H. (2015). Denitrification, anammox, and n2 production in marine sediments. Annu. Rev. Mar. Sci. 7, 403–423. doi: 10.1146/annurev-marine-010213-135040
DiFiore, P. J., Sigman, D. M., and Dunbar, R. B. (2009). Upper ocean nitrogen fluxes in the Polar Antarctic Zone: constraints from the nitrogen and oxygen isotopes of nitrate. Geochem. Geophys. Geosyst. 10:Q11016. doi: 10.1029/2009GC002468
Duan, L.-Q., Song, J.-M., Yuan, H.-M., Li, X.-G., and Li, N. (2016). Distribution, partitioning and sources of dissolved and particulate nitrogen and phosphorus in the north Yellow Sea. Estuar. Coast. Shelf Sci. 181, 182–195. doi: 10.1016/j.ecss.2016.08.044
Fan, M.-Y., Zhang, Y.-L., Lin, Y.-C., Chang, Y.-H., Cao, F., Zhang, W.-Q., et al. (2019). Isotope-based source apportionment of nitrogen-containing aerosols: a case study in an industrial city in China. Atmos. Environ. 212, 96–105. doi: 10.1016/j.atmosenv.2019.05.020
Fan, W., and Song, J. (2014). A numerical study of the seasonal variations of nutrients in the Changjiang River estuary and its adjacent sea area. Ecol. Modell. 291, 69–81. doi: 10.1016/j.marpolbul.2019.04.027
Fu, M., Wang, Z., Pu, X., Xu, Z., and Zhu, M. (2012). Changes of nutrient concentrations and N: P: si ratios and their possible impacts on the Huanghai Sea ecosystem. Acta Oceanol. Sin. 31, 101–112. doi: 10.1007/s13131-012-0224-x
Galloway, J. N., Leach, A. M., Bleeker, A., and Erisman, J. W. (2013). A chronology of human understanding of the nitrogen cycle. Philos. Trans. R. Soc. B 368:20130120. doi: 10.1098/rstb.2013.0120
Gao, M., Liu, J., Qiao, Y., Zhao, M., and Zhang, X.-H. (2017). Diversity and abundance of the denitrifying microbiota in the sediment of Eastern China marginal seas and the impact of environmental factors. Microb. Ecol. 73, 602–615. doi: 10.1007/s00248-016-0906-6
Granger, J., and Sigman, D. M. (2009). Removal of nitrite with sulfamic acid for nitrate N and O isotope analysis with the denitrifier method. Rapid Commun. Mass Spectr. 23, 3753–3762. doi: 10.1002/rcm.4307
Grasshoff, K., Kremling, K., and Ehrhardt, M. (2009). Methods of Seawater Analysis. Hoboken, NJ: John Wiley & Sons.
Gruber, N., and Sarmiento, J. L. (1997). Global patterns of marine nitrogen fixation and denitrification. Glob. Biogeochem. Cycles 11, 235–266. doi: 10.1029/97GB00077
Gu, B., Ju, X., Chang, J., Ge, Y., and Vitousek, P. M. (2015). Integrated reactive nitrogen budgets and future trends in China. Proc. Nat. Acad. Sci. U.S.A. 112:8792. doi: 10.1073/pnas.1510211112
Guo, C., Zhang, G., Sun, J., Leng, X., Xu, W., Wu, C., et al. (2020). Seasonal responses of nutrient to hydrology and biology in the southern Yellow Sea. Cont. Shelf Res. 206:104207. doi: 10.1016/j.csr.2020.104207
Guo, J., Yuan, H., Song, J., Li, X., and Duan, L. (2020). Hypoxia, acidification and nutrient accumulation in the Yellow Sea Cold Water of the South Yellow Sea. Sci. Total Environ. 745:141050. doi: 10.1016/j.scitotenv.2020.141050
Han, L., Zhu, Y., Liu, S., Zhang, J., and Li, R. (2013). Nutrients of atmospheric wet deposition from the Qianliyan Island of the Yellow Sea. China Environ. Sci. 33, 1174–1184. doi: 10.1016/j.envpol.2021.118034
He, X., Bai, Y., Pan, D., Chen, C. T. A., Cheng, Q., Wang, D., et al. (2013). Satellite views of the seasonal and interannual variability of phytoplankton blooms in the eastern China seas over the past 14 yr (1998–2011). Biogeosciences 10, 4721–4739. doi: 10.5194/bg-10-4721-2013
Hill, A. R., and Cardaci, M. (2004). Denitrification and organic carbon availability in riparian wetland soils and subsurface sediments. Soil Sci. Soc. Am. J. 68, 320–325. doi: 10.2136/sssaj2004.3200a
Jahnke, R. A. (2010). “Global synthesis1,” in Carbon and Nutrient Fluxes in Continental Margins: A Global Synthesis, eds K.-K. Liu, L. Atkinson, R. Quiñones, and L. Talaue-McManus (Berlin: Springer), 597–615. doi: 10.1007/978-3-540-92735-8_16
Jiang, H., Liu, D., Song, X., Ma, Y., Wang, Y., Liu, A., et al. (2018). Response of phytoplankton assemblages to nitrogen reduction in the Laizhou Bay, China. Mar. Pollut. Bull. 136, 524–532. doi: 10.1016/j.marpolbul.2018.09.042
Jin, J., Liu, S. M., Ren, J. L., Liu, C. G., Zhang, J., Zhang, G. L., et al. (2013). Nutrient dynamics and coupling with phytoplankton species composition during the spring blooms in the Yellow Sea. Deep Sea Res. Part II Top. Stud. Oceanogr. 97, 16–32. doi: 10.1016/j.dsr2.2013.05.002
Kang, D.-J., Chung, C. S., Kim, S. H., Hong, G. H., and Kim, K.-R. (1994). Oxygen isotope characteristics of seawaters in the Yellow Sea. La Mer 32, 279–284.
Katsuyama, C., Kondo, N., Suwa, Y., Yamagishi, T., Itoh, M., Ohte, N., et al. (2008). Denitrification activity and relevant bacteria revealed by nitrite reductase gene fragments in soil of temperate mixed forest. Microbes Environ. 23, 337–345. doi: 10.1264/jsme2.me08541
Kim, H., Park, G.-H., Lee, S.-E., Kim, Y.-I., Lee, K., Kim, Y.-H., et al. (2019). Stable isotope ratio of atmospheric and seawater nitrate in the East Sea in the northwestern Pacific ocean. Mar. Pollut. Bull. 149:110610. doi: 10.1016/j.marpolbul.2019.110610
Kim, J., Ghim, Y., Lee, S., Moon, K.-C., Shim, S.-G., Bae, G., et al. (2010). Atmospheric deposition of nitrogen and sulfur in the Yellow Sea region: significance of long-range transport in East Asia. Water Air Soil Pollut. 205:259. doi: 10.1007/s11270-009-0072-2
Kim, T.-W., Lee, K., Najjar, R. G., Jeong, H.-D., and Jeong, H. J. (2011). Increasing N abundance in the northwestern Pacific Ocean due to atmospheric nitrogen deposition. Science 334, 505–509. doi: 10.1126/science.1206583
Kroopnick, P., and Craig, H. (1972). Atmospheric oxygen: isotopic composition and solubility fractionation. Science 175, 54–55. doi: 10.1126/science.175.4017.54
Lee, S.-H., and Beardsley, R. C. (1999). Influence of stratification on residual tidal currents in the Yellow Sea. J. Geophys. Res. Oceans 104, 15679–15701. doi: 10.1029/1999JC900108
Lehmann, M. F., Sigman, D. M., and Berelson, W. M. (2004). Coupling the 15N/14N and 18O/16O of nitrate as a constraint on benthic nitrogen cycling. Mar. Chem. 88, 1–20. doi: 10.1016/j.marchem.2004.02.001
Levin, L. A., Liu, K.-K., Emeis, K.-C., Breitburg, D. L., Cloern, J., Deutsch, C., et al. (2015). Comparative biogeochemistry–ecosystem–human interactions on dynamic continental margins. J. Mar. Syst. 141, 3–17. doi: 10.1016/j.jmarsys.2014.04.016
Li, H., Zhang, Y., Tang, H., Shi, X., Rivkin, R. B., and Legendre, L. (2017b). Spatiotemporal variations of inorganic nutrients along the Jiangsu coast, China, and the occurrence of macroalgal blooms (green tides) in the southern Yellow Sea. Harmful Algae 63, 164–172. doi: 10.1016/j.hal.2017.02.006
Li, H., Lin, L., Ye, S., Li, H., and Fan, J. (2017a). Assessment of nutrient and heavy metal contamination in the seawater and sediment of Yalujiang Estuary. Mar. Pollut. Bull. 117, 499–506. doi: 10.1016/j.marpolbul.2017.01.069
Li, H.-M., Zhang, C.-S., Han, X.-R., and Shi, X.-Y. (2015). Changes in concentrations of oxygen, dissolved nitrogen, phosphate, and silicate in the southern Yellow Sea, 1980–2012: sources and seaward gradients. Estuar. Coast. Shelf Sci. 163, 44–55. doi: 10.1016/j.ecss.2014.12.013
Li, M., Hong, Y., Cao, H., Klotz, M. G., and Gu, J. D. (2013). Diversity, abundance, and distribution of NO-forming nitrite reductase-encoding genes in deep-sea subsurface sediments of the South China Sea. Geobiology 11, 170–179. doi: 10.1111/gbi.12020
Li, S.-L., Liu, C.-Q., Li, J., Liu, X., Chetelat, B., Wang, B., et al. (2010). Assessment of the sources of nitrate in the Changjiang River, China using a nitrogen and oxygen isotopic approach. Environ. Sci. Technol. 44, 1573–1578. doi: 10.1021/es902670n
Li, Y. W., Hu, Y. Y., and Chen, S. M. (2013). Distribution and influence factors of nutrients in the North Yellow Sea in Summer and Autumn. Zhongguo Huanjing Kexue China Environ. Sci. 33, 1060–1067.
Li, Z., Walters, W. W., Hastings, M. G., Zhang, Y., Song, L., Liu, D., et al. (2019). Nitrate isotopic composition in precipitation at a chinese megacity: seasonal variations, atmospheric processes, and implications for sources. Earth Space Sci. 6, 2200–2213. doi: 10.1029/2019EA000759
Liu, D., Keesing, J. K., He, P., Wang, Z., Shi, Y., and Wang, Y. (2013). The world’s largest macroalgal bloom in the Yellow Sea, China: formation and implications. Estuar. Coast. Shelf Sci. 129, 2–10. doi: 10.1016/j.ecss.2013.05.021
Liu, J. A., Su, N., Wang, X., and Du, J. (2017). Submarine groundwater discharge and associated nutrient fluxes into the Southern Yellow Sea: a case study for semi-enclosed and oligotrophic seas-implication for green tide bloom. J. Geophys. Res. Oceans 122, 139–152. doi: 10.1002/2016JC012282
Liu, S., Hong, G.-H., Zhang, J., Ye, X., and Jiang, X. (2009). Nutrient budgets for large Chinese estuaries. Biogeosciences 6, 2245–2263. doi: 10.5194/bg-6-2245-2009
Liu, S., Zhang, J., Chen, S. Z., Chen, H., Hong, G., Wei, H., et al. (2003). Inventory of nutrient compounds in the Yellow Sea. Cont. Shelf Res. 23, 1161–1174. doi: 10.1111/j.1472-765X.2005.01635.x
Liu, S. M., Altabet, M. A., Zhao, L., Larkum, J., Song, G. D., Zhang, G. L., et al. (2017). tracing nitrogen biogeochemistry during the beginning of a spring phytoplankton bloom in the Yellow Sea using coupled nitrate nitrogen and oxygen isotope ratios. J. Geophys. Res. Biogeosciences 122, 2490–2508. doi: 10.1002/2016jg003752
Liu, S. M., Ning, X., Dong, S., Song, G., Wang, L., Altabet, M. A., et al. (2020). Source Versus recycling influences on the isotopic composition of nitrate and nitrite in the East China Sea. J. Geophys. Res. Oceans 125:e2020JC016061. doi: 10.1029/2020JC016061
Liu, X., Beusen, A. H., Van Beek, L. P., Mogollón, J. M., Ran, X., and Bouwman, A. F. (2018). Exploring spatiotemporal changes of the Yangtze River (Changjiang) nitrogen and phosphorus sources, retention and export to the East China Sea and Yellow Sea. Water Res. 142, 246–255. doi: 10.1016/j.watres.2018.06.006
Liu, X., Chiang, K.-P., Liu, S.-M., Wei, H., Zhao, Y., and Huang, B.-Q. (2015). Influence of the Yellow Sea Warm Current on phytoplankton community in the central Yellow Sea. Deep Sea Res. Part I Oceanogr. Res. Pap. 106, 17–29. doi: 10.1016/j.dsr.2015.09.008
Liu, X., Yu, Z., Song, X., and Cao, X. (2009). The nitrogen isotopic composition of dissolved nitrate in the Yangtze River (Changjiang) estuary, China. Estuar. Coast. Shelf Sci. 85, 641–650. doi: 10.1016/j.ecss.2009.09.017
Mayer, B., Bollwerk, S. M., Mansfeldt, T., Hütter, B., and Veizer, J. (2001). The oxygen isotope composition of nitrate generated by nitrification in acid forest floors. Geochim. Cosmochim. Acta 65, 2743–2756. doi: 10.1016/s0016-7037(01)00612-3
Moon, J.-Y., Lee, K., Lim, W.-A., Lee, E., Dai, M., Choi, Y.-H., et al. (2021). Anthropogenic nitrogen is changing the East China and Yellow seas from being N deficient to being P deficient. Limnol. Oceanogr. 66, 914–924. doi: 10.1002/lno.11651
Qi, J., Yu, Y., Yao, X., Gang, Y., and Gao, H. (2020). Dry deposition fluxes of inorganic nitrogen and phosphorus in atmospheric aerosols over the Marginal Seas and Northwest Pacific. Atmos. Res. 245:105076. doi: 10.1016/j.atmosres.2020.105076
Qi, J. H., Shi, J. H., Gao, H. W., and Sun, Z. (2013). Atmospheric dry and wet deposition of nitrogen species and its implication for primary productivity in coastal region of the Yellow Sea, China. Atmos. Environ. 81, 600–608. doi: 10.1016/j.atmosenv.2013.08.022
Qiao, S., Shi, X., Wang, G., Zhou, L., Hu, B., Hu, L., et al. (2017). Sediment accumulation and budget in the Bohai Sea, Yellow Sea and East China Sea. Mar. Geol. 390, 270–281. doi: 10.1016/j.margeo.2017.06.004
Rafter, P. A., DiFiore, P. J., and Sigman, D. M. (2013). Coupled nitrate nitrogen and oxygen isotopes and organic matter remineralization in the Southern and Pacific Oceans. J. Geophys. Res. Oceans 118, 4781–4794. doi: 10.1002/jgrc.20316
Ren, C., Yuan, H., Song, J., Duan, L., Li, X., Li, N., et al. (2020). The use of amino sugars for assessing seasonal dynamics of particulate organic matter in the Yangtze River estuary. Mar. Chem. 220:103763. doi: 10.1016/j.marchem.2020.103763
Schmidt, G. A., Bigg, G. R., and Rohling, E. J. (1999). Global Seawater Oxygen-18 Database. 1.22. Washington, DC: NASA.
Shi, J. H., Gao, H. W., Zhang, J., Tan, S. C., Ren, J. L., Liu, C. G., et al. (2012). Examination of causative link between a spring bloom and dry/wet deposition of Asian dust in the Yellow Sea, China. J. Geophys. Res. Atmos. 117:2012.
Sigman, D. M., and Boyle, E. A. (2000). Glacial/interglacial variations in atmospheric carbon dioxide. Nature 407, 859–869. doi: 10.1038/35038000
Sigman, D. M., Casciotti, K. L., Andreani, M., Barford, C., Galanter, M., and Böhlke, J. (2001). A bacterial method for the nitrogen isotopic analysis of nitrate in seawater and freshwater. Anal. Chem. 73, 4145–4153. doi: 10.1021/ac010088e
Sigman, D. M., DiFiore, P. J., Hain, M. P., Deutsch, C., Wang, Y., Karl, D. M., et al. (2009). The dual isotopes of deep nitrate as a constraint on the cycle and budget of oceanic fixed nitrogen. Deep Sea Res. Part I Oceanogr. Res. Pap. 56, 1419–1439. doi: 10.1016/j.dsr.2009.04.007
Sigman, D. M., and Fripiat, F. (2019). “Nitrogen Isotopes in the Ocean,” in Encyclopedia of Ocean Sciences, 3rd Edn, eds J. K. Cochran, H. J. Bokuniewicz, and P. L. Yager (Oxford: Academic Press), 263–278. doi: 10.1016/b978-0-12-409548-9.11605-7
Smith, S. V., Swaney, D. P., Talaue-Mcmanus, L., Bartley, J. D., Sandhei, P. T., McLAUGHLIN, C. J., et al. (2003). Humans, hydrology, and the distribution of inorganic nutrient loading to the ocean. BioScience 53, 235–245. doi: 10.1641/0006-3568(2003)053[0235:hhatdo]2.0.co;2
Song, D. B., Gao, Z. Q., Fu-Xiang, X. U., Jin-Quan, A. I., Ning, J. C., Shang, W. T., et al. (2018). Spatial and temporal variability of the green tide in the south yellow sea in 2017 deciphered from the goci image. Oceanol. Limnol. Sin. 49, 1068–1074.
Song, G., Liu, S., Zhu, Z., Zhai, W., Zhu, C., and Zhang, J. (2016). Sediment oxygen consumption and benthic organic carbon mineralization on the continental shelves of the East China Sea and the Yellow Sea. Deep Sea Res. Part II Top. Stud. Oceanogr. 124, 53–63. doi: 10.1016/j.dsr2.2015.04.012
Song, W., Liu, X.-Y., Wang, Y.-L., Tong, Y.-D., Bai, Z.-P., and Liu, C.-Q. (2020). Nitrogen isotope differences between atmospheric nitrate and corresponding nitrogen oxides: a new constraint using oxygen isotopes. Sci. Total Environ. 701:134515. doi: 10.1016/j.scitotenv.2019.134515
Su, N., Du, J., Liu, S., and Zhang, J. (2013). Nutrient fluxes via radium isotopes from the coast to offshore and from the seafloor to upper waters after the 2009 spring bloom in the Yellow Sea. Deep Sea Res. Part II Top. Stud. Oceanogr. 97, 33–42. doi: 10.1016/j.dsr2.2013.05.003
Sun, J., Feng, Y., Wang, D., Song, S., Jiang, Y., Ding, C., et al. (2013). Bottom-up control of phytoplankton growth in spring blooms in Central Yellow Sea, China. Deep Sea Res. Part II Top. Stud. Oceanogr. 97, 61–71. doi: 10.1016/j.dsr2.2013.05.006
Sun, R., Li, T., and Chang, F. (2009). Distribution of benthic foraminifera and its bearing on marine environmental factors in the north Yellow Sea serface sediments. Mar. Geol. Q. Geol. (in Chineses) 29, 21–28. doi: 10.3724/sp.J.1140.2009.04021
Tian, S., Gaye, B., Tang, J., Luo, Y., Li, W., Lahajnar, N., et al. (2020). A reactive nitrogen budget of the Bohai Sea based on an isotope mass balance model. Biogeosciences. doi: 10.5194/bg-2020-471
Umezawa, Y., Yamaguchi, A., Ishizaka, J., Hasegawa, T., Yoshimizu, C., Tayasu, I., et al. (2013). Seasonal shifts in the contributions of the Changjiang River and the Kuroshio Current to nitrate dynamics at the continental shelf of the northern East China Sea based on a nitrate dual isotopic composition approach. Biogeosci. Discuss. 10, 10143–10188. doi: 10.5194/bg-11-1297-2014
Voss, M., Bange, H. W., Dippner, J. W., Middelburg, J. J., Montoya, J. P., and Ward, B. (2013). The marine nitrogen cycle: recent discoveries, uncertainties and the potential relevance of climate change. Philos. Trans. R. Soc. B Biol. Sci. 368:20130121. doi: 10.1098/rstb.2013.0121
Wang, B., Xin, M., Wei, Q., and Xie, L. (2018). A historical overview of coastal eutrophication in the China Seas. Mar. Pollut. Bull. 136, 394–400. doi: 10.1016/j.marpolbul.2018.09.044
Wang, J., Yu, Z., Wei, Q., Yang, F., Dong, M., Li, D., et al. (2020c). Intra-and inter-seasonal variations in the hydrological characteristics and nutrient conditions in the southwestern Yellow Sea during spring to summer. Mar. Pollut. Bull. 156:111139. doi: 10.1016/j.marpolbul.2020.111139
Wang, J., Beusen, A. H. W., Liu, X., Van Dingenen, R., Dentener, F., Yao, Q., et al. (2020b). Spatially explicit inventory of sources of nitrogen inputs to the Yellow Sea, East China Sea, and South China Sea for the period 1970–2010. Earths Future 8:e2020EF001516. doi: 10.1029/2020EF001516
Wang, J., Beusen, A. H. W., Liu, X., and Bouwman, A. F. (2020a). Aquaculture Production is a Large, Spatially Concentrated Source of Nutrients in Chinese Freshwater and Coastal Seas. Environ. Sci. Technol. 54, 1464–1474. doi: 10.1021/acs.est.9b03340
Wang, W., Yu, Z., Song, X., Wu, Z., Yuan, Y., Zhou, P., et al. (2016). The effect of Kuroshio Current on nitrate dynamics in the southern East China Sea revealed by nitrate isotopic composition. J. Geophys. Res. Oceans 121, 7073–7087. doi: 10.1002/2016JC011882
Wang, W., Yu, Z., Song, X., Wu, Z., Yuan, Y., Zhou, P., et al. (2017). Characteristics of the δ ^{15} N_{NO_3 } distribution and its drivers in the Changjiang River estuary and adjacent waters. Chin. J. Oceanol. Limnol. 35:367. doi: 10.1007/s00343-016-5276-x
Wang, Y., Liu, D., Xiao, W., Zhou, P., Tian, C., Zhang, C., et al. (2021). Coastal eutrophication in China: trend, sources, and ecological effects. Harmful Algae 107:102058. doi: 10.1016/j.hal.2021.102058
Wang, J., Bouwman, A. F., Liu, X., Beusen, A. H. W., Van Dingenen, R., Dentener, F., et al. (2021). Harmful algal blooms in chinese coastal waters will persist due to perturbed nutrient ratios. Environ. Sci. Technol. Lett. 8, 276–284. doi: 10.1021/acs.estlett.1c00012
Wankel, S. D., Kendall, C., Francis, C. A., and Paytan, A. (2006). Nitrogen sources and cycling in the San Francisco Bay Estuary: a nitrate dual isotopic composition approach. Limnol. Oceanogr. 51, 1654–1664. doi: 10.4319/lo.2006.51.4.1654
Wei, Q., Yao, Q., Wang, B., Wang, H., and Yu, Z. (2015). Long-term variation of nutrients in the southern Yellow Sea. Cont. Shelf Res. 111, 184–196. doi: 10.1016/j.csr.2015.08.003
Wei, Q.-S., Yu, Z.-G., Wang, B.-D., Fu, M.-Z., Xia, C.-S., Liu, L., et al. (2016). Coupling of the spatial–temporal distributions of nutrients and physical conditions in the southern Yellow Sea. J. Mar. Syst. 156, 30–45. doi: 10.1016/j.jmarsys.2015.12.001
Wong, G. T. (2012). Removal of nitrite interference in the Winkler determination of dissolved oxygen in seawater. Mar. Chem. 130, 28–32. doi: 10.1016/j.marchem.2011.11.003
Wu, Z., Yu, Z., Song, X., Wang, W., Zhou, P., Cao, X., et al. (2019). Key nitrogen biogeochemical processes in the South Yellow Sea revealed by dual stable isotopes of nitrate. Estuar. Coast. Shelf Sci. 225:106222. doi: 10.1016/j.ecss.2019.05.004
Xia, B., Ma, S. S., Cui, Y., Chen, B. J., and Jiang, Z. J. (2009). Distribution of temperature, salinity, dissolved oxygen, nutrients and their relationships with green tide in Enteromorpha prolifera outbreak area of the Yellow Sea. Prog. Fish. Sci. 30, 94–101.
Xiao, X., Agustí, S., Pan, Y., Yu, Y., Li, K., Wu, J., et al. (2019). Warming amplifies the frequency of harmful algal blooms with eutrophication in Chinese coastal waters. Environ. Sci. Technol. 53, 13031–13041. doi: 10.1021/acs.est.9b03726
Xiong, T.-Q., Wei, Q.-S., Zhai, W.-D., Li, C.-L., Wang, S.-Y., Zhang, Y.-X., et al. (2020). comparing subsurface seasonal deoxygenation and acidification in the Yellow Sea and Northern East China Sea along the North-to-South Latitude Gradient. Front. Mar. Sci. 7:686. doi: 10.3389/fmars.2020.00686
Xu, Z., Liu, S., Xiang, R., and Song, G. (2017). Live benthic foraminifera in the Yellow Sea and the East China Sea: vertical distribution, nitrate storage, and potential denitrification. Mar. Ecol. Prog. Ser. 571, 65–81. doi: 10.3354/meps12135
Yang, F., Wei, Q., Chen, H., and Yao, Q. (2018). Long-term variations and influence factors of nutrients in the western North Yellow Sea, China. Mar. Pollut. Bull. 135, 1026–1034. doi: 10.1016/j.marpolbul.2018.08.034
Yu, G., Jia, Y., He, N., Zhu, J., Chen, Z., Wang, Q., et al. (2019). Stabilization of atmospheric nitrogen deposition in China over the past decade. Nat. Geosci. 12, 424–429. doi: 10.1038/s41561-019-0352-4
Yu, H., Yu, Z., Song, X., Cao, X., Yuan, Y., and Lu, G. (2015). Seasonal variations in the nitrogen isotopic composition of dissolved nitrate in the Changjiang River estuary, China. Estuar. Coast. Shelf Sci. 155, 148–155. doi: 10.1016/j.ecss.2015.01.017
Yu, S., Yao, P., Liu, J., Zhao, B., Zhang, G., Zhao, M., et al. (2016). Diversity, abundance, and niche differentiation of ammonia-oxidizing prokaryotes in mud deposits of the Eastern China marginal seas. Front. Microbiol. 7:137. doi: 10.3389/fmicb.2016.00137
Zhai, W. (2018). Exploring seasonal acidification in the Yellow Sea. Sci. China Earth Sci. 61, 647–658. doi: 10.1007/s11430-017-9151-4
Zhang, G., Zhang, J., and Liu, S. (2007). Characterization of nutrients in the atmospheric wet and dry deposition observed at the two monitoring sites over Yellow Sea and East China Sea. J. Atmos. Chem. 57, 41–57. doi: 10.1007/s10874-007-9060-3
Zhang, S., Wang, Q., Lü, Y., Cui, H., and Yuan, Y. (2008). Observation of the seasonal evolution of the Yellow Sea Cold Water Mass in 1996–1998. Cont. Shelf Res. 28, 442–457. doi: 10.1016/j.csr.2007.10.002
Zhang, X., Zhang, Q., Yang, A., Hou, L., Zheng, Y., Zhai, W., et al. (2018). Incorporation of microbial functional traits in biogeochemistry models provides better estimations of benthic denitrification and anammox rates in coastal oceans. J. Geophys. Res. Biogeosci. 123, 3331–3352. doi: 10.1029/2018JG004682
Zhang, Y., Liu, X., Fangmeier, A., Goulding, K., and Zhang, F. (2008). Nitrogen inputs and isotopes in precipitation in the North China Plain. Atmos. Environ. 42, 1436–1448. doi: 10.1016/j.atmosenv.2007.11.002
Zhang, Y., Yu, Q., Ma, W., and Chen, L. (2010), Atmospheric deposition of inorganic nitrogen to the eastern China seas and its implications to marine biogeochemistry. J. Geophys. Res. 115:D00K10. doi: 10.1029/2009JD012814
Zhang, Z., Zheng, N., Zhang, D., Xiao, H., Cao, Y., and Xiao, H. (2019). Rayleigh based concept to track NOx emission sources in urban areas of China. Sci. Total Environ. 704:135362. doi: 10.1016/j.scitotenv.2019.135362
Zhao, Q., Lu, Z., Zhang, C. S., and Shi, X. Y. (2012). The seasonal changes of nutrients and interfering factors in the West of the North Yellow Sea (in Chinese). Adv. Mar. Sci. 30, 69–76.
Zhao, S., Xiao, T., Lu, R., and Lin, Y. (2010). Spatial variability in biomass and production of heterotrophic bacteria in the East China Sea and the Yellow Sea. Deep Sea Res. Part II Top. Stud. Oceanogr. 57, 1071–1078. doi: 10.1016/j.dsr2.2010.02.009
Zheng, L.-W., and Zhai, W.-D. (2021). Excess nitrogen in the Bohai and Yellow Seas, China: distribution, trends, and source apportionment. Sci. Total Environ. 794:148702. doi: 10.1016/j.scitotenv.2021.148702
Zheng, Y., Hou, L., Liu, M., Gao, J., Yin, G., Li, X., et al. (2015). Diversity, abundance, and distribution of nirs-harboring denitrifiers in intertidal sediments of the yangtze estuary. Microb. Ecol. 70, 30–40. doi: 10.1007/s00248-015-0567-x
Zhong, X., Yan, M., Ning, X., Yan, Z., and Xin, Y. (2020). Nitrate processing traced by nitrate dual isotopic composition in the early spring in the Changjiang (Yangtze River) Estuary and adjacent shelf areas. Mar. Pollut. Bull. 161:111699. doi: 10.1016/j.marpolbul.2020.111699
Zhou, J., Zhu, Z.-Y., Hu, H.-T., Zhang, G.-L., and Wang, Q.-Q. (2021). Clarifying water column respiration and sedimentary oxygen respiration under oxygen depletion off the Changjiang estuary and adjacent east China sea. Front. Mar. Sci. 7:623581. doi: 10.3389/fmars.2020.623581
Zhou, M.-J., Shen, Z.-L., and Yu, R.-C. (2008). Responses of a coastal phytoplankton community to increased nutrient input from the Changjiang (Yangtze) River. Cont. Shelf Res. 28, 1483–1489. doi: 10.1016/j.csr.2007.02.009
Keywords: Yellow Sea Cold Water Mass, nitrate, nitrate dual isotopes, nitrification, N loss
Citation: Tian S, Gaye B, Tang J, Luo Y, Lahajnar N, Dähnke K, Sanders T, Xiong T, Zhai W and Emeis K-C (2022) Nitrate Regeneration and Loss in the Central Yellow Sea Bottom Water Revealed by Nitrogen Isotopes. Front. Mar. Sci. 9:834953. doi: 10.3389/fmars.2022.834953
Received: 14 December 2021; Accepted: 28 February 2022;
Published: 24 March 2022.
Edited by:
Jianfang Chen, Second Institute of Oceanography, Ministry of Natural Resources, ChinaReviewed by:
Yongyu Zhang, Qingdao Institute of Bioenergy and Bioprocess Technology (CAS), ChinaCopyright © 2022 Tian, Gaye, Tang, Luo, Lahajnar, Dähnke, Sanders, Xiong, Zhai and Emeis. This is an open-access article distributed under the terms of the Creative Commons Attribution License (CC BY). The use, distribution or reproduction in other forums is permitted, provided the original author(s) and the copyright owner(s) are credited and that the original publication in this journal is cited, in accordance with accepted academic practice. No use, distribution or reproduction is permitted which does not comply with these terms.
*Correspondence: Shichao Tian, dGlhbnNjXzE5ODlAMTI2LmNvbQ==
Disclaimer: All claims expressed in this article are solely those of the authors and do not necessarily represent those of their affiliated organizations, or those of the publisher, the editors and the reviewers. Any product that may be evaluated in this article or claim that may be made by its manufacturer is not guaranteed or endorsed by the publisher.
Research integrity at Frontiers
Learn more about the work of our research integrity team to safeguard the quality of each article we publish.