 Jessica Morten
 Ryan Freedman
 Jeffrey D. Adams
 Jono Wilson
 Aliya Rubinstein
 Sean Hastings
- 1National Oceanic and Atmospheric Administration (NOAA), Channel Islands National Marine Sanctuary, Santa Barbara, CA, United States
- 2California Marine Sanctuary Foundation, Monterey, CA, United States
- 3Greater Farallones Association, San Francisco, CA, United States
- 4NOAA National Marine Fisheries Service Office of Protected Resources, Silver Spring, MD, United States
- 5The Nature Conservancy, Santa Barbara, CA, United States
- 6Bren School of Environmental Science & Management, University of California, Santa Barbara, Santa Barbara, CA, United States
Vessel strikes are one of the main threats to large whales globally and to endangered blue, fin, and humpback whales in California waters. For over 10 years, NOAA has established seasonal voluntary Vessel Speed Reduction (VSR) zones off of California and requested that all vessels 300 gross tons (GT) or larger decrease speeds to 10 knots or less to reduce the risk of vessel strikes on endangered whales. We offer a comprehensive analysis quantifying cooperation levels of all vessels ≥ 300 GT from 2010 to 2019 within designated VSR zones using Automatic Identification Systems (AIS) data. While average speeds of large vessels have decreased across the years studied, cooperation with voluntary 10-knot speed reduction requests has been lower than estimated to be needed to reduce vessel-strike related mortality to levels that do not inhibit reaching and maintaining optimal sustainable populations. A comparison of vessel speeds across inactive and active voluntary VSR time periods show a modest (+ 15%) increase in cooperation from 2017 to 2019. A complementary, incentive-based VSR program that was started in 2014 and scaled up in 2018 within the region likely improved voluntary VSR cooperation levels, as participating container and car carrier vessels traveled at lower speeds during the VSR season than vessels not enrolled in the incentive-based effort. Comparisons of vessel speeds in the incentive-based VSR program across inactive and active time periods showed a significant (+ 41%) increase in cooperation. With cooperation levels for the voluntary VSR hovering around 50%, and the challenge of funding and sustaining an incentive-based VSR program, voluntary VSR approaches may be insufficient to achieve cooperation levels needed to significantly reduce the risk of vessel strike-related mortality for these federally protected whales, suggesting that VSR regulations warrant consideration.
Introduction
Vessel strikes are a threat to whales globally and are observed in coastal areas around the world where whales concentrate for feeding or breeding purposes (Laist et al., 2001, 2014; Panigada et al., 2006; Berman-Kowalewski et al., 2010; Carretta et al., 2016; De Vos et al., 2016; Rockwood et al., 2017; NOAA National Marine Fisheries Service, 2019).
Southern California’s coastal waters provide habitat and seasonal feeding grounds for blue whales (Balaenoptera musculus), fin whales (Balaenoptera physalus), and humpback whales (Megaptera novaeangliae). All three species congregate within important feeding habitat identified off the west coast of the United States in the summer and fall (Irvine et al., 2014; Calambokidis et al., 2015; Becker et al., 2017; Abrahms et al., 2019), where they are provided legal protection—including the prohibition of take (incidental or otherwise)—under the Marine Mammal Protection Act, the Endangered Species Act, and the National Marine Sanctuary Act.
Large endangered whales share southern California’s coastal waters with many large vessels [≥ 300 gross tons (GT)], the majority of which travel through this region as they transit to and from the ports of Los Angeles and Long Beach (LA/LB). In 2019, there were 4,561 vessel arrivals and 4,257 departures to LA/LB (Marine Exchange of Southern California, 2020) and together the two ports were responsible for roughly 30% of the nation’s market share of imports and exports, or 16,969,664 Twenty-Foot Equivalent Units (TEUs) in total (Port of Long Beach, 2019; Port of Los Angeles, 2019).
There are two internationally approved approaches—a northern and a southern—for the Traffic Separation Scheme (TSS) into LA/LB (see Figure 1) that are designated by the International Maritime Organization (IMO) and are used by approximately 80% of shipping traffic in the region (Marine Exchange of Southern California, 2020). The other 20% of vessels frequenting the ports of LA/LB use voluntary western traffic lanes, established in 2009 by the LA/LB Harbor Safety Committee, to navigate on the south side of the northern Channel Islands (Marine Exchange of Southern California, 2020). This area south of the northern Channel Islands is also the United States’ Point Mugu Sea Range used by the U.S. Navy for live fire exercises, weapons testing, and training.
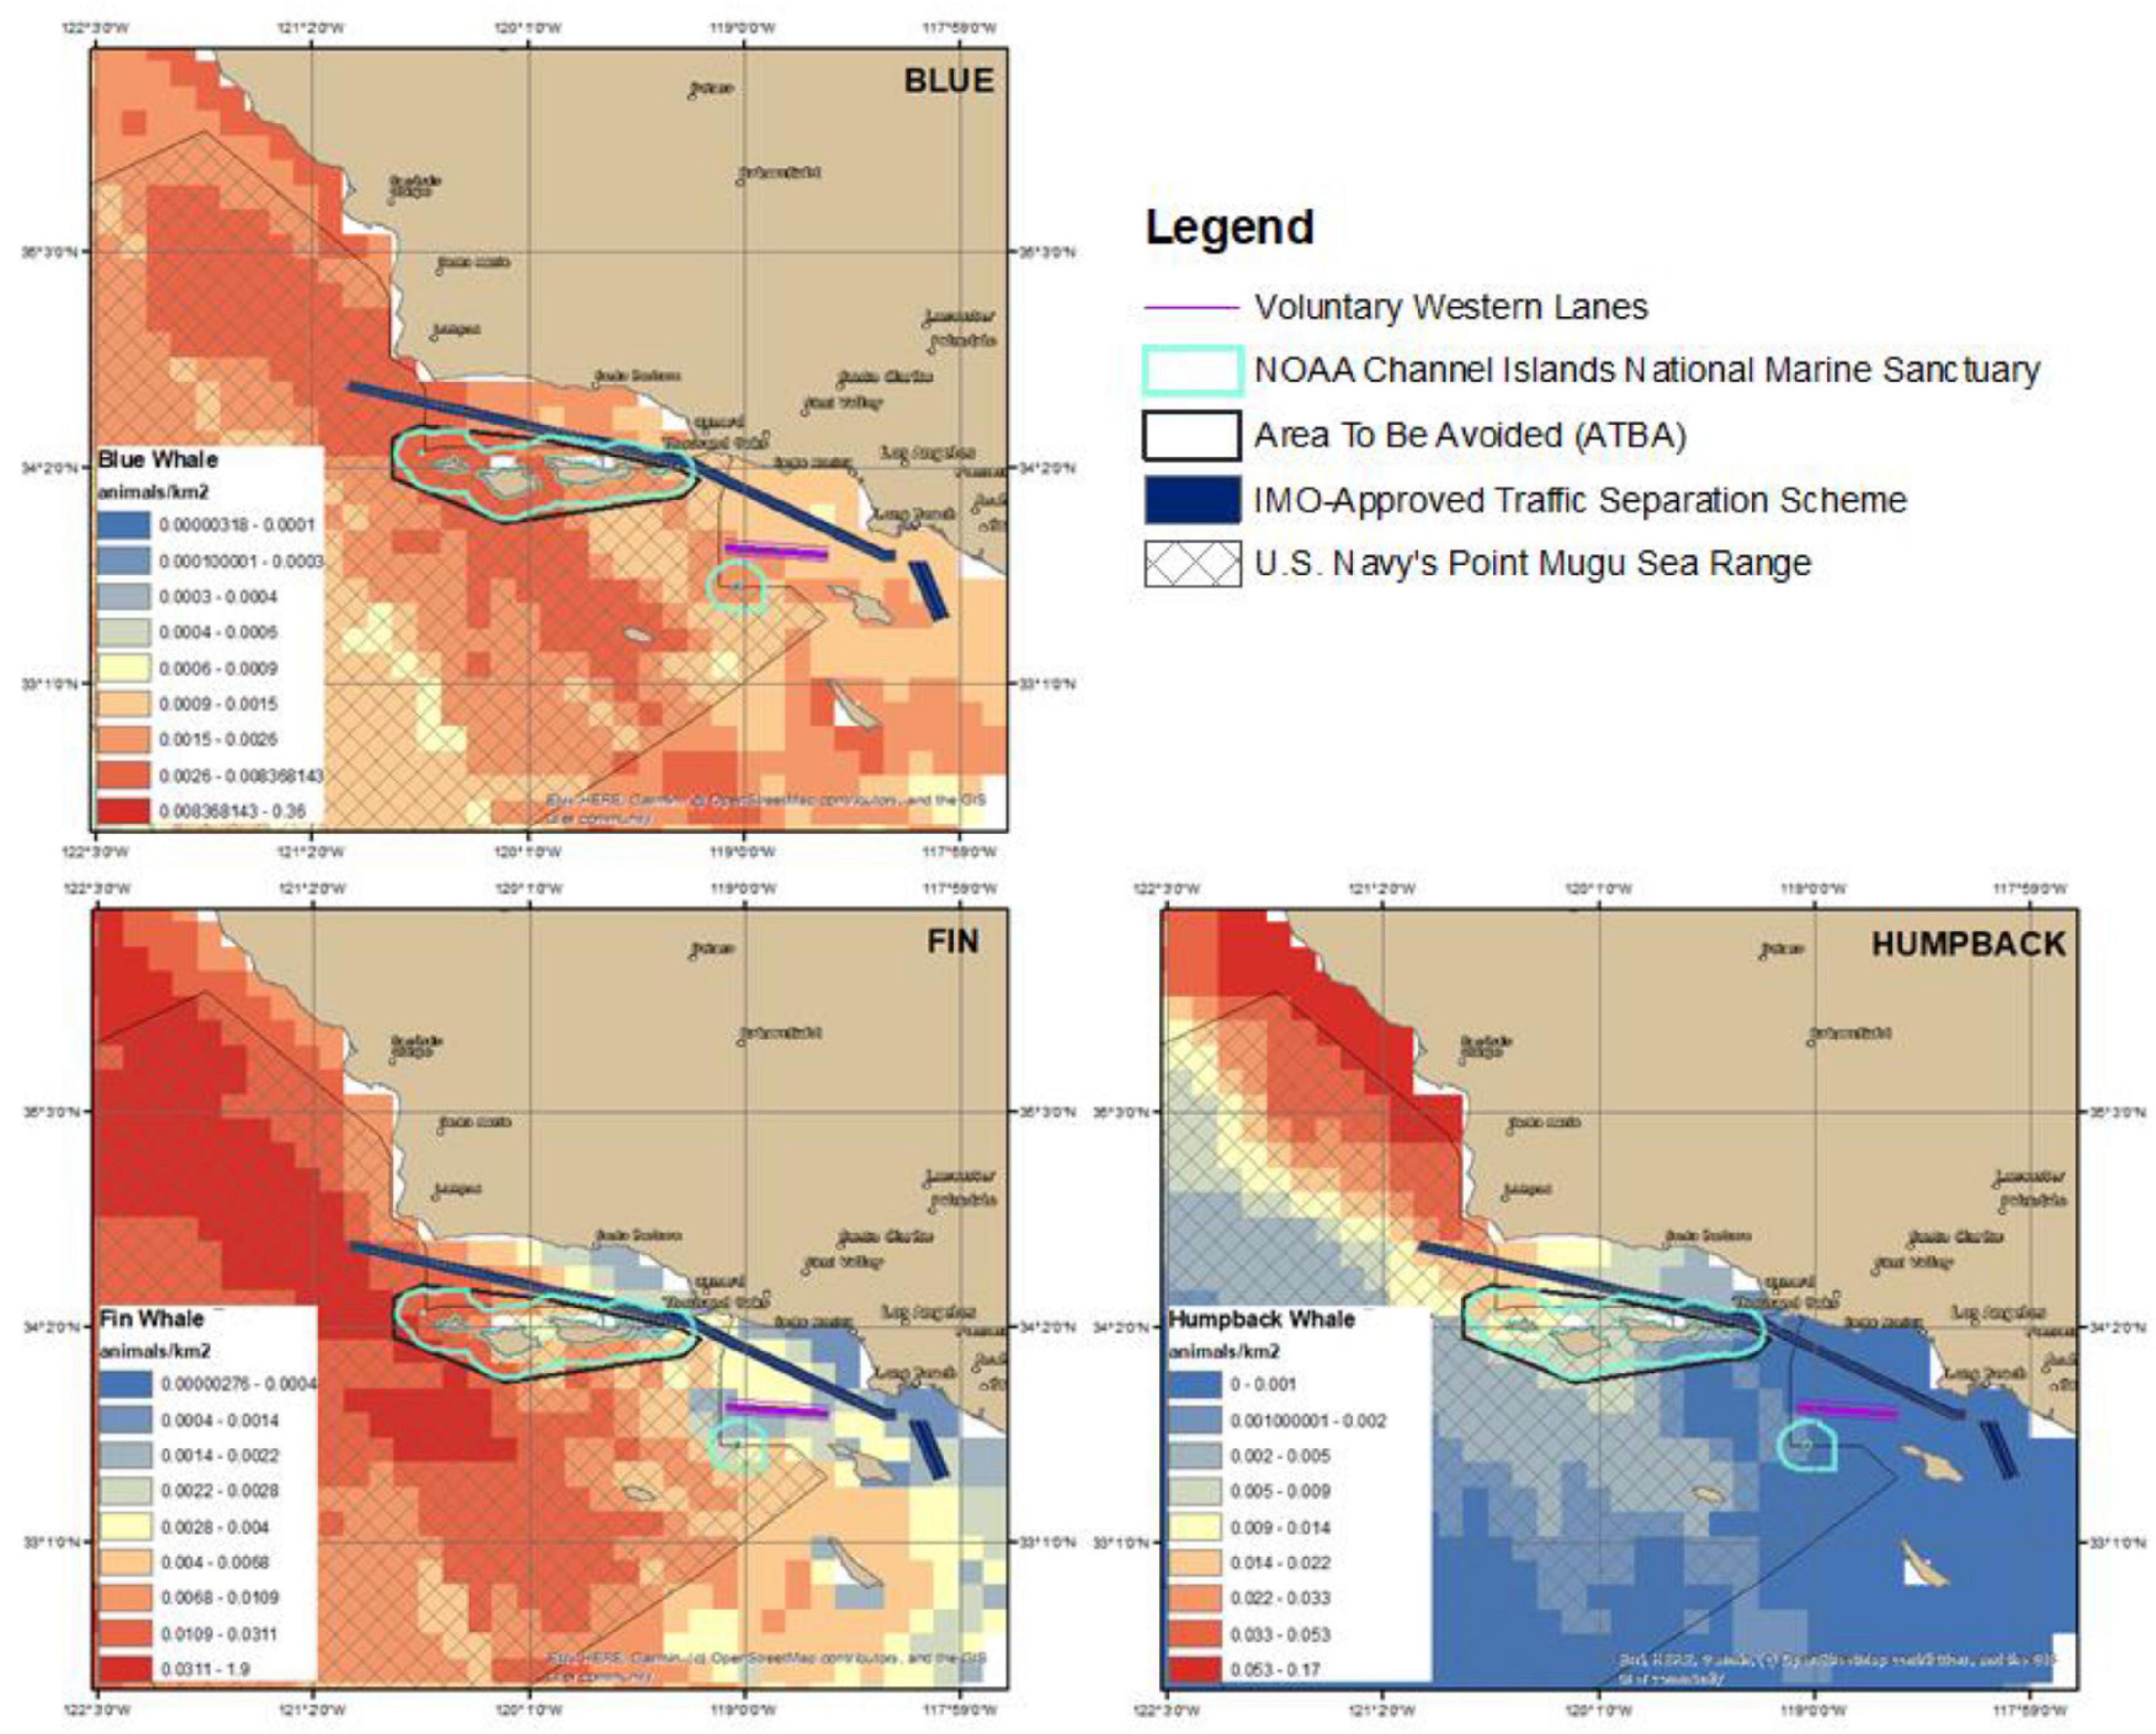
Figure 1. Predicted density of blue, fin, and humpback whales from models produced by Becker et al. (2020) and existing management areas impacting vessel routing in the Southern California Bight.
These heavily trafficked shipping routes to LA/LB overlap with habitat and important feeding areas for endangered blue, fin, and humpback whales (see Figure 1), increasing the risk of vessel strikes (Redfern et al., 2013; Calambokidis et al., 2015; Rockwood et al., 2017). On the U.S. west coast, vessel strikes are considered to be one of the top two human threats to large whales (Clapham et al., 1999; Peel et al., 2018; Schoeman et al., 2020). From 2007 to 2019 there were 57 recorded strandings of endangered whales on the U.S. west coast (including blue, humpback, fin, sperm, and sei whales) that had injuries consistent with vessel strikes, with an average of 4 such recorded strandings per year (NOAA National Marine Fisheries Service, 2019).
Recent work examining and modeling vessel strike mortality suggests that these recorded vessel strike events represent a small proportion of the total number taking place, because most collisions between large vessels and whales go undetected, and the majority of large whale species sink after death (Reisdorf et al., 2012; Pace et al., 2021). Models estimate that a total of 83 (18 blue, 22 fin, and 43 humpback) whales are killed by vessel strikes along the U.S. west coast between May and September each year (Rockwood et al., 2017), suggesting that total annual vessel strike mortality often exceeds blue and humpback Potential Biological Removal (PBR) management thresholds, which are defined under the MMPA as the maximum number of animals, not including natural mortalities, that may be removed from a marine mammal stock while allowing that stock to reach or maintain its optimum sustainable population (Rockwood et al., 2017; Carretta et al., 2020). In the Santa Barbara Channel and the surrounding waters of the Southern California Bight alone, an estimated average of 8.9 blue, 4.6 humpback, and 9.7 fin whales are killed by vessel strikes between June and November each year (Rockwood et al., 2017; Rockwood et al., 2021).
A variety of approaches have been used around the world to reduce the frequency and severity of vessel strikes. In several locations globally and on both coasts of the United States, internationally designated shipping lanes have been relocated and redefined to reduce whale/vessel co-occurrence by the International Maritime Organization (IMO), an agency of the United Nations charged with developing a consistent international code of operations for maritime shipping (Silber et al., 2012). These spatial measures, along with the establishment of Areas To Be Avoided (ATBA), have been successful at achieving compliance and a reduction in risk of vessel strikes (Vanderlaan and Taggart, 2009; Dransfield et al., 2014). However, in the southern California region and in other regions globally, optimal spatial reconfigurations and solutions are difficult to identify and implement (Redfern et al., 2019). Research has shown that altering shipping routes impacts each population differently, sometimes reducing mortality risk for one species while increasing it for another (Redfern et al., 2019). In addition, spatial conflicts exist between various human uses of these marine regions, which in southern California includes offshore energy development and the U.S. Navy’s Point Mugu Sea Range (Redfern et al., 2013; Rockwood et al., 2017). Spatial measures also require review, agreement and adoption by the IMO, which can take years to implement.
To more dynamically address vessel strike risk in areas where vessels and endangered whales overlap, Vessel Speed Reduction (VSR) measures are a commonly used management tool that have been trialed and implemented around the world. Although collisions between vessels and whales may still occur at any speed level, slow speed measures have been shown to reduce the risk of fatal vessel strikes on large whales in the areas and time periods in which they are implemented (Laist et al., 2001; van der Hoop et al., 2015). VSR measures offer additional environmental benefits when adherence is achieved, including reducing air emissions (Lindstad et al., 2011; Santa Barbara County Air Pollution Control District, 2019) and underwater noise (McKenna et al., 2009; Gassmann et al., 2017; Joy et al., 2019).
The types of VSR initiatives that have been tried and implemented globally to achieve these benefits range from government regulatory programs that mandate slow speeds across specific areas (NOAA National Marine Fisheries Service, 2020) to incentive-based VSR programs that motivate cooperation from participants with financial awards and positive press (Freedman et al., 2017; Port of Long Beach, 2019; Port of Los Angeles, 2019; Vancouver Frasier Port Authority, 2019), to purely voluntary VSR requests with no awards or incentives attached (Wiley et al., 2008; Guzman et al., 2020; Rockwood et al., 2020; Vance et al., 2021). The different styles of VSR implementation achieve varying levels of regulatory compliance or voluntary cooperation from targeted groups of large vessels (see Table 1).
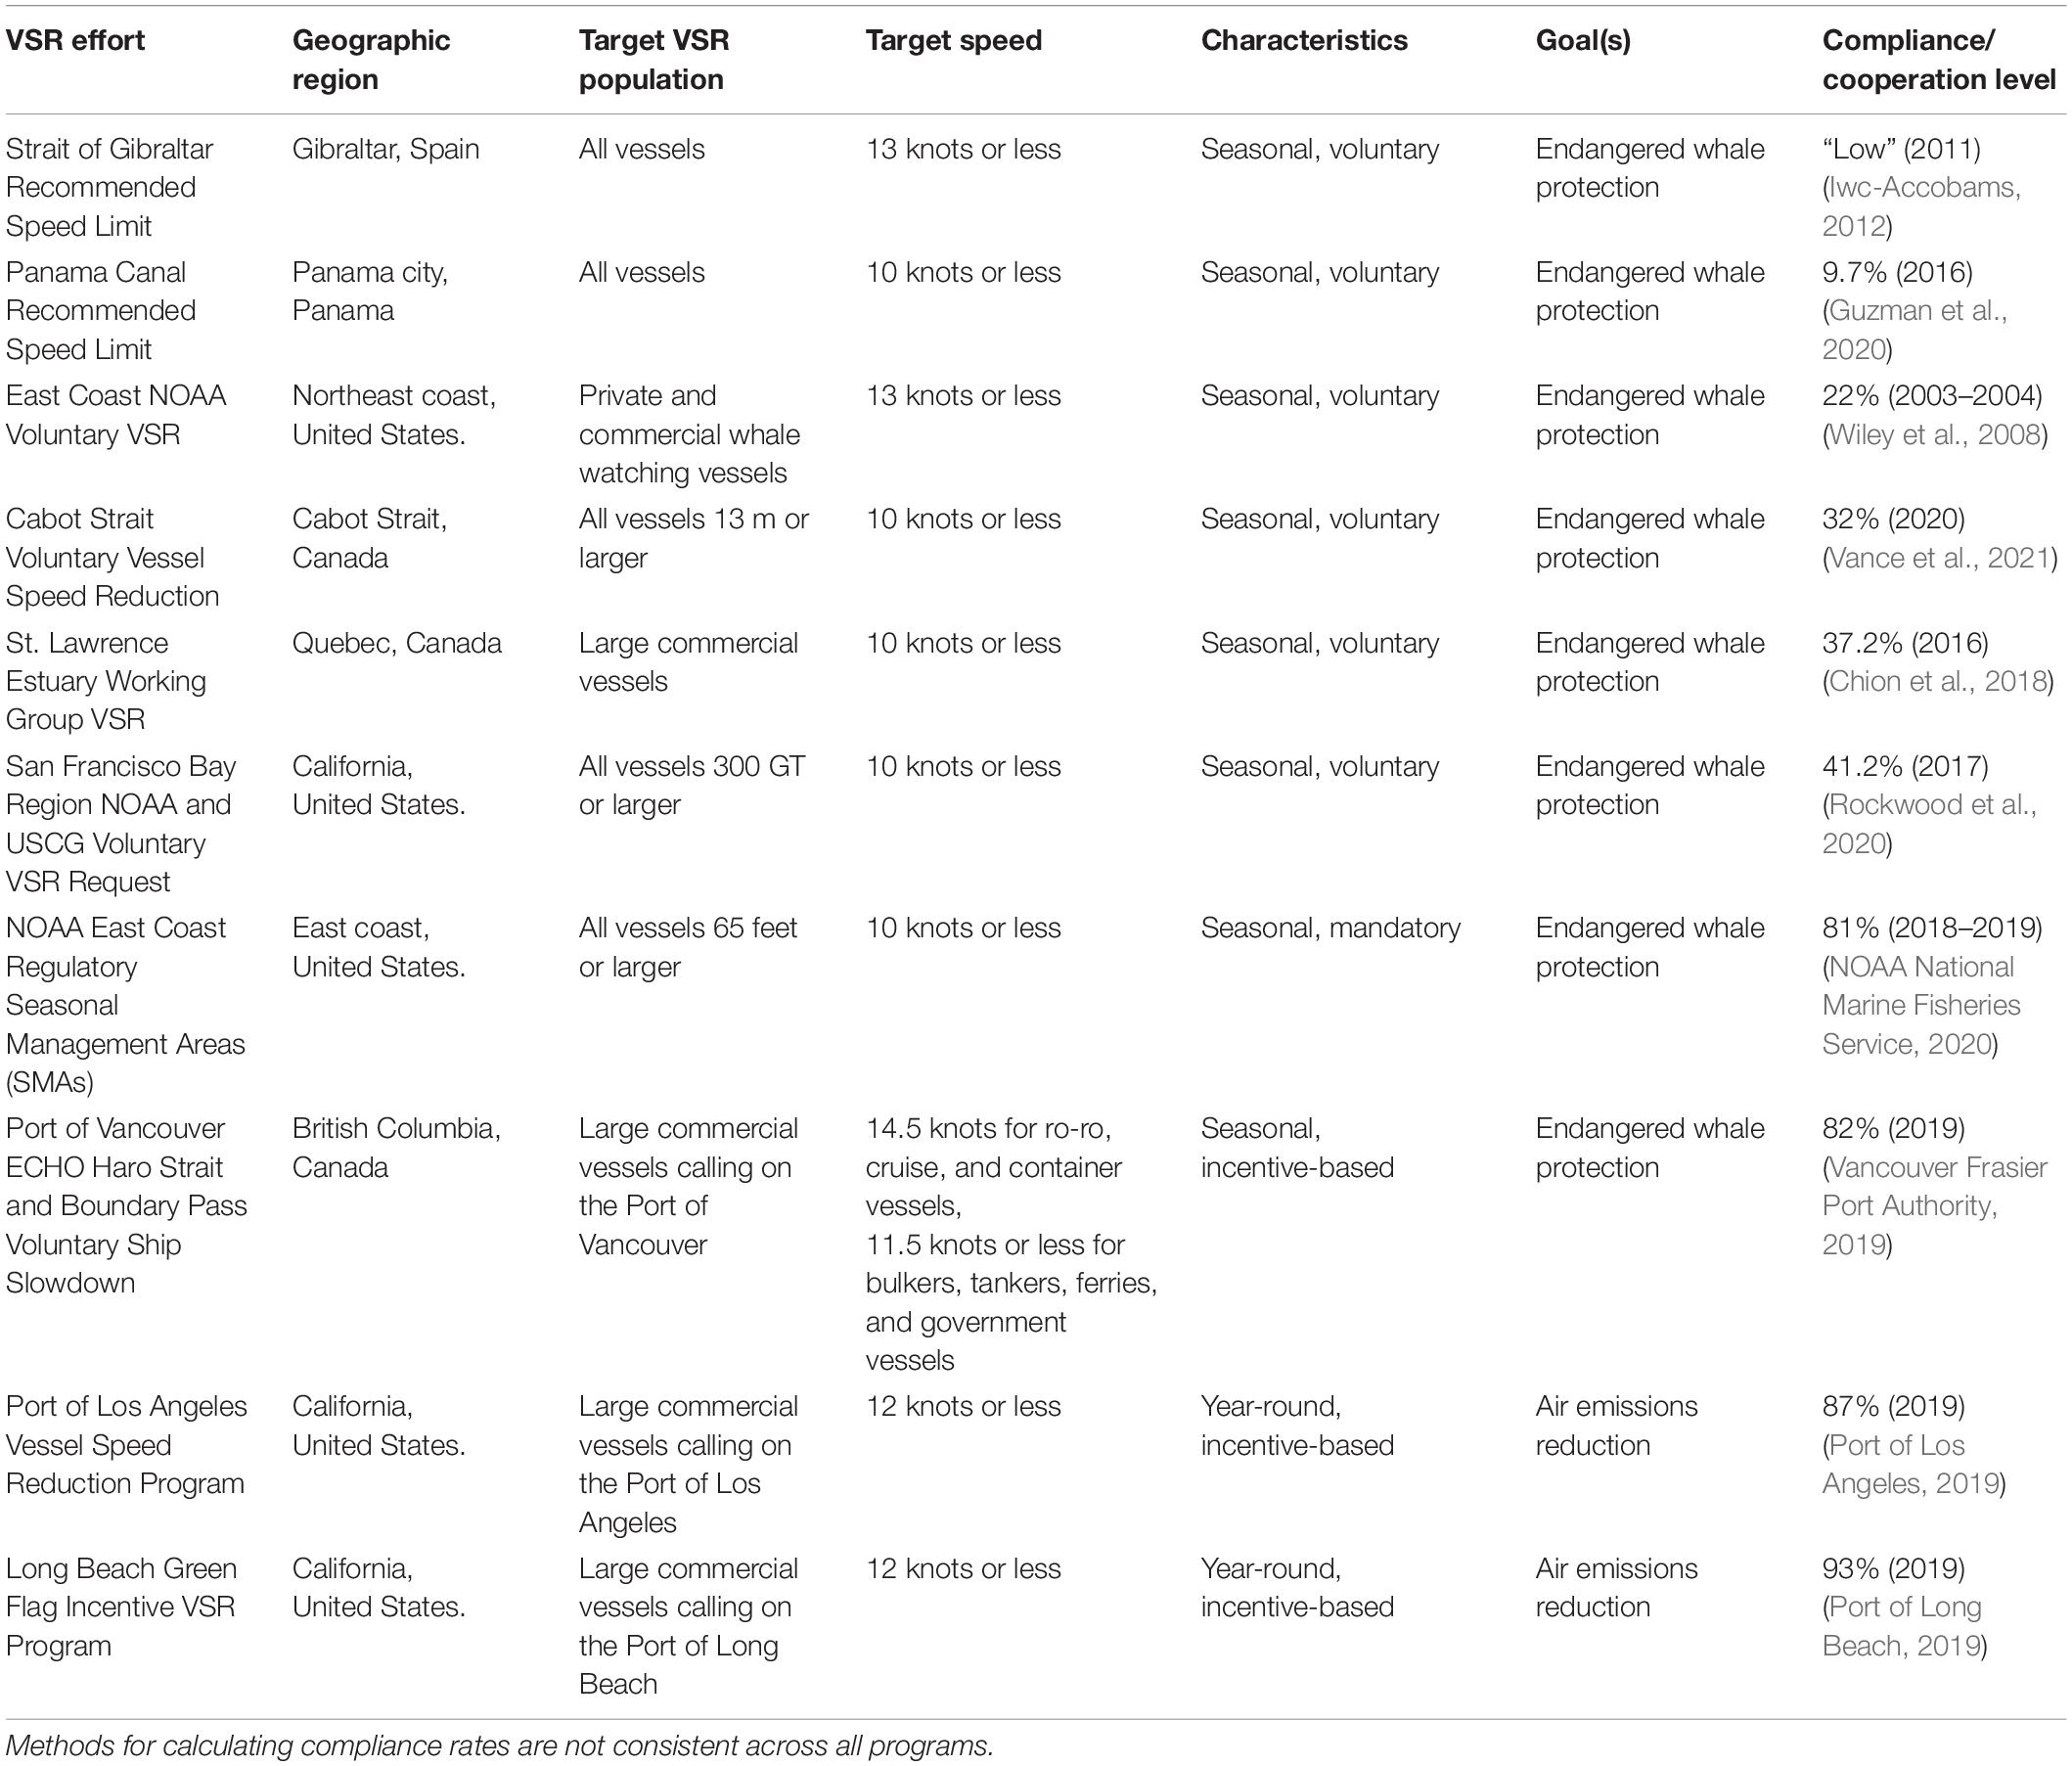
Table 1. Vessel Speed Reduction (VSR) efforts aimed at endangered whale protection and air emissions reduction.
On the east coast of the United States, mandatory speed restrictions of 10 knots or less implemented by NOAA have been shown to achieve relatively high (81%) levels of compliance within established Seasonal Management Areas (SMAs) designated to protect critically endangered North Atlantic right whales (Lagueux et al., 2011; NOAA National Marine Fisheries Service, 2020). The rule requires most vessels 65 feet or larger to reduce speeds to 10 knots or less when transiting through 10 SMAs during periods of peak right whale occurrence. Vessel speeds are monitored within these SMAs by NOAA, and citations are issued to enforce compliance. Studies have shown that these regulatory and enforcement measures have been effective at reducing speeds in these areas (Silber et al., 2014; van der Hoop et al., 2015). However, the species remains critically endangered and the remaining risk of vessel strike is still a threat to its survival.
Some incentive-based VSR efforts have been successful in achieving high levels of cooperation with slow speed requests (see Table 1; Freedman et al., 2017; Port of Long Beach, 2019; Port of Los Angeles, 2019; Vancouver Frasier Port Authority, 2019). For example, the Ports of LA/LB—which administer emissions-focused, year-round incentive-based VSR efforts within 40 nautical miles of the ports—have sustained funding and record cooperation rates of ∼90% each year with their 12 knots or less speed reduction requests (Port of Long Beach, 2019; Port of Los Angeles, 2019). These port-based Incentive Programs achieve the same or higher levels of compliance shown to be accomplished by mandatory VSR regulations implemented on the east coast to protect endangered North Atlantic right whales (NOAA National Marine Fisheries Service, 2020).
On the west coast, vessel speeds are not regulated, however, the take of whales by vessels (incidental or otherwise) is not authorized by the MMPA or ESA. Current Channel Islands National Marine Sanctuary regulations promulgated under the NMSA also prohibit taking any marine mammal within the Sanctuary, unless authorized by the MMPA [16 U.S.C. 1361 et seq., and ESA, 16 U.S.C. 1531 et seq.], or any regulation, as amended, promulgated under the MMPA or ESA [§922.72(a)(9)]. In 2007, four blue whale vessel strike incidents were recorded on the U.S. west coast in the Santa Barbara Channel region within a 3-month timespan and raised concern that vessel strike mortalities might be threatening the endangered Eastern Tropical Pacific blue whale population’s recovery (Berman-Kowalewski et al., 2010). In response, NOAA declared an Unusual Mortality Event and issued a voluntary VSR request to all vessels ≥ 300 GT transiting within the region. To address vessel strike risk farther north in California, similar 10 knots or less slow speed requests have been implemented and communicated off of San Francisco Bay since 2012. These voluntary slow speed requests have continued since 2007 on a seasonal basis—generally from May through November of each year—and are communicated through the U.S. Coast Guard’s weekly Local Notice to Mariners as well as through direct communications from NOAA. Starting in 2019, to further raise awareness, NOAA and USCG also began sending annual letters to vessel operators to communicate their fleet’s recorded cooperation levels with the voluntary requests.
Recent modeling work suggests that a cooperation level of 80% or higher with the southern California VSR request could reduce the estimated vessel strike mortality by 20–30% to blue, fin, and humpback whales (Rockwood et al., 2021). However, past studies on the voluntary VSR requests in southern California have shown adherence to be limited (0–13%) across large vessel traffic in the years examined (Mckenna et al., 2012; Freedman et al., 2017). To motivate increased cooperation with the voluntary VSR requests, in 2014, CINMS partnered with California county air district agencies and non-profit partners to create a complementary and concurrent incentive-based VSR program, known as the Protecting Blue Whales and Blue Skies Program. This Incentive Program offers financial incentives and positive public recognition to container and car carrier lines willing to enroll and transit slowly through the VSR zones.
Using Automatic Identification Systems (AIS) data, we evaluated and compared cooperation levels from large vessel traffic with voluntary VSR requests in southern California from 2010 to 2019 and the Protecting Blue Whales and Blue Skies Program in 2018 and 2019. In addition to quantifying overall cooperation levels with these two voluntary VSR efforts, we assessed whether large vessel speeds have changed over time, both across years and within each year across inactive and active VSR time periods. Acknowledging that vessel behavior and speeds are impacted by a number of factors—including air quality regulatory changes and economic events (a summary of factors impacting vessel behavior off of California from 2007 to 2018 can be referenced in Moore et al., 2018)—we evaluate historical adherence with these two concurrent VSR efforts in order to assess the effectiveness of these voluntary slow speed measures at achieving reduced vessel speeds to protect endangered whales.
Materials and Methods
Communication of NOAA Voluntary Vessel Speed Reduction Requests in Southern California
From 2007 to 2019, the voluntary VSR request was communicated weekly to all mariners through the U.S. Coast Guard District 11 Local Notice to Mariners (LNM) and broadcasted on the marine band radio by NOAA Weather. The LNM is an established vehicle for the USCG to communicate information to mariners on changes to navigation rules, aids to navigation, and the presence of local hazards. The VSR request was also disseminated to the shipping industry by NOAA through direct emails, the Marine Exchange of Southern California—which serves as the ship traffic controller for the region with USCG’s Vessel Traffic Service—shipping industry representatives, and the LA/LB Harbor Safety Committee.
NOAA implemented a dynamic spatial and temporal approach to voluntary VSR zones and requests over 2010–2019 in which the timing and the geographic area were subject to adjustment based on the timing, number, and distribution of confirmed whales in the area (see Figure 2). Initially, whale advisories were triggered when five or more ESA listed whales were confirmed in proximity of the Traffic Separation Scheme (TSS) and were subsequently canceled when fewer than five whales were detected over 2 week time periods. From 2010 to 2018, the VSR zones were limited to portions of the Santa Barbara Channel TSS. In 2019, the voluntary VSR zone was expanded to include all three approaches into the ports of Los Angeles and Long Beach. From 2010 to 2018, the VSR zone was encapsulated within a broader Whale Advisory Zone that put mariners on notice of the increased presence of whales and recommended reducing speed. In most years of implementation (2010–2012, 2015–2019), the VSR request was to travel at 10-knots or below while in 2013 and 2014 the VSR notice only requested that vessels reduce speed and exercise caution within VSR areas.
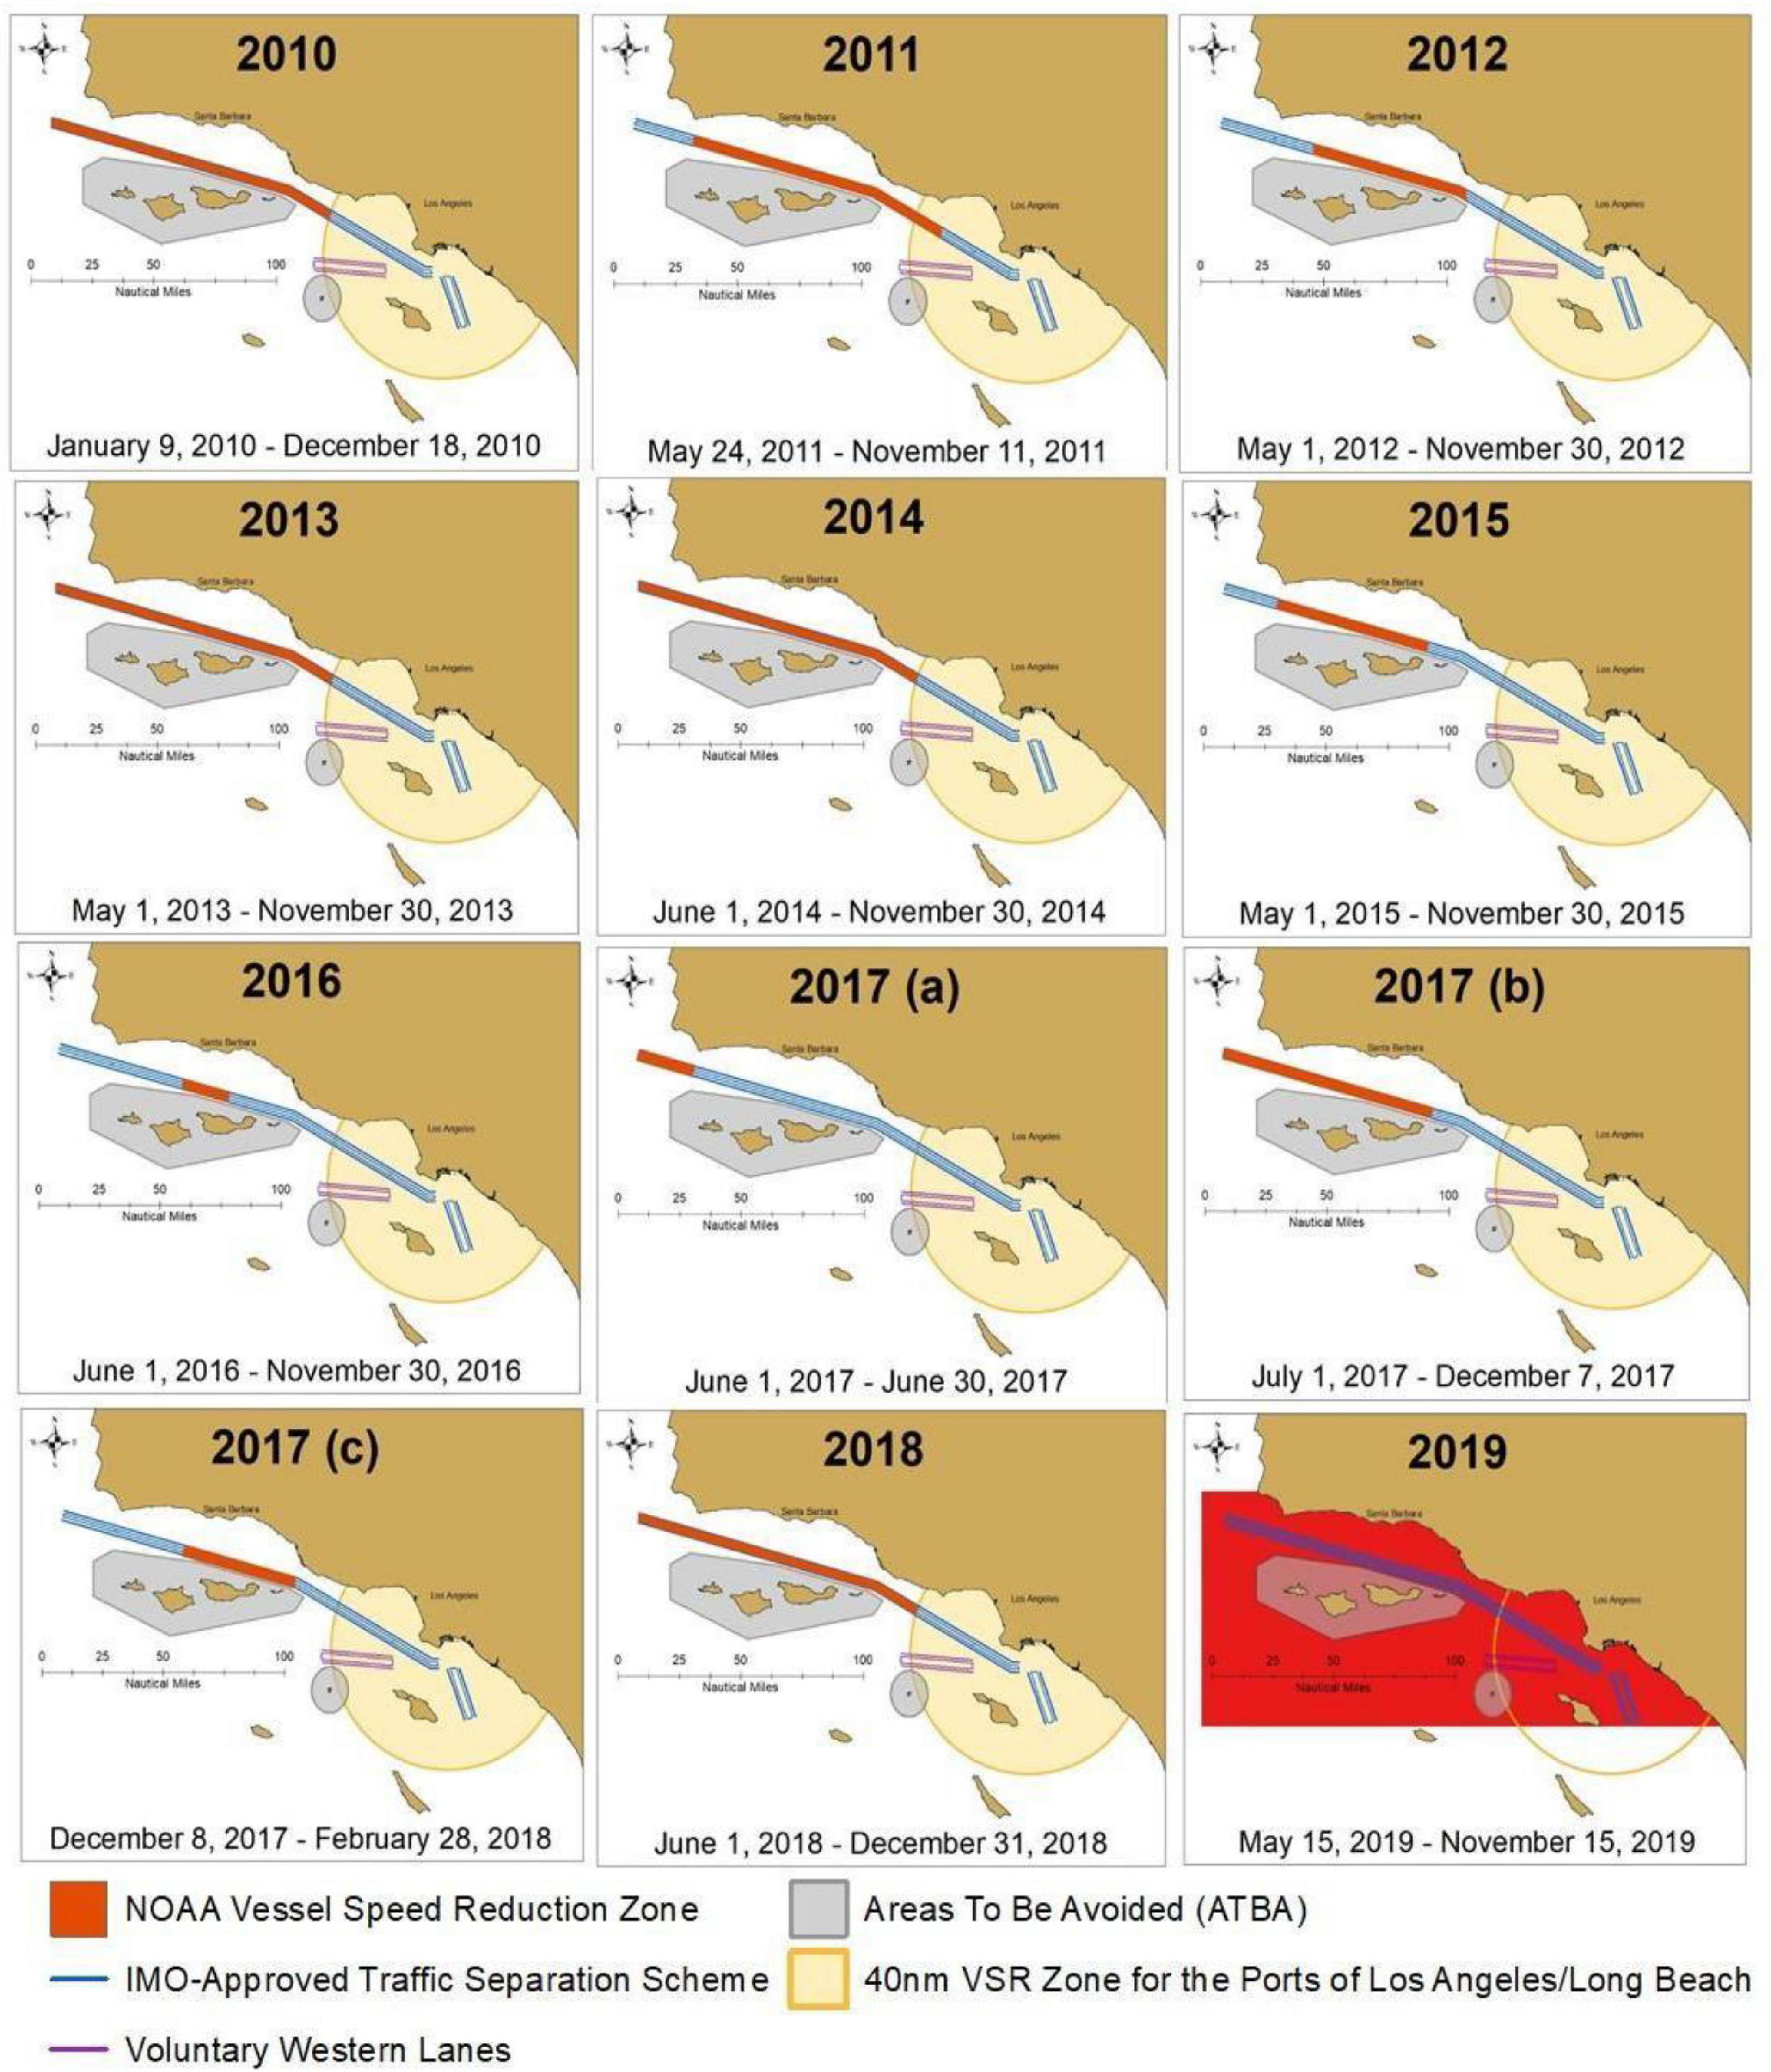
Figure 2. NOAA Voluntary VSR zones 2010–2019, shown in red.
NOAA performed AIS analyses annually to quantify the level of cooperation of each carrier company with the VSR request in California. Starting in 2018, letters were sent to carrier companies to increase awareness of the VSR request and provide companies with an overview of their fleet’s level of cooperation.
Communication of the Protecting Blue Whales and Blue Skies Program
Beginning in 2014 and continuing from 2016 to 2019, an incentive-based VSR initiative known as the Protecting Blue Whales and Blue Skies Program was launched by a partnership that includes NOAA’s Office of National Marine Sanctuaries, California county air district agencies, and non-profit partners. The Incentive Program offered positive public recognition and grant-funded financial rewards from a variety of sources to container and car carrier companies transiting slowly through the Santa Barbara Channel region to reduce vessel strike mortality on endangered whales, harmful air emissions, and ocean noise.
The Incentive Program parameters evolved and expanded through its 5 years of implementation. In 2014, the program requested that shipping companies enroll and select transits to slow to 12 knots or less in the Santa Barbara Channel between July 1 and November 15. Starting in 2019, the program requested that container and car carrier companies slow to 10 knots or less within VSR zones off of southern California as well as in the TSS off of San Francisco Bay from May 15 through November 15 to receive financial rewards and public recognition (Santa Barbara County Air Pollution Control District, 2019).
Enrollment materials and VSR zones for the Protecting Blue Whales and Blue Skies Program were shared on the Santa Barbara County Air Pollution Control District website, and communicated by program partners through shipping industry and agency-based email lists and phone calls in the spring of each program year. Participating shipping companies enrolled individual vessel transits in early years (2014, 2016–2017) and, in later years (2018–2019), they enrolled their entire fleets. AIS data analyses were conducted at the end of each VSR season to quantify each company’s cooperation level across enrolled transits (2014, 2016–2017) or their entire fleet (2018–2019). In 2014, 2016–2018, the Incentive Program zones were limited to portions of the Santa Barbara Channel TSS (see Figure 3). In 2019, the voluntary VSR zone was expanded to include all three approaches into the ports of Los Angeles and Long Beach (see Figure 3). In 2019, enrolled companies whose vessels cumulatively traveled a minimum 10% of their total distance within the VSR zones at 10 knots or less received some positive recognition and were recognized in an awards ceremony for their participation in the voluntary program. Enrolled companies whose vessels traveled at least 50% of their total distance within the VSR zones at 10 knots or less received financial awards, which ranged from $1,500 to $50,000 depending on fleet size and were scaled to higher levels of cooperation.
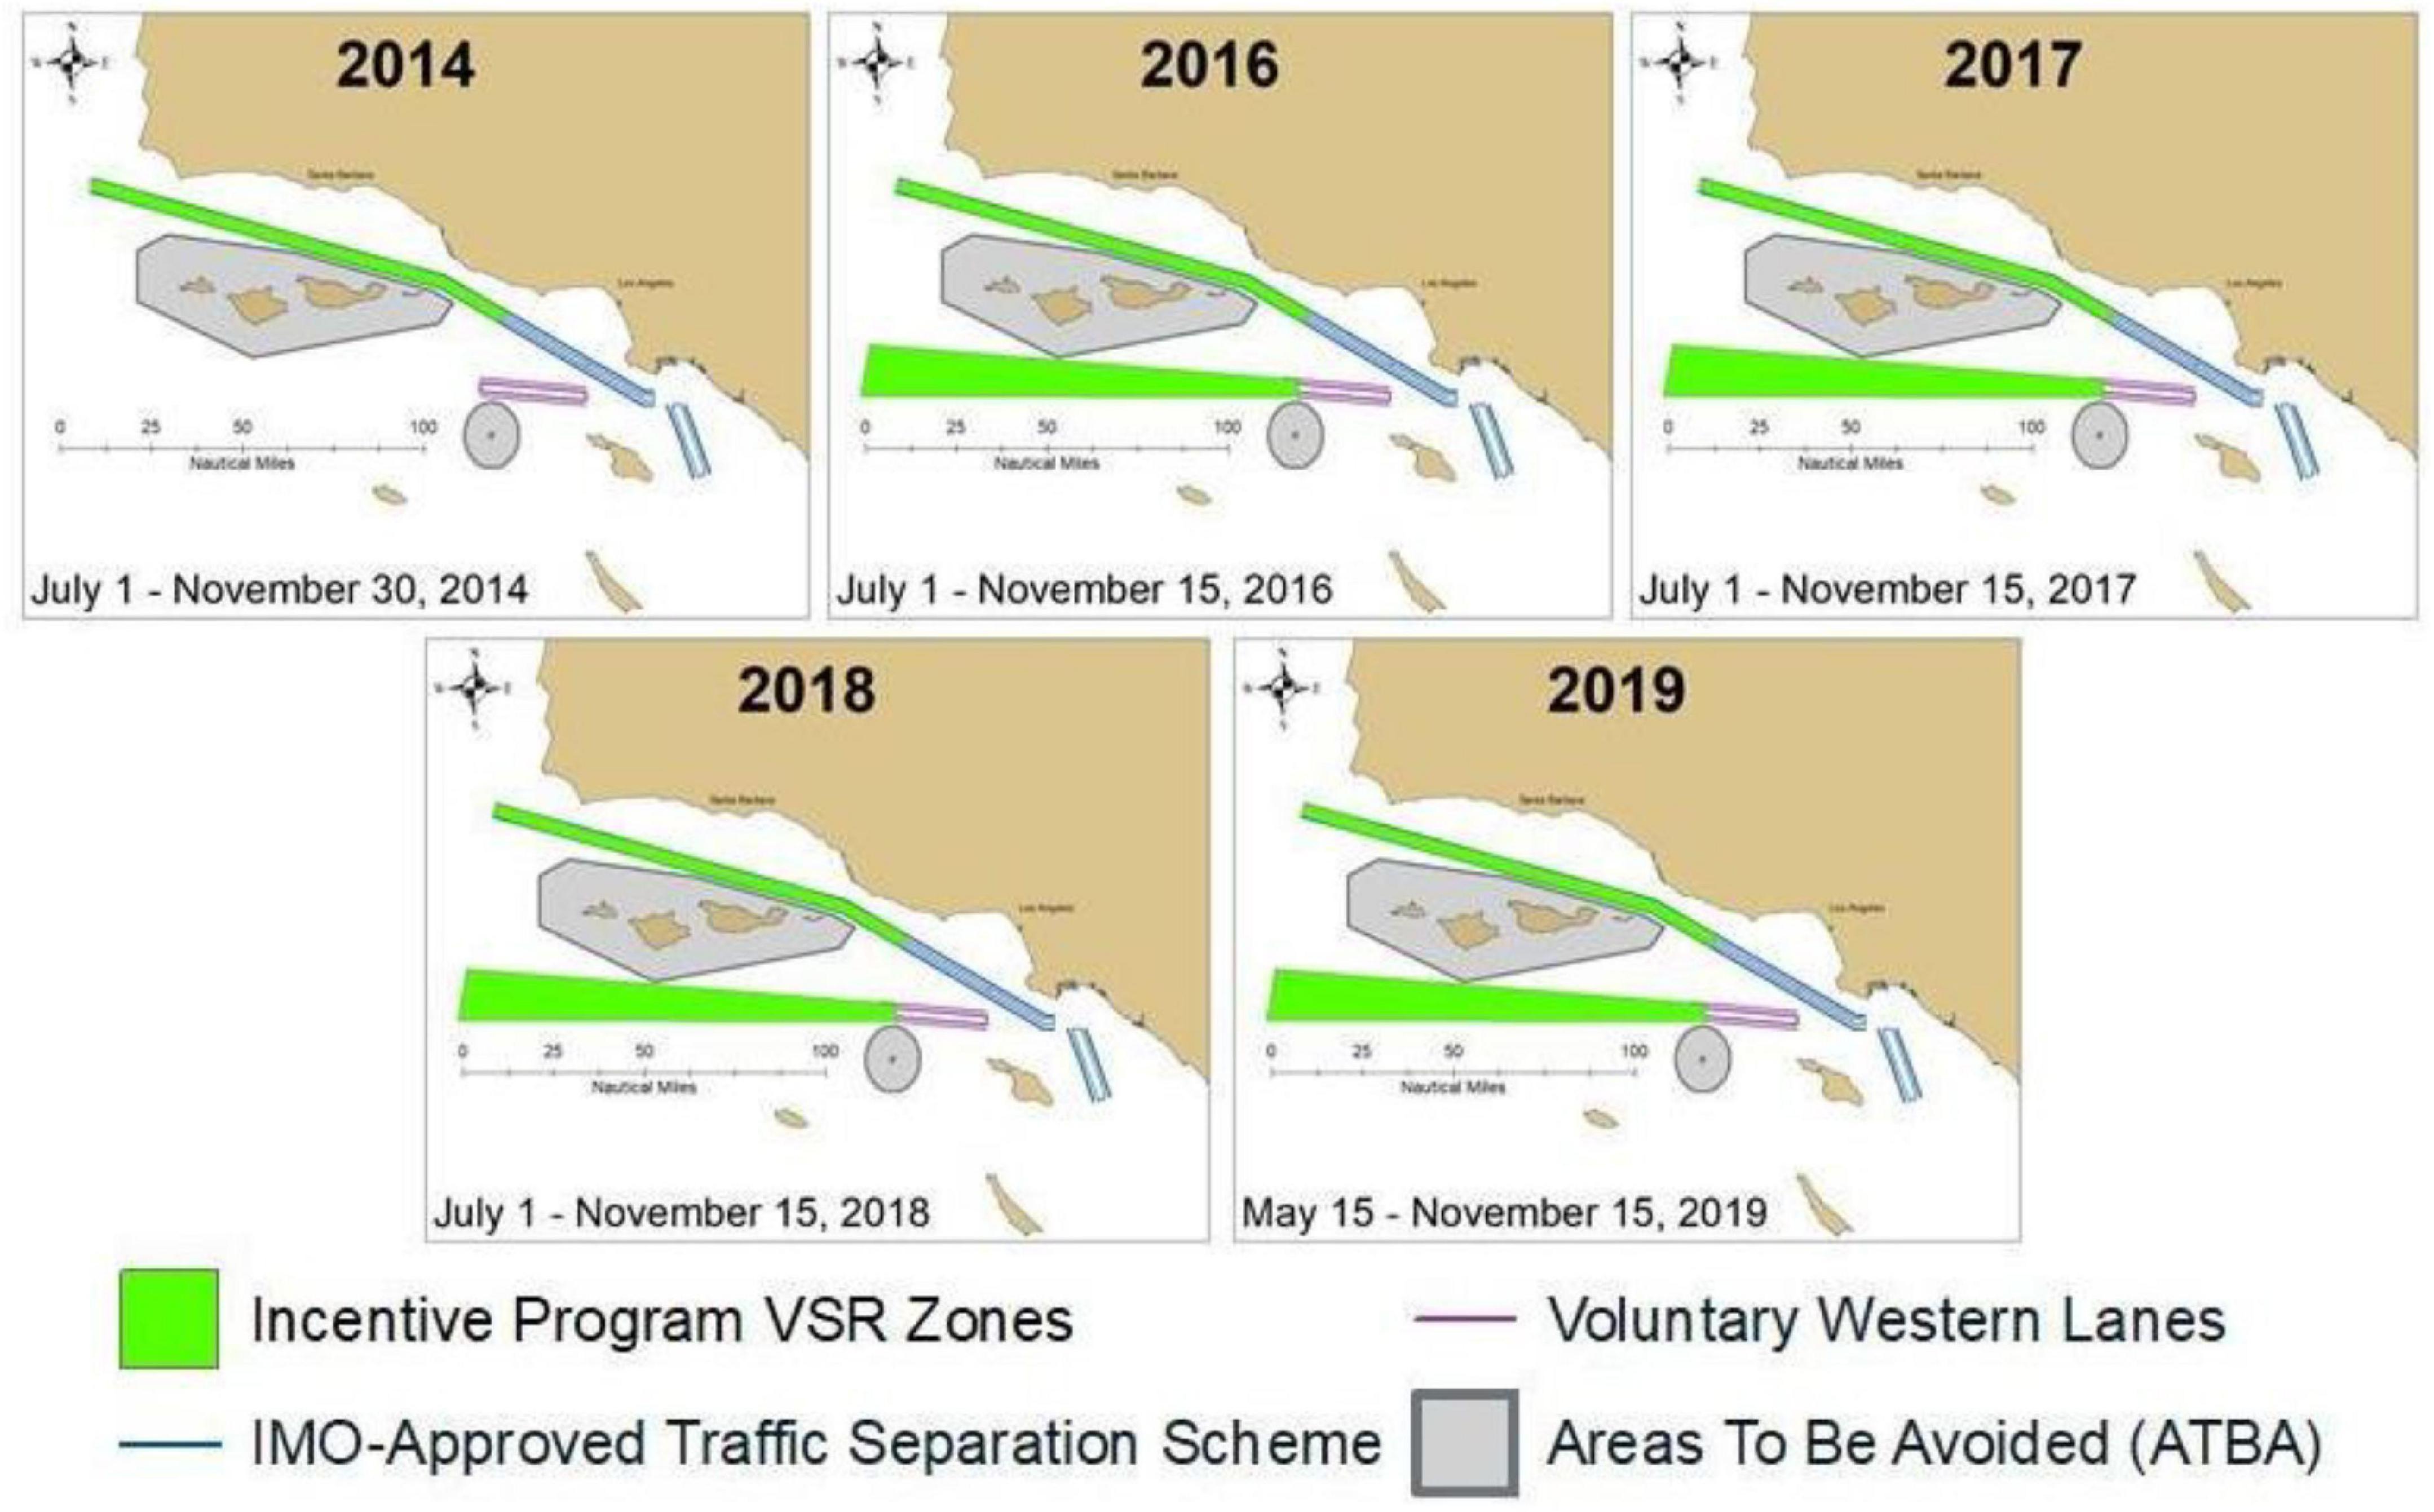
Figure 3. Southern California Protecting Blue Whales and Blue Skies Program VSR zones 2014, 2016–2019, shown in green.
Automatic Identification Systems Data Collection and Vessel Speed Analyses
We obtained 10 years of AIS data (2010–2019) for the VSR zones in southern California from the Marine Exchange of Alaska’s (2010–2017) and the USCG’s Nationwide Automatic Identification System (NAIS) (2018–2019) networks of terrestrial stations. The data were decoded, converted into comma separated value (CSV) files, and imported into a spatially enabled PostgreSQL/PostGIS database. To ensure the inclusion of only vessels meeting the ≥ 300 GT specification of the request (GT is not a data point contained in AIS messages), we limited our analysis to vessels that we were able to cross-link to the IHS Maritime World Register of Ships, a database that houses comprehensive and current data on the global merchant vessel fleet. And, as a quality control measure, any AIS data containing speed over ground (SOG) values exceeding a vessel’s service speed by 3 knots or more were removed from the analysis.
AIS records were aggregated into vessel transits using the methodology found in Silber and Bettridge (2010). To assess cooperation across VSR seasons and years, we calculated the percent of total transit distance (nautical miles) traveled by vessels within the VSR zones at speeds less than or equal to 10 knots, between 10.1 and 12 knots, between 12.1 and 15, and greater than 15. In addition, we calculated the average distance-weighted speed over ground of each transit segment.
Cooperation levels were calculated by quantifying the percentage of nautical miles traveled by vessels ≥ 300 GT within the VSR zones at 10 knots or less out of total nautical miles traveled within the VSR zones during each time period. Cooperation levels for all transits recorded by vessels ≥ 300 GT were calculated across each voluntary VSR time period (defined as the active time period) and across the time periods when the voluntary VSR request was not in effect (defined as the inactive time period). Similarly, cooperation levels for all nautical miles recorded by vessels enrolled in the Incentive Program were calculated across each Incentive Program time period (defined as the active time period) and across the time periods when the Incentive Program VSR request was not in effect (defined as the inactive time period).
Speed data for individual vessels enrolled in the Incentive Program in 2018 and 2019 (years when the Incentive Program implemented the fleet approach) were extracted and compared with speed data from vessels not enrolled in the program in 2018 and 2019.
Results
Transit segments representing 3,166,788 nautical miles traveled within the VSR zones by 5,617 unique vessels ≥ 300 GT from 2010 to 2019 were compiled and analyzed. Container ships accounted for 51% of the total nautical miles, car carriers (designed to carry wheeled cargo such as cars and trucks) accounted for 10%, bulk cargo vessels accounted for 9%, 7% by tanker vessels, and 5% by large pleasure or passenger vessels, and 1% by research vessels. The remaining 17% of nautical miles were completed by other types of large vessels, including general cargo vessels, tugs, towing vessels, dredging vessels, and oil platform maintenance vessels. Average speed across all vessel types ≥ 300 GT is shown in Figure 4. Average speeds of large vessels decreased across the VSR areas over the study time period, from 14 knots in 2010 in the VSR zone in the Santa Barbara Channel to 9 knots in 2019 in the expanded VSR zone (see Table 2 and Figure 5).
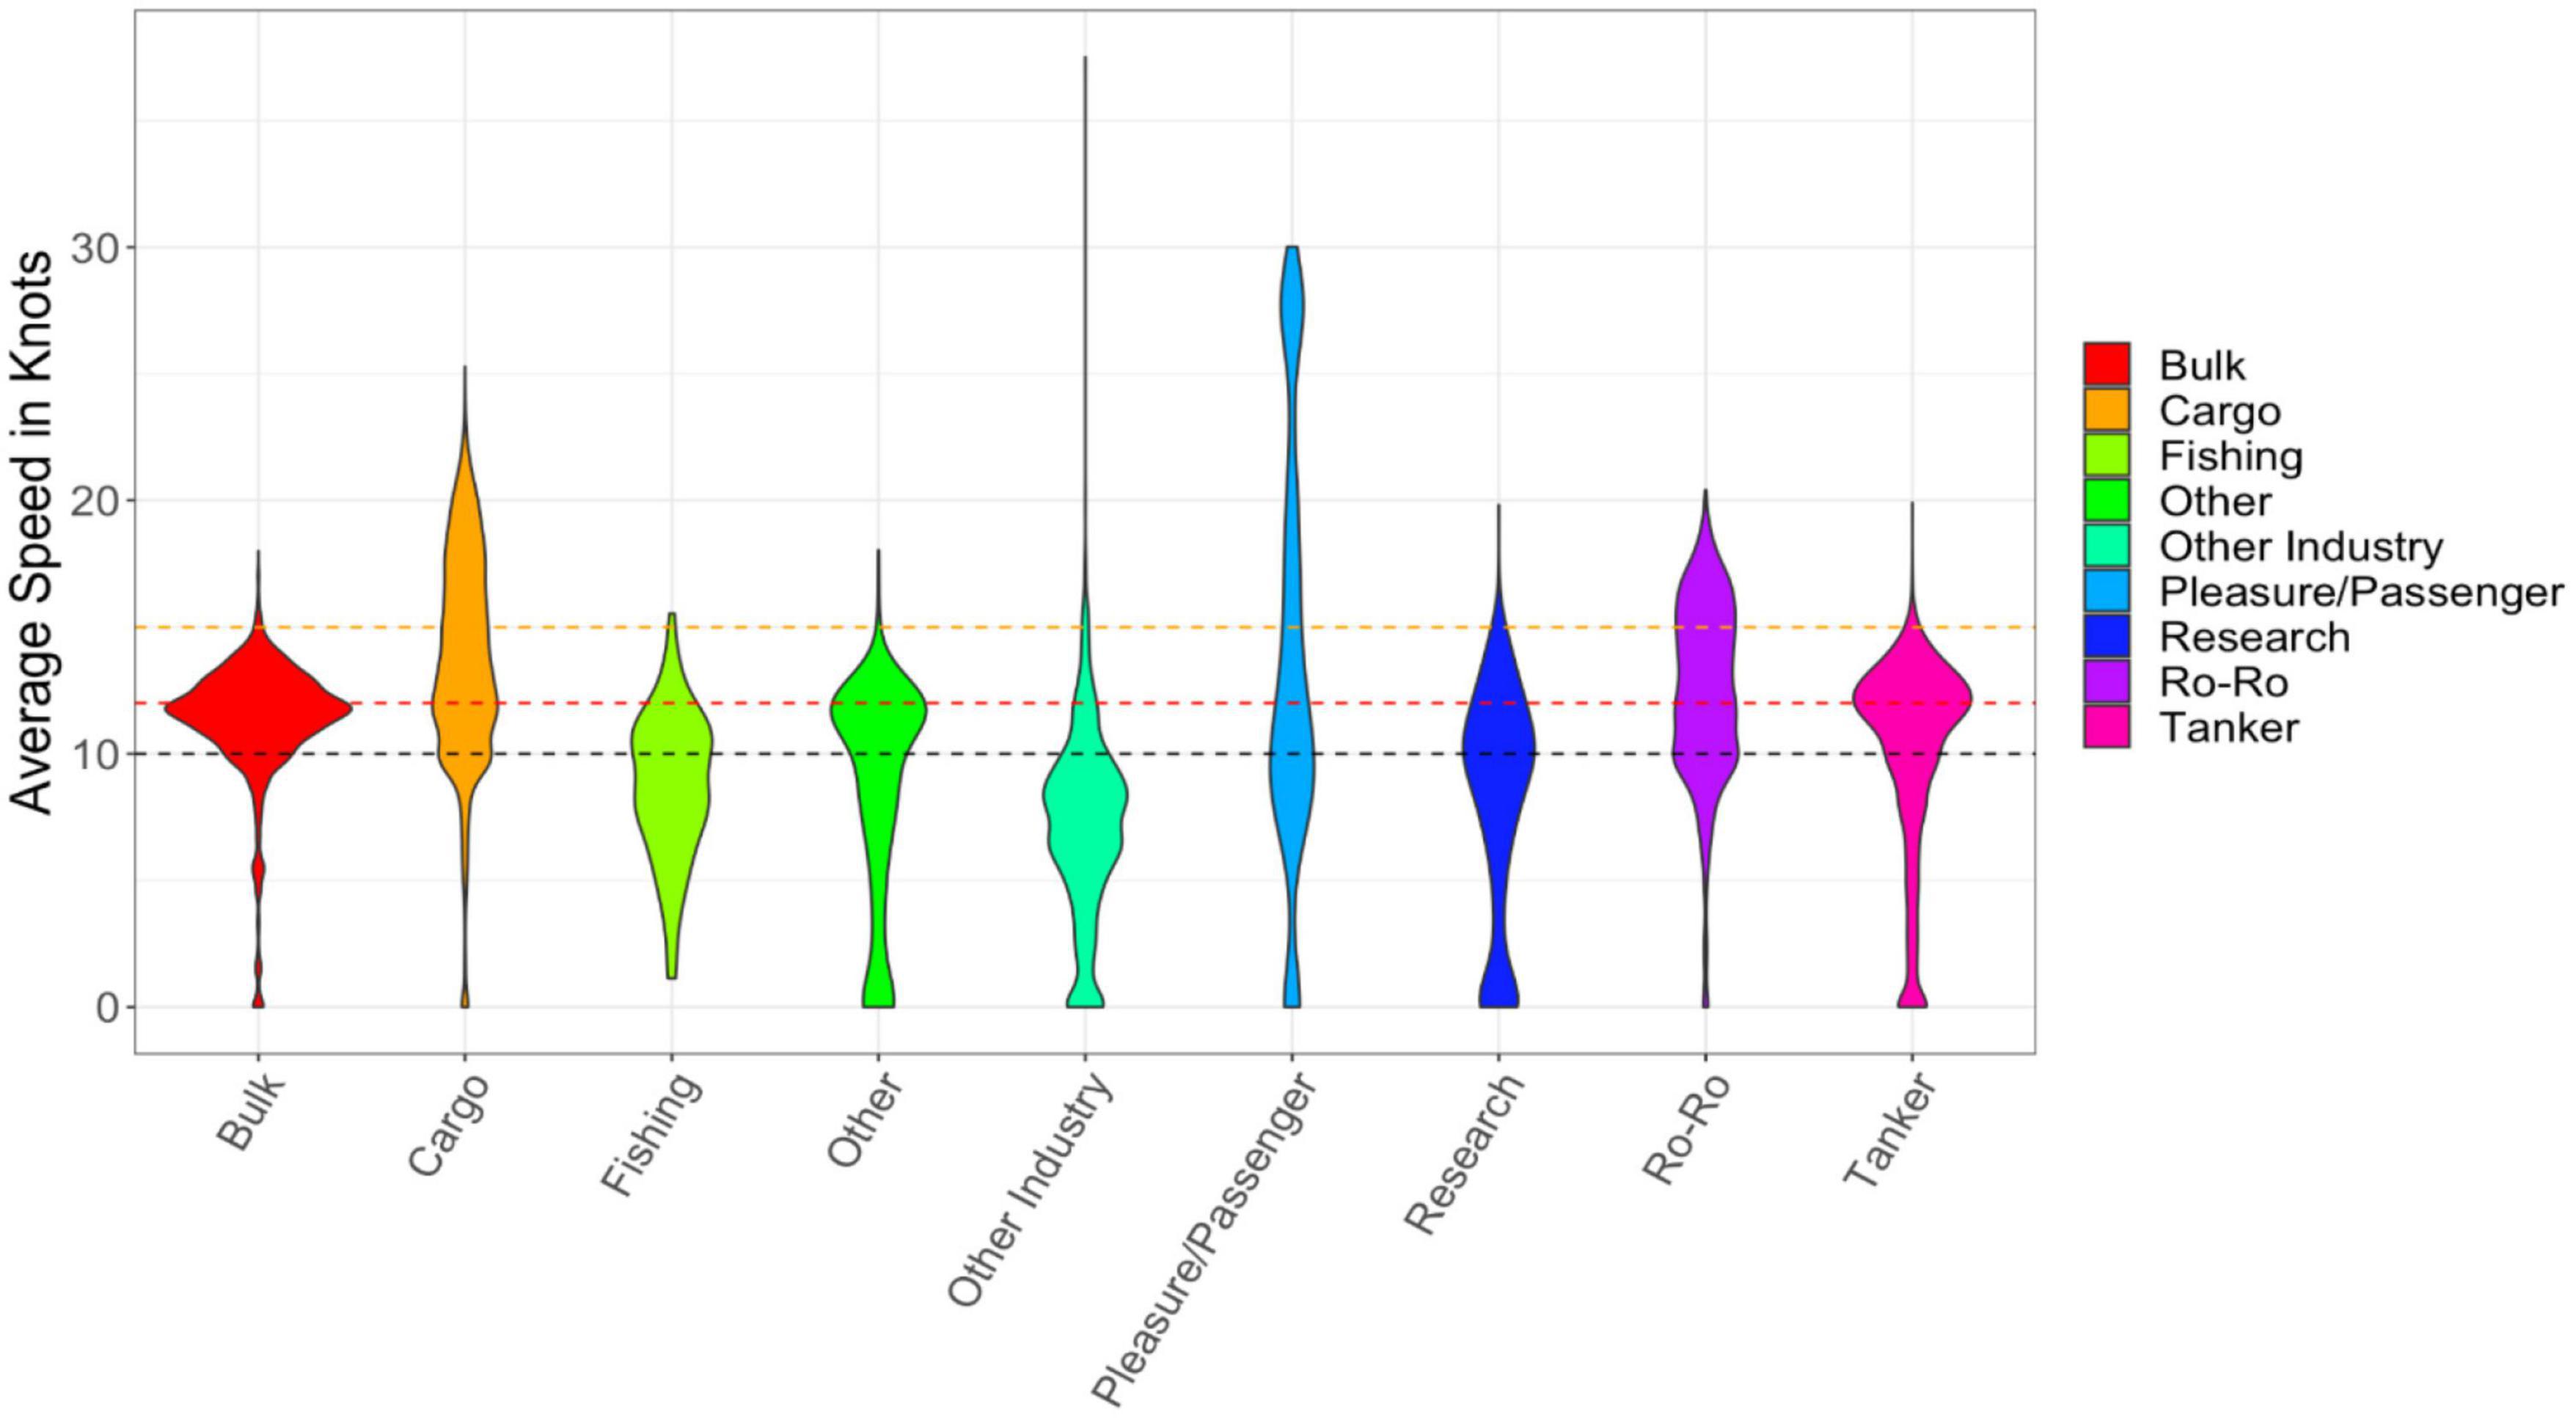
Figure 4. Average speeds of vessels ≥300 GT by vessel type, 2010 Southern California Protecting Blue Whales and Blue Skies Program VSR zones 2014, 2016–2019, shown in green. 2019. The width of the filled region of the plots is proportional to the number of transits. Black dotted line represents 10 knots, red line represents 12 knots, and yellow line represents 15 knots.
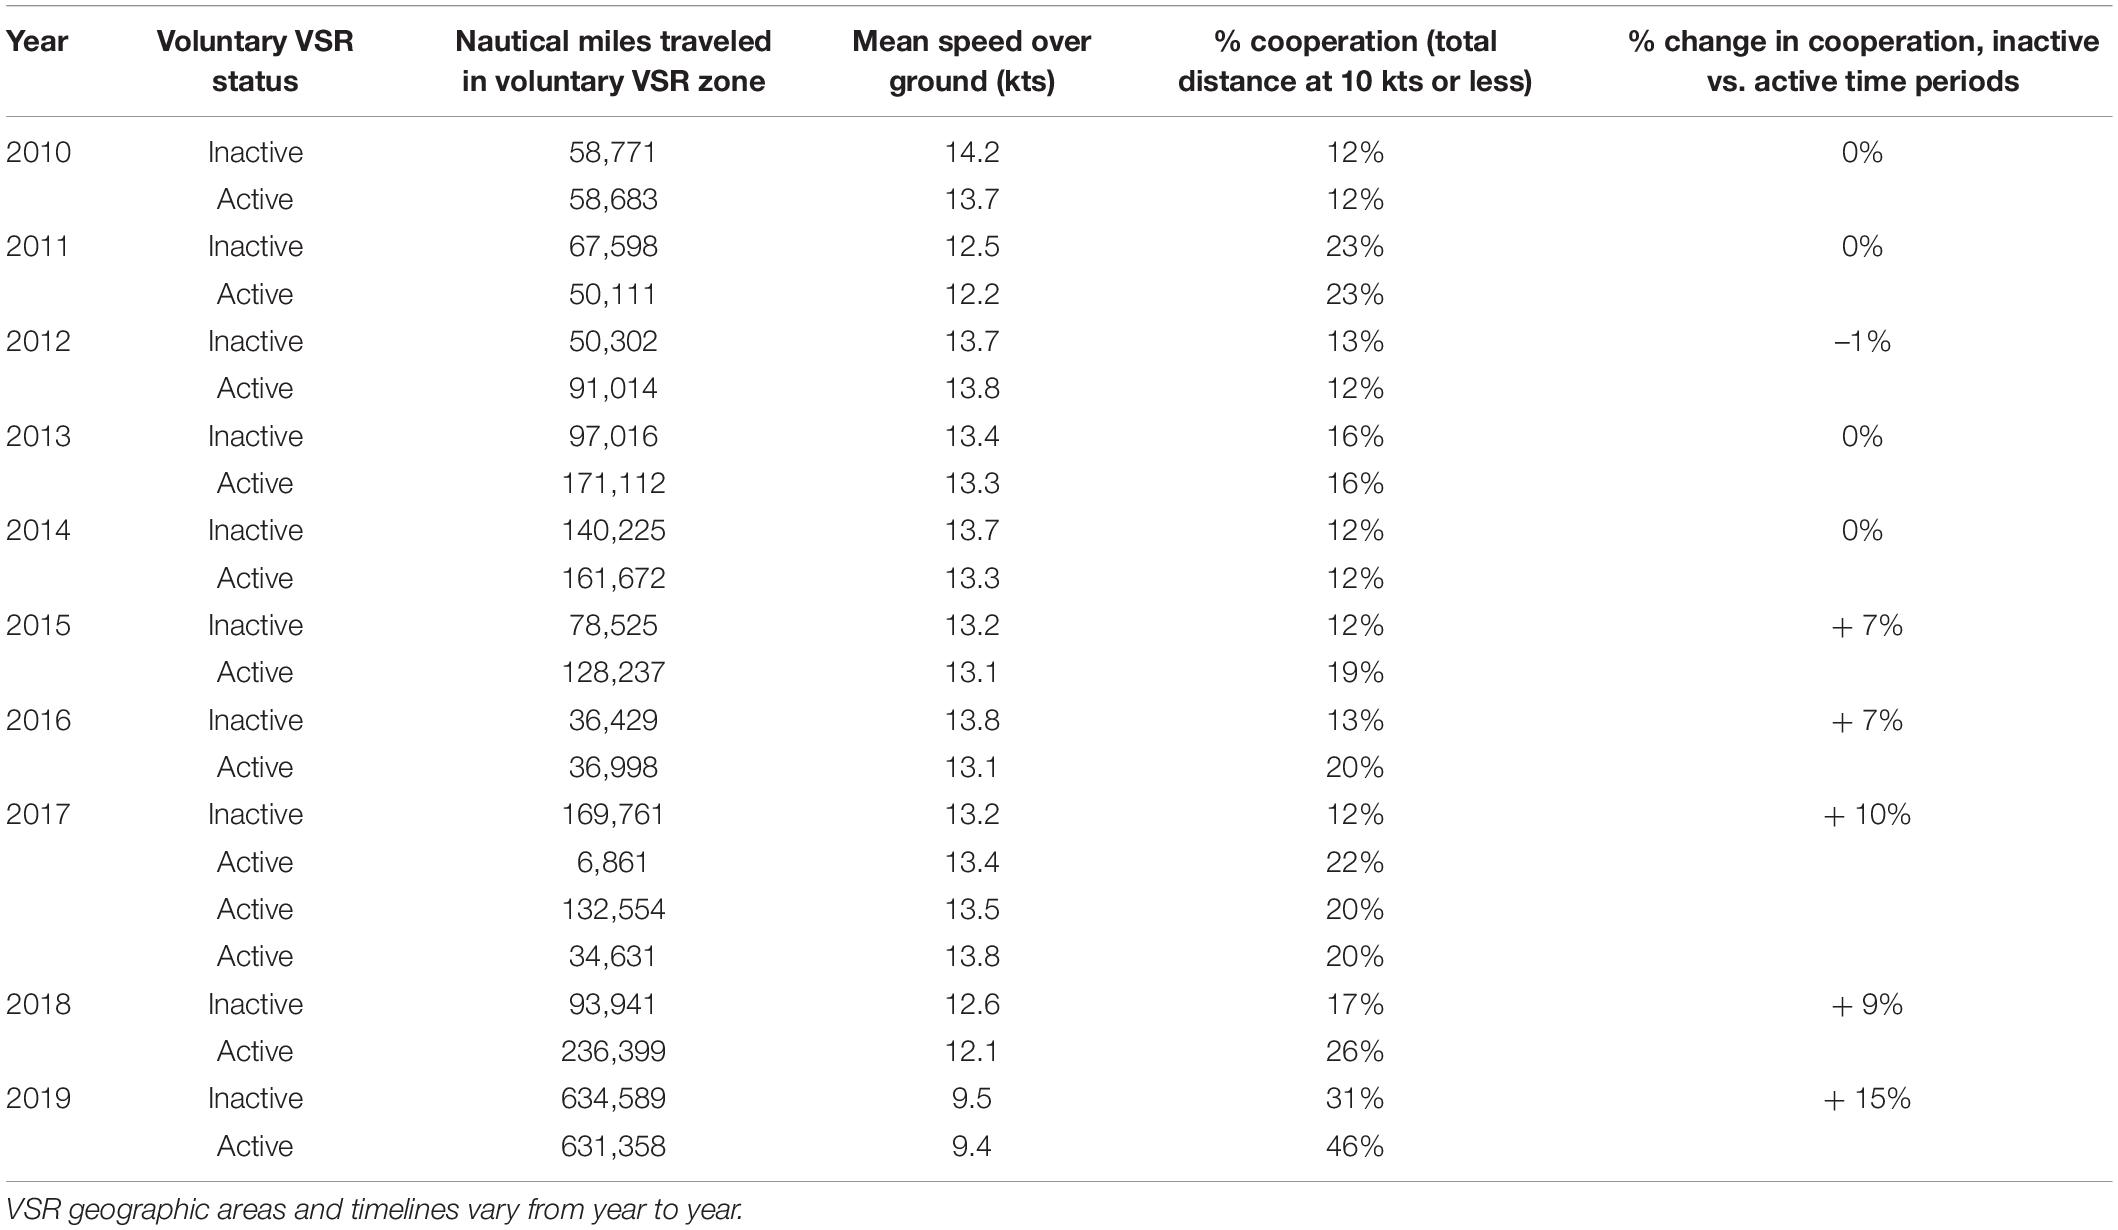
Table 2. Nautical miles traveled, mean speed over ground, and % cooperation of all vessels ≥300 GT with voluntary VSR requests across years and across active vs. inactive time periods.
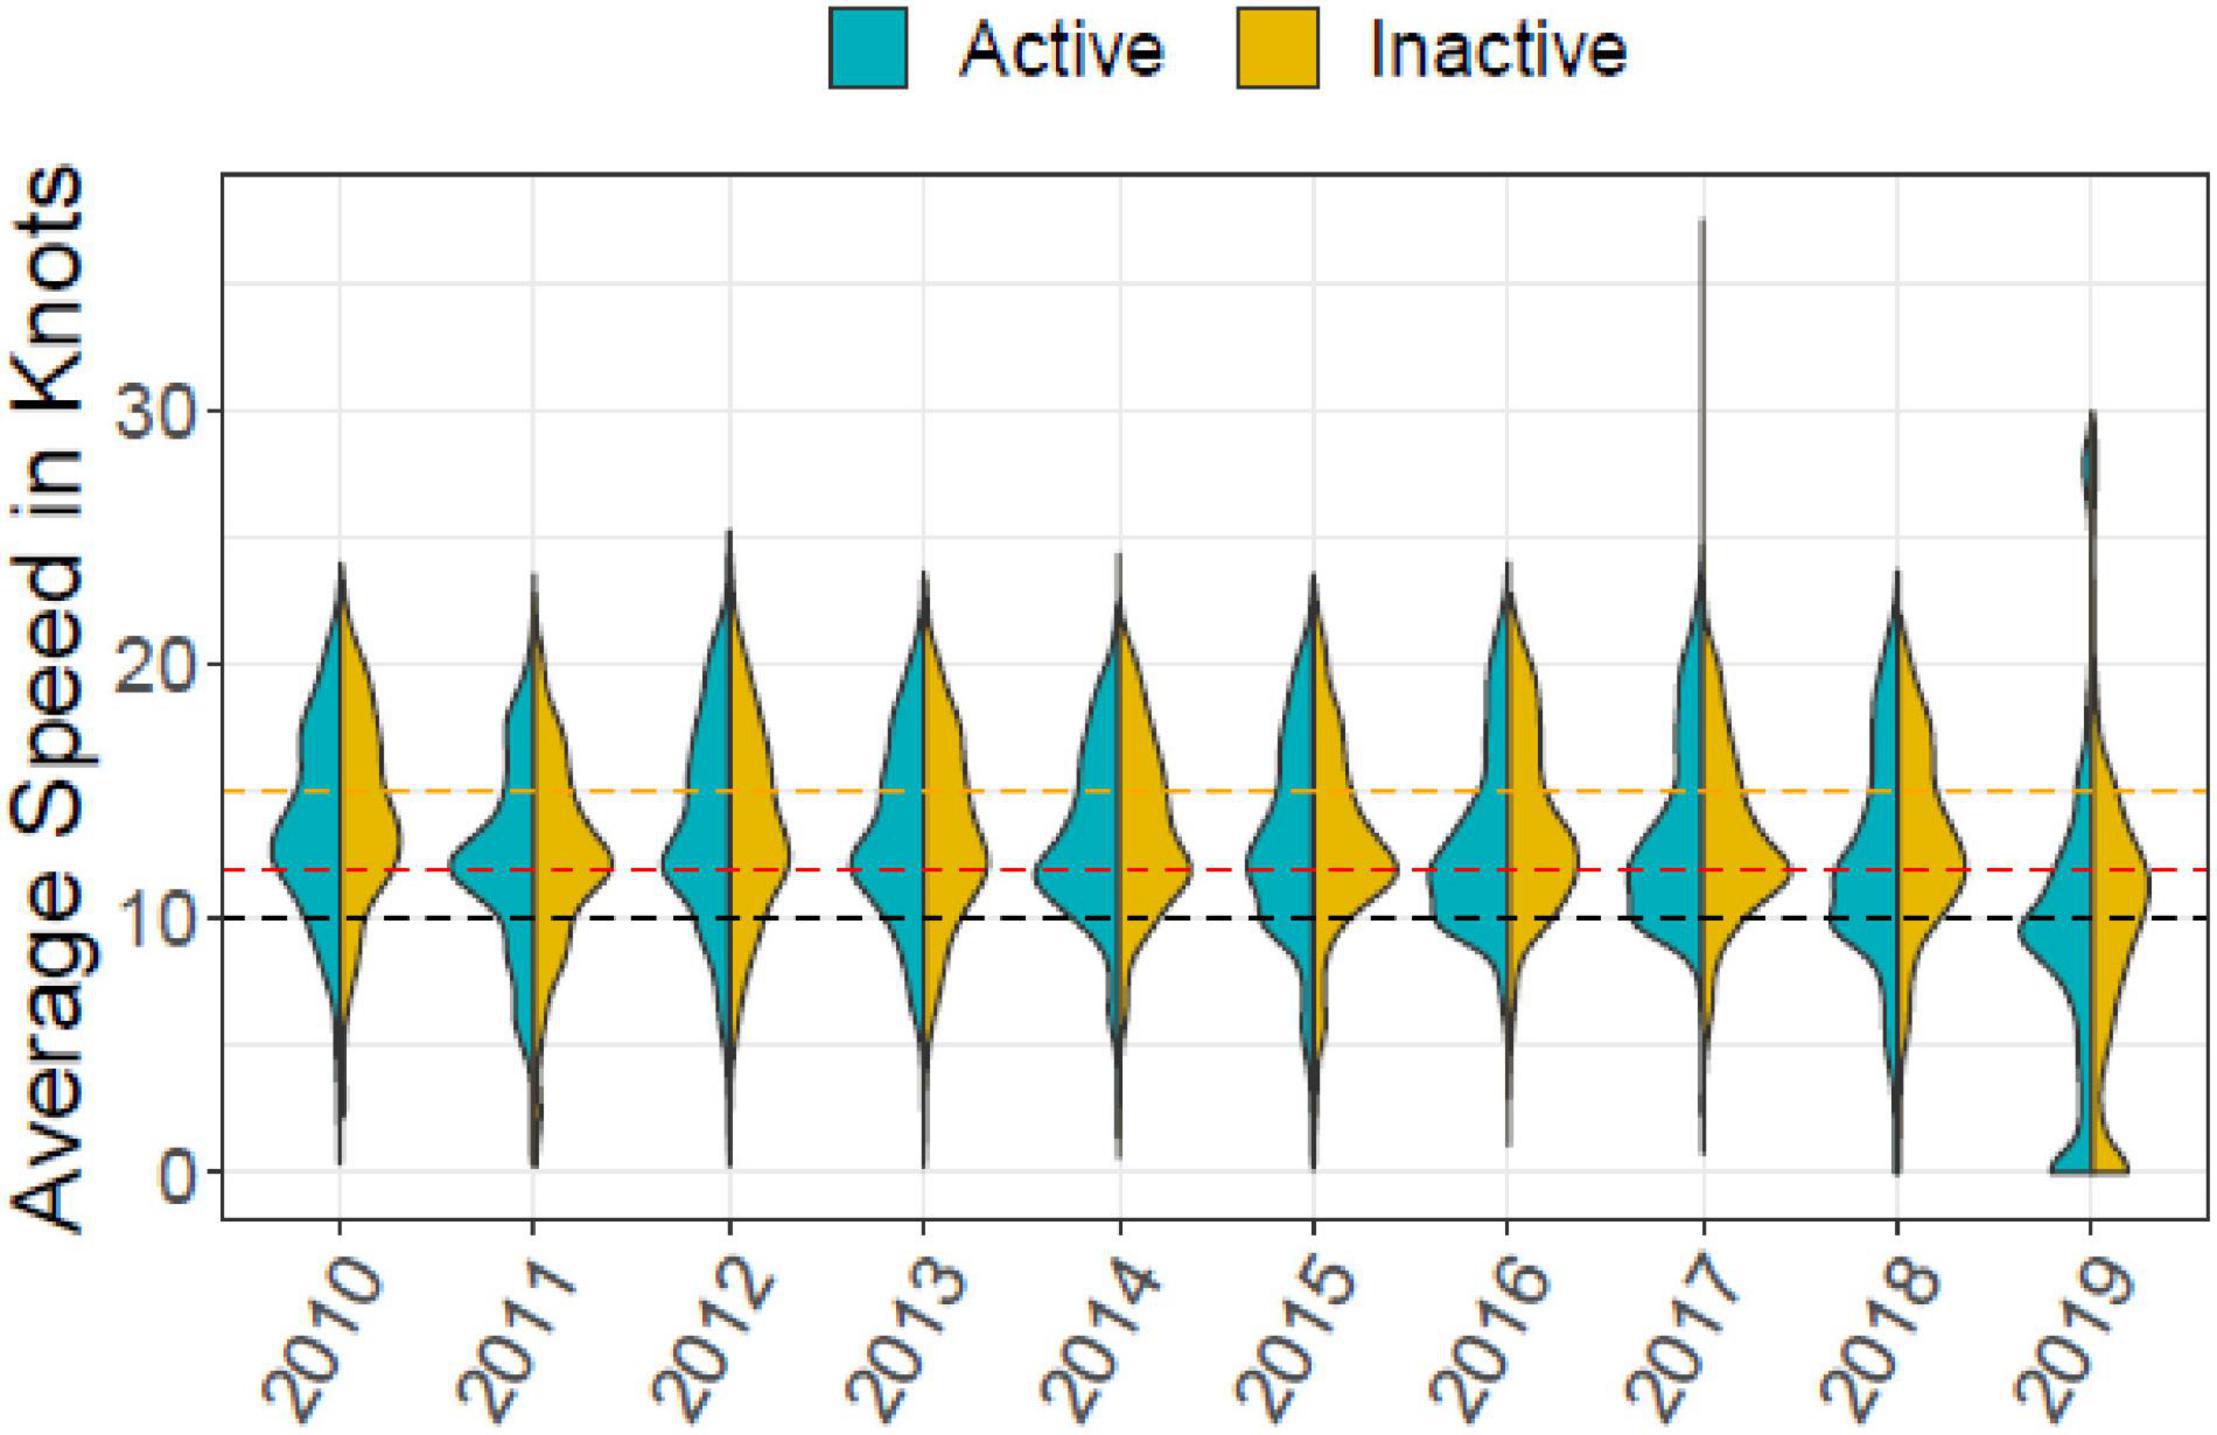
Figure 5. Average speed of transits by vessels ≥ 300 GT, by year and by VSR status (active/inactive VSR time periods), 2010–2019. The width of the filled region of the plots is proportional to the number of transits. Black dotted line represents 10 knots, red line represents 12 knots, and yellow line represents 15 knots.
Cooperation Levels With NOAA Voluntary Vessel Speed Reduction Requests in Southern California
Cooperation levels with the voluntary VSR request, as measured by the percentage of nautical miles traveled by vessels ≥ 300 GT within the VSR zones at 10 knots or less out of total nautical miles traveled within the VSR zones, ranged from 12% in 2010to 46% in 2019 (see Table 2 below). A comparison of cooperation levels across active and inactive time periods across years shows an increased change in cooperation levels in later years of the voluntary VSR (+ 10% in 2017 and + 15% in 2019) (see Table 2 and Figure 5).
Cooperation Levels With the Protecting Blue Whales and Blue Skies Program in Southern California
The container and car carrier vessels enrolled in the Incentive Program in 2018 and 2019 were responsible for 37% of total nautical miles traveled by vessels ≥ 300 GT in the southern California voluntary VSR zones in those 2 years and 79% of the nautical miles traveled by container and car carrier vessels.
The enrolled container and car carrier vessels had higher cooperation levels of 32% in 2018 and 52% in 2019 with slow speed requests compared with cooperation levels of 14% in 2018 and 28% in 2019 across vessels ≥ 300 GT that were not enrolled in the incentive effort (see Figure 6).
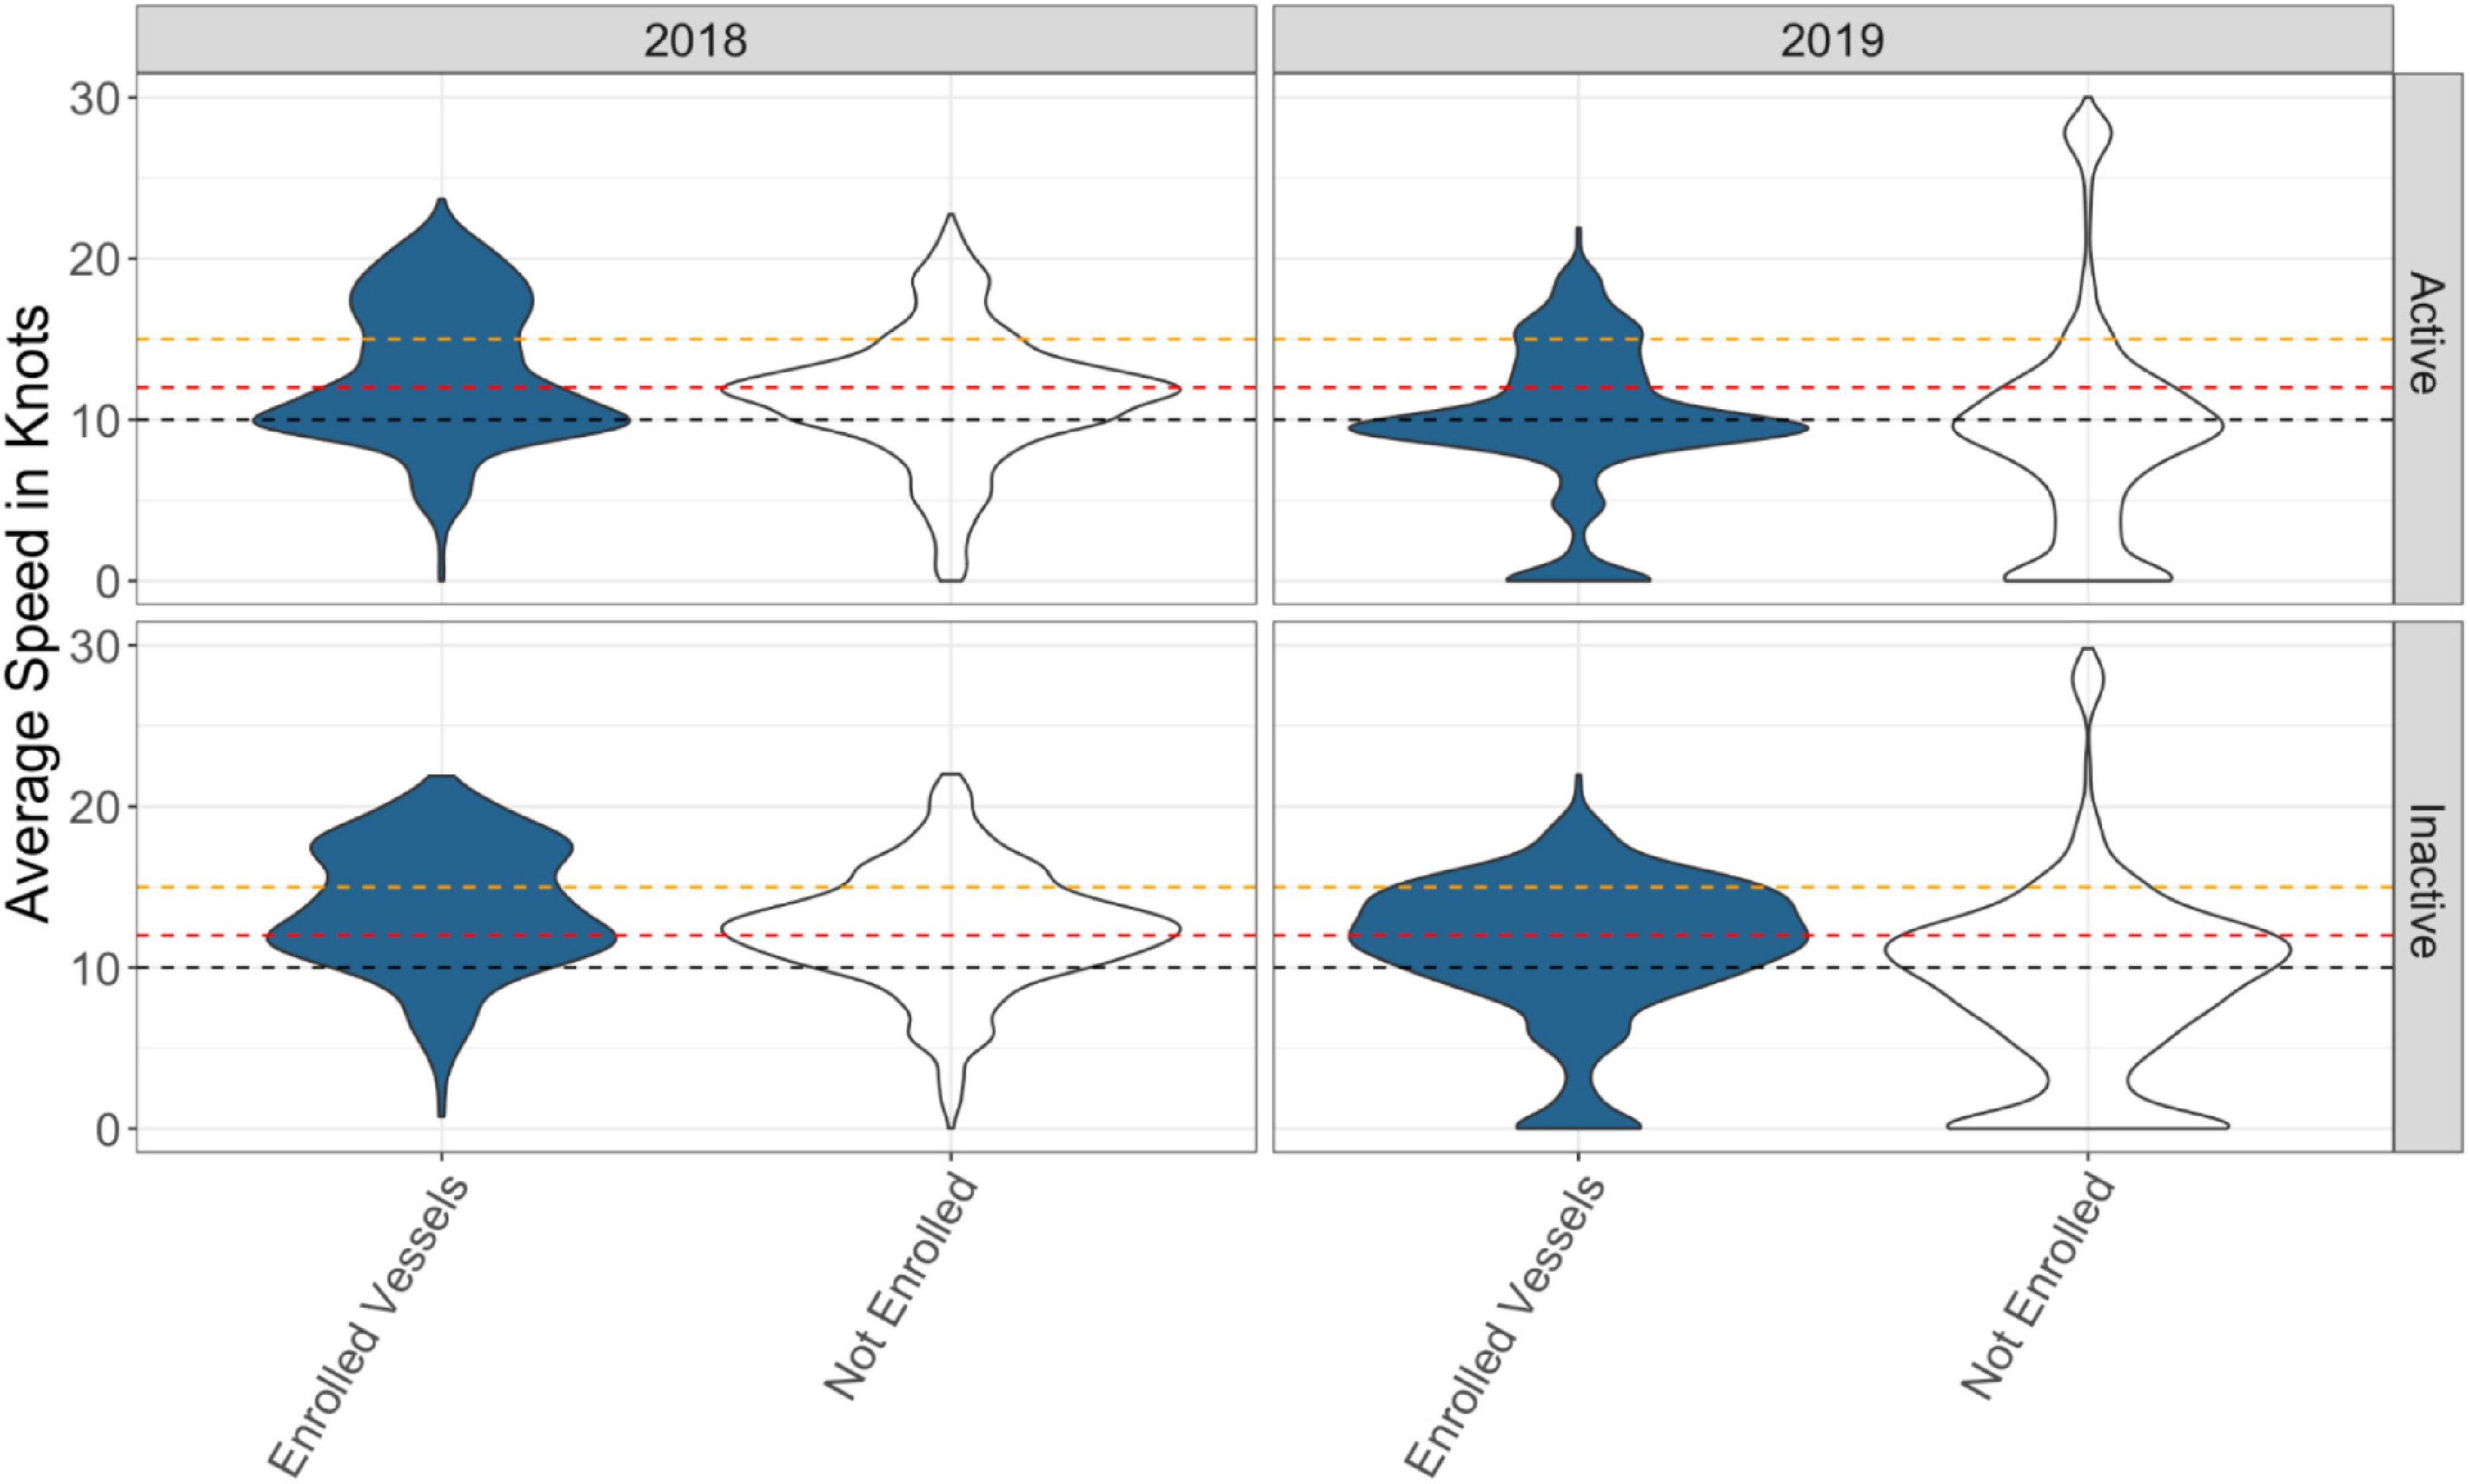
Figure 6. Average speed of transits by vessels enrolled in the Protecting Blue Whales and Blue Skies Program vs. vessels not enrolled in the program across voluntary VSR zones during 2018 and 2019 inactive and active time periods. The width of the filled region of the plots is proportional to the number of transits. Black dotted line represents 10 knots, red dotted line represents 12 knots, and yellow dotted line represents 15 knots.
When comparing active time periods and inactive time periods, vessels enrolled in the Incentive Program decreased average speeds by 0.88 knots in 2018 and 1.02 knots in 2019 during active periods, compared with decreases of 0.16 knots in 2018 and 0.38 knots in 2019 across vessels ≥ 300 GT not enrolled in the incentive effort. A comparison of cooperation levels of enrolled vessels across active and inactive time periods across 2018 and 2019 shows an increased change in cooperation across later years of the Incentive Program (+ 20% in 2018 and + 41% in 2019) (see Table 3).
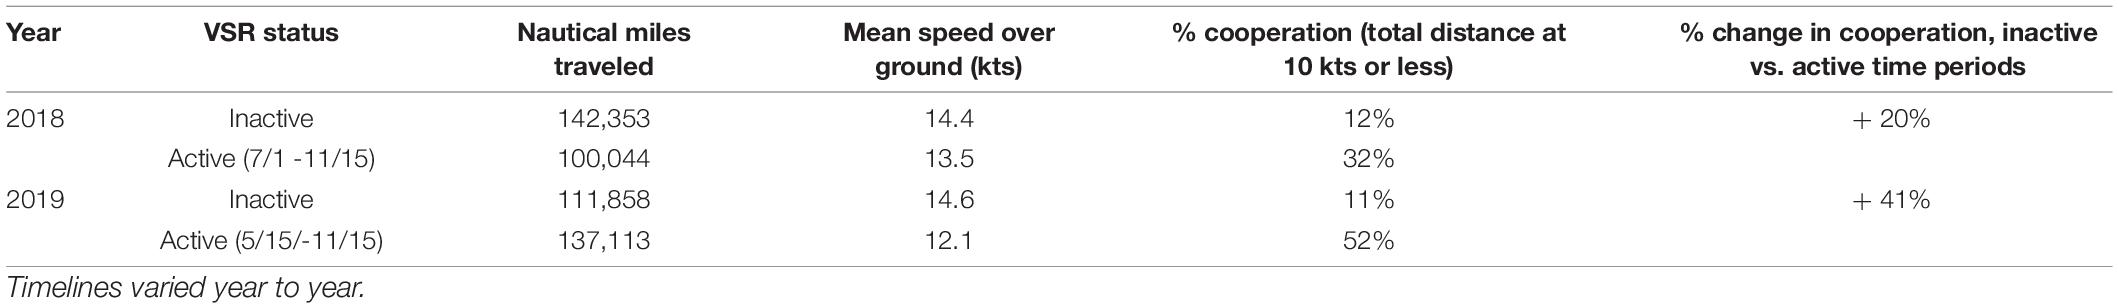
Table 3. Nautical miles traveled, mean speed over ground, and % cooperation of enrolled vessels in the Protecting Blue Whales and Blue Skies Program’s southern California VSR zones across 2018 and 2019 and across active vs. inactive time periods.
Discussion
Though voluntary VSR measures can be implemented quickly and dynamically when compared to mandatory measures, analyses have shown that voluntary VSR efforts, and particularly those without incentives, are often ineffective at achieving the desired behavior change of reducing large vessel speeds near whales (Wiley et al., 2008; Freedman et al., 2017; Vance et al., 2021).
Though cooperation levels appear to be increasing, the results from this study showed that cooperation levels with NOAA voluntary VSR requests across 2010–2019 were low, remaining under 50% across the 10 years examined. The results also showed that cooperation levels with the Protecting Blue Whales and Blue Skies Incentive Program were similarly low, at 32% in 2018 and 52% in 2019.
Because there has been a long-term downward trend in vessel speeds (Moore et al., 2018), it is difficult to attribute these cooperation levels that represent distance traveled by large vessels at slower speeds to one or both voluntary VSR requests. In addition, the evolving nature of the voluntary program, as shown in the variation of geographic areas and timelines of the VSR zones across the 10 years of implementation (see Figure 2), introduce potential spatial and temporal differences that influence vessel speeds when comparing year to year.
Given these factors—and given that a percentage of vessel traffic already travels at 10 knots or less in these areas during inactive time periods (17% in 2018 and 31% in 2019)—examining the change in cooperation levels across the inactive vs. active time periods offers a more accurate measure of adherence with the voluntary VSR requests. The change in cooperation levels recorded from inactive to active time periods (see Tables 2, 3) across both voluntary VSR efforts suggest that the Incentive Program has been more effective at achieving the desired behavior change of vessels slowing down in the VSR zones, with a + 41% change in cooperation recorded in 2019 for Incentive Program vessels compared with a + 15% change in cooperation recorded for the 2019 voluntary VSR requests.
Given that the Incentive Program offers enrolled participants positive incentives, including financial awards and positive press, the results corroborate other findings that incentive-based programs are more successful at achieving voluntary cooperation with slow speed requests than voluntary requests without incentives (see Table 1) and are a more effective measure to slow large vessel traffic (Freedman et al., 2017; Port of Los Angeles, 2019). However, unlike other incentive-based port programs, the Protecting Blue Whales and Blues Skies Program lacks a sustained source of funding, limiting the scale and viability of the initiative’s effectiveness into the future.
Conclusion
Our analysis of vessel traffic across 2010–2019 shows that cooperation levels with NOAA voluntary VSR requests were under 50%. Though a 20% increase in cooperation levels with the NOAA voluntary VSR was recorded in 2019 compared to 2018 levels—likely influenced by the increase in cooperation recorded by enrolled vessels in the Incentive Program in those years—voluntary adherence to the NOAA voluntary VSR is not reaching 80–95% cooperation levels that are estimated to be needed to reduce vessel strike mortality to levels that do not inhibit reaching and maintaining optimal sustainable whale populations (Rockwood et al., 2021).
Given that cooperation remains under 50% from large vessel traffic in the region with these voluntary VSR requests, and given the lack of sustained funding for a broader-scale incentive-based VSR program to further motivate higher levels of cooperation with ongoing voluntary VSR requests, mandatory slow speed regulations in southern California warrant consideration to further reduce vessel strike mortality of endangered whales. Research has shown that mandatory regulations in the southern California Bight may maximize benefits to whales (Redfern et al., 2019), and that costs to industry accrued by slowing down vessels in these areas are minimal (Gonyo et al., 2019).
Additional work to continue to separate vessels and whales and streamline vessel traffic patterns, such as ATBA and adjustments to Traffic Separation Schemes, are being considered and would be beneficial to supplement VSR initiatives (Redfern et al., 2019; Rockwood et al., 2021). Future measures for the region include a proposal currently in review by the IMO to expand the ATBA and extend the TSS that overlap with important blue and humpback whale feeding areas.
In addition, press and market-driven approaches that engage the corporate retail sector, particularly customers of the vessel operators in the region, hold promise to further motivate vessels to increase cooperation with VSR efforts. Corporate social responsibility is an increasingly popular and effective means to achieve conservation, and worth further consideration to promote vibrant maritime commerce that is respectful of the ocean environment.
Data Availability Statement
The datasets presented in this article are not readily available because of data sharing restrictions per agreement with private data providers. However, the corresponding author can share access to free sources of AIS data covering the full study area and timeline. Requests to access the datasets should be directed to corresponding author.
Author Contributions
SH, JM, JW, and AR conceptualized and administered the study. JW provided project funding. JA and JM acquired, queried, and processed the data. RF and JM analyzed the data. JM, RF, and SH led the investigation of the data and writing of the original draft. JM, RF, JA, JW, AR, and SH contributed to approved the final draft. All authors contributed to the article and approved the submitted version.
Funding
This work was funded by the Nature Conservancy and the California Marine Sanctuary Foundation.
Conflict of Interest
The authors declare that the research was conducted in the absence of any commercial or financial relationships that could be construed as a potential conflict of interest.
Publisher’s Note
All claims expressed in this article are solely those of the authors and do not necessarily represent those of their affiliated organizations, or those of the publisher, the editors and the reviewers. Any product that may be evaluated in this article, or claim that may be made by its manufacturer, is not guaranteed or endorsed by the publisher.
Acknowledgments
We wish to thank Jen Dillon and Ed Page from the Marine Exchange of Alaska for their assistance in acquiring west coast historical AIS data. We thank to Rose Muller and Bruce Anderson and to Starcrest LLC for assisting with data analysis for 2010–2017. We also wish to thank Elizabeth Becker from NOAA National Marine Fisheries Service Southwest Fisheries Science Center for contributing whale density prediction maps for the included figures as well as Lauren Saez, Justin Greenman, and Lauren Demaio from NOAA National Marine Fisheries Service Protected Resources Division for providing whale strandings data. We also would like to thank Kip Louttit from the Marine Exchange of Southern California for providing data and invaluable insight on vessel traffic patterns in southern California. We lastly wish to thank Jaime Jahnke and Cotton Rockwood from Point Blue Conservation Science, Chris Mobley from Channel Islands National Marine Sanctuary, Michael Carver from Cordell Bank National Marine Sanctuary, and Eric Patterson, Penny Ruvelas, Caroline Good, and Shannon Bettridge from NOAA National Marine Fisheries Service for their careful review and helpful input on this work.
References
Abrahms, B., Hazen, E. L., Aikens, E. O., Savoca, M. S., Goldbogen, J. A., Bograd, S. J., et al. (2019). Memory and resource tracking drive blue whale migrations. Proc. Natl. Acad. Sci. 116, 5582–5587.
Becker, E. A., Forney, K. A., Miller, D. L., Fiedler, P. C., Barlow, J., and Moore, J. E. (2020). Habitat-Based Density Estimates for Cetaceans in the California Current Ecosystem based on 1991-2018 Survey Data, U.S. Department of Commerce, NOAA Technical Memorandum NMFS-SWFSC-638. Washington, DC: NOAA.
Becker, E. A., Forney, K. A., Thayre, B. J., Debich, A., Campbell, G. S., Whitaker, K., et al. (2017). Habitat-based density models for three cetacean species off Southern California illustrate pronounced seasonal differences. Front. Mar. Sci. 4:121. doi: 10.3389/fmars.2017.00121
Berman-Kowalewski, M., Gulland, F., Wilkin, S., Calambokidis, J., Mate, B., Cordaro, J., et al. (2010). Association Between Blue Whale (Balaenoptera musculus) Mortality and and Ship Strikes Along the California Coast. Aquat. Mamm. 36, 59–66. doi: 10.1578/AM.36.1.2010.59
Calambokidis, J., Steiger, G. H., Curtice, C., Harrison, J., Ferguson, M. C., Becker, E., et al. (2015). Biologically important areas for selected cetaceans within U.S. Waters – West Coast Region. Aquat. Mamm. 41, 39–53. doi: 10.1578/AM.4112015.39
Carretta, J. V., Forney, K. A., Oleson, E. M., Weller, D. W., Lang, A. R., Baker, J., et al. (2020). U.S. Pacific Marine Mammal Stock Assessments: 2019. Washington, D.C.: NOAA technical memorandum NOAA-TM-NMFS-SWFSC-629.
Carretta, J. V., Muto, M. M., Wilkin, S., Greenman, J., et al. (2016). Sources of Human-Related Injury and Mortality for U.S. Pacific West Coast Marine Mammal Stock Assessments, 2010-2014. Washington, D.C.: NOAA Tech Memo NMFS-SWFSC-601Google Scholar
Chion, C., Turgeon, S., Cantin, G., Michaud, R., MeÂnard, N., Lesage, V., et al. (2018). A voluntary conservation agreement reduces the risks of lethal collisions between ships and whales in the St. Lawrence Estuary (QueÂbec, Canada): from co-construction to monitoring compliance and assessing effectiveness. PLoS One 13:e0202560. doi: 10.1371/journal
Clapham, P. J., Young, S. B., and Brownell, R. L. Jr. (1999). Baleen whales: conservation issues and the status of the most endangered populations. Mamm. Rev. 29, 37–60. doi: 10.1046/j.1365-2907.1999.00035.x
De Vos, A., Brownell, R., Tershy, B., and Croll, D. (2016). Anthropogenic Threats and Conservation Needs of Blue Whales, Balaenoptera musculus indica, around Sri Lanka. J. Mar. Biol. 2016, 1-12. doi: 10.1155/2016/8420846
Dransfield, A., Hines, E., Mcgowan, J., Holzman, B., Nur, N., Elliott, M., et al. (2014). Where the whales are: using habitat modeling to support changes in shipping regulations within National Marine Sanctuaries in Central California. Endanger. Species Res. 26, 39–57. doi: 10.3354/esr00627
Freedman, R., Herron, S., Byrd, M., Birney, K., Morten, J., Shafritz, B., et al. (2017). The effectiveness of incentivized and non-incentivized vessel speed reduction programs: case study in the Santa Barbara channel. Ocean Coast. Manage. 148, 31–39. doi: 10.1016/j.ocecoaman.2017.07.013
Gassmann, M., Wiggins, S., and Hildebrand, J. (2017). Deep-water measurements of container ship radiated noise signatures and directionality. J. Acoust. Soc. Am. 142, 1563–1574.
Gonyo, S., Goedeke, T., Wolfe, K., Jeffrey, C., Gorstein, M., Poti, M., et al. (2019). An economic analysis of shipping costs related to potential changes in vessel operating procedures to manage the co-occurrence of maritime vessel traffic and whales in the Channel Islands region. Ocean Coast. Manage. 177, 179–187. doi: 10.1016/j.ocecoaman.2019.04.024
Guzman, H., Hinojosa, N., and Kaiser, S. (2020). Ship’s compliance with a traffic separation scheme and speed limit in the Gulf of Panama and implications for the risk to humpback whales. Mar. Pol. 120:104113. doi: 10.1016/j.marpol.2020.104113
Irvine, L. M., Mate, B. R., Winsor, M. H., Palacios, D. M., Bograd, S. J., et al. (2014). Spatial and temporal occurrence of blue whales off the U.S. west coast, with implications for management. PLoS One 9:e109485. doi: 10.1371/journal.pone.0102959
Iwc-Accobams (2012). Report of the Joint IWC-ACCOBAMS Workshop on Reducing Risk of Collisions between Vessels and Cetaceans. IWC/63/CC 8 - Agenda item 4.1. Available online at https://www.ascobans.org/sites/default/files/document/AC18_5-08_IWC-ACCOBAMS_ShipStrikesWorkshop_1.pdf
Joy, R., Tollit, D., Wood, J., MacGillivray, A., Li, Z., Trounce, K., et al. (2019). Potential Benefits of Vessel Slowdowns on Endangered Southern Resident Killer Whales. Front. Mar. Sci. 6:344. doi: 10.3389/fmars.2019.00344
Lagueux, K. M., Zani, M. A., Knowlton, A. R., and Kraus, S. D. (2011). Response by vessel operators to protection measures for right whales Eubalaena glacialis in the southeast U.S. calving ground. Endanger. Spec. Res. 14, 69–77.
Laist, D., Knowlton, A., and Pendleton, D. (2014). Effectiveness of Mandatory Vessel Speed Limits for Protecting North Atlantic Right Whales. Endanger. Spec. Res. 23, 133–147.
Laist, D., and Knowlton, Mead, Collet, and Podesta. (2001). Collisions between ships and whales. Mar. Mamm. Sci. 17, 35–75.
Lindstad, E., Asbjørnslett, B., and Strømman, A. (2011). Reductions in greenhouse gas emissions and cost by shipping at lower speeds. Energy Pol. 39, 3456–3464. doi: 10.1016/j.enpol.2011.03.044
Marine Exchange of Southern California (2020). Arrivals to and Departures from the Ports of Los Angeles and Long Beach.San Pedro: Marine Exchange of Southern California
Mckenna, M., Katz, S., Condit, C., and Walbridge, S. (2012). Response of Commercial Ships to a Voluntary Speed Reduction Measure: are Voluntary Strategies Adequate for Mitigating Ship-Strike Risk? Coast. Manage. 40, 634–650.
McKenna, M., Soldevilla, M., Oleson, E., Wiggins, S., and Hildebrand, J. (2009). “Increased Underwater Noise Levels in the Santa Barbara Channel from Commercial Ship Traffic and its Potential Impact on Blue Whales (Balaenoptera musculus),” in Proceedings of the 7th California Islands Symposium, (Arcata: Institute for Wildlife Studies).
Moore, T., Redfern, J., Carver, M., Hastings, S., Adams, J., and Silber, G. (2018). Exploring ship traffic variability off California. Ocean Coast. Manag. 163, 515–527. doi: 10.1016/j.ocecoaman.2018.03.010
NOAA National Marine Fisheries Service (2019). NOAA West Coast Large Whale Strandings Database 2019.Washington D.C: National Oceanic and Atmospheric Administration
NOAA National Marine Fisheries Service (2020). North Atlantic Right Whale Vessel Speed Rule Assessment.Washington D.C: NOAA.
Pace, R. M., Williams, R., Kraus, S. D., Knowlton, A. R., and Pettis, H. M. (2021). Cryptic mortality of north atlantic right whales. Conserv. Sci. Pract. 3:e346. doi: 10.1111/csp2.346
Panigada, S., Pesante, G., Zanardelli, M., Capoulade, F., Gannier, A., and Weinrich, M. T. (2006). Mediterranean fin whales at risk from fatal ship strikes. Mar. Pollut. Bull. 52, 1287–1298. doi: 10.1016/j.marpolbul.2006.03.014
Peel, D., Smith, J. N., and Childerhouse, S. (2018). Vessel strike of whales in Australia: the challenges of analysis of historical incident data. Front. Mar. Sci. 5:69. doi: 10.3389/fmars.2018.00069
Port of Long Beach (2019). 2019 Annual Green Flag Incentive Program Operator Compliance Monthly Report. https://polb.com/business/incentives#green-flag-program (accessed December 20, 2020).
Port of Los Angeles (2019). Vessel Speed Reduction Program Operator Summary Report. https://kentico.portoflosangeles.org/getmedia/f899bdf1-4e15-419e-8ec3-2d024c6f75f1/2019_VSR_Counts_POLA (accessed December 20, 2020).
Redfern, J., Mckenna, M., Moore, T., Calambokidis, C., Deangelis, M., Becker, E., et al. (2013). Assessing the Risk of Ships Striking Large Whales in Marine Spatial Planning. Conservat. Biol. 27, 292–302.
Redfern, J., Moore, T., Becker, E., et al. (2019). Evaluating stakeholder-derived strategies to reduce the risk of ships striking whales. Divers Distrib. 2019, 1575–1585. doi: 10.1111/ddi.12958
Reisdorf, A. G., Bux, R., Wyler, D., Benecke, M., Klug, C., et al. (2012). Float, explode or sink: postmortem fate of lung-breathing marine vertebrates. Palaeobiodivers. Palaeoenviron. 92, 67–81. doi: 10.1007/s12549-011-0067-z
Rockwood, C., Adams, J., Hastings, S., Morten, J., and Jahncke, J. (2021). Modeling whale deaths from ship strikes to reduce the risk of fatality to endangered whales. Front. Mar. Sci. 8:649890. doi: 10.3389/fmars.2021.649890
Rockwood, R., Adams, J., Silber, G., and Jahncke, J. (2020). Estimating effectiveness of speed reduction measures for decreasing whale-strike mortality in a high-risk region. Endanger. Species Res. 43, 145–166. doi: 10.3354/esr01056
Rockwood, C., Calambokidis, J., and Jahncke, J. (2017). High mortality of blue, humpback and fin whales from modeling of vessel collisions on the U.S. West Coast suggests population impacts and insufficient protection. PLoS One 12:e0183052. doi: 10.1371/journal.pone.0183052
Santa Barbara County Air Pollution Control District (2019). Protecting Blue Whales and Blue Skies 2019 Results. https://www.ourair.org/air-pollution-marine-shipping/ (accessed June 1, 2020).
Schoeman, R. P., Patterson-Abrolat, C., and Plön, S. (2020). A global review of vessel collisions with marine animals. Front. Mar. Sci. 7:292. doi: 10.3389/fmars.2020.00292
Silber, G., Adams, J., and Fonnesbeck, C. (2014). Compliance with Vessel Speed Restrictions to Protect North Atlantic Right Whales. PeerJ. 2: e399.
Silber, G. K., and Bettridge, S. (2010). Vessel Operations in Right Whale Protection Areas in 2009. U.S. Dep. Commer. Washington D.C: NOAA
Silber, G. K., Vanderlaan, A. S. M., Tejedor Arceredillo, A., Johnson, L., Taggart, C. T., Brown, M. W., et al. (2012). The role of the International maritime organization in reducing vessel threat to whales: process, options, action and effectiveness. Mar. Pol. 36, 1221–1233. doi: 10.1016/j.marpol.2012.03.008
van der Hoop, J. M., Vanderlaan, A. S. M., Cole, T. V. N., Henry, A. G., Hall, L., Mase-Guthrie, B., et al. (2015). Vessel strikes to large whales before and after the 2008 ship strike rule. Conserv. Lett. 8, 24–32. doi: 10.1111/conl.12105
Vance, A., Elmslie, K., and McIver, R. (2021). The Edge of Extinction. Protecting North Atlantic Right Whales. Oceana Can. doi: 10.5281/zenodo.4549293
Vancouver Frasier Port Authority (2019). Annual ECHO Program Report. https://www.portvancouver.com/wp-content/uploads/2020/06/ECHO-Program-2019-Annual-Report.pdf (accessed December 20, 2020).
Vanderlaan, A. S. M., and Taggart, C. T. (2009). Efficacy of a voluntary area to be avoided to reduce risk of lethal vessel strikes to endangered whales. Conserv. Biol. 23, 1467–1474. doi: 10.1111/j.1523-1739.2009.01329.x
Keywords: vessel strikes, ship strikes, blue whale, humpback whale, fin whale, Vessel Speed Reduction, AIS, shipping
Citation: Morten J, Freedman R, Adams JD, Wilson J, Rubinstein A and Hastings S (2022) Evaluating Adherence With Voluntary Slow Speed Initiatives to Protect Endangered Whales. Front. Mar. Sci. 9:833206. doi: 10.3389/fmars.2022.833206
Received: 10 December 2021; Accepted: 19 January 2022;
Published: 15 February 2022.
Edited by:
Ellen Hines, San Francisco State University, United StatesReviewed by:
Ladd M. Irvine, Oregon State University, United StatesAldo S. Pacheco, National University of San Marcos, Peru
Copyright © 2022 Morten, Freedman, Adams, Wilson, Rubinstein and Hastings. This is an open-access article distributed under the terms of the Creative Commons Attribution License (CC BY). The use, distribution or reproduction in other forums is permitted, provided the original author(s) and the copyright owner(s) are credited and that the original publication in this journal is cited, in accordance with accepted academic practice. No use, distribution or reproduction is permitted which does not comply with these terms.
*Correspondence: Jessica Morten, amVzc2ljYS5tb3J0ZW5Abm9hYS5nb3Y=