 Sabrina Sayers
 Ruth Reef
- School of Earth, Atmosphere and Environment, Monash University, Clayton, VIC, Australia
The promotion of sedimentation by mangrove ecosystems with adequate sediment supply has been well documented. However, predicting the amount of accretion or erosion at a specific point, is difficult due to the inherent stochasticity of sediment movement and deposition. Forcings which have been thought to influence short-term sedimentation rates, such as the amount of suspended matter in the incoming water, the wave regime at the site, elevation above sea level, distance from the low tide mark, and vegetation density, were investigated using large arrays of erosion pins at five sites around Western Port, Victoria over the course of one and a half years. We analyzed large scale/short-term and small-scale/longer-term vertical displacement within and between sites, and quantified small-scale intra-site variability. Results show, that while all study sites within Western Port were accreting sediment, they were not doing so at the same rate, and both intra-site and inter-site variability is high. Short-term large-scale or site wide analysis shows that total suspended matter and significant wave height (SWH) did not significantly affect vertical displacement rates. Surprisingly, neither distance from water nor vegetation density significantly affected vertical displacement or explain the spatial distribution of accretion and erosion within the sites. The coefficient of variation at each pin shows that there is high temporal variability in vertical displacement at each location, with individual pins alternating between erosion and accretion over time. Our study finds that while large scale (1 km2) patterns of sedimentation are temporally consistent, small scale patterns (< 100 m2) are difficult to predict. This small-scale stochasticity therefore compounds management of mangrove ecosystems, especially as it relates to predicting the response to sea level rise. Thus, investment in small scale management of vegetation density, or microtopography, is perhaps not required for overall shoreline stability with sea level rise and blue carbon accumulation, making ecosystem restoration more feasible where resources are limited. However, at larger, forest-wide, spatial scales a higher level of predictability exists such as the overall response of the coastal tract to prevalent wave energy and sediment supply.
Introduction
Mangroves have developed morphological adaptations to the dynamic intertidal environments in which they exist. Specific adaptations such as extensive above ground root systems, vary among species and climate zones. These large root systems are known to affect the geomorphology of the coastlines along which they establish. For example, the root systems interact with incoming water by inducing drag forces and decreasing the velocity of the water that is in contact with vegetation, thus promoting the settling of allochthonous suspended sediment (Ellison, 2019).
The ability of coastal vegetation, including mangroves and salt marshes, to promote the settling of sediment through the reduction of flow velocities has been well studied (Furukawa and Wolanski, 1996; Reed et al., 1999; Moskalski and Sommerfield, 2012; Nolte et al., 2013; Sheehan and Ellison, 2015; Horstman et al., 2018). This bio-geomorphic function has become more important as of late because of the imminent threat to global coasts as a result of sea level rise due to climate change. This has led to an increase in research and government backed management schemes to employ nature-based solutions to coastal protection (Saleh and Weinstein, 2016). Some of these schemes fail because of improper planning and the deficit that exists in understanding the complexities of the biophysical interactions that determine sedimentation. The ability of mangroves to influence sedimentation depends on various parameters such as the availability of sediment, distance from sediment supply, prevailing hydrodynamics including wave climate, topography, and vegetation structure. These variables and their interactions affect the spatial and temporal distribution of sediment within vegetated coasts (Van Proosdij et al., 2006). The complexity of this physical environment operates at a range of spatial and temporal scales, thereby resulting in highly stochastic behavior.
Root system geometry of various species such as buttress roots, aerial roots, prop roots, and pneumatophores, each affect flow and sedimentation differently (Furukawa and Wolanski, 1996; Krauss et al., 2003; Krauss et al., 2014; Du et al., 2021). Other vegetation characteristics such as root and tree density affect vegetation induced drag. Pneumatophore density has been shown to be positively correlated to the dissipation of turbulent kinetic energy (Norris et al., 2017). The influence of vegetation elements on energy dissipation and therefore sediment transport, has been shown to occur in two modes. One showing that vegetation can increase drag to result in flow reduction thereby preventing sediment resuspension and promoting sedimentation (Horstman et al., 2018). In other areas of sparser pneumatophores, the generated turbulence can cause the resuspension of sediment within this zone (Mullarney et al., 2017; Horstman et al., 2018). Young and Harvey (1996) found that sediment accretion within Avicennia marina in New Zealand showed no statistical relationship to stem density and other measures of plant physiognomy, except for the density of pneumatophores. In a study to ascertain the sediment accretion abilities of two different species Du and Zhang (2020) found that vertical accretion had a greater relation to the total volume of aerial root structures. The distribution of pneumatophore density, length, and thickness within mangroves are variable as is the occurrence of biotic factors which alter vegetation roughness such as barnacles (Mullarney et al., 2017). Bed roughness, and therefore ease of resuspension is also affected by the presence of bioturbation, soil binding microorganisms (Stokes and Harris, 2015; Kakeh et al., 2016; Horstman et al., 2018), fine rootlets (Spenceley, 1977; Krauss et al., 2014), and detritus.
In addition to vegetation characteristics, incoming wave energy is an essential factor to be considered in sedimentation studies (Van Proosdij et al., 2006) as waves remobilize mudflat and offshore bed sediments (Fricke et al., 2017). Links between site hydrodynamics and vegetation characteristics alone are not sufficient to explain the dissimilarity seen within and between sites. This was also highlighted in salt marsh studies in Reef et al. (2018). Without a supply of sediment, accretion within these systems is not possible. The concentration of suspended particles in incoming water is therefore another relevant factor in determining sedimentation within a site (Moskalski and Sommerfield, 2012). Distance from this source water is also a parameter to be considered as suspended particle concentration decreases with distance from the source as settling occurs with movement through vegetation (Van Proosdij et al., 2006; Moskalski and Sommerfield, 2012). Site topography is another parameter for consideration in the spatial distribution of sedimentation (Van Proosdij et al., 2006) as elevation affects hydroperiod characteristics, thus both the settlement time for and the energy in tidal currents are impacted (Reed et al., 1999).
Numerous methods exist to spatially examine sedimentation within coastal environments. These include depositional methods such as filters and traps (Nolte et al., 2013) which are useful in shorter term studies that investigate spatial deposition patterns across single tide cycles (Reed et al., 1999; Van Proosdij et al., 2006). These shorter-term studies are useful in providing snapshots of the interaction of water depth, inundation time, and other tidal variables, with parameters such as suspended sediment concentration and elevation (Van Proosdij et al., 2006). Longer term methods such as SETs which also capture compaction do not allow for insight into spatial or temporal variation to be captured. Erosion pins offer an easy deployment of an array of pins across a site or numerous sites, allowing both short/medium term and spatial dynamics to be captured. They provide an advantage over other short term methods such as marker horizons and sedimentation plates, which are more prone to be affected by bioturbation (Nolte et al., 2013). Erosion pins have been shown to sometimes cause localized scour depending on their deployment (Spenceley, 1977; Nolte et al., 2013), however, in low energy environments, if pin distribution or density is not greater than that of pneumatophores, they should reflect the natural processes that occur, accurately. This is reflected in Spenceley (1977) where grids which had a greater density than that of the pneumatophores present displayed intense localized scour.
In this study, the influence of biotic and abiotic characteristics on the spatial and temporal patterns of sedimentation at five different sites around the Western Port embayment are investigated. These characteristics include wave climate, suspended sediment concentration, distance from sediment source, microtopography, and vegetation density. These parameters have been highlighted as significant determinants in the distribution of sedimentation, however, the complex interactions between them are yet to be investigated. The use of five different sites allowed for the capture of the variation of vegetation characteristics of Avicennia marina var australasica as well as specific site wide characteristics of wave climate and sediment input. Spatial variation was analyzed by deploying an array of erosion pins based on the method used by Sheehan and Ellison (2015). Temporal variation was considered by conducting the study over a period of one and a half years with measurements planned during every season.
Materials and Methods
Study Location
Western Port is an embayment located 80 km to the east of central Melbourne, Australia. The climate of the bay is temperate; Cerberus station recorded 29-year annual mean minimum, and maximum temperatures of 9.8 and 19.2°C. The bay has a semidiurnal tidal regime and experiences an average tidal range of approximately 2.2 m. The marine flora around the bay includes seagrass meadows, mangroves, and salt marsh. The only species of mangrove in Western Port Bay is Avicennia marina var australasica; the bay is close to the southern latitudinal limit of the Avicennia marina species.
The hydrodynamic complexity of the bay is influenced by the presence of French Island and Phillip Island. Sea water is primarily exchanged with the Bass Strait at the Western Segment entrance, where it is split into the North and East Arms by the presence of French Island (Figure 1).
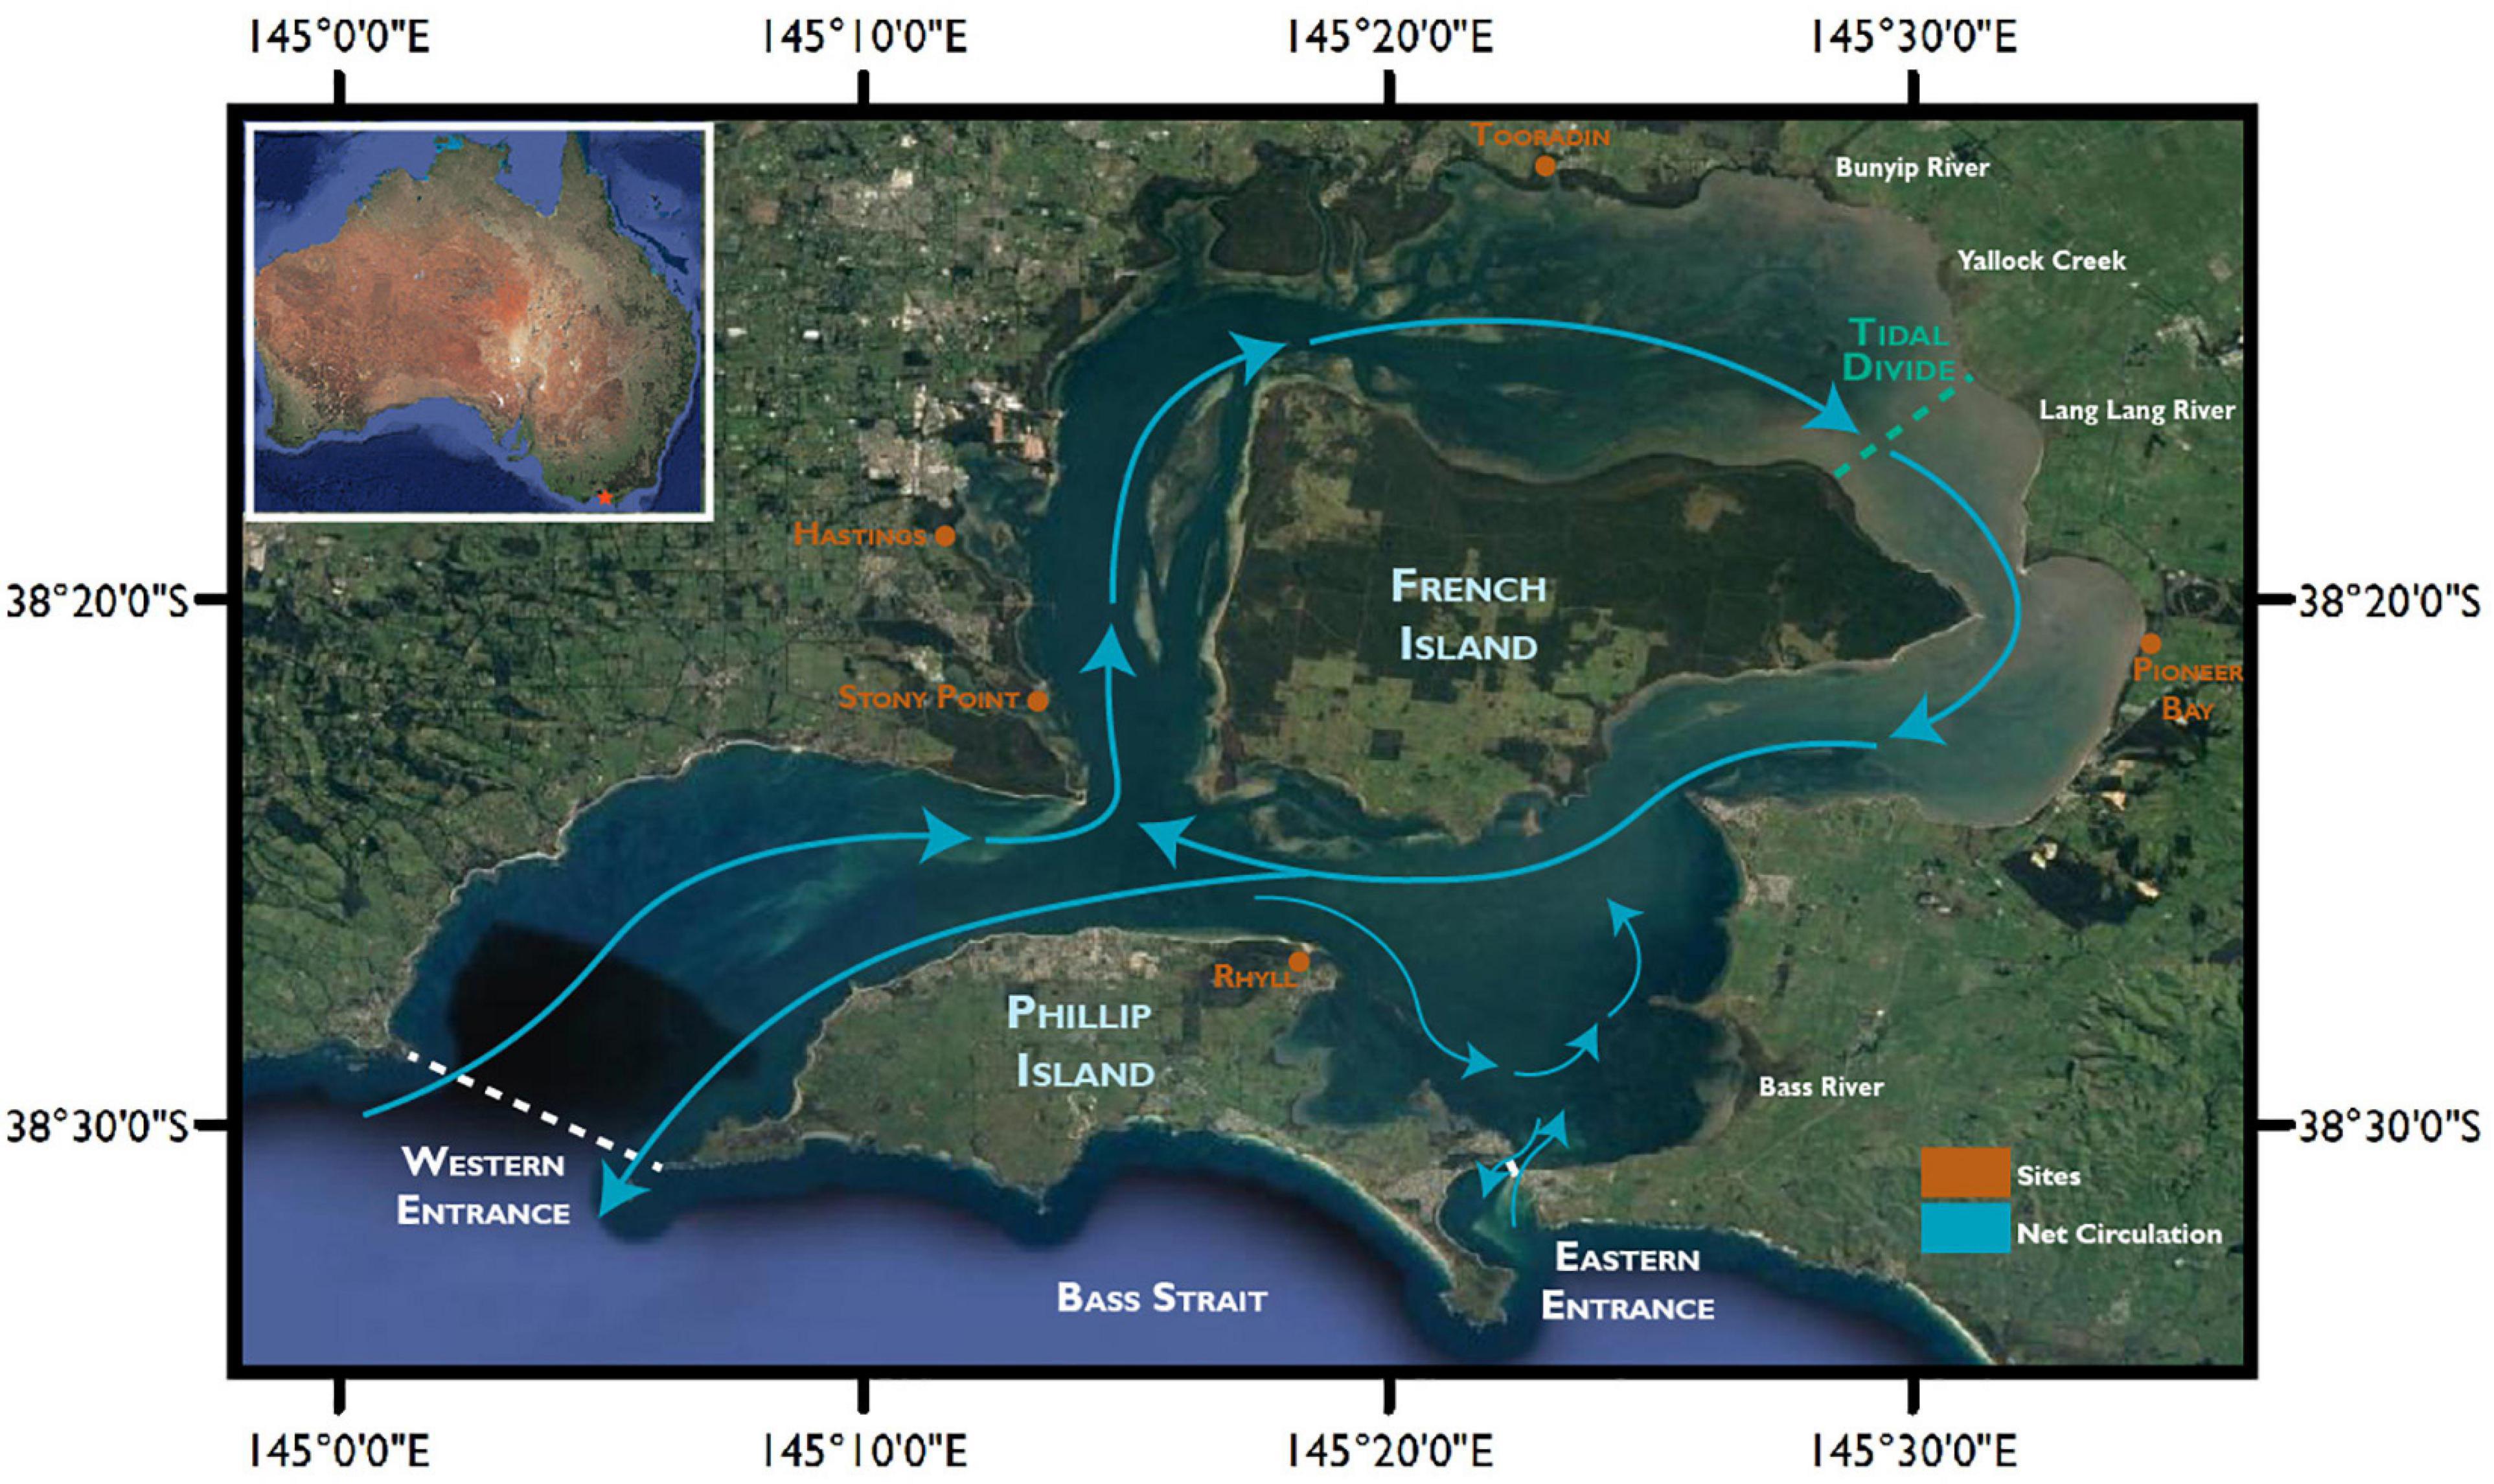
Figure 1. Location of data collection sites, features and net water circulation around Western Port Bay. Net circulation patterns based on Harris et al. (1979). Map data: Google, Maxar Technologies.
Primary sources of fine sediment (<4 μm) into the north of the bay include the Bunyip river (27%) and Lang Lang river (20%) to the north, as well as the erosion of the Lang Lang cliffs (32%) (Wallbrink et al., 2003). Secondary sources of fine sediments are channel, and gully bank erosion (Wallbrink et al., 2003). The hydrodynamics within Western Port Bay impose clockwise sediment movement around French Island.
Sediment Data Collection
In order to investigate the sediment dynamics and the role of Avicennia marina var australasica in sedimentation within Western Port, five sites were chosen around the bay, as indicated in Figure 1. Mangrove vegetation structure varies around the bay therefore, sites were chosen to capture the breadth of structural variability.
A total of 50 cm long, 2 mm thick stainless-steel rods (erosion pins) were installed at each site in a grid based on Sheehan and Ellison (2015) in December 2019 at Stony Point, Hastings, Pioneer Bay, and Rhyll. Pins were installed at Tooradin in March 2020. A square grid of pins was deployed at each site, with shore-parallel rows of 10 erosion pins spaced 10 m apart. Row transects were laid at shore-perpendicular intervals from the low intertidal, every 10 m to the back of the mangrove vegetation, as seen in Figure 2 at Pioneer Bay. Each pin was driven 30 cm deep into the sediment. Measurements of the height of each rod above the sediment were taken approximately every 3–6 months, until July 2021.
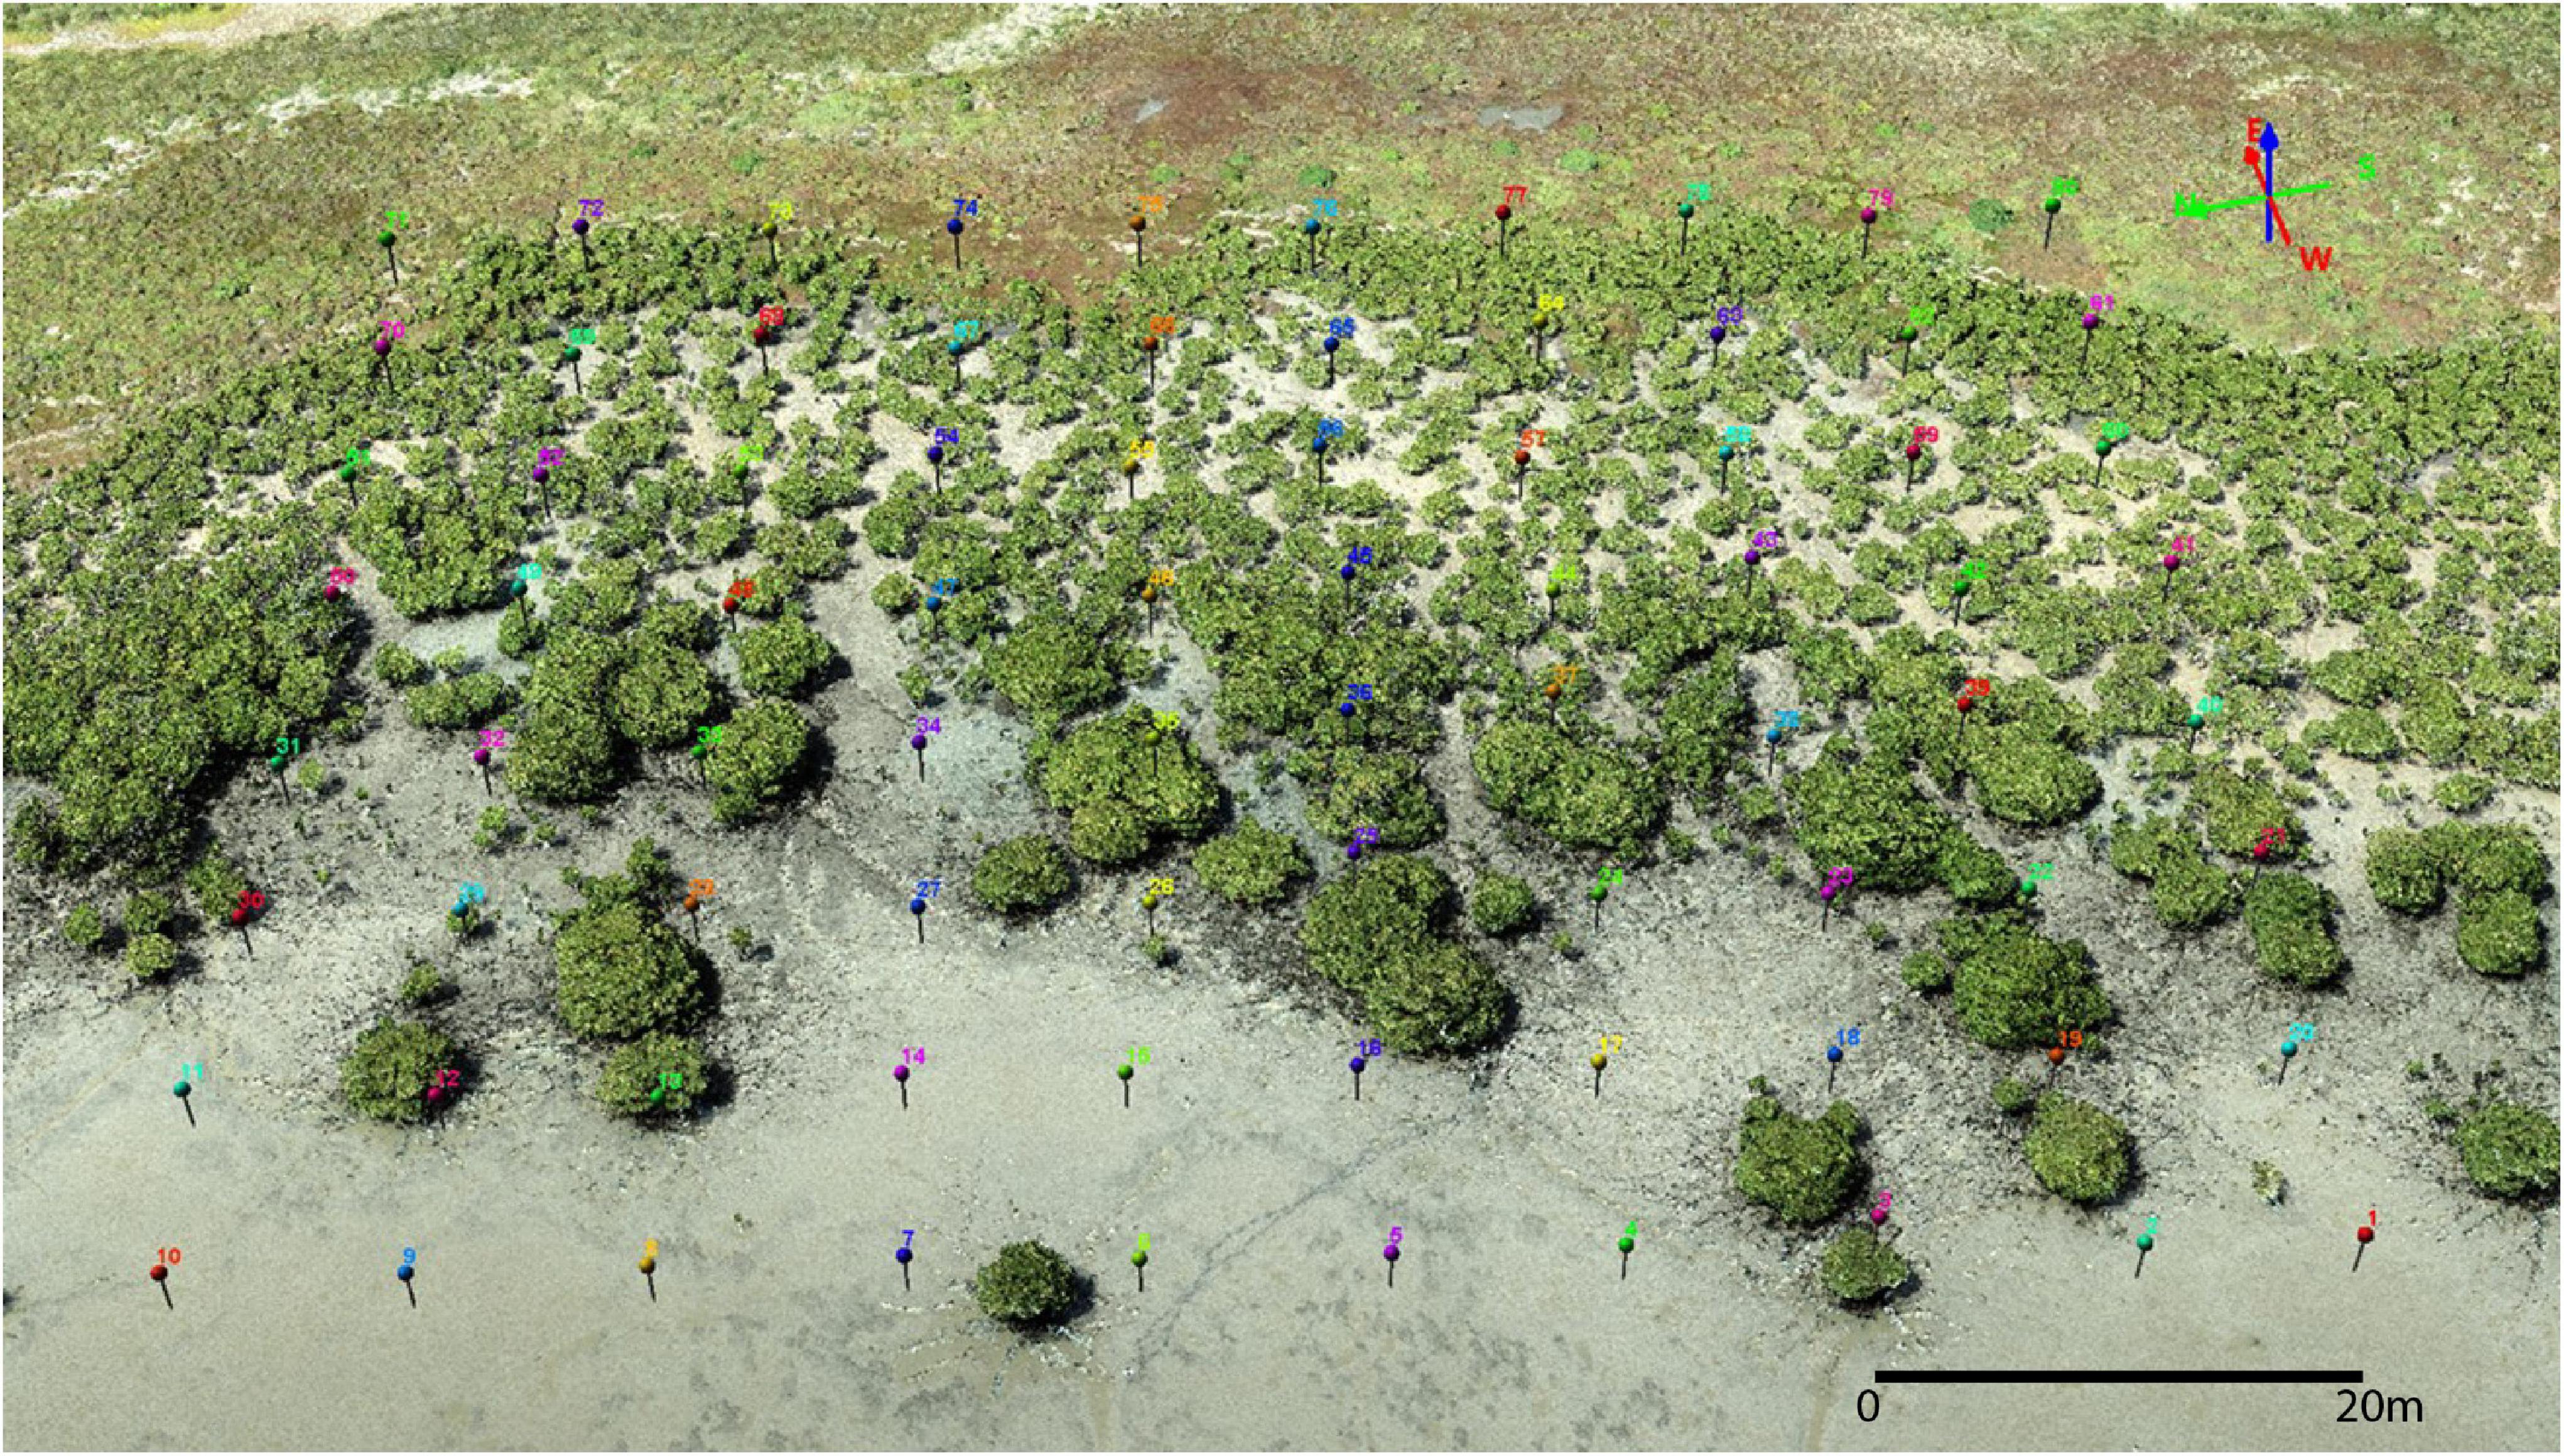
Figure 2. Configuration of stainless-steel rods at Pioneer Bay, Western Port Bay. Site coordinates are 38°22′11.5″S 145°32′52.2″E.
Supplementary Data Collection
Elevation data was collected at each erosion pin using the Navcom sf-3040 D-GPS unit. The distance from the mean lower low water (MLLW), −0.6 m, as measured using the distance from point to line function in QGIS with MLLW calculated from Western Port bathymetry data. Total suspended matter (TSM) was captured from ESA Globcolour (Doerffer and Schiller, 2007) monthly mean of cloud free data, ACRI-ST company (Sophia Antipolis, France) with 4 km × 4 km spatial resolution. Site relevant monthly TSM measurements were extracted.
An RBR duet logger (RBR Ltd., Ottowa, CANADA) was placed at each site in May 2021 to July 2021 to analyze the differences in wave climate at each site including average incident significant wave height (SWH), wave energy, wave period, and depth. As waves within Western Port Bay are primarily wind driven, the data collected from the loggers was used to calibrate a wind/wave relationship at each site in order to simulate the wave climatology during the extent of the experiment.
Vegetation studies were conducted on site by measuring the percentage of bare sediment in 1 × 1 m quadrat around each pin. The percentage of bare sediment was calculated as 100 minus the total percentage of coverage of raft, pneumatophores, mangrove stems, cyanobacteria, algae, and salt marsh present.
Data Analysis
Differences in the height of the erosion pin above the sediment was calculated between measurements in 6-month intervals during the first year, and 3-month intervals thereafter, as well as the difference from the start of the experiment, T0, when pin height was 20.0 cm. The average change at each site was then calculated. Analysis of results was broken down into three sections: Large-scale short-term site wide changes, small-scale long term within site changes, and finally intra-site variability. Both longer term changes, T0-Tn and shorter-term changes T(n–1)-Tn were averaged across site for comparison. A number of pins were trampled by kangaroos that frequent these sites. Pins that were lost or damaged during the experiment were not included in the long-term averages or analysis, but short-term changes were still tracked with replacement pins. No scouring was evident around the stainless-steel pins.
Large-scale short-term analysis sought to examine the inter-site variability throughout the length of the experiment by comparing the average pin change within sites during each measurement period. The relationship between the site average daily change per time period, total suspended matter (TSM), and wave energy was investigated using a multiple linear regression model in R.
Small-scale longer-term within site change analysis focused on the total daily change over the entirety of the experiment, at each pin at each site. Spatial analysis was conducted using Inverse Distance Weighted (IDW) interpolation in QGIS, and by calculating Moran’s I in R. The dependence of these changes on the variables to MLLW, bare sediment, and elevation were then examined using a multiple non-linear regression model in R. Intra-site variability was scrutinized by calculating coefficient of variation (CV), which was then analyzed using IDW interpolation in QGIS.
Results
Large-Scale Short-Term Analysis
SWH between the sites are mostly distinct (Figure 3A), with Pioneer Bay having consistently higher wave heights than all other sites, with average monthly wave heights being above 0.2 m. Expected wave heights at Rhyll are constantly lower than that of other sites, with an average SWH of only 0.04 m. Hastings has the second lowest expected SWHs, averaging 0.07 m during this entire period. Wave heights at Tooradin and Stony Point are less distinct than that of other sites throughout the experiment. They are slightly higher on average, at Stony Point (0.096 m), than Tooradin (0.095 m).
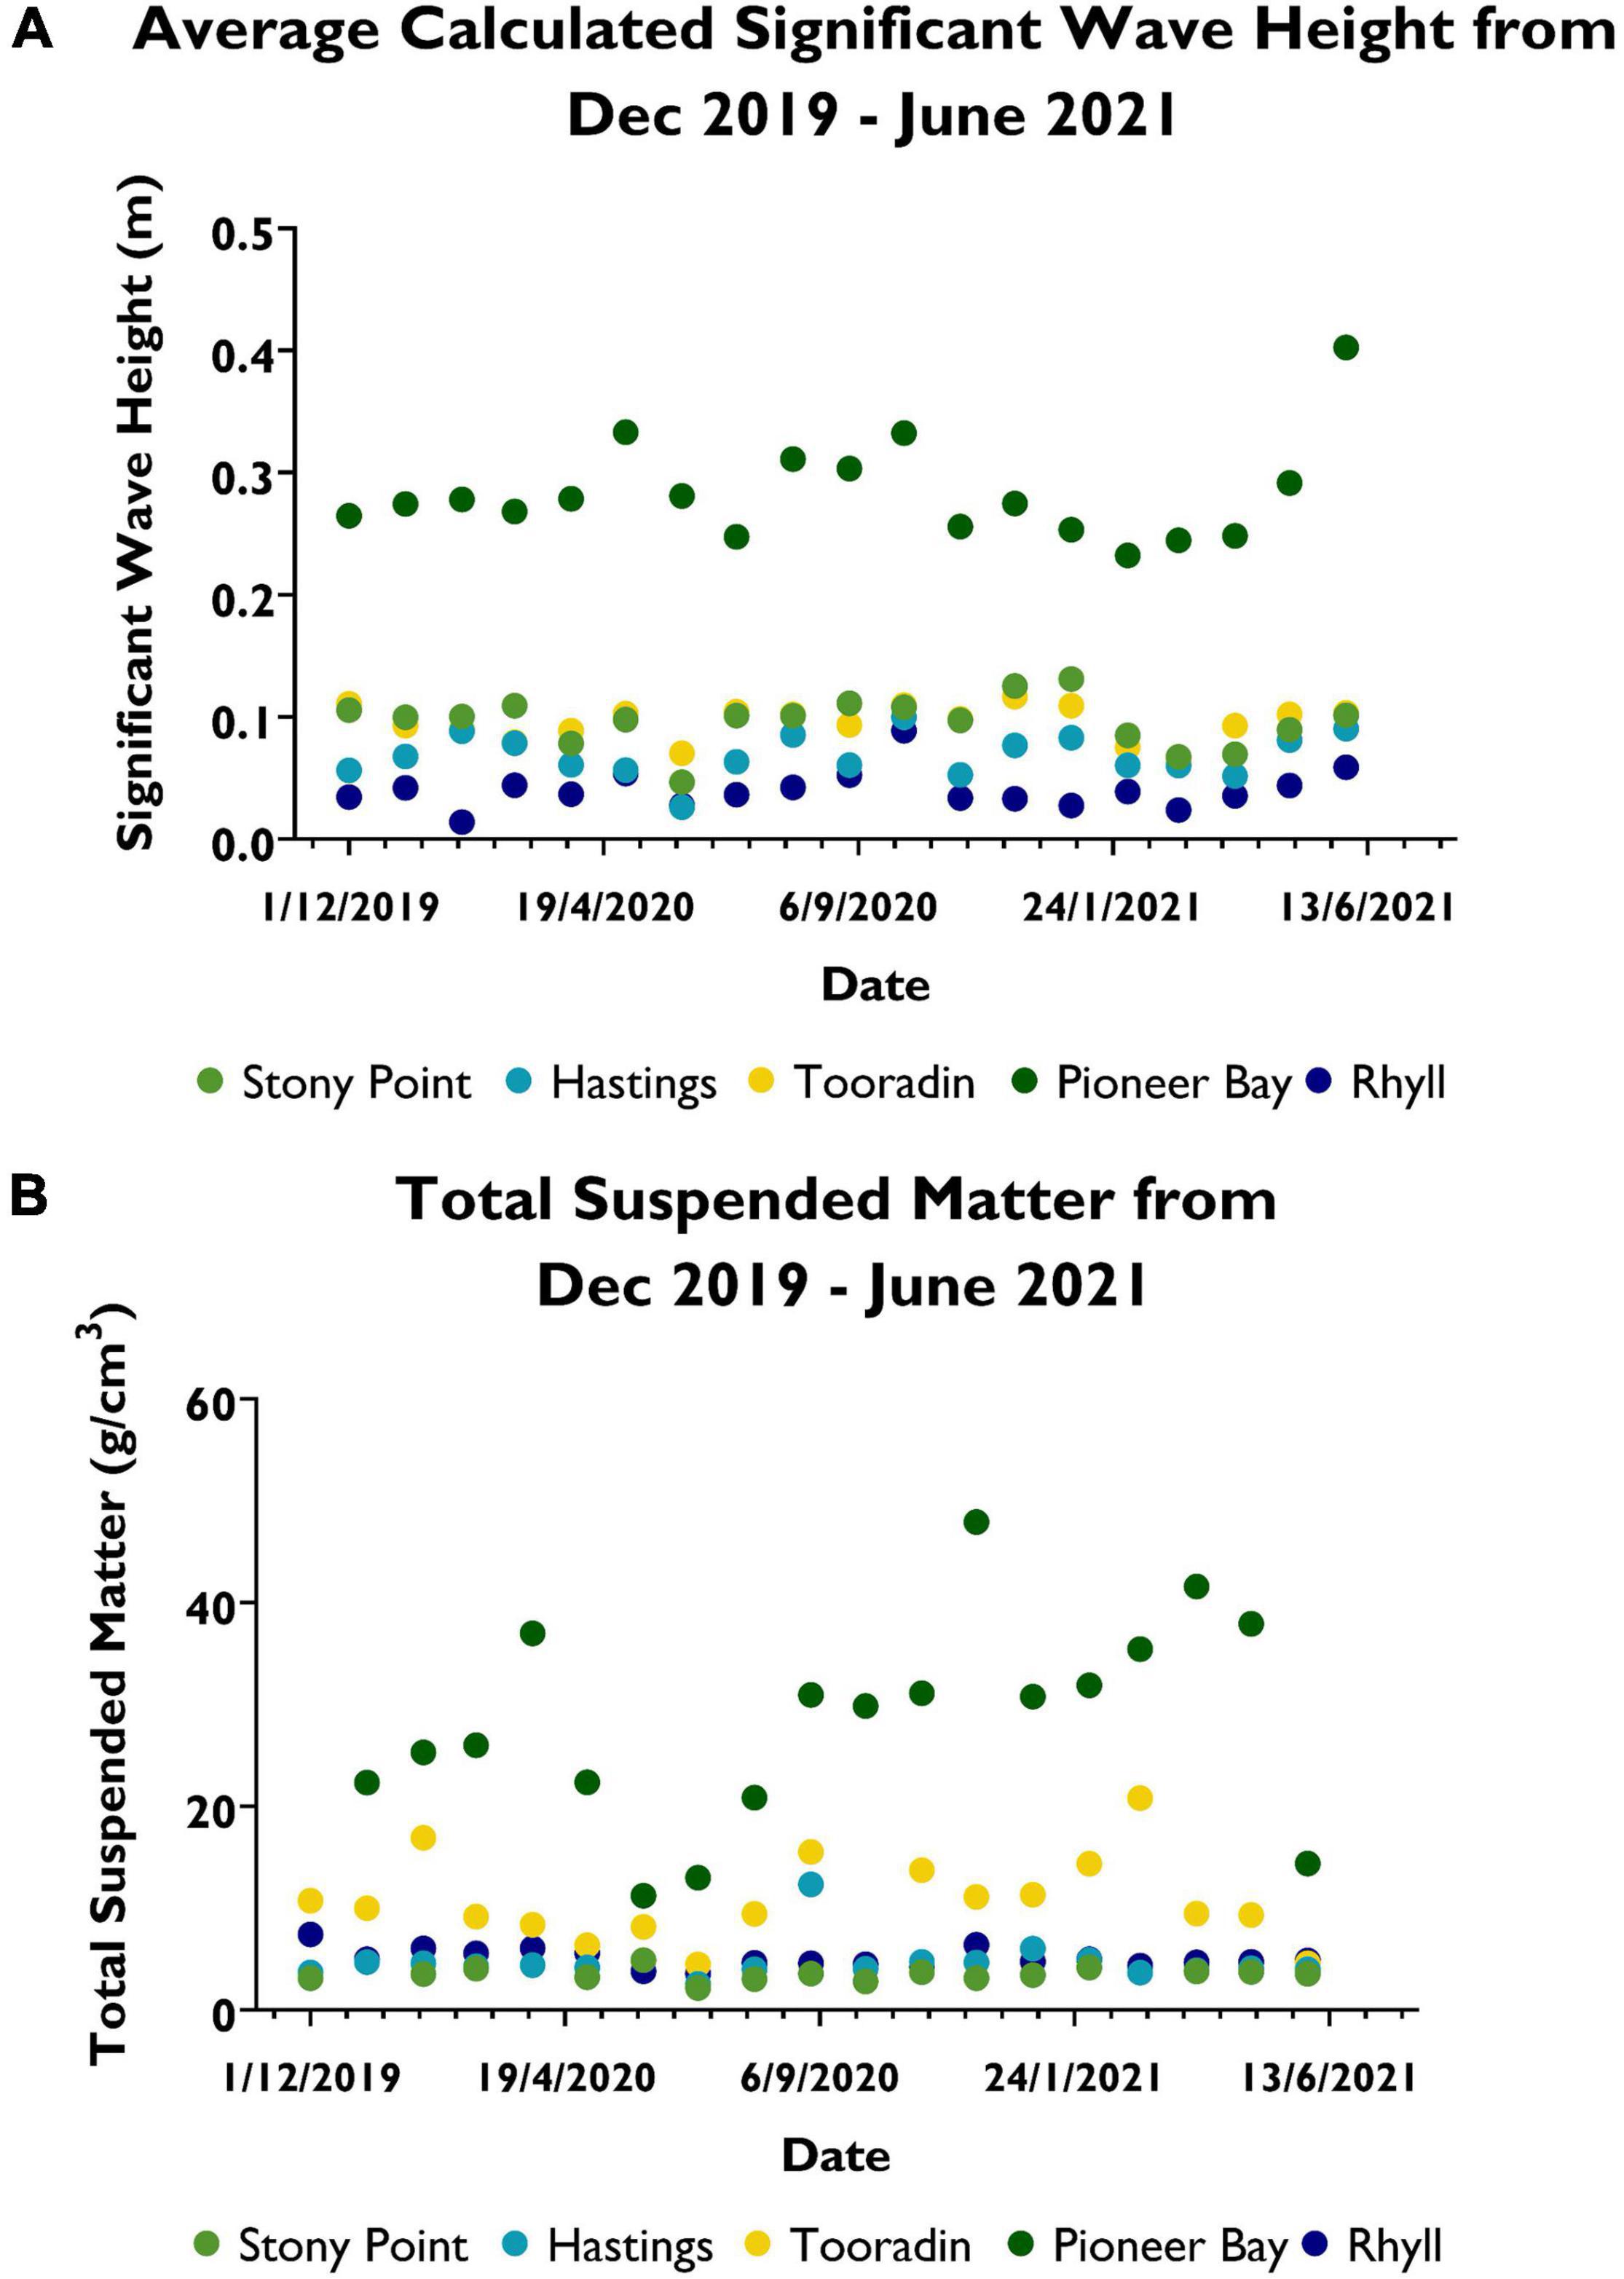
Figure 3. (A) Average monthly calculated significant wave height during December 2019 to June 2021. (B) Total suspended matter (TSM) observed during December 2019 to June 2021.
Patterns of TSM (Figure 3B) during the experiment also follow a distinct pattern, despite monthly fluctuations at each site. Pioneer Bay has sustained significantly higher TSM values than other sites throughout the duration of the experiment, except in June and July, 2019. A substantial peak of 47.9 g/cm3 was observed at this site in December 2020. The average value of TSM during the entire observation period is 28.3 g/cm3 at Pioneer Bay, compared to 10.8 g/cm3 at Tooradin. The maximum recorded value at Tooradin was 20.8 g/cm3. TSM at Tooradin remained the second highest throughout the period, despite monthly fluctuations. This remained true, except in June 2021, when it was surpassed by Rhyll with an observed value of 4.87 g/cm3. Average TSM at Rhyll was 5.03 g/cm3 compared to 4.70 g/cm3 at Hastings. Values at Hastings mostly remained slightly lower than that of Rhyll, except for a noticeable peak of 12.3 g/cm3 in September, and smaller but notable increases in November 2020 and January 2021. TSM values at Stony Point remained lower than all other sites at an average of 3.48 g/cm3, except in June 2020, when it peaked at 4.87 g/cm3. This occurred during the same month that Pioneer Bay TSM values plummeted to its lowest of 11.2 g/cm3. TSM at Tooradin 8.15 g/cm3 was not significantly higher or lower than average, while Rhyll recorded its second lowest value of 3.80 g/cm3 during this period. A value for Hastings was not recorded during this period. Missing values were only recorded in Dec 2019 for Pioneer Bay, October 2020 at Tooradin, June 2020 at Hastings, and in January 2020, April 2020, and March 2021 at Stony Point.
Average site change during measurement period (Figure 4) showed that sites have accreted during every period except during T0-T2, at both Hastings and Rhyll. During T0-T1 average change was 2.0 cm at both Rhyll and Hastings. Reported values at other sites were much lower, with a measured change of 0.9 and 0.7 cm, at Pioneer Bay and Stony Point, respectively. Change at Tooradin was 0.8 cm. However, it should be noted that T0 for Tooradin, is March 2020. During T0-T2 average total change decreased to 1.8 and 1.5 cm, at Rhyll and Hastings, respectively. This shows that during T1-T2 more pins across the two sites recorded erosion, however, the total long-term change was still positive. Accretion was observed at Pioneer Bay with at increase to 1.3 cm, at Tooradin with a total change of 1.1 cm, and an increase to 1.2 cm at Stony Point. Changes during T0-T3 were much more conservative at Pioneer Bay, Tooradin, and Stony Point, with increases to 1.4, 1.2, and 1.3 cm, respectively; compared to a much more substantial jump to 2.1 cm at Rhyll and 1.8 cm Hastings. Between December 2019 and June 2021, Rhyll experienced the largest increase of 3.0 cm, followed by Pioneer Bay with 2.4 cm, Hastings with 2.2 cm, and Stony Point with 1.6 cm. For the period March 2020–June 2021, a change of 1.4 cm was noted at Tooradin.
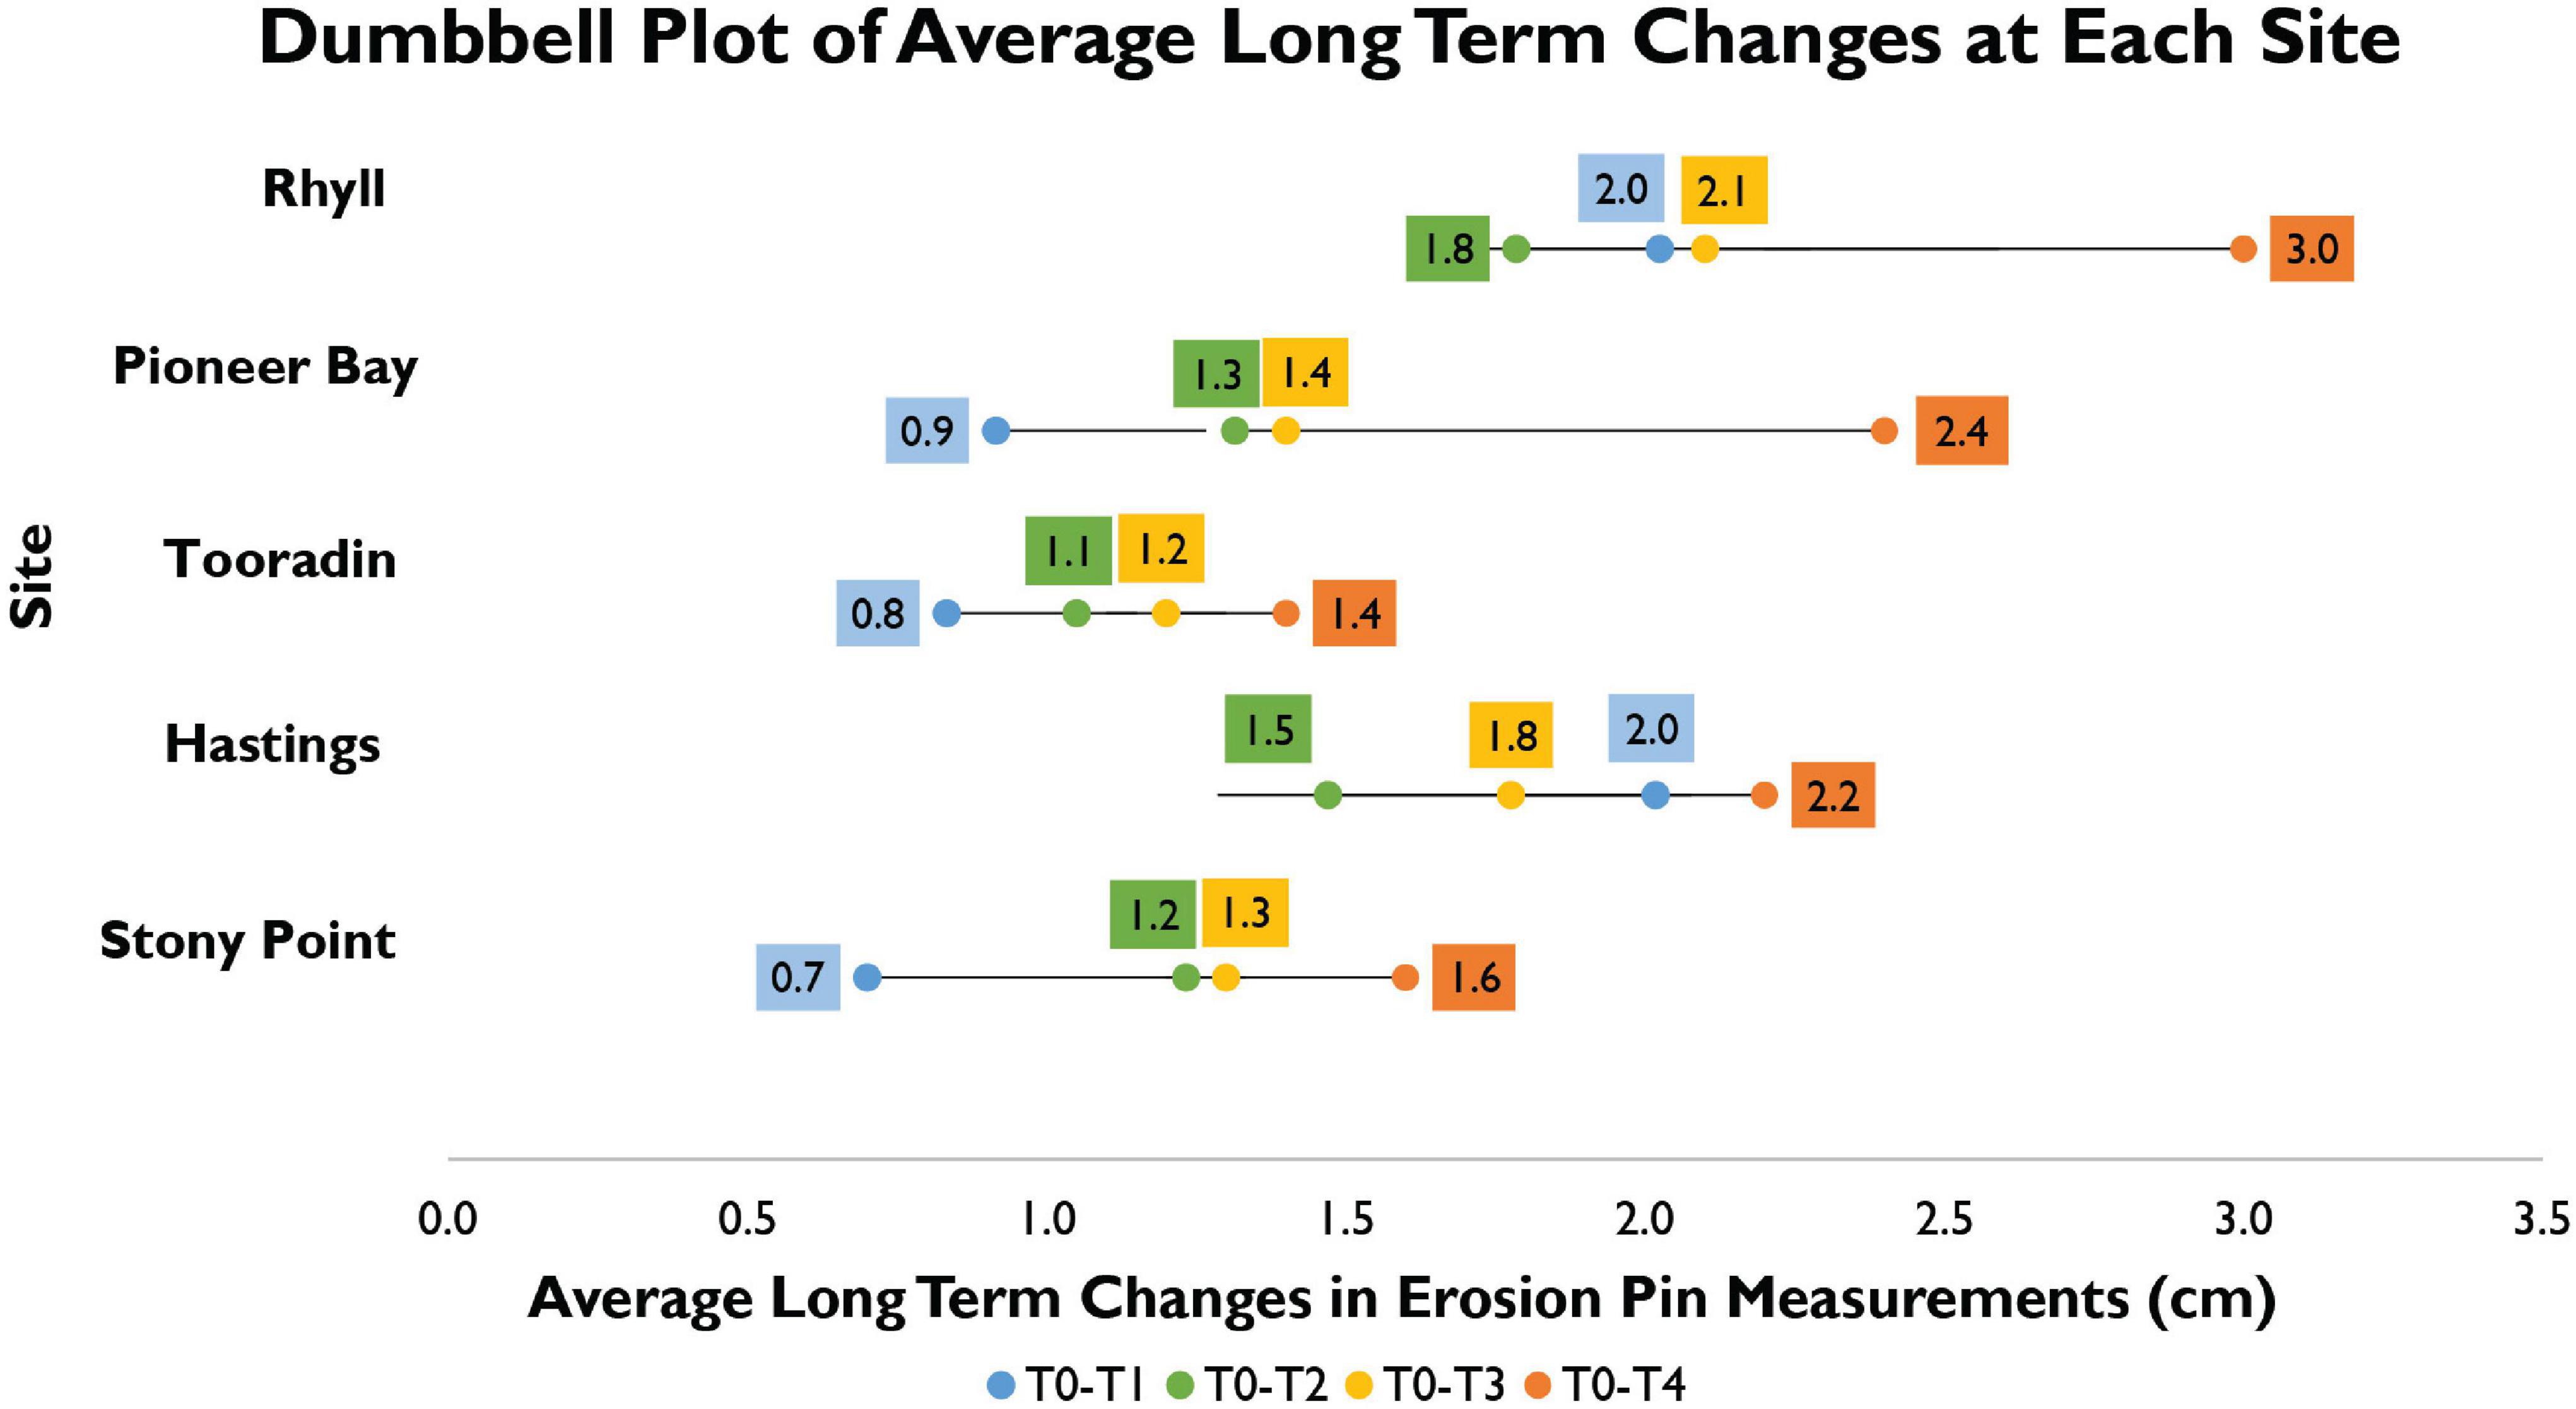
Figure 4. Dumbbell plot showing long term average changes at each site.
The average daily change per site during each measurement period was plotted against TSM (Figure 5A) and average SWH (Figure 5B). No relationship was found between TSM or SWH with average daily change, as the calculated p-value was 0.5673 and 0.575, respectively. Therefore, neither TSM or SWH was statistically significant. An equation to predict short-term sedimentation based on these parameters could not be developed; R2 was calculated as 0.02.
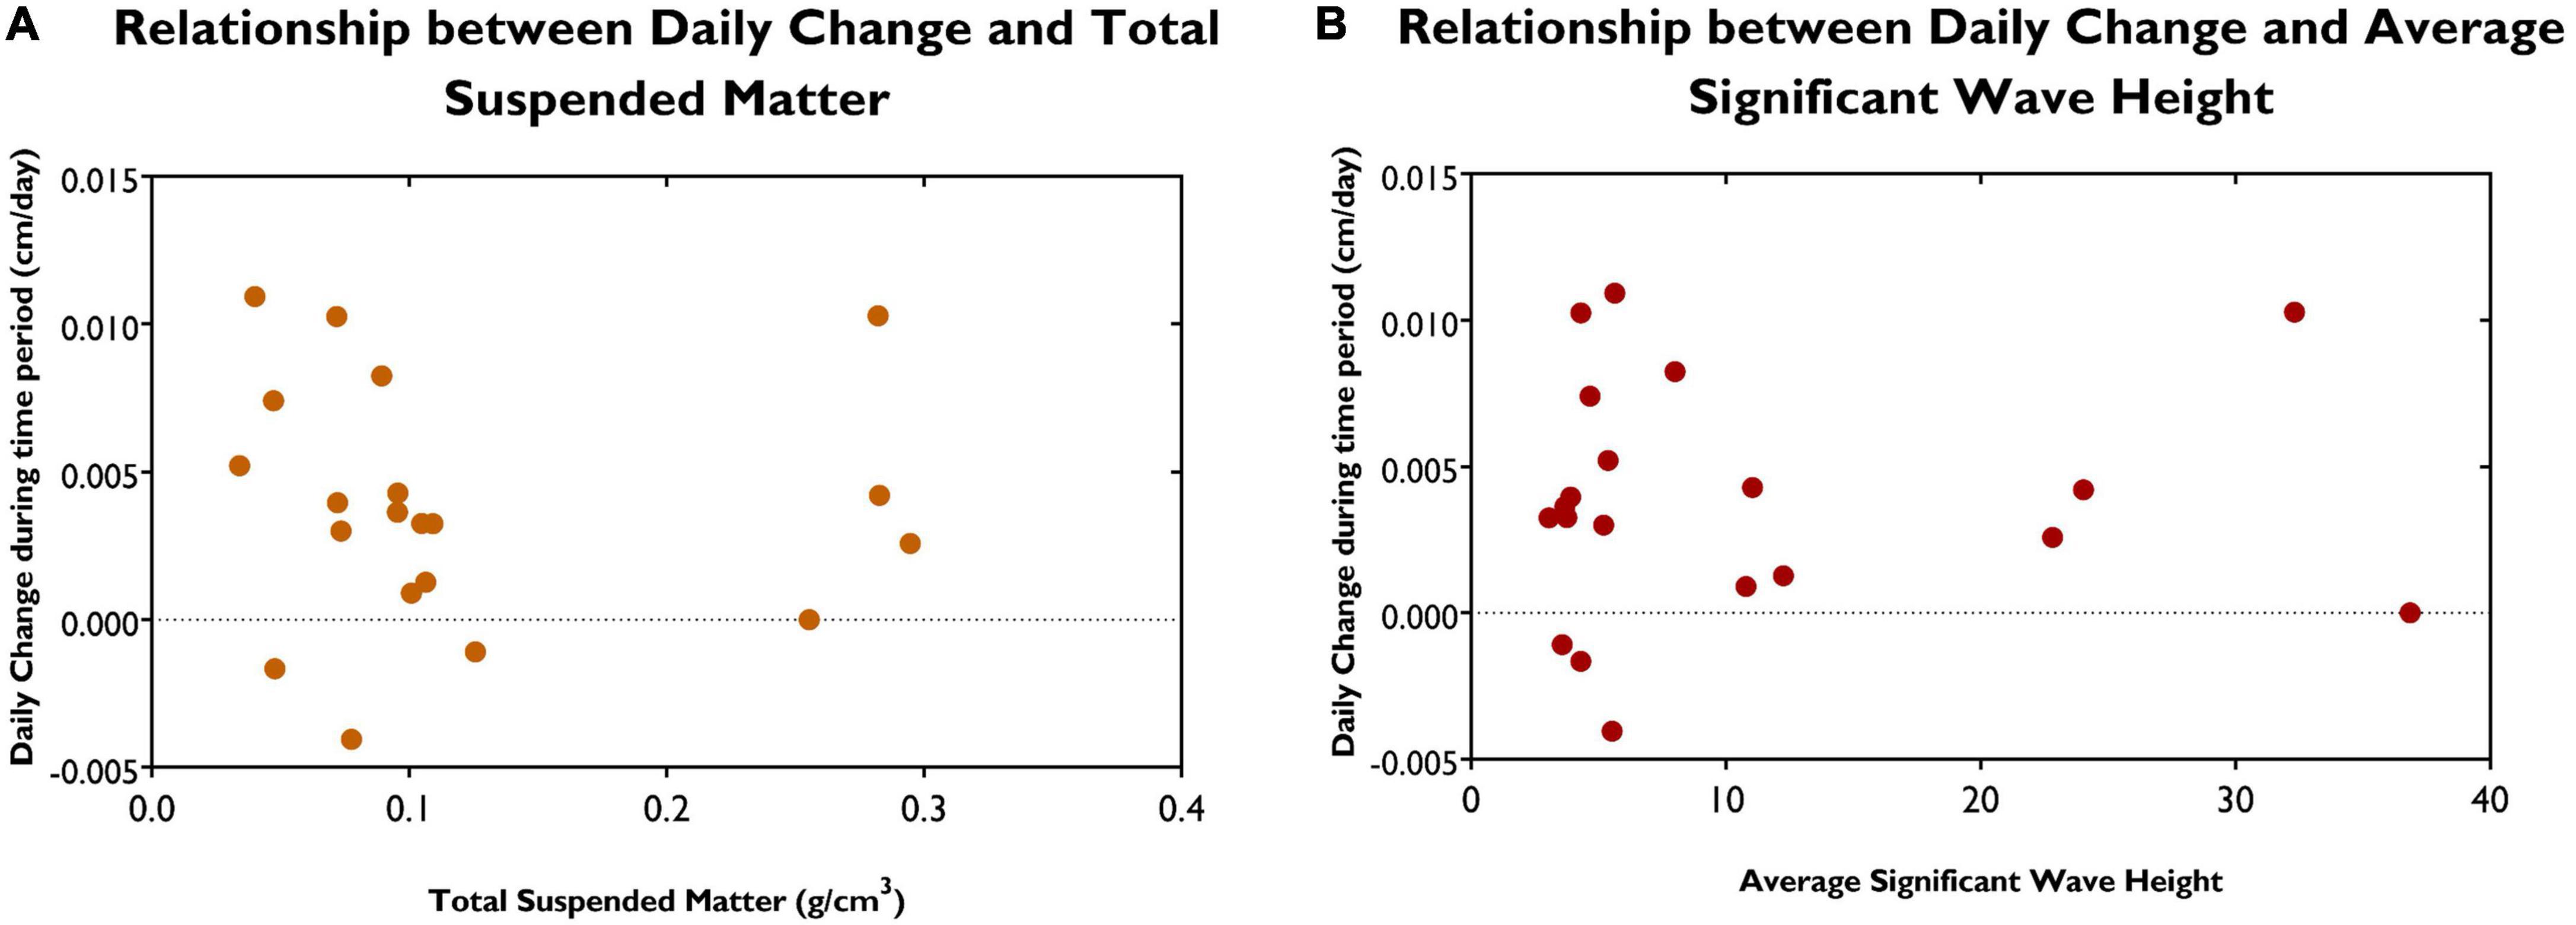
Figure 5. (A) Relationship between daily change between measurement periods and total suspended matter at the various sites. (B) Relationship between daily change between measurement periods and average significant wave height at the various sites.
Rhyll had the highest average accretion of 3.0 cm over the course of the measurements, despite a period of erosion during the second measurement period, between July and November 2020. During this period of erosion, the average SWH was at its highest and average TSM was at the lowest recorded for the site. Rhyll experienced the highest average accretion during the final measurement period, between March and June 2021. Average calculated SWH during this time was only 0.01 m lower than that of the second measurement period. Average TSM was 0.363 g/cm3 higher than that of the second measurement period (an increase of 10%). From December 2020 to February 2021, average net sedimentation at Pioneer Bay was 0 cm despite having the highest TSM on record. The lowest calculated wave heights, and average change during the next measurement period at Pioneer Bay was 1.1 cm. During this same period, SWH was the highest recorded, and TSM was lower than in the December to February period. Pioneer Bay had the second highest total accretion during the experiment of 2.4 cm over 18 months.
Small-Scale Longer-Term Analysis
TSM and SWH were treated as site wide parameters used in inter-site and temporal compositions. Smaller scale (intra-site) parameters included distance from MLLW, elevation, and vegetation characteristics (measured as a percentage of bare sediment) for each individual pin. Results of IDW interpolation at Stony Point in Figure 6A, show randomness in the distribution of areas of accretion and erosion across the site. The calculated p-value from Moran’s I test was 0.058 indicating no significant spatial autocorrelation at this scale. At Hastings (Figure 6B), results show a pattern of erosion at the front of the mangrove, more accretion occurring in the middle of the site and erosion or less accretion occurring at the back of the site. There are still areas of erosion occurring within this area, and pins with higher rates of accretion are also randomly spread throughout. Moran’s I test shows significant autocorrelation at Hastings (p = 0.04). At Tooradin (Figure 6C) spatial autocorrelation is present (Moran’s I, p < 0.0017) but is opposite in pattern to that of Hastings, with more areas of higher accretion located at the seaward edge of the mangrove. Areas of accretion and erosion were randomly dispersed throughout the middle and back of the site. Pioneer Bay (Figure 6D) does not show any discernible large-scale pattern of accretion, but erosion and accretion patches occur, with a significant spatial autocorrelation (p = 0.01). Most of the site was accreting. At Rhyll (Figure 6E), similar to Pioneer Bay, accretion and erosion do not follow a larger pattern but some clustering is present (p = 0.00018).
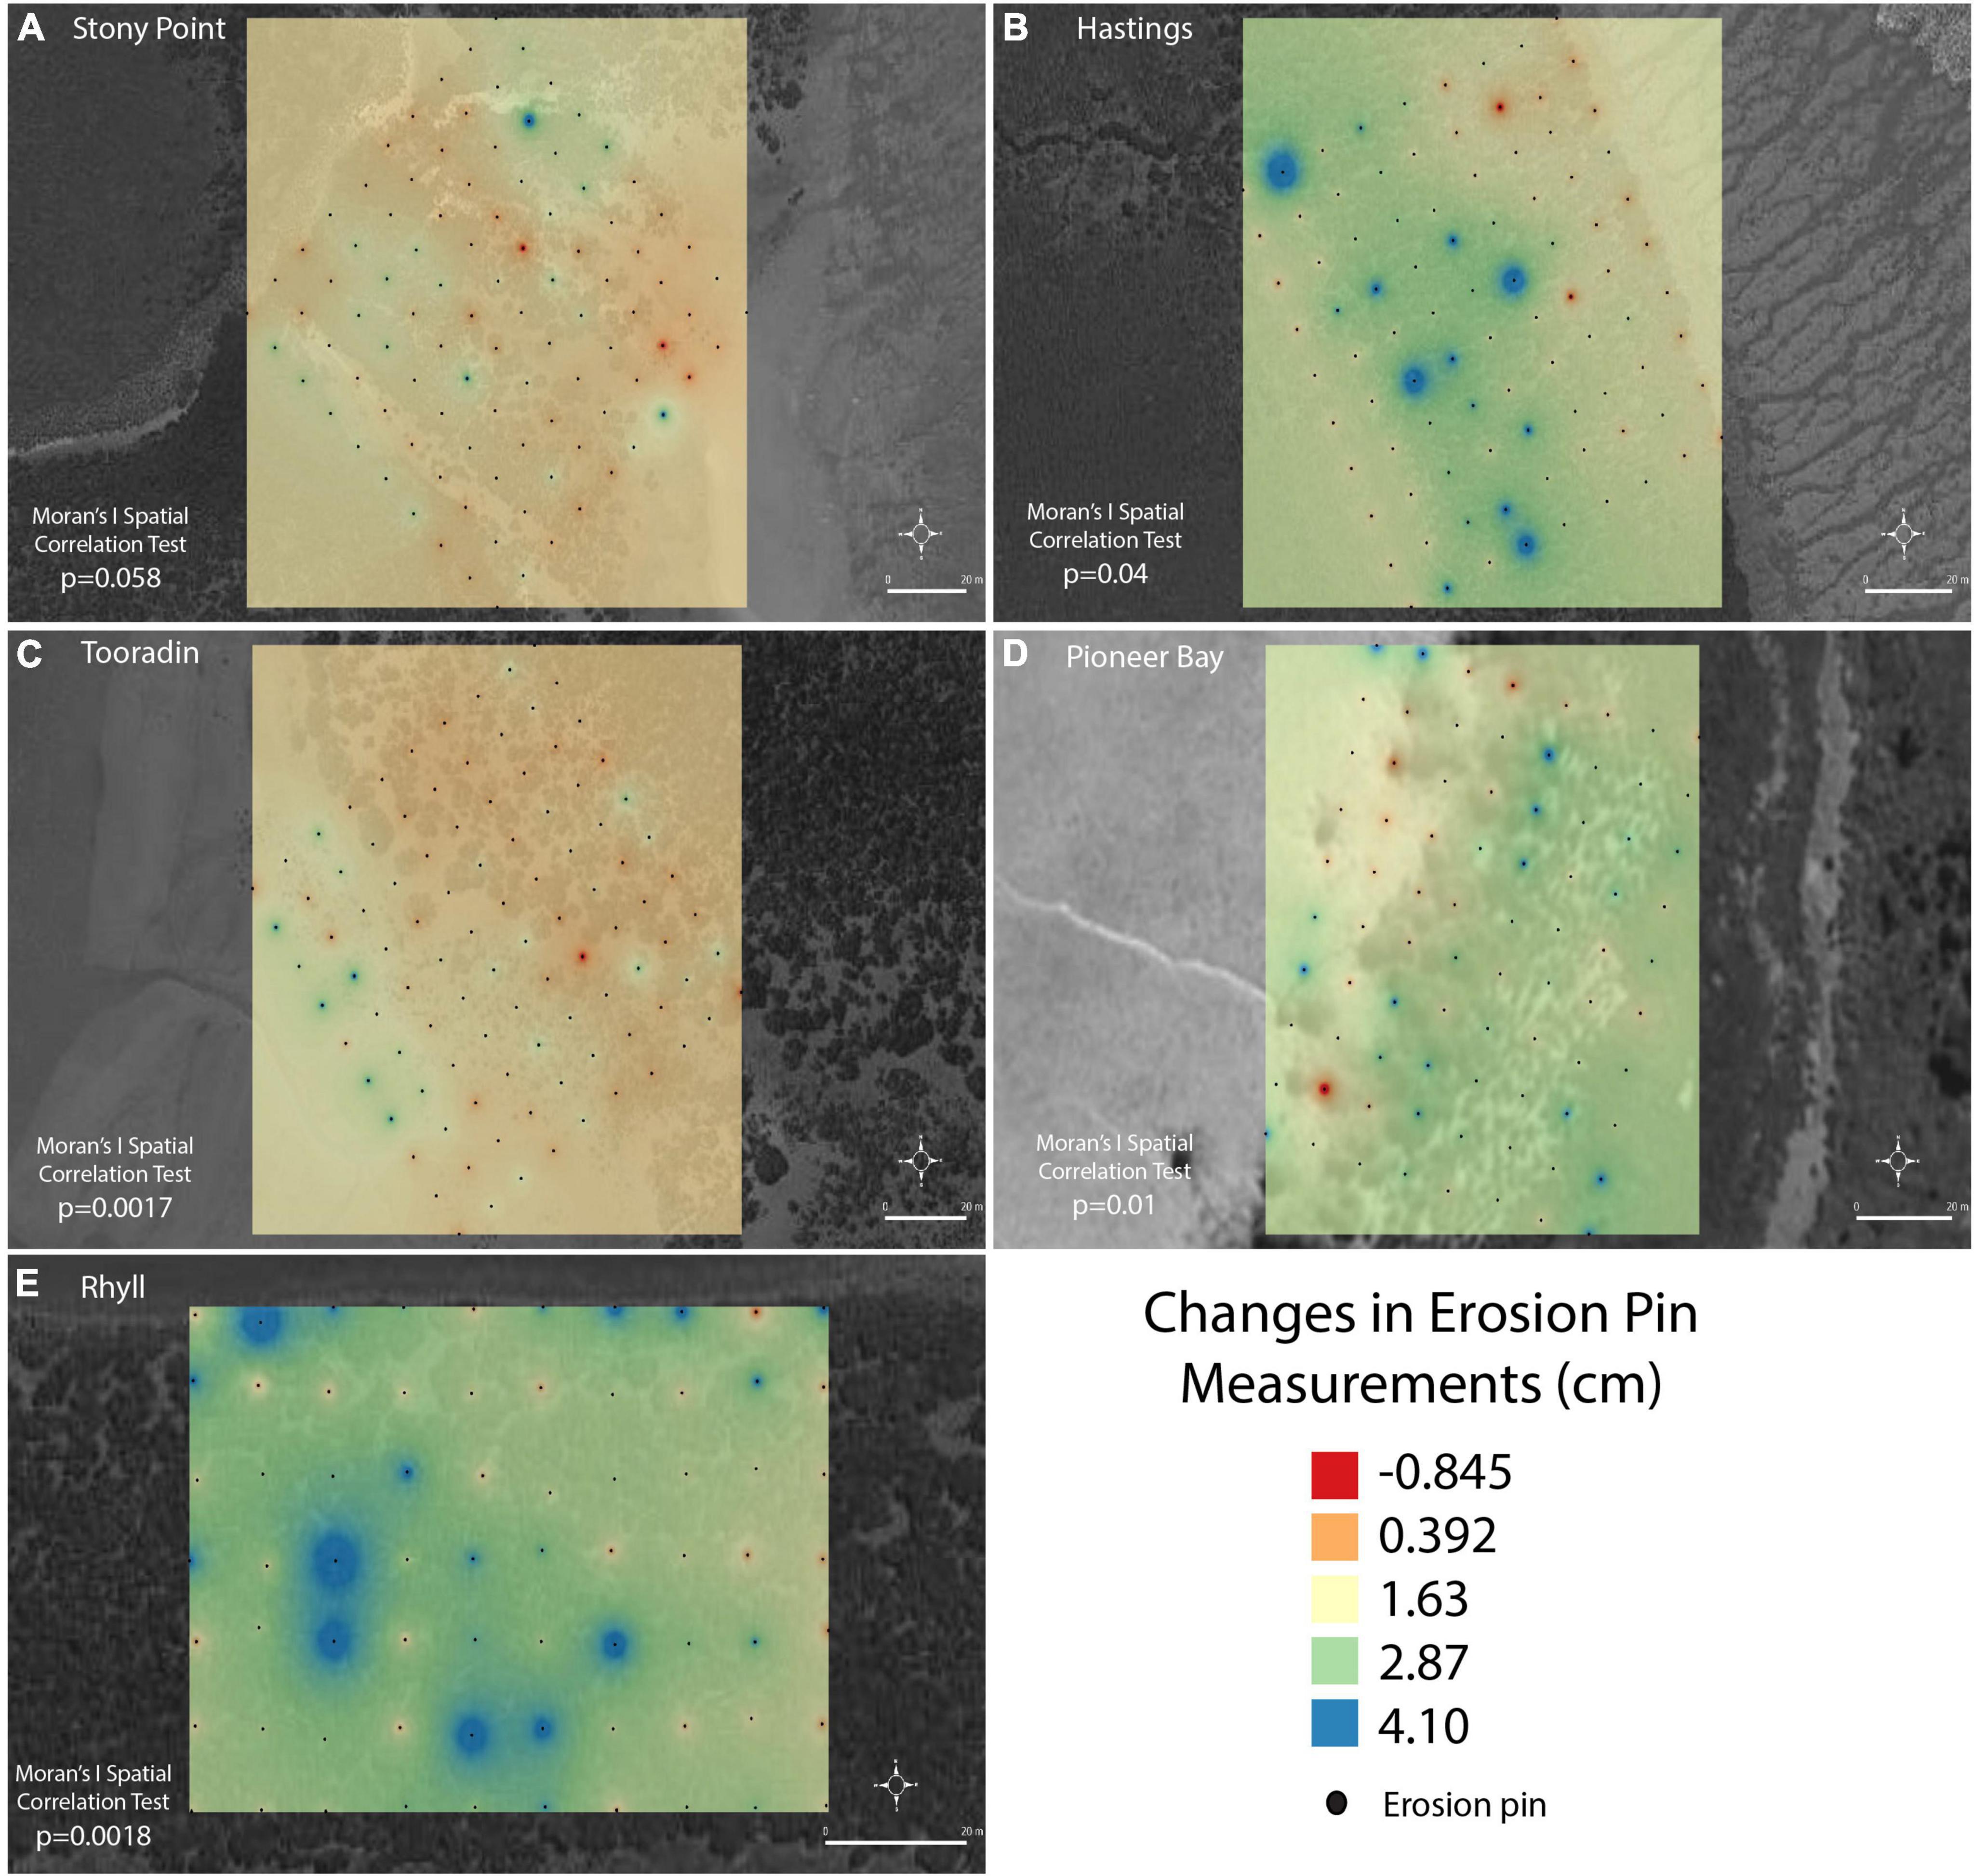
Figure 6. Long term changes recorded at each erosion pin during experiment across the sites (A) Stony Point, (B) Hastings, (C), Tooradin, (D) Pioneer Bay, (E) Rhyll.
We found no significant relationship between average daily sedimentation and elevation above sea level (multiple non-linear regression, p = 0.32 and p = 0.32, respectively) or with the distance from MLLW (Figures 7A,B). The clustering of values at distances greater than 400 and 200 m from MLLW represent pins located at Pioneer Bay and Rhyll, respectively, where high wave energy restricts the mangrove to higher intertidal elevations. We found no relation between percentage of bare sediment in the immediate area around the pin and daily change (Figure 7C); pins surrounded by 100% bare sediment showed both erosion and accretion. While there is no significant increase in deposition with increased vegetation cover (p = 0.065), less erosion seems to be occurring at heavily vegetated pins. The synergistic relationships between bare sediment and distance or elevation, elevation and distance and finally bare sediment, distance and elevation were all found to be statistically insignificant with p-values of 0.663, 0.844, 0.557, and 0.433, respectively. An equation to predict long-term sedimentation or erosion could not be developed here; R2 for the model was reported as 0.065.
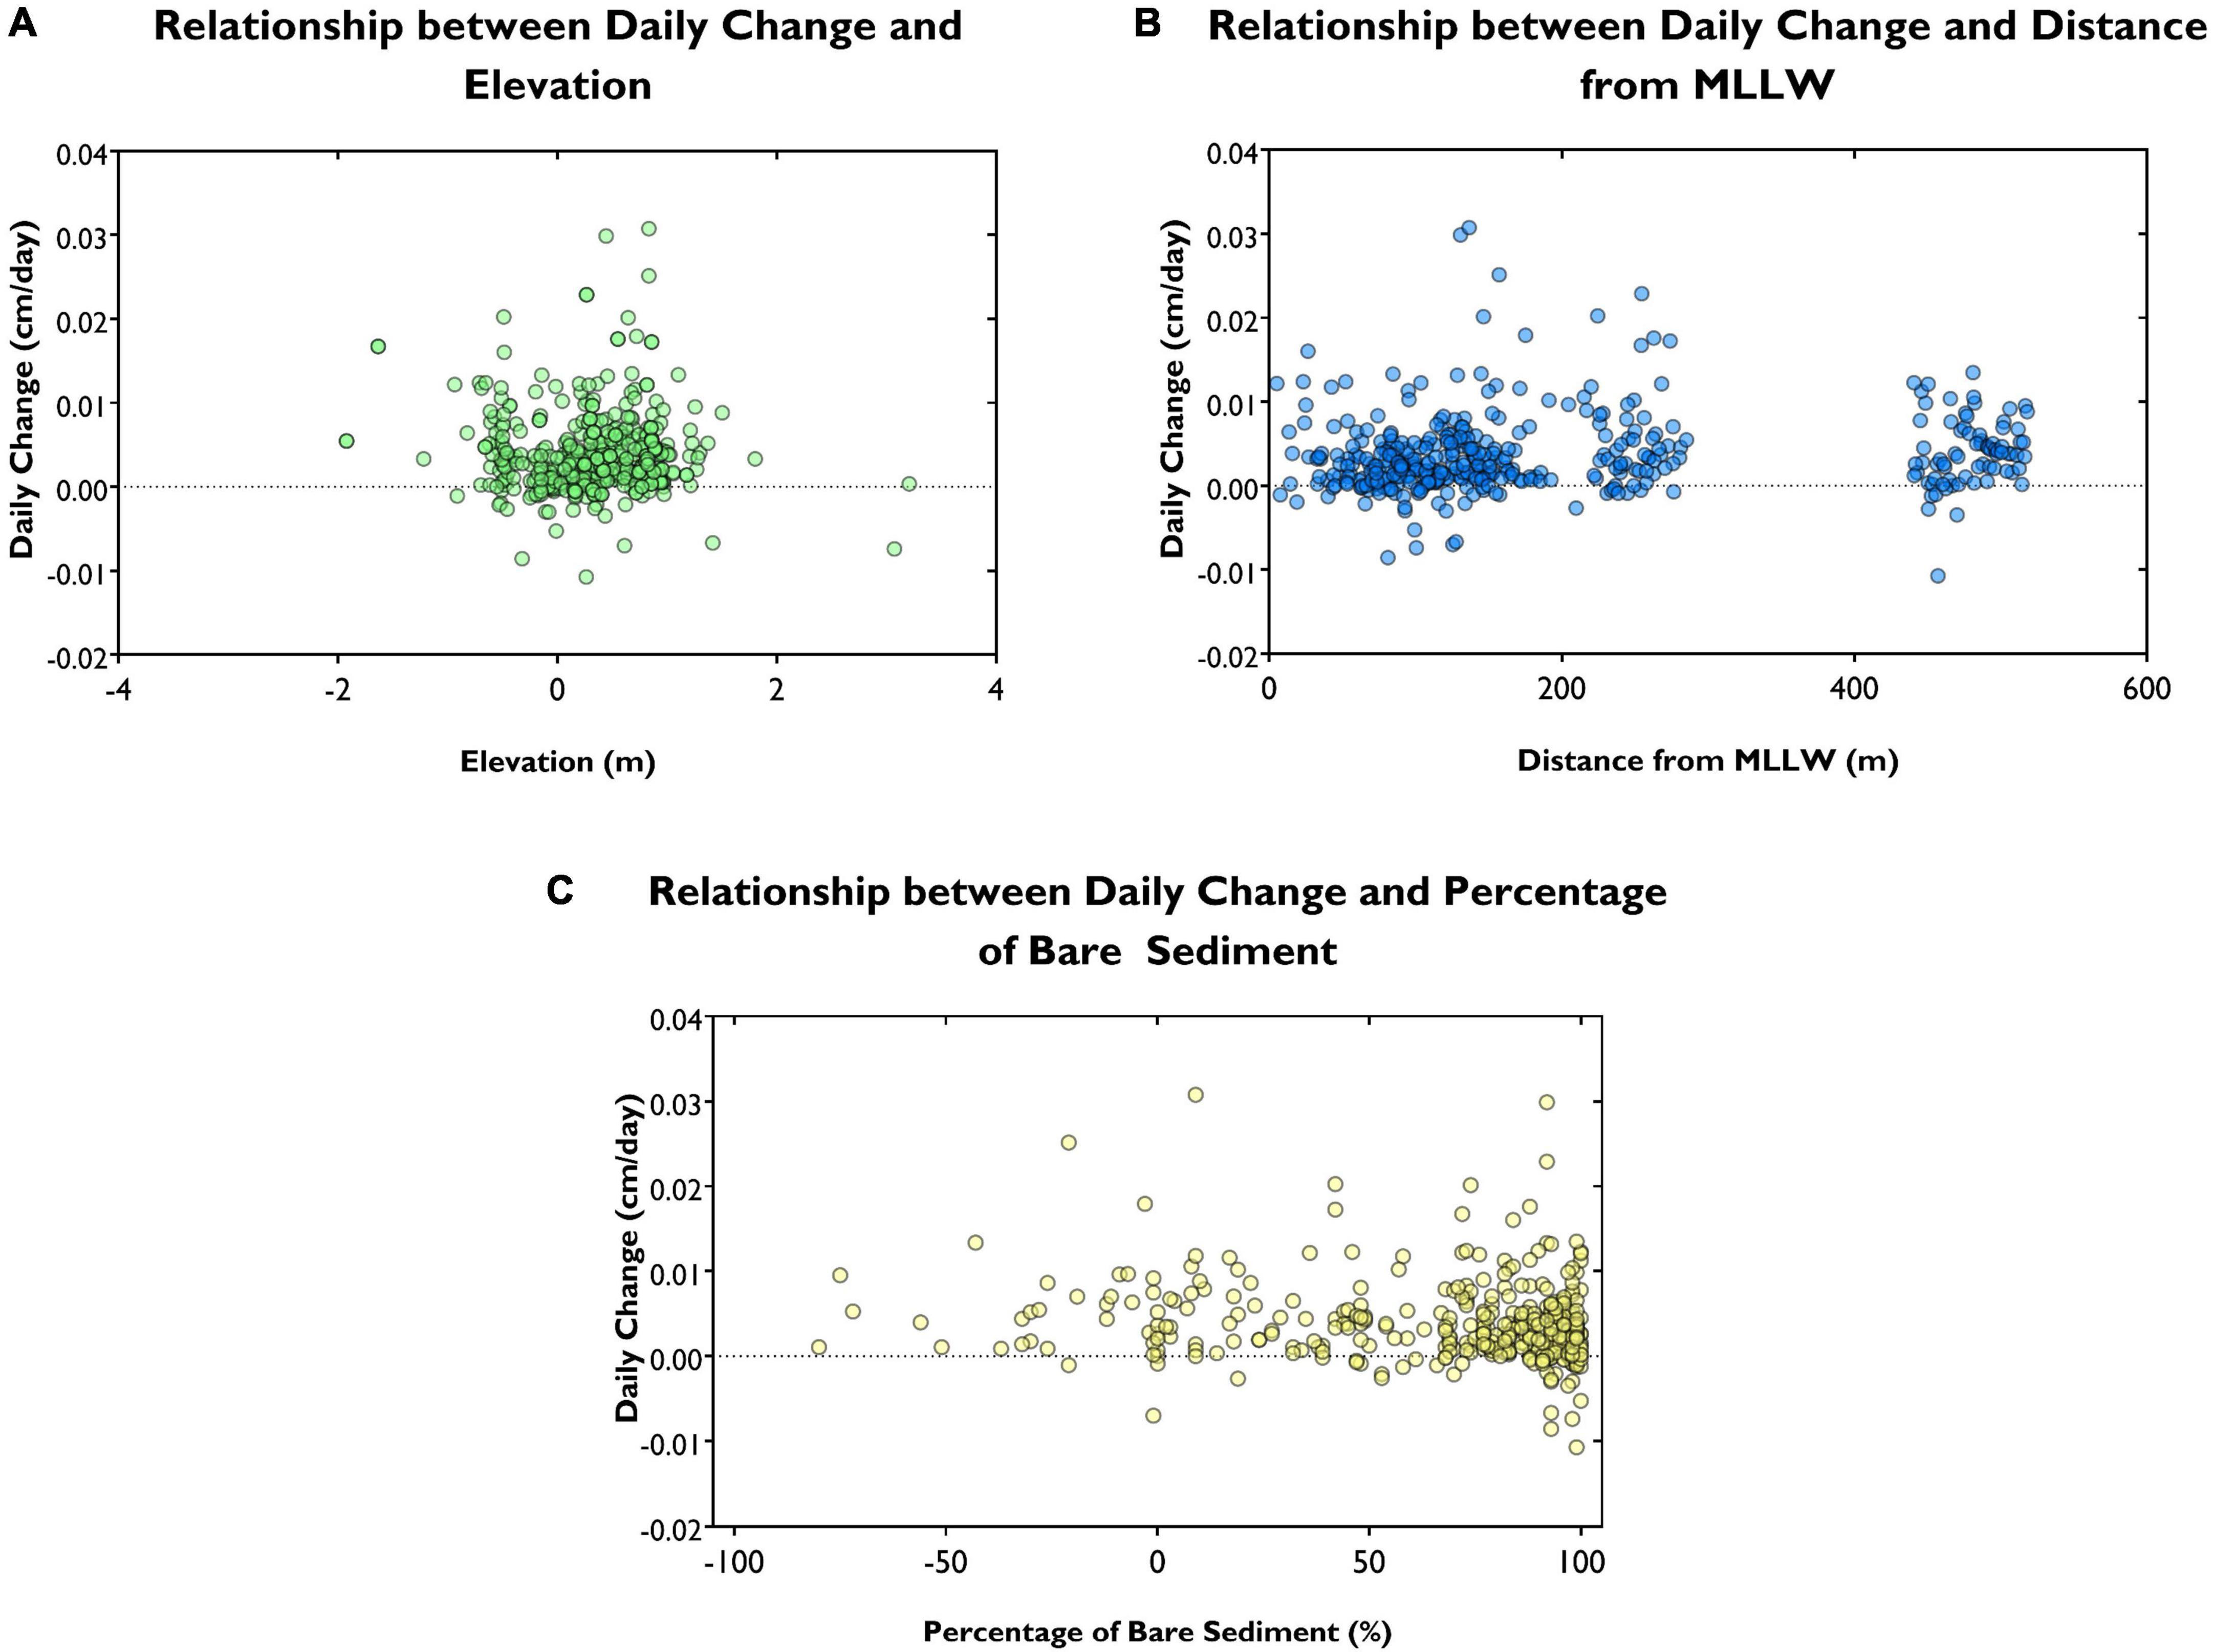
Figure 7. The relationship between long term change and (A) elevation, (B) distance from MLLW and (C) percentage bare sediment.
Intra-Site Variability
The change in sedimentation at each pin over the measurement periods was assessed using the coefficient of variation (CV) of the long term mean (Figure 8). On average, CV at Rhyll (panel e) is lowest and spatially uniform, indicating the highest rate of stability in the sedimentation process. At other sites such as Stony Point and Hastings, higher CVs occur overall and the instability in sedimentation is distributed in a complex pattern that is not explained by the measured geographical parameters of distance from MLLW, vegetation density or elevation. At Pioneer Bay CV is low within the forest, but exceptionally high on the mudflat. This pattern was not seen at other sites. On average, temporal variation between measurements is highest at Tooradin, particularly to the north of the site.
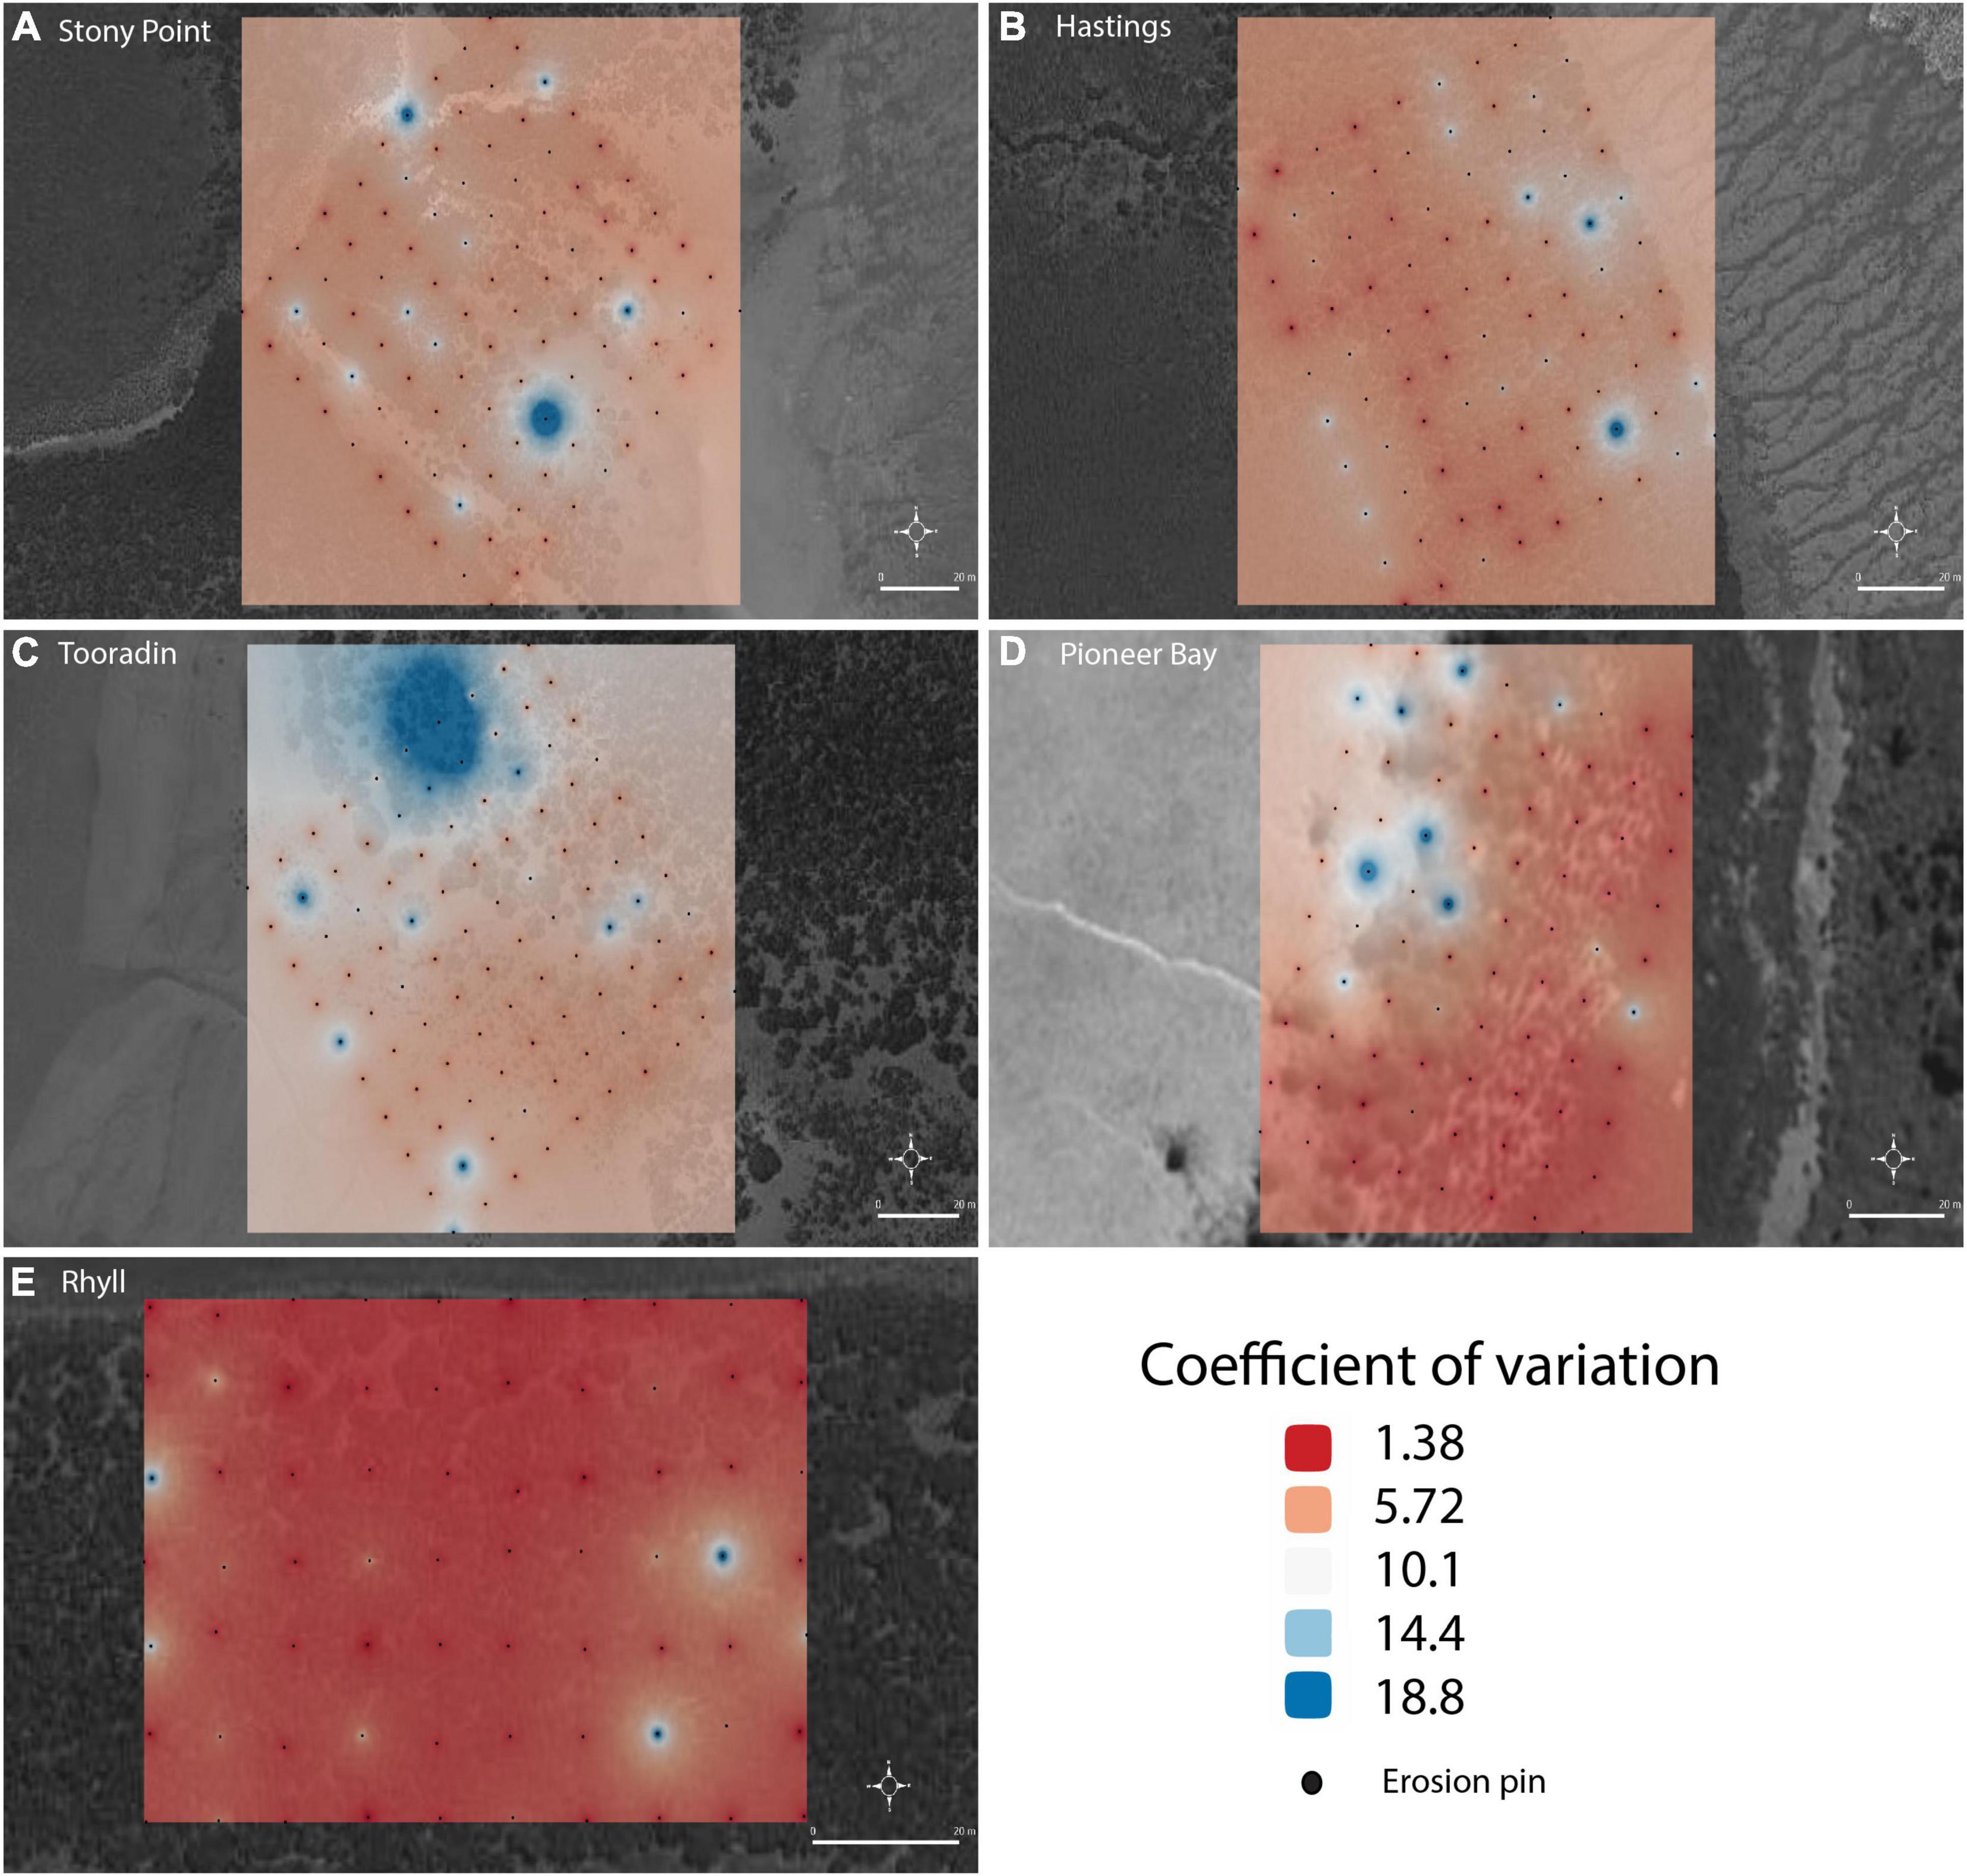
Figure 8. Inter and intra-site measurement coefficient of variation at sites (A) Stony Point, (B) Hastings, (C), Tooradin, (D) Pioneer Bay, (E) Rhyll.
At Stony Point, the site showed an average of 1.6 cm accretion over the 18-month period. The pin which showed the largest erosion at this site (4 cm) is surrounded by both accreting and eroding pins. The 1 × 1 m quadrat around this pin had a high cover of mangrove vegetation and raft, including shells. Distance from MLLW was measured as 125.5 m and elevation was 0.612 m AHD. This pin is located firmly in the middle of the site. In comparison, the pin with the largest accretion of 11.5 cm was located at a similar elevation of 0.645 m and distance from MLLW of 146.3 m. It is surrounded by mostly accreting pins, however, none have accreted quite as much. Its distance from MLLW is greater, at 146.4 m, however, 74% of its surrounds was bare sediment. The difference between the elevations of these pins is not substantial either, with a difference of 0.033 m.
Measurements at Hastings range from −4.2 to 17.5 cm. The pin showing the most erosion at this site is located toward the front of the site, at a distance of 100.5 m from MLLW with 98% bare sediment. The pin with the largest increase is located toward the back of the site, at a distance of 136.6 m from MLLW, and was surrounded by 9% bare sediment. It is away from other highly accreting pins, and is surrounded by much slower accreting pins with measurements of 0.4, 0.5, and 1.2 cm.
Tooradin presents a unique situation. The pin with the highest accretion of 7.5 cm is located in the second row; erosion was only recorded at this pin during the final measurement period. The seaward rows at Tooradin were accreting. Points of higher erosion to the back of the site were randomly dispersed. The greatest sediment loss recorded at Tooradin was 4 cm; this pin showed periods of alternating erosion and accretion over the course of the experiment. Surrounding pins show a mix of erosion and accretion to varying amounts. Both of these pins are located within 100 m of the MLLW, and elevation was recorded as −0.322 and −0.486 m, respectively. Bare sediment around these pins were also recorded as 84 and 93%.
The pin with highest accretion, a measurement of 7.5 cm at Pioneer Bay was located in an area with 99% bare sediment. This is the same bare sediment percentage as the pin which recorded the most erosion at this site, and across all sites: −6.2 cm. As seen so far at other sites, this pin was not continually eroding over the course of the experiment, but instead gained sediment during the first and last measurement periods. This, in stark contrast with the highest accreting pin which continually gained sediment throughout the experiment.
At Rhyll, highly accreting pins of more than 4.1 cm seem to occur in pairs (the distance between pin pairs is 10 m), and accreting pins make up a larger proportion of the total of pins deployed than other sites, and accretion was more stable over time (as indicated by lower CVs). The pin that experienced the highest accretion, of 13 cm, was continuously accreting throughout the entirety of the experiment, and was located in the center of the site. Two other highly accreting pins are located near it, with a few surrounding pins showing erosion. 92% of the quadrat surrounding this pin was bare sediment in comparison to 19% around the pin with the lowest long-term erosion of 1.5 cm. The elevation at these pins were 0.263 and −0.459, respectively.
Discussion
Large Scale Order
While intra-site variability was high, on average all sites exhibited net accretion over the 18-month period. The differences in environmental conditions, as defined by TSM and SWH in this study, did not significantly explain the overall erosion and accretion that occurred at these sites during these periods. Rhyll also experienced erosion between July and November 2020. In comparing these parameters at Hastings to that of Rhyll, average TSM was at its highest during this time of high erosion, and the average calculated SWH was at its second lowest value. The variation in sediment supply between measurements periods did not to significantly affect sedimentation, despite the importance placed on sediment supply by findings of Willemsen et al. (2016) in mangroves and Moskalski and Sommerfield (2012) in salt marshes. The overall net accretion over the measurement period could indicate that sediment supply is sufficient, which could be why sediment supply was not a governing factor of sedimentation within the mangrove. Variation in SWH was also insufficient to explain differences between measurement periods at all sites. These sites do show some important similarities. These sites receive the lowest wave energies of the five sites, and have similar TSM values. Vegetation within these sites is more, similar than other sites with trees being taller, stems being wider, and/or less multi-stemmed. Vegetation at the sites show differences at the vegetation edge and at the mangrove/salt marsh interface. At Rhyll, seaward vegetation is especially short with single stemmed, more flexible vegetation, whereas at Hastings seaward vegetation is quite tall. At the saltmarsh/mangrove interface at Rhyll there is a sharp change from tall mangrove vegetation to saltmarsh, whereas at Hastings, there is a more gradual change with a decrease in the height of mangrove with an intermingling of saltmarsh and mangrove. The differences between the vegetation at these sites are apparent when looking at the spatial distribution of areas of erosion and accretion. The similarities of the parameters investigated between the two sites, and differences compared to the other three sites, are not sufficient to explain the erosion that occurred at these two sites between T1 and T2.
Pioneer Bay, the site which consistently received significantly higher SWH and TSM than all other sites the second highest sedimentation of all sites during the experiment. This high accretion in the presence of higher wave action was also noted by Fricke et al. (2017) in their study which found that the site with greater hydrodynamic energy showed more progradation due to the greater sediment input. The major fluvial sediment inputs in Western Port are highlighted in Figure 1. Erosion of the Lang Lang cliffs is also a known sediment input in the bay. Sediment transport within the bay and to the sites is then governed by the net clockwise circulation of water. Areas near Pioneer Bay and Rhyll sites are considered important depositional areas for mud (Harris et al., 1979). Differences in sedimentation between Rhyll and other sites could be partially linked to the difference in site hydrodynamics; where other sites are fringed by mangroves and sediment is delivered via wave action across the front margin of the mangrove. Sediment delivery and movement at Rhyll may be governed by tidal creek hydrodynamics as well as exchange along the sea margin given its location at the entrance of Rhyll Inlet. In considering the hydrodynamics at this site, the front or North of the site is located along the edge of the Rhyll Inlet. In a study of marsh surface deposition, Reed et al. (1999) showed that high tides which increase creek velocities may provide an increased supply of sediment to the vegetation edge through the amplified potential for sediment remobilization within the creek. Horstman et al. (2017) showed similar patterning at Whangapoua Harbour, New Zealand where greater deposition was recorded at the fringe. The site at Whangapoua Harbour is located behind a land spit, meaning, it is not exposed to direct wave action like most of the sites in this study (Horstman et al., 2017). The east of the site at Rhyll may then receive some more dampened wave energy from the sea/shore margin.
Small Scale Stochasticity
Despite the statistical insignificance of distance from MLLW, elevation, and vegetation characteristics, they can be useful in identifying and examining patterns within the sites as well as the similarity and dissimilarity of adjacent points.
Measurements at Stony Point fit the initial hypothesis of this site, showing lower accretion due to its location within Western Port Bay and the lower supply of sediment to this area. In a closer examination of the coefficient of variation of the pins which showed maximum erosion and accretion, neither of them were consistently eroding or accreting during the entire experiment with both experiencing one period of movement in the opposite direction. Larger scale patterns are not discernible at this site. There are some areas of clustering of accreting pins at the back edges of the site, with some occurring in the mid-back of the site. Both the foremost and hindmost rows show a mix of erosion and accretion. Stony Point also has some clear pathways for faster flow of water through the site. These are unlike smaller creeks or channels observed at other sites, which show erosion within the channel but accretion along the edges. Topography within Stony Point is more heterogenous than other sites. Within site topographic variation was shown to have an influence on sediment deposition through modeling by Horstman et al. (2015) that demonstrated that decreasing this characteristic lead to an increase in average deposition at a site. However, topography at the scale measured was not a significant forcing of sedimentation, suggesting a more complex incorporation of the planform is required. Bed roughness within Stony Point is extremely variable both within site and in comparison to other sites. The site is mostly sandy with muddier areas located in more vegetated areas. Shells are a frequent sight throughout; they were treated as raft in the calculation of bare sediment due to their influence on surface drag and due to covering the erodible material.
Patterns at Hastings were more apparent, with clearer erosion and lower rates of accretion at the foremost (seaward) and hindmost row (the transition zone between mangrove and salt marsh vegetation). Patterning at Hastings could be explained by the presence of runnels at the front of the site which have been shown to have the potential for erosion and resuspension of sediments (Fagherazzi and Mariotti, 2012). Hastings is an archetype for the expected sedimentation pattern where the sediment at the marsh/mudflat interface is remobilised and deposited further into the forest. Turbulence at the vegetation edge is particularly high because it introduces the first obstacles to flow of incoming water and waves (Horstman et al., 2018). Greater vegetation edge erosion than in site was also observed during field measurements by Le Nguyen and Vo Luong (2019) in an overall eroding site. Young and Harvey (1996) also found that sedimentation was lower toward the seaward edge of their study site in Hauraki Plains, New Zealand where the same species variety was present. Increasing pneumatophore density with distance from the sea was found to be the driver for this spatial pattern (Young and Harvey, 1996). Measurement at the highest accreting pin has not changed since the first measurement. There are large low-lying branches near this pin as well as a pathway for large marine debris. This measurement may reflect a combination of these factors. The pin showing the largest erosion exhibited erosion during periods one and two, but accretion during period three and four; a recurring pattern exhibited by the high CV of many of the pins (Figure 8). It should be noted that this pin is located near a crab hole so bioturbation could be a contribution this higher rate of erosion. Our visual inspection suggests that Hastings had a higher occurrence of crab holes throughout the site than the other sites measured, but bioturbation was not quantified in this study. Bioturbation affects bed roughness; the subsequent created drag could be double that of a smooth bed (Shull, 2019). Bioturbation can also result in biostablization of sediments (Horstman et al., 2014; Shull, 2019).
The biophysical characteristics of Tooradin are interesting, as vegetation here is markedly different from other sites with trees with anomalous roots and structure occurring at the front of the site. Tree geometry may play a role in the disparity observed at this site. Differences between the vegetation characteristics of Avicennia marina observed in tropical regions as opposed to temperate regions like these, can have an effect on the distribution of zones of accretion and erosion across a site (Horstman et al., 2018). Vegetation observed at Tooradin was the most heterogenous of all the sites with clustering of younger trees with anomalous roots in the south (front) and south east of the site. Despite this array of vegetation, clear patterns of increased or decreased sedimentation could not be observed between these areas. There is also a small channel that snakes parallel to a few of the pins located at the front of the mangrove. This could imply that hydrodynamics within this part of the site may be different from that of the back of the site. There is the added complication of the proximity of this site to a boat ramp, though wave logger readings did not reveal any significant occurrences of boat wake during the deployment period.
Like Hastings, the last row of erosion pins at Pioneer Bay is located at the transition zone between mangrove and salt marsh vegetation. However, unlike Hastings, there is no clear pattern in this zone with pins showing varying degrees of accretion, and a few of erosion. The differences at these vegetation transition zones can provide insight into the effects of mangroves on sediment supply and accumulation in salt marshes. Coleman et al. (2021) showed that fringing mangroves had no negative impact on sediment delivery or sedimentation in landward saltmarshes in New South Wales. However, results at Hastings show that further investigation could be needed. The vegetation edge at Pioneer Bay is also pointedly different from that of Hastings in terms of vegetation density. The mangrove edge at Hastings is denser and more clearly defined than that of Pioneer Bay, which has areas of large trees as well as areas of little or no vegetation in the first 20 m of the grid. The effect of epiphytic algae which is thought to increase friction (Adame et al., 2010; Le Minor et al., 2021) can also be investigated at Pioneer Bay. While all sites did display the typical landward gradient of a decrease in algal accumulation on pneumatophores, epiphytic algae were particularly prolific at Pioneer Bay. Some pneumatophore diameters were measured as 4 cm due to these algae. Wolanski (1995) mentions that particles sticking to algal mucus, amongst others, is an important process to trapping clay particles. However, sedimentation in these areas at Pioneer Bay were not markedly higher than other areas, in fact, some pins located in these sites showed erosion. A denser fringe can contribute to enhanced deposition within the forest as a result of increased flood dominance (Bryan et al., 2017). This denser fringe is also absent at Stony Point. It is important to note, however, that incident wave energy at Hastings is substantially lower than that of Pioneer Bay and even Stony Point. Sediment deposition may be encouraged in sites with low incoming wave energy where this coincides with higher inundation time (Van Proosdij et al., 2006), but differences in inundation dynamics were not considered in this study. At first glance, patterning at Pioneer Bay seems to be related to the presence or density of vegetation specifically in the North East of the site. Upon closer investigation, some pins located in areas of higher vegetation density are eroding. This is contradictory to findings by Horstman et al. (2015), where sediment deposition was controlled by microtopography (rather than vegetation density). In this study, neither of these factors are sufficient to explain the spatial variation observed.
Analyzing the distribution of sediment gain and loss throughout these sites show that small scale sedimentation is a stochastic process. Thresholds within the data could not be ascertained. This study further highlights the complex interplay of all the factors investigated here. Where previous mangrove and saltmarsh studies highlighted the importance of wave climate and sediment supply to sites (Moskalski and Sommerfield, 2012; Horstman et al., 2015; Willemsen et al., 2016), results from this study show that neither of those factors are statistically significant to explain the spatial variation observed between the study sites here. Young and Harvey (1996) showed that pneumatophore density was a significant factor in determining the distribution of sedimentation in their study while Horstman et al. (2015) stated that within site topography and relative elevation as opposed to vegetation density were determinant factors. This study found that neither of these characteristics were sufficient to explain the intra-site spatial variation exhibited. Findings of Reef et al. (2018) found that the interaction of vegetation characteristics and hydrodynamics are not sufficient to explain sediment deposition patterns was supported by the results found here. Clustering of similarly accreting or eroding pins was significant at all sites but Stony Point at the measured spatial scale (10 m), indicating that for some areas, erosion or deposition events occur at larger scales than the pin grid resolution. Where such clustering occurs, varied among sites and between time points. The clusters of eroding points were observed to be larger in size than clusters of accreting points, however, variation of cluster shape and size within and between sites is large making generalizations difficult (Figure 5). There is also heterogeneity associated with temporal patterns of sedimentation, with not all eroding pins continuously eroding or vice versa, even though some pins show less variation between consecutive measurements than others.
The parameters examined did not explain the temporal and spatial variability exhibited by these sites. In order to understand the spatial and temporal variation observed here and in other studies, more instrumentation and field studies would be needed (Le Minor et al., 2021). This could include short-term experiments which measure tidal characteristics such as inundation depth, time, and tidal pumping. Site specific measurements such as bed shear stress and erodibility would enable the exploration of the binding effects of the biological elements present such as fine rootlets and soil binding microorganisms. Particle size distribution can also provide useful insight into the dynamics on display here. It is important to note, however, that while this study only measured five parameters; TSM, SWH, elevation, distance to MLLW, and vegetation density, using a simple array of erosion pins, it did prove useful in allowing the replication of the study across multiple sites. A complex study which would encompass more variables and equipment would be expensive (Le Minor et al., 2021) and would limit the simultaneous deployment at this many sites, at such a scale. The deployment of grids of erosion pins were also sufficient to provide the data gathered here. Issues with localized scour which was noted in Spenceley (1977) and Nolte et al. (2013) was not observed here. Data gathered here can therefore be used to define further experiments to continue to delve into sediment transport and retention within mangrove ecosystems. The study showed that all the sites are accreting, with the highest accretion occurring at Rhyll and Pioneer Bay. This is in keeping with previous studies which show that these areas are important depositional areas within Westernport Bay (Harris et al., 1979). These results are also in line with some horizontal measurements of growth of the shoreline within the bay with sites such as Tooradin and Hastings showing 0.5 and 0.3 m growth since 1988 (Bishop-Taylor et al., 2021a,b). These results also show that these sites are keeping up with predicted sea level rise in Southern Australia (IPCC, 2021).
Data Availability Statement
The raw data supporting the conclusions of this article will be made available by the authors, without undue reservation.
Author Contributions
SS conducted and led the field campaigns. SS and RR did the analysis of data and article composition. Both authors contributed to the article and approved the submitted version.
Funding
Funding for the fieldwork associated with this project was provided by the Department of Environment, Land, Water and Planning of the Victoria State Government as part of their project investigating changes within Western Port Bay and Australian Research Council Award DP180103444 to RR.
Conflict of Interest
The authors declare that the research was conducted in the absence of any commercial or financial relationships that could be construed as a potential conflict of interest.
Publisher’s Note
All claims expressed in this article are solely those of the authors and do not necessarily represent those of their affiliated organizations, or those of the publisher, the editors and the reviewers. Any product that may be evaluated in this article, or claim that may be made by its manufacturer, is not guaranteed or endorsed by the publisher.
Acknowledgments
We would like to acknowledge members of the School of Earth, Atmosphere and Environment at Monash University for technical support and help during the extensive field campaigns. GlobColour data (http://globcolour.info) used in this study has been developed, validated, and distributed by ACRI-ST, France.
References
Adame, M. F., Neil, D., Wright, S. F., and Lovelock, C. E. (2010). Sedimentation within and among mangrove forests along a gradient of geomorphological settings. Estuar. Coast. Shelf Sci. 86, 21–30. doi: 10.1016/j.ecss.2009.10.013
Bishop-Taylor, R., Nanson, R., Sagar, S., and Lymburner, L. (2021a). DEA Coastlines. Australia: Commonwealth of Australia.
Bishop-Taylor, R., Nanson, R., Sagar, S., and Lymburner, L. (2021b). Mapping Australia’s dynamic coastline at mean sea level using three decades of Landsat imagery. Remote Sens. Env. 267:112734. doi: 10.1016/j.rse.2021.112734
Bryan, K. R., Nardin, W., Mullarney, J. C., and Fagherazzi, S. (2017). The role of cross-shore tidal dynamics in controlling intertidal sediment exchange in mangroves in Cù Lao Dung. Continent. Shelf Res. 147, 128–143. doi: 10.1016/j.csr.2017.06.014
Coleman, D. J., Rogers, K., Corbett, D. R., Owers, C. J., and Kirwan, M. L. (2021). The geomorphic impact of mangrove encroachment in an Australian salt marsh. Estuar. Coast. Shelf Sci. 251:107238. doi: 10.1016/j.ecss.2021.107238
Doerffer, R., and Schiller, H. (2007). The MERIS Case 2 water algorithm. Int. J. Remote Sens. 28, 517–535. doi: 10.1080/01431160600821127
Du, Q., Qin, Z., Ming, S., and Zhang, C. (2021). Differences in the vertical accretion of sediment among mangrove species with different aerial root types. Estuar. Coast. Shelf Sci. 256:107375. doi: 10.1016/j.ecss.2021.107375
Du, Q., and Zhang, C. (2020). The vertical accretion of sediment under the alien mangrove species Sonneratia apetala and the indigenous species Aegiceras corniculatum. Wetl. Ecol. Manage. 28, 595–606. doi: 10.1007/s11273-020-09734-z
Ellison, J. C. (2019). “Biogeomorphology of mangroves,” in Coastal Wetlands: an Ecosystem Integrated Approach, eds G. M. E. Perillo, E. Wolanski, and D. R. Cahoon, C.S. Hopkinson (Amsterdam: Elsevier Science), 687–715. doi: 10.1016/B978-0-444-63893-9.00020-4
Fagherazzi, S., and Mariotti, G. (2012). Mudflat runnels: evidence and importance of very shallow flows in intertidal morphodynamics. Geophys. Res. Lett. 39:14402. doi: 10.1029/2012GL052542
Fricke, A. T., Nittrouer, C. A., Ogston, A. S., and Vo-Luong, H. P. (2017). Asymmetric progradation of a coastal mangrove forest controlled by combined fluvial and marine influence, Cù Lao Dung, Vietnam. Cont. Shelf Res. 147, 78–90. doi: 10.1016/j.csr.2017.07.012
Furukawa, K., and Wolanski, E. (1996). Sedimentation in Mangrove Forests. Mangroves Salt Marshes 1, 3–10. doi: 10.1023/A:1025973426404
Harris, J. E., Hinwood, J. B., Marsden, M. A. H., and Sternberg, R. W. (1979). Water movements, sediment transport and deposition in Western Port. Mar. Geol. 30, 131–161. doi: 10.1016/0025-3227(79)90010-0
Horstman, E. M., Dohmen-Janssen, C. M., Bouma, T. J., and Hulscher, S. J. M. H. (2015). Tidal-scale flow routing and sedimentation in mangrove forests: combining field data and numerical modelling. Geomorphology 228, 244–262.
Horstman, E. M., Dohmen-Janssen, C. M., Narra, P. M. F., Van Den Berg, N. J. F., Siemerink, M., and Hulscher, S. J. M. H. (2014). Wave attenuation in mangroves: a quantitative approach to field observations. Coast. Eng. 94, 47–62. doi: 10.1016/j.coastaleng.2014.08.005
Horstman, E. M., Lundquist, C. J., Bryan, K. R., Bulmer, R. H., Mullarney, J. C., and Stokes, D. (2018). The Dynamics of Expanding Mangroves in New Zealand. Threats To Mangrove Forests. New York: Springer International Publishing AG.
Horstman, E. M., Mullarney, J. C., Bryan, K. R., and Sandwell, D. R. (2017). “Deposition gradients across mangrove fringes,” in Proceedings of Coastal Dynamics, eds T. Aagaard, R. Deigaard, and D. Fuhrman (Denmark: Helsingør), 911–922.
IPCC (2021). Climate Change 2021: The Physical Science Basis. Contribution of Working Group I to the Sixth Assessment Report of the Intergovernmental Panel on Climate Change. Cambridge: Cambridge University Press.
Kakeh, N., Coco, G., and Marani, M. (2016). On the morphodynamic stability of intertidal environments and the role of vegetation. Adv. Water Res. 93, 303–314. doi: 10.1016/j.advwatres.2015.11.003
Krauss, K. W., Allen, J. A., and Cahoon, D. R. (2003). Differential rates of vertical accretion and elevation change among aerial root types in Micronesian mangrove forests. Estuar. Coast. Shelf Sci. 56, 251–259. doi: 10.1016/S0272-7714(02)00184-1
Krauss, K. W., Mckee, K. L., Lovelock, C. E., Cahoon, D. R., Saintilan, N., Reef, R., et al. (2014). How mangrove forests adjust to rising sea level. New Phytol. 202, 19–34. doi: 10.1111/nph.12605
Le Minor, M., Zimmer, M., Helfer, V., Gillis, L. G., and Huhn, K. (2021). “Flow and sediment dynamics around structures in mangrove ecosystems—a modeling perspective,” in Dynamic Sedimentary Environments of Mangrove Coasts, eds F. Sidik and D. Friess (Netherlands: Elsevier, Amsterdam), 83–120. doi: 10.1016/B978-0-12-816437-2.00012-4
Le Nguyen, H. T., and Vo Luong, H. P. (2019). Erosion and deposition processes from field experiments of hydrodynamics in the coastal mangrove area of Can Gio. Vietnam Oceanol. 61, 252–264. doi: 10.1016/j.oceano.2018.11.004
Moskalski, S. M., and Sommerfield, C. K. (2012). Suspended sediment deposition and trapping efficiency in a Delaware salt marsh. Geomorphology 139-140, 195–204. doi: 10.1016/j.geomorph.2011.10.018
Mullarney, J. C., Henderson, S. M., Reyns, J. A. H., Norris, B. K., and Bryan, K. R. (2017). Spatially varying drag within a wave-exposed mangrove forest and on the adjacent tidal flat. Cont. Shelf Res. 147, 102–113. doi: 10.1016/j.csr.2017.06.019
Nolte, S., Koppenaal, E. C., Esselink, P., Dijkema, K. S., Schuerch, M., De Groot, A. V., et al. (2013). Measuring sedimentation in tidal marshes: a review on methods and their applicability in biogeomorphological studies. J. Coast. Conserv. 17, 301–325. doi: 10.1007/s11852-013-0238-3
Norris, B. K., Mullarney, J. C., Bryan, K. R., and Henderson, S. M. (2017). The effect of pneumatophore density on turbulence: a field study in a Sonneratia-dominated mangrove forest. Vietnam Cont. Shelf Res. 147, 114–127. doi: 10.1016/j.csr.2017.06.002
Reed, D. J., Spencer, T., Murray, A. L., French, J. R., and Leonard, L. (1999). Marsh surface sediment deposition and the role of tidal creeks: Implications for created and managed coastal marshes. J. Coast. Conserv. 5, 81–90. doi: 10.1007/bf02802742
Reef, R., Schuerch, M., Christie, E. K., Möller, I., and Spencer, T. (2018). The effect of vegetation height and biomass on the sediment budget of a European saltmarsh. Estuar. Coast. Shelf Sci. 202, 125–133. doi: 10.1016/j.ecss.2017.12.016
Saleh, F., and Weinstein, M. P. (2016). The role of nature-based infrastructure (NBI) in coastal resiliency planning: a literature review. J. Environ. Manage 183, 1088–1098. doi: 10.1016/j.jenvman.2016.09.077
Sheehan, M. R., and Ellison, J. C. (2015). Tidal marsh erosion and accretion trends following invasive species removal, Tamar Estuary, Tasmania. Estuar. Coast. Shelf Sci. 164, 46–55. doi: 10.1016/j.ecss.2015.06.013
Shull, D. H. (2019). Bioturbation. Encyclopedia Ocean Sci. 2, 671–676. doi: 10.1016/B978-0-12-409548-9.11493-9
Spenceley, A. P. (1977). The role of pneumatophores in sedimentary processes. Mar. Geol. 24, M31–M37. doi: 10.1016/0025-3227(77)90001-9
Stokes, D. J., and Harris, R. J. (2015). Sediment properties and surface erodibility following a large-scale mangrove (Avicennia marina) removal. Cont. Shelf Res. 107, 1–10.
Van Proosdij, D., Davidson-Arnott, R. G. D., and Ollerhead, J. (2006). Controls on spatial patterns of sediment deposition across a macro-tidal salt marsh surface over single tidal cycles. Estuar. Coast. Shelf Sci. 69, 64–86. doi: 10.1016/j.ecss.2006.04.022
Wallbrink, P. J., Hancock, G. J., Olley, J. M., Hughes, A. O., Prosser, I. P., Hunt, D., et al. (2003). The Western Port Sediment Study. Canberra, AU: CSIRO Land and Water.
Willemsen, P. W. J. M., Horstman, E. M., Borsje, B. W., Friess, D. A., and Dohmen-Janssen, C. M. (2016). Sensitivity of the sediment trapping capacity of an estuarine mangrove forest. Geomorphology 273, 189–201. doi: 10.1016/j.geomorph.2016.07.038
Wolanski, E. (1995). Transport of sediment in mangrove swamps. Hydrobiologia 295, 31–42. doi: 10.1007/978-94-011-0289-6_5
Keywords: temperate mangrove, sediment, ecosystem service, vegetation structure, biophysical interaction
Citation: Sayers S and Reef R (2022) Short-Term Sedimentation Dynamics of Temperate Mangroves in Western Port Bay, Victoria. Front. Mar. Sci. 9:832148. doi: 10.3389/fmars.2022.832148
Received: 09 December 2021; Accepted: 07 February 2022;
Published: 28 February 2022.
Edited by:
Iris Möller, Trinity College Dublin, IrelandCopyright © 2022 Sayers and Reef. This is an open-access article distributed under the terms of the Creative Commons Attribution License (CC BY). The use, distribution or reproduction in other forums is permitted, provided the original author(s) and the copyright owner(s) are credited and that the original publication in this journal is cited, in accordance with accepted academic practice. No use, distribution or reproduction is permitted which does not comply with these terms.
*Correspondence: Sabrina Sayers, c2FicmluYS5zYXllcnNAbW9uYXNoLmVkdQ==