 Feiyang Ge1,2
 Zhiyuan Ma2,3
 Bin Chen2,3
 Yu Wang2
 Xiaoqian Lu1
 Shenqun An1
 Dian Zhang2
 Wanting Zhang2
 Weiwei Yu2,3*
 Wenxuan Han1*Xingguang Yu2
 Zhenghua Liu2Fangfang Kuang2
- 1Beijing Key Laboratory of Biodiversity and Organic Farming, China Agricultural University, Beijing, China
- 2Third Institute of Oceanography, Ministry of Natural Resources, Xiamen, China
- 3Key Laboratory of Marine Ecological Conservation and Restoration, Ministry of Natural Resources, Xiamen, China
Understanding diversity patterns and associated driving factors are the critical topics in macroecology and conservation biology. Phytoplankton are highly susceptible to environmental changes in estuaries, particularly eutrophication. This study examined phytoplankton alpha and beta diversity using investigation data in May (springtime), August (summer) and November (autumn) 2009 in China’s Jiulong River estuary, where it was easily polluted because of considerable discharge from a highly dense human population and low self-purification capacity with its limited river basin area, potentially resulting in eutrophication and then influencing phytoplankton diversity. Potential influencing factors were also explored, including dissolved oxygen, salinity, nutrients, nutrient ratios, geographic and hydrologic distance, and so on. The results indicated that Shannon’s index (H’) and Pielou’s index (J) decreased from the estuary’s upper to middle and then increased from middle to lower reaches, Simpson’s (D) observed the opposite trend and species number (S) gradually increased from the estuary’s upper to lower reaches. For beta diversity, all the indices showed a gradual decrease trend from the estuary’s upper to lower reaches, where also, turnover dominated beta diversity for all seasons. It is noteworthy that the significant roles that nutrients and nutrient ratios played in shaping phytoplankton diversity patterns and the nutrient balance were characterized by excess nitrogen (N) and silicon (Si) and limited phosphorus (P), which could potentially cause diatom blooms. Findings also showed that decreasing Si concentrations can help to reduce overall pollution levels as well as the restoration of the estuary’s ecosystem better than just reducing N alone. Accordingly, this study advocates for the protection of the entire estuary system with particular emphasis on its upper reaches. Moreover, greater attention should also be paid to impacts associated with N input and nutrient ratio trade-offs to the prospective watershed management of this estuary. This study provides a practical approach to explore estuarine diversity in a comprehensive way, which can inform effective biodiversity conservation and also be applied to other marine ecosystems to better guide sustainable management and conservation practices.
Introduction
Reducing biodiversity loss has become a global issue on both land and sea (Blowes et al., 2019; Pinsky et al., 2019; Cooper et al., 2020; Trisos et al., 2020). The Earth is presently experiencing an extinction crisis that is largely the result of anthropogenic exploitation, which has caused widespread changes in the global distribution of organisms (Chapin et al., 2000), where roughly one million species are threatened with extinction (Balvanera, 2019). The biodiversity of ocean systems is higher than terrestrial systems, while the rate of loss in marine biodiversity occurs much quicker compared to terrestrial biodiversity caused by climate change and anthropogenic impacts (Blowes et al., 2019; Pinsky et al., 2019; Cooper et al., 2020; Trisos et al., 2020). Furthermore, a decline in marine biodiversity has caused to reduction or loss of some ocean or coastal ecosystem services and functions (Blowes et al., 2019; Pinsky et al., 2019; Cooper et al., 2020; Paul et al., 2020; Trisos et al., 2020).
Estuaries act as transitional zones between brackish and freshwater, where intense material exchanges take place among terrestrial, riverine, and marine ecosystems, subsequently playing a critical role in biogeochemical cycling (Srichandan et al., 2019). High diversity and productivity are critical characteristic of estuarine systems (Dursun and Tas, 2019), which comprise of various ecosystem services and a high natural capital value (Costanza et al., 1997). However, estuaries are susceptible to a variety of natural and anthropogenic disturbances (Gillanders et al., 2011; Atwood et al., 2012; Bucci et al., 2012; O’Brien et al., 2016). It has been estimated that greater than 60% of the world’s population and two-thirds of mid- to large-sized cities are distributed within and around estuarine and coastal areas (Ma and Mao, 2014; O’Brien et al., 2016). Over the past half century, intensive anthropogenic disturbances have dramatically increased nutrient inputs into estuaries from inland sources, causing widespread eutrophication (Nixon, 1995; NRC (National Research Council), 2000; Rabalais, 2002; Ho et al., 2019) that ultimately results in the degradation of habitats and a decrease in biodiversity (NRC (National Research Council), 2000; Bricker et al., 2008; Zhao et al., 2010; Clark et al., 2015). Accordingly, nutrient pollution in estuaries and associated effects have garnered increasing attention throughout the world (Liu and Shen, 2001; Li et al., 2014; Paerl et al., 2014; Wallace et al., 2014; Fennel and Testa, 2018; Barletta et al., 2019; Wurtsbaugh et al., 2019).
Being both the most important primary producer and the fundamental component of the food web, phytoplankton are an essential constituent of marine ecosystems (Dursun and Tas, 2019). However, phytoplankton is susceptible to nutrient concentrations (Redfield, 1934; Paerl et al., 2007), whose biomass and patterns will be dramatically altered in the presence of such nutrients. To some extent, the composition, structure, function, and spatiotemporal distribution of phytoplankton indicate the environmental quality status and the biological integrity of aquatic ecosystems (Ekwu and Sikoki, 2006). In macroecology and conservation biology, it is critical to understand phytoplankton spatial diversity patterns (Collen et al., 2013). In doing so, previous studies primarily focused on alpha and gamma diversity (Muylaert et al., 2009; Rochelle-Newall et al., 2011; Guo et al., 2014; Bharathi and Sarma, 2019; Dursun and Tas, 2019), while little attention has been paid to beta diversity. Although both alpha and gamma diversity are indicative of species richness, their spatial scales dramatically differ, where the former refers to in-site diversity (i.e., local species pools) and the latter refers to overall diversity (i.e., regional species pools). Notably differing from alpha and gamma diversity, beta diversity refers to between-site diversity across different habitats, ecosystems, or regions (Whittaker, 1960), which reflect community construction processes as well as biodiversity formation and maintenance (Condit et al., 2002; Kraft et al., 2011; Legendre and De Cáceres, 2013; Li et al., 2016). Given the considerable habitat gradients of estuarine systems (e.g., that associated with salinity levels), beta diversity (used in conjunction with alpha and gamma diversity) and associative patterns provide much more informative results. This approach is key to understanding estuarine response to anthropogenic activities.
Numerous studies have documented many factors that contribute to phytoplankton diversity, which mostly include alpha diversity, such as salinity (Elliot and Whitfield, 2011; Mousing et al., 2016; Bode et al., 2017; Stefanidou et al., 2020), nutrients (Bode et al., 2017), organic matter variables (Bode et al., 2017), hydromorphology (Elliot and Whitfield, 2011), sunlight (Wang et al., 2020), and spatial structure (Moresco et al., 2017; Yang et al., 2017). However, there is only limited information on potential factors that influence beta diversity patterns (Mousing et al., 2016; Moresco et al., 2017; Yang et al., 2017; Stefanidou et al., 2020; Wang et al., 2020), and even less on the different factors between alpha and beta diversity. It is important to note that the significant role that nutrients concentrations play in phytoplankton diversity is widely recognized among researchers (Huppert et al., 2002, 2005; Ji et al., 2016). Additionally, although nutrient ratios have attracted considerable attention from the scientific community, the role they play in natural ecosystems is not well understood (Redfield, 1934; Falkowski and Davis, 2004; Koeve and Kähler, 2010; Mills and Arrigo, 2010; Weber and Deutsch, 2010; Peñuelas et al., 2013). This is because relevant studies have mostly conducted controlled experiments (Chislock et al., 2014; Xu et al., 2014; Thrane et al., 2016; Jacquemin et al., 2018; Schulhof et al., 2019; Bach et al., 2020; Zhou et al., 2021).
The Jiulong River estuary is one of China’s most important estuarine systems. It is characterized by an extremely dense human population (13.39 million) that subsists within a limited river basin area (1.47 × 10⁴ km2) (Fujian Provincial Bureau of Statistics, 2020), which roughly corresponds to approximately 41% of the areas of the Hudson River basin, Canada, under a population density equivalent to New York City, United States. A highly dense human population in conjunction with highly intensive anthropogenic activities pose great pressure on the Jiulong River estuary, where annual dissolved inorganic nitrogen (DIN) flux is 8.278 × 10⁴ t⋅yr–1, soluble reactive phosphorus (SRP) flux is 0.195 × 10⁴ t⋅yr–1, and dissolved silica (DSi) flux is 17.831 × 10⁴ t⋅yr–1 (Wu et al., 2017), which may shape and influence phytoplankton diversity patterns, given that phytoplankton are the most sensitive aquatic community to nutrient pollution. This study used the Jiulong River estuary as the study area to (i) examine spatial patterns of phytoplankton species diversity along estuary to offshore gradients, using both alpha and beta diversity; to (ii) explore potential factors that shape diversity patterns, particularly within an environmental context, and to test whether differences exist between alpha and beta diversity; and to (iii) evaluate the relative roles that nutrient concentrations and nutrient ratios play in shaping diversity patterns.
Materials and Methods
Study Area
The Jiulong River estuary is situated along China’s southeastern coast at the southern point of the East China Sea. This estuary originates from Longyan and Zhangzhou cities, with a total length of 1,923 km and a basin area of 1.47 × 10⁴ km2 (Figure 1; Huang, 2008). Nutrient and pollutant runoff flows into the estuary through three tributaries, namely, the Beixi River, the Xixi River, and the Nanxi River, which together strongly impact the Jiulong River estuary. The estuary is comprised of several ecosystems, such as mangrove, salt marsh, tidal flats, and brackish water, which provide important spawning ground habitats for many marine organisms. In 1988, the Jiulong River Estuary Provincial Mangrove Reserve (with a total area of 420.2 ha) was established to protect its mangrove ecosystem, wetland waterfowl community, and endangered wildlife. The Jiulong River estuary is an also important habitat for the Indo-Pacific humpback dolphin (Sousa chinensis), which the IUCN Red List of Threatened Species has classified as “Vulnerable.” The estuary also acts as a migratory “stopover” for thousands of migratory waterfowls in the East Asian–Australasian Flyway.
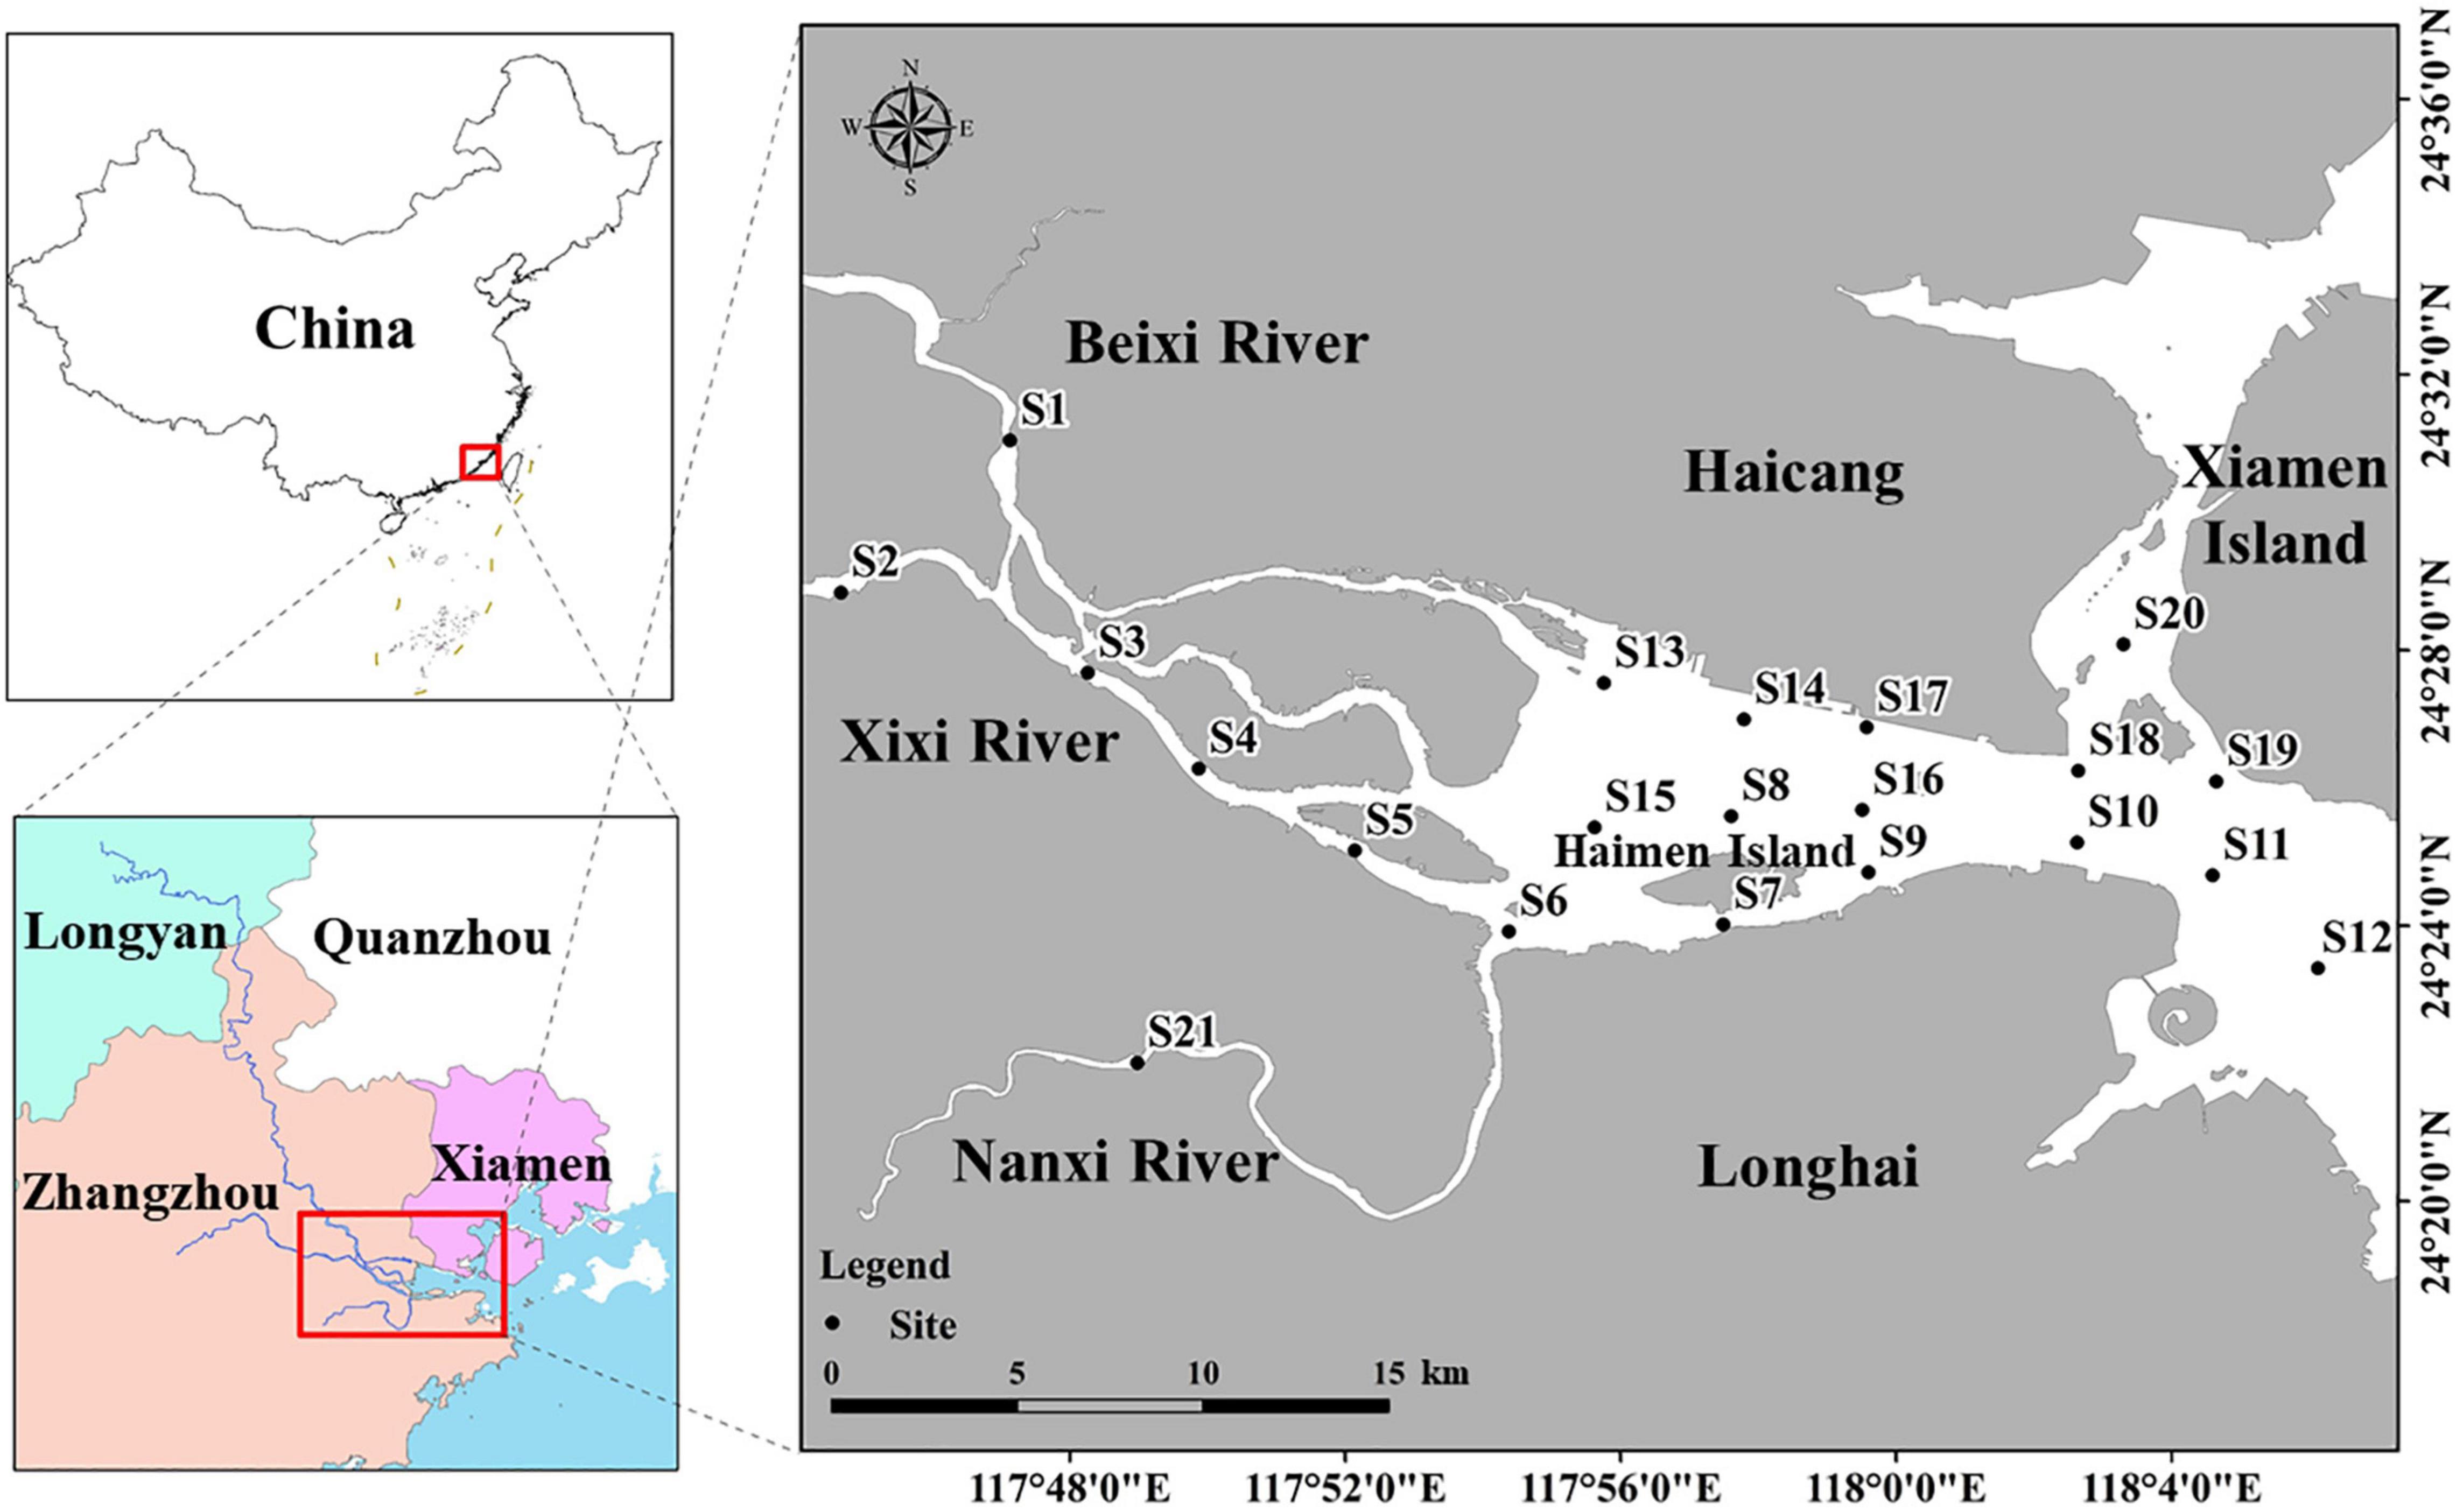
Figure 1. Study area and sampling sites of Jiulong River estuary.
Methodological Approach
The study approach is provided in Figure 2. First, species diversity indices were selected and calculated, including alpha and beta diversity. Then, a quantile-quantile test (i.e., Q–Q test) was used to verify data normality of alpha diversity, while Ordinary Kriging was used to map distribution. At the same time, the study area was divided into different subregions based on salinity clustering and geographical characteristics, and beta diversity distribution was mapped for pairwise site and subregion comparisons. Finally, Pearson’s r was applied to calculate the relationship between environmental variables and diversity indices, after which optimal equations were obtained by means of stepwise regression, which was used to identify critical environmental factors that contribute to spatial patterns in phytoplankton diversity.
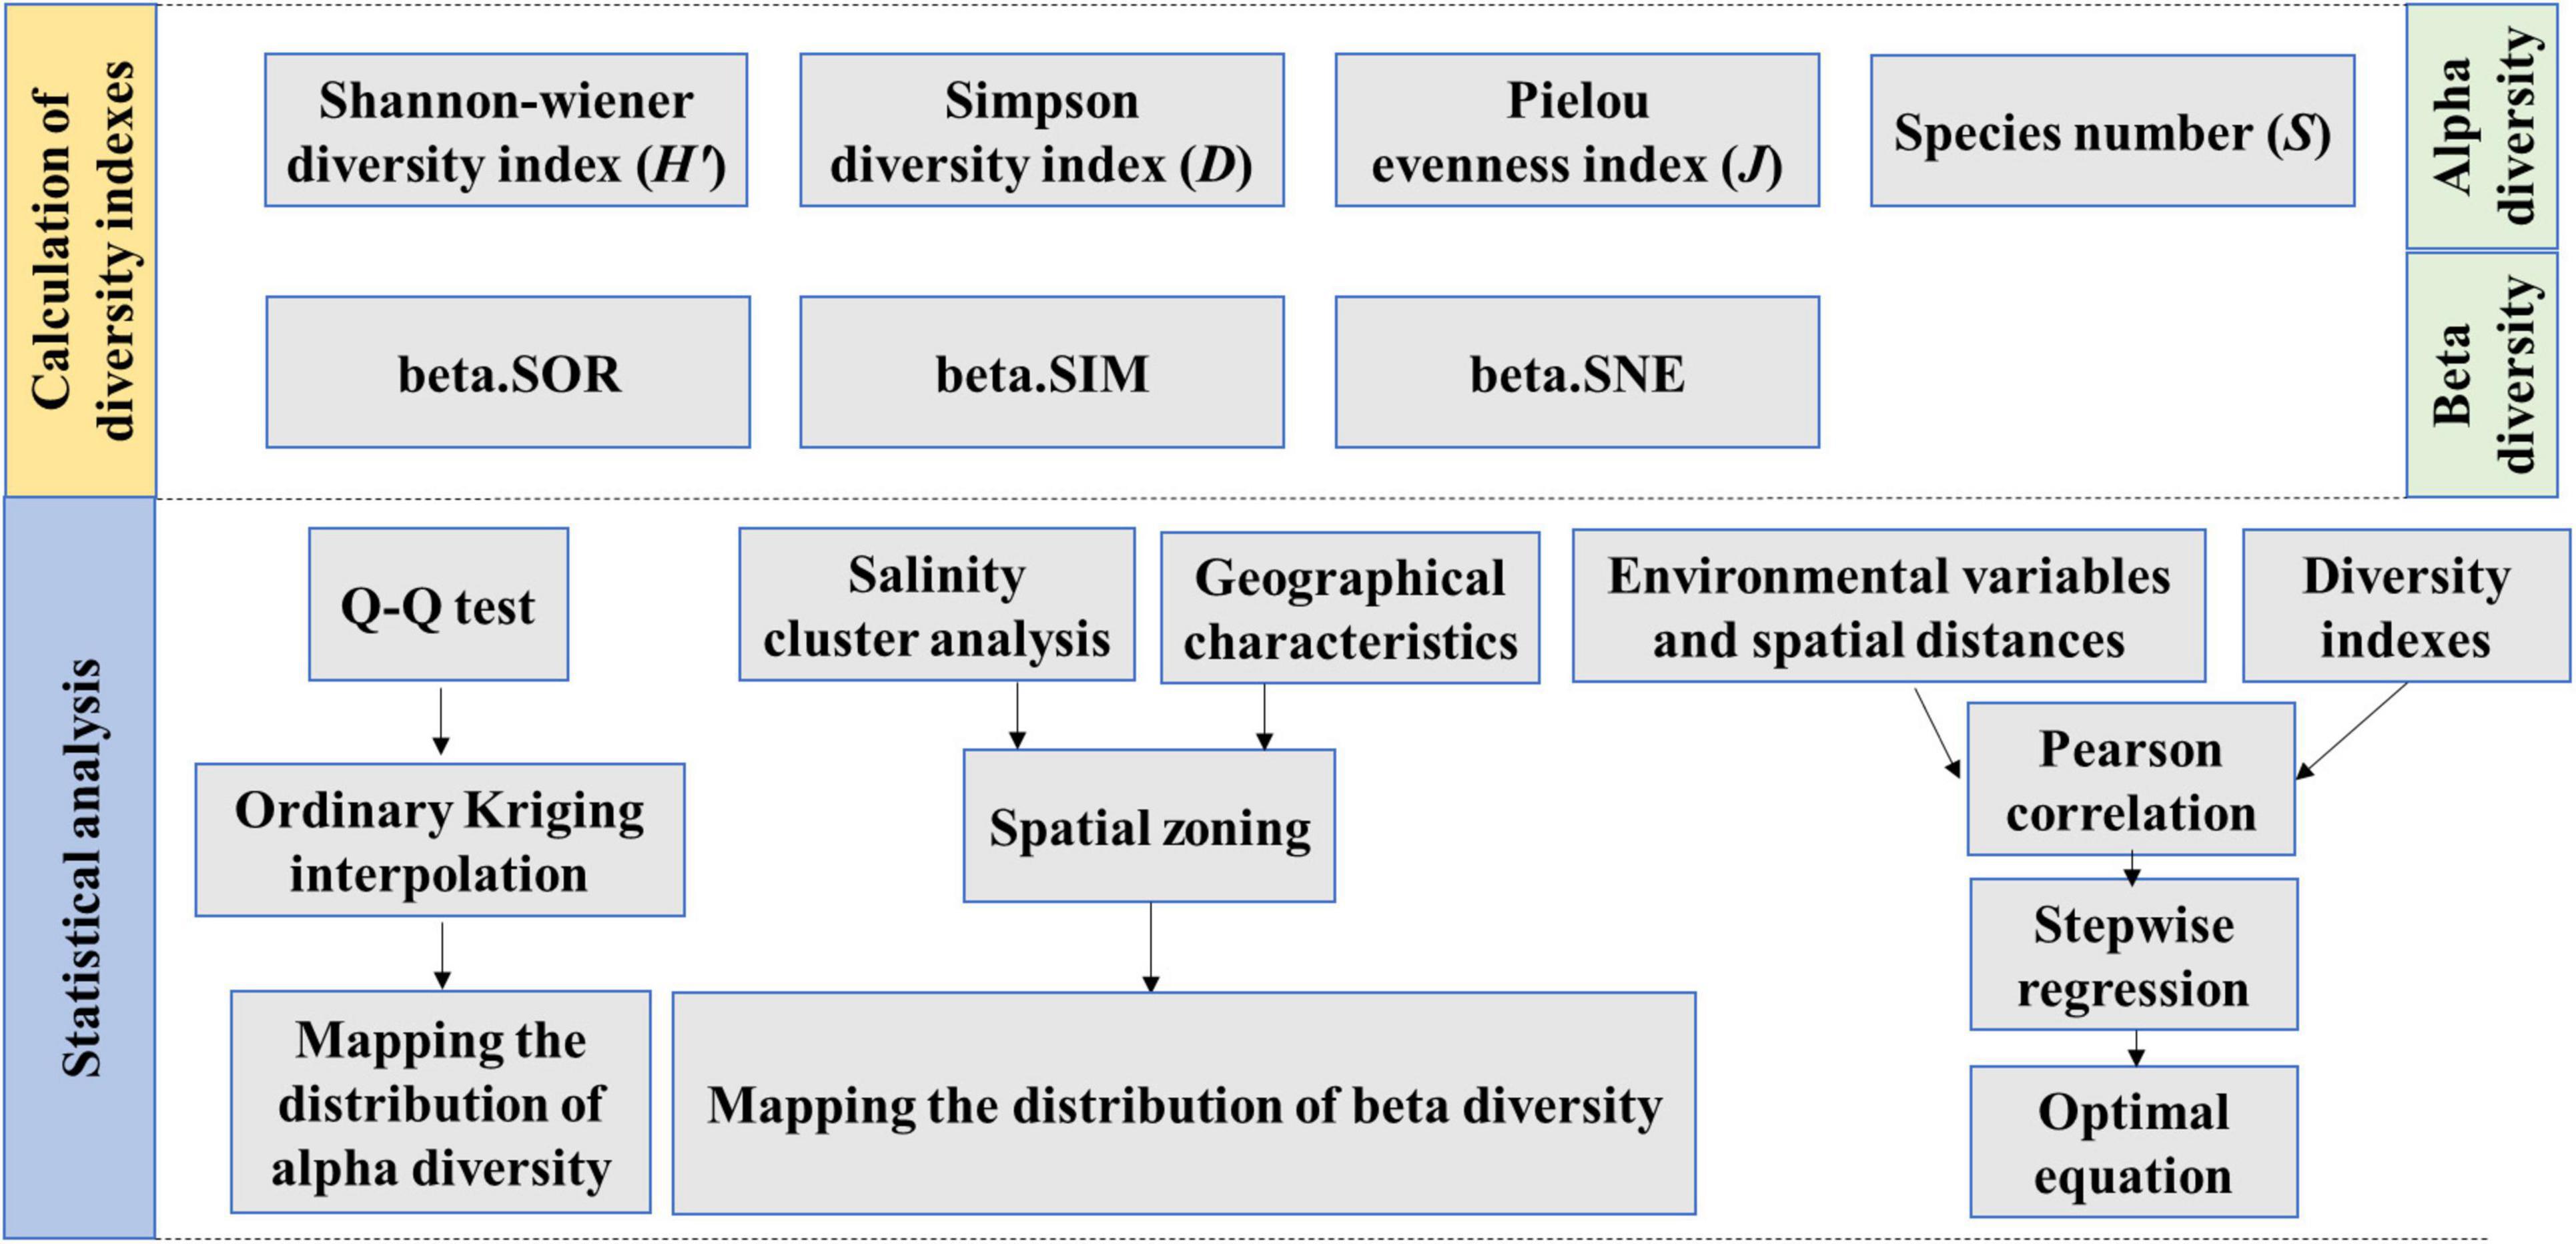
Figure 2. Methodology flowchart.
Data Sources
The phytoplankton and environmental data used in this study were obtained from Yu et al. (2012). These data were collected at 21 locations along the estuary during three field campaigns, namely, in May (springtime), August (summer), and November (autumn) 2009 (Figure 1). All samples were obtained during low tide. Niskin bottles (5 L) was used to collect water samples, where two water depths were conducted, i.e., surface samples at a water depth below 5 m and bottom samples at a water depth above 5 m. Three duplicate samples were also collected from each location.
Phytoplankton organisms contained in the samples were then transferred to glass sampler bottles and fixed in a 2% glutaraldehyde solution. Referring to traditional phytoplankton identification systems (Jin and Chen, 1960; Hu et al., 1980; Tomas, 1997), species identification and phytoplankton enumeration were conducted using an epifluorescence microscope. The original phytoplankton species data supporting Yu et al. (2012) were provided in the Supplementary Table 2.
The environmental data of 15 variables were extracted from the Figures of Yu et al. (2012), including pH, dissolved oxygen (DO), chemical oxygen demand (COD), temperature (T), salinity (Sal), water depth (WD), Total nitrogen (TN), DIN (i.e., the sum total of ammonium, nitrate, and nitrite), silicate (SiO4–-Si), nitrate (NO3–-N), nitrite (NO2–-N), ammonium (NH4+-N), total phosphorus (TP), dissolved inorganic phosphorus (DIP), suspended particulate matter (SPM). A multi-parameter probe (YSI 6600 V2) was used to measure pH and DO. A conductivity-temperature-depth (CTD) system was used to measure T, Sal, and WD. Samples used for nutrient concentration measurements were kept in 2 L plastic bottles at −4 °C and measured within a 12 h period at a laboratory. TN, DIN, SiO4–-Si, NO3–-N, NO2–-N, NH4+-N, TP, DIP, SPM, and COD were measured following the National Standard of the Oceanographic Survey of China (GB/T 12763.4-2007). Other environmental variables were also calculated based on the above procedure, including the dissolved inorganic nitrogen (DIC) to phosphorus (P) ratio (N/P), the TN to TP ratio (TN/TP), the silicon (Si) to P ratio (Si/P), and the Si to DIN ratio (Si/N).
Hydrologic data used to calculate the hydrologic distance was extracted from Jing et al. (2011), including hydrologic direction and velocity.
Statistical Analysis
The phytoplankton diversity indices selected for this study cover both alpha and beta diversity. For alpha diversity, four typical and widely used indices were selected, including the Shannon index (H′), Simpson’s index (D), Pielou’s evenness index (J), and the Species number (S) index. For beta diversity, this study used the BAS approach (Baselga, 2010, 2012) to calculate and decompose beta diversity, where the Sørensen pairwise dissimilarity index (beta.SOR) was first calculated and then decomposed to a turnover value (beta.SIM) and a nestedness value (beta.SNE). Supplementary Table 1 provides the diversity index equations, which were conducted in the packages “vegan” and “beta.part” of R 4.0.2 (Baselga and Orme, 2012).
Spatial subdivision was conducted to further quantify the diversity distribution. The salinity clustering results showed that five distinctive groups were found according to their geographic location, i.e., tributary (S1–S4, S21), river mouth (S5, S6), southern part of middle estuary (S7, S8, S15), northern and eastern part of middle estuary (S9, S10, S13, S14, S16, S17) and outer estuary (S11, S12, S18–S20) (Figure 3). Based on salinity clustering groups, combined with the consideration of sampling sites number balance, the study area was subdivided into three subregions, including the upper (Area I), middle (Area II), and lower reaches (Area III) of the estuary (Figure 4).
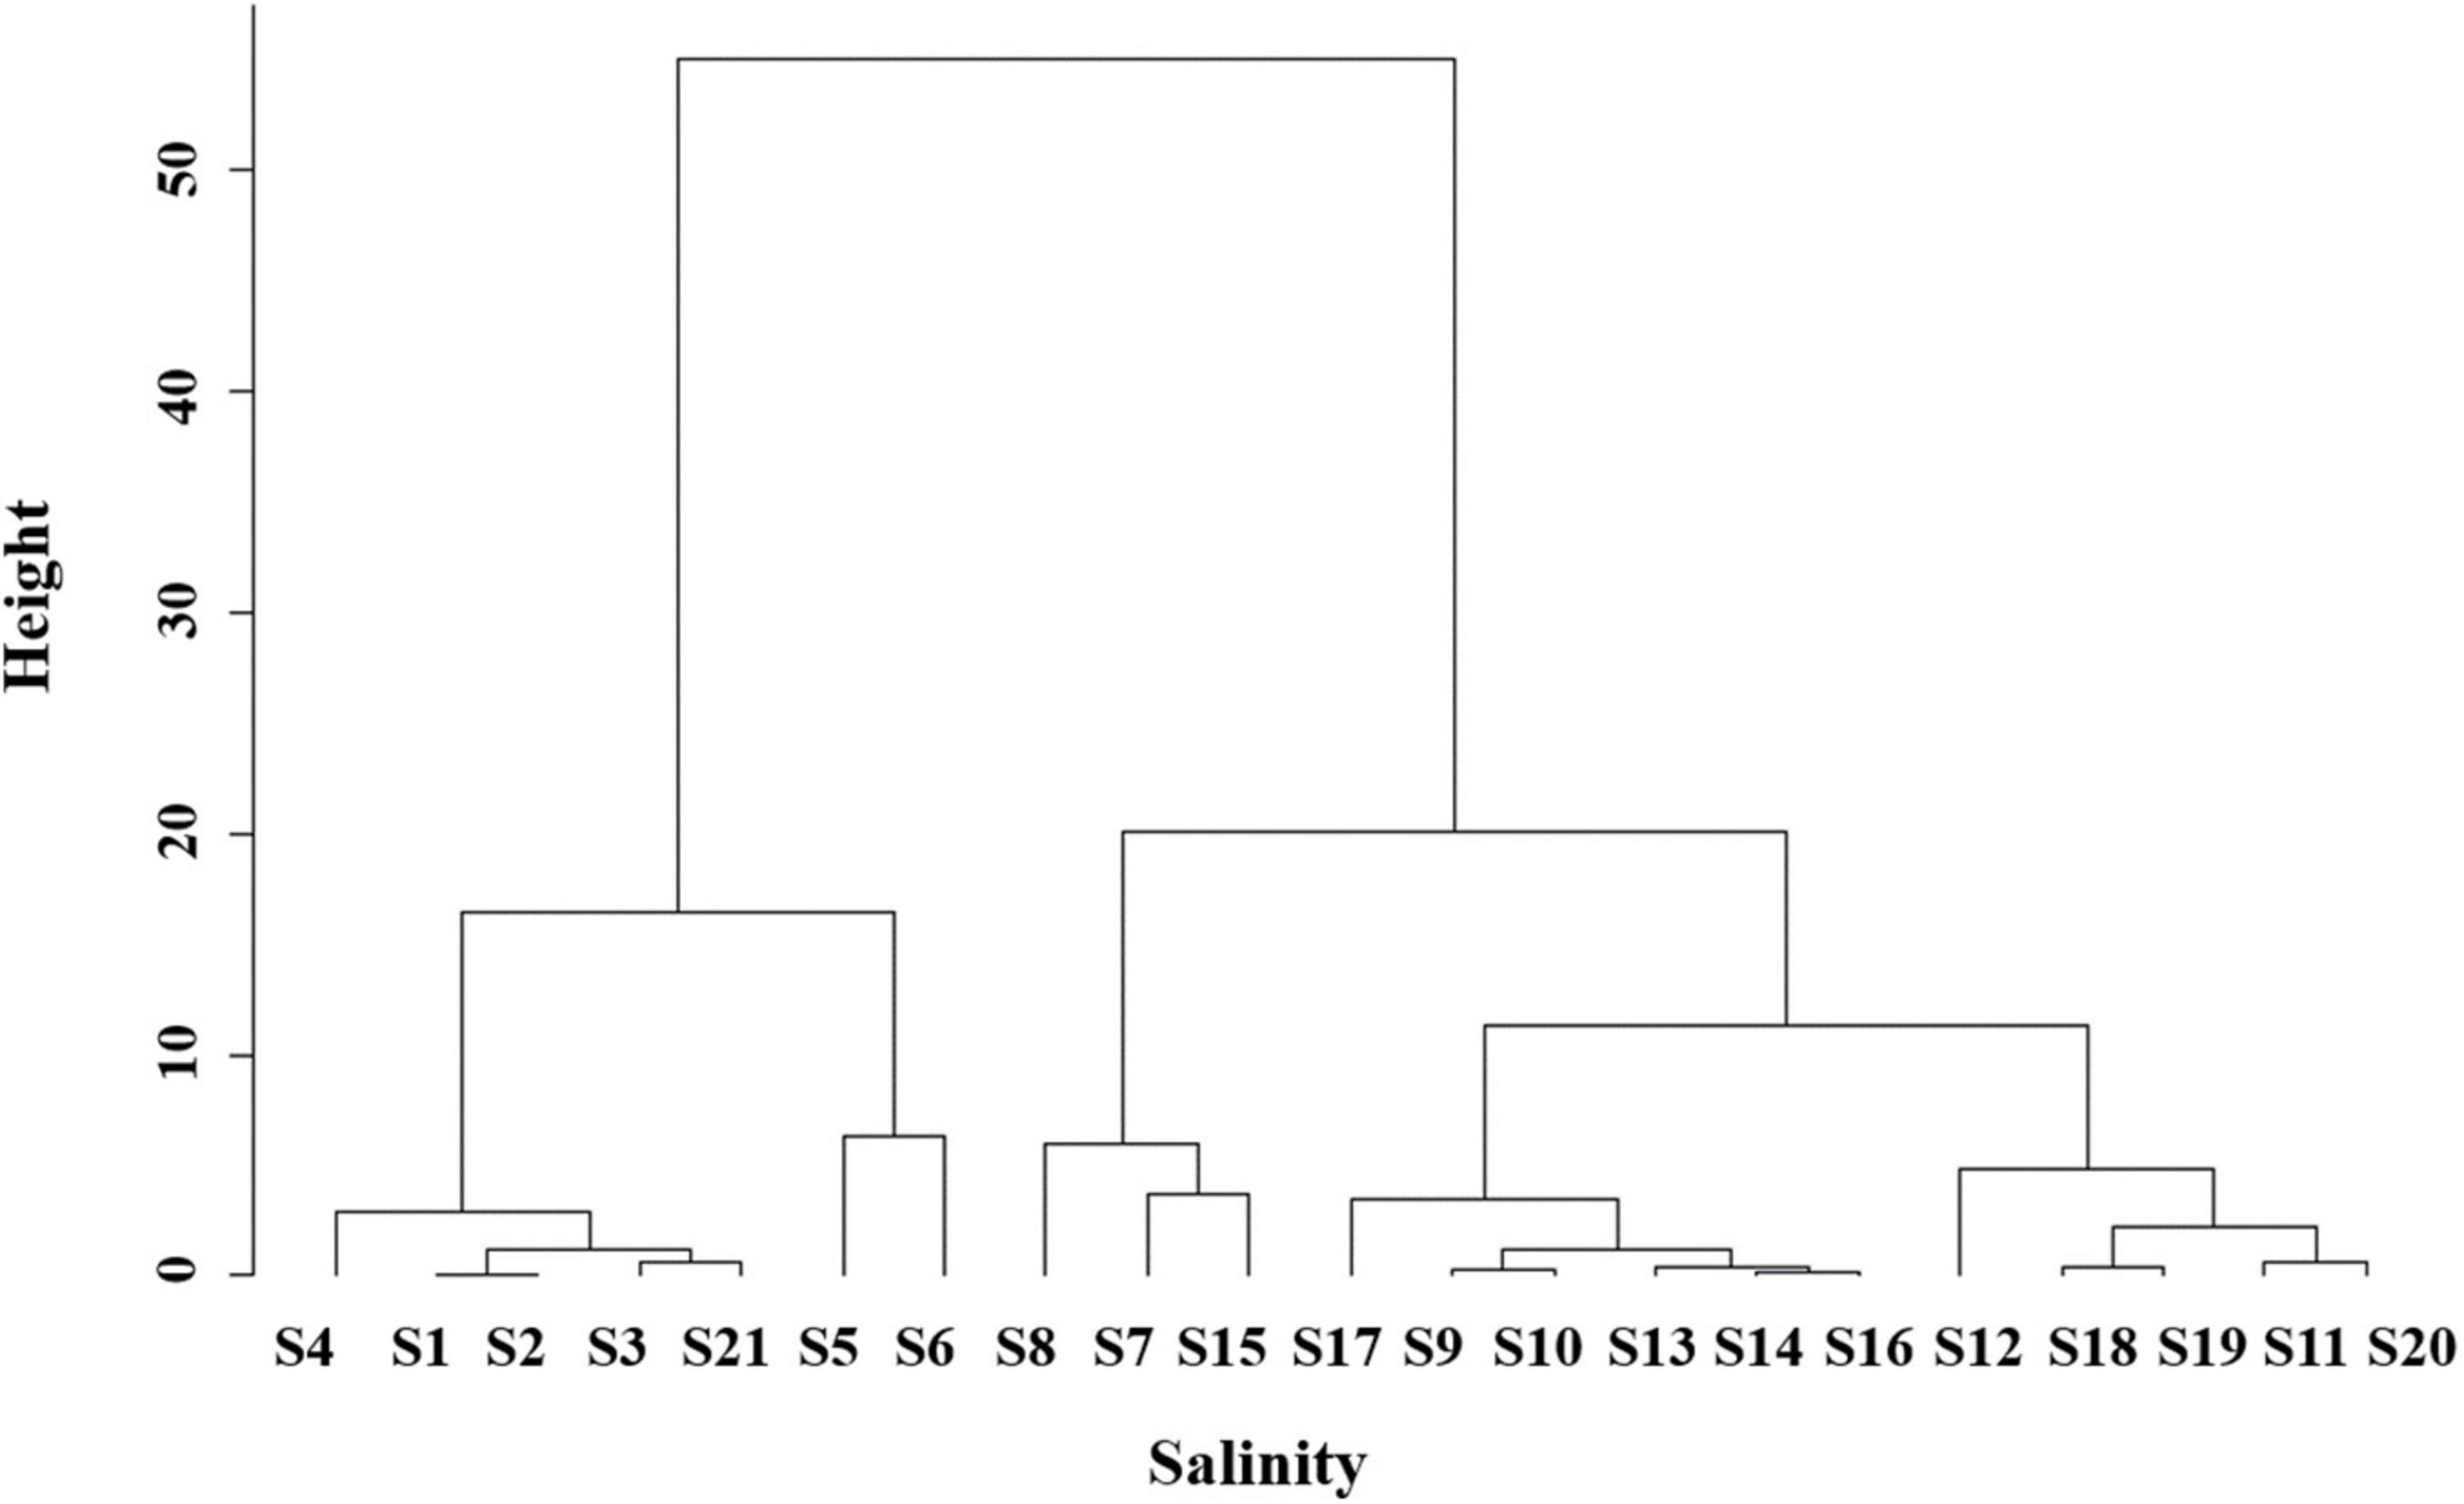
Figure 3. The hclust (Average Linkage Clustering) of the sites according to the salinity.
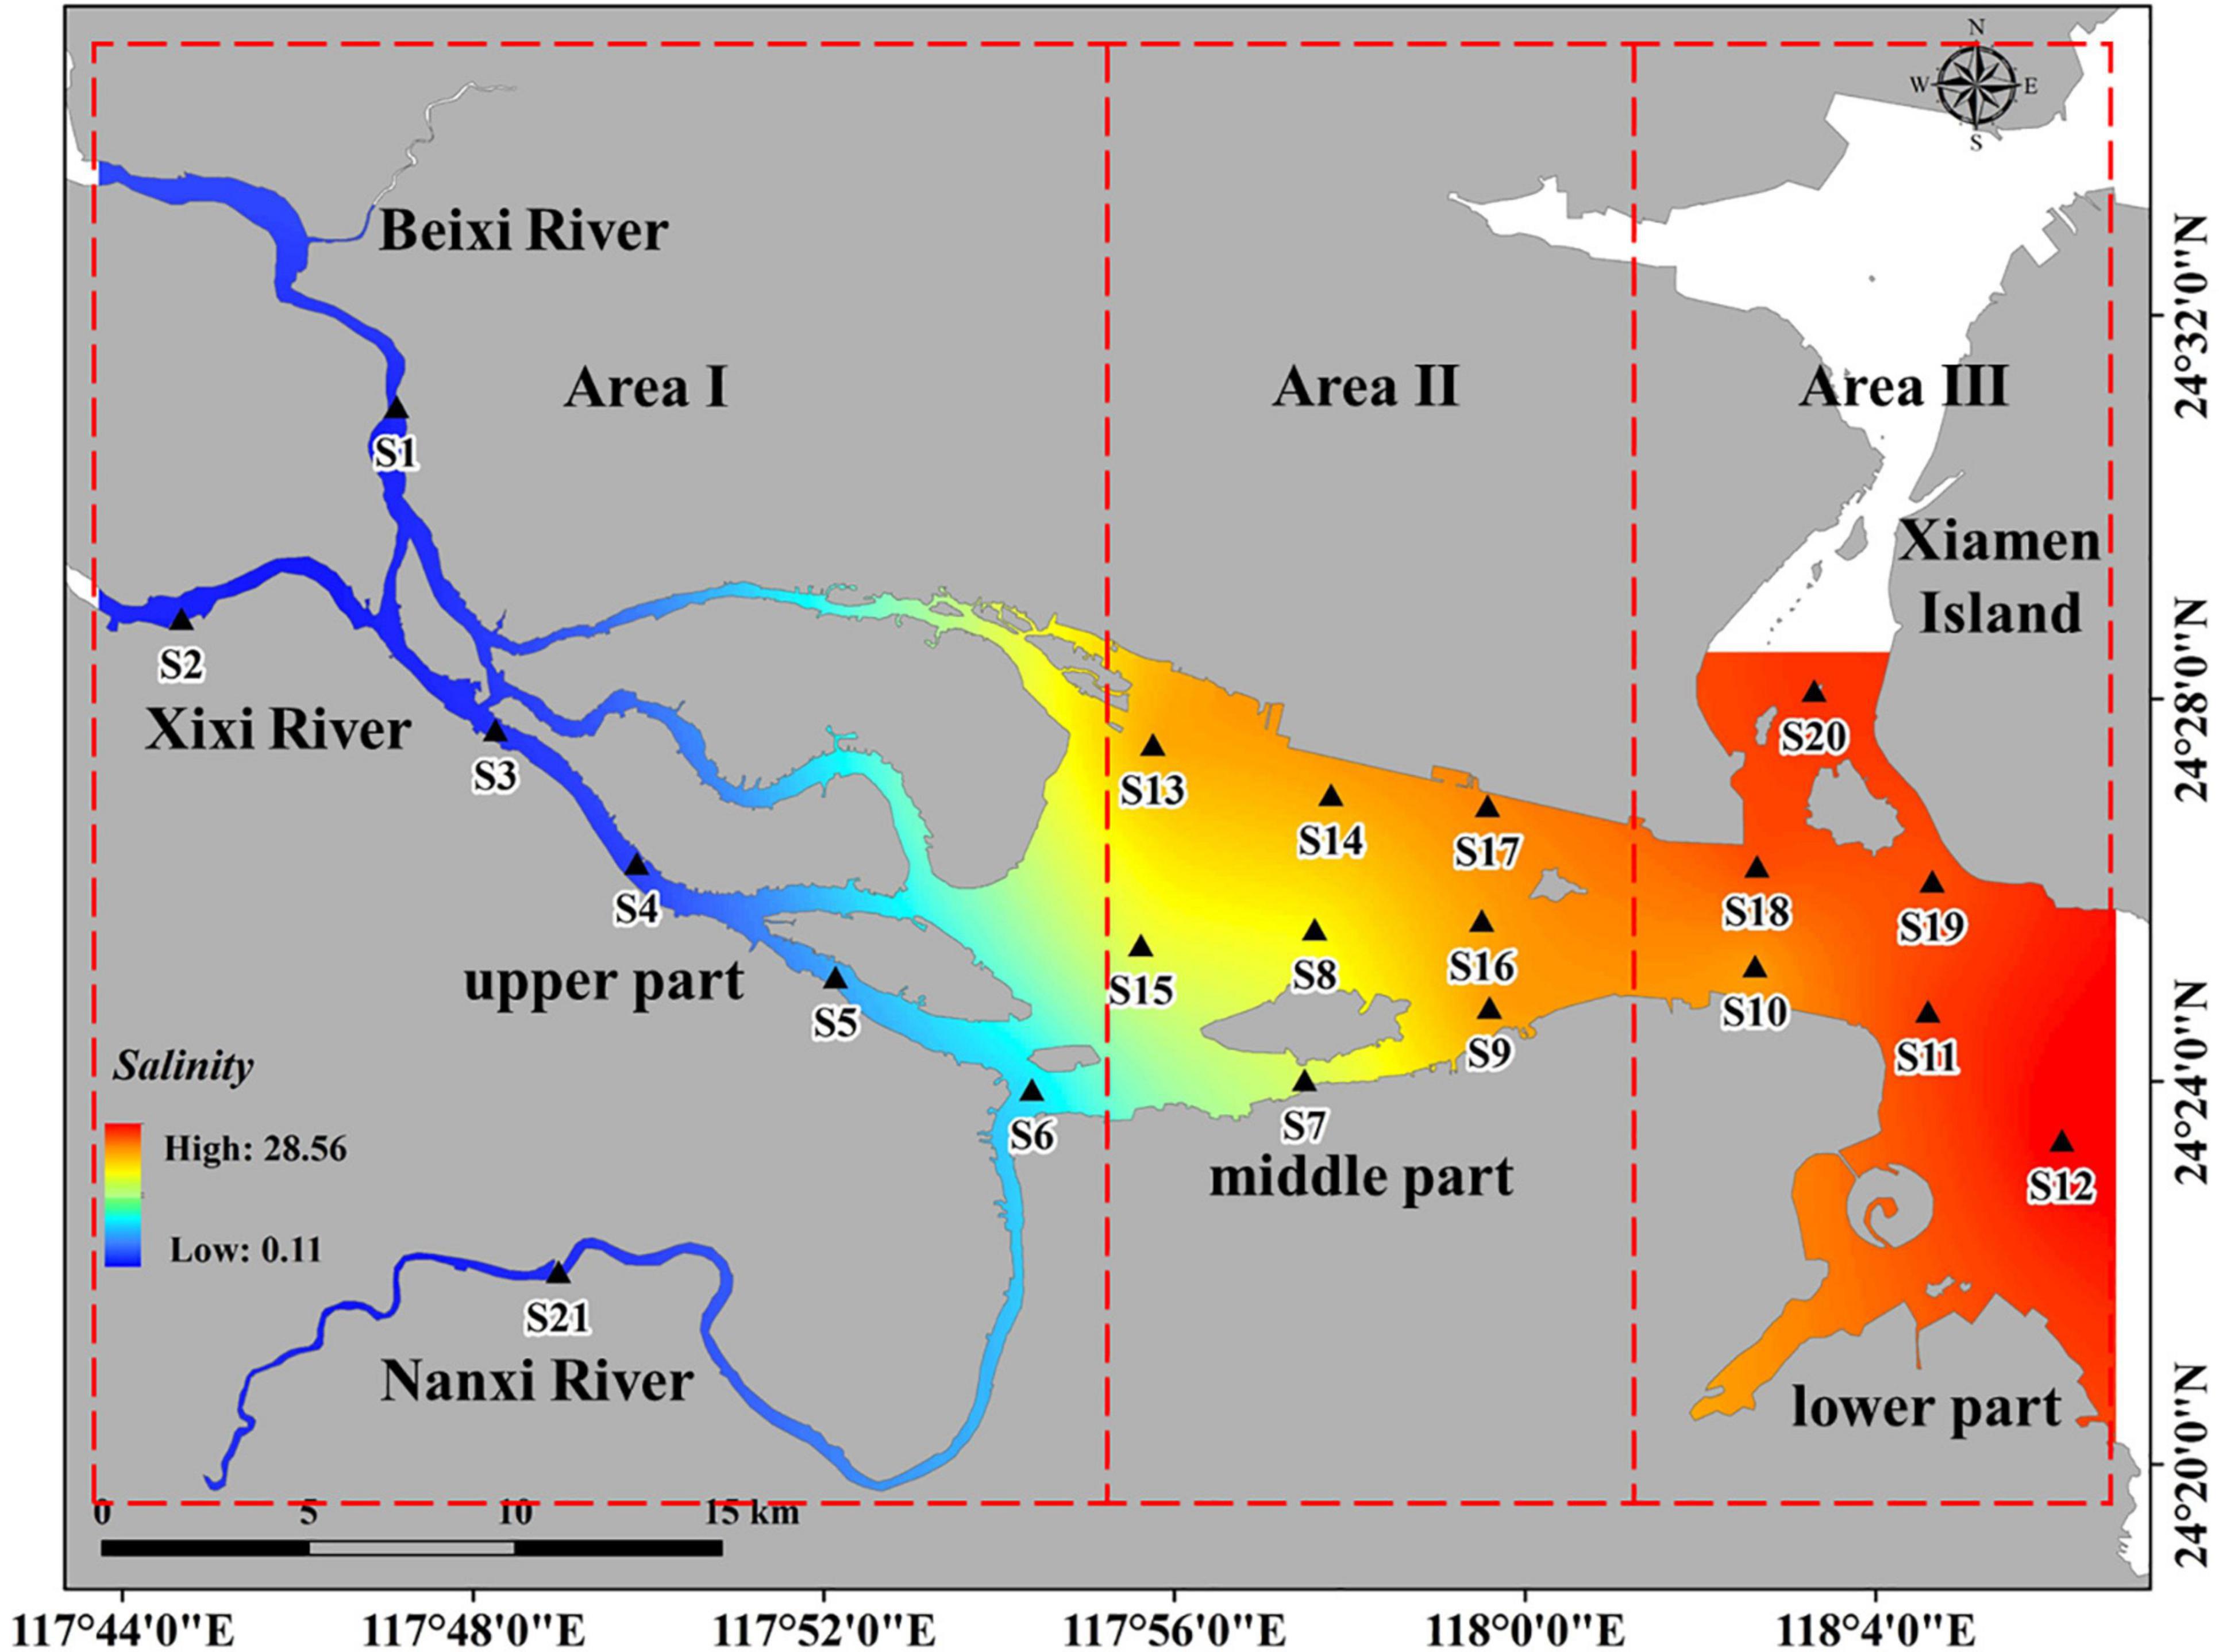
Figure 4. The sub-regions of study area.
Results from the Q–Q test indicated that alpha diversity data followed normal distribution (see Supplementary Figure 1), suggesting that Ordinary Kriging was applicable in mapping the distribution of alpha and gamma diversity, where a linear function was selected as the semi-variant model used in Ordinary Kriging, given that the linear function was optimal for accuracy of cross-validation evaluation. A pairwise site comparison of beta diversity was mapped using a connective line, and averages were used to represent the beta diversity of each subregion. The “ggplot2” package in R 4.0.2 was used to conduct the Q–Q test. ArcGIS 10.7 was used to conduct Ordinary Kriging and biodiversity mapping.
Pearson’s r was used to quantify relationships between environmental and geographic parameters and diversity indices, which was conducted to identify the driving factors of phytoplankton diversity patterns in the Jiulong River estuary. In total, 63 datasets obtained from three field campaigns were used to analyze correlations between environmental variables and alpha diversity. In total, 210 datasets, covering data from three field campaigns that were mixed among any two sites, were used to analyze correlations between beta diversity and environmental and geographic variables, where differences in environmental variables among pairwise site comparisons were used, while geographic distance and hydrologic distance were used to represent geographic variables, which were, respectively, obtained using the point distance tool of proximity analysis and SDM toolbox incorporating the north and east components of mean flow velocity at 6 h during low tide (because of a regular semidiurnal tide in Jiulong River estuary, Liu, 2012) as the cost resistance surface in ArcGIS 10.7. Additionally, based on Pearson’s r results, stepwise regression was conducted to obtain optimal equations between variables and diversity indices after data was normalized. This was done to enhance comparisons at the same scale. Forest plots were used to visualize the coefficient strength of key variables in the optimized equation. Pearson’s r, normalization, stepwise regression, and forest plots were conducted in packages “corrplot,” “clusterSim,” “car,” “grid,” “magrittr,” “checkmate,” and “forestplot” in R 4.0.2, respectively.
Results
Spatial Patterns of Phytoplankton Alpha Diversity
Supplementary Table 3 and Figure 5 provide the overall spatial variation of phytoplankton alpha diversity indices across three seasons. Shannon index (H’) values ranged from 2.23 to 3.51 (2.90 average), where the highest value was measured at S11 (i.e., at the lower reaches of the estuary) and the lowest value was measured at S8 (i.e., at the middle reaches of the estuary). Simpson’s index (D) values ranged from 0.15 to 0.71 (0.28 average), where the highest value was measured at S1 (i.e., at the upper reaches of the Beixi River estuary) and the lowest value was measured at S3 (i.e., at the upper reaches of the Xixi River estuary). Pielou’s evenness (J) values ranged from 0.55 to 0.84 (0.67 average), where the highest value was measured at S3 (i.e., at the upper reaches of the Xixi River estuary) and the lowest value was measured at S20 (i.e., the lower reaches of the estuary). Species number (S) values ranged from 27 to 59 (45 average), where the highest value was measured at S19 (i.e., the lower reaches of the estuary) and the lowest value was measured at S4 (i.e., the upper reaches of the estuary).
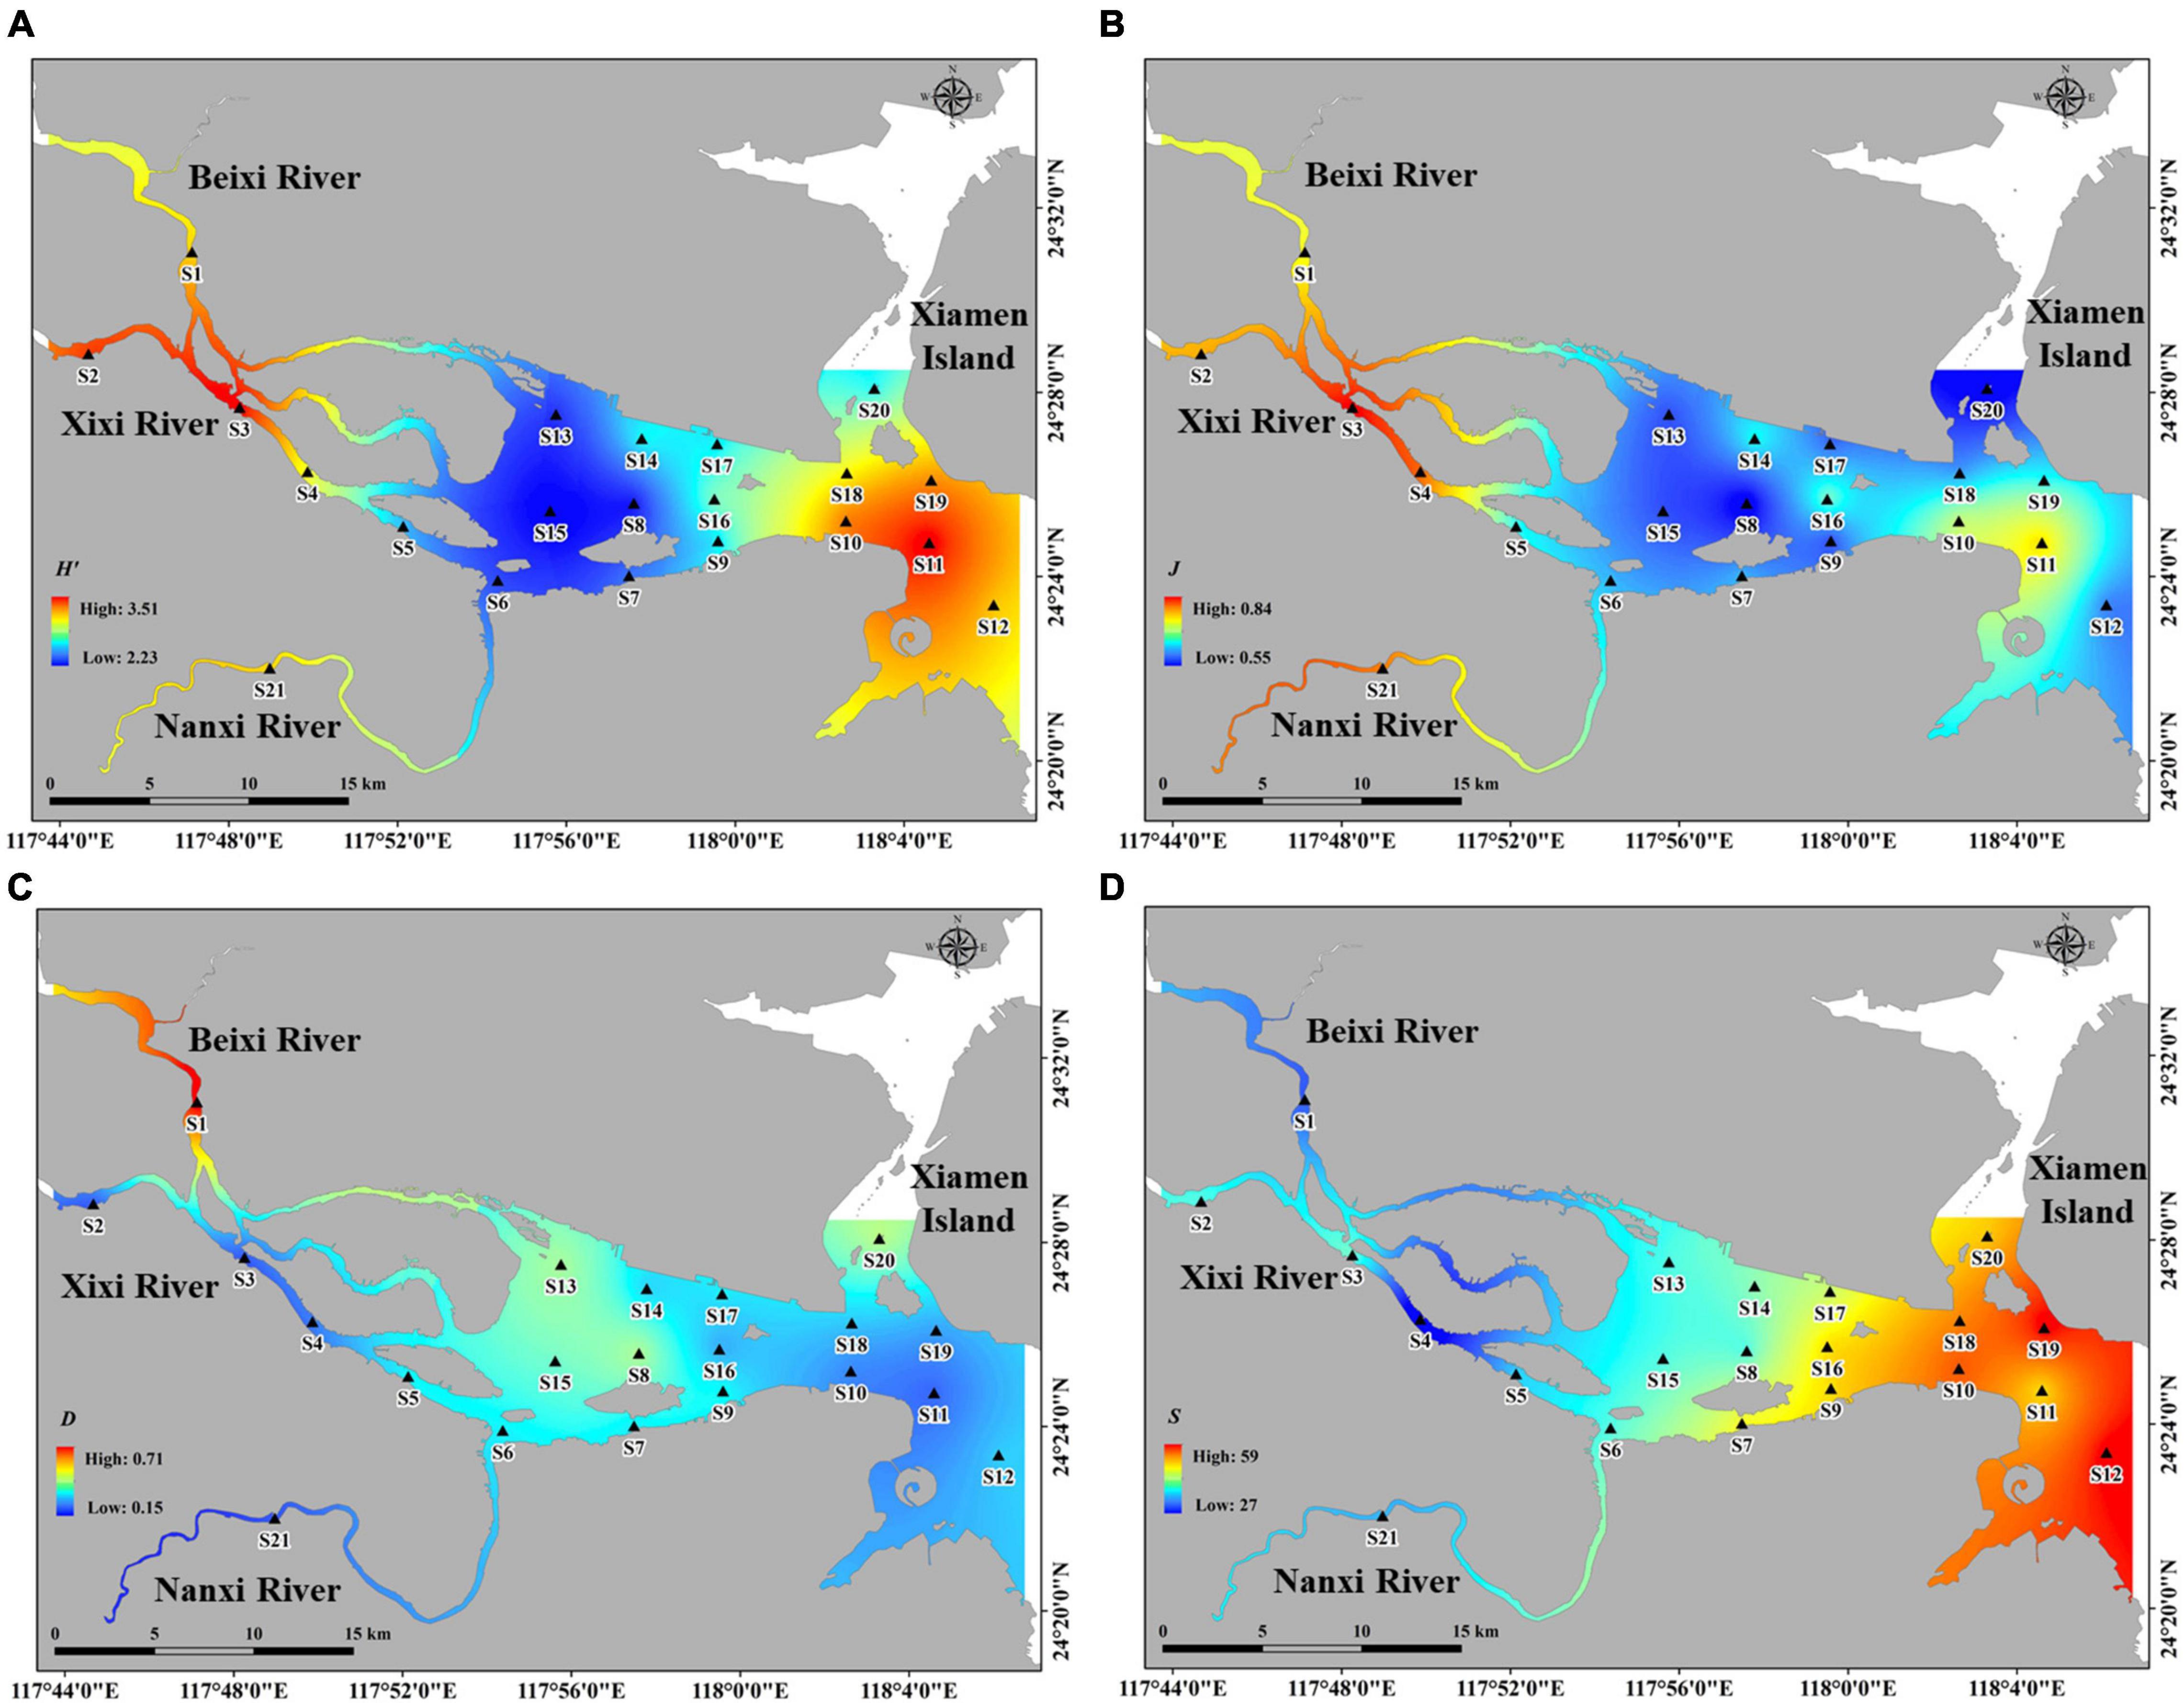
Figure 5. The spatial distribution patterns of alpha diversity and species number. (A) Shannon-wiener diversity index. (B) Pielou evenness index. (C) Simpson diversity index. (D) Species number. The darker color indicates the higher diversity.
Results generally showed a wide range of values in all alpha diversity indices, indicating significant spatial variation among the different sites. A similar gradient was observed in H’ and J values, which gradually decreased from upper to middle and then increased from the middle to lower reaches of the estuary (Supplementary Table 3 and Figures 5A,B). D gradually decreased from the upper to lower reaches of the estuary (Supplementary Table 2 and Figure 5C). Conversely, S gradually increased from the upper to lower reaches of the estuary (Supplementary Table 3 and Figure 5D). Among the different subregions, the highest H’ and S values were observed in Area III, the highest J value was observed in Area I, and the highest D was observed in Area II.
Season variations of spatial patterns were observed (Supplementary Table 3). The highest H’ value was found in autumn (3.43 average), followed by spring (2.79 average) and summer (2.46 average), where spatial patterns varied greatly across different seasons, i.e., H’ value in spring decreased from upper to lower reaches of estuary, while the opposite trend was found in autumn. The highest J value was found in autumn (0.75 average), followed by spring (0.70 average) and summer (0.56 average), where their spatial patterns were similar with H’. The highest D value was found in summer (0.42 average), followed by spring (0.24 average) and autumn (0.19 average), where their spatial patterns were nearly opposite to H’ and J. The S values in autumn (24 average) and summer (23 average) were higher than that in spring (16 average), with an increasing spatial trend from upper to lower reaches of estuary for all three seasons.
Spatial Patterns of Phytoplankton Beta Diversity
Pairwise beta diversity site comparisons are shown in Figure 6. The beta.SOR values ranged from 0.27 to 0.81 (0.4 average), and this large range indicated significant variation between the different sites. A gradual decreasing trend was observed from the upper to lower reaches of the estuary. The highest beta.SOR value was observed between S3 (the Xixi River) and S21 (the Nanxi River) at the upper reaches of the estuary, characterized by a low hydrologic exchange between these two different tributaries. On the other hand, the lowest beta.SOR value was observed between S10 and S20 at the lower reaches of the estuary, characterized by a small geographic distance and a high hydrologic exchange.
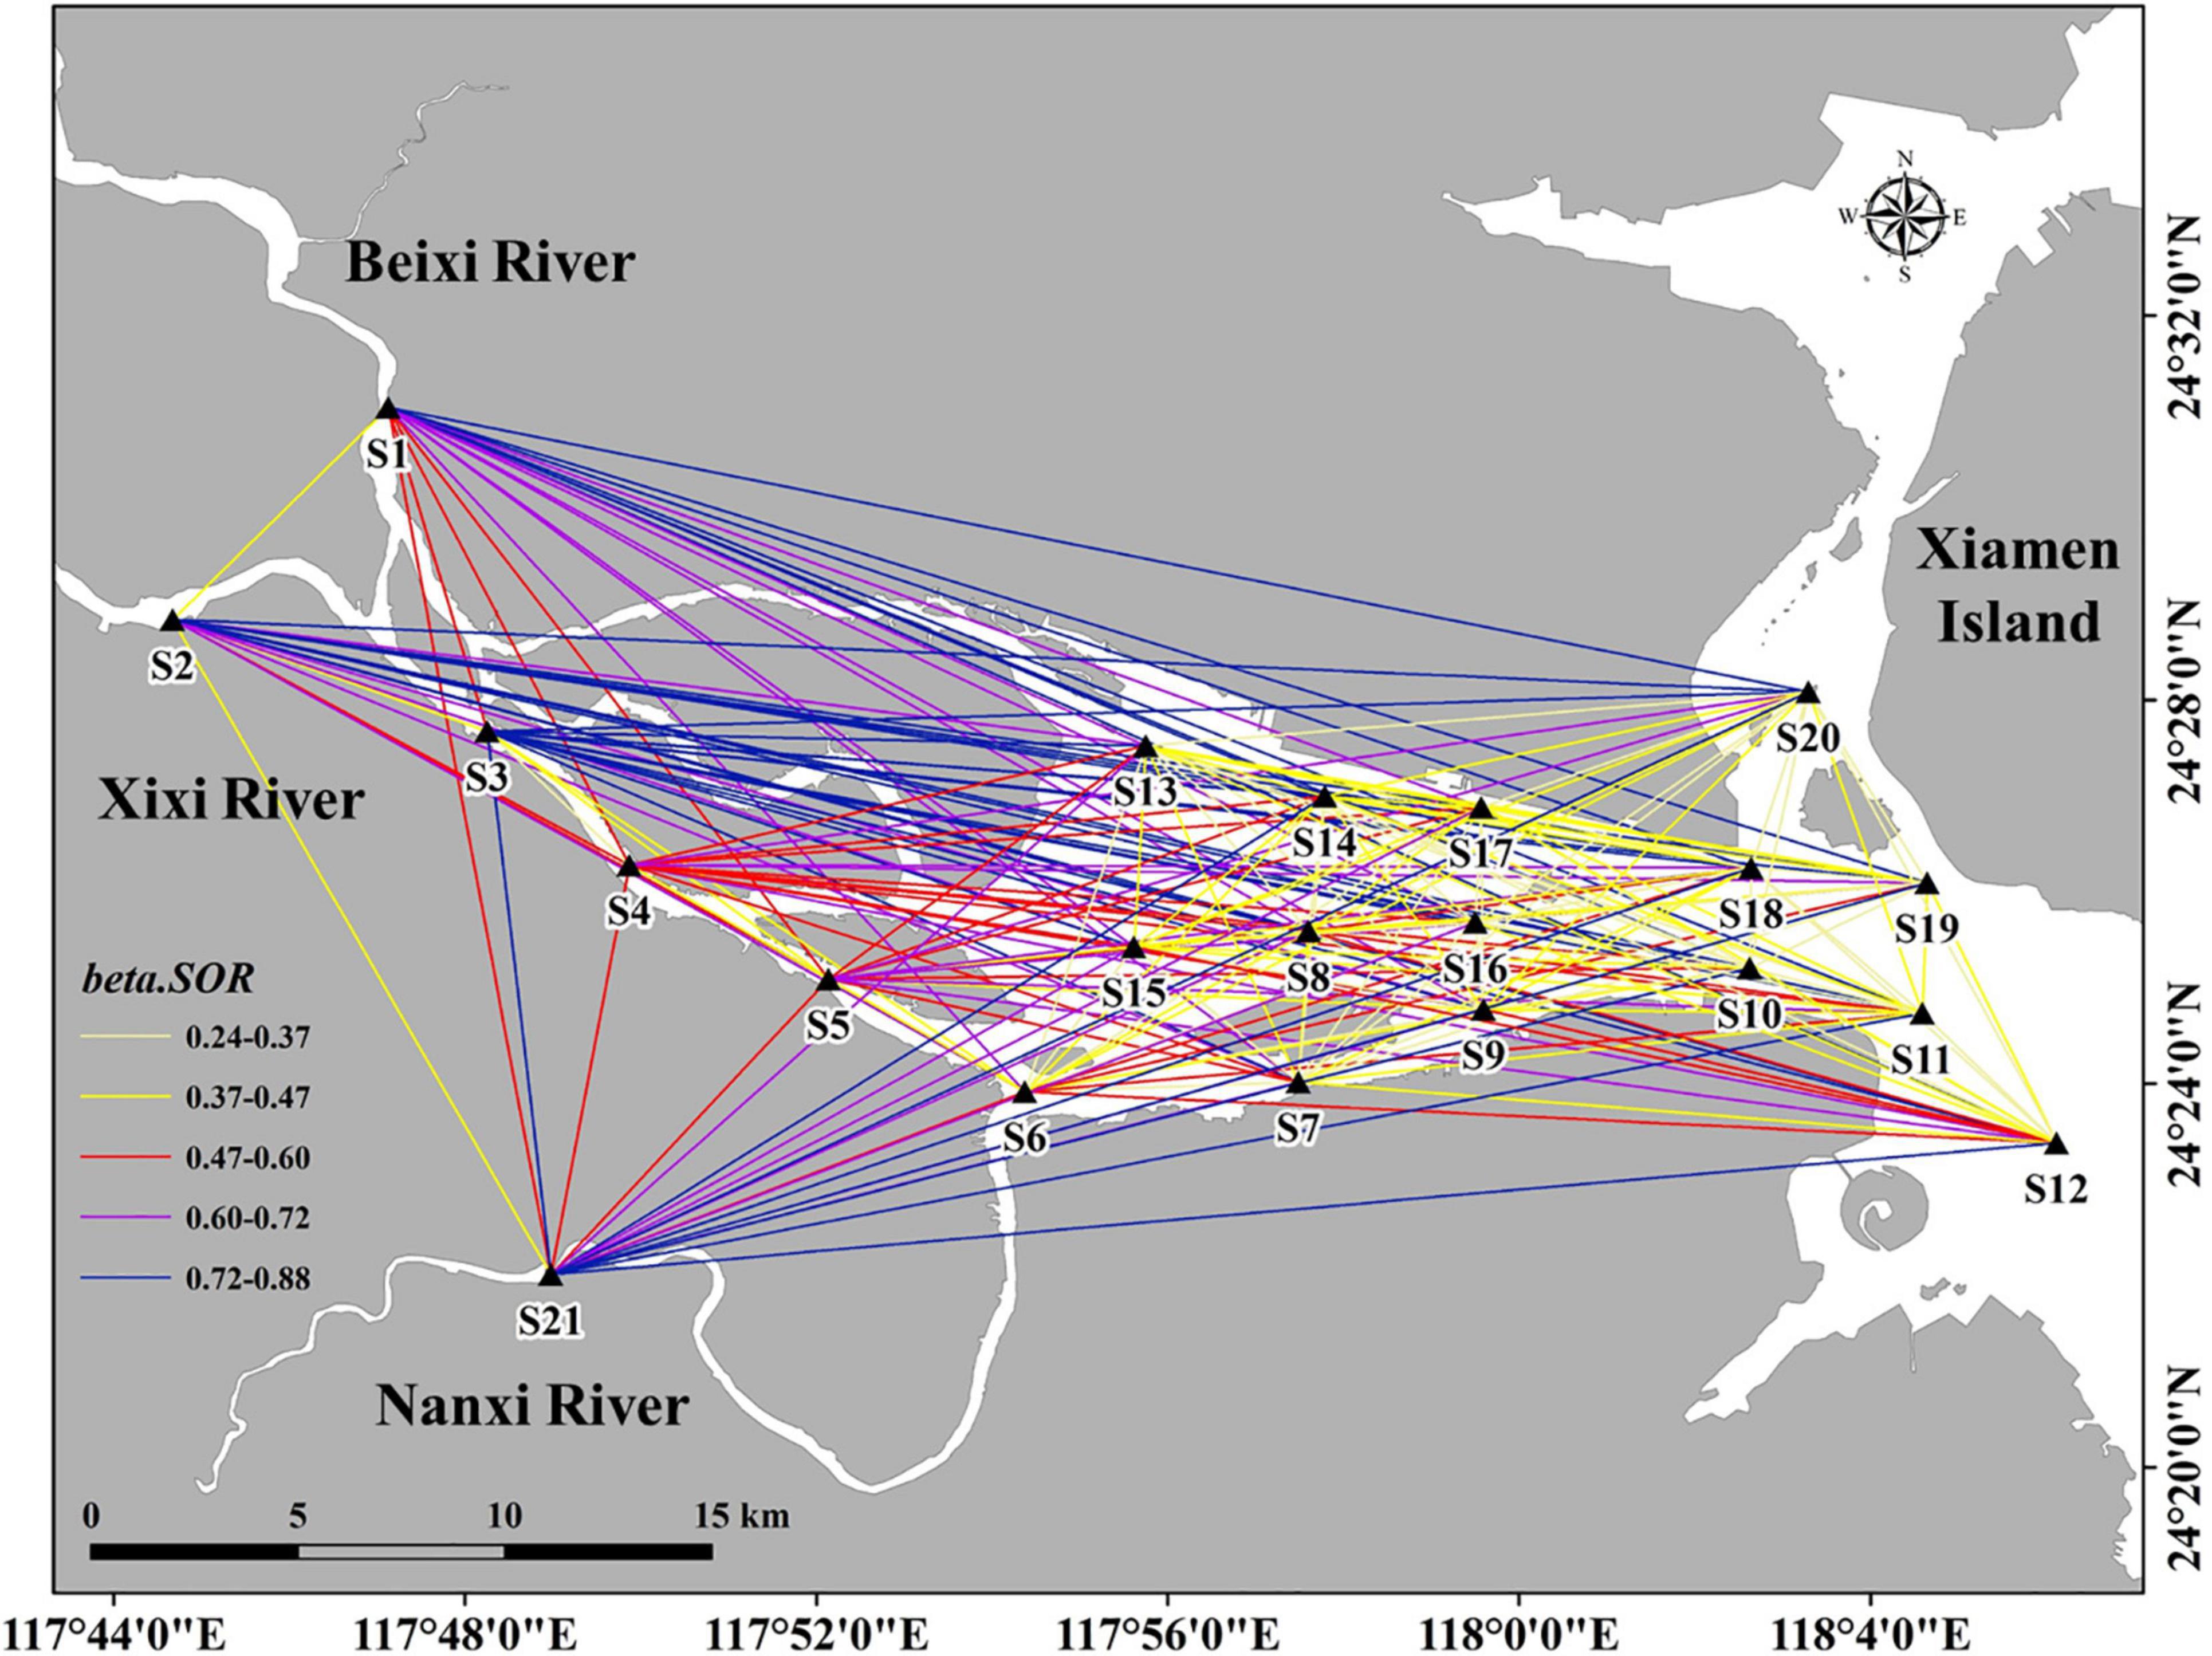
Figure 6. The spatial distribution of pairwise-site beta diversity (beta.SOR).
Supplementary Table 3 show the beta diversity of each subregion and associated components. beta.SOR values ranged from 0.34 to 0.51 (0.4 average); beta.SIM values ranged from 0.31 to 0.43 (0.35 average); beta.SNE values ranged from 0.03 to 0.07 (0.05 average). beta.SOR, beta.SIM, and beta.SNE values exhibited the same distribution pattern, namely, a deceasing trend from the upper to lower reaches of the estuary, where the highest value was measured at Area I and the lowest value was measured at Area III. Furthermore, beta.SIM dominated beta.SNE regardless of the area (i.e., the upper, middle, or lower reaches of the estuary), indicating that species turnover was dominant.
The seasonal similarities and differences of beta diversity patterns were provided in the Supplementary Table 3. The same pattern was observed for beta.SOR and beta.SIM, where temporally, their values in summer and spring were slightly higher than that in autumn, and spatially, the highest value was found at Area I and the lowest value was found at Area III, indicating a deceasing trend from the upper to lower reaches of the estuary for all three seasons. Fluctuations in beta.SNE values differed from the other two indices, it showed inconsistent spatial trends across different seasons, where the highest value was found in Area III in spring, while Area II observed the highest value in summer and autumn. It was noted that beta.SIM value was greatly higher than beta.SNE across all subregions and seasons, indicating that species turnover was dominant.
Relationships Between Phytoplankton Biodiversity and Environmental and Spatial Variables
Pearson’s r values between phytoplankton alpha diversity and environmental variables are shown in Figure 7A. Results showed that H’ significantly and negatively correlated to T (r = −0.45; p < 0.01) and NO2–-N (r = −0.46; p < 0.01). J significantly and negatively correlated to T (r = −0.31, p < 0.01), Sal (r = −0.28; p < 0.01), NO2–-N (r = −0.46; p < 0.01), and positively correlated to NO3–-N (r = 0.32; p < 0.01), and DIN (r = 0.26; p < 0.01). D positively correlated to T (r = 0.32; p < 0.01). Compared to the other alpha diversity indices, S was affected by more environmental variables, where the top six environmental variables that showed a high correlation were Sal (r = 0.61; p < 0.01), WD (r = 0.59; p < 0.01), and pH (r = 0.36; p < 0.01) and those showing a negative correlation were COD (r = −0.45; p < 0.01), NO3–-N (r = −0.44; p < 0.01), and DIN (r = −0.4; p < 0.01).
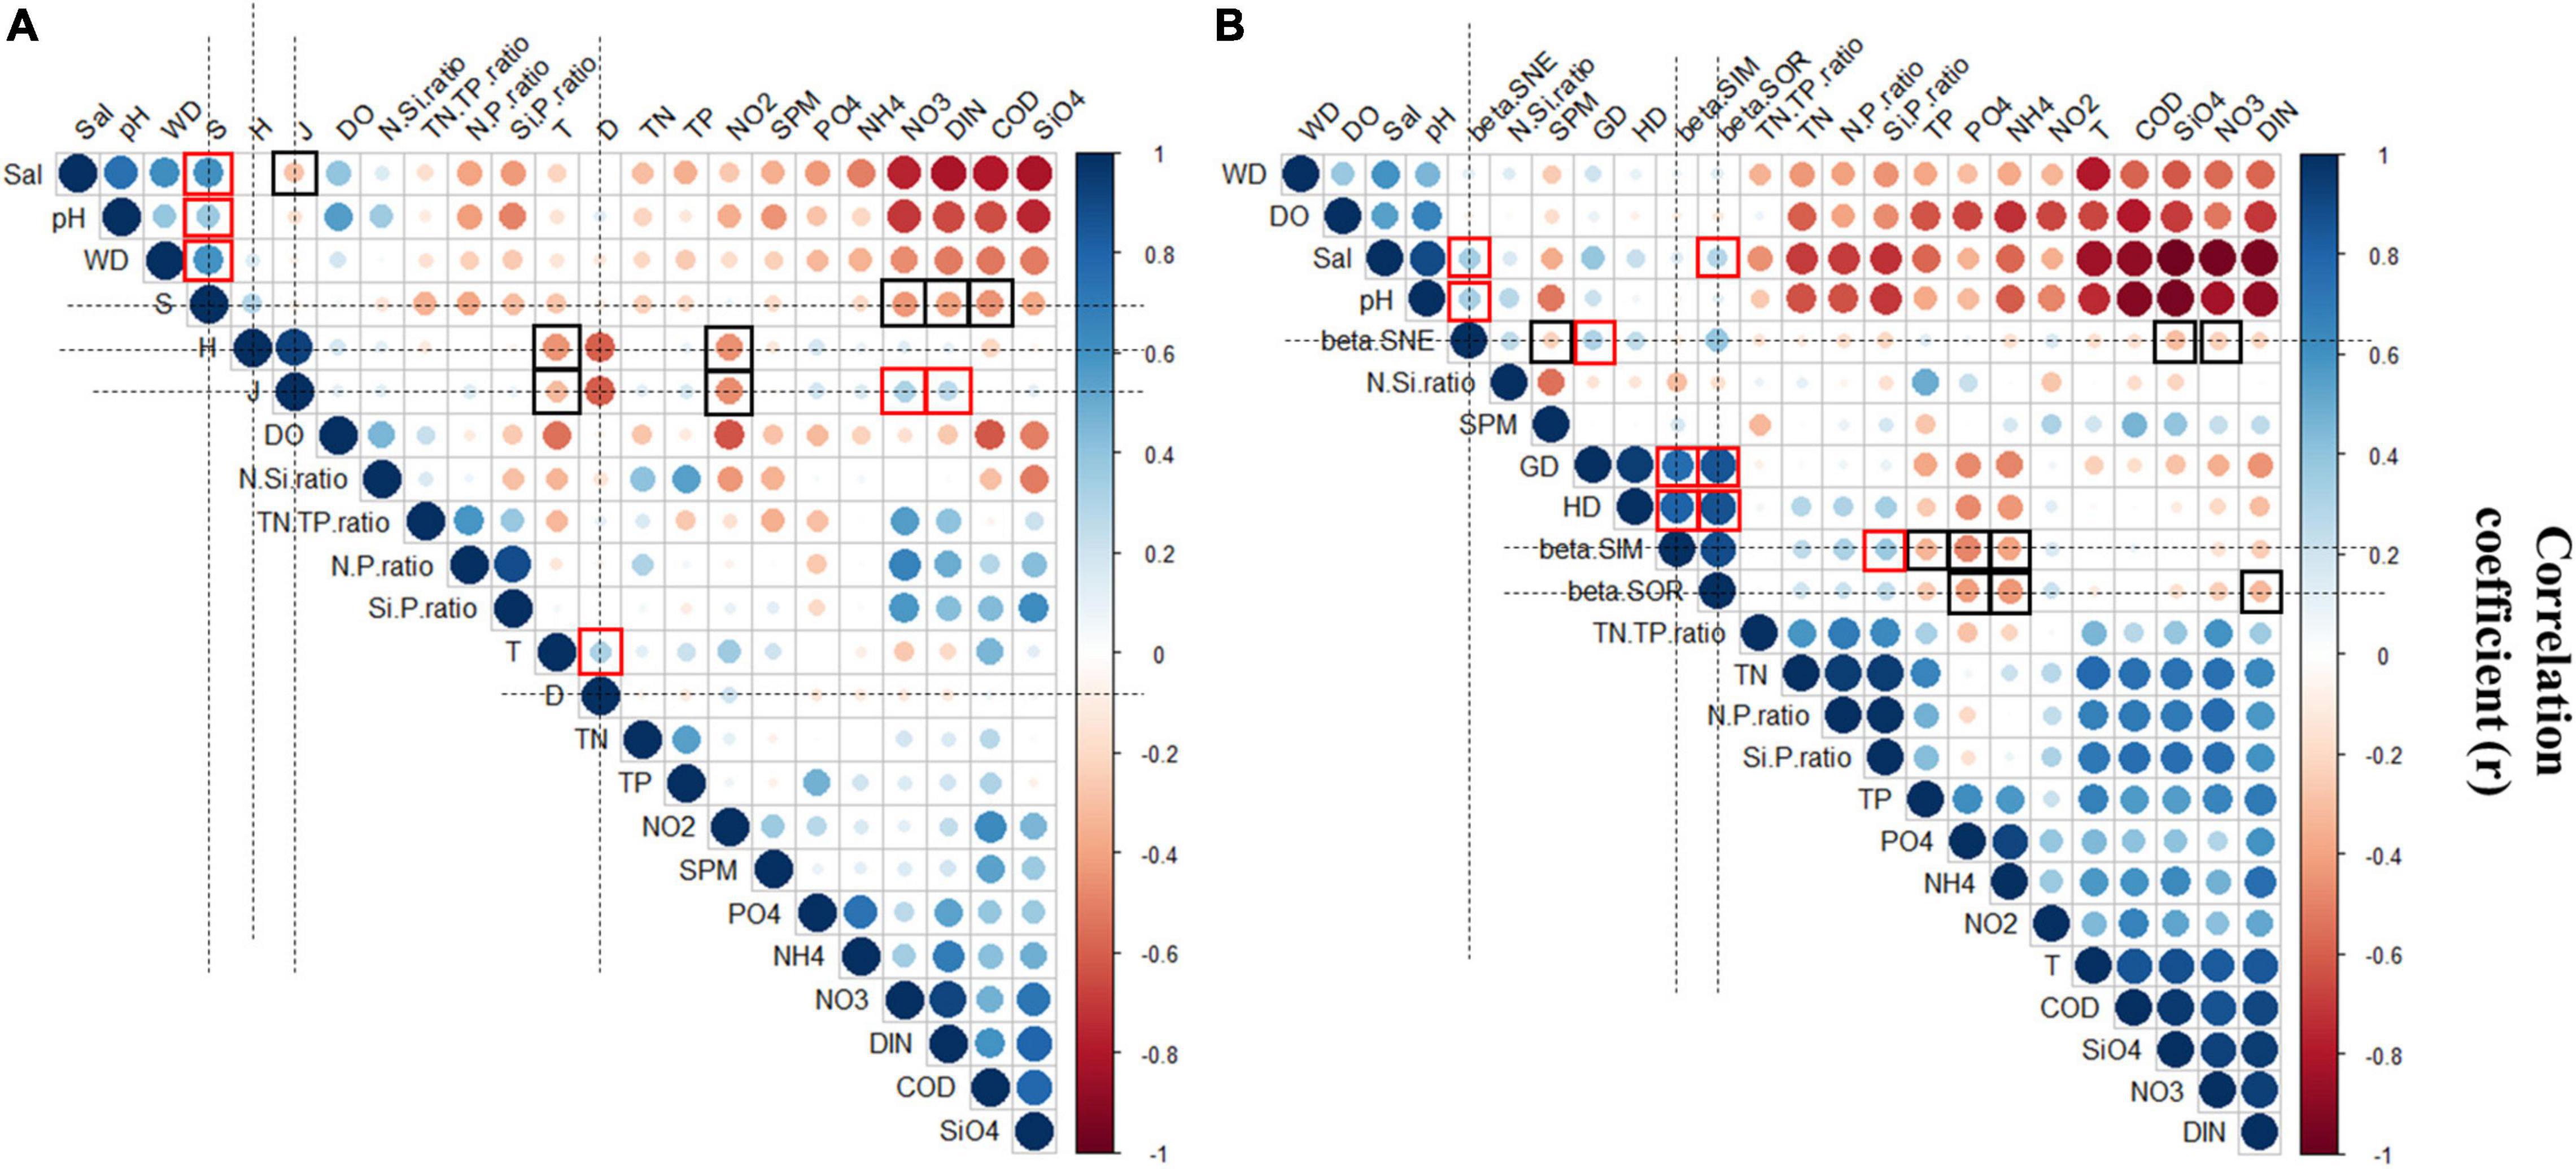
Figure 7. The Pearson’s correlation coefficient matrix between diversity and environmental variables and spatial distances. (A) The Pearson’s correlation coefficient matrix between alpha diversity and environmental variables. (B) The Pearson’s correlation coefficient matrix between beta diversity and environmental variables and spatial distances. Red represented negative correlations, and blue represented positive correlations. The size of circle indicated the strength of correlation.
The development of optimal regression equations between phytoplankton alpha diversity indices and environmental variables indicated that alpha diversity was influenced by interactions among several environmental factors, and their parameters and coefficients are shown in Supplementary Figure 2. The equation for H’ parameterized with T and NO2–-N (adjusted R2 = 0.27; p < 0.001; Akaike information criterion [AIC] = −19); J parameterized with Sal and NO2–-N (adjusted R2 = 0.41; p < 0.001; AIC = −31); D parameterized with T (adjusted R2 = 0.09; p < 0.001; AIC = −6). By contrast, more parameters were included in the S equation, which parameterized with WD, Sal, NO3–-N, and TN:TP (adjusted R2 = 0.58; p < 0.001; AIC = −48), among which salinity, nutrients (NO3–-N) and nutrients ratio (TN:TP) were the most influential environmental variables, yielding high absolute coefficient values. In general, results indicated that H’, D, and J were strongly affected by temperature, salinity, and nutrients, while S was mainly affected by salinity, nutrients and nutrient ratios, including NO3–-N and TN:TP. Low and negative AIC values in all equations indicated the goodness-of-fit of the equations shown above.
Pearson’s r between phytoplankton beta diversity and environmental variables are shown in Figure 7B. Results showed that much more environmental variables significantly influenced beta.SIM, the top four that showed high correlations were PO4–-P (R2 = −0.48; p < 0.01), NH4+-N (R2 = −0.39; p < 0.01), Si:P (R2 = 0.37; p < 0.01) and TP (R2 = −0.34; p < 0.01). The correlation strength of the top five (i.e., between beta.SNE and environmental variables) was as follows: Sal (R2 = 0.34; p < 0.01), pH (R2 = 0.32; p < 0.01), SiO4–-Si (R2 = −0.30; p < 0.01), NO3–-N (R2 = −0.23; p < 0.01), and SPM (R2 = −0.22; p < 0.01). Analogously, beta.SOR correlated to NH4+-N (R2 = −0.44; p < 0.01), PO4–-P (R2 = −0.42; p < 0.01), Sal (R2 = 0.28; p < 0.01) and DIN (R2 = −0.33; p < 0.01). Additionally, all beta diversity indices significantly and positively correlated to geographic distance (beta.SOR, R2 = 0.85, p < 0.01; beta.SIM, R2 = 0.76, p < 0.01; beta.SNE, R2 = 0.31, p < 0.01), and hydrologic distance (beta.SOR, R2 = 0.86, p < 0.01; beta.SIM, R2 = 0.81, p < 0.01; beta.SNE, R2 = 0.24, p < 0.01).
The optimal regression equations between phytoplankton beta diversity indices and environmental and spatial variables were subsequently developed, and their parameters and coefficients are shown in Supplementary Figure 3. The equation for beta.SIM parameterized to the nutrients (PO4–-P, TP, DIN), nutrients ratio (Si:P) and spatial variables (GD, HD) (adjusted R2 = 0.78; p < 0.001; AIC = −313), where the nutrients ratio (Si:P) was the crucial parameter with a higher absolute coefficient value. beta.SNE parameterized to nutrients (SiO4–-Si), nutrients ratio (Si:P and N:Si), others (Sal, COD, SPM), and spatial variables (HD) (adjusted R2 = 0.51; p < 0.001; AIC = −143), among which nutrients (SiO4–-Si) was the most influential environmental variables with the highest absolute coefficient value. beta.SOR parameterized to nutrients (NO3–-N, NH4+-N, TN, and DIN), and spatial variables (GD, HD) (adjusted R2 = 0.83; p < 0.001; AIC = −366), among which nutrients (NO3–-N, NH4+-N, TN, and DIN) were the most influential environmental variables with high absolute coefficient values. Low and negative AIC values for all equations indicated the goodness-of-fit of the equations shown above.
Discussion
Diversity Patterns Incorporating Alpha and Beta Diversity
Phytoplankton species diversity in the Jiulong River estuary was calculated at two different scales, namely, alpha and beta diversity, where alpha diversity reflects with-in site diversity and beta diversity reflects between-site diversity between sites or subregions. Different diversity scales represent fundamental aspects of biological communities (Socolar et al., 2016), and this is due to the different constructs and mathematical expressions among the various indices.
For overall alpha diversity across three seasons, H’ and J values decreased from the upper to middle and then increased from middle to lower reaches of the Jiulong River estuary. D exhibited the opposite trend, and S gradually increased from the upper to lower reaches of the Jiulong River estuary Alpha diversity patterns were observed to be complex, and this was due to their multiple indices, which differ in their theoretical foundation and interpretation (Morris et al., 2014). Moreover, H’ was equally sensitive to rare and abundant species; J emphasized evenness; D was sensitive in the presence of abundant species; S was sensitive to rare species (Shannon, 1948; Simpson, 1949; Pielou, 1969; Peet, 1974; Magurran, 1988; Krebs, 1998; Morris et al., 2014). Observed patterns in the different diversity indices indicated that species abundance was relatively evenly distributed in the upper reaches of the estuary, a greater number of abundant species was observed in the tributary estuary, while a greater number of rare species was observed in the lower reaches of the estuary.
For overall beta diversity across three seasons, beta.SOR, beta.SIM, and beta.SNE values exhibited a general gradient, gradually decreasing along with an increase in salinity gradients from the upper to the lower reaches of the estuary. This trend also reflects the strength of environmental gradients under the hypothesis that diversity is greater in heterogeneous environments. In other words, the standard deviation of most environmental variables in the upper reaches of the estuary was higher than corresponding values in the middle or lower reaches, including T, DO, SPM and all nutrients and nutrient ratios except for NO2–-N (Supplementary Table 4). Analogously, beta diversity patterns of the three subregions showed that their variations gradually decreased from the upper reaches (Area I) to the middle reaches (Area II) to the lower reaches (Area III) of the estuary (beta.SOR: ΔI–II = 0.146, ΔI–II = 0.024; beta.SIM: ΔI–II = 0.114, ΔI–II = 0.014; beta.SNE: ΔI–II = 0.032, ΔI–II = 0.01). Results indicated that phytoplankton communities in the hyposaline upper reaches of the estuary were the most diverse and heterogeneous in species composition, while hypersaline communities were the least diverse and most homogeneous. Besides, there was not seasonal difference in spatial pattern of beta.SOR and beta.SIM, which was consistent with the decreasing gradient aforementioned from the upper to the lower reaches of the estuary. Slight seasonal variation was found for beta.SNE, but beta.SNE value was largely lower than beta.SIM (see Supplementary Table 3).
Beta diversity decomposition can help clarify processes associated with phytoplankton community construction, which typically decompose into species replacement (or turnover) and richness differences or nestedness (i.e., species gain or loss) (Harrison et al., 1992; Williams, 1996). The relative importance of these two components may help us better understand the underlying mechanisms that shape and maintain community diversity distribution patterns (Baselga, 2010; Podani and Schmera, 2011; Fu et al., 2019). In this study, beta diversity patterns in the Jiulong River estuary were mostly dominated by turnover (spring: 90%, summer: 90%, autumn: 88%), which appears to be a common phenomenon across a wide range of taxa in estuary or marine ecosystems, such as macrobenthos (Alsaffar et al., 2017), aquatic plant communities (Bertuzzi et al., 2018), and marine fish (Liggins et al., 2015).
When alpha and beta diversity was combined, although species richness increased along with gradients (i.e., from the upper to lower reaches of the estuary), phytoplankton composition became more homogeneous as environmental differences decreased (see Supplementary Table 4). With-in and between-site variation are both important to comprehensively explore biodiversity patterns. Since the different scales and the different levels of biodiversity make it relatively complex, a single index cannot reasonably be used to explore diversity patterns. Although a variety of diversity indices have been developed to express various aspects of biodiversity, there is no consensus on which diversity index is best (Socolar et al., 2016). Different indices will yield different diversity patterns, showing different aspects of the same natural phenomenon. In Jiulong River estuary, our study indicated that the species richness of phytoplankton was relatively higher in the lower estuary, while phytoplankton was more diverse and heterogeneous in species composition in the upper estuary, informing flexible conservation strategies in line with different objectives. Thus, it is better to explore diversity patterns hierarchically, incorporating both alpha and beta diversity with various other indices.
Key Factors That Shape Phytoplankton Diversity Patterns
Pearson’s r and stepwise regression results indicated that a few variables correlated to diversity patterns. To more comprehensively identify key factors, this study quantified relative contributions by calculating the absolute coefficient percentage value to all statistically significant variables (p < 0.001) obtained from the optimal regression equations (see Supplementary Figure 2 and Figure 3). Results showed that environmental variables, including T, NO2–-N, Sal, N:P, and Si:P, were the key determinants that shaped alpha diversity patterns in the Jiulong River estuary (see Supplementary Figure 2). Differences were observed among the different indices, namely, NO2–-N and T in H’ contributed 51 and 49%, NO2–-N and Sal in J contributed 52 and 48%, respectively, while a greater number of environmental determinants in S were observed, including Sal (42%), NO3–-N (25%), TN:TP (18%), and WD (15%) (Figure 8).
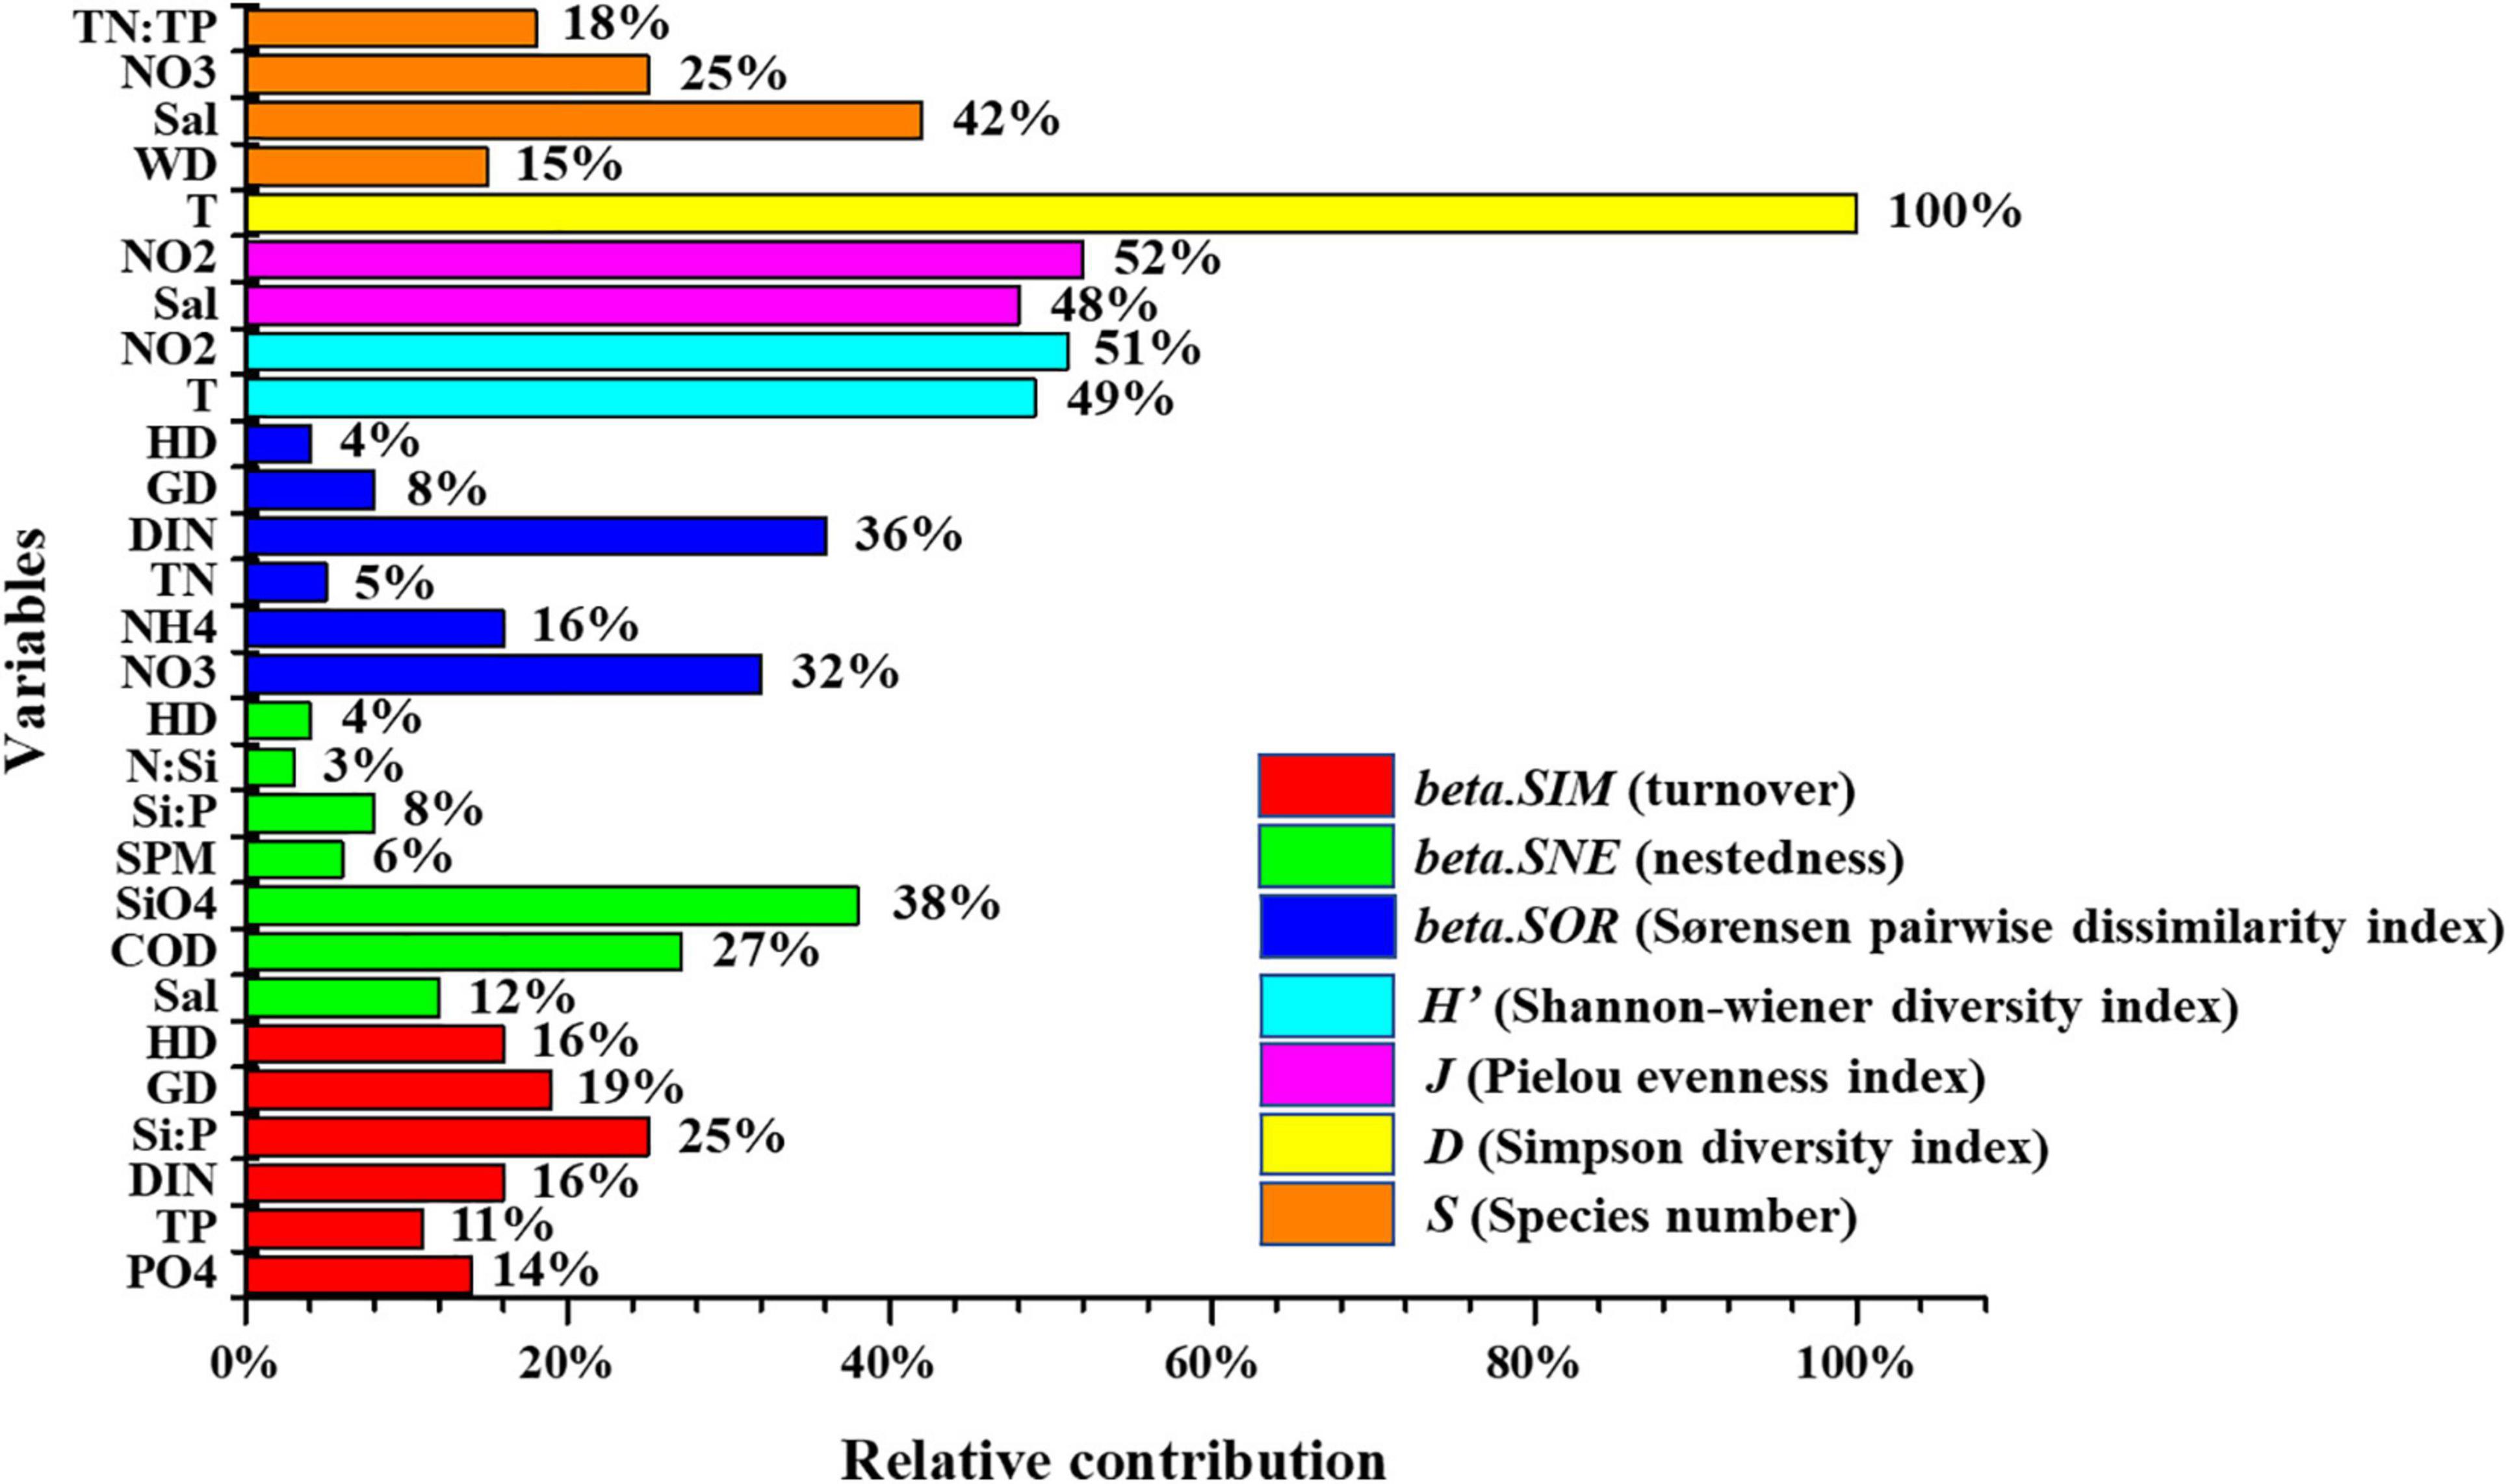
Figure 8. Relative contribution of environmental variables and spatial distances to phytoplankton diversity of the overall.
For beta.SOR, beta.SIM, and beta.SNE, environmental and spatial factors drove beta diversity, where the total contributions of environmental variables were 88, 65, and 96% and that of spatial variables were 12, 35, and 4%, respectively (Figure 8). Key environmental determinants of beta.SOR included DIN (36%), TN (5%), NO3–-N (32%), and NH4+-N (16%), followed by spatial variables (12%, GD: 8%; HD: 4%). Environmental variables contributed of beta.SIM the highest were Si:P (25%), DIN (16%), PO4–-P (14%), and TP (11%), followed by spatial variables (35%, HD:16%, GD: 19%). Compared to the low spatial variables contribution (4%, HD) of beta.SNE, environmental variables played a significant role, namely, SiO4–-Si (38%), COD (27%), Sal (12%), Si:P (8%), SPM (6%), and N:Si (3%). Although phytoplankton beta diversity was shaped by the limited contribution of spatial variables in the Jiulong River estuary, which could admittedly be due to the relatively small spatial scale of our study, a significant correlation was observed between beta diversity and spatial distance (Figures 8, 9), which is in agreement with findings from previous studies across various taxa in estuary ecosystems (Josefson and Göke, 2013; Josefson, 2016).
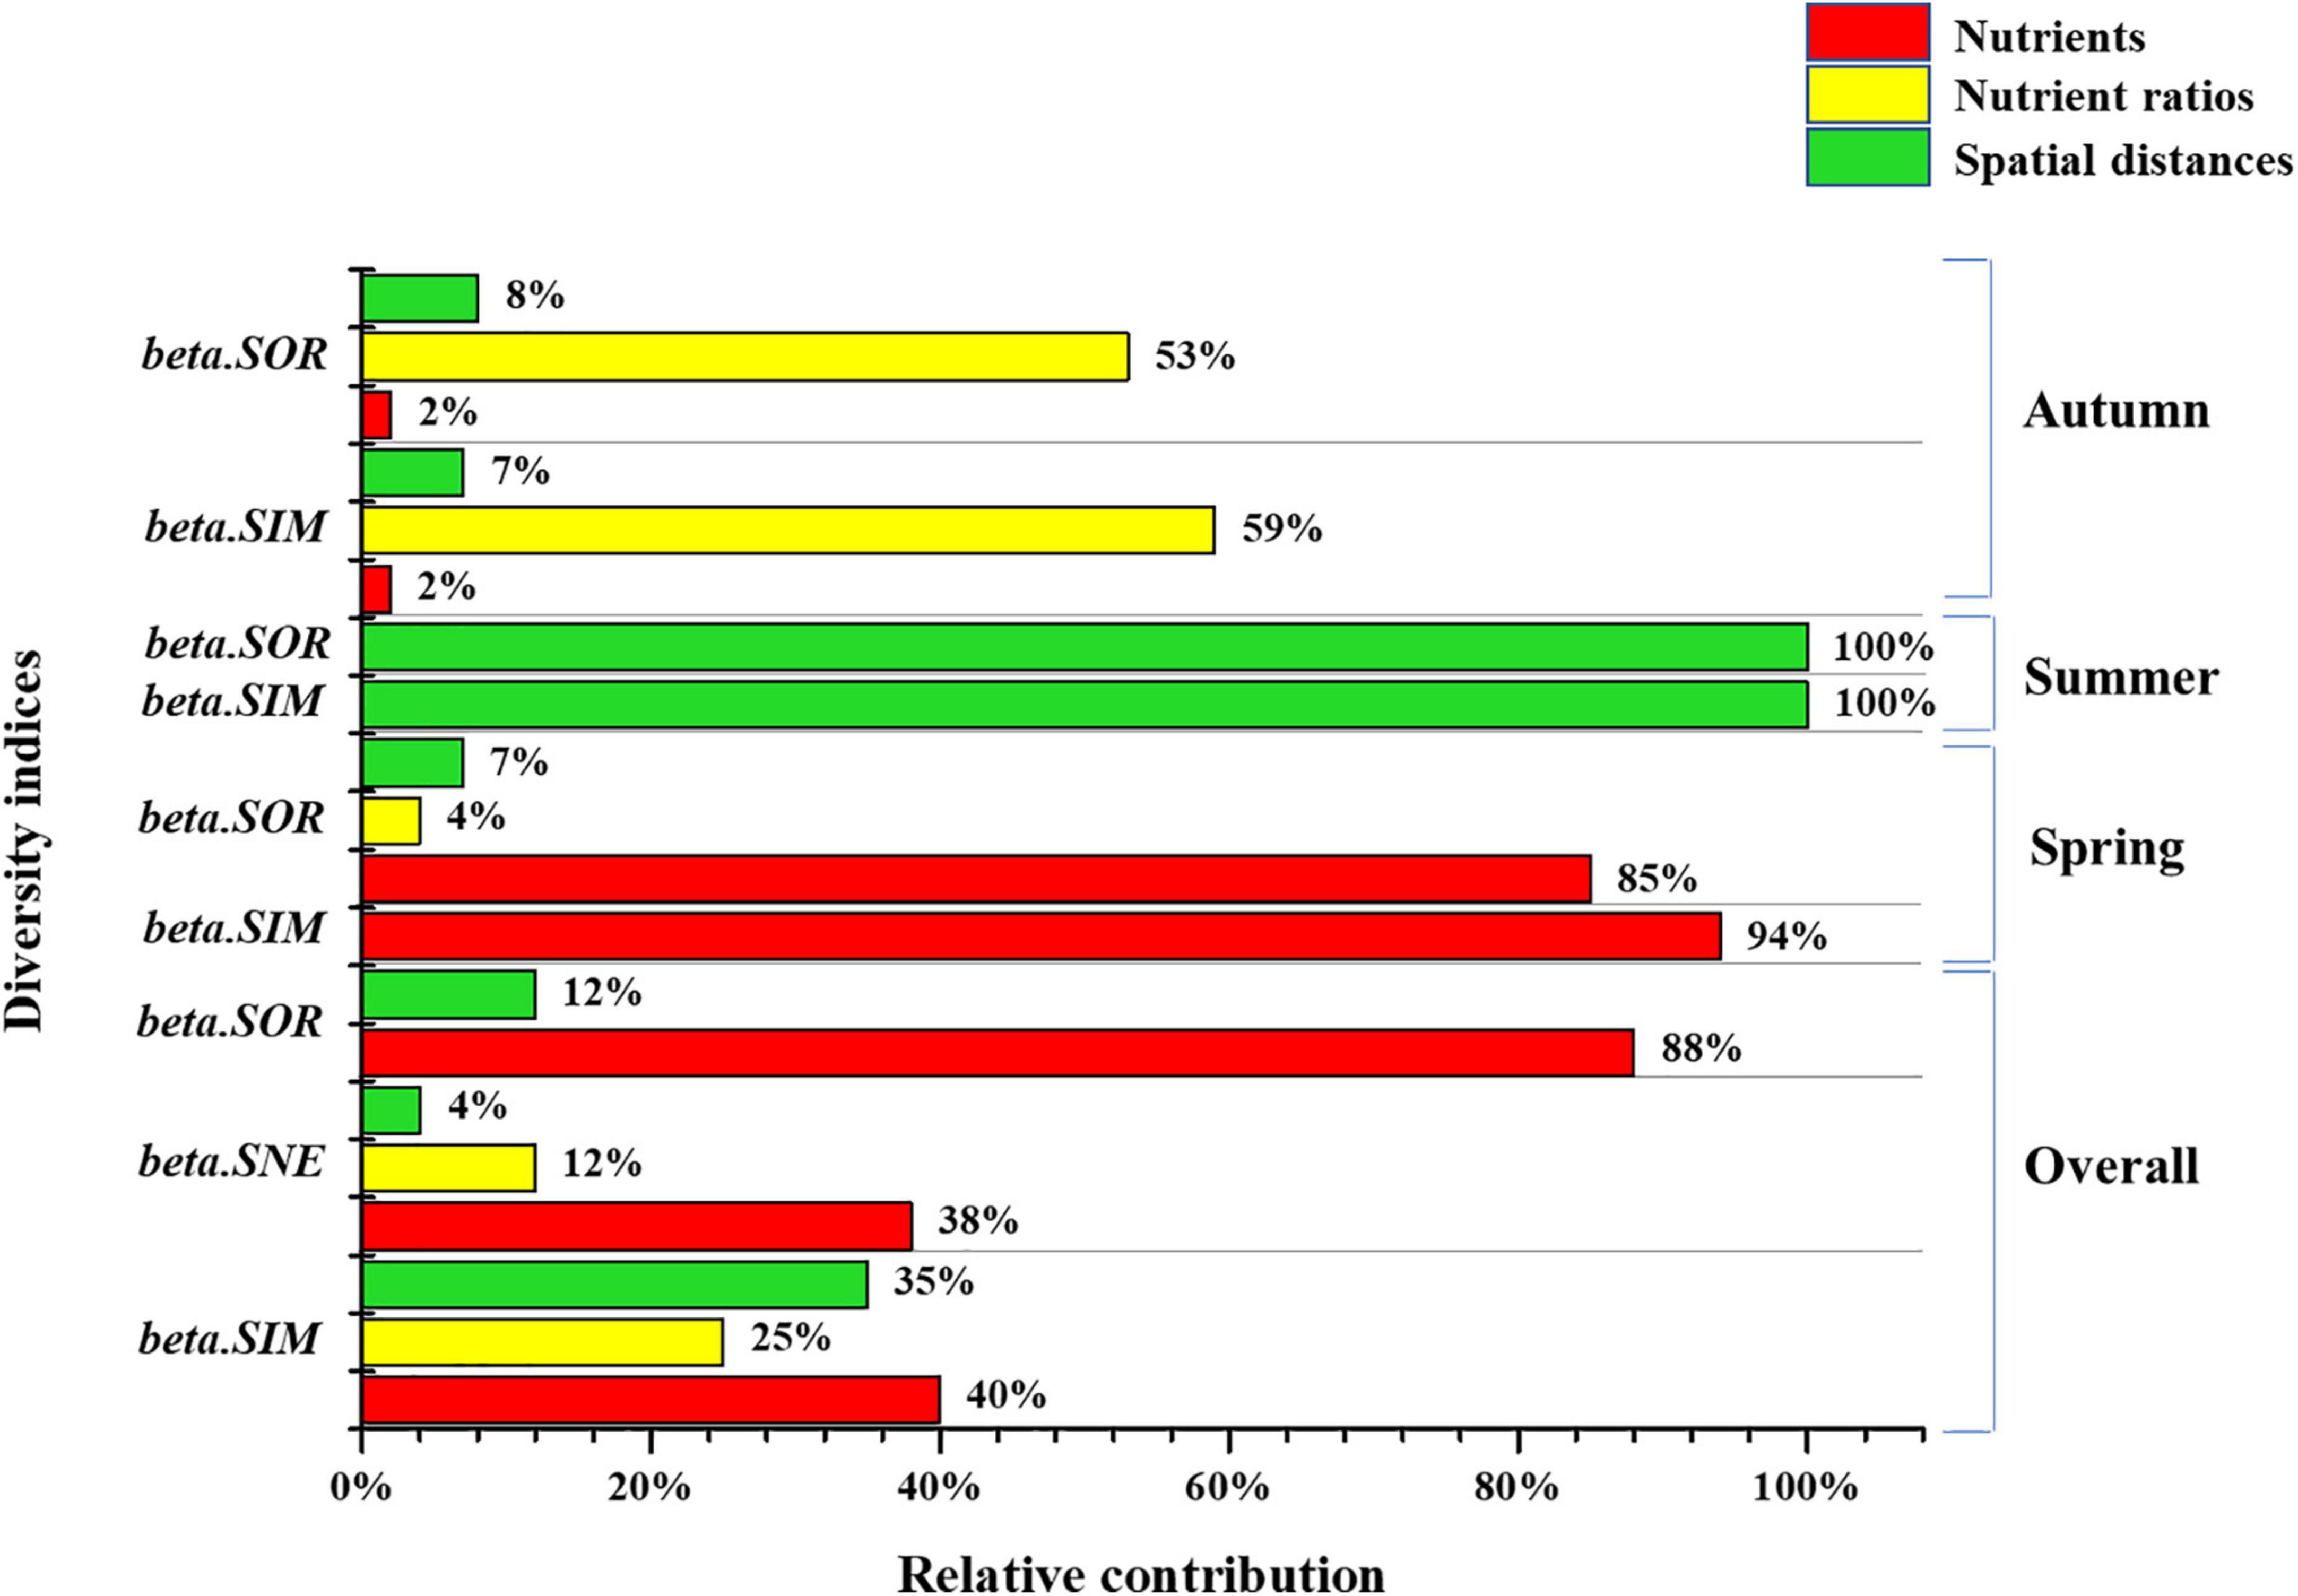
Figure 9. Relative contributions of nutrients, nutrient ratios and spatial distances in beta diversity.
Combined with the key factors that influenced alpha and beta diversity, our study found that environmental factors significantly influenced alpha and beta diversity. Moreover, beta diversity was also influenced by spatial distances. Although many studies have shown a strong relationship between spatial distance and beta diversity respective to different taxa in estuarine systems, such as phytoplankton (Josefson and Göke, 2013), benthic invertebrates (Josefson and Göke, 2013), and bivalve mollusks (Chust et al., 2013), most of these studies focused on passive dispersal or less mobile species, and the relationship between distance and highly mobile species in estuarine systems is not yet clear. In our study, compared with environmental variables, spatial distance (geographic and hydrologic distance) showed a lower contribution, for example, only about 12% contribution of spatial distances to the beta.SOR (Figure 9), which might be mainly because of the limited spatial scale in Jiulong River estuary. Thus, it was worthy to examine the contribution of spatial distance to phytoplankton beta diversity in a larger scale in further studies.
Roles of Nutrients and Nutrient Ratios in Shaping Phytoplankton Diversity Patterns
Our study found high correlations between phytoplankton diversity indices and environmental variables of nutrients and nutrient ratios in the Jiulong River estuary, indicating that nutrients and nutrient ratios contributed significantly to phytoplankton biodiversity patterns, which is in agreement with findings from previous studies conducted in similar estuarine environments (Schoor et al., 2008; Li et al., 2010; Huang et al., 2013; Chu et al., 2014; Zhang et al., 2015; Anselme et al., 2018). The relative contribution was quantified by calculating the percentage of the absolute coefficient value of all relevant variables that yielded a statistically significant value (p < 0.001) from optimal regression equations (see Figures 9, 10). Results showed that nutrients contributed 25, 52, 51, 40, 38, and 88% to S, J, H’, beta.SIM, beta.SNE, and beta.SOR, respectively, while nutrients ratio contributed 17, 12, and 25% to S, beta.SNE, and beta.SIM, respectively (Figures 9, 10). In general, nutrients and nutrient ratios contributed significantly to beta diversity and overwhelmingly to alpha diversity, where nutrient ratios influenced S, beta.SIM and beta.SNE and nutrients significantly influenced beta.SOR.
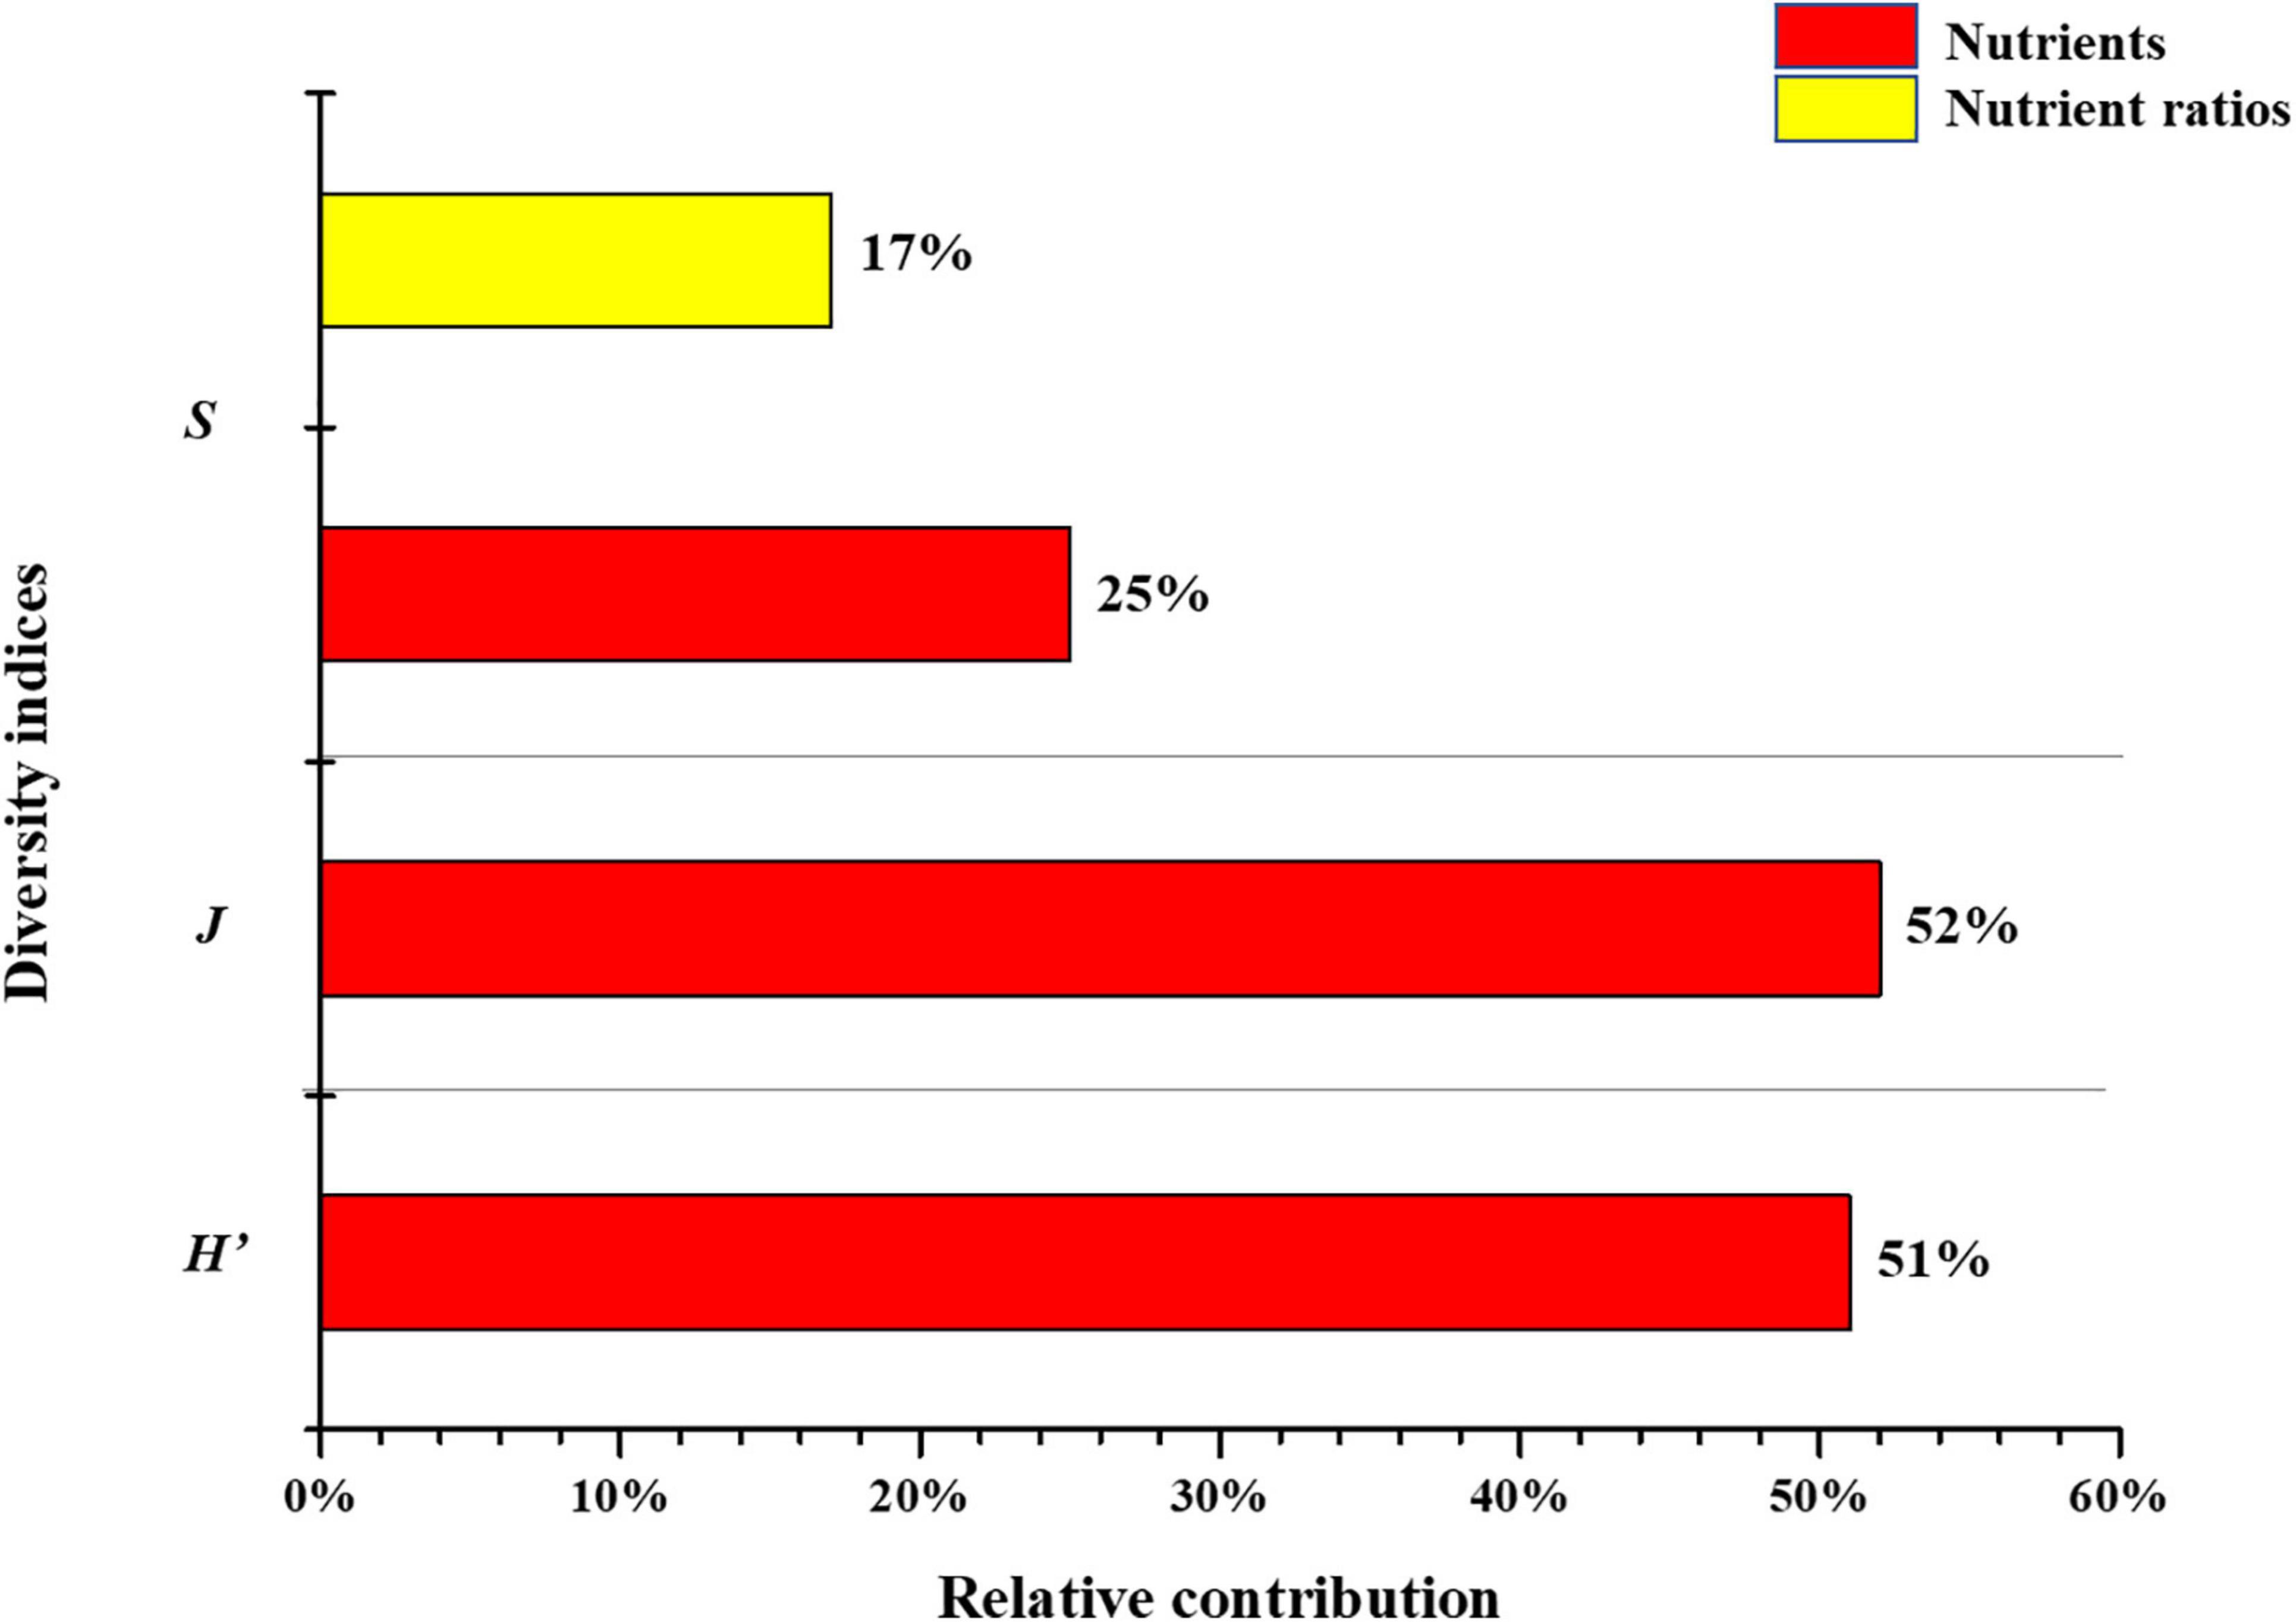
Figure 10. Relative contributions of nutrients and nutrient ratios in alpha diversity.
The results indicated that key variables with greatest contribution to beta diversity varied among different seasons, i.e., nutrients in spring, spatial distances in summer and nutrient ratios in autumn, respectively (see Supplementary Table 4). The seasonal difference above might due to the variation of specific variable, such greatest variation of nutrients (TN and TP) found in spring, nutrient ratios (N:P and Si:P) in autumn; by contract, the variation was slight for environmental variables in summer, so spatial distance played a more important role in shaping communities differences between sites (Figure 9).
Previous studies conducted on nutrient ratios primarily focused on N:P and Si:P (Schoor et al., 2008; Li et al., 2010; Huang et al., 2013; Chu et al., 2014; Zhang et al., 2015), while relatively few focused on Si:N (Li et al., 2010; Chu et al., 2014). Justić et al. (1995) proposed that P limitation could potentially occur under conditions where Si:P > 22 and N:P > 22, N limitation could potentially occur under conditions where N:P < 10 and N:Si < 1, and Si limitation could potentially occur under conditions where Si:P < 10 and N:Si > 1. In our study, P limitation could potentially occur under conditions of high Si:P and N:P in the Jiulong River estuary, where the former ranged from 19 to 933 (118 average) and the latter ranged from 16 to 322 (51 average) (Figure 11). Additionally, the fact that both N:P and Si:P exceeded a value of 10 at all sampling sites (Figure 11), the probability of Si and N limitation was low. Our study found that P was a potential limiting factor in the Jiulong River estuary, while the estuary was clearly N-enriched, Si-enriched, and P-limited.
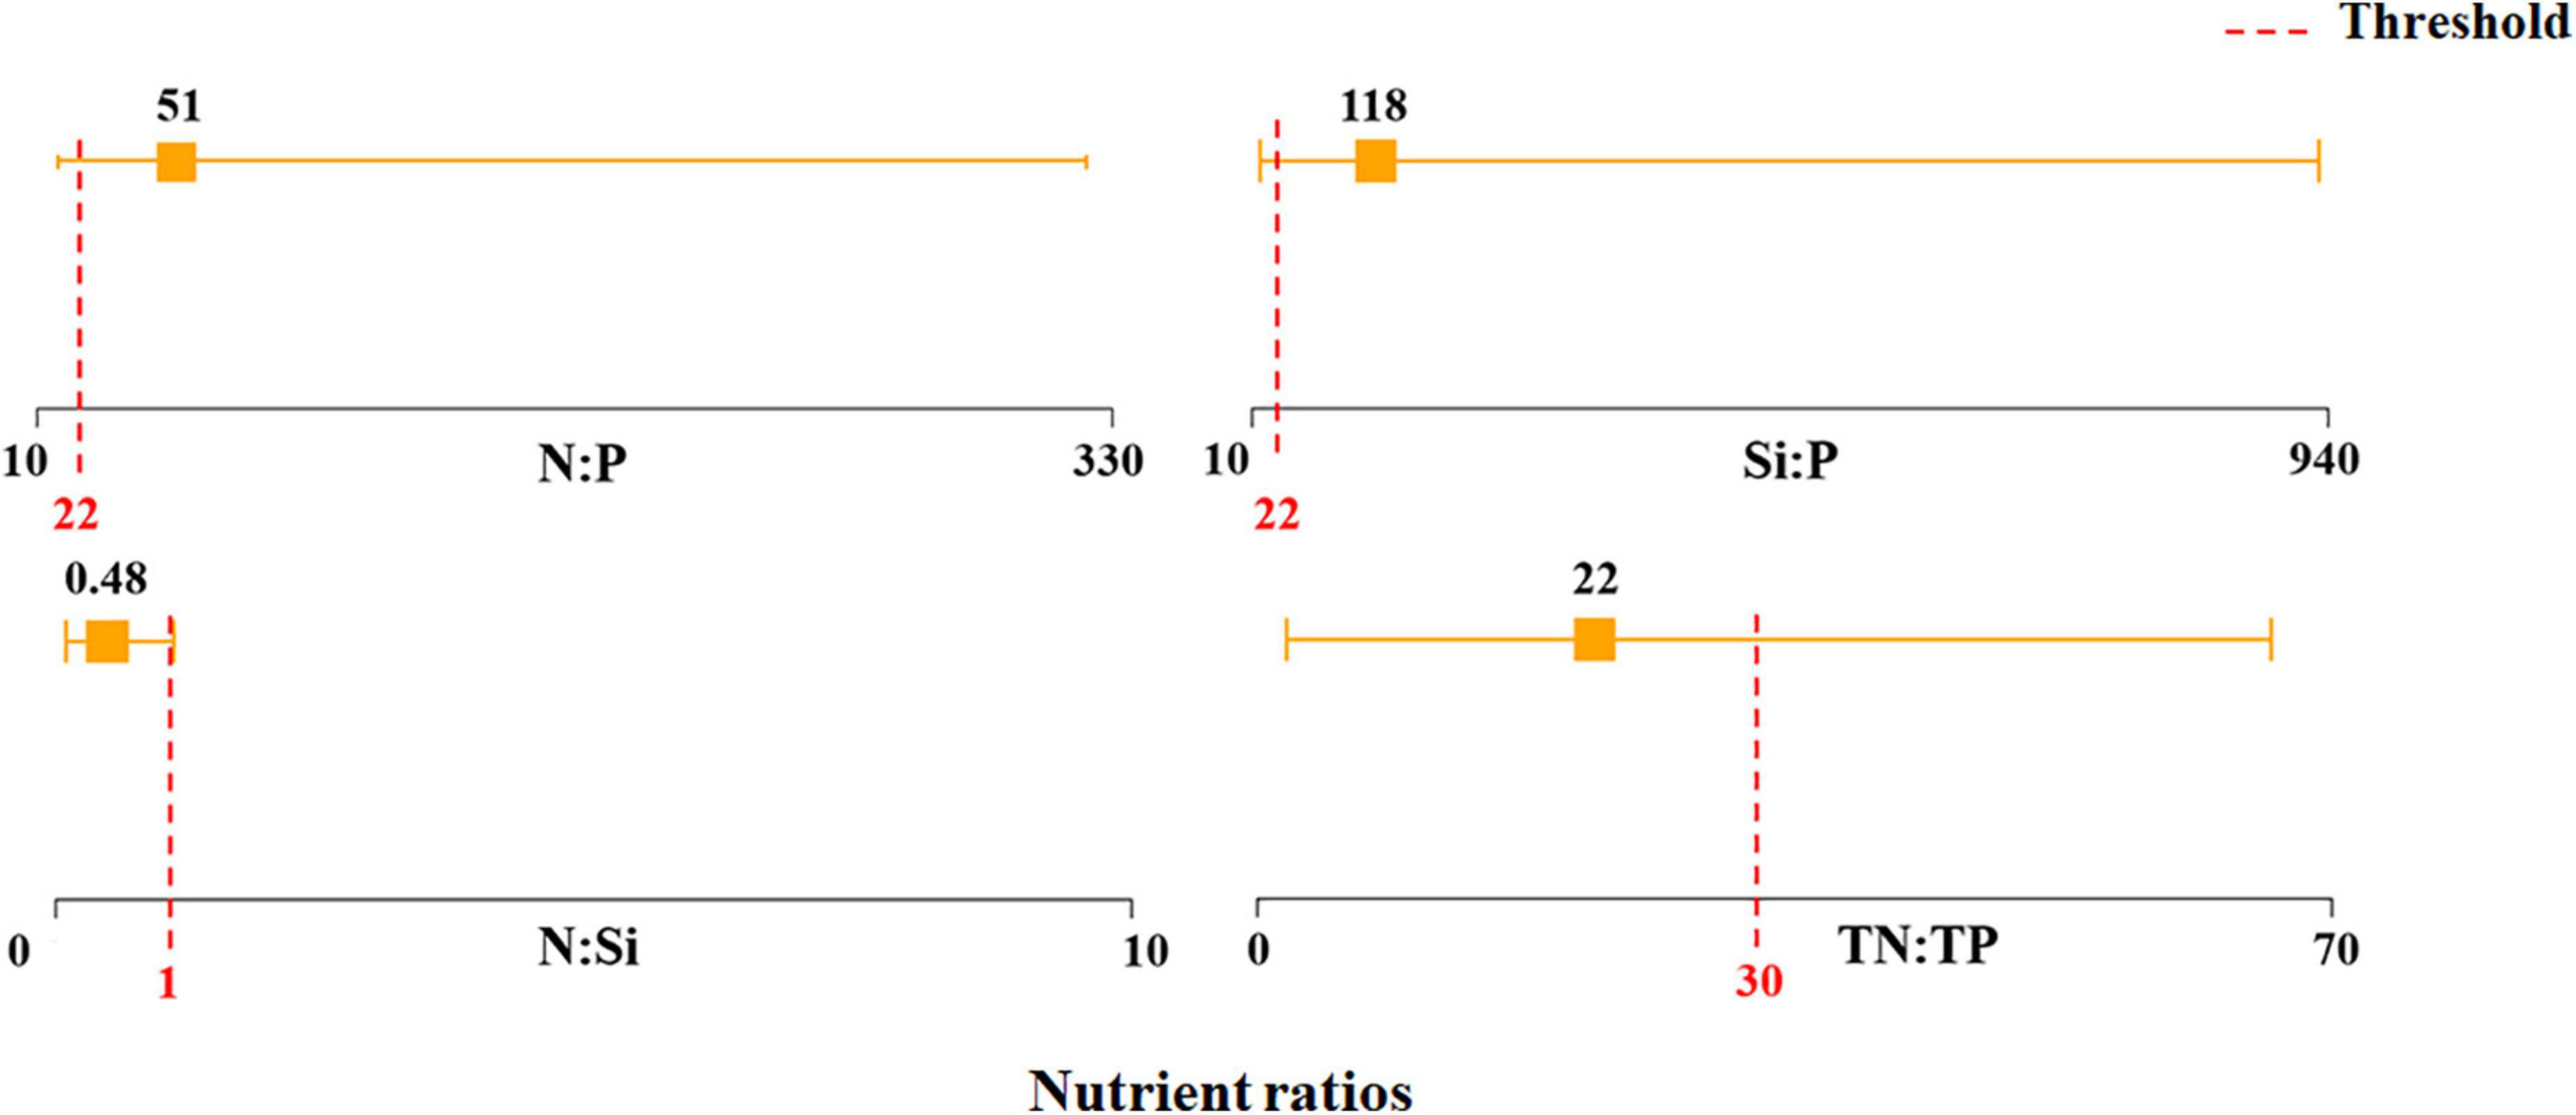
Figure 11. The range and average of nutrient ratios. Yellow line represented the range values of nutrient ratio in Jiulong River Estuary, and yellow square represented their average. Red dashed line represented the threshold of nutrient ratios to inform potential P, N, and Si limitation (Justić et al., 1995).
The same nutrient ratio phenomenon was observed in the Yangtze River and Pearl River estuaries, being the two largest and most densely populated and economically developed estuaries in China, where Si:P and N:P values exceeded the recommended threshold (22) (Yin et al., 2001; Li et al., 2010), indicating that similar to the Jiulong River estuary, they were also N-enriched, Si-enriched, and P-limited. However, compared to these two large estuaries, Si:P, N:P, and N:Si values in the Jiulong River estuary were all lower (Figure 12), indicating that the nutrient condition of the Jiulong River estuary was more balanced than these estuaries, even with respect to the general condition along the Chinese coast (Figure 12).
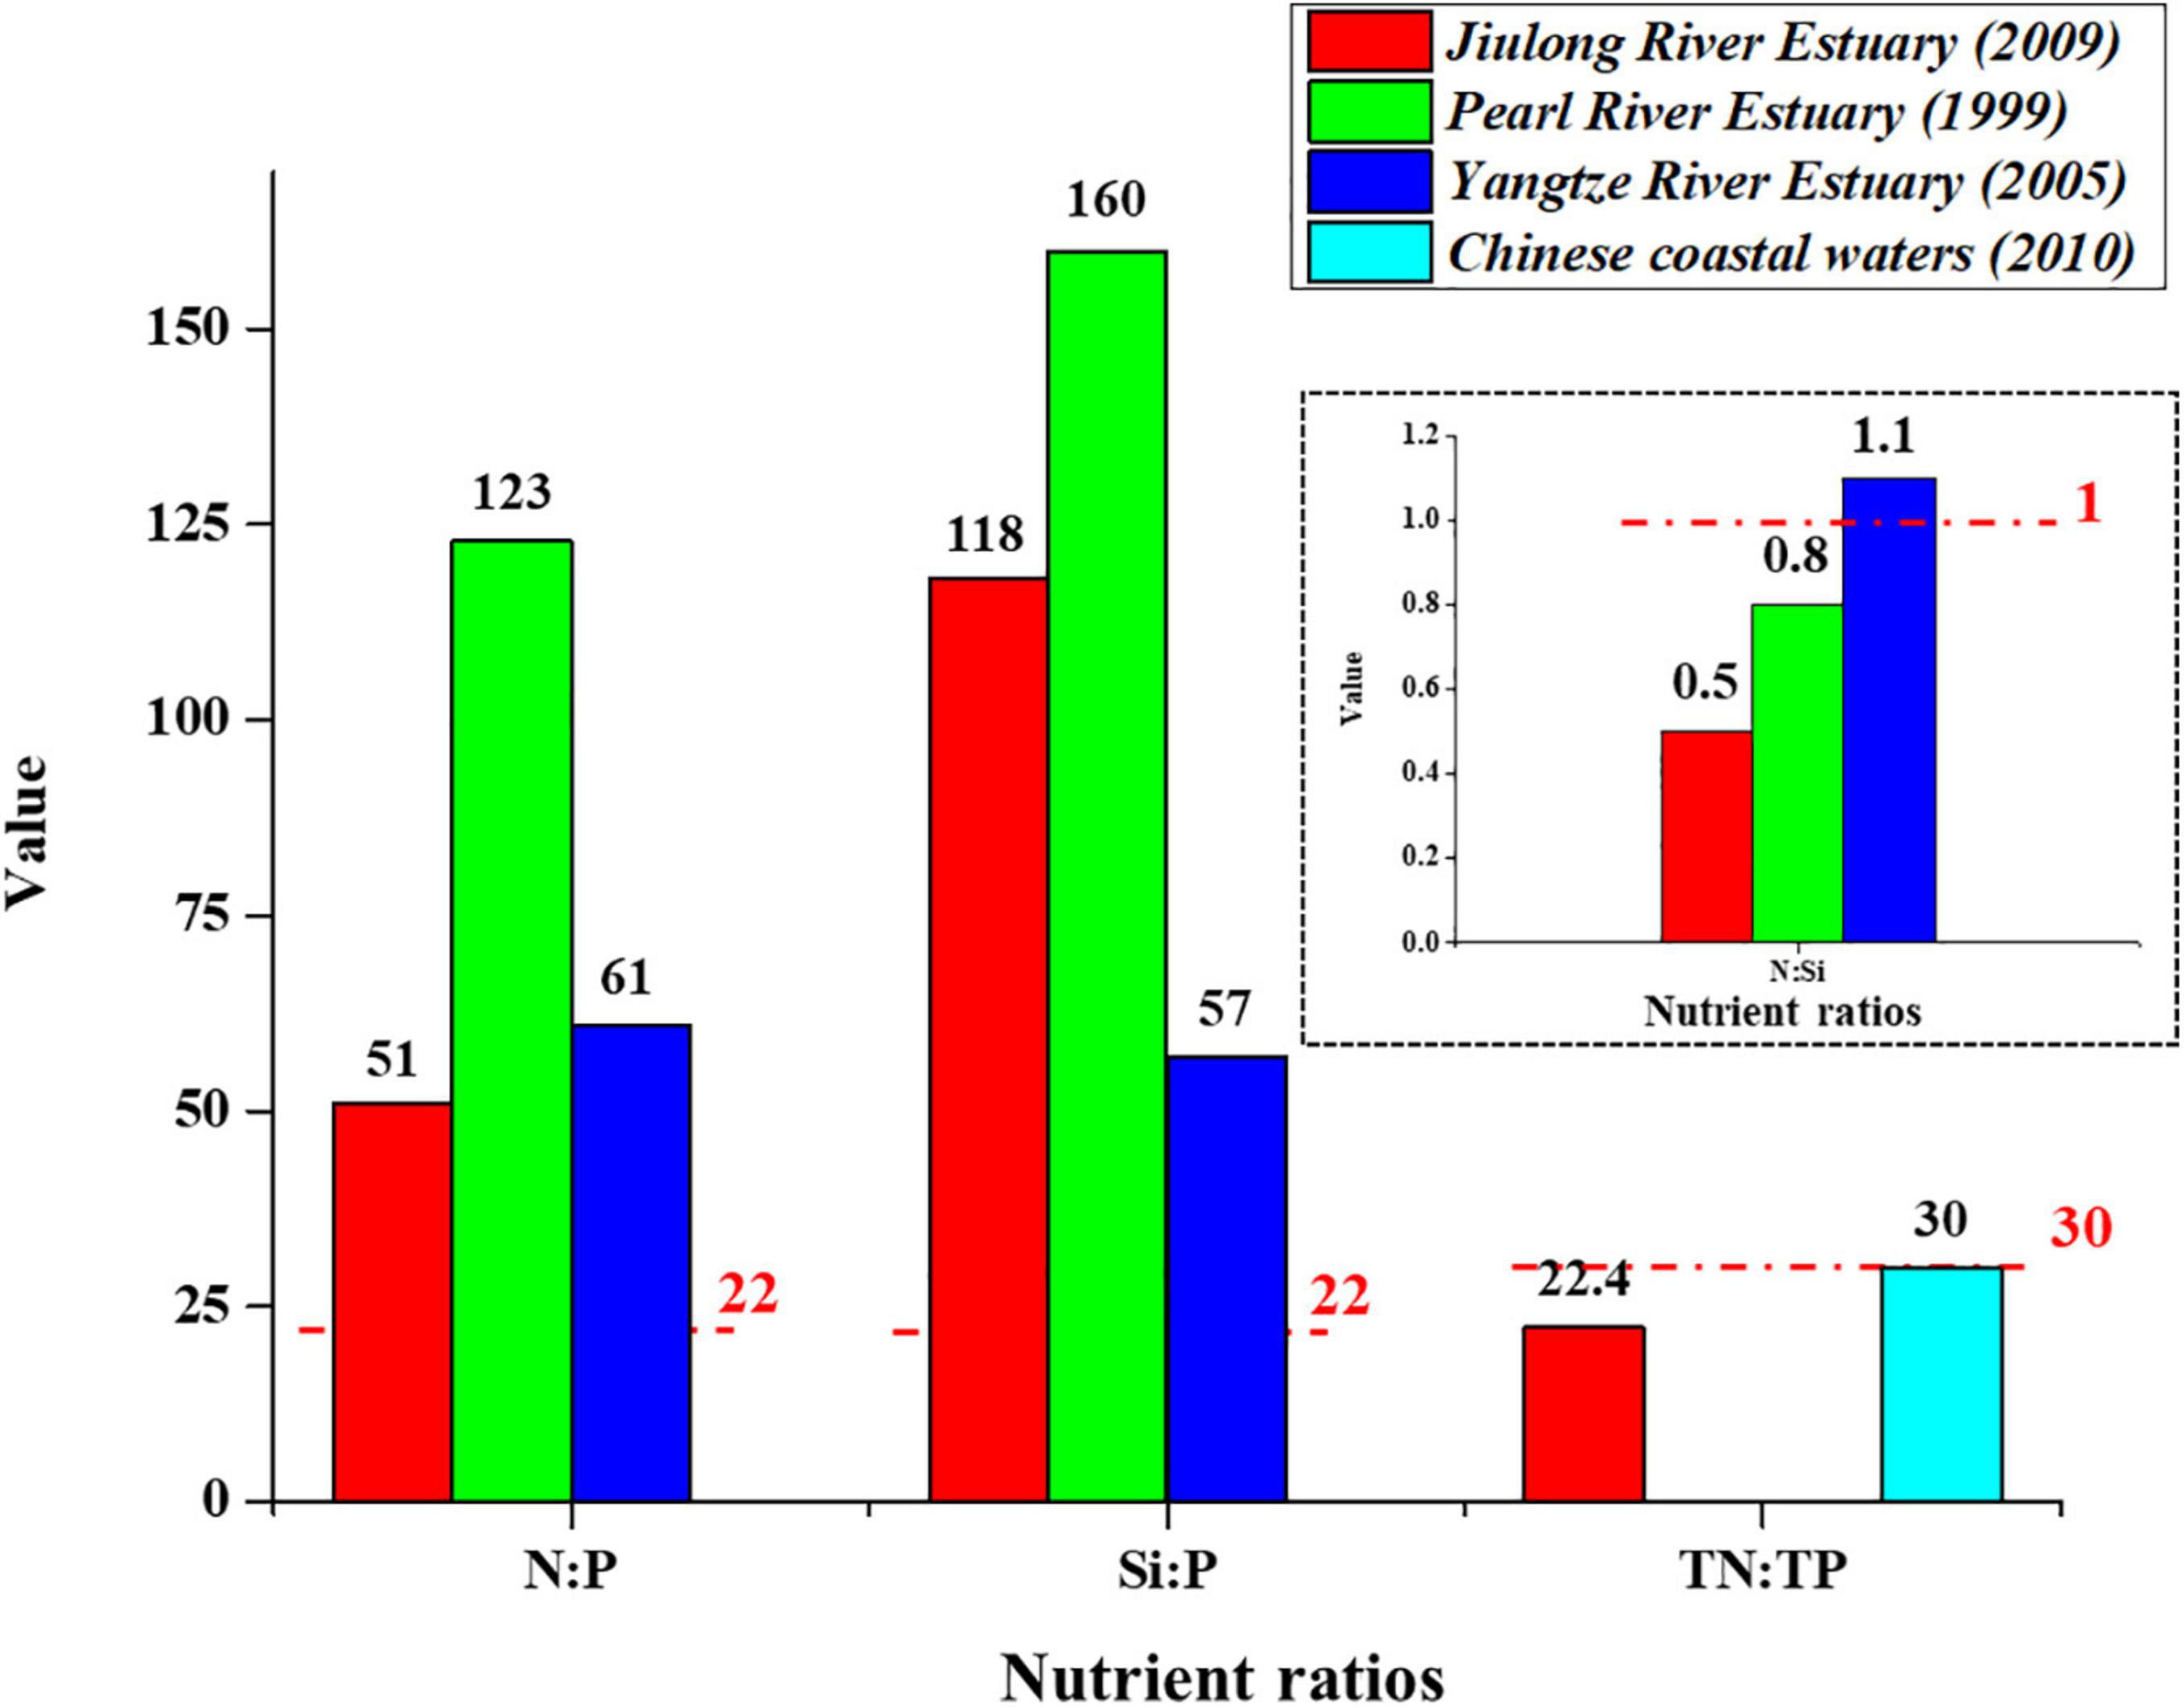
Figure 12. The average of nutrient ratios in Yangtze River Estuary (Li et al., 2010), Pearl River Estuary (Yin et al., 2001), Jiulong River Estuary and Chinese coastal waters (Wang et al., 2021). Red dashed line represented the threshold of nutrient ratio to inform potential P, N, and Si limitation (Justić et al., 1995).
Given that different phytoplankton species differ in their nutrient demands, nutrient concentrations and nutrient ratios may affect phytoplankton diversity (Redfield, 1934; Paerl and Justić, 2013). Additionally, N and P are essential nutrients for all phytoplankton species (Paerl and Justić, 2013), while Si is mostly specific to diatoms (Officer and Ryther, 1980). Taking this into account, we inferred that N played a more important role in phytoplankton diversity patterns than P and Si in the Jiulong River estuary. This is because of a nutrient concentration imbalance in different elements characterized by enriched N, limited P, and specifically Si. We also found that diatoms became more prevalent in the Jiulong River estuary as Si concentrations increased, where diatoms accounted for large proportion of species composition of the phytoplankton community (i.e., 90% in summer and 87% in autumn). Therefore, nutrient concentrations and nutrient ratios may influence phytoplankton diversity patterns. Accordingly, more attention should be paid to trade-offs among nutrient elements instead of just solely focusing on specific nutrient concentrations.
Recommended Jiulong River Estuary Ecosystem Management Practices
Increasingly, beta diversity has been used to guide biodiversity conservation, such as the design of protected areas, the identification of priority areas, and the establishment of ecological corridors (Cody, 1986; Thomas, 1990; Harrison et al., 1992; Pimm and Gittleman, 1992; Nekola and White, 1999; Myers et al., 2000; Wu et al., 2010; Fattorini, 2011). The two beta diversity components reflect two different or even opposite processes in community construction (Gaston and Blackburn, 2000; Baselga, 2012); thus, beta diversity decomposition should be incorporated into biodiversity conservation rather than accounting for beta diversity alone (Angeler, 2013). Baselga (2010) suggested that when turnover dominates, the entire area should be protected, while when nestedness dominates, only sites or areas with the highest species richness should be protected to conserve the entire area. On this account, the entire Jiulong River estuary should be protected due to its dominant turnover pattern (accounting for 85%). Additionally, when using alpha and beta diversity, more attention should be paid to conserving diverse species composition of phytoplankton in the upper reaches, and protecting its species abundance in the lower reaches.
This study showed that the Jiulong River estuary is N-enriched, Si-enriched, and P-limited, where an excess in N and Si may lead to eutrophication and impact phytoplankton diversity. Compared to the Yangtze River and Pearl River estuaries, the nutrient status in the Jiulong River estuary was more balanced. Phytoplankton take up extraneous nutrients at a fixed ratio (Redfield ratio: C:N:P = 106:16:1; Redfield, 1934) to meet their own growth and survival requirements, and diatoms specifically require Si in addition to C, N, and P, absorbing Si and N on a 1:1 M basis (Officer and Ryther, 1980). Although there is a strong consensus that N is the primary cause of eutrophication in aquatic marine ecosystems (Paerl, 2009; Cosme et al., 2015), the relatively high Si (compared to N) in the Jiulong River estuary poses a potential algal bloom threat. With an increase in Si concentrations in the Jiulong River estuary, the composition of phytoplankton species richness gradually led to the dominance of diatoms. For example, diatoms accounted for roughly 90% of phytoplankton species richness in our study, which may impact phytoplankton diversity. Therefore, instead of solely focusing on reducing N pollution, it is recommended to also reduce Si concentrations during ecosystem restoration initiatives. This will help restructure the phytoplankton community and prevent algal blooms (via diatoms).
Conclusion
Phytoplankton is one of the most susceptible aquatic organisms to environmental change in estuaries, especially regarding eutrophication. In this study, phytoplankton diversity patterns and their potential factors (particularly nutrient concentrations and nutrient ratios) were examined, using both alpha and beta diversity in the Jiulong River estuary, China. Our study indicated that diversity patterns were shown to vary at different scales, in different seasons and in different indices in Jiulong River estuary, where the phytoplankton species richness was higher in autumn and in the lower estuary, while phytoplankton was more diverse and heterogeneous in its composition in the upper estuary, highlighting that it is better to explore diversity patterns hierarchically to inform an effective conservation strategy. Environmental factors had a significant influence on both alpha and beta phytoplankton diversity in Jiulong River estuary, particularly nutrient concentrations and nutrient ratios, characterized by an excess in N and Si but limited P. Our findings provide an important information to enhance biodiversity conservation in Jiulong River estuary in a comprehensive way, and also offer a practical approach and analytically based information to protect estuarine or even other marine ecosystem diversity, which can be applied to other estuaries to better guide sustainable management and conservation practices.
Data Availability Statement
The raw data supporting the conclusions of this article will be made available by the authors, without undue reservation.
Author Contributions
FG: perform the research. FG, WY, and WH: methodology, data wrangling, and project administration. FG, YW, XL, SA, DZ, WZ, and FK: data analyze. XY, ZM, and ZL: resources and data collection. WY, WH, ZM, and BC: supervision. BC, XY, and WY: funding acquisition. All authors contributed to the conceptualization, writing, review, and editing of the manuscript, and read and agreed to the published version of the manuscript.
Funding
This article was funded by the National Key research and Development Program of China (2017YFA0604902), the National Natural Science Foundation of China (42076163 and 42176171), and Marine Public Welfare Project of China (200805064).
Conflict of Interest
The authors declare that the research was conducted in the absence of any commercial or financial relationships that could be construed as a potential conflict of interest.
Publisher’s Note
All claims expressed in this article are solely those of the authors and do not necessarily represent those of their affiliated organizations, or those of the publisher, the editors and the reviewers. Any product that may be evaluated in this article, or claim that may be made by its manufacturer, is not guaranteed or endorsed by the publisher.
Supplementary Material
The Supplementary Material for this article can be found online at: https://www.frontiersin.org/articles/10.3389/fmars.2022.829285/full#supplementary-material
References
Alsaffar, Z., Cúrdia, J., Borja, A., Irigoien, X., and Carvalho, S. (2017). Consistent variability in beta-diversity patterns contrasts with changes in alpha-diversity along an onshore to offshore environmental gradient: the case of red sea soft-bottom macrobenthos. Mar. Biodiv. 49, 247–262. doi: 10.1007/s12526-017-0791-3
Angeler, D. G. (2013). Revealing a conservation challenge through partitioned long-term beta diversity: increasing turnover and decreasing nestedness of boreal lake metacommunities. Divers. Distrib. 19, 772–781. doi: 10.1111/ddi.12029
Anselme, C. M., Gisele, F. Y. G., Jules, R. N. N., Manfred, D. B., Fils, M. O., and Raphaël, O. (2018). Assessment of water quality in the lower nyong estuary (cameroon, atlantic coast) from environmental variables and phytoplankton communities composition. Afr. J. Environ. Sci. Technol. 12, 198–208. doi: 10.5897/ajest2017.2454
Atwood, T. B., Wiegner, T. N., and MacKenzie, R. A. (2012). Effects of hydrological forcing on the structure of a tropical estuarine food web. Oikos 121, 277–289. doi: 10.1111/j.1600-0706.2011.19132.x
Bach, L. T., Paul, A., Boxhammer, T., von der Esch, E., Graco, M., Schulz, K., et al. (2020). Factors controlling plankton community production, export flux, and particulate matter stoichiometry in the coastal upwelling system off Peru. Biogeosciences 17, 4831–4852. doi: 10.5194/bg-17-4831-2020
Balvanera, P. (2019). Societal burdens of nature loss. Science 366, 184–185. doi: 10.1126/science.aaz1433
Barletta, M., Lima, A. R. A., and Costa, M. F. (2019). Distribution, sources and consequences of nutrients, persistent organic pollutants, metals and microplastics in south American estuaries. Sci. Total Environ. 651, 1199–1218. doi: 10.1016/j.scitotenv.2018.09.276
Baselga, A. (2010). Partitioning the turnover and nestedness components of beta diversity. Glob. Ecol. Biogeogr. 19, 134–143. doi: 10.1111/j.1466-8238.2009.00490.x
Baselga, A. (2012). The relationship between species replacement, dissimilarity derived from nestedness, and nestedness. Glob. Ecol. Biogeogr. 21, 1223–1232. doi: 10.1111/j.1466-8238.2011.00756.x
Baselga, A., and Orme, C. D. L. (2012). betapart: an R package for the study of beta diversity. Methods Ecol. Evol. 3, 808–812. doi: 10.1111/j.2041-210x.2012.00224.x
Bertuzzi, T., Pires, M. M., and Maltchik, L. (2018). Drivers of the beta diversity of aquatic plant communities along a latitudinal gradient in southern Brazilian coastal ponds. J. Veg. Sci. 30, 281–290. doi: 10.1111/jvs.12711
Bharathi, M. D., and Sarma, V. S. (2019). Impact of monsoon-induced discharge on phytoplankton community structure in the tropical Indian estuaries. Reg. Stud. Mar. Sci. 31:100795. doi: 10.1016/j.rsma.2019.100795
Blowes, S. A., Supp, S. R., Antão, L. H., Bates, A., Bruelheide, H., Chase, J. M., et al. (2019). The geography of biodiversity change in marine and terrestrial assemblages. Science 366, 339–345. doi: 10.1126/science.aaw1620
Bode, A., Varela, M., Prego, R., Rozada, F., and Santos, M. D. (2017). The relative effects of upwelling and river flow on the phytoplankton diversity patterns in the ria of a coruña (NW Spain). Mar. Biol. 164:93. doi: 10.1007/s00227-017-3126-9
Bricker, S. B., Longstaff, B., Dennison, W., Jones, A., Boicourt, K., Wicks, C., et al. (2008). Effects of nutrient enrichment in the nation’s estuaries: a decade of change. Harmful Algae. 8, 21–32. doi: 10.1016/j.hal.2008.08.028
Bucci, A. F., Ciotti, ÁM., Pollery, R. C. G., de Carvalho, R., de Albuquerque, H. C., and Simões, L. T. S. (2012). Temporal variability of chlorophyll-a in the São vicente estuary. Braz. J. Oceanogr. 60, 485–499. doi: 10.1590/s1679-87592012000400007
Chapin, F. S. III, Zavaleta, E. S., Eviner, V. T., Naylor, R. L., Vitousek, P. M., Reynolds, H. L., et al. (2000). Consequence of changing biodiversity. Nature 405, 232–242. doi: 10.1038/35012241
Chislock, M. F., Sharp, K. L., and Wilson, A. E. (2014). Cylindrospermopsis raciborskii dominates under very low and high nitrogen-to-phosphorus ratios. Water Res. 49, 207–214. doi: 10.1016/j.watres.2013.11.022
Chu, T. V., Torréton, J. P., Mari, X., Nguyen, H. M. T., Pham, K. T., Pham, T. T., et al. (2014). Nutrient ratios and the complex structure of phytoplankton communities in a highly turbid estuary of Southeast Asia. Environ. Monit. Assess. 186, 8555–8572. doi: 10.1007/s10661-014-4024-y
Chust, G., Albaina, A., Aranburu, A., Borja, Á, Diekmann, O. E., Estonba, A., et al. (2013). Connectivity, neutral theories and the assessment of species vulnerability to global change in temperate estuaries. Estuar. Coast. Shelf Sci. 131, 52–63. doi: 10.1016/j.ecss.2013.08.005
Clark, G. F., Kelaher, B. P., Dafforn, K. A., Coleman, M. A., Knott, N. A., Marzinelli, E. M., et al. (2015). What does impacted look like? High diversity and abundance of epibiota in modified estuaries. Environ. Pollut. 196, 12–20. doi: 10.1016/j.envpol.2014.09.017
Cody, M. L. (1986). “Diversity, rarity, and conservation in mediterranean-climate regions,” in Conservation Biology: The Science of Scarcity and Diversity, ed. M. E. Soulé (Sunderland, MA: Sinauer Associates), 122–152. doi: 10.1016/j.scitotenv.2016.09.097
Collen, B., Whitton, F., Dyer, E. E., Baillie, J. E. M., Cumberlidge, N., Darwall, W. R. T., et al. (2013). Global patterns of freshwater species diversity, threat and endemism. Glob. Ecol. Biogeogr. 23, 40–51. doi: 10.1111/geb.12096
Condit, R., Pitman, N., Leigh, E. G. Jr., Chave, J., Terborgh, J., Foster, R. B., et al. (2002). Beta-diversity in tropical forest trees. Science 295, 666–669. doi: 10.1126/science.1066854
Cooper, G. S., Willcock, S., and Dearing, J. A. (2020). Regime shifts occur disproportionately faster in larger ecosystems. Nat. Commun. 11:15029. doi: 10.1038/s41467-020-15029-x
Cosme, N., Koski, M., and Hauschild, M. Z. (2015). Exposure factors for marine eutrophication impacts assessment based on a mechanistic biological model. Ecol. Modell. 317, 50–63. doi: 10.1016/j.ecolmodel.2015.09.005
Costanza, R., d’ Arge, R., de Groot, R., Farber, S., Grasso, M., Hannon, B., et al. (1997). The value of the world’s ecosystem services and natural capital. Nature 387, 253–260. doi: 10.1038/387253a0
Dursun, F., and Tas, S. (2019). Variations in abundance and diversity of phytoplankton in the surface waters of the golden horn estuary (sea of marmara). J. Mar. Biol. Assoc. U.K. 99, 279–290. doi: 10.1017/s0025315418000073
Ekwu, A. O., and Sikoki, F. D. (2006). Phytoplankton diversity in the cross river estuary of nigeria. J. Appl. Sci. Environ. Mgt. March. 10, 89–95. doi: 10.4314/jasem.v10i1.17296
Elliot, M., and Whitfield, A. K. (2011). Challenging paradigms in estuarine ecology and management. Estuar. Coast. Shelf Sci. 94, 306–314. doi: 10.1016/j.ecss.2011.06.016
Falkowski, P. G., and Davis, C. S. (2004). Natural proportions. Nature 431:131. doi: 10.1038/431131a
Fattorini, S. (2011). Insect rarity, extinction and conservation in urban rome (italy): a 120-year-long study of tenebrionid beetles. Insect. Conserv. Divers. 4, 307–315. doi: 10.1111/j.1752-4598.2010.00129.x
Fennel, K., and Testa, J. M. (2018). Biogeochemical controls on coastal hypoxia. Annu. Rev. Mar. Sci. 11, 4.1–4.26. doi: 10.1146/annurev-marine-010318-095138
Fu, H., Yuan, G., Jeppesen, E., Ge, D., Li, W., Zou, D., et al. (2019). Local and regional drivers of turnover and nestedness components of species and functional beta diversity in lake macrophyte communities in China. Sci. Total Environ. 687, 206–217. doi: 10.1016/j.scitotenv.2019.06.092
Fujian Provincial Bureau of Statistics (2020). The Statistical Bulletin of National Economic and Social Development of Fujian Province. Fuzhou: Fujian Daily News. 2019.
Gaston, K. J., and Blackburn, T. M. (2000). Pattern and Process in Macroecology. Oxford: Blackwell Science.
Gillanders, B. M., Elsdon, T. S., Halliday, I. A., Jenkins, G. P., Robins, J. B., and Valesini, F. J. (2011). Potential effects of climate change on Australian estuaries and fish utilising estuaries: a review. Mar. Freshw. Res. 62:1115. doi: 10.1071/mf11047
Guo, P., Shen, H., and Wang, J. (2014). Species diversity, community structure and distribution of phytoplankton in the changjiang estuary during dry and flood periods. J. Mar. Biol. Assoc. U.K. 94, 459–472. doi: 10.1017/s0025315413001641
Harrison, S., Ross, S. J., and Lawton, J. H. (1992). Beta diversity on geographic gradients in britain. J. Anim. Ecol. 61, 151–158. doi: 10.2307/5518
Ho, J. C., Michalak, A. M., and Pahlevan, N. (2019). Widespread global increase in intense lake phytoplankton blooms since the 1980s. Nature 574, 667–670. doi: 10.1038/s41586-019-1648-7
Hu, H., Li, Y., Wei, Y., Zhu, H., Chen, J., and Shi, Z. (1980). Algae in Fresh Waters of China. Shanghai: Shanghai Science and Technology Press.
Huang, W., Zhu, X., Chen, Q., He, Q., Liao, Y., Du, P., et al. (2013). Seasonal variability of phytoplankton community structure in relation to different nitrogen-phosphorus ratios in the southern coastal waters of zhejiang, China. J. Ocean Univ. China 12, 577–588. doi: 10.1007/s11802-013-2192-y
Huang, X. (2008). Hydrological characteristics of jiulong river basin. Hydraul. Sci. Technol. 1, 16–20.
Huppert, A., Blasius, B., and Stone, L. (2002). A model of phytoplankton blooms. Am. Nat. 159, 156–171. doi: 10.1086/324789
Huppert, A., Blasius, B., Olinky, R., and Stone, L. (2005). A model for seasonal phytoplankton blooms. J. Theor. Biol. 236, 276–290. doi: 10.1016/j.jtbi.2005.03.012
Jacquemin, C., Bertrand, C., Oursel, B., Thorel, M., Franquet, E., and Cavalli, L. (2018). Growth rate of alpine phytoplankton assemblages from contrasting watersheds and N-deposition regimes exposed to nitrogen and phosphorus enrichments. Freshw. Biol. 63, 1326–1339. doi: 10.1111/fwb.13160
Ji, X., Yuan, S., and Zhu, H. (2016). Analysis of a stochastic model for algal bloom with nutrient recycling. Int. J. Biomath. 9:1650083. doi: 10.1142/s1793524516500832
Jing, C., Zhu, X., Bao, X., and Song, D. (2011). Three dimensional tidal current numerical simulation based on FVCOM in and around Xiamen bay. J. Oceanogr. Taiwan Strait. 30, 103–113. doi: 10.3969/J.ISSN.1000-8160.2011.01.016
Josefson, A. B. (2016). Species sorting of benthic invertebrates in a salinity gradient – importance of dispersal limitation. PLoS One 11:e0168908. doi: 10.1371/journal.pone.0168908
Josefson, A. B., and Göke, C. (2013). Disentangling the effects of dispersal and salinity on beta diversity in estuarine benthic invertebrate assemblages. J. Biogeogr. 40, 1000–1009. doi: 10.1111/jbi.12047
Justić, D., Rabalais, N. N., Turner, R. E., and Dortch, Q. (1995). Changes in nutrient structure of river-dominated coastal waters: stoichiometric nutrient balance and its consequences. Estuar. Coast. Shelf Sci. 40, 339–356. doi: 10.1016/s0272-7714(05)80014-9
Koeve, W., and Kähler, P. (2010). Balancing ocean nitrogen. Nat. Geosci. 3, 383–384. doi: 10.1038/ngeo884
Kraft, N. J. B., Comita, L. S., Chase, J. M., Sanders, N. J., Swenson, N. G., Crist, T. O., et al. (2011). Disentangling the drivers of β-diversity along latitudinal and elevational gradients. Science 333, 1755–1758. doi: 10.1126/science.1208584
Legendre, P., and De Cáceres, M. (2013). Beta diversity as the variance of community data: dissimilarity coefficients and partitioning. Ecol. Lett. 16, 951–963. doi: 10.1111/ele.12141
Li, H., Tang, H., Shi, X., Zhang, C., and Wang, X. (2014). Increased nutrient loads from the changjiang (yangtze) river have led to increased harmful algal blooms. Harmful Algae. 39, 92–101. doi: 10.1016/j.hal.2014.07.002
Li, X., Liu, Y., Liu, Y., Xu, Y., Yang, Y., and Shen, Z. (2016). Impacts of geographical distances and environmental differences on the beta diversity of plant communities in the dry-hot valley of the yuanjiang river. Biodiv. Sci. 24, 399–406. doi: 10.17520/biods.2015245
Li, Y., Li, D., Tang, J., Wang, Y., Liu, Z., and He, S. (2010). Long-term changes in the changjiang estuary plankton community related to anthropogenic eutrophication. Aquat. Ecosyst. Health. Manag. 13, 66–72. doi: 10.1080/14634980903579942
Liggins, L., Booth, D. J., Figueira, W. F., Treml, E. A., Tonk, L., Ridgway, T., et al. (2015). Latitude-wide genetic patterns reveal historical effects and contrasting patterns of turnover and nestedness at the range peripheries of a tropical marine fish. Ecography 38, 1212–1224. doi: 10.1111/ecog.01398
Liu, X., and Shen, H. (2001). Estimation of dissolved inorganic nutrients fluxes from the changjiang river into estuary. Sci. China Ser. B. 44, 135–141. doi: 10.1007/bf02884819
Liu, Z. (2012). Sediment Characteristics, Transport Patterns and Their Environmental Response in the Xiamen Sea. Available online at: https://kns.cnki.net/KCMS/detail/detail.aspx?dbname=CMFD2012&filename=1012376101.nh (accessed May 23).
Ma, T., and Mao, L. (2014). Adaptation strategies for climate change in foreign estuarine cities and implications for China. World Environ. 2, 60–63.
Magurran, A. E. (1988). Ecological Diversity and Its Measurement. Bangor: University College of North Wales.
Mills, M. M., and Arrigo, K. R. (2010). Magnitude of oceanic nitrogen fixation influenced by the nutrient uptake ratio of phytoplankton. Nat. Geosci. 3, 412–416. doi: 10.1038/ngeo856
Moresco, G. A., Bortolini, J. C., Dias, J. D., Pineda, A., Jati, S., and Rodrigues, L. C. (2017). Drivers of phytoplankton richness and diversity components in Neotropical floodplain lakes, from small to large spatial scales. Hydrobiologia. 799, 203–215. doi: 10.1007/s10750-017-3214-3
Morris, E. K., Caruso, T., Buscot, F., Fischer, M., Hancock, C., Maier, T. S., et al. (2014). Choosing and using diversity indices: insights for ecological applications from the german biodiversity exploratories. Ecol. Evol. 4, 3514–3524. doi: 10.1002/ece3.1155
Mousing, E. A., Richardson, K., Bendtsen, J., Cetiniæ, I., and Perry, M. J. (2016). Evidence of small-scale spatial structuring of phytoplankton alpha- and beta-diversity in the open ocean. J. Ecol. 104, 1682–1695. doi: 10.1111/1365-2745.12634
Muylaert, K., Sabbe, K., and Vyverman, W. (2009). Changes in phytoplankton diversity and community composition along the salinity gradient of the Schelde estuary (belgium/the netherlands). Estuar. Coast. Shelf Sci. 82, 335–340. doi: 10.1016/j.ecss.2009.01.024
Myers, N., Mittermeier, R. A., Mittermeier, C. G., da Fonseca, G. A. B., and Kent, J. (2000). Biodiversity hotspots for conservation priorities. Nature 403, 853–858. doi: 10.1038/35002501
Nekola, J. C., and White, P. S. (1999). The distance decay of similarity in biogeography and ecology. J. Biogeogr. 26, 867–878. doi: 10.1046/j.1365-2699.1999.00305.x
Nixon, S. W. (1995). Coastal marine eutrophication: a definition, social causes, and future concerns. Ophelia. 41, 199–219. doi: 10.1080/00785236.1995.10422044
NRC (National Research Council) (2000). Clean Coastal Waters: Understanding and Reducing The Effects of Nutrient Pollution. Washington, DC: National Academies Press.
O’Brien, A., Townsend, K., Hale, R., Sharley, D., and Pettigrove, V. (2016). How is ecosystem health defined and measured? A critical review of freshwater and estuarine studies. Ecol. Indic. 69, 722–729. doi: 10.1016/j.ecolind.2016.05.004
Officer, C., and Ryther, J. (1980). The possible importance of silicon in marine eutrophication. Mar. Ecol. Prog. Ser. 3, 83–91. doi: 10.3354/meps003083
Paerl, H. W. (2009). Controlling eutrophication along the freshwater–marine continuum: dual nutrient (n and p) reductions are essential. Estuar. Coast. 32, 593–601. doi: 10.1007/s12237-009-9158-8
Paerl, H. W., Hall, N. S., Peierls, B. L., and Rossignol, K. L. (2014). Evolving paradigms and challenges in estuarine and coastal eutrophication dynamics in a culturally and climatically stressed world. Estuar. Coast. 37, 243–258. doi: 10.1007/s12237-014-9773-x
Paerl, H. W., Valdes-Weaver, L. M., Joyner, A. R., and Winkelmann, V. (2007). Phytoplankton indicators of ecological change in the eutrophying pamlico soundsystem, north carolina. Ecol. Appl. 17, S88–S101. doi: 10.1890/05-0840.1
Paul, C., Hanley, N., Meyer, S. T., Fürst, C., Weisser, W. W., and Knoke, T. (2020). On the functional relationship between biodiversity and economic value. Sci. Adv. 6:eaax7712. doi: 10.1126/sciadv.aax7712
Peet, R. K. (1974). The measurement of species diversity. Annu. Rev. Ecol. Syst. 5, 285–307. doi: 10.2307/2096890
Peñuelas, J., Poulter, B., Sardans, J., Ciais, P., van der Velde, M., Bopp, L., et al. (2013). Human-induced nitrogen–phosphorus imbalances alter natural and managed ecosystems across the globe. Nat. Commun. 4:2934. doi: 10.1038/ncomms3934
Pimm, S. L., and Gittleman, J. L. (1992). Biological diversity: where is it? Science 255:940. doi: 10.1126/science.1546290
Pinsky, M. L., Eikeset, A. M., McCauley, D. J., Payne, J. L., and Sunday, J. M. (2019). Greater vulnerability to warming of marine versus terrestrial ectotherms. Nature 569, 108–111. doi: 10.1038/s41586-019-1132-4
Podani, J., and Schmera, D. (2011). A new conceptual and methodological framework for exploring and explaining pattern in presence-absence data. Oikos 120, 1625–1638. doi: 10.1111/j.1600-0706.2011.19451.x
Redfield, A. C. (1934). On The Proportions of Organic Derivations in Sea Water and Their Relation To The Composition of Plankton. Liverpool: University Press of Liverpool.
Rochelle-Newall, E. J., Chu, V. T., Pringault, O., Amouroux, D., Arfi, R., Bettarel, Y., et al. (2011). Phytoplankton distribution and productivity in a highly turbid, tropical coastal system (bach dang estuary, vietnam). Mar. Pollut. Bull. 62, 2317–2329. doi: 10.1016/j.marpolbul.2011.08.044
Schoor, A., Selig, U., Geiß-Brunschweiger, U., Schaible, R., Schumann, R., Schubert, B., et al. (2008). Phytoplankton diversity and photosynthetic acclimation along a longitudinal transect through a shallow estuary in summer. Mar. Ecol. Prog. Ser. 364, 31–46. doi: 10.3354/meps07452
Schulhof, M. A., Shurin, J. B., Declerck, S. A. J., and Van de Waal, D. B. (2019). Phytoplankton growth and stoichiometric responses to warming, nutrient addition and grazing depend on lake productivity and cell size. Glob. Chang Biol. 25, 2751–2762. doi: 10.1111/gcb.14660
Socolar, J. B., Gilroy, J. J., Kunin, W. E., and Edwards, D. P. (2016). Sparse data necessitate explicit treatment of beta-diversity: a reply to bush. Trends Ecol. Evol. 31, 338–339. doi: 10.1016/j.tree.2016.02.019
Srichandan, S., Baliarsingh, S. K., Prakash, S., Lotliker, A. A., Parida, C., and Sahu, K. C. (2019). Seasonal dynamics of phytoplankton in response to environmental variables in contrasting coastal ecosystems. Environ. Sci. Pollut. Res. 26, 12025–12041. doi: 10.1007/s11356-019-04569-5
Stefanidou, N., Katsiapi, M., Tsianis, D., Demertzioglou, M., Michaloudi, E., and Moustaka-Gouni, M. (2020). Patterns in alpha and beta phytoplankton diversity along a conductivity gradient in coastal mediterranean lagoons. Diversity 12:38. doi: 10.3390/d12010038
Thrane, J. E., Hessen, D. O., and Andersen, T. (2016). The impact of irradiance on optimal and cellular nitrogen to phosphorus ratios in phytoplankton. Ecol. Lett. 19, 880–888. doi: 10.1111/ele.12623
Trisos, C. H., Merow, C., and Pigot, A. L. (2020). The projected timing of abrupt ecological disruption from climate change. Nature 580, 1–6. doi: 10.1038/s41586-020-2189-9
Wallace, R. B., Baumann, H., Grear, J. S., Aller, R. C., and Gobler, C. J. (2014). Coastal ocean acidification: the other eutrophication problem. Estuar. Coast. Shelf Sci. 148, 1–13. doi: 10.1016/j.ecss.2014.05.027
Wang, H., Zhao, D., Chen, L., Giesy, J. P., Zhang, W., Yuan, C., et al. (2020). Light, but not nutrients, drives seasonal congruence of taxonomic and functional diversity of phytoplankton in a eutrophic highland lake in China. Front. Plant Sci. 11:179. doi: 10.3389/fpls.2020.00179
Wang, J., Bouwman, A. F., Liu, X., Beusen, A. H. W., Van Dingenen, R., Dentener, F., et al. (2021). Harmful algal blooms in chinese coastal waters will persist due to perturbed nutrient ratios. Environ. Sci. Technol. Lett. 8, 276–284. doi: 10.1021/acs.estlett.1c00012
Weber, T. S., and Deutsch, C. (2010). Ocean nutrient ratios governed by plankton biogeography. Nature 467, 550–554. doi: 10.1038/nature09403
Whittaker, R. H. (1960). Vegetation of the siskiyou mountains. Oregon California. Ecol. Monogr. 30, 279–338. doi: 10.2307/1948435
Williams, P. H. (1996). Mapping variations in the strength and breadth of biogeographic transition zones using species turnover. Proc. R. Soc. Lond. B. 263, 579–588. doi: 10.2307/50680
Wu, F., Yang, X., and Yang, J. (2010). Additive diversity partitioning as a guide to regional montane reserve design in Asia: an example from yunnan province, China. Divers. Distrib. 16, 1022–1033. doi: 10.1111/j.1472-4642.2010.00710.x
Wu, G., Cao, W., Huang, Z., Kao, C. M., Chang, C., Chiang, P., et al. (2017). Decadal changes in nutrient fluxes and environmental effects in the jiulong river estuary. Mar. Pollut. Bull. 124, 871–877. doi: 10.1016/j.marpolbul.2017.01.071
Wurtsbaugh, W. A., Paerl, H. W., and Dodds, W. K. (2019). Nutrients, eutrophication and harmful algal blooms along the freshwater to marine continuum. WIREs. Water 6:e1373. doi: 10.1002/wat2.1373
Xu, H., Paerl, H. W., Qin, B., Zhu, G., Hall, N. S., and Wu, Y. (2014). Determining critical nutrient thresholds needed to control harmful cyanobacterial blooms in eutrophic lake taihu, China. Environ. Sci. Technol. 49, 1051–1059. doi: 10.1021/es503744q
Yang, Y., Hu, R., Lin, Q., Hou, J., Liu, Y., Han, B., et al. (2017). Spatial structure and β-diversity of phytoplankton in tibetan plateau lakes: nestedness or replacement? Hydrobiologia. 808, 301–314. doi: 10.1007/s10750-017-3433-7
Yin, K., Qian, P., Wu, M. C. S., Chen, J. C., Huang, L., Song, X., et al. (2001). Shift from P to N limitation of phytoplankton growth across the pearl river estuarine plume during summer. Mar. Ecol. Prog. Ser. 221, 17–28. doi: 10.3354/meps221017
Yu, X., Liu, Z., Ma, Z., and Chen, B. (2012). Jiulong Jianghekou Shengtai Huanjing Zhuangkuang Yu Shengtai Xitong Guanli. Beijing: Ocean Press.
Zhang, W., Sun, J., Nie, H., Jiang, G., and Tao, J. (2015). Seasonal and spatial variations of nutrient and the response of phytoplankton in PRE and adjacent sea areas. Acta Ecol. Sinica. 35, 169–179. doi: 10.5846/stxb201308262158
Zhao, D., Zhang, F., Wang, H., Liu, F., and Suo, A. (2010). Driving forces and management strategies for estuaries in northern China. Front. Earth Sci. 4:51–58. doi: 10.1007/s11707-010-0004-x
Keywords: phytoplankton, diversity pattern, nutrient ratio, nutrient, driving factors
Citation: Ge F, Ma Z, Chen B, Wang Y, Lu X, An S, Zhang D, Zhang W, Yu W, Han W, Yu X, Liu Z and Kuang F (2022) Phytoplankton Species Diversity Patterns and Associated Driving Factors in China’s Jiulong River Estuary: Roles That Nutrients and Nutrient Ratios Play. Front. Mar. Sci. 9:829285. doi: 10.3389/fmars.2022.829285
Received: 05 December 2021; Accepted: 02 February 2022;
Published: 08 March 2022.
Edited by:
Meilin Wu, South China Sea Institute of Oceanology (CAS), ChinaReviewed by:
Mi Sun Yun, Tianjin University of Science & Technology, ChinaJianfeng Feng, Nankai University, China
Copyright © 2022 Ge, Ma, Chen, Wang, Lu, An, Zhang, Zhang, Yu, Han, Yu, Liu and Kuang. This is an open-access article distributed under the terms of the Creative Commons Attribution License (CC BY). The use, distribution or reproduction in other forums is permitted, provided the original author(s) and the copyright owner(s) are credited and that the original publication in this journal is cited, in accordance with accepted academic practice. No use, distribution or reproduction is permitted which does not comply with these terms.
*Correspondence: Weiwei Yu, eXV3ZWl3ZWlAdGlvLm9yZy5jbg==; Wenxuan Han, aGFud2VueHVhbkBjYXUuZWR1LmNu