 Sebastian Neun
 Nils Hendrik Hintz
 Matthias Schröder2
 Maren Striebel
- 1Institute for Chemistry and Biology of the Marine Environment (ICBM), Carl von Ossietzky University of Oldenburg, Wilhelmshaven, Germany
- 2Institute for Chemistry and Biology of the Marine Environment (ICBM), Carl von Ossietzky University of Oldenburg, Oldenburg, Germany
The natural environment of phytoplankton is variable in manifold ways. Light, as essential resource for photosynthetic phytoplankton, fluctuates in its intensity (quantity) as well as spectrum (quality) over great temporal scales in aquatic ecosystems. To elucidate the significance of temporal heterogeneity in available light spectrum for phytoplankton, we analyzed the growth of four marine North Sea species (chlorophyte Tetraselmis sp., cryptophyte Rhodomonas salina, cyanobacteria Pseudanabaena sp., raphidophyte Fibrocapsa japonica), in monoculture as well as the dynamics of these species in pairwise competition experiments under blue and green light. These species were chosen as they differ in their absorption of light, the colors were chosen to contrast the absorption by chlorophylls (blue), carotenoids (partially green) and phycobiliproteins (green). Light colors were either supplied constantly or along a gradient of fluctuation frequencies (hourly to weekly alternation) between blue and green but always with the same photon flux density. When constantly supplied (no change in color), the color of light led to significant differences in growth rates and carrying capacities of the species, with Pseudanabaena sp. being the only one profiting from green light. Under alternating light color, the maximum growth rate of R. salina was higher with faster light color fluctuations, but lower for Pseudanabaena sp. and did not show significant trends for F. japonica and Tetraselmis sp. Accordingly, competition was significantly affected by the light color treatments, under constant as well as fluctuating supply conditions. However, we did not detect considerable changes in competitive outcomes between fluctuating light colors vs. constant light color supply. As the underwater light in natural ecosystems is rather variable than constant, our results of fluctuations within the light spectrum highlight their frequency-dependent effects on growth and competition. While fluctuating light colors affect the growth and capacity of species, our tested fluctuations did not have major effects on species competition.
Introduction
As primary producers, phytoplankton considerably affect processes like the cycling of elements (Falkowski et al., 1998) and control the food webs by limiting the growth of nearly all higher trophic levels (e.g., Falkowski, 2012). Aquatic primary production strongly depends on the availability of light and nutrients (Falkowski, 1994; Field et al., 1998; Elser et al., 2007). In water, light intensity is attenuated exponentially with depth due to absorption and scattering processes by water molecules, particulate and dissolved organic matter (Stomp et al., 2007a; Kirk, 2011). Moreover, the attenuation of light is wavelength-dependent, based on the optical properties of water and creates a vertical gradient in underwater light colors. Thus, in clear water bodies like the open oceans, the light absorption by water molecules themselves shift the watercolor bluish (Stomp et al., 2007a; Kirk, 2011). Thereupon, in coastal seas and lakes high loads of organic matter can lead to a dominance of brownish wavelengths and the light absorption by phytoplankton can color the water more greenish (Morel, 1980; Stomp et al., 2007a; Kirk, 2011). Characterized by its intensity, i.e., quantity, and wavelengths, i.e., light quality, the variability in light influences not only the productivity but also the distribution (horizontally as well as vertically) and diversity of phytoplankton (Wall and Briand, 1979; Falkowski, 1994; Holtrop et al., 2021).
Furthermore, natural environments are fluctuating at multiple scales and affect the living organisms in manifold ways (Bernhardt et al., 2020), with particularly high fluctuations in light. The fastest light fluctuations underwater are those induced by surface ripples as they briefly focus and diffuse the incident light, similar to a lens, within seconds (Dera and Gordon, 1968; Walsh and Legendre, 1983; Falkowski, 1984). Slower causes of light fluctuations are a changing cloud cover in the range of minutes and diurnal changes (Walsh and Legendre, 1983; Ferris and Christian, 1991). Aquatic organisms further encounter light intensity fluctuations induced by semi-diurnal tidal changes and phytoplankton species are subjected to light variations, both quantitatively and qualitatively, due to vertical mixing in the timespan of minutes to hours (Denman and Gargett, 1983; Walsh and Legendre, 1983; Falkowski, 1984). Moreover, with future predictions of altered water temperatures, wind conditions and precipitation pattern the light availability and light fluctuation for phytoplankton is expected to change as well due to climate change (Saros et al., 2012; Sydeman et al., 2014; Somavilla et al., 2017; Dutkiewicz et al., 2019).
With having pigments of different properties and quantity, phytoplankton possess structures to absorb the prevailing light as efficiently as possible, even under sub-optimal conditions. These pigments harvest the light photons of the photosynthetic active radiation (PAR) according to their absorption characteristics and transfer their energy to the light reaction of photosynthesis (Falkowski and Raven, 2007; Roy et al., 2011).
The chlorophylls have two absorption peaks, one in the blue of 400–500 nm and one in the red of 600–700 nm of the light spectrum, but almost no absorption of green light between 500 and 600 nm (Kirk, 2011; Croce and van Amerongen, 2014). Carotenoids, however, absorb in the short-wavelength region between 300 and 500 nm and thus, contrary to the chlorophylls, to a small extent in the green part (Kirk, 2011). Phycobiliproteins occur in Rhodophyta, Cryptophyta, and Cyanophyta and are, except a few carotenoids, the only pigments absorbing the PAR in the “green gap” at 500–600 nm (Croce and van Amerongen, 2014).
Because of their different light absorption characteristics, species-specific pigment compositions and thus light-harvesting strategies may allow the coexistence of phytoplankton species along the vertical light gradient (Wall and Briand, 1979; Stomp et al., 2007b; Holtrop et al., 2021). Indeed, several studies showed that for calm conditions the vertical distribution of phytoplankton species within the water column can be linked to the available light quality (Bidigare et al., 1990; Stomp et al., 2007b; Hickman et al., 2009), indicating that the outcome of phytoplankton competition for light is not determined solely by the given light intensity but also by the availability of different wavelengths.
This adds a complete additional dimension to the high diversity in morphology such as size or motility and biochemistry such as storage products or nutrient uptake mechanisms of phytoplankton as a potential explanation of Hutchinson’s “paradox of the plankton” (Hutchinson, 1961). An underexplored mechanism for the high diversity in phytoplankton might be this twofold multi-dimensionality, both of the variable supply by light fluctuations and the use, i.e., light acquisition traits. Hutchinson supposed that in nature the assumed steady-state never occurs as environmental changes are faster than the process of competitive exclusion (Hutchinson, 1961). Thus, temporal variability in an environment may be an important aspect preventing competitive exclusion (Richerson et al., 1970; Tilman et al., 1982). Although there is great evidence that varying light conditions do support the biodiversity of phytoplankton (Litchman, 1998, 2003; Flöder et al., 2002; Flöder and Burns, 2005), evidence for a linkage between fluctuating light spectrum and phytoplankton competition is rare. Stomp et al. (2008) showed that light color fluctuations are an important factor for the coexistence of phytoplankton species, especially those with periods that are comparable with weather-induced light fluctuations. For fluctuations in light color, no coexistence was observed but species with a flexible phenotype had a clear advantage under fluctuating light colors. However, competition of phytoplankton, especially eukaryotic species, under fluctuating light color is still barely examined.
Luimstra et al. (2020) showed that the photosynthetic efficiency is also a function of light color. They studied competition between a green alga and a cyanobacterium, both harvesting different ranges of the light’s spectrum, under mixtures of blue and red light. As long as blue light was available, the green alga competitively excluded the cyanobacterium and the cyanobacterium won competition only under 100% red light so that coexistence was never observed, but the color of light determined the competition outcome. Thus, coexistence under white light cannot be expected in general although two species absorb in two different regions of the light spectrum (Luimstra et al., 2020; Tan et al., 2020).
The impact of temporal variations in light quality is a remaining question but may be an important contribution explaining the coexistence of phytoplankton species. In aquatic environments with intense vertical mixing, calm conditions are the exception rather than the rule. Therefore, we conducted a laboratory experiment with four marine phytoplankton species, showing different light-absorption and investigated their growth under two different light colors, blue and green in monoculture as well as in two-species mixtures. Light was supplied constantly as well as fluctuating with different frequencies to test the effect of fluctuating light color on growth and competition of the species. We tested the following hypotheses:
H1: The performance of phytoplankton species depends on species-specific light-harvesting strategies under blue and green light conditions. That is, a higher performance is expected for species possessing a complementary pigment composition and thus can use the light spectrum provided more efficiently as compared to other species.
H2: Species showing differences in the performance under blue and green light will be negatively affected by light fluctuations, both in monoculture and mixed culture, as the usable light is reduced on average over time. However, outcomes will depend on the frequency of light fluctuations. The negative effect should disappear for high frequencies as short periods of unsuitable light can be outlasted.
H3: In general, if two species compete for the same light spectrum, the species with the higher growth rate will dominate. If two species use blue and green light differently, resulting in dissimilar performances, they can coexist under blue-green light.
Materials and Methods
Phytoplankton
Species were selected according to their light-harvesting properties by means of light absorption. The chlorophyte Tetraselmis sp. (in following abbreviated as Tet) and the raphidophyte Fibrocapsa japonica (Fib) were chosen and suggested as species, potentially favoring blue light. As potentially green-light using species, the cryptophyte Rhodomonas salina (Rho) and the cyanobacterium Pseudanabaena sp. (Pse) were selected, both known to contain phycoerythrin. Strains of the latter species are further known for being able to adjust their cellular pigment ratio of phycoerythrin:phycocyanin with light quality (Tandeau de Marsac, 1977; Bryant and Cohenbazire, 1981; Stomp et al., 2008). All phytoplankton species were originally isolated from the German bight in the North Sea. They were pre-cultivated in f/2 medium according to Guillard and Ryther (1962) and Guillard (1975) at 18°C and under the same white light with an intensity of about 30 μmol photons m–2 s–1 and a day:night cycle of 12:12 h.
Experimental Setup
For the experiment, cultures were grown in f/2 medium (Guillard and Ryther, 1962; Guillard, 1975) using transparent 24-well cell culture plates (Greiner Bio-One) in opaque boxes (Figure 1). The temperature was kept constant at 20°C. We applied constant light treatments with blue (CLB), green (CLG) and blue-green (CLBG) light, as well as five fluctuating light treatments (FL) with light fluctuating between blue and green light with the following frequencies (Figure 1): 1 h blue/1 h green: frequency = 12 day–1, 7 h blue/7 h green: frequency = 1.71 day–1, 1 d blue/1 d green: frequency = 0.5 day–1, 2 d blue/2 d green: frequency = 0.25 day–1, 7 d blue/7 d green: frequency = 0.07 day–1. All light treatments experienced a day:night cycle of 14:10 h that refers to light intensity. Day:night cycle of light intensity (14:10 h) and temperatures were monitored with temperature/light data loggers (HOBO Pendant MX2202, Onset). As it was not possible to randomize the plates’ wells within the setup, we used a maximal number of replicates (6 for each monoculture and 4 for each mixture, per box and respective treatment) which were placed across two well plates per box. Within the boxes, well plates were illuminated from below with small high-power light-emitting diodes (LEDs). Blue light was obtained from single-colored blue LEDs with a peak emission at 445 nm (Csspm1.14, OSRAM), overlapping greatly with the regarding chlorophyll peak. For green light, white LEDs (Highpower 1W 3,000–4,000°K, World Trading Net GmbH & Co. KG) were covered with a green light transmission foil (LEE Filter 088, LEE Filters Worldwide), resulting in a peak emission at approximately 575 nm. This matches with reported absorption values of phycoerythrin in Rho (545–565 nm, e.g., da Silva et al., 2009; Heidenreich and Richardson, 2020) and Pse (560–570 nm, e.g., Stomp et al., 2008; Acinas et al., 2009). Due to differences in total light output between the blue LEDs and the white LEDs with the light filter, the number of LEDs per box were adapted. By the uniformly distribution of LEDs, a sufficient distance to the well plates as well as reflective coating of the boxes’ walls and lids a homogeneous light distribution was ensured for all positions. The light output was measured as photon flux density (μmol photons m–2 s–1) with a spherical PAR-sensor (US-SQS/L Submersible Spherical Micro Quantum Sensor, Walz, with LI-250A, LI-COR), integrating the irradiance over the PAR range (400-700 nm). Photon flux density was set to 50 μmol photons m–2 s–1 in total for each light treatment, by adjusting the LEDs via constant current reduction (KSQ1000 V2.0, KT-Elektronik GmbH). This has the advantage of stepless adjusting without inducing high-frequent fluctuations (Schulze et al., 2017). The light fluctuations as well as the day:night cycle were programmed with a microcontroller (Arduino Nano, Arduino AG). Accurate timing was specified with a connected real-time clock (DS1307, LC Technology).
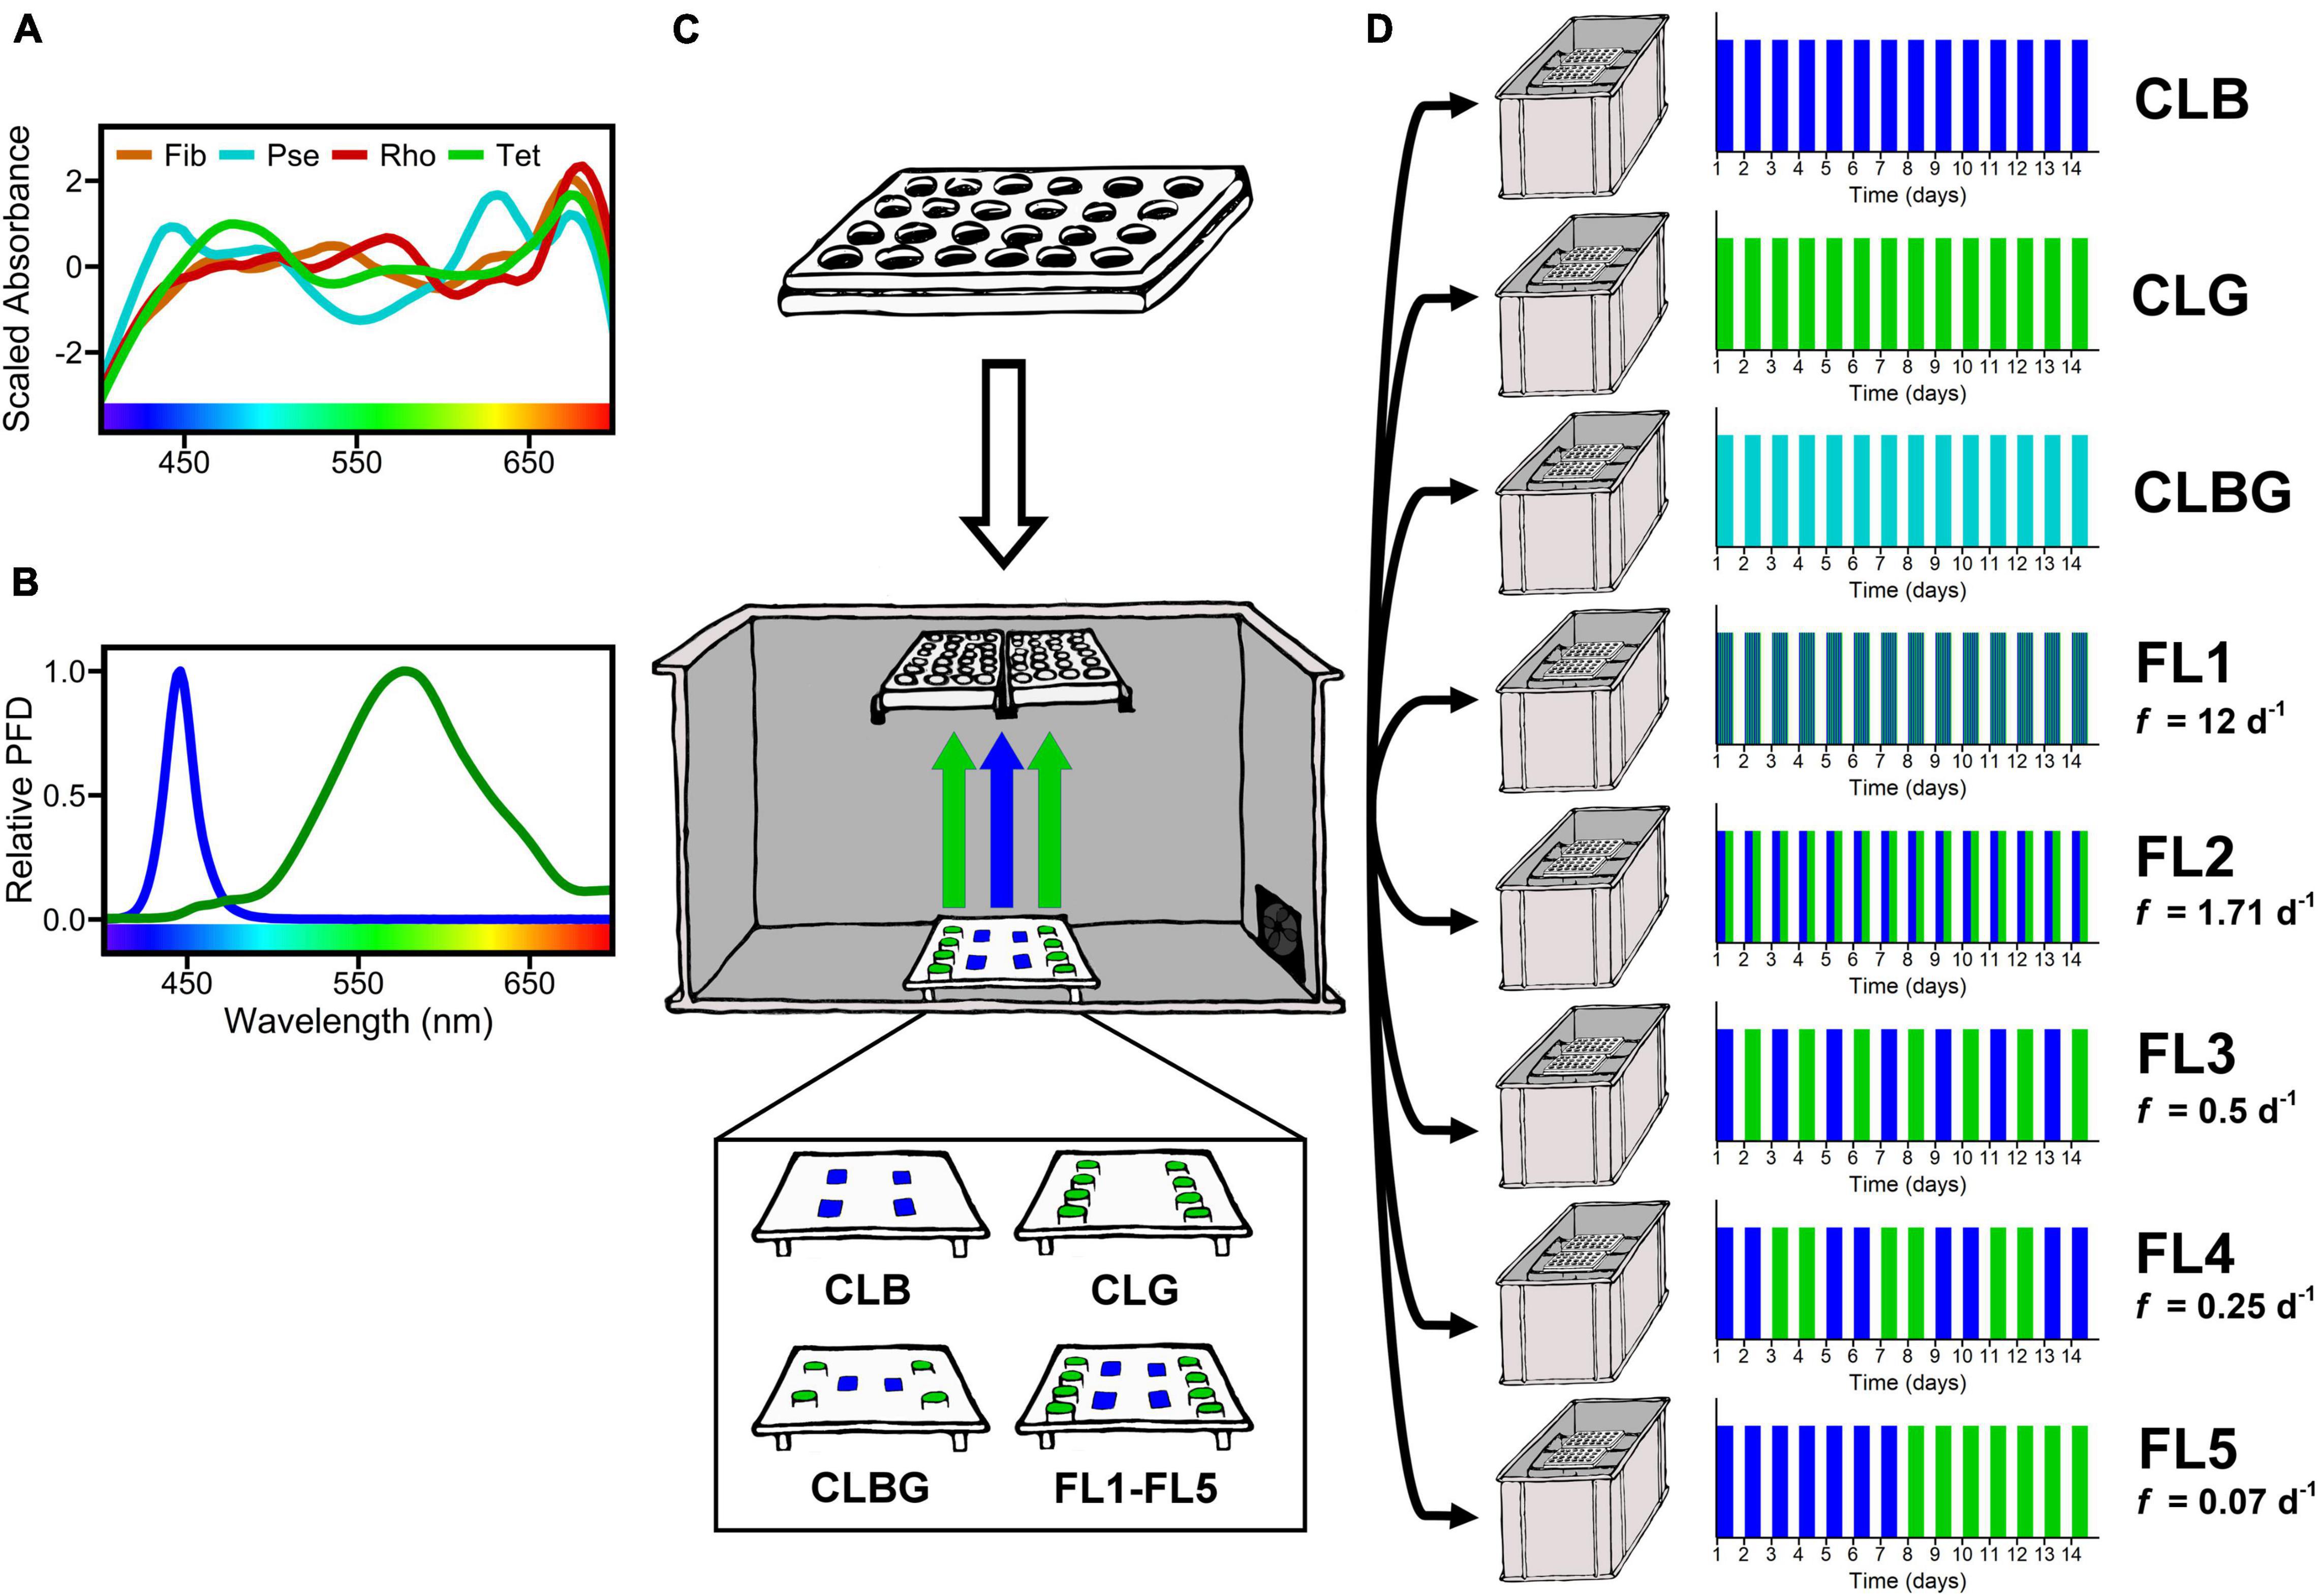
Figure 1. Scheme of experimental setup. (A) Species absorption spectra scaled by z-transformation and (B) the supplied light spectra in relative photon flux density (PFD). The supplied light was adjusted to 50 μmol photons m– 2 s– 1 integrated over the PAR range for each treatment. (C) Experimental setup by placing two culture microwell plates above the LED array in combinations according to the treatments. Uniformly distribution of LEDs, sufficient distance and a reflective coating of the boxes’ walls and lid ensured a homogenous light distribution for all positions. Temperature control was implied by the opening at the right side of the opaque box. (D) Treatments time schedule stating the fluctuation frequency (f) for an example duration of 14 days. Treatments were considered as “constant” (CLB, CLG, CLBG) if the applied spectrum did not alternate and “fluctuating” if the spectrum alternated (between blue and green) throughout the experiment. They were conducted in replicates of 6 for monocultures and 4 for pairwise species mixtures for each treatment and box, respectively.
Sampling and Measurements
The experiment lasted 16 days. Each well in the culture plates was filled with a total volume of 2 mL and all monocultures as well as mixed cultures were inoculated with the same biovolume concentration of 1.2*106 μm3 mL–1. Consequently, biovolume concentrations of the respective species in mixed culture were half of that in monoculture. Species-specific biovolume was estimated based on geometric shapes by measuring the size parameter of at least 20 randomly chosen cells according to Hillebrand et al. (1999) and Olenina et al. (2006).
Daily measurements included blank-subtracted optical density (OD450nm) (Supplementary Figure 1) as well as in vivo absorption spectra (300–805 nm, in steps of 1 nm, as absorbance per wavelength, see Supplementary Figure 3) using a microplate reader (Synergy H1, BioTek). Before measurements, culture plates were shaken gently to homogenize the cultures. Every 4 days 10% of the cultures were sampled and exchanged with fresh, sterile medium to compensate culture volume loss and avoid nutrient limitation. Samples were fixed with Lugol’s iodine solution and microscopically counted (DM IL inverted microscope, Leica) to monitor population dynamics and respective proportions in mixtures. Monocultures were not counted but checked for contaminations by other species.
Statistical Analysis
Based on daily OD450nm measurements, logistic growth curves were fitted per experimental unit to predict the parameters of maximum growth rate (rmax) and carrying capacity (K) (Eq. 1) of monocultures and mixed cultures with N0 as the OD450nm at the beginning and t the day of the experiment (Supplementary Figure 2).
Carrying capacities were converted from OD measurements into biovolume concentration (mm3 mL–1) based on dilution series and microscopic determinations to clarify differences between species. Linear regression models were fitted to test for a linear relationship for these calibrations for each monoculture. For two-species mixtures, linear relationships between the experimentally measured optical density values and counted cell concentrations were calculated. Analysis of variances (ANOVA) were conducted to test for significant treatment effects on rmax and K, including treatment and species as independent variables. Significant differences among treatments and species under constant light were tested using post-hoc tests (Tukey HSD test). For fluctuations (as frequency day–1) we estimated linear relationships between fluctuation frequency and rmax or K, respectively. A significant fit of the linear regression slope indicated whether the rmax or K were positively or negatively correlated to fluctuation frequency. A positive correlation indicated a higher rmax or K, respectively, with higher fluctuation frequency, i.e., the faster the light color fluctuated. ANOVA assumptions of normality and homoscedasticity were checked by Shapiro-Wilk-Test and Levene’s test, respectively. If necessary, log transformation was applied to fit the assumptions.
All statistical results were interpreted as significant for a significance level of α = 0.05 and all statistical analysis were performed with R version 4.0.2 (R Project for Statistical Computing, RRID:SCR_001905, R Core Team, 2020). Fitting of logistic growth curves and ANOVA was performed with the “stats” package (R Core Team, 2020). Levene’s test for homoscedasticity was performed with the “car” package (Fox and Sanford, 2019). All plots were done with the “ggplot2” package (Wickham, 2016).
Results
Monoculture Performance Under Constant Light—Growth and Carrying Capacity
Maximum growth rates (rmax) and carrying capacities (K) were significantly affected by the light treatments (Figure 2, significant treatment effect, Table 1) and showed species-specific responses (Figure 2, species and species * treatment effect, Table 1). In general, highest rmax were observed under blue light whereas green light resulted in species’ lowest rmax (Figure 2). Post-hoc tests revealed that phytoplankton rmax did not differ significantly between the blue and blue-green light treatments (Figure 2A and Table 1), however, rmax under green vs. blue light as well as rmax under green vs. blue-green were significantly different (Figure 2A and Table 1). K was overall highest affected by green light (Figure 2B, significant treatment effects and treatment comparison, Table 1) but did not differ between blue and blue-green light.
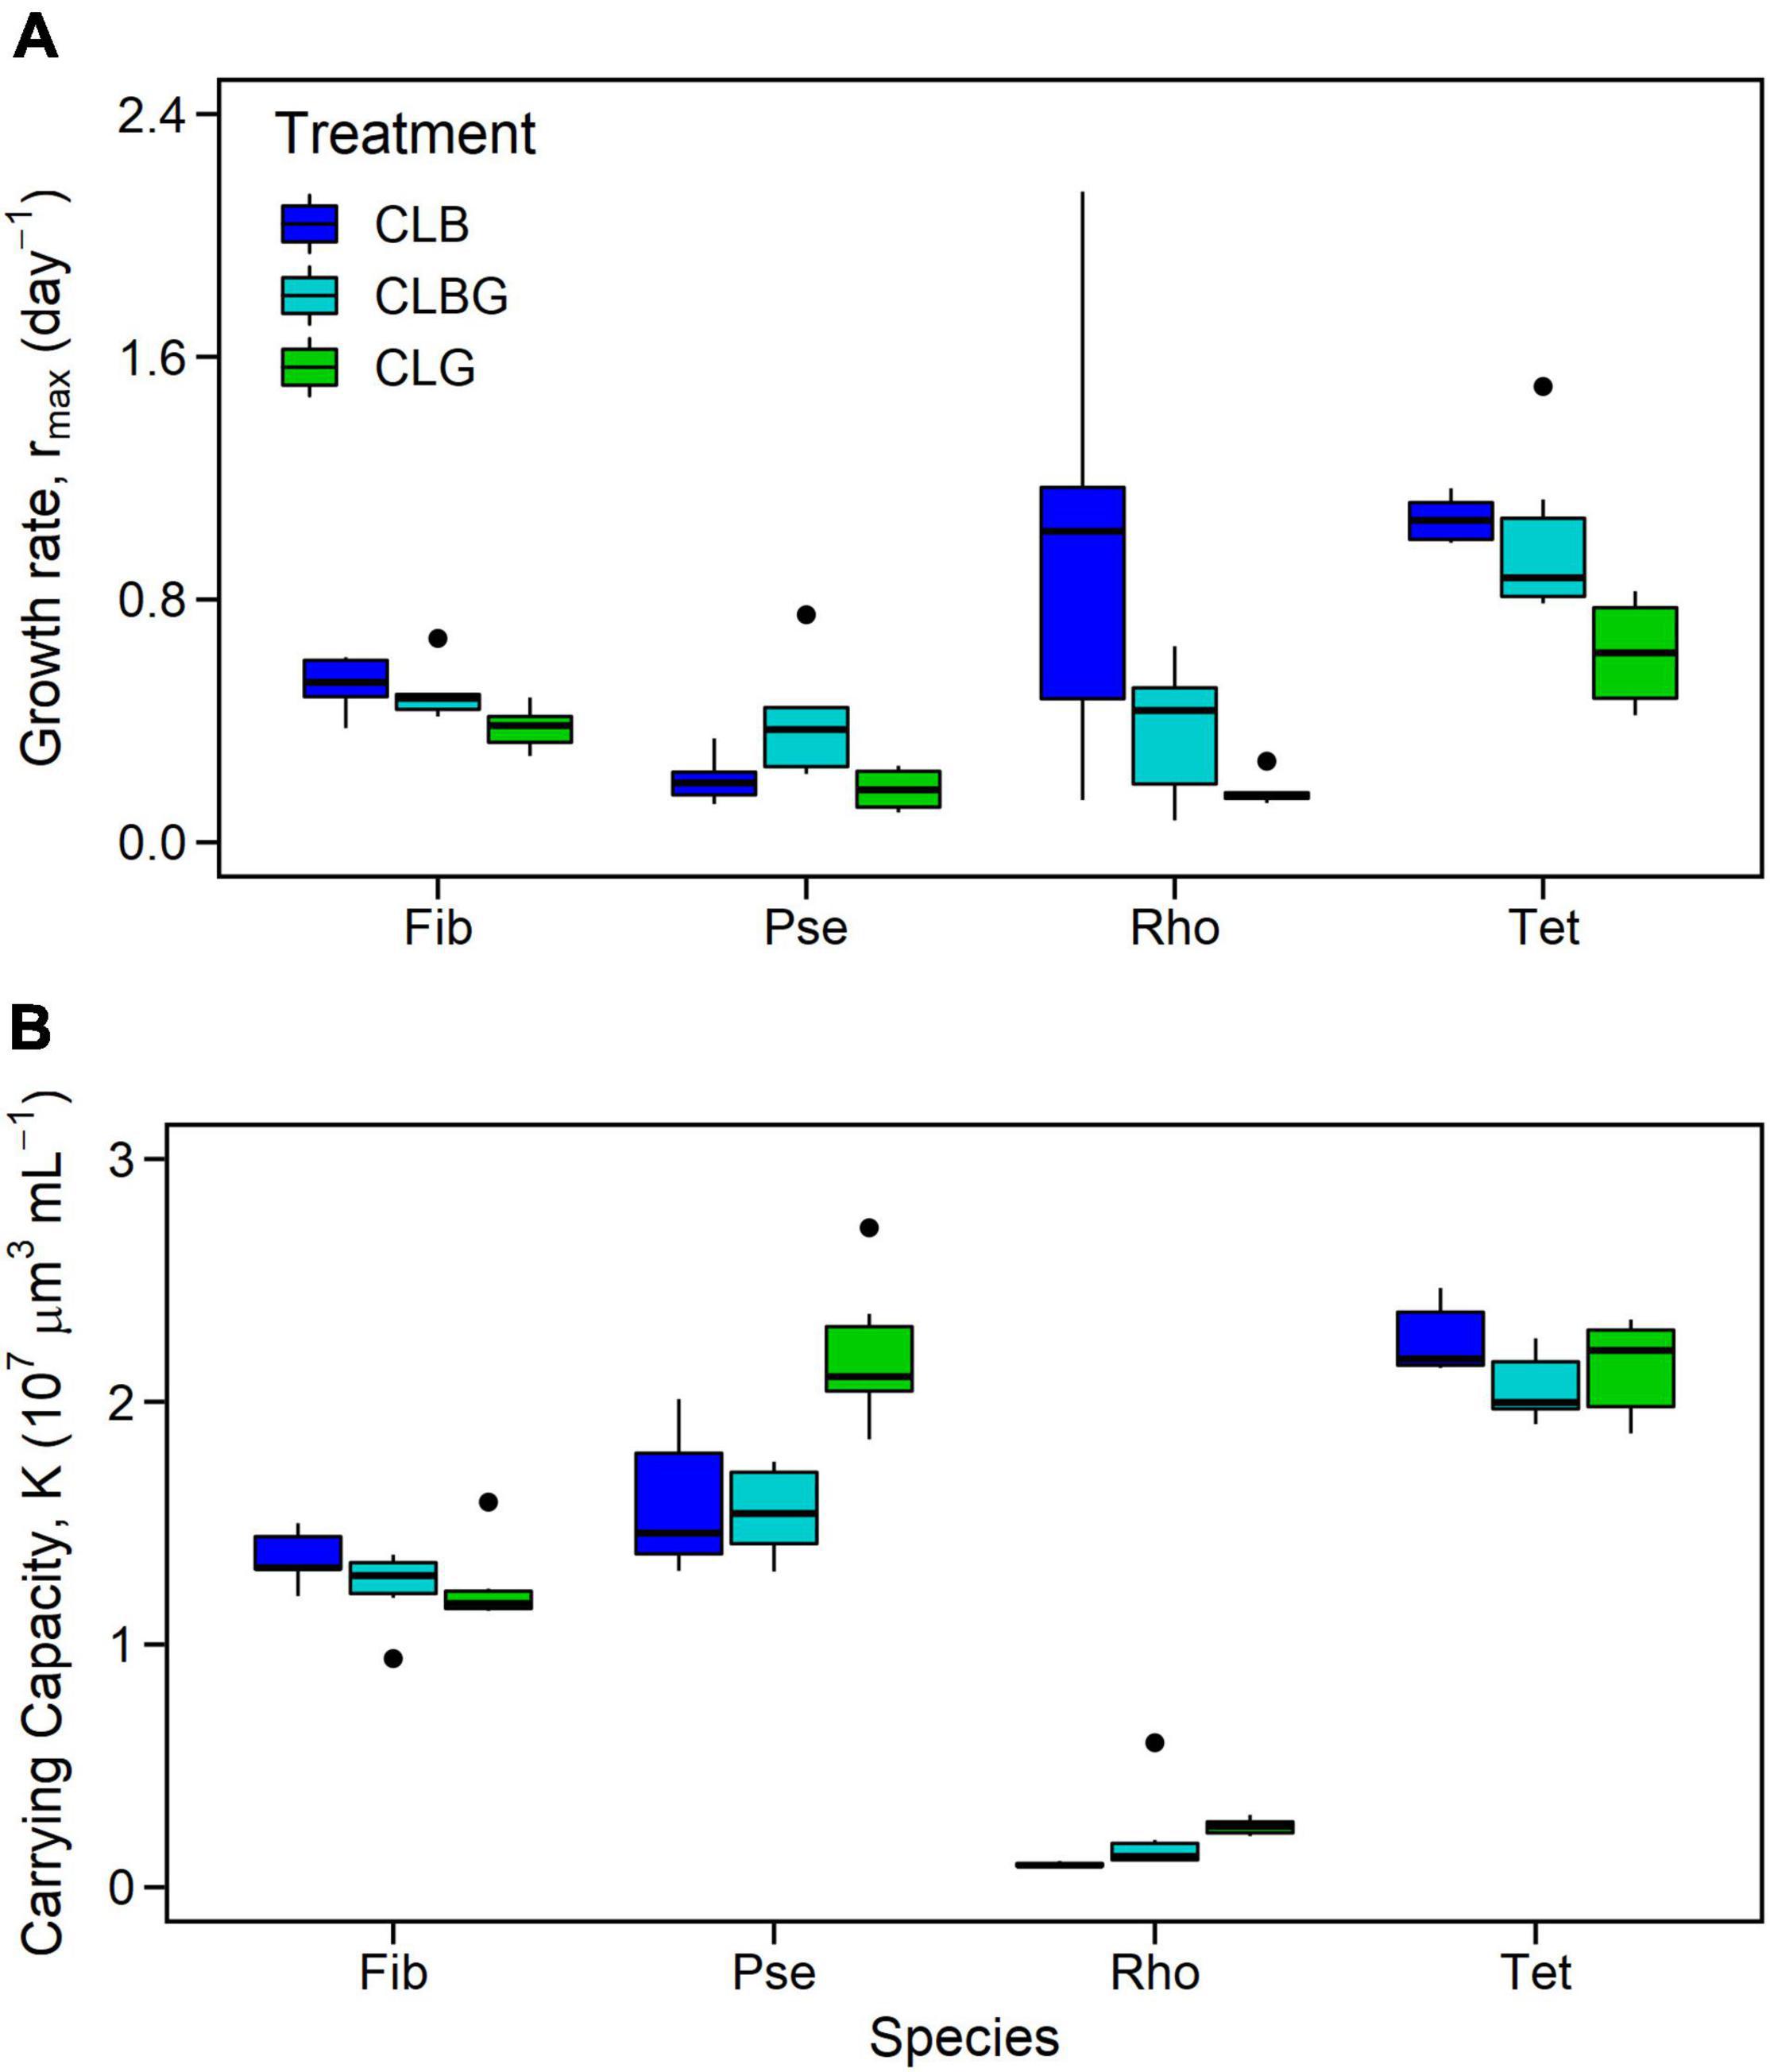
Figure 2. Maximum growth rate (A) and carrying capacity (B) for monocultures [Fibrocapsa japonica (Fib), Pseudanabaena sp. (Pse), Rhodomonas salina (Rho), and Tetraselmis sp. (Tet)] under constant light. Colors indicate constant light treatment (CLB, constant blue light; CLBG, constant blue-green light; CLG, constant green light).
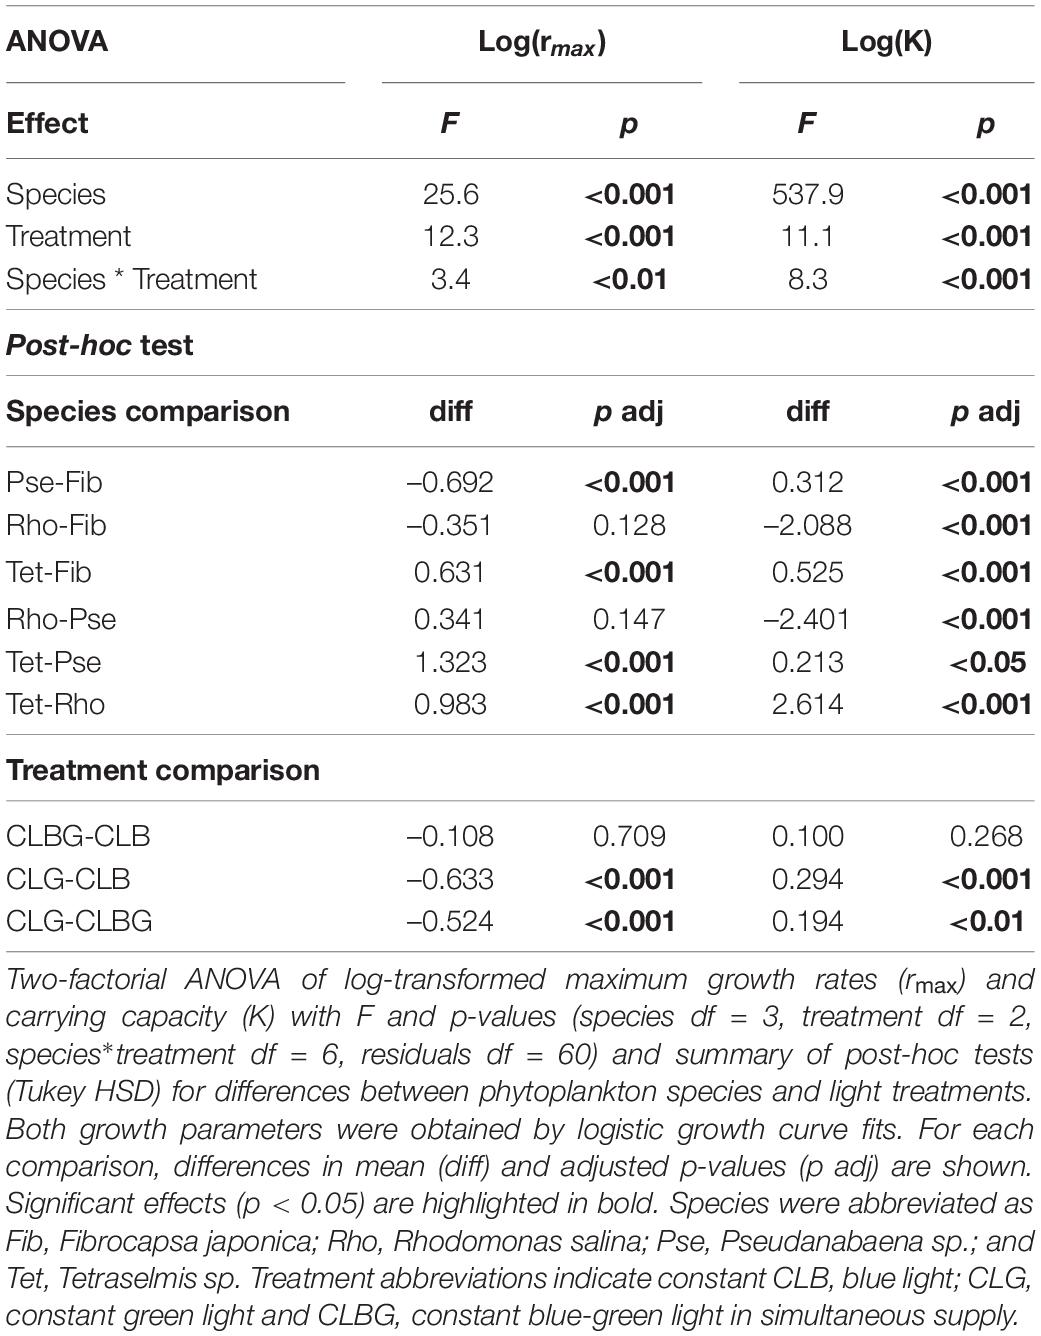
Table 1. Monocultures under constant light.
Species comparison showed that Tetraselmis sp. (Tet) had significantly higher rmax than all other species and Fibrocapsa japonica (Fib) significantly higher rmax than Pseudanabaena sp. (Pse), while the rmax did not significantly differ between the other species comparisons. In contrast, species K were overall species-specific, meaning significant differences for all species comparison were obtained (Table 1), with the highest K for Tet.
Monoculture Performance Under Fluctuating Light—Growth and Carrying Capacity
Frequency effects of light color fluctuation on rmax and K of phytoplankton monocultures depended on the species identity (Figures 3, 4 and Table 2, significant interactive effect of species * frequency). While rmax of Fib was not affected by light fluctuations and K only marginally positive affected (Figures 3A,E and Table 2) growth rates of Pse decreased with increasing fluctuation frequency whereas carrying capacity increased with fluctuation frequency (Figures 3B,F and Table 2). Maximum growth rates of Rhodomonas salina (Rho) increased with faster frequency of light fluctuation (Figure 3C and Table 2) while no significant effect of fluctuation frequency on K (although a decreasing trend) was observed (Figure 3G and Table 2). Maximum growth rates and K of Tet tended to increase with faster frequency of light fluctuation (Figures 3D,H and Table 2), however, as the lowest fluctuation frequency resulted in highest growth rate (first week of experiment exposed to blue light before switched to green) this trend was not significant (Figures 3D, 4A and Table 2).
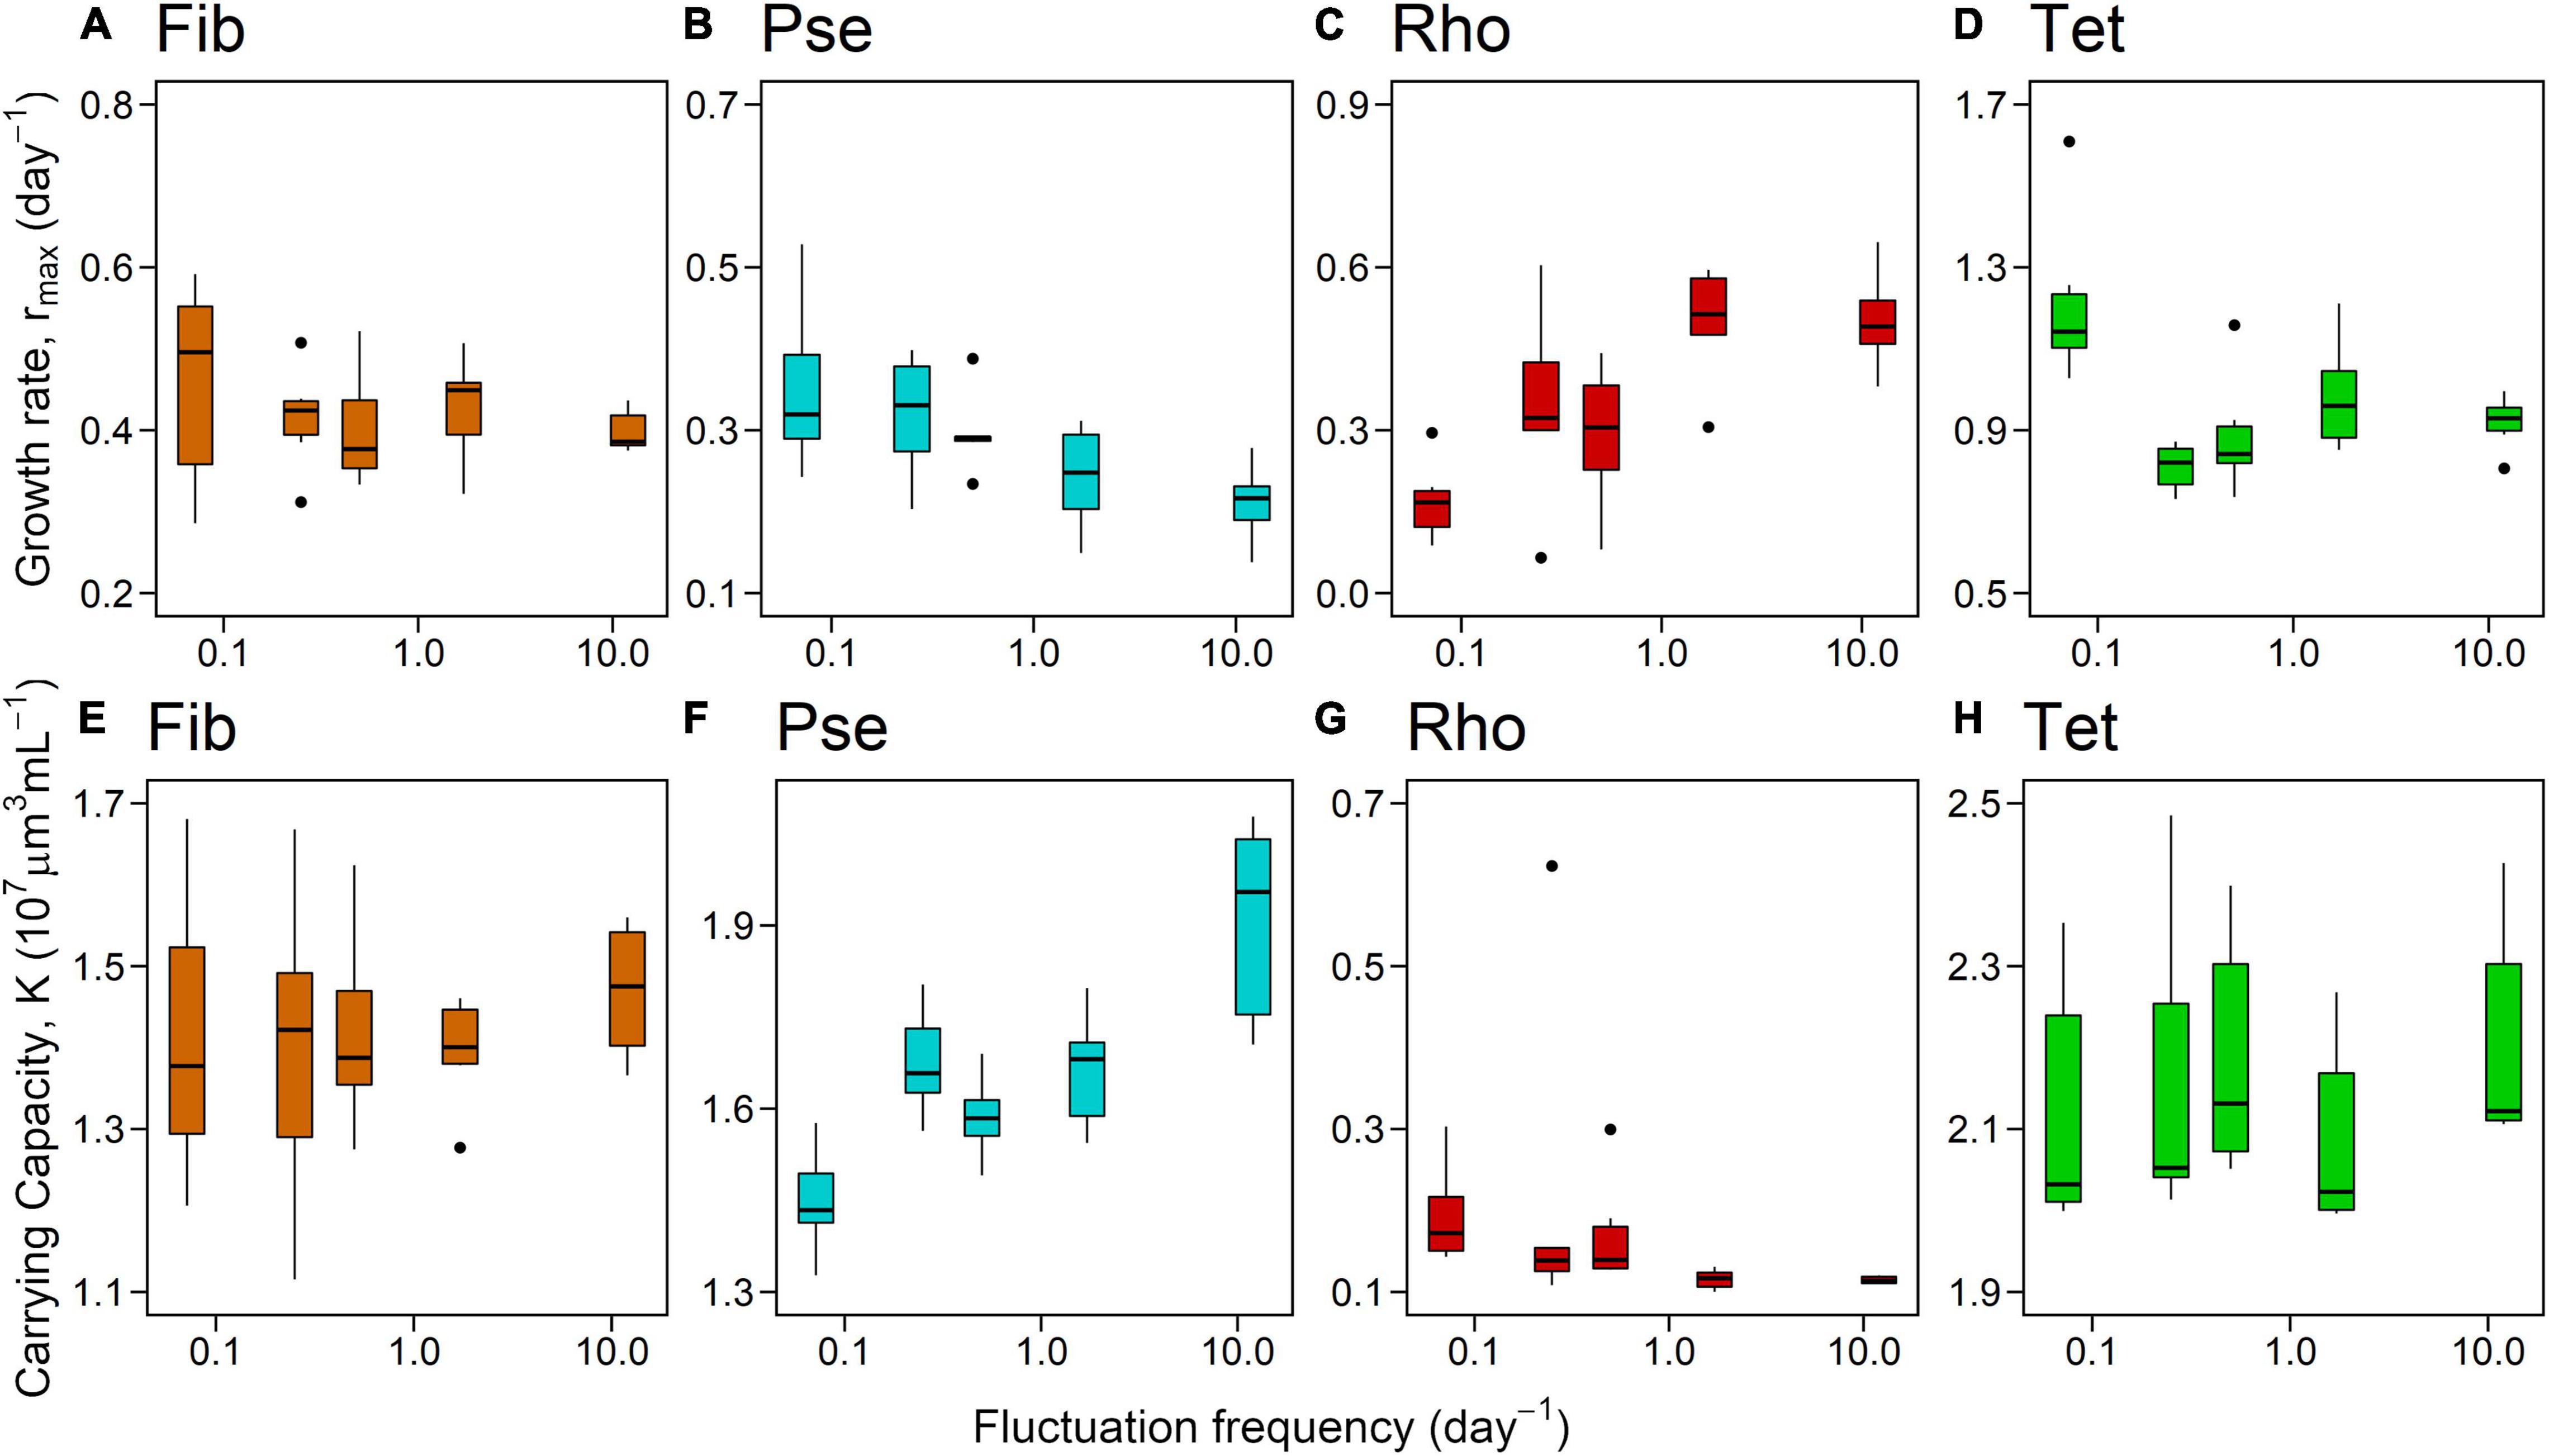
Figure 3. Maximum growth rate (A–D) and carrying capacity (E–H) for monocultures related to fluctuation frequency (displayed as fluctuation frequency per day on log-scale). (A): Fibrocapsa japonica (Fib), (B): Pseudanabaena sp. (Pse), (C): Rhodomonas salina (Rho), and (D): Tetraselmis sp. (Tet).
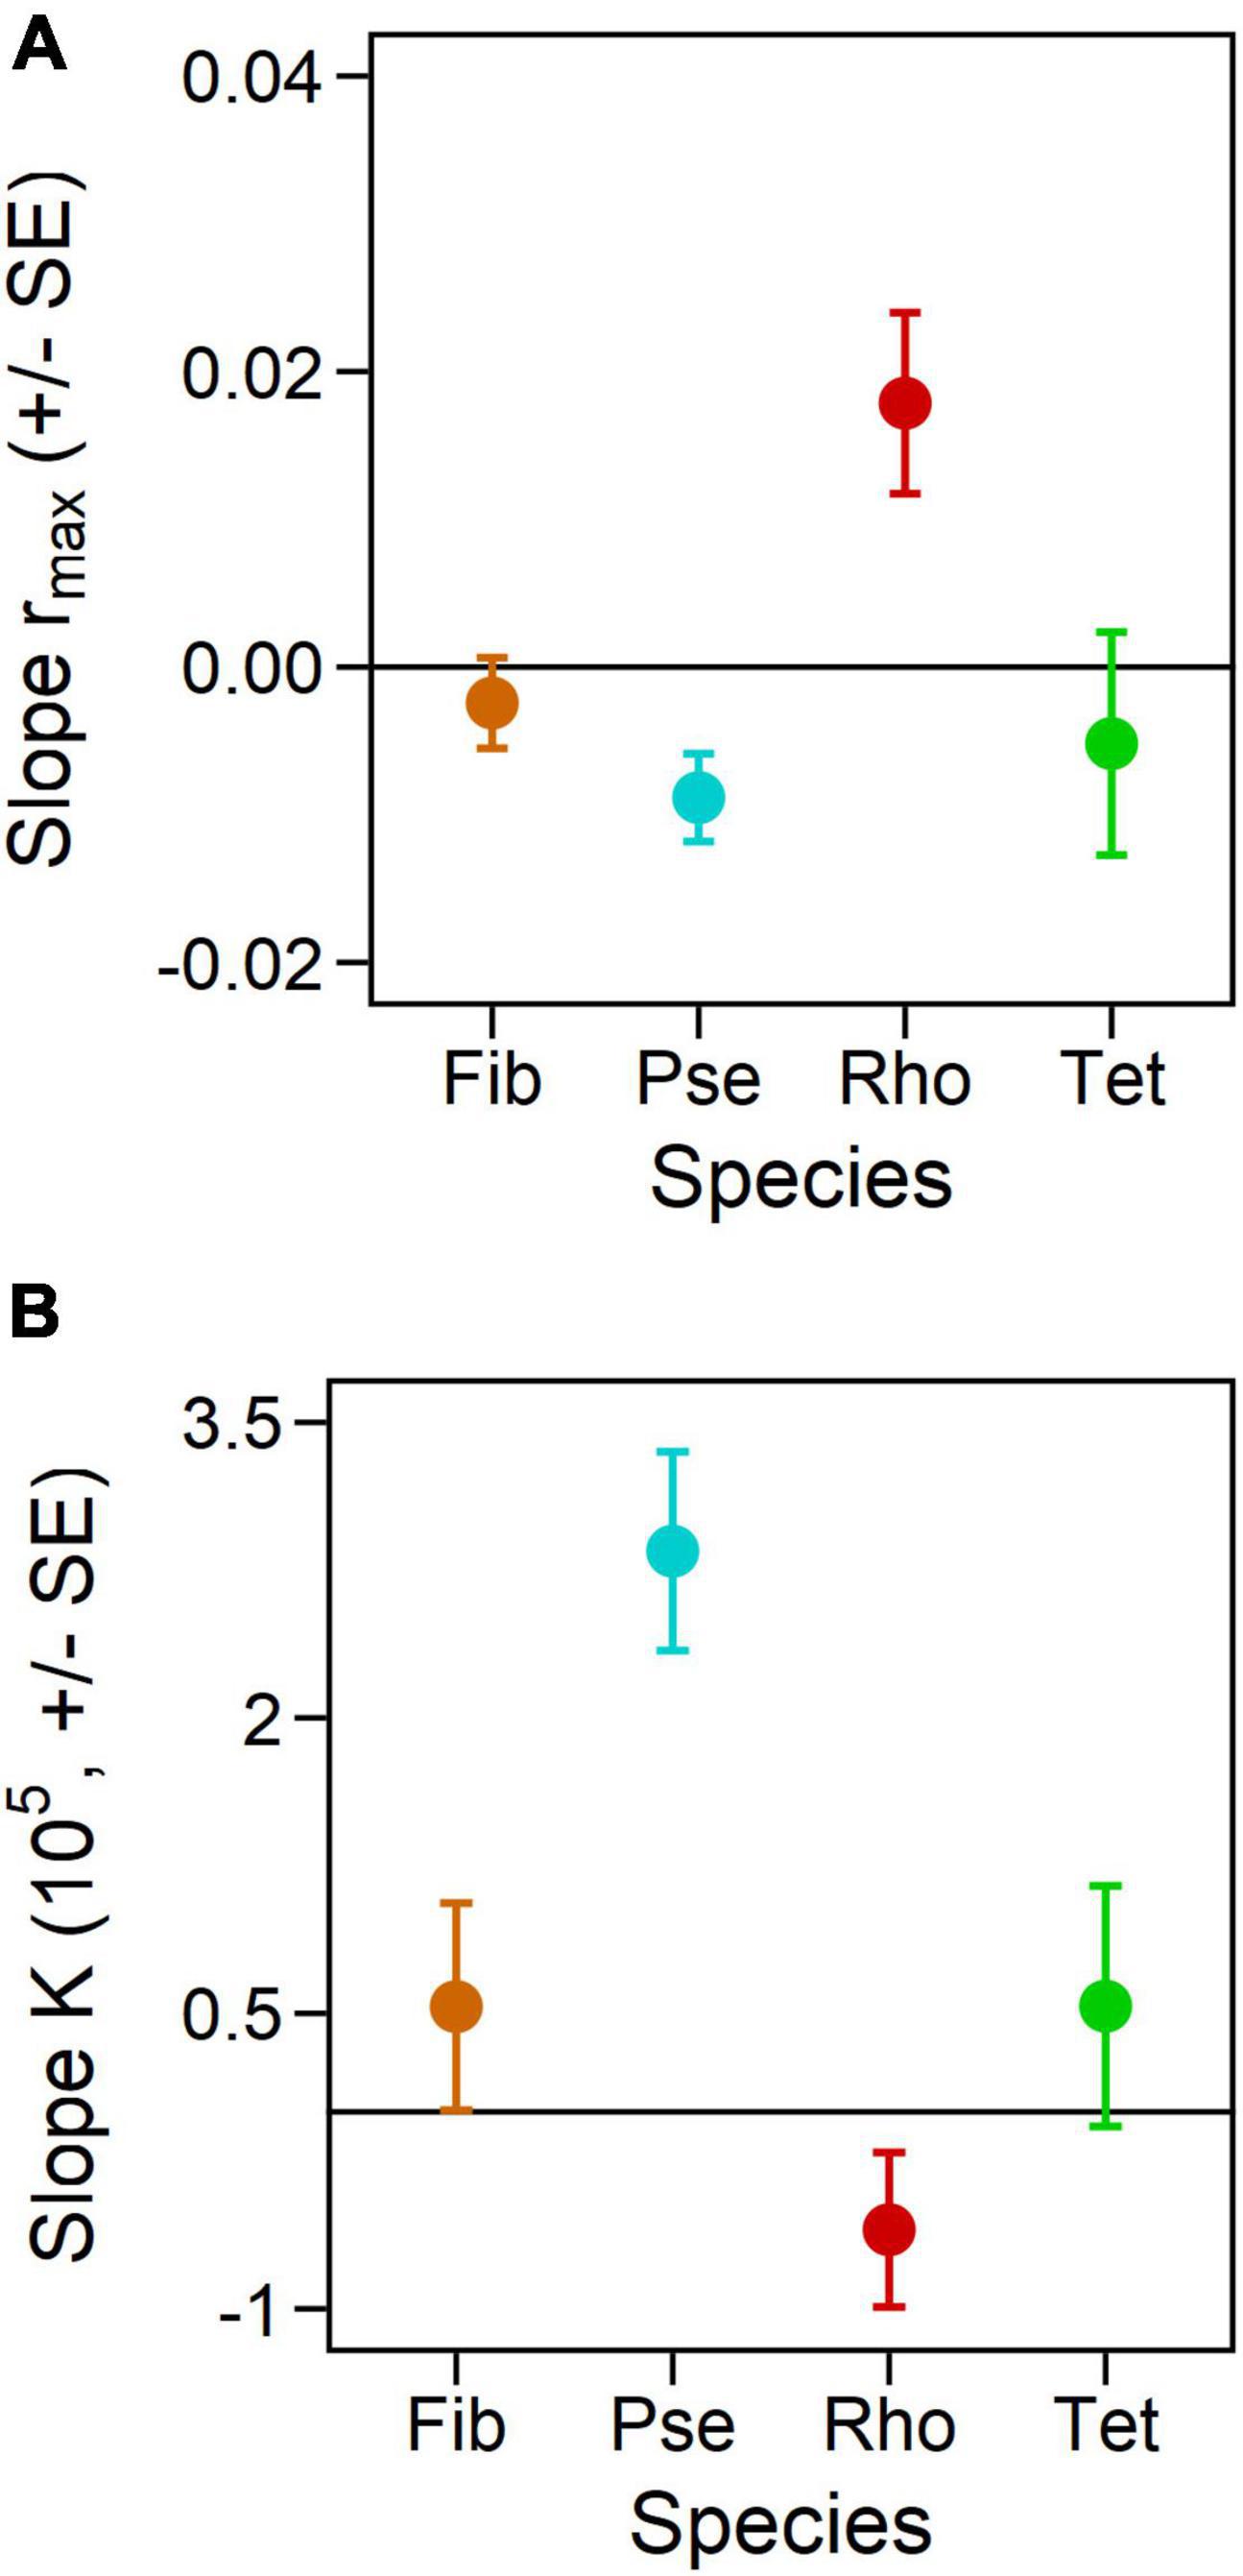
Figure 4. Slopes from the relations between fluctuation frequency and responses in maximum growth rates (A) and carrying capacities (B) of the monocultures, calculated based on linear regressions. A positive correlation indicates a higher rmax or K, respectively, with higher fluctuation frequency, i.e., the faster the light color fluctuated. Error bars represent standard error of calculated regression slopes.
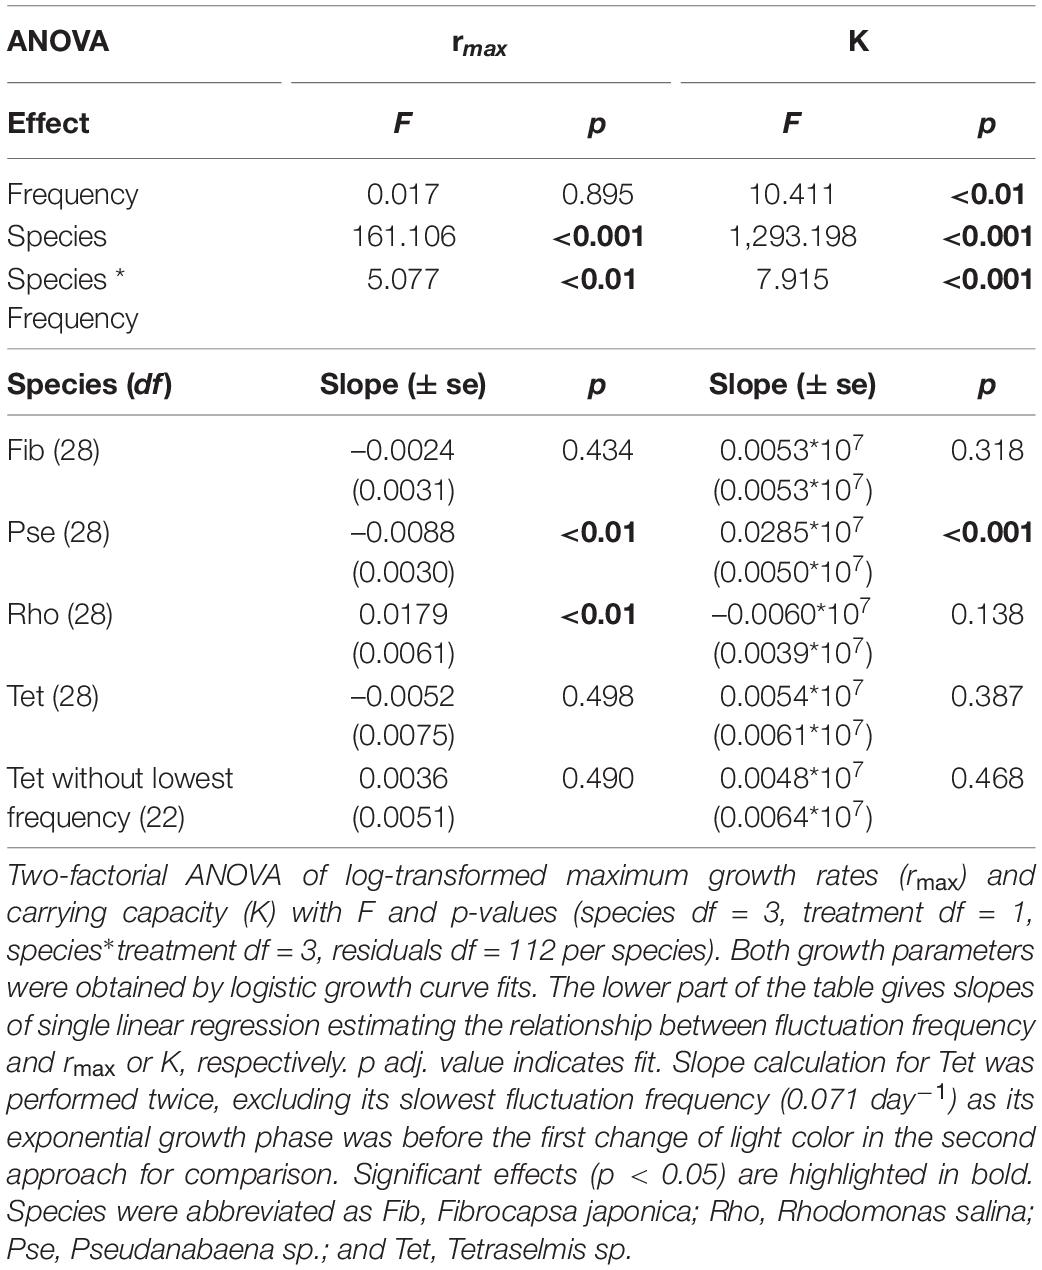
Table 2. Monocultures under fluctuating light.
Mixed Culture Performance Under Constant Light—Growth, Capacity and Species Proportion
Maximum growth rates as well as K of the two-species mixtures, as total response of both species together (Fib+Tet, Pse+Rho, Pse+Tet, and Rho+Tet), were significantly affected by light treatment and species mixture (Table 2), with highest rmax under blue light and lowest rmax under the green light treatment while K was significantly higher under green light compared to blue light (Figure 5, significant treatment effects and treatment comparison, Table 3).
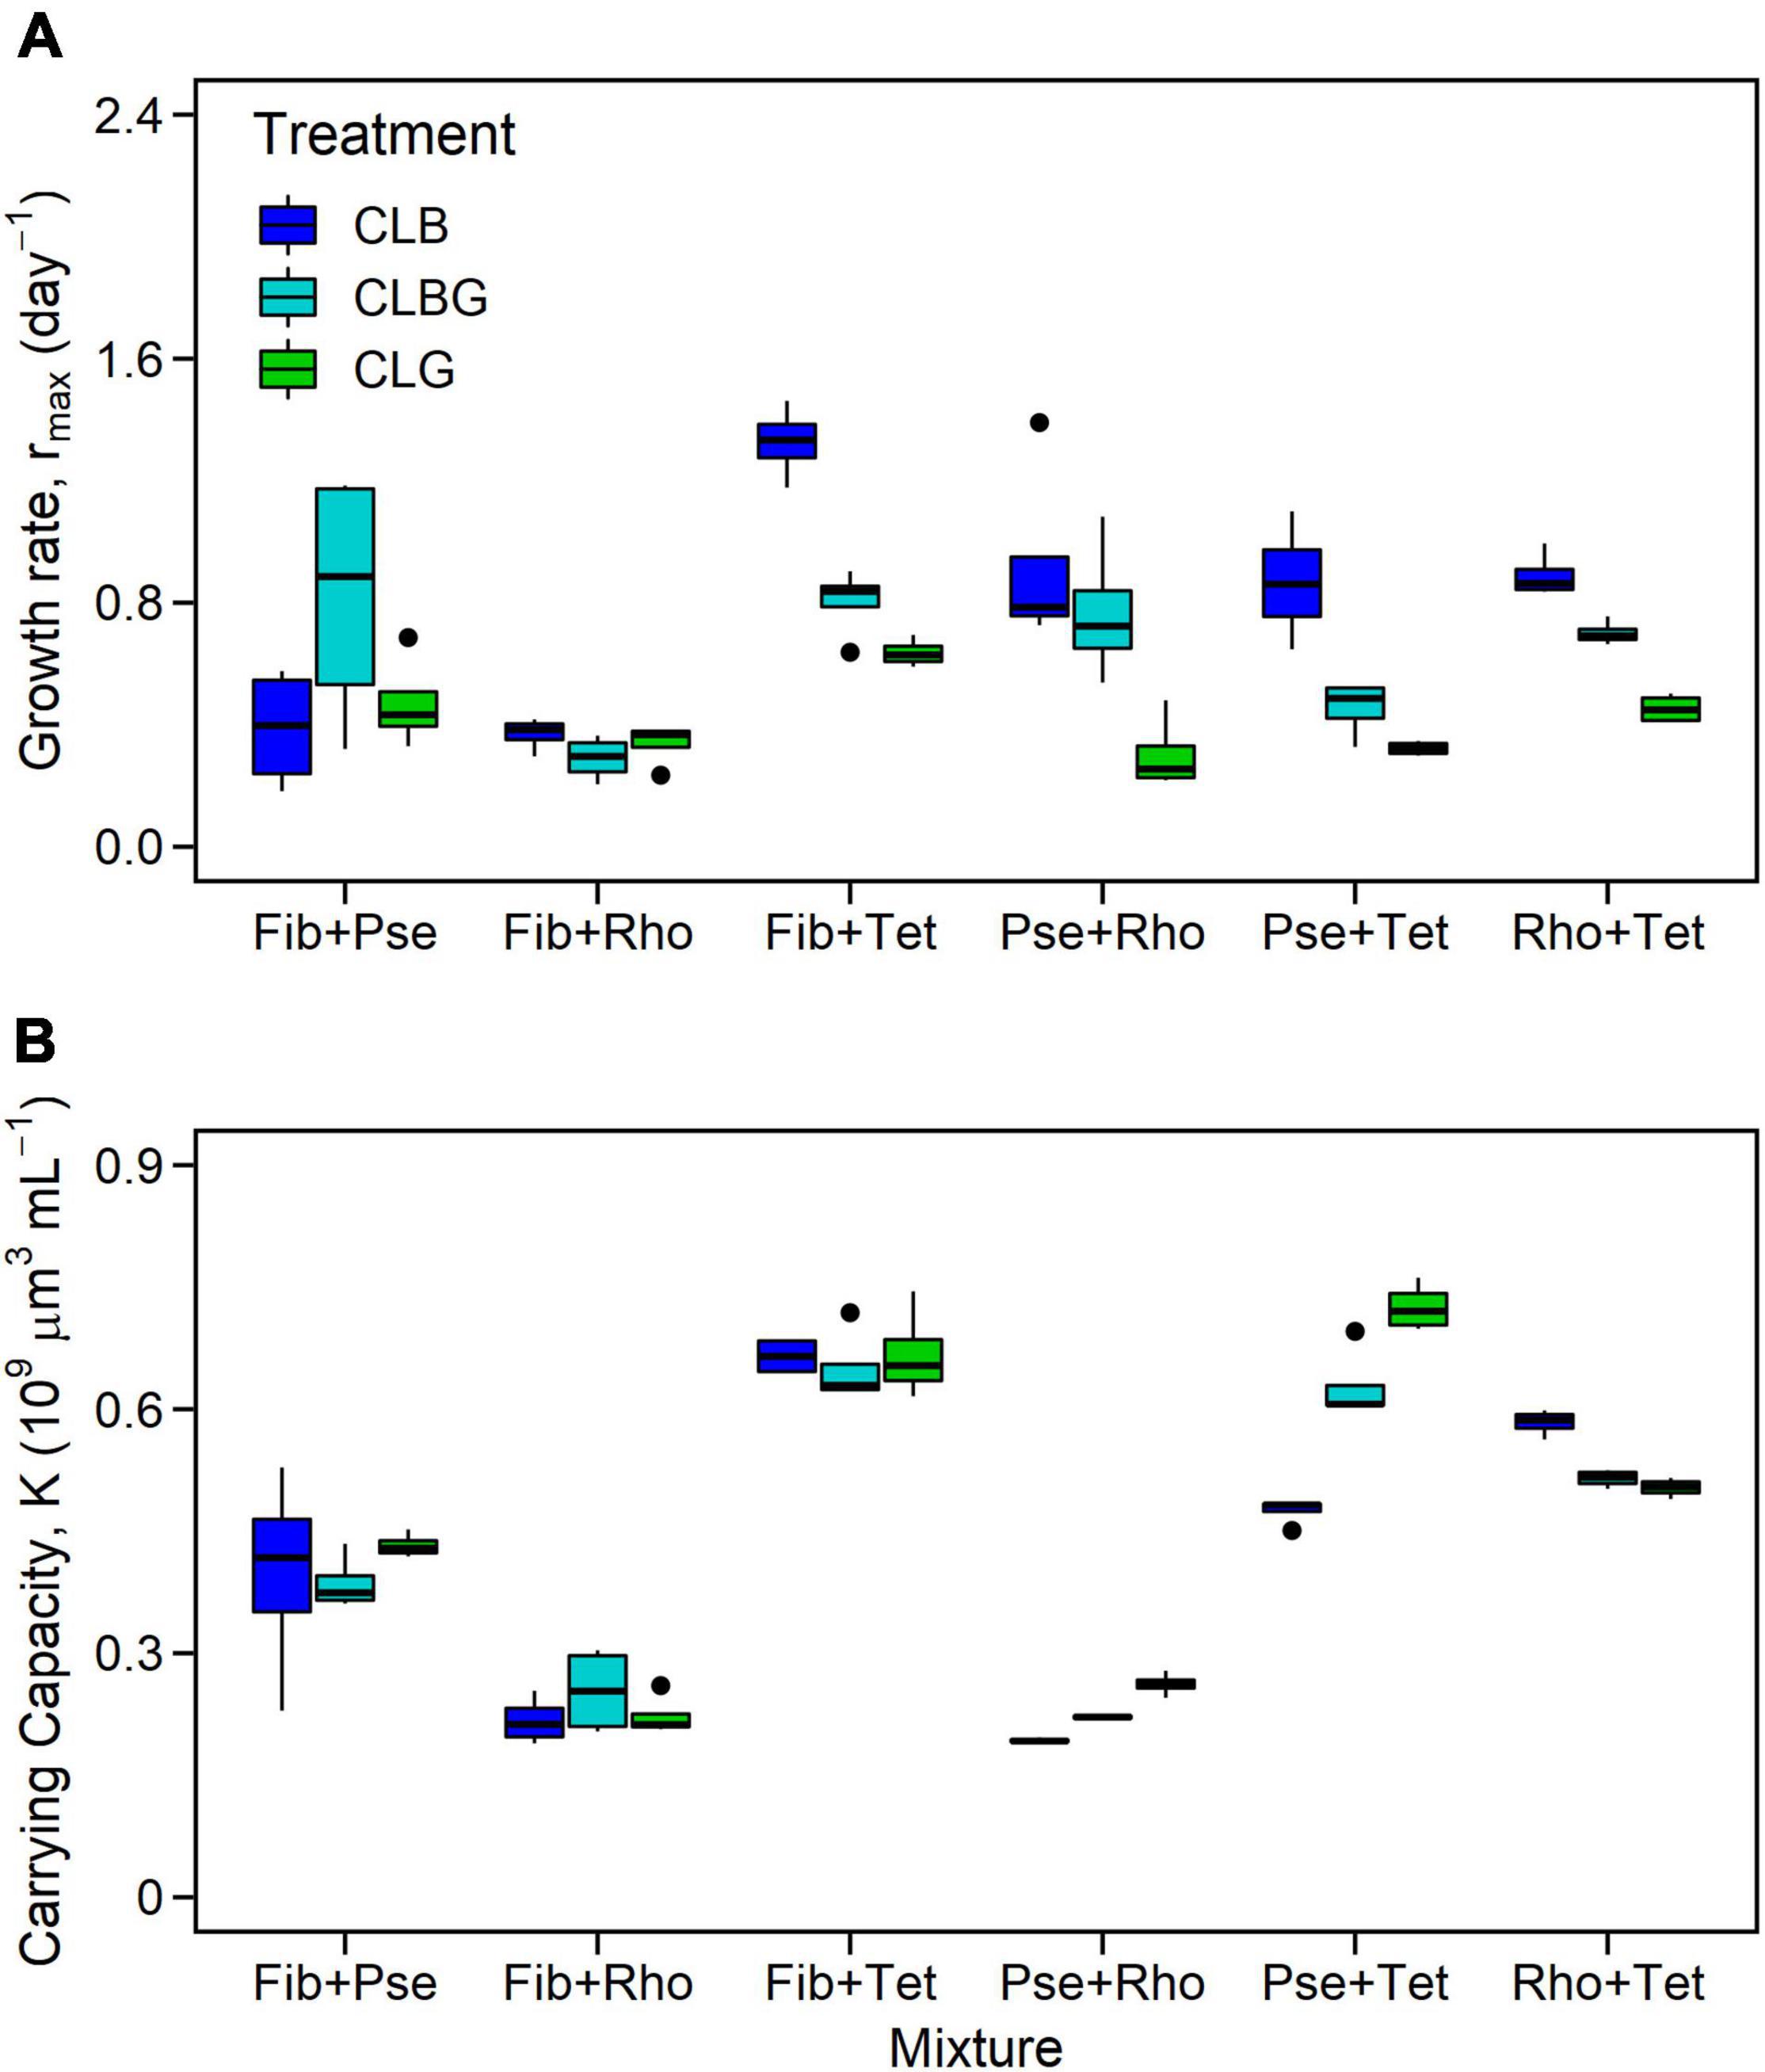
Figure 5. Maximum growth rate (A) and carrying capacity (B) for two-species mixtures. Colors indicate constant light treatments (CLB, constant blue light; CLBG, constant blue-green light; CLG, constant green light).
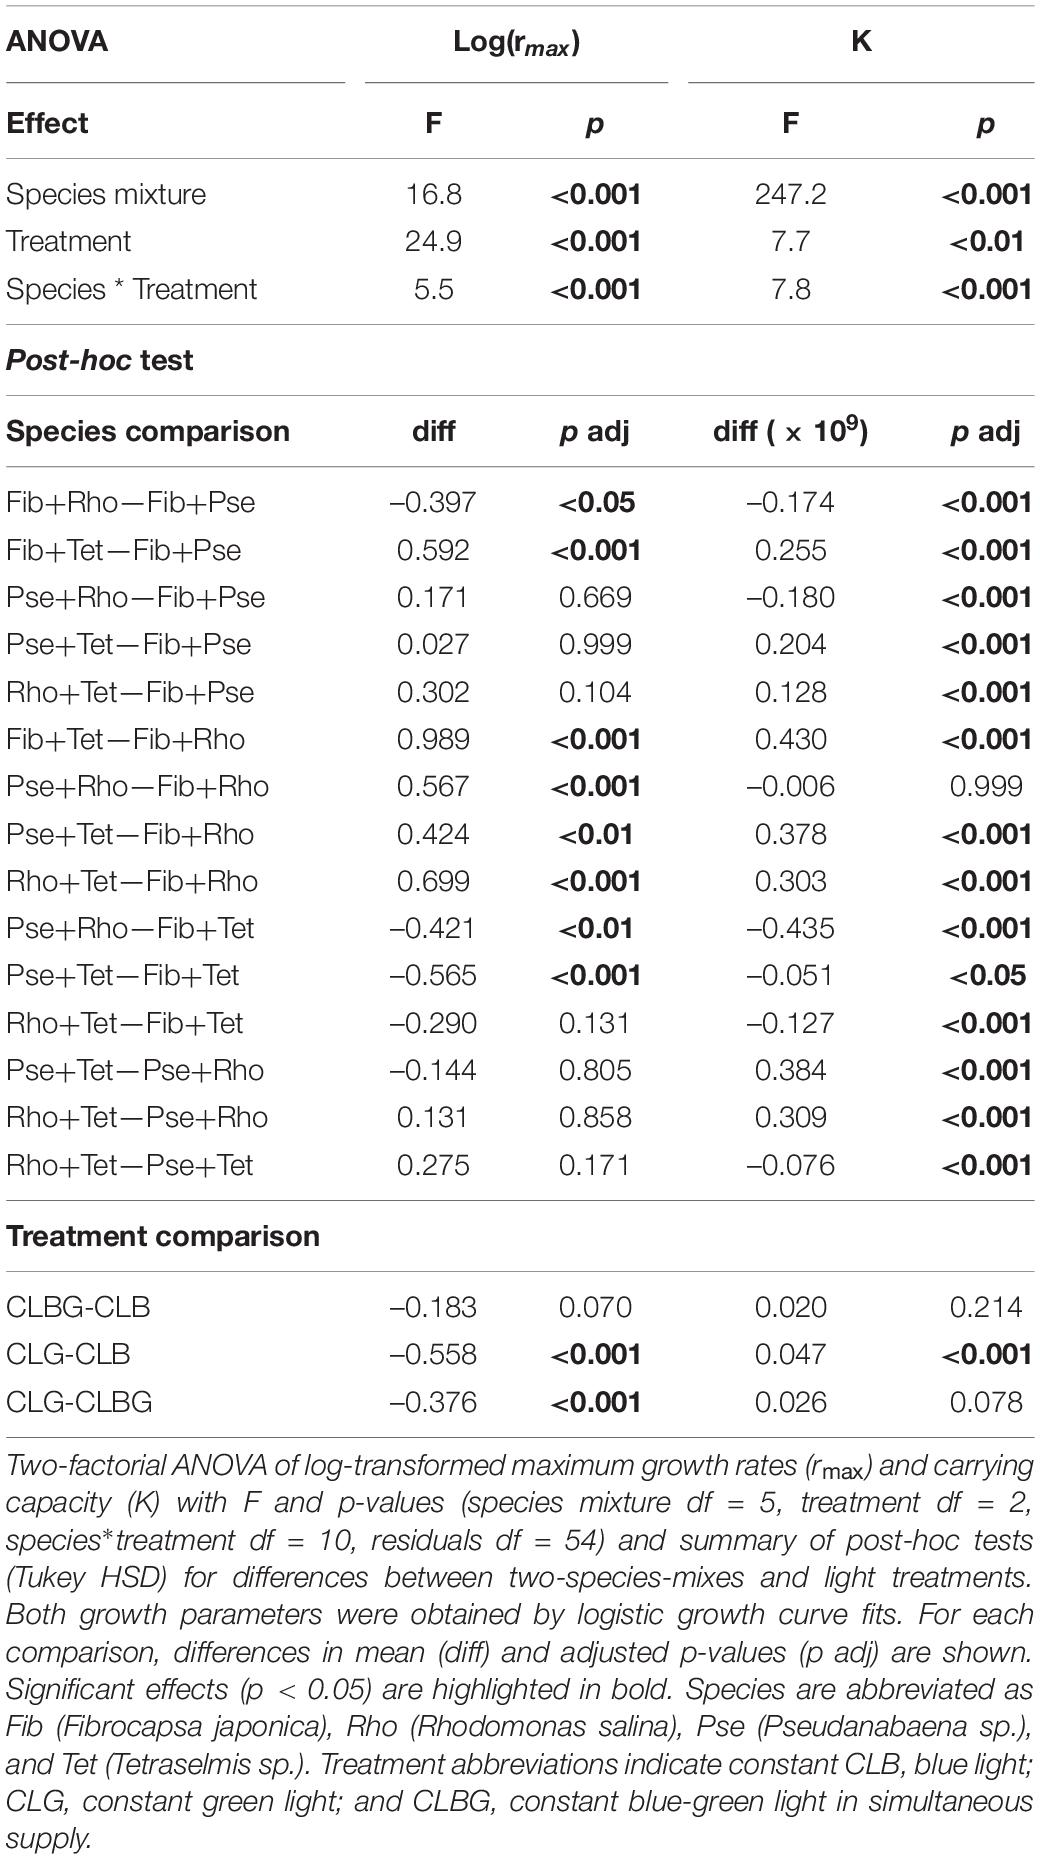
Table 3. Two-species mixtures under constant light.
The two-species mixtures reflect the performance of the included species, mixtures containing Tet generally performed better than others while mixtures containing Rho showed lower performance than other mixtures (Figure 5, species mixture comparison, Table 3).
Furthermore, the light treatment effects (light color) also depended on the containing species, thus mixed cultures including Tet had overall higher rmax under blue light than under blue-green and lowest under green light while such light effects on rmax were not observed in other mixtures.
The two-species mixtures’ K was mainly species-specific, thus mixtures including Tet had highest K while mixtures containing Rho had lowest K compared to other mixtures (Figure 5, species mixture comparison, Table 3). The light treatment effects, in terms of light color, of the two-species mixtures’ K only existed between blue and green light treatments (Figure 5 and Table 3).
Mixed Culture Performance Under Fluctuating Light—Growth, Capacity, and Species Proportion
Frequency of blue-green light fluctuations significantly affected rmax and K of species mixtures (Figure 6 and Table 4). While the overall growth rates of mixtures decreased with increasing frequency (Figure 6 and Table 4), the slopes of fitted linear relationships between growth rates and frequency of individual mixtures were not significant except for Pse+Tet (Figure 7A and Table 4). K was significantly affected by frequency and species mixture, here K increased significantly with increasing fluctuation frequency for Pse+Rho, Pse+Tet, and Rho+Tet (Figure 7B and Table 4).
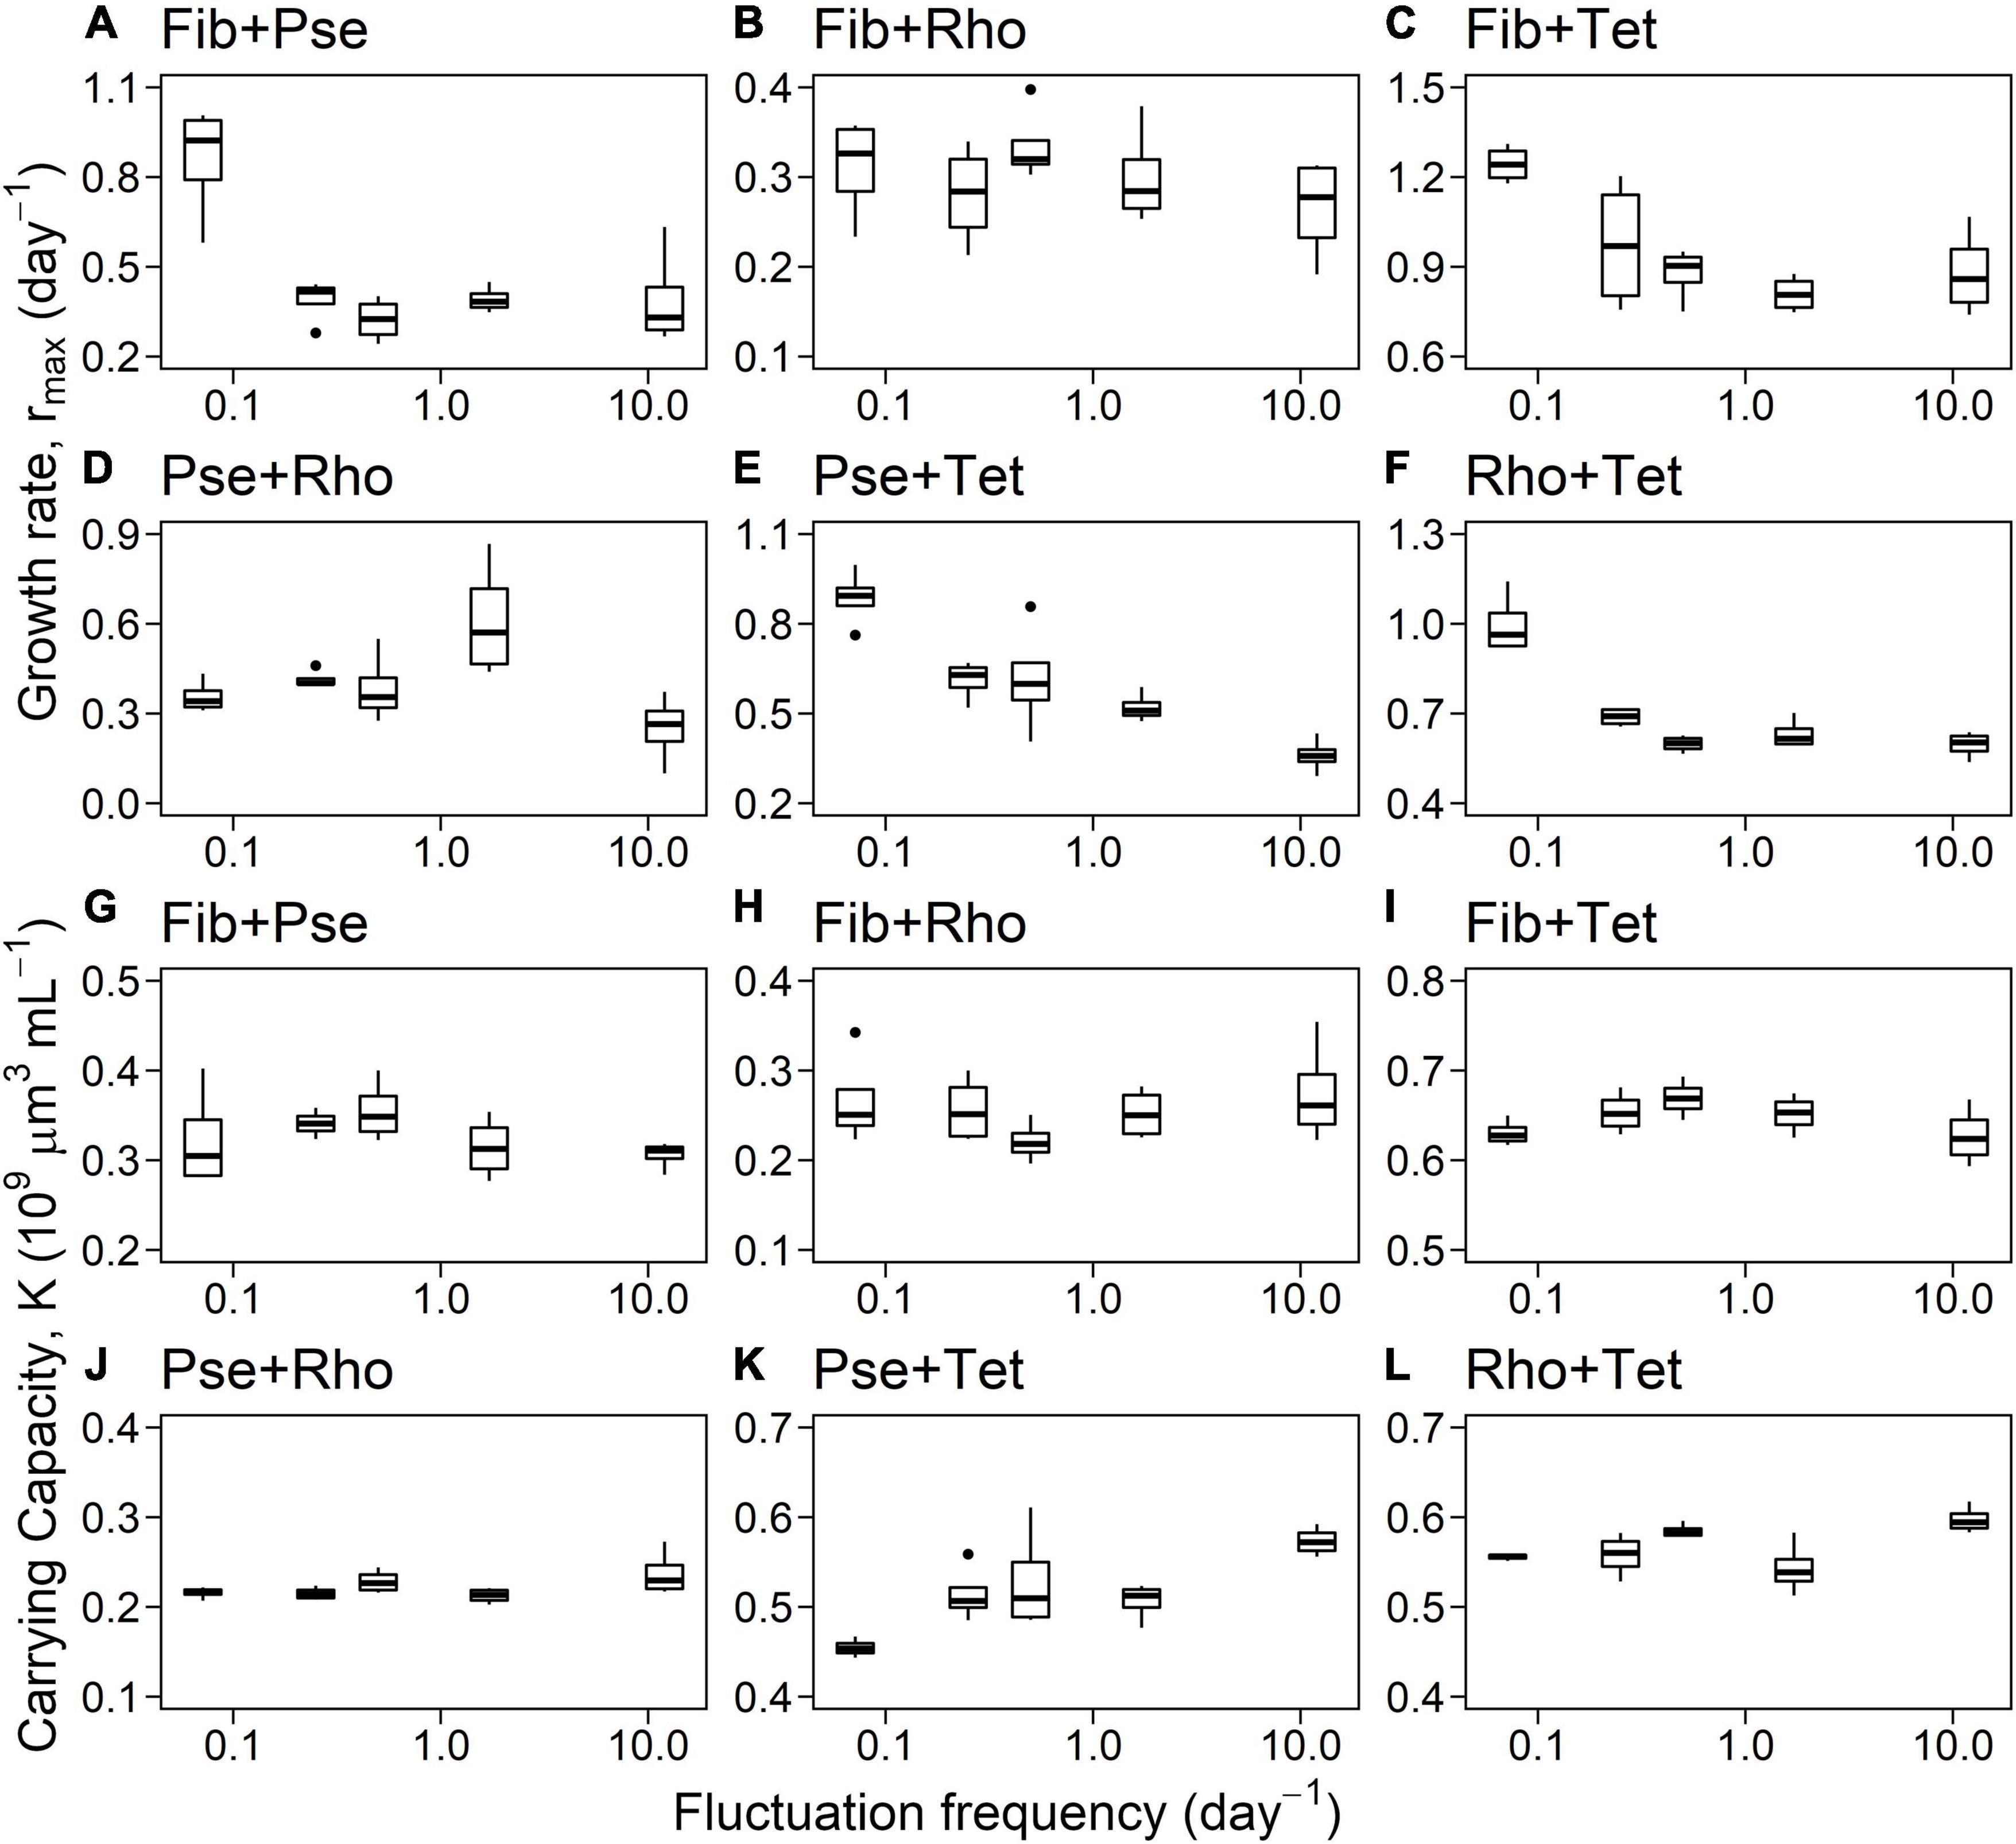
Figure 6. Maximum growth rates (A–F) and carrying capacity (G–L) for two-species mixtures related to fluctuation frequency (log-scale).
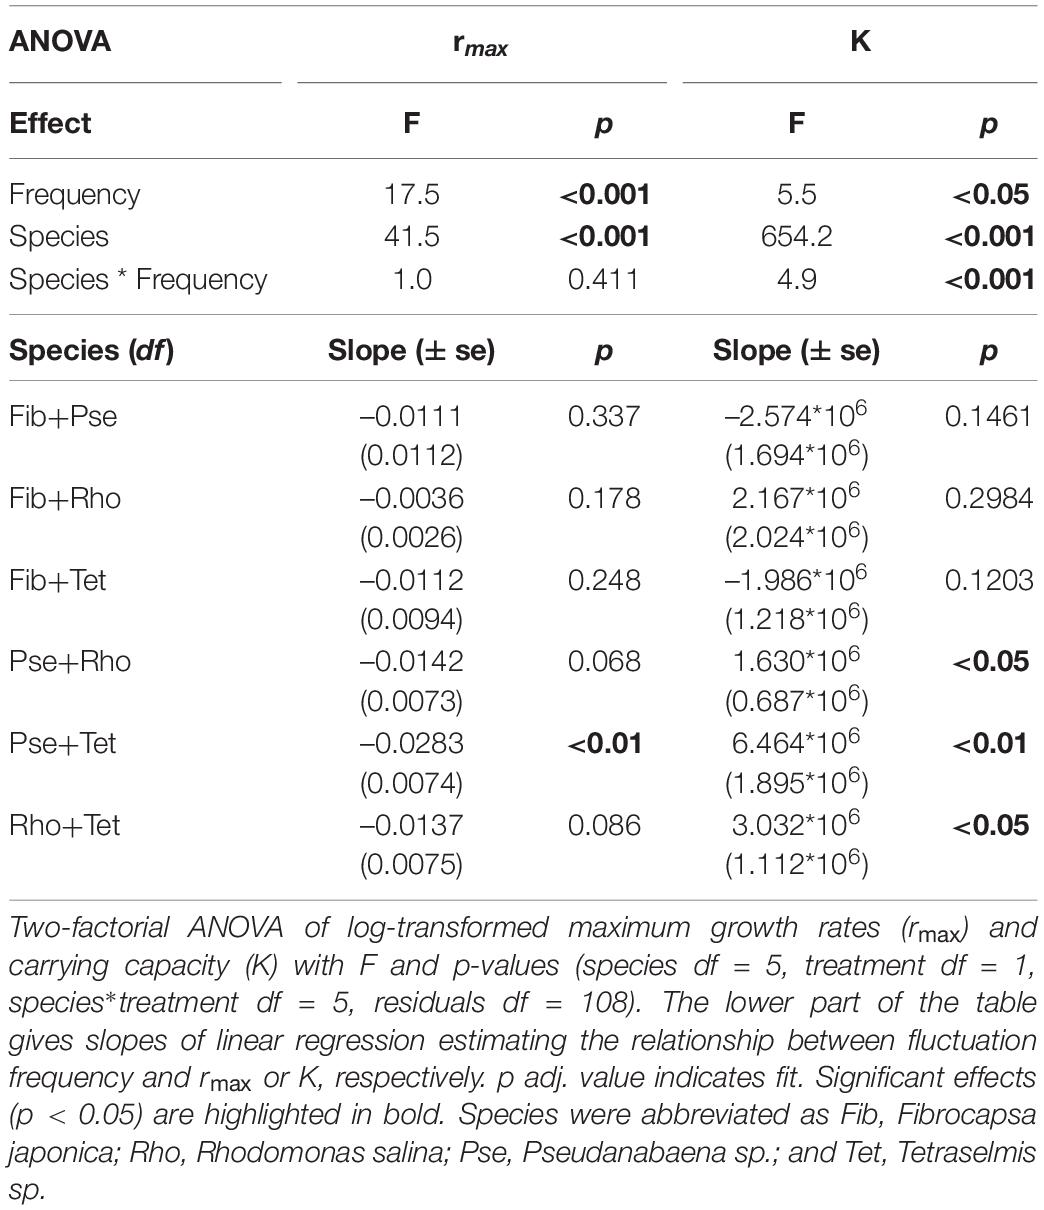
Table 4. Two-species mixtures under fluctuating light.
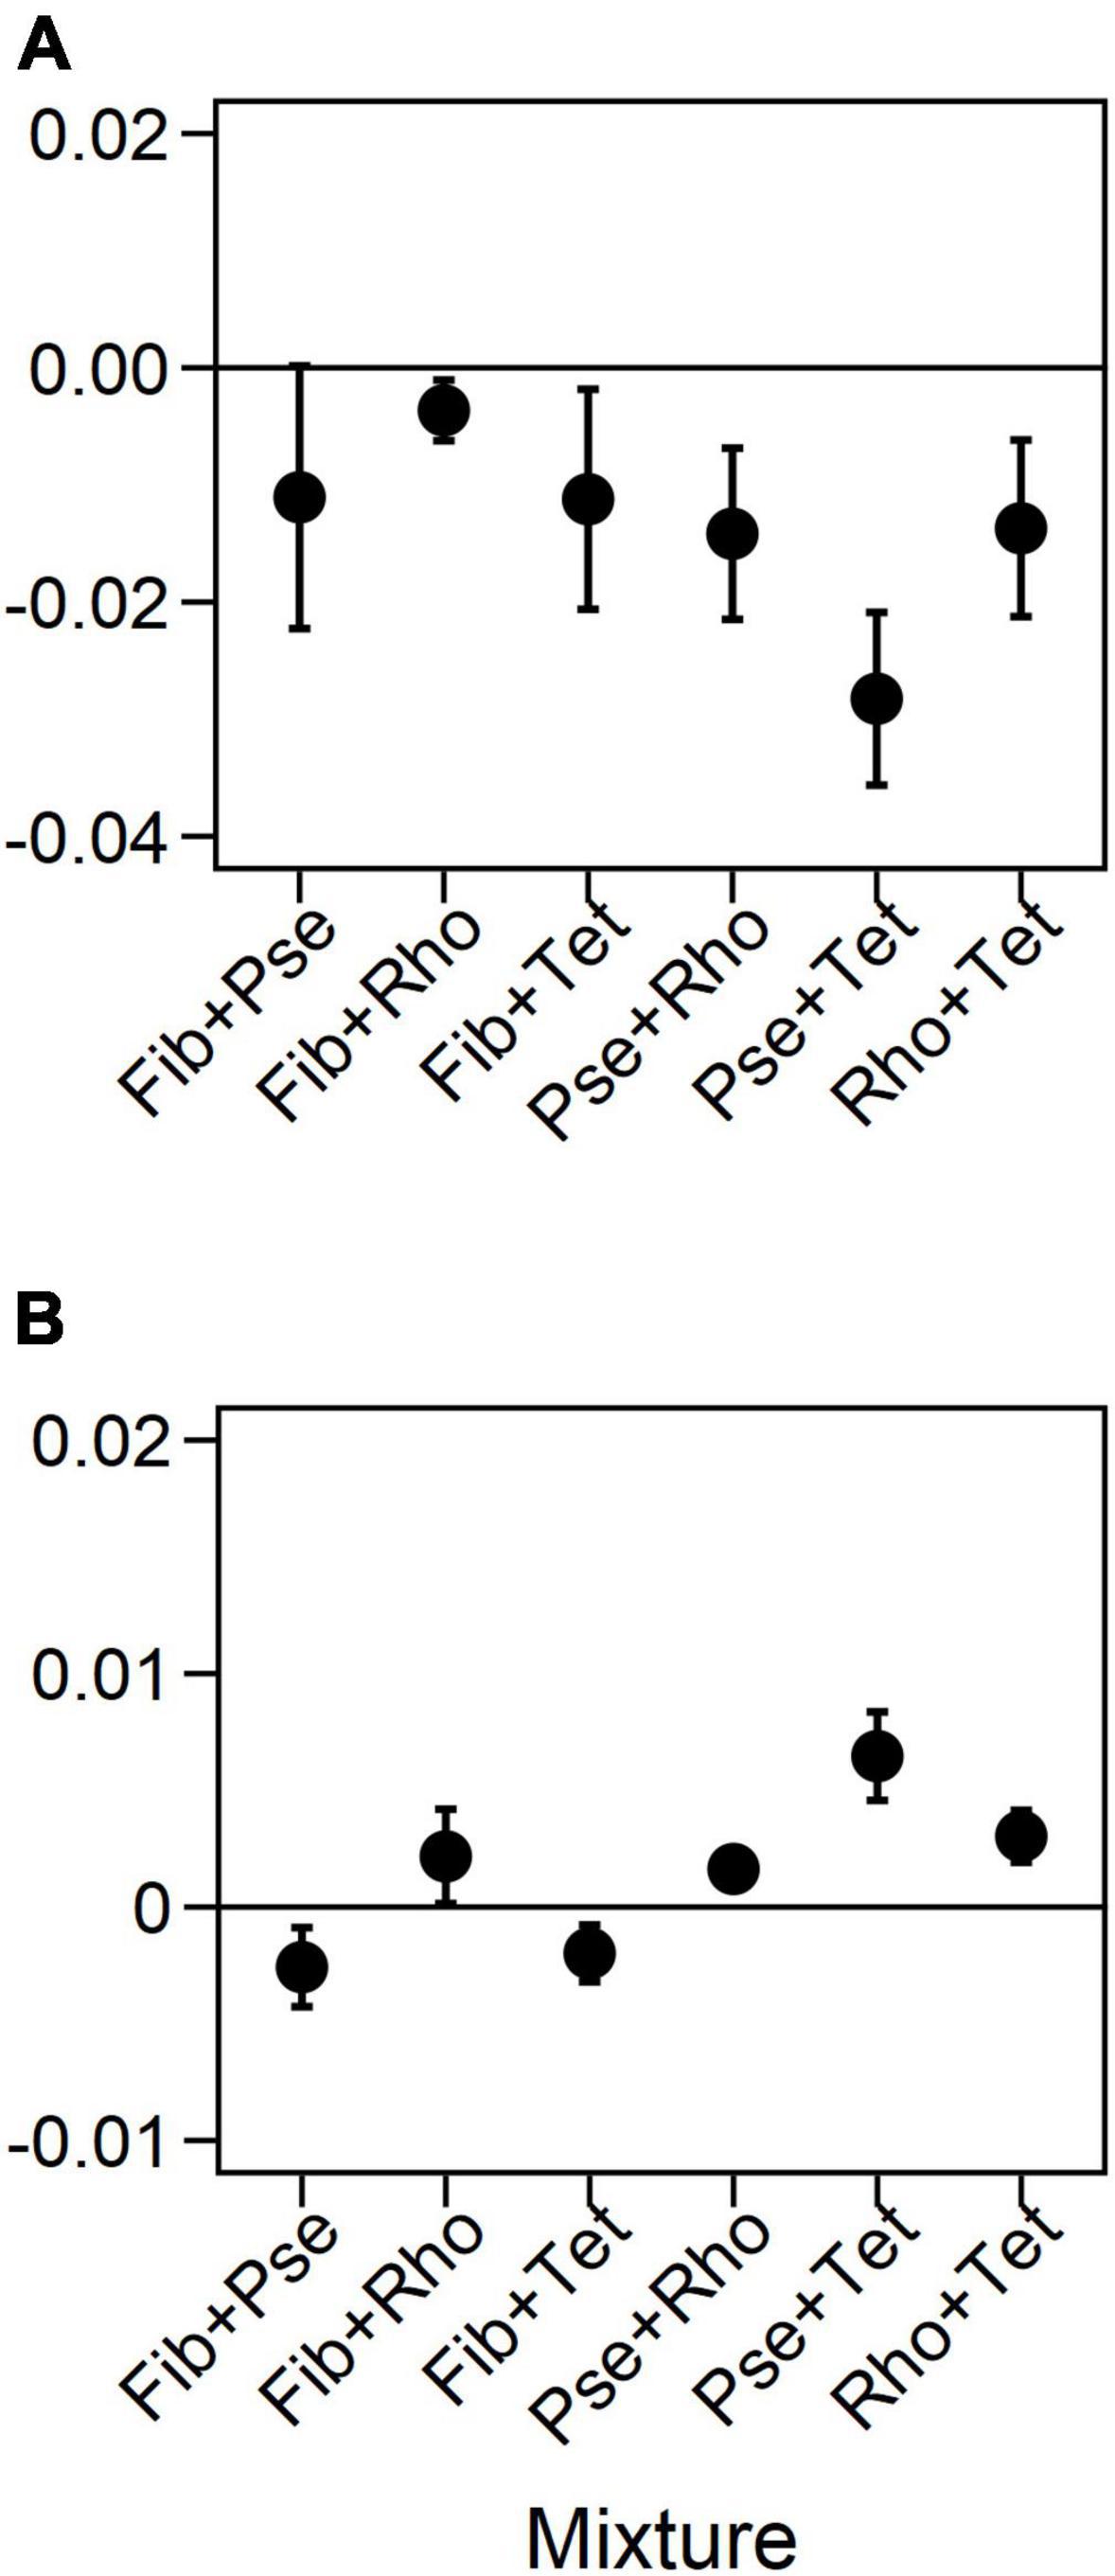
Figure 7. Slopes from the relations between fluctuation frequency and responses in maximum growth rates (A) and carrying capacities (B) of the two-species mixtures. Error bars represent standard error.
Composition of Mixed Cultures—Relative Biovolume Under Constant and Fluctuating Light Colors
In mixture under constant light conditions, almost all combinations showed significant effects of the supplied light (except Fib+Rho, Figure 8 and Table 5). While Pse showed significantly lower relative biovolume under blue light compared to blue-green and highest relative biovolume under green light in mixture (Figure 8 and Table 5), the respective other species contained in the two-species mixture showed the opposed effect. The light treatment dependent relative biovolume of the other species generally reflected the preferences observed in monoculture, however, it depended also on the combination of species. Rho showed higher relative biovolume under blue light when combined with Pse while Rho showed higher relative biovolume under green light when combined with Tet (Figure 8). Similar to the observations under constant light, Tet was the dominating species in mixed cultures under fluctuating light conditions.
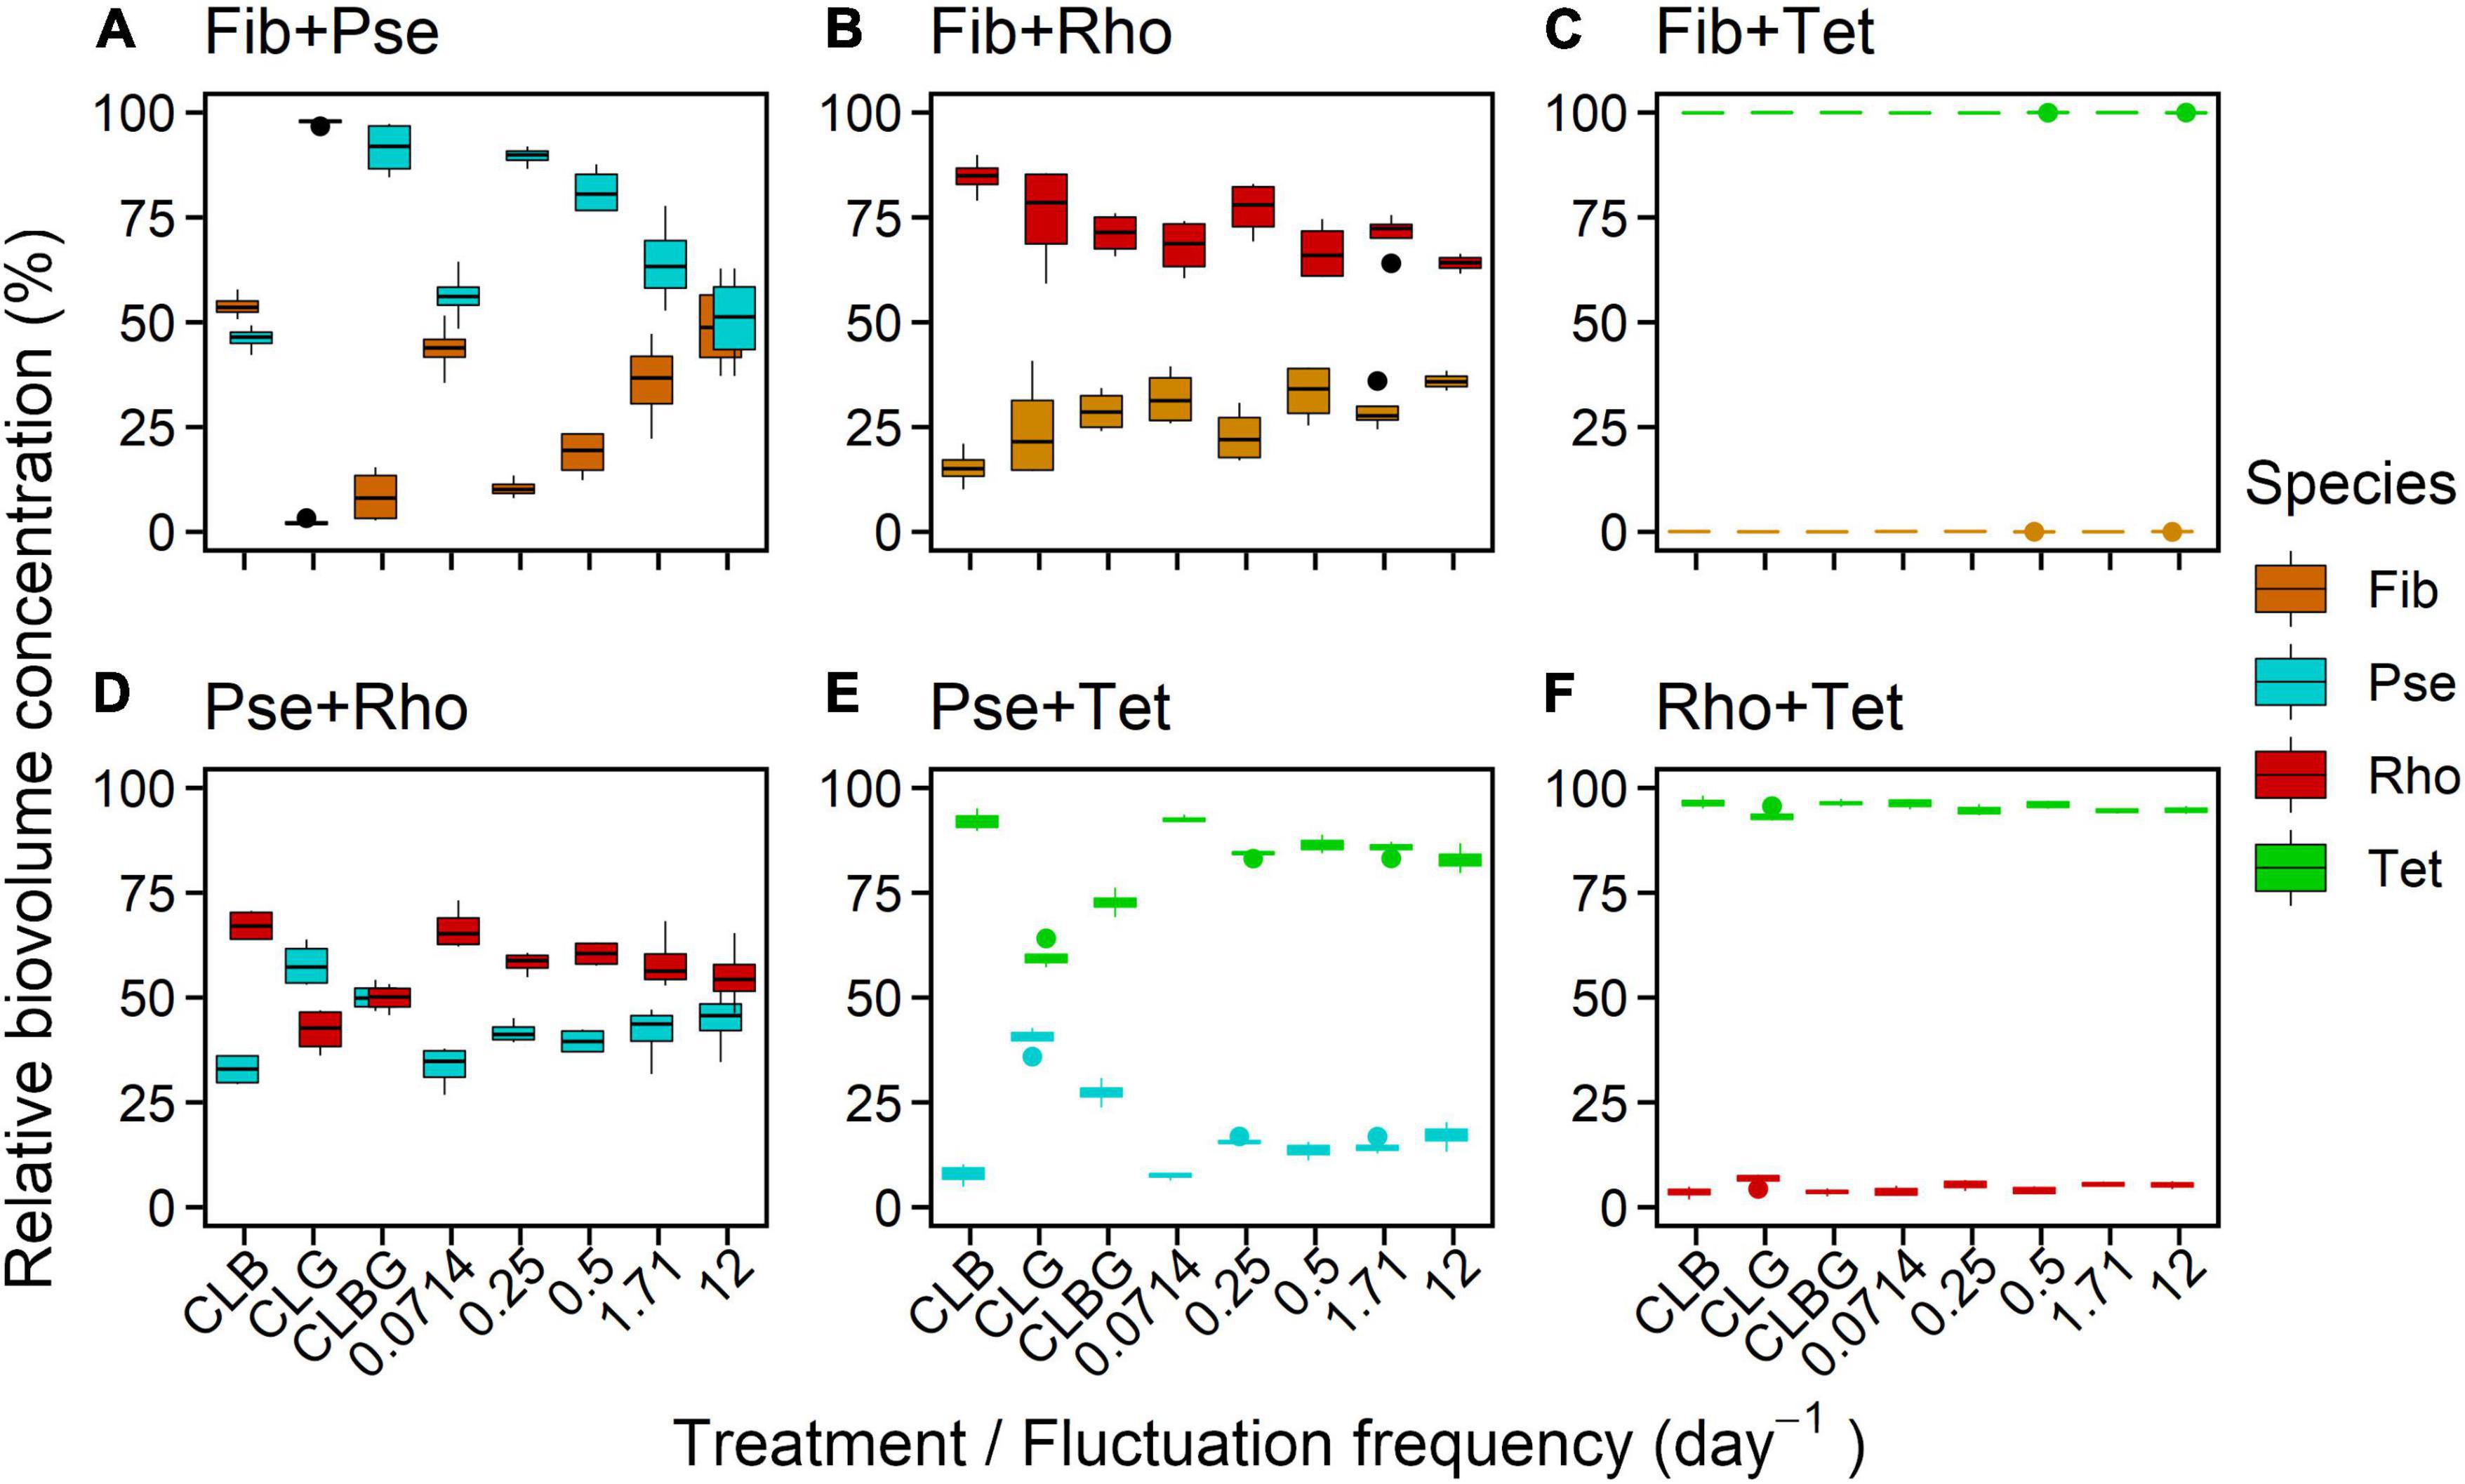
Figure 8. Species-specific contribution to total biovolume (%) under constant and fluctuating conditions for two-species mixtures (A–F) after the experiment (16 days). Colors indicate the species in combination. The distance of both species’ biovolumes indicates the extent of domination. Values of 100 and 0%, respectively, indicate exclusion. Positions on the x-axis were slightly shifted for better visibility.
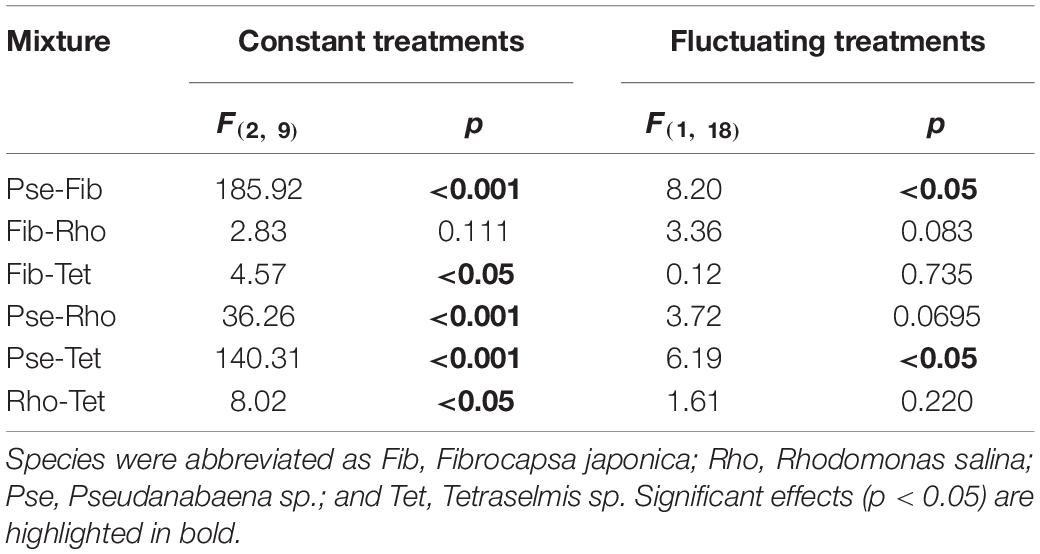
Table 5. ANOVA outcomes (F and p-values given) testing for effects of constant and fluctuating light on the relative proportion of species in the two-species mixtures.
Discussion
Species Performance Under Constant Light
Our results show that performance of phytoplankton species clearly depends on the wavelength of the supplied light, which is in great overlap with previous studies (Luimstra et al., 2018; Heidenreich and Richardson, 2020; Tan et al., 2020). For all phytoplankton species, except for the cyanobacterium Pseudanabaena sp. (Pse), highest growth rates were observed under blue compared to green light supply. We considered Tetraselmis sp. (Tet) and Fibrocapsa japonica (Fib) as blue-light using species, both having higher absorption and higher maximum growth rates under blue light than under green light. Pse and Rhodomonas salina (Rho) were considered as species using blue as well as green light due to the pigment phycoerythrin. However, these species did not show higher growth under green light than Tet and Fib, whereas the capacity within these species was highest under green light. That is, species performances depended on their light-harvesting strategies, but we did not observe that species with green-light absorbing pigments have consequently higher growth under green light than species without such pigments, which conflicts with our first hypothesis (H1). Thus, species-specific performance was most relevant before treatment specific effects came into play, treatment effects, however, reflected the light absorption traits.
In our experiment, the chlorophyte Tet was observed as fast-growing species, showing the overall highest maximum growth rates, irrespective of the light treatments. This corresponds to the meta-analysis of Schwaderer et al. (2011) who examined that (freshwater) chlorophytes are generally characterized by high growth rates. We found that light color affected the maximum growth rates of Tet but not the carrying capacity. Tet is not known to possess pigments absorbing the green light efficiently which affected the rmax. Here, small emission of orange-red light at 600–650 nm, although the treatment was peaking in green, probably overlapped with the second absorption peak of chlorophyll and thus sufficed growth of Tet which later reached a similar K than under blue light. Nevertheless, Abiusi et al. (2014) also reported growth of a Tetraselmis species (T. suecica) under blue and green light, similar to our results.
Maximum growth rates of the raphidophyte Fib were significantly lower under green light than under blue light but carrying capacities did not differ between the treatments. Besides chlorophyll a and c, Fib is known to possess several carotenoids as accessory light-harvesting pigments, i.a. fucoxanthin (Guidi-Rontani et al., 2010), which in part absorbs green light as well (e.g., Dubinsky and Stambler, 2009). With that, Fib could have used the green light in our treatments, leading to the similar carrying capacities under the blue and green light.
The cryptophyte species Rho showed large differences in maximum growth rates, with higher growth under blue light than under green light. These results are consistent with other studies on the genus of Rhodomonas (Heidenreich and Richardson, 2020; Latsos et al., 2021). Absorption spectra (Supplementary Figure 3) showed that Rho absorbs blue and red light, likely due to the chlorophylls a and c as well as green light by phycoerythrin (Lawrenz and Richardson, 2017; Heidenreich and Richardson, 2020). The performance of Pse was clearly different from the other species, as its growth rates were highest under constant blue-green light. Furthermore, maximum growth rates did not significantly differ between blue and green light. Carrying capacities, however, were significantly higher under green light than under the other constant light treatments. Lower growth of cyanobacteria under blue light compared to green or red light was also reported in other studies(e.g., Bland and Angenent, 2016; Luimstra et al., 2018; Tan et al., 2020). Based on our measured absorption spectra characteristics (Supplementary Figure 3) this can be related to the diverse set of pigments common in Pse, namely chlorophyll a absorbing blue and red light, phycoerythrin absorbing green light, and phycocyanin absorbing orange-red light (Stomp et al., 2008; Acinas et al., 2009), suggesting that the cyanobacterium is a good competitor under different light colors. However, Luimstra et al. (2018) elucidated that, in contrast to species with chlorophyll-based pigment complexes like chlorophytes, cyanobacteria with their phycobiliproteins have a lower light-harvesting efficiency for blue light due to an imbalance in the photosystems. Thus, corresponding with Heidenreich and Richardson (2020) it seems likely that phycobiliproteins are not very effective in light-harvesting but allow the species to widen the window of absorbable wavelengths. This might explain why we did not detect higher growth responses of phycoerythrin-containing species under green light compared to species without such pigments (rejecting H1).
Species Performance Under Fluctuating Light
Monoculture experiments under constant light showed that blue and green light resulted in significant differences in the growth responses of Fib, Rho, and Tet, respectively. Thus, the assumption was that fluctuations between blue and green light would, depending on the frequency, also affect species performance. Our experiment revealed that fluctuations in the available light spectrum do not necessarily affect phytoplankton growth in monocultures but there are species able to tolerate these fluctuations. Generally, species maximum growth rates depended more on fluctuation frequency than species carrying capacities did. As for Fib, neither maximum growth rates nor carrying capacities were affected by fluctuation frequency, this supports the previous implication that the effects of the light colors on growth of Fib were not strong. Maximum growth rates of the other species were all significantly affected by the fluctuation frequency but not always in the same direction. While growth rates of Tet and Rho were higher with faster fluctuations, those of Pse decreased with increasing fluctuation frequency. Carrying capacities showed the opposite picture with those of Rho decreasing while the others were either increasing or not affected by fluctuation frequency. For Pseudanabaena sp., having the capability of complementary chromatic adaptation, Stomp et al. (2008) suggested that there might be a threshold for light color fluctuations above which it could benefit from this phenotypic plasticity. Thus, for their used strain of Pseudanabaena sp., fluctuations between green and red light in the order of hours were too fast for the species to acclimate. The used fluctuation frequencies in our experiment might also have been too fast for such a chromatic adaptation and in addition, the blue light color treatment we used (alteration between green and blue) did not match the phycobilin’s absorption range (compared to red as in Stomp et al., 2008).
Our experiment showed that growth and capacity of phytoplankton species can be affected by the frequency of fluctuating light colors but there are also species being unaffected (here Fib and Tet) which confirms partially hypothesis H2. Species showed positive and negative responses in performances to fluctuation frequency.
Competition Outcomes
According to the first part of hypothesis H3, we expected that a species with a higher growth rate for a certain light color would dominate in competition with a species, having a lower growth rate. However, the results of our experiment showed that species-specific growth rates measured in monocultures—at certain light color conditions—could not be used directly to predict the competition outcome for all mixtures. While Tet was observed as fast-growing species, showing overall highest maximum growth rates and carrying capacities under constant light treatment, this was reflected in the competitive outcomes in mixed cultures. On the other hand, Rho became a dominant species when it was mixed with Fib under all constant light treatments contrariwise to the observed growth traits of the species in monoculture. Thus, our results of the mixed cultures with Fib and Rho as well as the Fib and Pse mixture results conflict with hypothesis H3, as growth in mixture could not be predicted by the performance at different light colors in monocultures. It emphasizes that further factors affecting competition, such as the light characteristics and species light-use efficiencies (cf. Huisman and Weissing, 1994; Stomp et al., 2004; Luimstra et al., 2020) needs to be included.
Our hypothesis that species using blue and green light differently would be able to coexist when both light colors are supplied simultaneously was thus not supported by our results but may be explained by species light-use efficiencies (rejecting H3). Under blue-green and green light, Pse competitively excluded Fib, despite the higher maximum growth rates and carrying capacities of Fib in monoculture compared to those of Pse. This coincides again with the results of Luimstra et al. (2018) that cyanobacteria have a lower light use efficiency for blue light.
Fluctuation frequency significantly affected the population dynamics in almost all two-species mixtures, however, effects of species-specific competition were more pronounced than the effects of fluctuation frequency. According to hypothesis H2, we expected that maximum growth rates and carrying capacities in species mixtures depended on fluctuation frequency if at least one species showed differences in growth under blue and green light in monoculture, respectively. This was confirmed by all mixtures, except that of Fib and Rho showing no effect of fluctuation frequency on maximum growth rate.
Implications of Light Color Fluctuations on the Performance of Different Species
The phytoplankton species analyzed here were originally isolated from the North Sea, a habitat which has encountered severe changes in temperature (Belkin, 2009), nutrient concentrations (Radach et al., 1990; Philippart et al., 2000) and loads of organic matter (Evans et al., 2005; Dupont and Aksnes, 2013; Binding et al., 2015; Capuzzo et al., 2015; Leech et al., 2018). The phytoplankton light absorption in the North Sea is characterized by large peaks in the blue and red wavebands whereas green light is less absorbed (Babin et al., 2003). Green light, however, is expected to provide a significant niche for growth of small cyanobacteria due to their well-suited set of phycobiliproteins (e.g., Stomp et al., 2007b; Holtrop et al., 2021). In our study, we observed that blue and green light lead to significant differences in growth of our phytoplankton species, belonging to three different phytoplankton phyla. Whereas all eukaryotic species had lower growth rates under green light than under blue light, only the cyanobacterium (Pse) grew similarly well under both light colors. These species-specific results indicate that shifts in watercolor will likely affect phytoplankton growth, depending on species light-harvesting strategies (Luimstra et al., 2018; Tan et al., 2020). As the estimated effects in monocultures did not necessarily predict competition outcomes, yet provide insight on potential changes in community compositions, experiments using mixtures and thus including species competition are essential. Pse was the only species in our experiment which benefited from the provided green light in competition with other species, highlighting the nature of cyanobacteria to be competitively advanced in aquatic ecosystems with altered light spectra (Scheffer et al., 1997; Lebret et al., 2018; Luimstra et al., 2020). However, the species chosen for this experiment might not be representative for certain phytoplankton groups and light absorption is expected to differ in general between species. Nevertheless, in water bodies with a less pronounced turbidity but strong vertical mixing processes, phytoplankton will encounter not only a shift but a high temporal variability in light conditions, both quantitatively and qualitatively. These mixing processes occur within the order of hours to days (e.g., Denman and Gargett, 1983) and thus greatly overlap with the tested light fluctuations here. Together with the large number of studies, demonstrating that growth of phytoplankton species is strongly affected by light intensity fluctuations, depending on species-specific traits (Nicklisch, 1998; Litchman, 2000; Guislain et al., 2019) we can contribute with this first attempt, that growth of phytoplankton species is also affected by fluctuations in light color although responses seem to be species-specific. The importance of light quality for natural phytoplankton populations is of increasing concern as several studies are reporting decreasing water clarity and shifts in underwater light spectra of coastal seas and lakes (Evans et al., 2005; Dupont and Aksnes, 2013; Binding et al., 2015; Capuzzo et al., 2015; Leech et al., 2018). Moreover, in future scenarios the patterns and frequencies of mixing processes are expected to change and affect phytoplankton (Saros et al., 2012; Sydeman et al., 2014; Somavilla et al., 2017). First studies show that such spectral shifts and altered light availability will likely affect phytoplankton growth and community structure (e.g., Thrane et al., 2014; Lebret et al., 2018; Mustaffa et al., 2020), emphasizing the importance of light as a dynamic environmental factor for the phytoplankton in aquatic ecosystems.
Conclusion
Our experimental outcomes demonstrate that shifts in watercolor within natural systems will likely affect phytoplankton growth, depending on species light-harvesting strategies. Pseudanabaena sp. benefited from the provided green light in competition with other species, highlighting the nature of cyanobacteria to be competitively advanced in aquatic ecosystems with such light spectra. Despite the frequency of fluctuation resulting in significant effects, the competition outcome under fluctuating light was outweighed by the combination of competitors, hence outcomes being species-specific. Nevertheless, the fluctuation in light color significantly influenced the species dynamics in mixed cultures and the light color use efficiency thus should be considered as important species-specific trait among others (as e.g., light-absorption properties, maximum growth rates, carrying capacities) to influence the outcomes of phytoplankton competition for light. The reported results here may be the first step to improve knowledge about the significance of fluctuating light conditions for phytoplankton growth and competition, not only in intensity but also in the quality of light.
Data Availability Statement
The raw data supporting the conclusions of this article will be made available by the authors, without undue reservation.
Author Contributions
NH and MSt designed the experiment. SN, NH, and MSc constructed the experimental setup. SN, MSt, and NH conducted the experiment. SN and MSt analyzed the data and drafted the manuscript, with input from all co-authors. All authors contributed to the article and approved the submitted version.
Funding
The project was funded by the German Research Foundation (DFG: STR 1383/5-1 and WA 2445/13-1).
Conflict of Interest
The authors declare that the research was conducted in the absence of any commercial or financial relationships that could be construed as a potential conflict of interest.
Publisher’s Note
All claims expressed in this article are solely those of the authors and do not necessarily represent those of their affiliated organizations, or those of the publisher, the editors and the reviewers. Any product that may be evaluated in this article, or claim that may be made by its manufacturer, is not guaranteed or endorsed by the publisher.
Acknowledgments
We thank Julian Zeller for supporting sampling and analysis. We also thank the editor and reviewers for their constructive comments on the manuscript.
Supplementary Material
The Supplementary Material for this article can be found online at: https://www.frontiersin.org/articles/10.3389/fmars.2022.824624/full#supplementary-material
References
Abiusi, F., Sampietro, G., Marturano, G., Biondi, N., Rodolfi, L., D’Ottavio, M., et al. (2014). Growth, photosynthetic efficiency, and biochemical composition of Tetraselmis suecica F&M-M33 grown with LEDs of different colors. Biotechnol. Bioeng. 111, 956–964. doi: 10.1002/bit.25014
Acinas, S. G., Haverkamp, T. H. A., Huisman, J., and Stal, L. J. (2009). Phenotypic and genetic diversification of Pseudanabaena spp. (cyanobacteria). ISME J. 3, 31–46. doi: 10.1038/ismej.2008.78
Babin, M., Stramski, D., Ferrari, G. M., Claustre, H., Bricaud, A., Obolensky, G., et al. (2003). Variations in the light absorption coefficients of phytoplankton, nonalgal particles, and dissolved organic matter in coastal waters around Europe. J. Geophys. Res. Oceans 108:3211. doi: 10.1029/2001jc000882
Belkin, I. M. (2009). Rapid warming of large marine ecosystems. Prog. Oceanogr. 81, 207–213. doi: 10.1016/j.pocean.2009.04.011
Bernhardt, J. R., O’Connor, M. I., Sunday, J. M., and Gonzalez, A. (2020). Life in fluctuating environments. Philos. Trans. R. Soc. B Biol. Sci. 375:20190454. doi: 10.1098/rstb.2019.0454
Bidigare, R. R., Marra, J., Dickey, T. D., Iturriaga, R., Baker, K. S., Smith, R. C., et al. (1990). Evidence for phytoplankton succession and chromatic adaptation in the Sargasso Sea during spring 1985. Mar. Ecol. Prog. Ser. 60, 113–122. doi: 10.3354/meps060113
Binding, C. E., Greenberg, T. A., Watson, S. B., Rastin, S., and Gould, J. (2015). Long term water clarity changes in North America’s Great Lakes from multi-sensor satellite observations. Limnol. Oceanogr. 60, 1976–1995. doi: 10.1002/lno.10146
Bland, E., and Angenent, L. T. (2016). Pigment-targeted light wavelength and intensity promotes efficient photoautotrophic growth of Cyanobacteria. Bioresour. Technol. 216, 579–586. doi: 10.1016/j.biortech.2016.05.116
Bryant, D. A., and Cohenbazire, G. (1981). Effects of chromatic illumination on Cyanobacterial Phycobilisomes evidence for the specific induction of a second pair of Phycocyanin subunits in Pseudanabaena 7409 grown in red light. Eur. J. Biochem. 119, 415–424. doi: 10.1111/j.1432-1033.1981.tb05624.x
Capuzzo, E., Stephens, D., Silva, T., Barry, J., and Forster, R. M. (2015). Decrease in water clarity of the southern and central North Sea during the 20th century. Glob. Chang. Biol. 21, 2206–2214. doi: 10.1111/gcb.12854
Croce, R., and van Amerongen, H. (2014). Natural strategies for photosynthetic light harvesting. Nat. Chem. Biol. 10, 492–501. doi: 10.1038/nchembio.1555
da Silva, A. F., Lourenco, S. O., and Chaloub, R. M. (2009). Effects of nitrogen starvation on the photosynthetic physiology of a tropical marine microalga Rhodomonas sp (Cryptophyceae). Aquat. Bot. 91, 291–297. doi: 10.1016/j.aquabot.2009.08.001
Denman, K. L., and Gargett, A. E. (1983). Time and space scales of vertical mixing and advection of phytoplankton in the upper ocean. Limnol. Oceanogr. 28, 801–815. doi: 10.4319/lo.1983.28.5.0801
Dera, J., and Gordon, H. R. (1968). Light field fluctuations in the photic zone. Limnol. Oceanogr. 13, 697–699. doi: 10.4319/lo.1968.13.4.0697
Dubinsky, Z., and Stambler, N. (2009). Photoacclimation processes in phytoplankton: mechanisms, consequences, and applications. Aquat. Microb. Ecol. 56, 163–176. doi: 10.3354/ame01345
Dupont, N., and Aksnes, D. L. (2013). Centennial changes in water clarity of the Baltic Sea and the North Sea. Estuar. Coast. Shelf Sci. 131, 282–289. doi: 10.1016/j.ecss.2013.08.010
Dutkiewicz, S., Hickman, A. E., Jahn, O., Henson, S., Beaulieu, C., and Monier, E. (2019). Ocean colour signature of climate change. Nat. Commun. 10:578. doi: 10.1038/s41467-019-08457-x
Elser, J. J., Bracken, M. E. S., Cleland, E. E., Gruner, D. S., Harpole, W. S., Hillebrand, H., et al. (2007). Global analysis of nitrogen and phosphorus limitation of primary producers in freshwater, marine and terrestrial ecosystems. Ecol. Lett. 10, 1135–1142. doi: 10.1111/j.1461-0248.2007.01113.x
Evans, C. D., Monteith, D. T., and Cooper, D. M. (2005). Long-term increases in surface water dissolved organic carbon: observations, possible causes and environmental impacts. Environ. Pollut. 137, 55–71. doi: 10.1016/j.envpol.2004.12.031
Falkowski, P. G. (1984). Physiological responses of phytoplankton to natural light regimes. J. Plankton Res. 6, 295–307. doi: 10.1093/plankt/6.2.295
Falkowski, P. G. (1994). The role of phytoplankton photosynthesis in global biogeochemical cycles. Photosynth. Res. 39, 235–258. doi: 10.1007/BF00014586
Falkowski, P. G., and Raven, J. A. (2007). Aquatic Photosynthesis. Princeton, NJ: Princeton University Press.
Falkowski, P. G., Barber, R. T., and Smetacek, V. (1998). Biogeochemical controls and feedbacks on ocean primary production. Science 281, 200–206. doi: 10.1126/science.281.5374.200
Ferris, J. M., and Christian, R. (1991). Aquatic primary production in relation to microalgal responses to changing light: a review. Aquat. Sci. 53, 187–217. doi: 10.1007/bf00877059
Field, C. B., Behrenfeld, M. J., Randerson, J. T., and Falkowski, P. (1998). Primary production of the biosphere: integrating terrestrial and oceanic components. Science 281, 237–240. doi: 10.1126/science.281.5374.237
Flöder, S., and Burns, C. W. (2005). The influence of fluctuating light on diversity and species number of nutrient-limited phytoplankton. J. Phycol. 41, 950–956. doi: 10.1111/j.1529-8817.2005.00124.x
Flöder, S., Urabe, J., and Kawabata, Z. (2002). The influence of fluctuating light intensities on species composition and diversity of natural phytoplankton communities. Oecologia 133, 395–401. doi: 10.1007/s00442-002-1048-8
Guidi-Rontani, C., Maheswari, U., Jabbari, K., and Bowler, C. (2010). Comparative ecophysiology and genomics of the toxic unicellular alga Fibrocapsa japonica. New Phytol. 185, 446–458. doi: 10.1111/j.1469-8137.2009.03074.x
Guillard, R. R. L. (1975). “Culture of phytoplankton for feeding marine invertebrates,” in Culture of Marine Invertebrate Animals, eds W. L. Smith and M. H. Chanley (New York, NY: Plenum Publishing), 29–60.
Guillard, R. R. L., and Ryther, J. H. (1962). Studies of marine planktonic diatoms. I. Cyclotella nana Hustedt, and Detonula confervacea (Cleve) Gran. Can. J. Microbiol. 8, 229–239. doi: 10.1139/m62-029
Guislain, A., Beisner, B. E., and Kohler, J. (2019). Variation in species light acquisition traits under fluctuating light regimes: implications for non-equilibrium coexistence. OIKOS 128, 716–728. doi: 10.1111/oik.05297
Heidenreich, K. M., and Richardson, T. L. (2020). Photopigment, absorption, and growth responses of marine cryptophytes to varying spectral irradiance. J. Phycol. 56, 507–520. doi: 10.1111/jpy.12962
Hickman, A. E., Holligan, P. M., Moore, C. M., Sharples, J., Krivtsov, V., and Palmer, M. R. (2009). Distribution and chromatic adaptation of phytoplankton within a shelf sea thermocline. Limnol. Oceanogr. 54, 525–536. doi: 10.4319/lo.2009.54.2.0525
Hillebrand, H., Dürselen, C. D., Kirschtel, D., Pollingher, U., and Zohary, T. (1999). Biovolume calculation for pelagic and benthic microalgae. J. Phycol. 35, 403–424. doi: 10.1046/j.1529-8817.1999.3520403.x
Holtrop, T., Huisman, J., Stomp, M., Biersteker, L., Aerts, J., Grébert, T., et al. (2021). Vibrational modes of water predict spectral niches for photosynthesis in lakes and oceans. Nat. Ecol. Evol. 5, 55–66. doi: 10.1038/s41559-020-01330-x
Huisman, J., and Weissing, F. J. (1994). LIGHT-LIMITED GROWTH AND COMPETITION FOR LIGHT IN WELL-MIXED AQUATIC ENVIRONMENTS – AN ELEMENTARY MODEL. Ecology 75, 507–520. doi: 10.2307/1939554
Kirk, J. T. O. (2011). Light and Photosynthesis in Aquatic Ecosystems. Cambridge: Cambridge University Press.
Latsos, C., van Houcke, J., Blommaert, L., Verbeeke, G. P., Kromkamp, J., and Timmermans, K. R. (2021). Effect of light quality and quantity on productivity and phycoerythrin concentration in the cryptophyte Rhodomonas sp. J. Appl. Phycol. 33, 729–741. doi: 10.1007/s10811-020-02338-3
Lawrenz, E., and Richardson, T. L. (2017). Differential effects of changes in spectral irradiance on photoacclimation, primary productivity and growth in Rhodomonas salina (Cryptophyceae) and Skeletonema costatum (Bacillariophyceae) in simulated blackwater environments. J. Phycol. 53, 1241–1254. doi: 10.1111/jpy.12578
Lebret, K., Langenheder, S., Colinas, N., Ostman, O., and Lindstrom, E. S. (2018). Increased water colour affects freshwater plankton communities in a mesocosm study. Aquat. Microb. Ecol. 81, 1–17. doi: 10.3354/ame01858
Leech, D. M., Pollard, A. I., Labou, S. G., and Hampton, S. E. (2018). Fewer blue lakes and more murky lakes across the continental US: implications for planktonic food webs. Limnol. Oceanogr. 63, 2661–2680. doi: 10.1002/lno.10967
Litchman, E. (1998). Population and community responses of phytoplankton to fluctuating light. Oecologia 117, 247–257. doi: 10.1007/s004420050655
Litchman, E. (2000). Growth rates of phytoplankton under fluctuating light. Freshw. Biol. 44, 223–235. doi: 10.1046/j.1365-2427.2000.00559.x
Litchman, E. (2003). Competition and coexistence of phytoplankton under fluctuating light: experiments with two cyanobacteria. Aquat. Microb. Ecol. 31, 241–248. doi: 10.3354/ame031241
Luimstra, V. M., Schuurmans, J. M., Verschoor, A. M., Hellingwerf, K. J., Huisman, J., and Matthijs, H. C. P. (2018). Blue light reduces photosynthetic efficiency of cyanobacteria through an imbalance between photosystems I and II. Photosynth. Res. 138, 177–189. doi: 10.1007/s11120-018-0561-5
Luimstra, V. M., Verspagen, J. M. H., Xu, T., Schuurmans, J. M., and Huisman, J. (2020). Changes in water color shift competition between phytoplankton species with contrasting light-harvesting strategies. Ecology 101:e02951. doi: 10.1002/ecy.2951
Morel, A. (1980). In-water and remote measurements of ocean color. Boundary Layer Meteorol. 18, 177–201. doi: 10.1007/bf00121323
Mustaffa, N. I. H., Kallajoki, L., Biederbick, J., Binder, F. I., Schlenker, A., and Striebel, M. (2020). Coastal ocean darkening effects via Terrigenous DOM addition on plankton: an indoor mesocosm experiment. Front. Mar. Sci. 7:547829. doi: 10.3389/fmars.2020.547829
Nicklisch, A. (1998). Growth and light absorption of some planktonic cyanobacteria, diatoms and Chlorophyceae under simulated natural light fluctuations. J. Plankton Res. 20, 105–119. doi: 10.1093/plankt/20.1.105
Olenina, I., Hajdu, S., Edler, L., Andersson, A., Wasmund, N., Busch, S., et al. (2006). Biovolumes and size-classes of phytoplankton in the Baltic Sea. HELCOM Baltic Sea Environ. Proc. 106, 1–144.
Philippart, C. J. M., Cadée, G. C., van Raaphorst, W., and Riegman, R. (2000). Long-term phytoplankton-nutrient interactions in a shallow coastal sea: algal community structure, nutrient budgets, and denitrification potential. Limnol. Oceanogr. 45, 131–144. doi: 10.4319/lo.2000.45.1.0131
R Core Team (2020). R: A Language and Environment for Statistical Computing. Vienna: R Foundation for Statistical Computing.
Radach, G., Berg, J., and Hagmeier, E. (1990). Long-term changes of the annual cycles of meteorological, hydrographic, nutrient and phytoplankton time series at Helgoland and at LV ELBE 1 in the German Bight. Cont. Shelf Res. 10, 305–328. doi: 10.1016/0278-4343(90)90054-P
Richerson, P., Armstrong, R., and Goldman, C. R. (1970). Contemporaneous disequilibrium, a new hypothesis to explain the “Paradox of the Plankton”. Proc. Natl. Acad. Sci. U.S.A. 67, 1710–1714. doi: 10.1073/pnas.67.4.1710
Roy, S., Llewellyn, C. A., Egeland, E. S., and Johnsen, G. (2011). Phytoplankton Pigments: Characterization, Chemotaxonomy, and Applications in Oceanography. Cambridge: Cambridge University Press.
Saros, J. E., Stone, J. R., Pederson, G. T., Slemmons, K. E., Spanbauer, T., Schliep, A., et al. (2012). Climate-induced changes in lake ecosystem structure inferred from coupled neo- and paleoecological approaches. Ecology 93, 2155–2164. doi: 10.1890/11-2218.1
Scheffer, M., Rinaldi, S., Gragnani, A., Mur, L. R., and van Nes, E. H. (1997). On the dominance of filamentous cyanobacteria in shallow, Turbid Lakes. Ecology 78, 272–282.
Schulze, P. S. C., Guerra, R., Pereira, H., Schuler, L. M., and Varela, J. C. S. (2017). Flashing LEDs for microalgal production. Trends Biotechnol. 35, 1088–1101. doi: 10.1016/j.tibtech.2017.07.011
Schwaderer, A. S., Yoshiyama, K., de Tezanos Pinto, P., Swenson, N. G., Klausmeier, C. A., and Litchman, E. (2011). Eco-evolutionary differences in light utilization traits and distributions of freshwater phytoplankton. Limnol. Oceanogr. 56, 589–598. doi: 10.4319/lo.2011.56.2.0589
Somavilla, R., Gonzalez-Pola, C., and Fernandez-Diaz, J. (2017). The warmer the ocean surface, the shallower the mixed layer. How much of this is true? J. Geophys. Res. Oceans 122, 7698–7716. doi: 10.1002/2017JC013125
Stomp, M., Huisman, J., de Jongh, F., Veraart, A. J., Gerla, D., Rijkeboer, M., et al. (2004). Adaptive divergence in pigment composition promotes phytoplankton biodiversity. Nature 432, 104–107. doi: 10.1038/nature03044
Stomp, M., Huisman, J., Stal, L. J., and Matthijs, H. C. P. (2007a). Colorful niches of phototrophic microorganisms shaped by vibrations of the water molecule. ISME J. 1, 271–282. doi: 10.1038/ismej.2007.59
Stomp, M., Huisman, J., Voros, L., Pick, F. R., Laamanen, M., Haverkamp, T., et al. (2007b). Colourful coexistence of red and green picocyanobacteria in lakes and seas. Ecol. Lett. 10, 290–298. doi: 10.1111/j.1461-0248.2007.01026.x
Stomp, M., van Dijk, M. A., van Overzee, H. M. J., Wortel, M. T., Sigon, C. A. M., Egas, M., et al. (2008). The timescale of phenotypic plasticity and its impact on competition in fluctuating environments. Am. Nat. 172, E169–E185. doi: 10.1086/591680
Sydeman, W. J., Garcia-Reyes, M., Schoeman, D. S., Rykaczewski, R. R., Thompson, S. A., Black, B. A., et al. (2014). Climate change. Climate change and wind intensification in coastal upwelling ecosystems. Science 345, 77–80. doi: 10.1126/science.1251635
Tan, X., Zhang, D. F., Duan, Z. P., Parajuli, K., and Hu, J. Y. (2020). Effects of light color on interspecific competition between Microcystis aeruginosa and Chlorella pyrenoidosa in batch experiment. Environ. Sci. Pollut. Res. 27, 344–352. doi: 10.1007/s11356-019-06650-5
Tandeau de Marsac, N. (1977). Occurrence and nature of chromatic adaptation in cyanobacteria. J. Bacteriol. 130, 82–91. doi: 10.1128/jb.130.1.82-91.1977
Thrane, J. E., Hessen, D. O., and Andersen, T. (2014). The absorption of light in lakes: negative impact of dissolved organic carbon on primary productivity. Ecosystems 17, 1040–1052. doi: 10.1007/s10021-014-9776-2
Tilman, D., Kilham, S. S., and Kilham, P. (1982). Phytoplankton community ecology – The role of limiting nutrients. Annu. Rev. Ecol. Syst. 13, 349–372. doi: 10.1146/annurev.es.13.110182.002025
Wall, D., and Briand, F. (1979). Response of lake phytoplankton communities to in situ manipulations of light intensity and colour. J. Plankton Res. 1, 103–112. doi: 10.1093/plankt/1.1.103
Walsh, P., and Legendre, L. (1983). Photosynthesis of natural phytoplankton under high frequency light fluctuations simulating those induced by sea surface waves. Limnol. Oceanogr. 28, 688–697. doi: 10.4319/lo.1983.28.4.0688
Keywords: phytoplankton, light spectrum, fluctuations, frequency, PAR, growth rate, carrying capacity, competition
Citation: Neun S, Hintz NH, Schröder M and Striebel M (2022) Phytoplankton Response to Different Light Colors and Fluctuation Frequencies. Front. Mar. Sci. 9:824624. doi: 10.3389/fmars.2022.824624
Received: 29 November 2021; Accepted: 09 February 2022;
Published: 25 March 2022.
Edited by:
Christopher Edward Cornwall, Victoria University of Wellington, New ZealandReviewed by:
Douglas Andrew Campbell, Mount Allison University, CanadaC.-Elisa Schaum, University of Hamburg, Germany
Martina Andrea Doblin, University of Technology Sydney, Australia
Copyright © 2022 Neun, Hintz, Schröder and Striebel. This is an open-access article distributed under the terms of the Creative Commons Attribution License (CC BY). The use, distribution or reproduction in other forums is permitted, provided the original author(s) and the copyright owner(s) are credited and that the original publication in this journal is cited, in accordance with accepted academic practice. No use, distribution or reproduction is permitted which does not comply with these terms.
*Correspondence: Nils Hendrik Hintz, bmlscy5oZW5kcmlrLmhpbnR6QHVvbC5kZQ==
†These authors have contributed equally to this work and share first authorship