
94% of researchers rate our articles as excellent or good
Learn more about the work of our research integrity team to safeguard the quality of each article we publish.
Find out more
ORIGINAL RESEARCH article
Front. Mar. Sci., 26 April 2022
Sec. Physical Oceanography
Volume 9 - 2022 | https://doi.org/10.3389/fmars.2022.824361
This article is part of the Research TopicPhysics and Biogeochemistry of the East Asian Marginal SeasView all 30 articles
 Go-Un Kim1
 Keunjong Lee1
 Jaeik Lee1
 Jin-Yong Jeong1
 Meehye Lee2
 Chan Joo Jang1,3
 Kyung-Ja Ha4
 SungHyun Nam5
 Jae Hoon Noh1,6
 Yong Sun Kim1,6*
Unprecedented retardation of spring water temperature rising during the 2020 pandemic year was identified in the Socheongcho Ocean Research Station within the northeastern basin of the Yellow Sea: an exceptionally high water temperature anomaly in March and a contrasted low-temperature anomaly in May. The slowest temperature evolution was principally caused by the significant increase in latent heat releases in April (117% higher than the climatology of 1982–2019). Strong northwesterly winds generated these exceptional heat fluxes associated with the dipole-like atmospheric circulation pattern over Siberia and the East Sea (Japan Sea). Besides, warm winter water facilitated the enhanced release of latent heat fluxes as a precondition. The oceanic heat redistribution partially supported the cold anomaly in the surface layer up to the middle of May through positive feedback between the low surface temperature and the active entrainment associated with tidal turbulent mixing. The resultant low temperature at the surface weakened the vertical stratification, both impeding the activation of phytoplankton’s photosynthesis albeit under the eutrophic surface layer, consequently resulting in the delayed and suppressed spring bloom during 2020. Since such extreme events are anticipated to occur more frequently under global warming, our results highlight the importance of continuously monitoring multi-disciplinary environmental conditions, climate extremes, and their impact on the Yellow Sea marine ecosystem.
The Yellow and East China Seas (YECS) are known to be the most productive marine ecosystem in the world (Belkin, 2009; Ma et al., 2019). The total primary production in the YECS provides comprehensive ecological and socioeconomic benefits as an abundant marine resource for 300 million people: biodiversity hotspots (Leal et al., 2013; Khim et al., 2021), bird habitats (Fan et al., 2021), and fishery products (Shi et al., 2020). As global warming has accelerated over the last few decades, the magnitude and frequency of extreme climate events (i.e., marine heat waves and cold surges) have increased in the YECS (Horton et al., 2015; Oliver et al., 2018; Tan and Cai, 2018; Yamaguchi et al., 2019; Yeo and Ha, 2019; Lee et al., 2020). This extraordinary environmental change could cause stressful conditions for marine biota, potentially resulting in an irreversible shift in primary production and dominant species by exterminating valuable marine organisms. Thus, attention needs to be paid to understanding which critical modulators could determine the primary production for efficient marine resource management.
Water temperature is one of the key factors concerning primary production, particularly during algal bloom’s early stage (Zhou et al., 2013; Liu et al., 2015; Wang and Gao, 2020). The water column of the YECS is vertically mixed throughout winter and until early April (Kim et al., 2018a). This weak stratification facilitates turbulent mixing associated with intense tides and waves, supplying nutrients from the bottom into the euphotic layer, indicating a eutrophic status of the YECS until the start of the spring phytoplankton bloom that usually appears by late April. Water temperature in the cold season goes down below 8°C; however, the year-to-year winter/spring temperatures could be modulated by large-scale atmospheric circulations such as the Siberian High, the North Pacific Oscillation, the Pacific Decadal Oscillation, the Arctic Oscillation, and a local branch of the Kuroshio Current (Yeh and Kim, 2010; Zhang et al., 2010; Park et al., 2015; Cai et al., 2017; Kim et al., 2018b), through the air-sea heat exchange and oceanic advection in the YECS (Liu et al., 2014; Ha et al., 2019; Yeo and Nam, 2020). As shortwave radiation increases in spring, the water starts to warm up and stratify, thereby triggering the active growth of phytoplanktons by holding nutrients within the euphotic layer (Liu et al., 2015). The observed winter water temperatures from January to March of 2020 were exceptionally higher by 1.2°C than those of the years 2017 to 2019 in the northeastern Yellow Sea, as estimated by the Socheongcho Ocean Research Station (S-ORS; see Figure 1A for its location); the sea surface temperature (SST) was 0.8°C higher than during the normal years of 1982 to 2019 according to the OISSTv2 dataset (not shown). This high temperature anomaly in the cold season allows us to project the early onset of the spring bloom with a considerable magnitude and, consequently, an increase in the net primary production of the YECS.
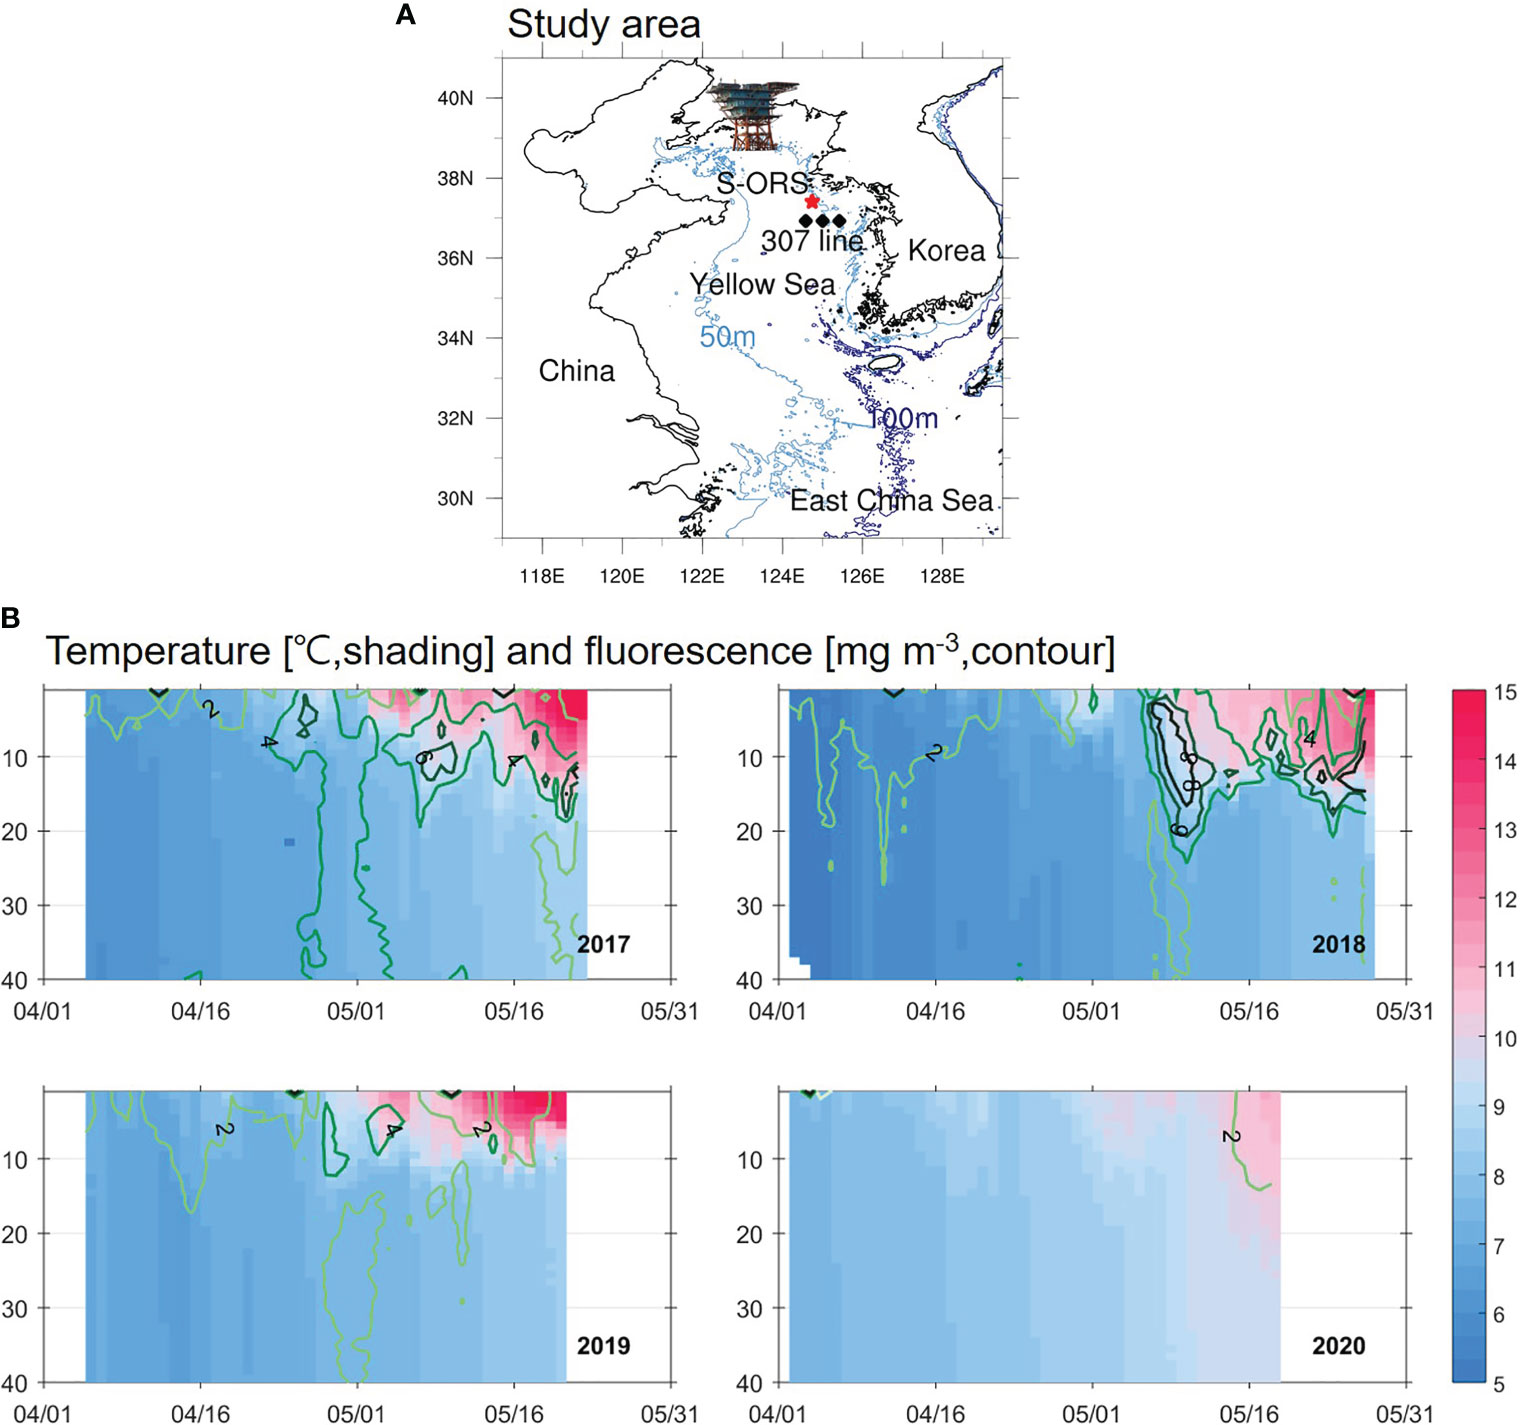
Figure 1 (A) Map of the monitoring site used in this study: the Socheongcho Ocean Research Station (S-ORS; star marker), the nutrient observation stations on the 307 line from the Korea Oceanographic Data Center (diamonds) with a bathymetry of 50 and 100 m. (B) Time-depth diagram of temperature (°C, shading) and fluorescence (mg m-3, contour) during the spring of 2017–2020 from the S-ORS. The fluorescence intervals are 2 mg m-3.
Fine dust is an additional source of nutrients for phytoplankton growth (Blain et al., 2004; Kim et al., 2011; Boreddy and Kawamura, 2015; Moon et al., 2021). Fine dust events, also known as the yellow dust, are common in spring over the downstream of China—the YECS and the Korean Peninsula—via the prevalent northwesterly winds. During the period 1980 to 2016, atmospheric nitrogen depositions emitted from northeast Asia increased in the Yellow Sea, resulting in an increase in nitrogen concentrations (Kim et al., 2011; Moon et al., 2021). These increases appear to have contributed to enhanced net primary productivity over the last four decades (Park et al., 2019). After the outbreak of the COVID-19 pandemic in December 2019, the Chinese government decided to put in place a total lockdown by halting daily life and industry to suppress the spread of the Coronavirus during the spring of 2020. This lockdown continued for around three months, from 23 January to 7 April, leading to a significant decline in air pollutant concentrations (Fan et al., 2020; Timmermann et al., 2020; Lee et al., 2021) and exceptionally sunny spring. For instance, fine dust concentrations decreased by 20% from 31.5 μg m-3 in 2016–2019 to 25.6 μg m-3 in 2020 in Seoul, the capital city of Korea (Han and Hong, 2020). This reduced fine dust might result in decreased nutrients supplied to the Yellow Sea, which, in turn, might presumably render a suppressed and delayed spring bloom.
How can we explain the counteracting effects of anomalously warm water during the cold season and the pandemic-related reduction of fine dust on the spring bloom in the Yellow Sea? We use observed time series from the air-sea monitoring system in the S-ORS, the northernmost station in the tower-type interdisciplinary monitoring network of the Korean ocean research stations in the YECS (Kim et al., 2019). This study finds that record-breaking slow warming of water happened in the spring of 2020 throughout the northeastern basin of the Yellow Sea. This low-temperature anomaly within the euphotic layer and the resultant homogenous water column resulted in a delayed and weaker spring bloom. The fine dust inferred from the S-ORS’s PM2.5 concentration barely decreased from March to April 2020 compared to the normal years 2017–2019. This unexpected change in the PM2.5 concentration seems to have had a marginal impact on the chlorophyll-a concentrations under the eutrophic water conditions of the Yellow Sea.
Temperature and chlorophyll profilings for more than six weeks from April to May 2017–2020 were carried out twice a day by considering a tidal period using the SBE 19 plus v2 Conductivity-Temperature-Depth (CTD) on the S-ORS platform, located in the northeastern basin of the Yellow Sea around 50 km off the Korea peninsula (37° 25´ 23.3 N, 124° 44´ 16.9˝E). In addition, the water temperature was monitored every 10 minutes at a fixed level of 5 m from a moored CTD array using an SBE 37-IM CTD sensor. Hereafter, we refer to this time series as the SST. The essential atmospheric variables were monitored via a meteorological tower around 15 m in height located on the roof deck of the S-ORS, including wind, relative humidity, shortwave radiation, air temperature, and air pressure. Besides, air particle sensors observed the PM2.5 concentration on the roof deck from 2017. More detailed information about the S-ORS facilities, instruments, and measurements can be found in Kim et al. (2019). These observation data are available on request from the Korea Ocean Research Station project website https://kors.kiost.ac.kr and the global data center in the OceanSITES network website https://dods.ndbc.noaa.gov/thredds/catalog/oceansites/catalog.html.
This study uses monthly mean datasets for the period 1982 to 2020: the gridded SST from the National Oceanic and Atmospheric Administration’s Optimal Interpolation Sea Surface Temperature version 2 (OISSTv2, obtained from https://psl.noaa.gov/data/gridded/data.noaa.oisst.v2.highres.html; Reynolds et al., 2007) and the atmospheric fields, including heat fluxes, a 10 m wind vector, and a 500-hPa geopotential height from the European Centre for Medium-Range Weather Forecasts Reanalysis 5 (ERA5, available from https://cds.climate.copernicus.eu; Hersbach et al., 2020). All the reanalysis datasets are on a 0.25° × 0.25° longitude-latitude grid. The statistical analyses were performed during the boreal spring season from March to May. The 2020 anomaly for each variable was calculated by subtracting the monthly climatology from 1982 to 2019. The statistical significance for the 2020 anomalies was determined by the criterion above and below one standard deviation from the monthly climatology. This study defines three important terms: 1) spring SST evolution as May minus March SST over the northeastern Yellow Sea (36.42°–38.42°N, 123.74°–125.74°E); 2) the winter SST index as January to March—the normalized time series of the cold months’ mean SST anomaly averaged over the northeastern Yellow Sea; 3) the dipole index as the normalized time series of geopotential height anomalies averaged over the East Sea (also referred to as the Japan Sea) (25°–40°N, 125°–145°E) minus Siberia (50°–70°N, 80°–120°E). A negative value in the dipole index means a stronger geopotential height anomaly (or high-pressure anomaly) over Siberia than the East Sea.
The SST variations in the northeastern Yellow Sea are marginally influenced by oceanic heat transport associated with a flow that branches out from the Kuroshio Current (Kim et al., 2018b). This characteristic feature allows us to take advantage of the Generalized Ocean Turbulence Model (GOTM) to analyze dynamical ocean responses to atmospheric forcing and initial conditions (Burchard and Baumert, 1995). Our one-dimensional model has 101 vertical levels with a 0.5 m interval (depth of 50 m). The simulated results and main findings estimated from the 0.5 m vertical resolution were robust compared to those using the finer or coarser vertical resolution (i.e., 0.25–1 m), indicating that this vertical resolution is sufficient to resolve turbulent mixing and vertical heat entrainment in the Yellow Sea. The turbulent mixing intensity was calculated based on a k-epsilon turbulence closure scheme with the dynamic dissipation rate equation for a turbulent length scale. The numerical experiments were initialized with water temperature and salinity profiles and forced with meteorological background fields (i.e., wind, relative humidity, shortwave radiation, air temperature, and air pressure) obtained from the S-ORS to identify the effects of the oceanic and atmospheric boundary conditions on the spring temperature evolution process. The initial water temperature was assigned a specific value throughout the vertical column to reflect a fully mixed condition during winter. Since the water density and stratification are principally determined by the water temperature in the Yellow Sea (Kim et al., 2018a), this study allocated an initial salinity profile of 32 for all model experiments. Based on the Oregon State University (OSU)’s tidal inversion software TPX09, the tidal model driver generated external pressure gradients for the tidal formation in the experiments (Egbert and Erofeeva, 2002); this study assigned four dominant tidal constituents. Each experiment ran for about 60 days with a one-hour time step.
This study designed four experiments: CTRL, ALL2020, WWT2020, and ATM2020 (Table 1). The CTRL experiment represented a typical situation during normal years by assigning the 2017−2019 mean (or climatological) atmospheric fields and a winter water temperature of 5.6°C as the boundary and initial conditions, respectively. The ALL2020 was an experiment to simulate the temperature evolution for spring 2020 by prescribing the observed atmospheric fields and an initial water temperature of 7.6°C. The effect of the winter water on the temperature evolution could be estimated by using the difference between the ALL2020 and ATM2020, the latter of which was simulated using the 2020 atmospheric fields and 2017−2019 mean winter water temperature. Similarly, the difference between the ALL2020 and WWT2020 indicated the effects of the atmospheric state on the 2020 spring temperature evolution.
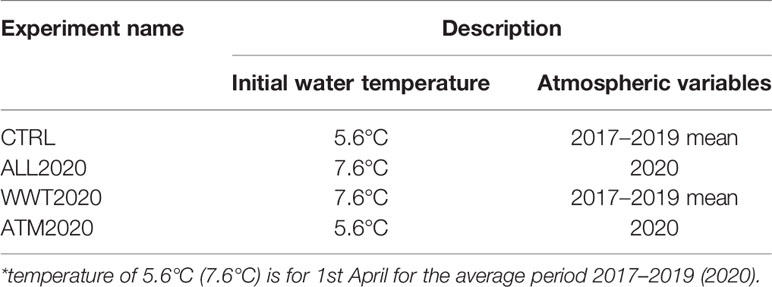
Table 1 List of numerical experiments.
The CTD profiling observations from the S-ORS revealed a low concentration of chlorophyll fluorescence, which barely increased to 2 mg m-3 in the middle of May 2020 (Figure 1B). Further, its peak time was delayed by more than a month relative to the normal years of 2017–2019. It is an analogy to the MODIS satellite data of negative anomalies chlorophyll-a concentration distribution from March to May 2020 in the Yellow Sea, with a substantial one in April (not shown). The low chlorophyll concentration at the S-ORS seems to have been closely related to the slow evolution of water temperature and stratification during spring 2020 (Figure 1B). Even though the water temperature during the winter of 2020 was around 1.2°C higher than during the normal years, the surface temperature only increased to 11.2°C by the end of May 2020, around 1°C lower than the normal years. This relative cold water and weak stratification probably prevented phytoplankton from germinating and undergoing active photosynthesis in spring (Zhou et al., 2013; Liu et al., 2015).
Figure 2 shows the spring SST evolution throughout the northeastern Yellow Sea for 1982−2020 from the OISSTv2 and 2017−2020 from the S-ORS. The mean SST warming in spring was 3.3°C per month with a standard deviation of 0.4°C per month for 1982−2019. The S-ORS SST data exhibited a similar rate to the reanalysis data for the period 2017−2020. Surprisingly, the SST warming during the spring of 2020 was the lowest for the last four decades: 2.4°C per month, less than two standard deviations from the climatology. The spring SST warming rate based on the observations from the S-ORS was 2.0°C per month, even lower than from the OISSTv2. This result indicates that the temperature evolution during spring 2020 was an unprecedented, record-breaking event for the last four decades. This result is, therefore, essential to understanding the dynamics of how the surface temperature evolution slowed down during spring 2020 to assess the implications of water temperature on phytoplankton growth and, thus, on the net primary production in the northeastern Yellow Sea. The relationship between the SST evolution and the winter SST and the April dipole indices (Figure 2) will also be described below in sections 3.2 and 3.3. These dynamics could be applied to shed light on the future climate of the Yellow Sea with global warming.
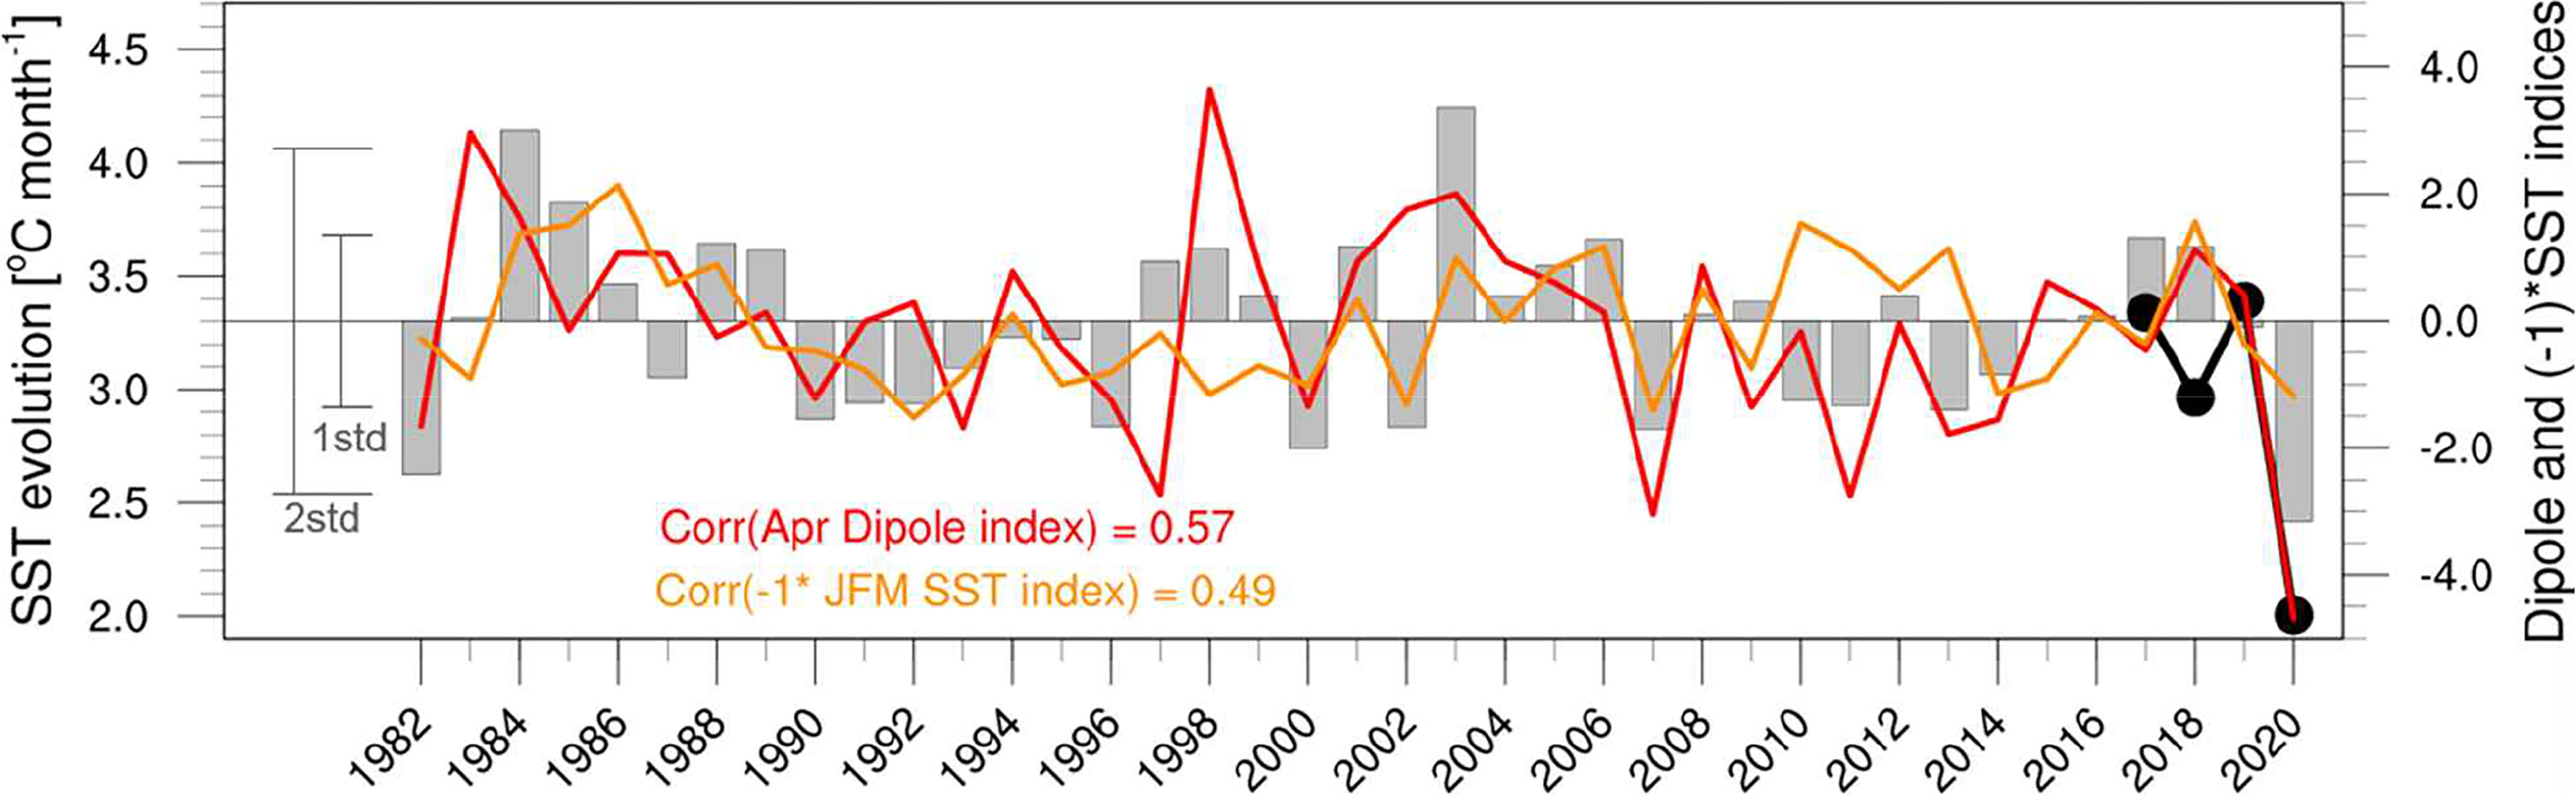
Figure 2 Time series of the SST evolution between March and May from the S-ORS (solid black line with circle markers) and OISSTv2 (gray bars) averaged over the northeastern Yellow Sea [36.42°–38.42°N, 123.74°–125.74°E]. The solid red and orange lines indicate the dipole index and −1xJM SST index, respectively. The one and two standard deviations for the climatological period 1982–2019 are shown in the plot.
A remarkable atmospheric change during spring 2020 appeared in the latent heat flux, as we will discuss below and in section 3.3. The strength of the winds and the temperature differences between the seawater and the air determined this flux. Therefore, we designed four numerical experiments to estimate the partial contribution of the water temperature and atmospheric fields to the spring temperature evolution (see Table 1 and section 2.3 for the numerical experiments).
As expected, the ALL2020 experiment shows the slowest warming in the spring SST, i.e., 1.7°C per month, while the SST warming rate is 3.5°C per month for the CTRL experiment (Figure 3A). These one-dimensional numerical experiments do not include oceanic advection. Nevertheless, as denoted by the solid/dashed lines in Figure 3A for the simulated/observed SSTs, the temperature evolution patterns from these two experiments are almost the same as those of the observed S-ORS temperatures. This result indicates the marginal role of oceanic heat advection in modulating the water temperature in the northeastern basin of the Yellow Sea, consistent with Kim et al. (2018b). The ALL2020 and CTRL experiments reflect that unique atmospheric forcing and initial temperature profile during spring 2020 together contributed to a warming rate difference of 1.8°C per month (= 3.5 minuses 1.7°C). The ATM2020 experiment renders a warming rate of 2.1°C per month, 1.4°C per month lower than one from the CTRL experiment. This drop in the warming rate suggests that 2020 atmospheric forcing accounts for up to 77.8% (1.4/1.8×100) of the extremely slow spring temperature evolution during spring 2020 (Figure 3A). This estimation, in turn, suggests that the warm winter water explains at least 22.2% of the 2020 spring temperature evolution. On the other hand, the WWT2020 experiment renders a warming rate of 2.6°C per month, which is 0.9°C per month lower than the one from the CTRL experiment, suggesting that the initial water temperature accounts for up to 50% (0.9/1.8×100) of the observed temperature evolution during spring 2020 (Figure 3A). Intriguingly, the substantial outgoing fluxes from the ocean in April (i.e., the negative latent heats in Figure 3B) appear to be associated with two strong cold surge events only for the experiments simulated with 2020 atmospheric forcing, that is, ALL2020 and ATM2020. When comparing the latent heat simulated by the ALL2020 experiment with that of ATM2020, the higher initial water temperature makes it possible to release the latent heat into the atmosphere more efficiently (Figure 3B). Collectively, the atmospheric forcing and winter water temperature as initial conditions seem to contribute to the 2020 spring temperature evolution by 50% to 77.8% and 22.2% to 50%, respectively.
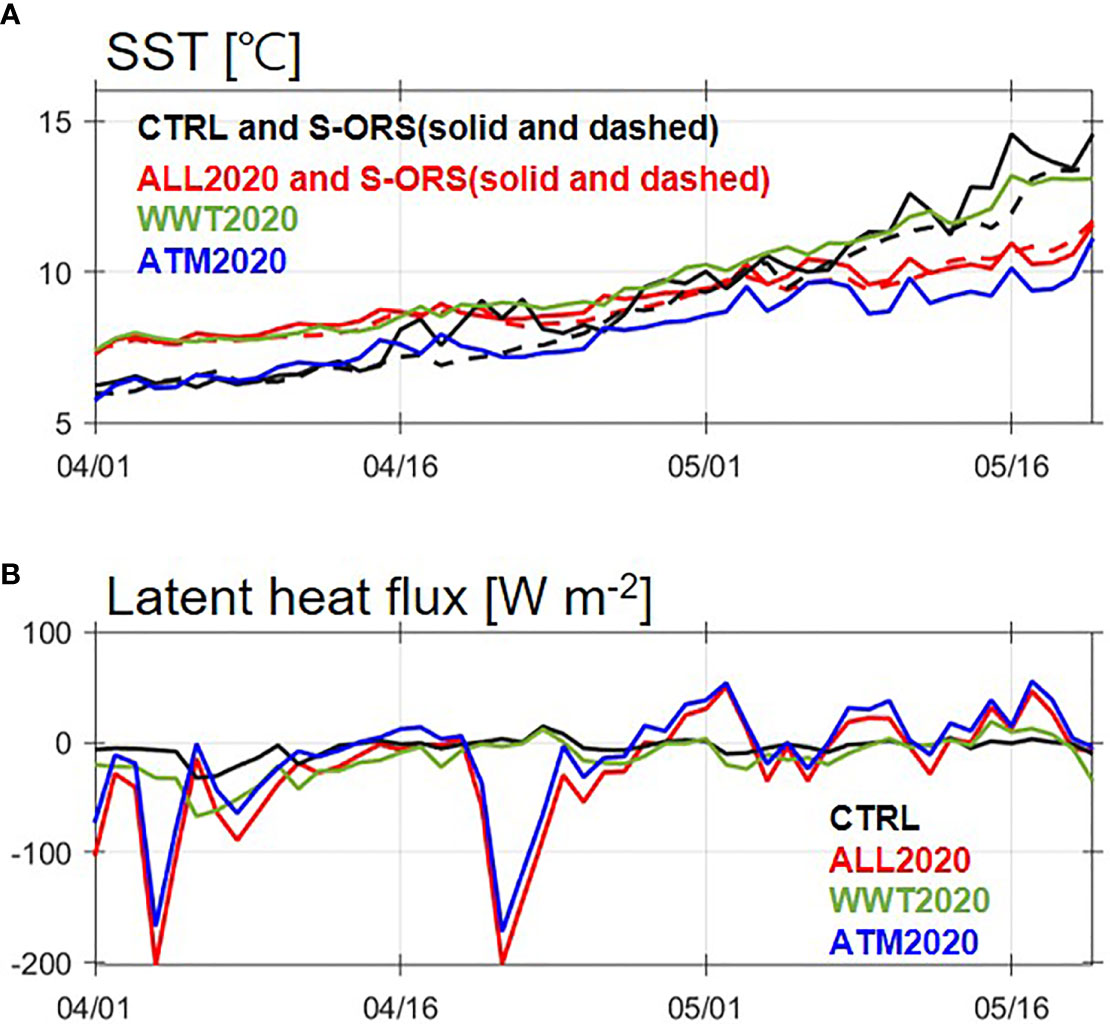
Figure 3 Time series of simulated (A) SST (°C) and (B) latent heat flux (W m-2) for the CTRL (black line), ALL2020 (red), WWT2020 (green), and ATM2020 (blue) from 1 April to 20 May. The dashed lines denote the observed SST during the period 2017–2019 and 2020 from the S-ORS.
Figure 4 also hints at a dynamic relationship between turbulent kinetic energy (TKE) and the spring evolution of the water temperature in the Yellow Sea. The CTRL and WWT2020 experiments, simulated using the normal year’s atmospheric forcing, project weaker TKE and higher temperatures within the upper part of the water, thereby rendering enhanced stratification because of the reduced entrainment of the surface heat to the lower layer of the water (Figures 4A, C). In contrast, the enhanced TKE, related to the cold surge events for the ALL2020 and ATM2020, transported heat efficiently from the surface to the bottom layer (Figures 4B, D). As shown in Figure 4F, the difference in the vertical water temperature between the ALL2020 and WWT2020 is large, with an anomalously cold surface of more than 2.5°C and a high bottom temperature up to 0.5°C by middle May, tending to form a vertically homogeneous temperature. A similar but less prominent vertical temperature gradient can be seen in the difference in the water temperature between the ALL2020 and ATM2020, which shows the effects of wintertime water temperature as an initial condition (Figure 4G).
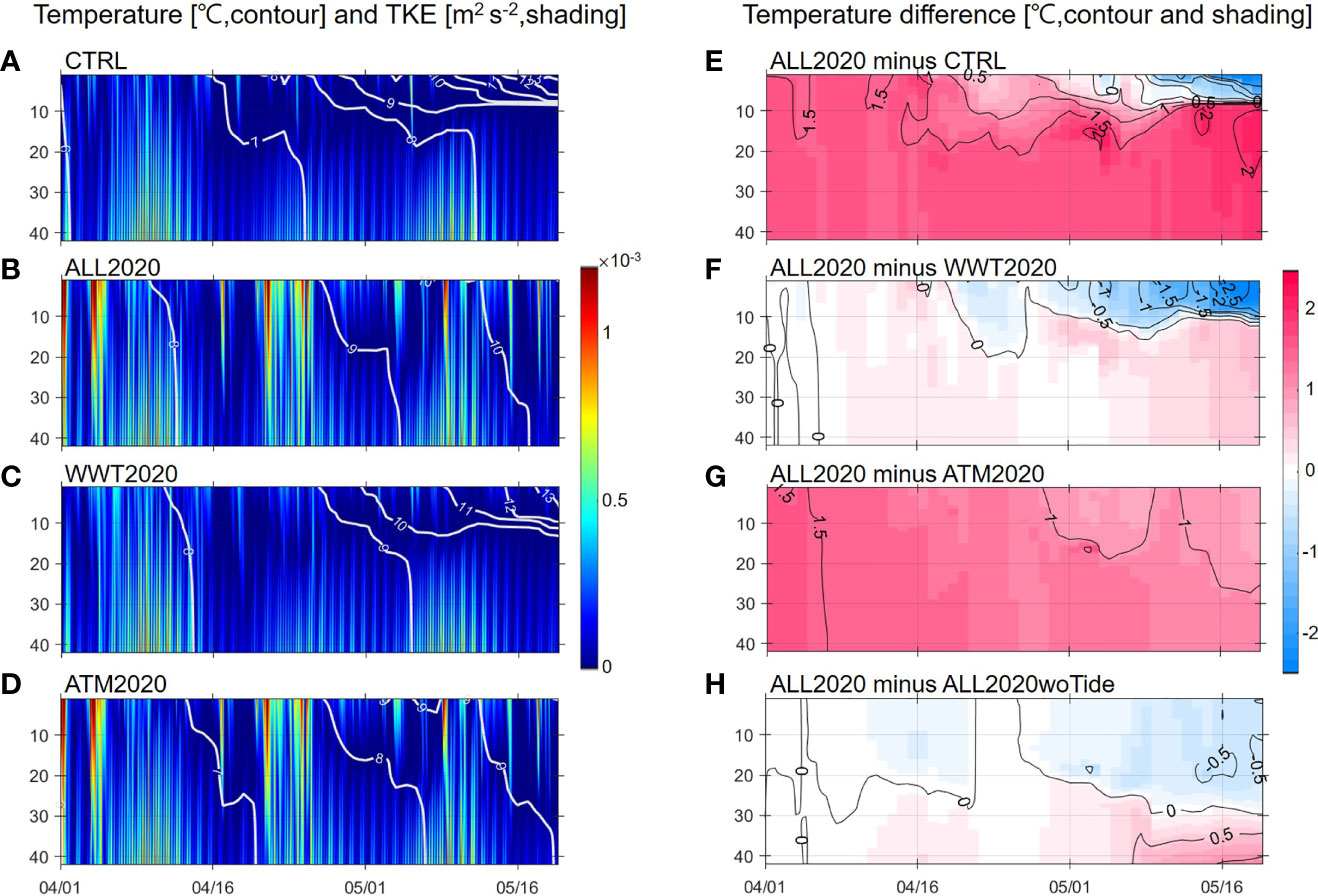
Figure 4 Time-depth diagram of temperature (°C, contour) and turbulent kinetic energy (m2 s-2, shading) simulated by the (A) CTRL, (B) ALL2020, (C) WWT2020, and (D) ATM2020 experiments for the period 1 April–20 May. Impact of (E) all factors (atmospheric forcing+initial water temperature+tidal forcing), (F) atmospheric forcing, (G) initial water temperature, and (H) tidal forcing on the spring temperature evolution, which was estimated by the temperature differences between the ALL2020 and CTRL, the ALL and WWT2020, the ALL2020 and ATM2020, and the ALL2020 and ALL2020woTide, respectively.
Strong TKE at the bottom appeared in all experiments, implying the indispensable heat exchanges between the surface and subsurface layers associated with tidal mixing (Figures 4A–D). To identify the role of heat entrainment associated with tidal forcing, we performed an extra experiment named ALL2020woTide (i.e., turn off the tidal forcing in ALL2020). The temperature difference between ALL2020 and ALL2020woTide experiments showed that the temperature changes went to about 0.4°C cooling at the upper layer compared to one (2.4°C) for the experiment between ALL2020 and CTRL, and more than 1.0°C warming in the lower layer by the middle of May associated with tidal mixing (Figure 4H). Given that heat losses from the sea surface result in a surface cooling anomaly such as in the 2020 spring case (Figure 4E), this cold anomaly tends to form a relatively homogeneous water column, which could facilitate TKEs reaching up to the surface layer across a weak thermocline in association with vigorous tidal mixing. In other words, the active entrainment redistributes surface heat into the subsurface layer, inducing an additional cold anomaly in the surface and also a warm anomaly in the subsurface layer; further, it weakens stratification and enhances entrainment. This positive feedback between surface temperature and turbulent entrainment, together with atmospheric forcing, might support why the low SST anomaly continued up to the end of May.
As inferred from Liu et al. (2015), the cold water in the upper layer could hinder the diatom’s and dinoflagellate’s germination, which are major phytoplankton, in the northeastern Yellow Sea during the spring bloom period (Jin et al., 2013; Fu et al., 2021). Besides, the weak stratification likely inhibits the accumulation of the chlorophyll-a concentration in the euphotic layer, resulting in weak and late spring blooms.
Figure 5 shows the spring evolution of the spatial fields of SST, latent heat, 10 m winds, and 500-hPa geopotential height anomalies from March to May 2020. The climatological SSTs over the Yellow Sea gradually increased from March to May, along with reduced latent heat releases into the air (Figures 5A–C). The 2020 SST anomalies over the northeastern basin of the Yellow Sea changed from a positive anomaly in March to a negative one in May. Accompanying a robust northwesterly wind anomaly over the Yellow Sea, the latent heat exhibited a significant negative anomaly of –26.4 W/m2 in April 2020—about a 117% increase compared to the climatology (Figures 5E, H and Table 2). This latent heat change was dominant with a similar magnitude for total heating (–21.8 W/m2), the sum of shortwave radiation (30.5 W/m2), longwave radiation (–21.3 W/m2), latent heat flux, and sensible heat flux (–4.6 W/m2) at the surface calculated from the surface net heat budget (Table 2). The anomalous shortwave radiation seemed principally compensated by instantaneous outgoing fluxes of longwave radiation due to clear skies during 2020 spring (not shown).
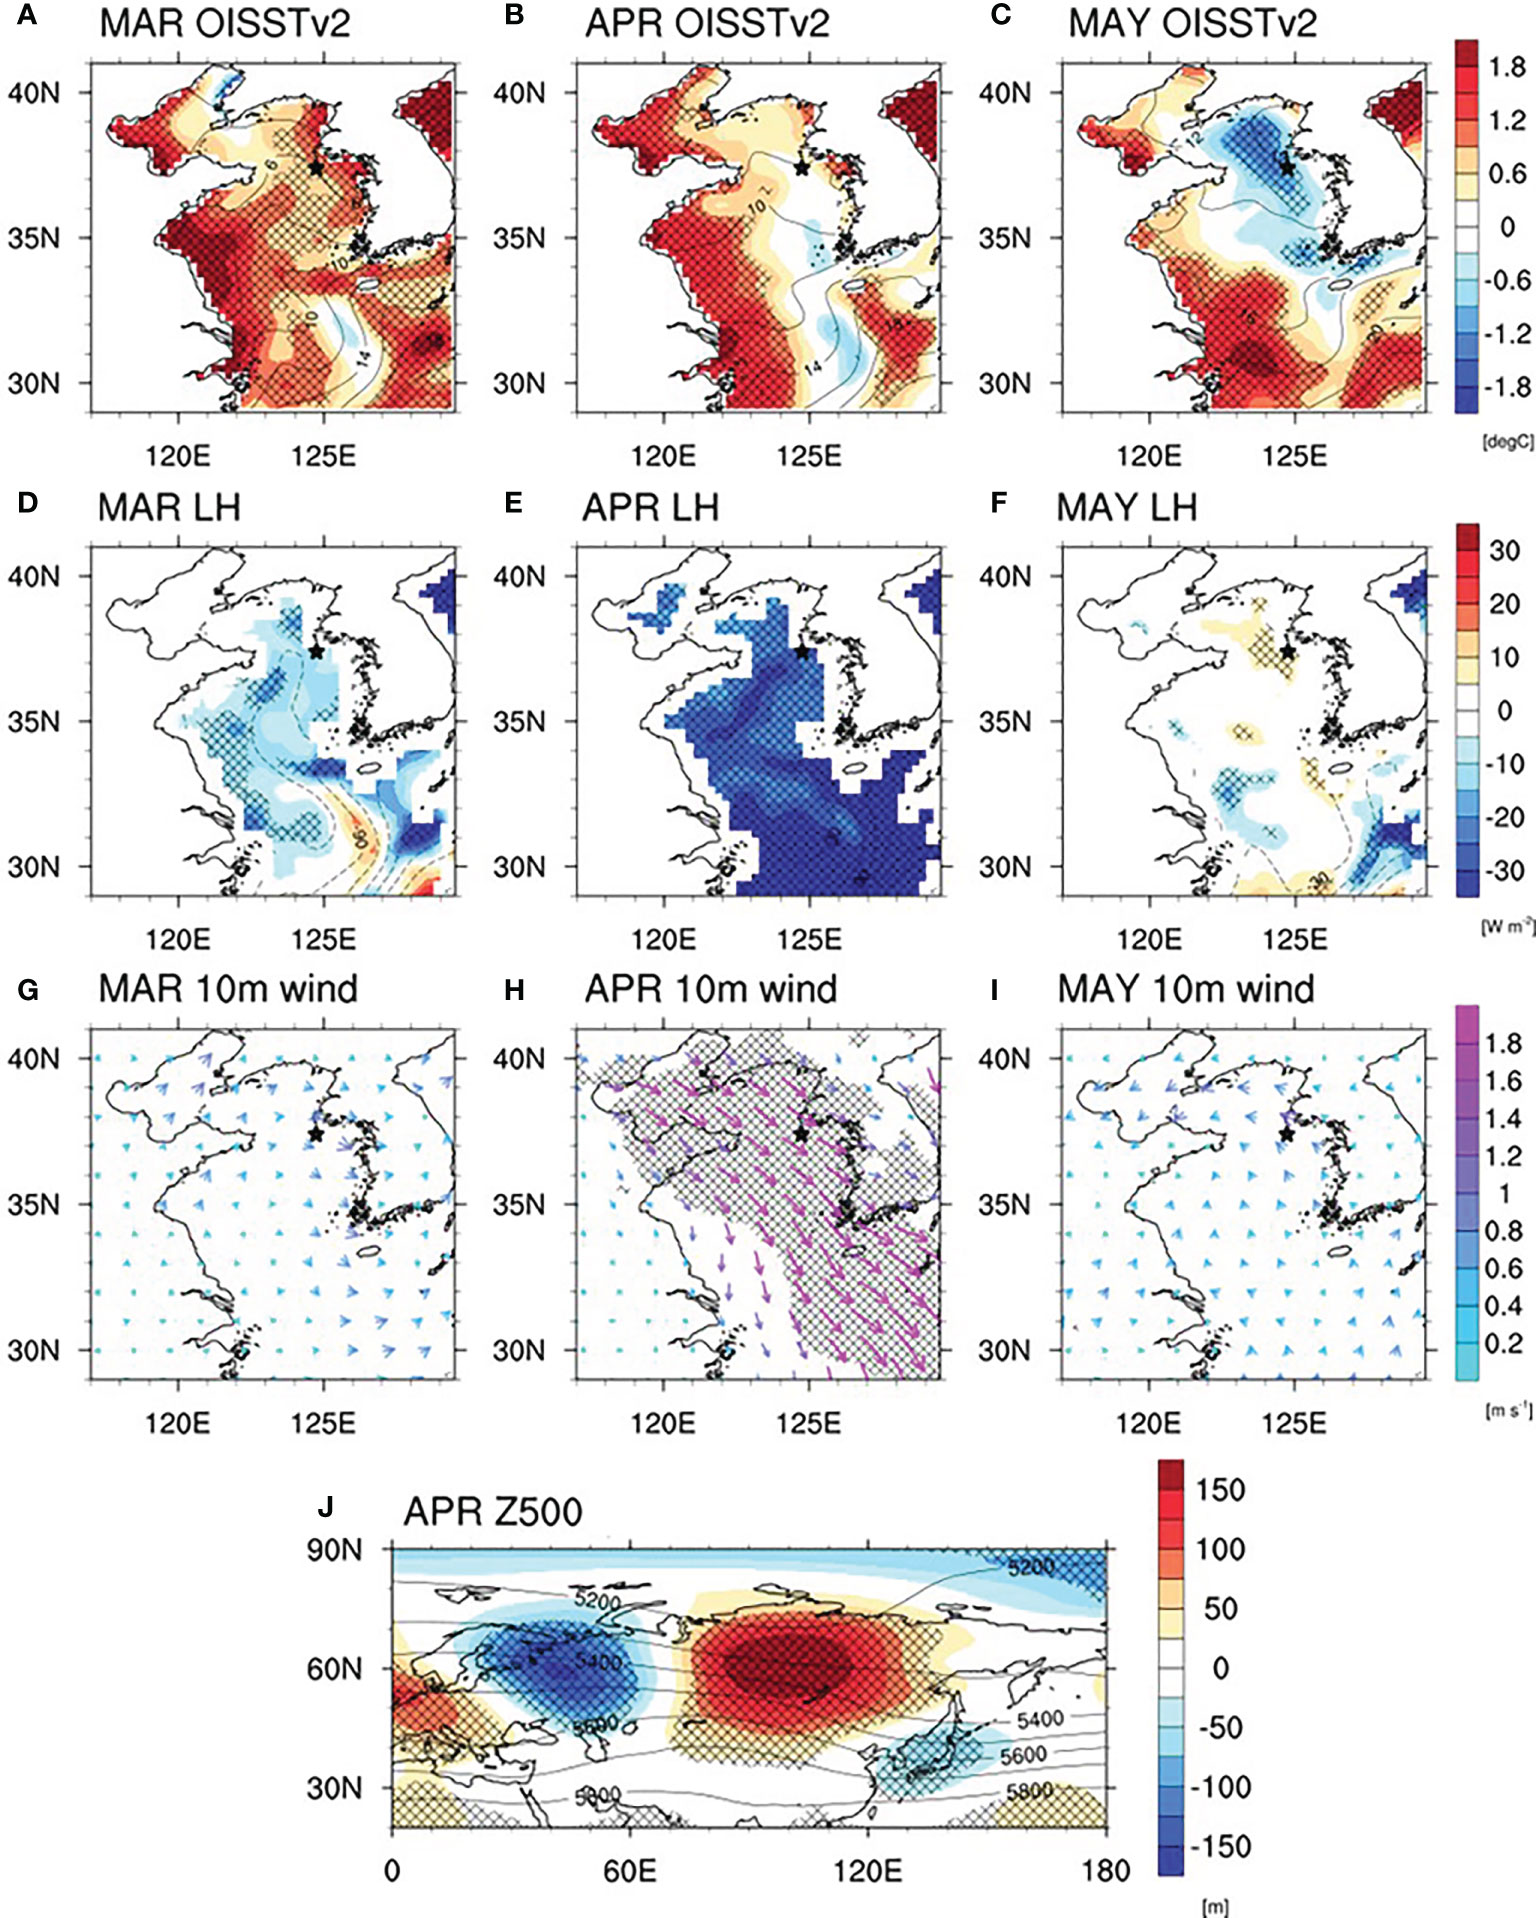
Figure 5 Spatial evolution of 2020 anomalies in (A–C) SST (°C), (D–F) latent heat flux (LH, W m-2), (G–I) 10m wind vector (m s-1), and (J) 500-hPa geopotential height (Z500, m) during the boreal spring. The contours in (A–F, J) denote the climatological fields from 1982 to 2019. The contour intervals are 2°C in (A–C), 30 W m-2 (D–F), and 100 m (J). The hatched areas in (A–J) represent the statistically significant regions at a 90% confidence level. The negative latent heat flux means heat loss from the ocean to the atmosphere (positive downward).
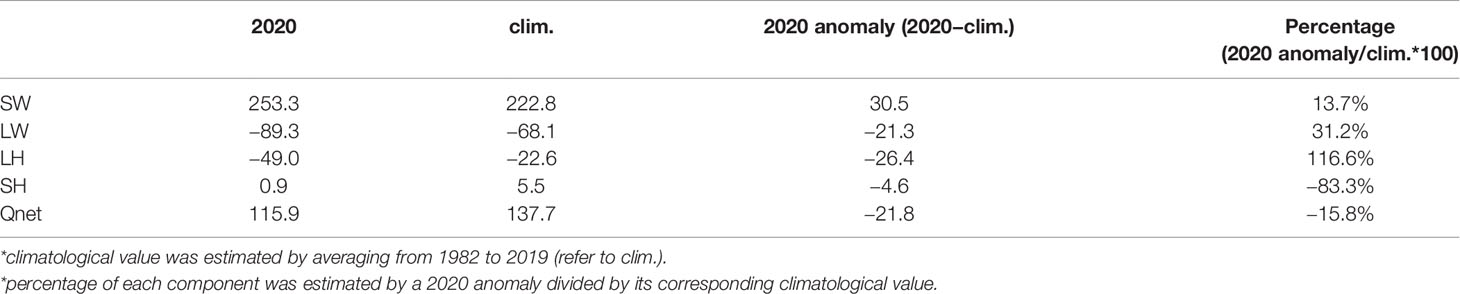
Table 2 Magnitudes, anomalies, and percentages for heat flux components and their summation (i.e., Qnet=SW+LW+LH+SH) during April over the northeastern basin of the Yellow Sea.
Hereafter, we focus on the basin-scale northwesterly wind anomaly related to latent heat fluxes. A question that needs to be answered is how this northwesterly wind anomaly could have occurred over the Yellow Sea. Figure 5J presents the geopotential height anomaly at 500 hPa during April 2020. In the middle troposphere, the anticyclonic circulation anomaly developed between the Ural Mountains and the Lake Baikal areas over the Siberian region. At the same time, a cyclonic circulation anomaly formed over the East Sea. This height anomaly with a northwest-southeast dipole pattern was an equivalent barotropic structure extending from the lower to the upper level (not shown). The dipole pattern led to a northwesterly wind anomaly over the Yellow Sea. Then, more latent heat was released from the northeastern Yellow Sea into the atmosphere; consequently, the SST increased slowly during the spring of 2020.
The characteristic atmospheric circulation in spring 2020 could explain the spring temperature evolution during the normal years. The composite analysis of the oceanic/atmospheric variables was conducted with the cases of slow, rapid, and slow minus rapid SST evolution. Here, the slow and rapid SST evolution years are based on below and above one standard deviation from the climatology (see the thin black lines in Figure 2). There are eight selected slow SST evolution years (1982, 1990, 1996, 2000, 2002, 2007, 2013, 2020) and three rapid SST evolution years (1984, 1985, 2003). Slightly different composite years that considered the northeastern Yellow Sea domain produced similar results (not shown). When analyzing the composite mean evolution of the oceanic/atmospheric variables between the slow and rapid SST evolution years (Figure 6) and the composite for the slow SST evolution years (Figure S1), the slow temperature evolution pattern and its related large-scale atmospheric pattern were robust. Although there were fewer rapid SST evolution years than those with slow SST evolution, the result of the composite for the rapid SST evolution years (Figure S2) was nearly opposite to that of the slow SST evolution.
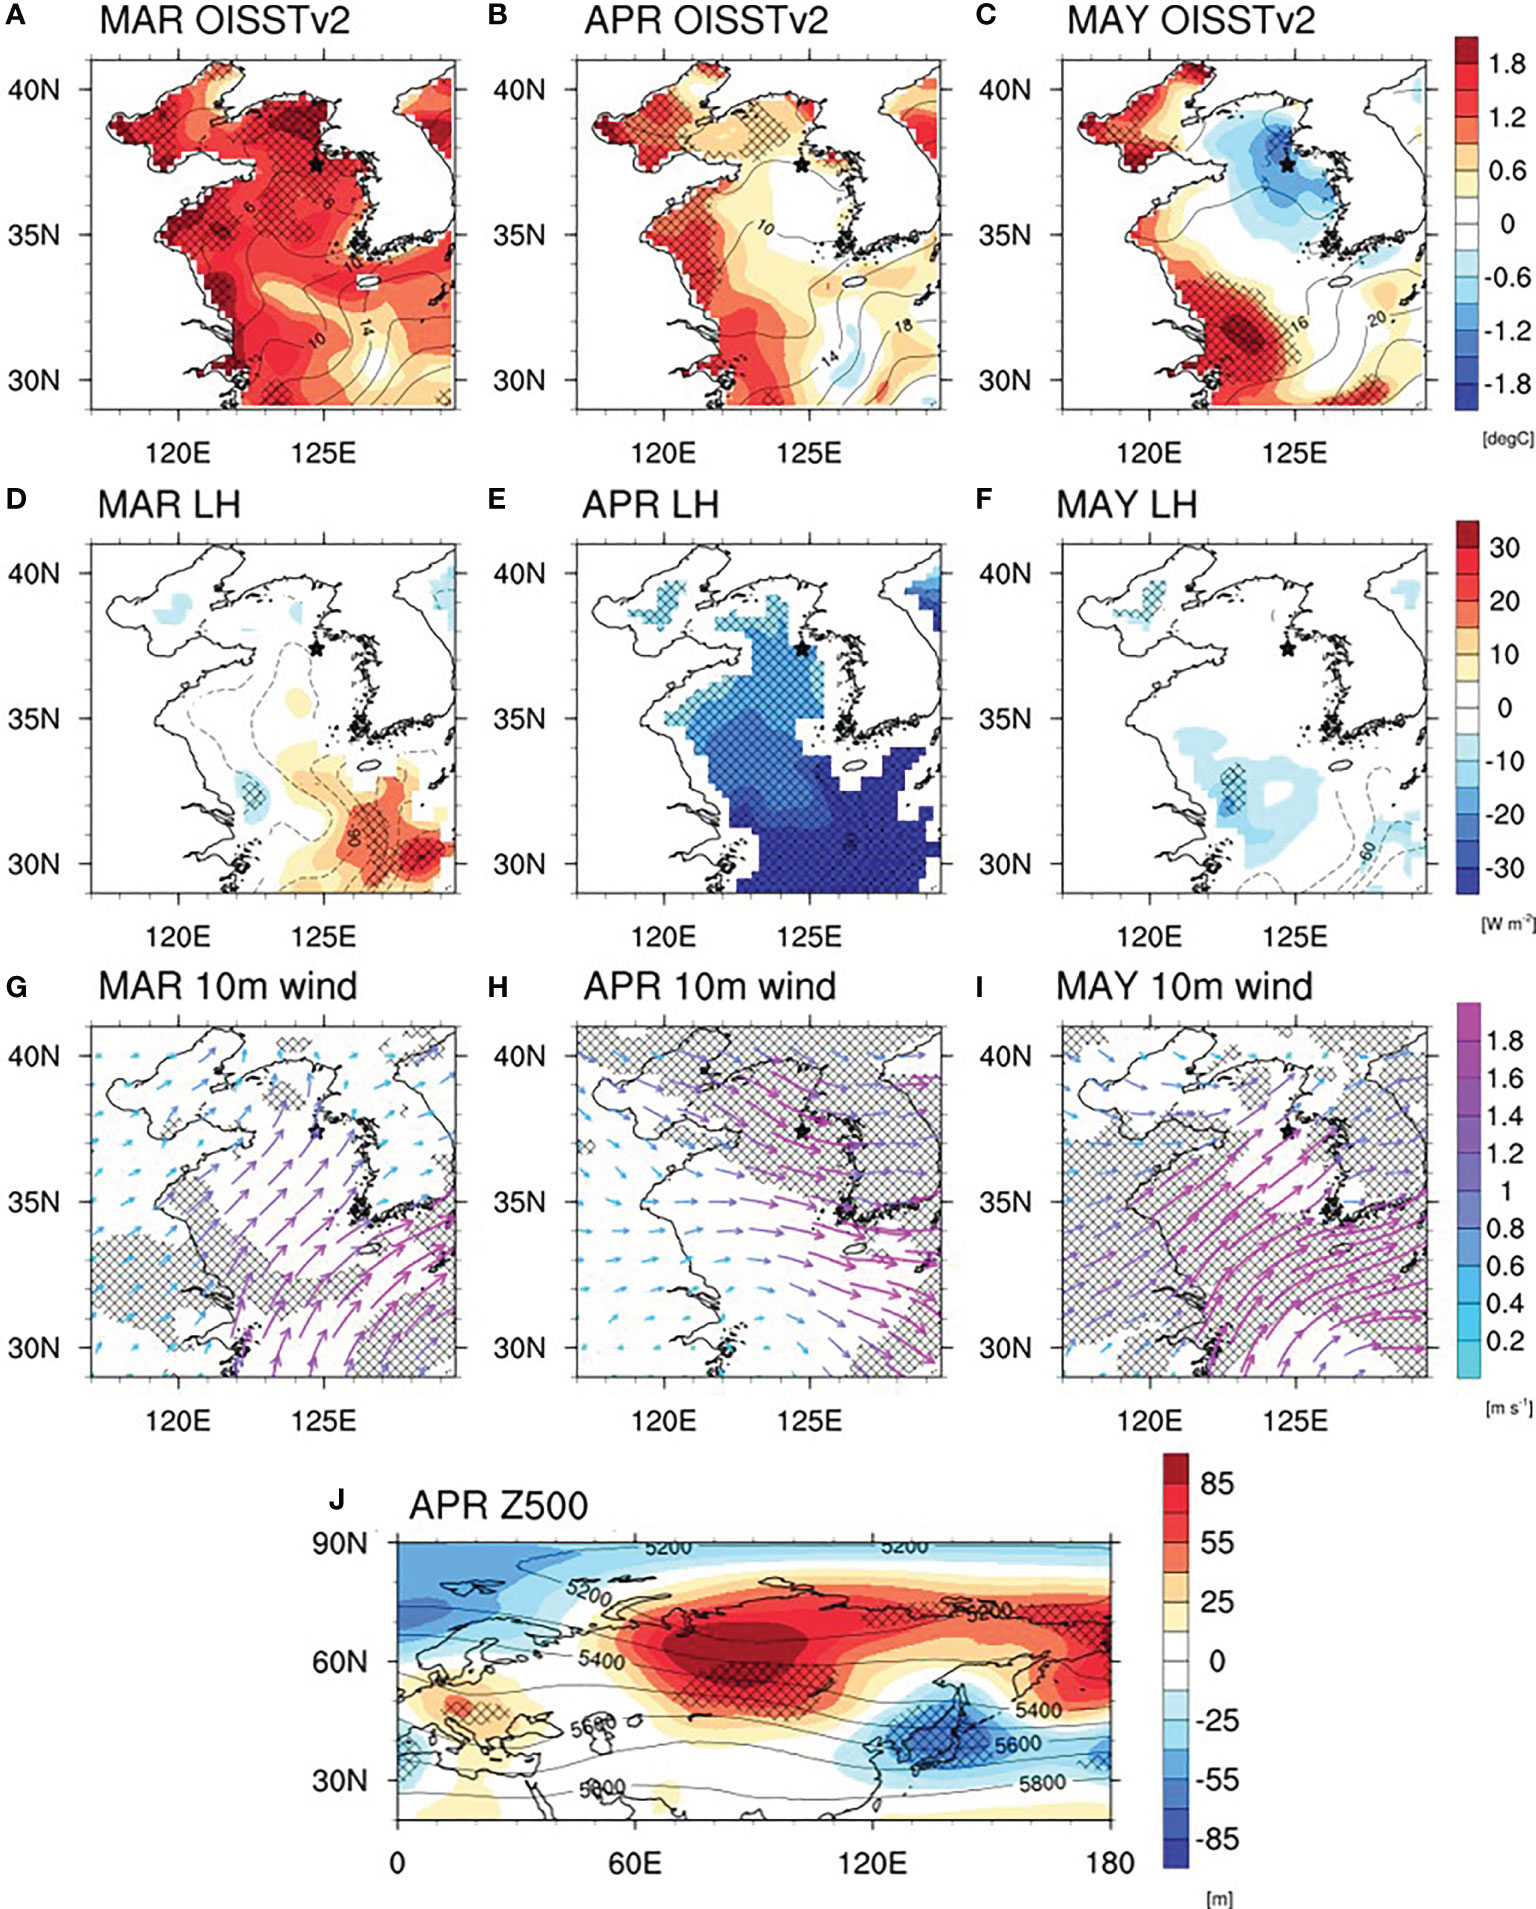
Figure 6 The same as Figure 5, but for the composite mean differences between the slow and rapid SST evolution years.
Note that the spring SST evolution covaries with the dipole index and the winter SST index with a correlation of 0.57 and 0.39 (p = .0002 and p = .0141) for 1982–2020, respectively (refer to Figure 2). These correlations reflect that the dipole atmospheric circulation and the winter SST account for around 33% and 15% of the year-to-year variance of spring SST evolution, respectively (percentages together about 50%). This result seems to reflect that other factors, including the warm current branched out from the Kuroshio, precipitation, aerosol-radiation/aerosol-cloud interactions, riverine discharges, and heat entrainment between surface and subsurface layers associated with turbulent mixing, could render year-to-year spring temperature evolution and also possibly affect the localized evolution throughout the Yellow Sea (Moon et al., 2009; Xuan et al., 2011; Liu et al., 2015; Xu et al., 2016; Timmermann et al., 2020; Lee et al., 2021).
This section assesses the contribution of the decrease in air pollution on nutrients during the spring of 2020. Previous studies have reported a reduction of fine dust and nitrogen dioxide in metropolitan regions such as Beijing, Shanghai, and Seoul during the COVID-19 lockdown (Figure S3; Fan et al., 2020; Han and Hong, 2020; Timmermann et al., 2020; Lee et al., 2021). Contrary to these studies, the concentration of fine dust estimated by PM2.5 on the S-ORS was 18.0 μg m-3 during March–April 2020, which decreased slightly from 18.6 μg m-3 and 18.8 μg m-3 during the previous years of 2018 and 2019, respectively (Figure 7). This reduction of PM2.5 concentration in 2020 was not significant from the measurements during the 2017–2019 period. This result is also consistent with the long-reanalysis MERRA-2 data that the anomalous aerosol optical depth decreased insignificantly during April 2020 (not shown). In line with the PM2.5 concentration on the S-ORS, major nutrients—nitrate (nitrite and nitrate nitrogen), silicate silicon, and phosphate phosphorus—at a subsurface depth level of 20 m from the 307 repeated line of the Korea Oceanographic Data Center, the northernmost section of the hydrographic sections and the closest one to the S-ORS, showed unremarkable changes during 2017 and 2020 (Figure 7). Overall, we believe that the change in fine dust related to the Chinese lockdown was trivial during spring 2020 and its impact on the concentration of nutrients was also negligible because of the Yellow Sea’s eutrophic status during winter and early spring.
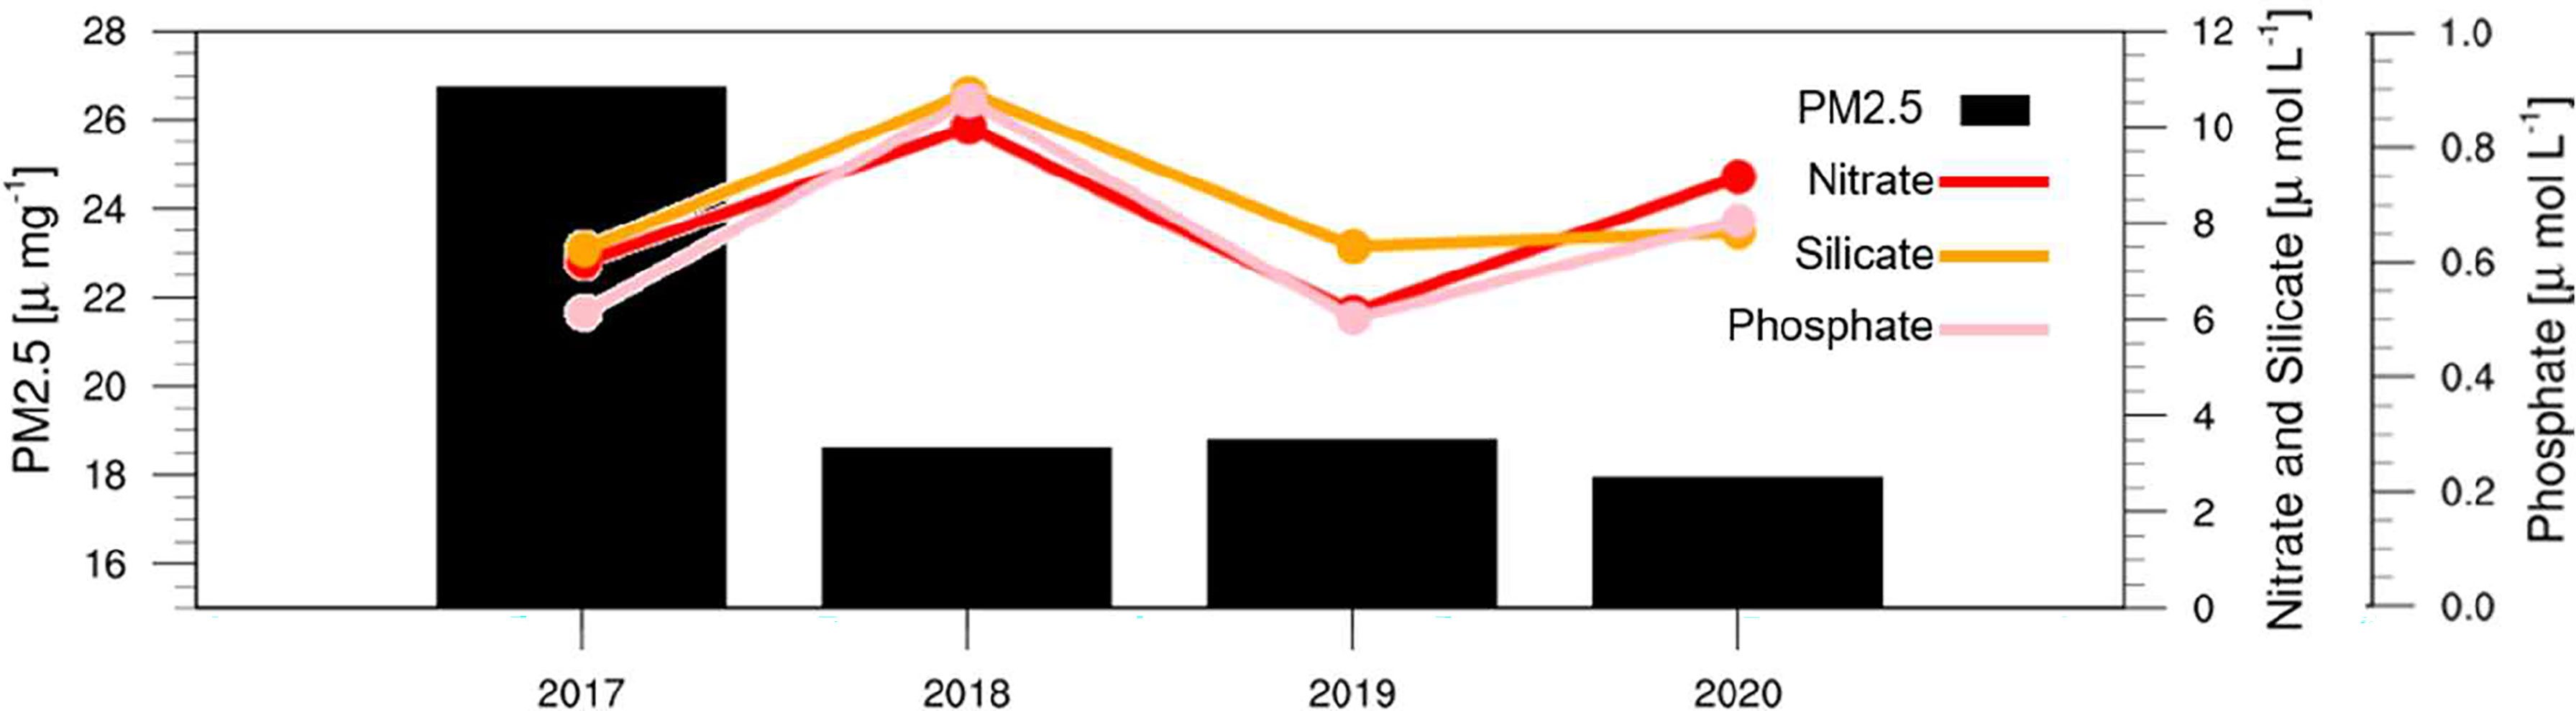
Figure 7 Time series of the averaged March–April PM2.5 concentrations (bars) from the S-ORS and the mean concentration of major nutrients at a subsurface level of 20 m during February between 2017 and 2020 obtained from the 307 line of the Korea Oceanographic Data Center: nitrate (nitrite and nitrate nitrogen, red line), silicate silicon (orange), and phosphate phosphorus (pink).
This study demonstrates that an unprecedented event of the slowest temperature evolution in the last four decades in the northeastern Yellow Sea occurred in spring 2020. The SST evolution between March and May 2020 in the northeastern Yellow Sea was significantly lower than for the 1982–2019 period. This slow temperature evolution occurred via a 117% increased latent heat release from the ocean into the atmosphere in April 2020 compared to the climatology. Strong northwesterly flows caused an increased net oceanic heat loss when an anticyclonic circulation and a cyclonic circulation appeared over Siberia and the East Sea, respectively. Furthermore, the winter-time warm water contributed to this slow evolution as a precondition to facilitating latent heat releases into the air. A mechanical stirring associated with tides might be another heat exchange process as positive oceanic feedback between surface temperature and active entrainment. These processes are schematically summarized in Figure 8. Both the low temperatures and weak stratification during April to May could be unfavorable conditions for phytoplankton growth, albeit under the eutrophic surface layer, thus resulting in the small and delayed spring bloom in 2020.
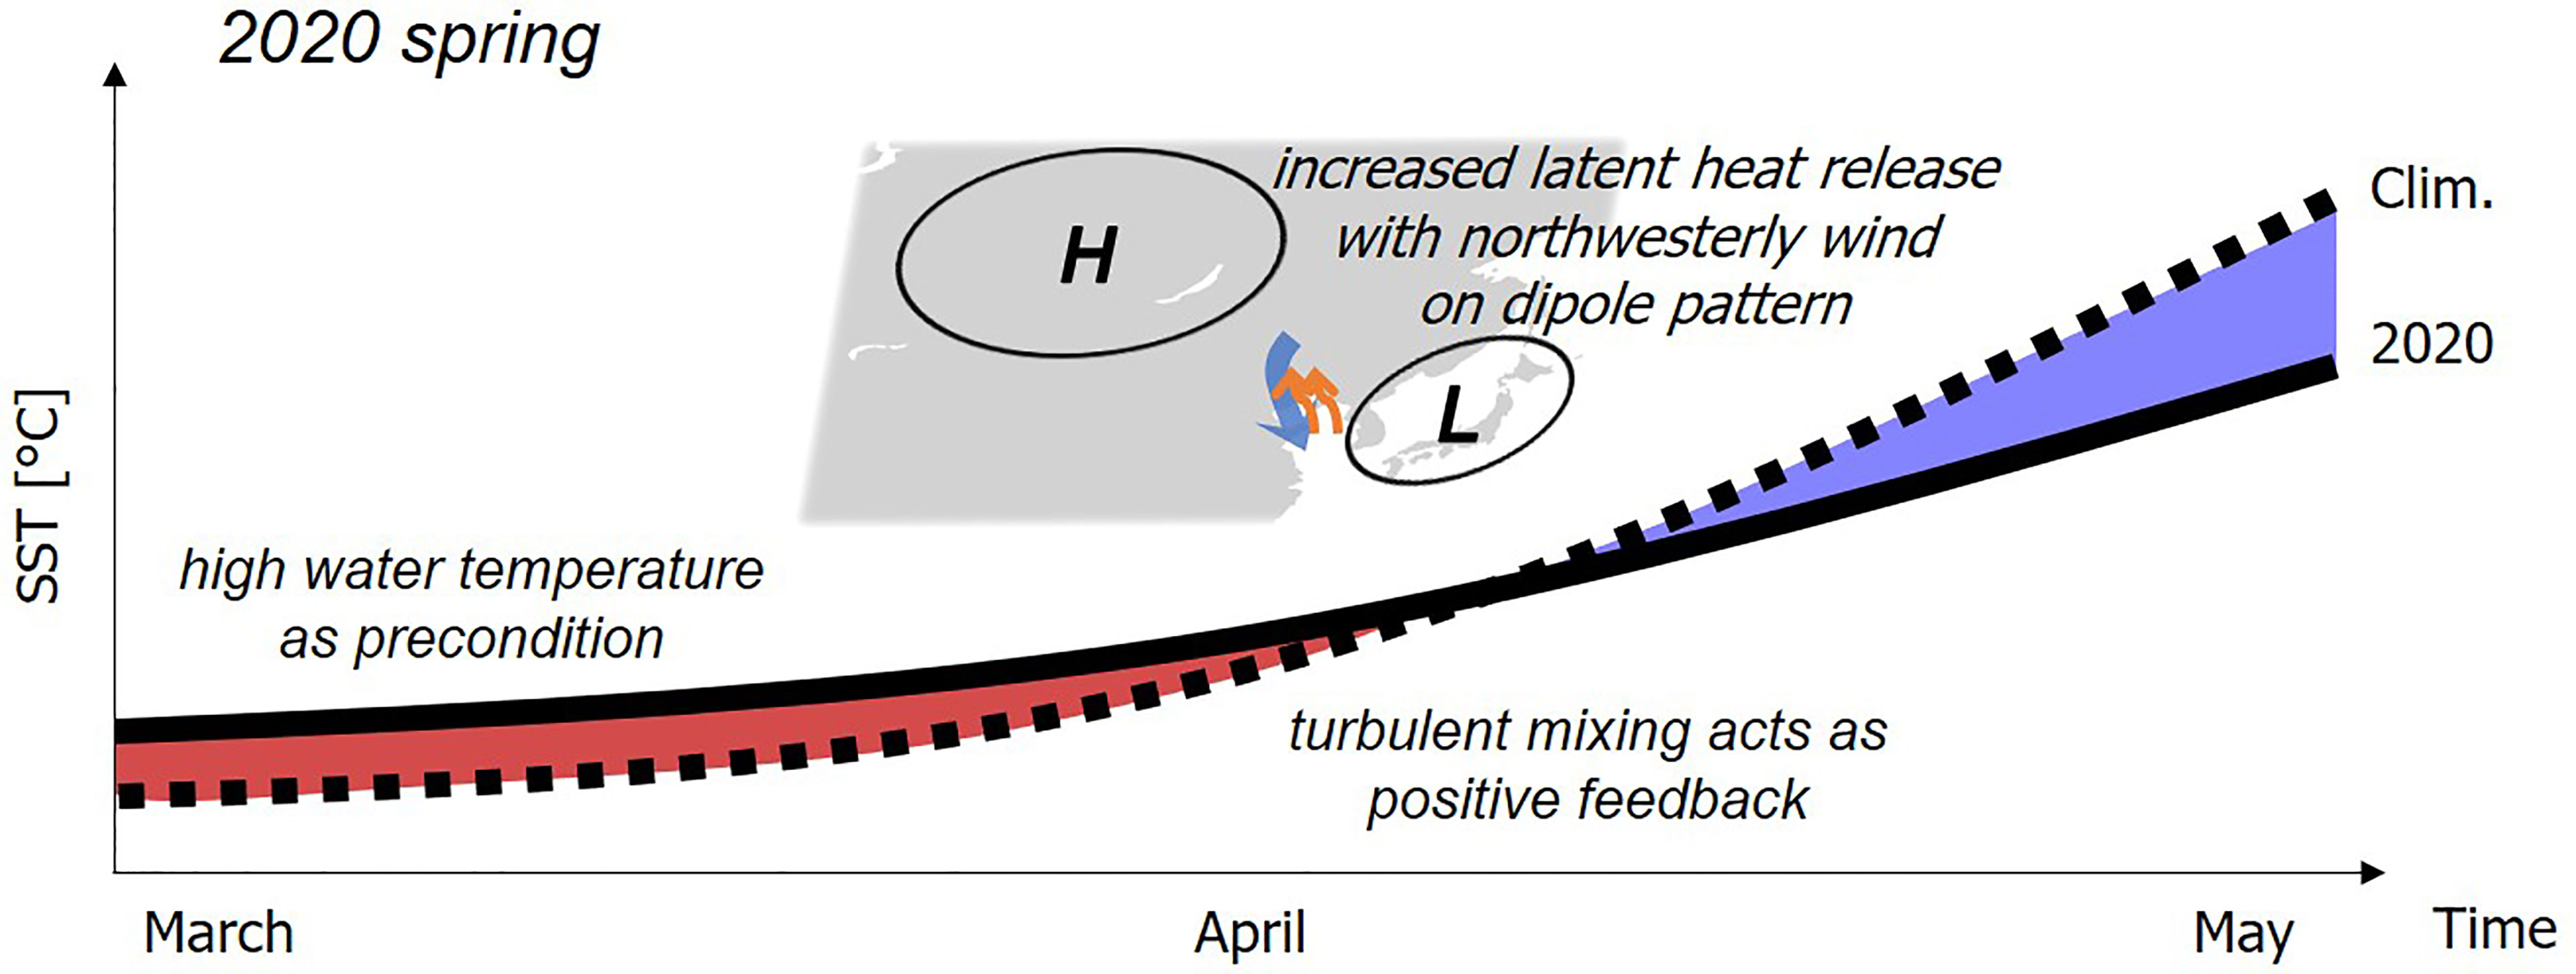
Figure 8 Schematic illustrating the slow temperature evolution process during the spring of 2020. The red (blue) shaded area denotes the higher (lower) SST in 2020 than the climatology (2017–2019 from the S-ORS and 1982–2019 from the OISSTv2). The light blue and orange arrows indicate the northwesterly wind and latent heat flux, respectively.
It is noteworthy that two primary contributors to the 2020 spring temperature evolution—wind-induced latent heat anomaly and winter water temperature anomaly—are related to large-scale atmospheric circulation around East Asia (e.g., Yeh and Kim, 2010; Kim et al., 2018b). This implies that the mechanism might be used to understand the basin-scale variability of the Yellow Sea. However, we cannot exclude the possibility that a local factor plays a dominant role in determining temperature evolution around local areas, such as the path of the Yellow Sea Warm Current over the central trough of the Yellow Sea, in which oceanic processes might counteract the effects of atmospheric circulations (Yeh and Kim, 2010; Kim et al., 2018b).
Most Coupled Model Intercomparison Project Phase 6 (CMIP6) experiments project a warmer climate in the future regardless of greenhouse gas emission scenarios (IPCC, 2021). Surface warming in the western North Pacific and its impact on thermocline water (i.e., mode water) could strengthen the stratification of the water column and raise the sea level over the center of the subtropical gyre in the northwestern Pacific. These changes could increase the zonal gradient of the sea level (Sun et al., 2013; Chen et al., 2019; Todd et al., 2019), leading to an intensified Kuroshio Current and a poleward migration of the subtropical Kuroshio gyre system. This change in the current could allow substantial heat advection into the YECS from this western boundary current (see Figure 1D in Chen et al., 2019), particularly during the winter monsoon period (Lie et al., 2009; Lin et al., 2011; Tak et al., 2016; Kim et al., 2018b). The warmer water that forms during winter could, therefore, lead to favorable preconditions for the large-scale release of latent heat. Furthermore, the winter/spring Arctic Oscillation tends to be a negative phase associated with decreased sea ice and higher air temperatures over the North Pole due to global warming; thus, cold polar air frequently reaches middle latitudes (He et al., 2017). This change makes cold surges more persistent than during normal years and causes increased latent heat fluxes from the ocean. In the future, warm winter water and cold surges could frequently lead to slow spring temperature evolutions like the 2020 event. These projected changes in oceanic and atmospheric circulation might damage the marine ecosystem during the spring bloom in the YECS.
An important finding of this study−the record-breaking spring temperature evolution event and its association with the feeble spring bloom in the northeastern Yellow Sea during the spring of 2020−was observed from the S-ORS. If S-ORS data is continuously observed and archived for a long period, the various temporal and multi-disciplinary characteristics within the northeastern Yellow Sea can be investigated in detail. It helps, in turn, to improve extreme weather predictions in the marginal northwestern Pacific Ocean under climate change.
The datasets presented in this study can be found in online repositories. The names of the repository/repositories and accession number(s) can be found below: The Korea Ocean Research Station project website https://kors.kiost.ac.kr and the global data center in the OceanSITES network website https://dods.ndbc.noaa.gov/thredds/catalog/oceansites/catalog.html.
J-YJ and YK designed the research. G-UK processed the reanalysis data. JL conducted the GOTM simulation runs and processed the time series data at the S-ORS and the 307 line of the KODC. ML processed the time series of PM2.5 data in S-ORS and China. JN processed the CTD profile of chlorophyll fluorescence in S-ORS. G-UK, YK, KL, J-YJ, and CJ interpreted the results. G-UK and YK wrote the manuscript. K-JH, ML, CJ, SN, and JN helped with improving the manuscript. All authors contributed to the article and approved the submitted version.
This research was a part of the project titled ‘Establishment of the Ocean Research Station in the Jurisdiction Zone and Convergence Research’ funded by the Ministry of Oceans and Fisheries in Korea. YK was partially supported by the national research foundation funded by the Korean government (NRF-2020R1F1A1070398) and ‘Influences of the Northwest Pacific circulation and climate variability on the Korean water changes and material cycle I - The role of Jeju warm current and its variability’ (PEA0011).
The authors declare that the research was conducted in the absence of any commercial or financial relationships that could be construed as a potential conflict of interest.
All claims expressed in this article are solely those of the authors and do not necessarily represent those of their affiliated organizations, or those of the publisher, the editors and the reviewers. Any product that may be evaluated in this article, or claim that may be made by its manufacturer, is not guaranteed or endorsed by the publisher.
We want to thank the many engineers and technicians who have worked on the Korea Ocean Research Stations (KORS) program to produce high-quality time series data. We are grateful to the technical staff at the Korea Hydrographic Observation Agency for maintaining and operating the KORS.
The Supplementary Material for this article can be found online at: https://www.frontiersin.org/articles/10.3389/fmars.2022.824361/full#supplementary-material
Supplementary Figure 1 | The same as, but for the composite for the slow SST evolution years.
Supplementary Figure 2 | The same as, but for the composite for the rapid SST evolution years.
Supplementary Figure 3 | The same as, but for the PM2.5 concentration in Beijing, Shanghai, and Seoul.
Belkin I. M. (2009). Rapid Warming of Large Marine Ecosystems. Prog. Oceanogr. 81, 207–213. doi: 10.1016/j.pocean.2009.04.011
Blain S. P., Guieu C. C., Claustre H., Leblanc K., Moutin T., Que´Guiner B., et al. (2004). Availability of Iron and Major Nutrients for Phytoplankton in the Northeast Atlantic Ocean. Limnol. Oceanogr. 49, 2095–2104. doi: 10.4319/lo.2004.49.6.2095
Boreddy S. K. R., Kawamura K. (2015). A 12-Year Observation of Water-Soluble Ions in TSP Aerosols Collected at a Remote Marine Location in the Western North Pacific: An Outflow Region of Asian Dust. Atmos. Chem. Phys. 15, 6437–6453. doi: 10.5194/acp-15-6437-2015
Burchard H., Baumert H. (1995). On the Performance of a Mixed-Layer Model Based on the κ-ϵ Turbulence Closure. J. Geophys. Res. Oceans 100, 8523–8540. doi: 10.1029/94jc03229
Cai R., Tan H., Kontoyiannis H. (2017). Robust Surface Warming in Offshore China Seas and Its Relationship to the East Asian Monsoon Wind Field and Ocean Forcing on Interdecadal Time Scales. J. Clim. 30, 8987–9005. doi: 10.1175/jcli-d-16-0016.1
Chen C., Wang G., Xie S.-P., Liu W. (2019). Why Does Global Warming Weaken the Gulf Stream But Intensify the Kuroshio? J. Clim. 32, 7437–7451. doi: 10.1175/jcli-d-18-0895.1
Egbert G. D., Erofeeva S. Y. (2002). Efficient Inverse Modeling of Barotropic Ocean Tides. J. Atmos. Ocean. Technol. 19, 183–204. doi: 10.1175/1520-0426(2002)019<0183:EIMOBO>2.0.CO;2
Fan C., Li Y., Guang J., Li Z., Elnashar A., Allam M., et al. (2020). The Impact of the Control Measures During the COVID-19 Outbreak on Air Pollution in China. Remote Sens. 12, 1613. doi: 10.3390/rs12101613
Fan J., Wang X., Wu W., Chen W., Ma Q., Ma Z. (2021). Function of Restored Wetlands for Waterbird Conservation in the Yellow Sea Coast. Sci. Total Environ. 756, 144061. doi: 10.1016/j.scitotenv.2020.144061
Fu X., Sun J., Wei Y., Liu Z., Xin Y., Guo Y., et al. (2021). Seasonal Shift of a Phytoplankton (>5 µm) Community in Bohai Sea and the Adjacent Yellow Sea. Diversity 13, 65. doi: 10.3390/d13020065
Ha K.-J., Nam S., Jeong J.-Y., Moon I.-J., Lee M., Yun J., et al. (2019). Observations Utilizing Korea Ocean Research Stations and Their Applications for Process Studies. Bull. Am. Meteorol. Soc 100, 2061–2075. doi: 10.1175/BAMS-D-18-0305.1
Han C., Hong Y. C. (2020). Decrease in Ambient Fine Particulate Matter During COVID-19 Crisis and Corresponding Health Benefits in Seoul, Korea. Int. J. Environ. Res. Public Health 17, 5279. doi: 10.3390/ijerph17155279
He S., Gao Y., Li F., Wang H., He Y. (2017). Impact of Arctic Oscillation on the East Asian Climate: A Review. Earth Sci. Rev. 164, 48–62. doi: 10.1016/j.earscirev.2016.10.014
Hersbach H., Bell B., Berrisford P., Hirahara S., Horányi A., Muñoz-Sabater J., et al. (2020). The ERA5 Global Reanalysis. Q. J. R. Meteorol. Soc 146, 1999–2049. doi: 10.1002/qj.3803
Horton D. E., Johnson N. C., Singh D., Swain D. L., Rajaratnam B., Diffenbaugh N. S. (2015). Contribution of Changes in Atmospheric Circulation Patterns to Extreme Temperature Trends. Nature 522, 465–469. doi: 10.1038/nature14550
IPCC (2021). Climate Change 2021: The Physical Science Basis. Contribution of Working Group I to the Sixth Assessment Report of the Intergovernmental Panel on Climate Change (Cambridge University Press).
Jin J., Liu S. M., Ren J. L., Liu C. G., Zhang J., Zhang G. L., et al. (2013). Nutrient Dynamics and Coupling With Phytoplankton Species Composition During the Spring Blooms in the Yellow Sea. Deep Sea Res. II: Top. Stud. Oceanogr. 97, 16–32. doi: 10.1016/j.dsr2.2013.05.002
Khim S. J., Lee C., Joon Song S., Bae H., Noh J., Lee J., et al. (2021). Marine Biodiversity in Korea: A Review of Macrozoobenthic Assemblages, Their Distributions, and Long-Term Community Changes From Human Impacts. Oceanogr. Mar. Biol. 59, 483–532.
Kim Y. S., Jang C. J., Jeong J.-Y., Shim J.-S. (2018a). Daily to Seasonal Variability of the Mixed Layer Depth in the Central Yellow Sea: Effects of Atmospheric Forcing. J. Coast. Res. 85, 576–580. doi: 10.2112/si85-116.1
Kim Y. S., Jang C. J., Noh J. H., Kim K.-T., Kwon J.-I., Min Y., et al. (2019). A Yellow Sea Monitoring Platform and Its Scientific Applications. Front. Mar. Sci. 6. doi: 10.3389/fmars.2019.00601
Kim Y. S., Jang C. J., Yeh S.-W. (2018b). Recent Surface Cooling in the Yellow and East China Seas and the Associated North Pacific Climate Regime Shift. Cont. Shelf Res. 156, 43–54. doi: 10.1016/j.csr.2018.01.009
Kim T.-W., Lee K., Najjar R. G., Jeong H.-D., Jin J. H. (2011). Increasing N Abundance in the Northwestern Pacific Ocean Due to Atmospheric Nitrogen Deposition. Science 334, 505–509. doi: 10.1126/science.1206583
Leal M. C., Munro M. H. G., Blunt J. W., Puga J., Jesus B., Calado R., et al. (2013). Biogeography and Biodiscovery Hotspots of Macroalgal Marine Natural Products. Nat. Prod. Rep. 30, 1380–1390. doi: 10.1039/c3np70057g
Lee S.-S., Chu J.-E., Timmermann A., Chung E.-S., Lee J.-Y. (2021). East Asian Climate Response to COVID-19 Lockdown Measures in China. Sci. Rep. 11, 1–9. doi: 10.1038/s41598-021-96007-1
Lee S., Park M.-S., Kwon M., Kim Y. H., Park Y.-G. (2020). Two Major Modes of East Asian Marine Heatwaves. Environ. Res. Lett. 15, 074008. doi: 10.1088/1748-9326/ab8527
Lie H.-J., Cho C.-H., Lee S. (2009). Tongue-Shaped Frontal Structure and Warm Water Intrusion in the Southern Yellow Sea in Winter. J. Geophys. Res. Oceans 114. doi: 10.1029/2007jc004683
Lin X., Yang J., Guo J., Zhang Z., Yin Y., Song X., et al. (2011). An Asymmetric Upwind Flow, Yellow Sea Warm Current: 1. New Observations in the Western Yellow Sea. J. Geophys. Res. Oceans 116. doi: 10.1029/2010jc006513
Liu X., Huang B., Huang Q., Wang L., Ni X., Tang Q., et al. (2015). Seasonal Phytoplankton Response to Physical Processes in the Southern Yellow Sea. J. Sea Res. 95, 45–55. doi: 10.1016/j.seares.2014.10.017
Liu N., Wu D., Lin X., Meng Q. (2014). Seasonal Variations of Air-Sea Heat Fluxes and Sea Surface Temperature in the Northwestern Pacific Marginal Seas. Acta Oceanol. Sin. 33, 101–110. doi: 10.1007/s13131-014-0433-6
Ma S., Liu Y., Li J., Fu C., Ye Z., Sun P., et al. (2019). Climate-Induced Long-Term Variations in Ecosystem Structure and Atmosphere-Ocean-Ecosystem Processes in the Yellow Sea and East China Sea. Prog. Oceanogr. 175, 183–197. doi: 10.1016/j.pocean.2019.04.008
Moon J. H., Hirose N., Yoon J. H. (2009). Comparison of Wind and Tidal Contributions to Seasonal Circulation of the Yellow Sea. J. Geophys. Res. Oceans 114. doi: 10.1029/2009jc005314
Moon J. Y., Lee K., Lim W. A., Lee E., Dai M., Choi Y. H., et al. (2021). Anthropogenic Nitrogen is Changing the East China and Yellow Seas From Being N Deficient to Being P Deficient. Limnol. Oceanogr. 66, 914–924. doi: 10.1002/lno.11651
Oliver E. C. J., Donat M. G., Burrows M. T., Moore P. J., Smale D. A., Alexander L. V., et al. (2018). Longer and More Frequent Marine Heatwaves Over the Past Century. Nat. Commun. 9, 1–12. doi: 10.1038/s41467-018-03732-9
Park K.-A., Lee E.-Y., Chang E., Hong S. (2015). Spatial and Temporal Variability of Sea Surface Temperature and Warming Trends in the Yellow Sea. J. Mar. Syst. 143, 24–38. doi: 10.1016/j.jmarsys.2014.10.013
Park G.-H., Lee S.-E., Kim Y.-I., Kim D., Lee K., Kang J., et al. (2019). Atmospheric Deposition of Anthropogenic Inorganic Nitrogen in Airborne Particles and Precipitation in the East Sea in the Northwestern Pacific Ocean. Sci. Total Environ. 681, 400–412. doi: 10.1016/j.scitotenv.2019.05.135
Reynolds R. W., Smith T. M., Liu C., Chelton D. B., Casey K. S., Schlax M. G. (2007). Daily High-Resolution-Blended Analyses for Sea Surface Temperature. J. Clim. 20, 5473–5496. doi: 10.1175/2007jcli1824.1
Shi Y., Wang J., Zuo T., Shan X., Jin X., Sun J., et al. (2020). Seasonal Changes in Zooplankton Community Structure and Distribution Pattern in the Yellow Sea, China. Front. Mar. Sci. 7. doi: 10.3389/fmars.2020.00391
Sun S., Wu L., Qiu B. (2013). Response of the Inertial Recirculation to Intensified Stratification in a Two-Layer Quasigeostrophic Ocean Circulation Model. J. Phys. Oceanogr. 43, 1254–1269. doi: 10.1175/jpo-d-12-0111.1
Tak Y. J., Cho Y. K., Seo G. H., Choi B. J. (2016). Evolution of Wind-Driven Flows in the Yellow Sea During Winter. J. Geophys. Res. Oceans 121, 1970–1983. doi: 10.1002/2016jc011622
Tan H., Cai R. (2018). What Caused the Record-Breaking Warming in East China Seas During August 2016? Atmos. Sci. Lett. 19, e853. doi: 10.1002/asl.853
Timmermann A., Lee S.-S., Chu J.-E., Chung E.-S., Lee J.-Y. (2020). COVID-19-Related Drop in Anthropogenic Aerosol Emissions in China and Corresponding Cloud and Climate Effects. EarthArXiv. doi: 10.31223/osf.io/z5dm8
Todd R. E., Chavez F. P., Clayton S., Cravatte S., Goes M., Graco M., et al. (2019). Global Perspectives on Observing Ocean Boundary Current Systems. Front. Mar. Sci. 6. doi: 10.3389/fmars.2019.00423
Wang Y., Gao Z. (2020). Contrasting Chlorophyll-a Seasonal Patterns Between Nearshore and Offshore Waters in the Bohai and Yellow Seas, China: A New Analysis Using Improved Satellite Data. Cont. Shelf Res. 203. doi: 10.1016/j.csr.2020.104173
Xuan J.-L., Zhou F., Huang D.-J., Wei H., Liu C.-G., Xing C.-X. (2011). Physical Processes and Their Role on the Spatial and Temporal Variability of the Spring Phytoplankton Bloom in the Central Yellow Sea. Acta Ecol. Sin. 31, 61–70. doi: 10.1016/j.chnaes.2010.11.011
Xu X., Zang K., Zhao H., Zheng N., Huo C., Wang J. (2016). Monthly CO2 at A4HDYD Station in a Productive Shallow Marginal Sea (Yellow Sea) With a Seasonal Thermocline: Controlling Processes. J. Mar. Syst. 159, 89–99. doi: 10.1016/j.jmarsys.2016.03.009
Yamaguchi J., Kanno Y., Chen G., Iwasaki T. (2019). Cold Air Mass Analysis of the Record-Breaking Cold Surge Event Over East Asia in January 2016. J. Meteorol. Soc Japan 97, 275–293. doi: 10.2151/jmsj.2019-015
Yeh S.-W., Kim C.-H. (2010). Recent Warming in the Yellow/East China Sea During Winter and the Associated Atmospheric Circulation. Cont. Shelf Res. 30, 1428–1434. doi: 10.1016/j.csr.2010.05.002
Yeo J.-H., Ha K.-J. (2019). Combined Effects of Blocking and AO on a Prolonged Snowstorm in Jeju Island. Asia Pac. J. Atmos. Sci. 55, 401–414. doi: 10.1007/s13143-018-0088-x
Yeo D.-E., Nam S. (2020). Seasonal and Spatial Variations of Air-Sea Heat Exchange in the Seas Around the Korean Peninsula: Based on the Observations and Reanalysis Products From 2011 to 2016. Prog. Oceanogr. 181, 102239. doi: 10.1016/j.pocean.2019.102239
Zhang L., Wu L., Lin X., Wu D. (2010). Modes and Mechanisms of Sea Surface Temperature Low-Frequency Variations Over the Coastal China Seas. J. Geophys. Res. Oceans 115. doi: 10.1029/2009jc006025
Keywords: Socheongcho Ocean Research Station (S-ORS), pandemic (COVID19), primary production, GOTM, 2020 extreme event, spring water temperature evolution, latent heat flux, warm winter water
Citation: Kim G-U, Lee K, Lee J, Jeong J-Y, Lee M, Jang CJ, Ha K-J, Nam S, Noh JH and Kim YS (2022) Record-Breaking Slow Temperature Evolution of Spring Water During 2020 and Its Impacts on Spring Bloom in the Yellow Sea. Front. Mar. Sci. 9:824361. doi: 10.3389/fmars.2022.824361
Received: 29 November 2021; Accepted: 28 March 2022;
Published: 26 April 2022.
Edited by:
Zhiyu Liu, Xiamen University, ChinaCopyright © 2022 Kim, Lee, Lee, Jeong, Lee, Jang, Ha, Nam, Noh and Kim. This is an open-access article distributed under the terms of the Creative Commons Attribution License (CC BY). The use, distribution or reproduction in other forums is permitted, provided the original author(s) and the copyright owner(s) are credited and that the original publication in this journal is cited, in accordance with accepted academic practice. No use, distribution or reproduction is permitted which does not comply with these terms.
*Correspondence: Yong Sun Kim, eW9uZ3NraW1Aa2lvc3QuYWMua3I=
Disclaimer: All claims expressed in this article are solely those of the authors and do not necessarily represent those of their affiliated organizations, or those of the publisher, the editors and the reviewers. Any product that may be evaluated in this article or claim that may be made by its manufacturer is not guaranteed or endorsed by the publisher.
Research integrity at Frontiers
Learn more about the work of our research integrity team to safeguard the quality of each article we publish.