 Jiejie Ma
 Walker O. Smith Jr.
- 1School of Oceanography, Shanghai Jiao Tong University, Shanghai, China
- 2Virginia Institute of Marine Science, William & Mary, Gloucester Point, VA, United States
Estimates of primary production represent the input of carbon into food webs, as well as the initial step in the biological pump. For the past 60 years, much of the productivity information has been obtained using measurements of 14C-bicarbonate removal during simulated in situ incubations. However, such measurements often do not reflect the complexity of the environment, and also suffer from uncertainties, biases and limitations. A vertically resolved bio-optical model has been used to estimate productivity based on profiles commonly assessed in oceanographic investigations, but comparisons with simultaneous measurements of 14C-uptake are limited. We conducted three cruises off the coast of New England that included sampling continental shelf waters, the shelf-break region, and deeper waters at scales of 7 km, all of which had productivity estimated by a vertically resolved productivity model as well as by traditional 14C-uptake measurements using simulated in situ techniques. We found that the vertically resolved bio-optical model gave results that appear to be more robust and resolved productivity at smaller vertical and horizontal scales, and seem less biased by some of the uncertainties in 14C-uptake measurements. Both estimates suggest that the New England waters are highly productive due to a variety of biological and physical processes occurring at different times of the year, but there was no consistent stimulation at the shelf break over the time scales of these estimates.
Introduction
The Mid-Atlantic Bight (MAB) continental shelf supports extensive and productive fisheries (O’Reilly and Busch, 1984; Townsend et al., 2006). The diverse and productive ecosystem results from a number of processes, such as the fluxes onto the shelf of nutrient-rich deep waters, convective mixing, and land-based nutrient inputs, all of which stimulate primary productivity. The region is characterized by relatively high chlorophyll concentrations, which vary substantially over broad spatial and temporal scales. A winter phytoplankton bloom occurs on the middle and outer shelf, while a spring bloom occurs on the outer shelf-break and slope region (Yoder et al., 1993, 2001, 2002; Xu et al., 2011; Zhang et al., 2013). Summer conditions tend to be oligotrophic throughout the shelf and slope regions.
Frontal systems play a significant role in many continental shelf regions, as they separate cool and fresh shelf water from the more saline slope waters, resulting in biological and physical differences between these two regions (Linder and Gawarkiewicz, 1998; Xu et al., 2011; Zhang et al., 2013). The shelf-slope front in the Mid-Atlantic Bight persists over the entire annual cycle, albeit with a different structure, extending from the bottom to the surface in winter, and in summer between the bottom to the seasonal thermocline (Marra et al., 1982; Houghton et al., 1988; Linder and Gawarkiewicz, 1998; Lozier and Gawarkiewicz, 2001). Fontal systems have also been implicated as an important potential site of upwelling (Linder and Gawarkiewicz, 1998), and hence may be loci for enhanced biological activity.
A number of mechanisms have been suggested to drive upwelling at the shelf break (Linder et al., 2004; Zhang et al., 2011; Zhang and Gawarkiewicz, 2015). Despite the potential for upwelling, monthly satellite composites do not show enhanced mean chlorophyll concentrations at the shelf break (Zhang et al., 2013; Oliver et al., 2022), and only a few images show a clear shelf-break enhancement (Ryan et al., 1999a,b). This may result from either the short duration of upwelling and its biological effects (Oliver et al., 2022), enhanced phytoplankton growth and accumulation below the depth of satellite detection, or the rapid removal of phytoplankton by zooplankton grazing (Zhang et al., 2013). Deep waters (near the 1% isolume) have been shown to be dominant features in summer offshore waters influenced by warm core ring intrusions (Oliver et al., 2021), but the importance of deep production as a general feature has not been established.
We focus on the estimation of primary production and analyze whether the chlorophyll and productivity are enhanced at the shelf break. Primary productivity has traditionally been assessed by short (24 h or less) measurements of 14C-uptake. The method is simple, and has been applied by numerous investigators over broad areas of the ocean and has provided a valuable data set to assess photosynthesis in the ocean (Marra et al., 2021). However, questions remain on the interpretation of these incubations (Marra et al., 1990, 2021; Marra and Barber, 2004). For example, the quantitative impact of phytoplankton respiration remains unclear, and variations among studies with regard to the starting time of incubations, length of incubations, size of bottles, measurement of dissolved organic carbon release during incubations, and temperature control during incubations remain. As a result, comparison among different studies is problematic. Regardless, previous estimates of productivity of the mid-Atlantic Bight region suggested that the annual rate of production is about 12 mol C m–2 (±20%) (Marra et al., 1992). Daily estimates can exceed 2 g C m–2 d–1.
Satellite estimates of chlorophyll have driven the development of new means of estimating productivity. Behrenfeld and Falkowski (1997a,b) described a method to estimate integrated productivity based solely on euphotic zone chlorophyll (estimated from chlorophyll concentrations in the upper water column), sea surface temperature, and photosynthetically active radiation (PAR), all of which are coupled to an established photosynthesis model. This method allows for far greater spatial and temporal resolution of primary productivity than can be obtained from discrete sampling, and is a powerful indication of how much carbon is being fixed into particulate matter over broad regions of the ocean. A second, related method is the vertically resolved method of estimating productivity, which again uses temperature, chlorophyll concentrations, and PAR in combination with a photosynthesis model. This allows for the primary productivity to be estimated throughout the water column at discrete depths and then integrated to give daily productivity estimates, and can be applied to different locations where highly resolved chlorophyll and temperature data are available (e.g., from closely spaced CTD measurements; Oliver et al., 2021; Smith et al., 2021). Such a method allows for the incorporation of small-scale features (e.g., narrow chlorophyll maxima) to be included in estimates of integrated productivity (Oliver et al., 2021), as well as to more reliably account for vertical temperature changes. Various algorithms to estimate primary productivity have been developed and compared (Campbell et al., 2002). They found that the algorithms tested generally were within a factor of two when compared to 14C-uptake measurements, and that the performance of algorithms was independent of the algorithm’s complexity.
We investigated the primary productivity on the continental shelf and the slope in the Mid-Atlantic Bight (Figure 1) and hypothesized that the continental shelf break would be a site of enhanced primary productivity, despite its lack of appearance in satellite chlorophyll images or composites. Oliver et al. (2022) showed that wind-driven events of short (a few days) durations could enhance productivity at the shelf break by enhancing frontal stratification, but a complete assessment of the importance of these events on longer time scales was not conducted. To test the importance of the shelf-break productivity relative to that on the shelf and slope, we analyzed productivity by three methods: simulated in situ incubations using a vertically resolved bio-optical model, 14C-uptake measurements, and surface variable estimates.
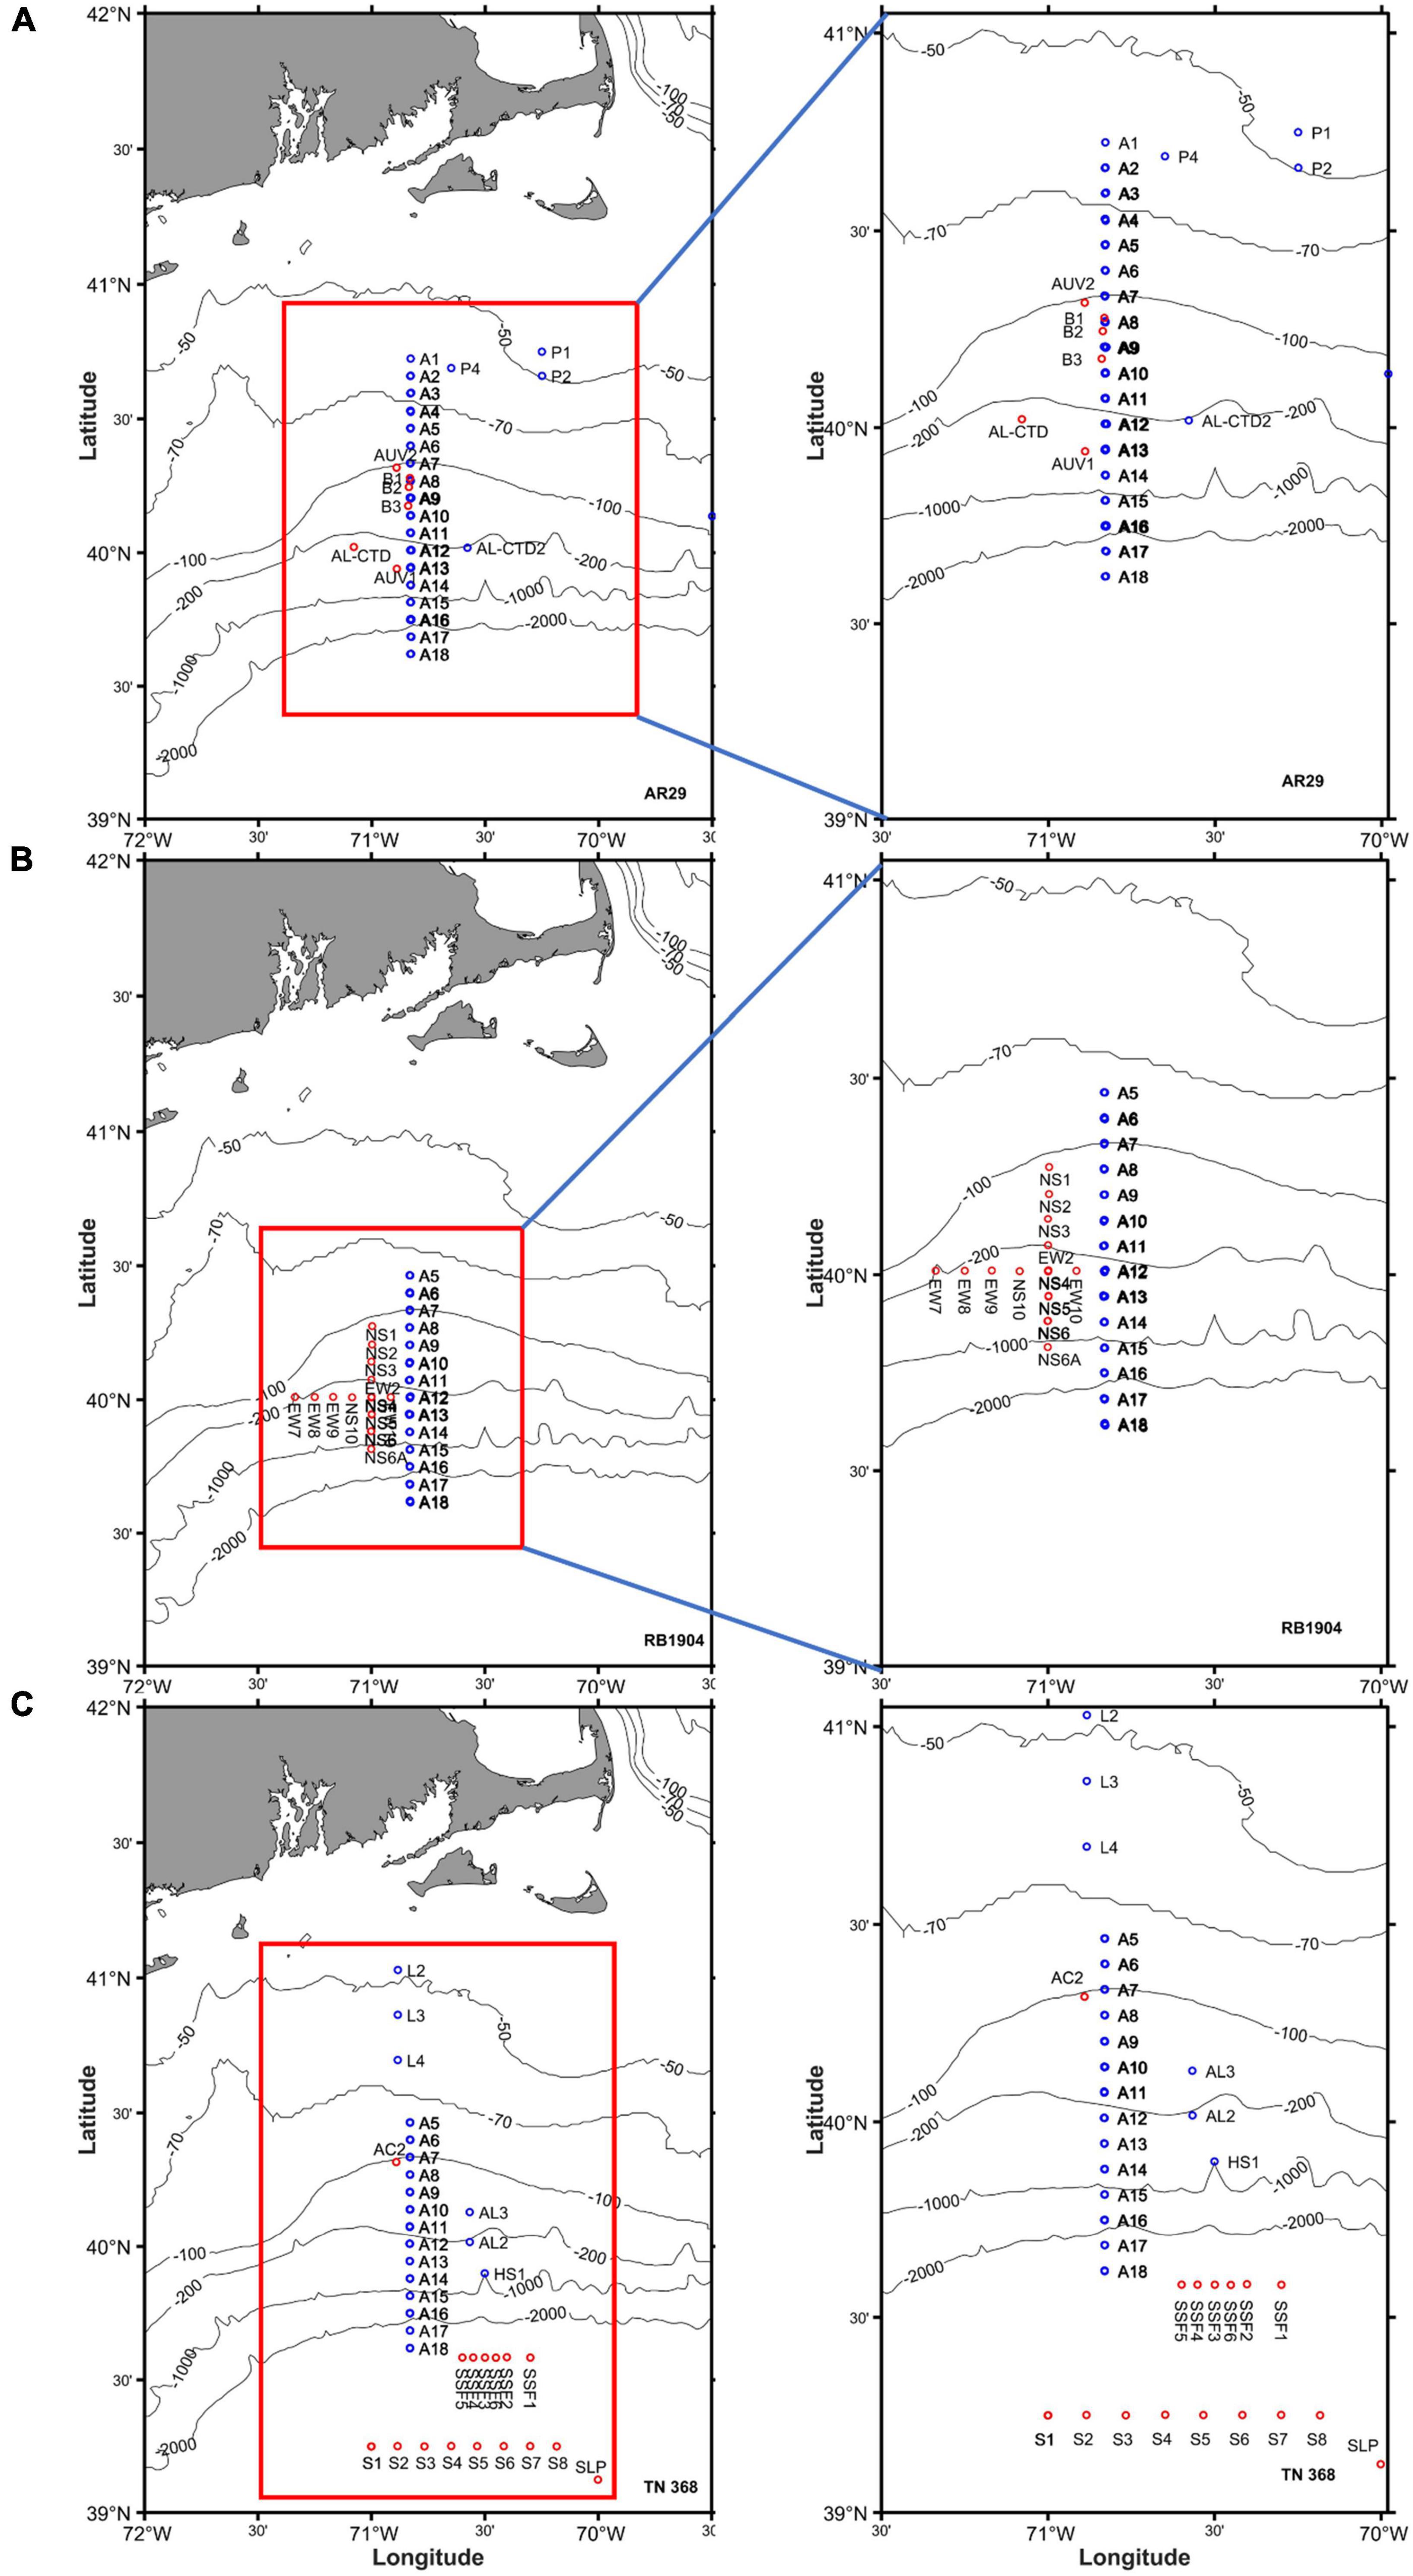
Figure 1. The locations of CTD stations occupied during (A) AR29, (B) RB1904, and (C) TN368 on the continental shelf and the slope waters off New England.
Materials and Methods
We conducted three cruises as part of the SPIROPA project (Shelf-break Productivity Interdisciplinary Research Operation at the Pioneer Array). The cruises were conducted in early spring (April 16–29, 2018 on the R.V. Armstrong), one in late spring (May 12–25, 2019 on the R.V. Brown) and one in summer (July 06–18, 2019 on the R.V. Thompson; Figure 1). A total of 161, 109, and 125 CTD casts were completed in the three cruises, with 11, 9, and 11 transects generally sampling from location A5 to A18, respectively (Figure 1). A majority of stations were occupied along a 125 km north-south transect perpendicular to the shelf break at 70.8°W (Figure 1). Station spacing was ca. 7 km, allowing the observation of mesoscale and sub-mesoscale processes. Twenty-four, 24 and 23 stations were sampled for 14C-incubations during the early spring (AR29), late spring (RB1904) and summer (TN368; Supplementary Table 1).
At each station, water was collected using a CTD-rosette system that had 24 10-L Niskin bottles, a PAR sensor, fluorometer, and transmissometer. Surface PAR data were collected continuously using a BioSpherical Model 240 quantum sensor. Water sampling depths were either standard depths (0, 10, 20, 30, 40, 50, 70, 100, 125, 150, 200, 250, and 500 m) or depths chosen by irradiance levels (selected during the down cast) for isotopic productivity determinations. Euphotic depths were the depths to which 1% irradiance of surface irradiance penetrated. Mixed layer depths were determined from the depth which increased by 0.03 σT units from the 5 m value. The σT values were irregular at some stations in the Armstrong cruise; therefore, a mean σT value in the upper 10 m was used to determine surface layer density. The location of the front was determined as the 34.5 isohaline (Zhang et al., 2013). The main transects were divided into inshore, frontal and offshore zones based on the 34.5 isohaline location (shelf-break stations were defined as those within 15 km on each side of 34.5 isohaline and generally included 2 stations on each side of the front). Isolumes chosen for productivity measurements were 100, 50, 25, 15, 5, 1, and 0.1% of surface irradiance. Water samples were collected for nutrients, chlorophyll, particulate organic carbon and nitrogen, biogenic silica, and phytoplankton taxonomy. Nutrients were filtered through polycarbonate filters, placed in acid-washed 50 mL polycarbonate bottles, frozen and analyzed using automated procedures at the Woods Hole Nutrient Facility. Chlorophyll samples were filtered through 25 mm Whatman GF/F filters under low pressure and frozen in liquid nitrogen for later analyses. Samples were extracted in 90% acetone and analyzed by fluorometry, and the fluorometer calibrated using commercially purified chlorophyll a (Knap et al., 1996). Particulate organic carbon and nitrogen samples were filtered through combusted (450°C for 4 h) 25 mm GF/F filters, rinsed with ca. 5 mL 0.01N HCl in filtered seawater, placed in combusted glass vials, and covered with combusted aluminum foil. Samples were dried at 60°C and analyzed on a Costech ECS Model 4010 elemental analyzer (Gardner et al., 2000).
Productivity was also measured using 14C-uptake (Smith et al., 2000, 2021). Briefly, samples were collected from known isolumes and placed into sterile 280 mL Qorpak bottles to which ca. 100 μCi NaH14CO3 were added (pH = 9.6). Bottles were then placed in an incubator through which surface seawater flowed and which had tubes wrapped with neutral density screening to reduce irradiance to that of the sampling depth. Incubations lasted 24 h. Most incubations were started prior to local noon. After incubation, samples were filtered through 25 mm GFF filters, which were rinsed with 0.01N HCL in seawater to remove inorganic carbon from the filter. Filters were placed in 7 mL scintillation vials and had 5 mL Ecolume® added. All samples were kept in the dark for at least 24 h to reduce chemiluminescence. The total amount of added isotope was quantified from a sample of 0.1 mL unfiltered sample placed into a scintillation vial. All samples were counted on a scintillation counter and the counts converted into carbon units.
Productivity was also modeled using two methods. The first was a model that originally used satellite estimates of surface temperature, chlorophyll concentrations and daily PAR information combined with a photosynthesis model to predict productivity (Behrenfeld and Falkowski, 1997a; Campbell et al., 2002). We used our surface CTD observations of surface temperatures and chlorophyll along with the measured PAR to estimate productivity in this manner. We also generated vertically resolved estimates of productivity using the CTD data from our casts and the measured PAR. Fluorescence values were converted to chlorophyll concentrations by regressing the extracted chlorophyll concentrations with the fluorescence values at the same depth. At each depth the available PAR was either measured or calculated from attenuation coefficients, and values derived from temperature (Behrenfeld and Falkowski, 1997b). PAR and values were used to calculate the photosynthetic rates using a hyperbolic tangent photosynthesis model (Platt and Jassby, 1976) at 1-m intervals and converted to carbon units using the vertical chlorophyll distributions. Photoinhibition effects were included using the relationship determined by Behrenfeld and Falkowski (1997b). Daily productivity was derived by integrating the rates through the 1% isolume depth (Oliver et al., 2021; Smith et al., 2021). All variables of both models are listed in Table 1.
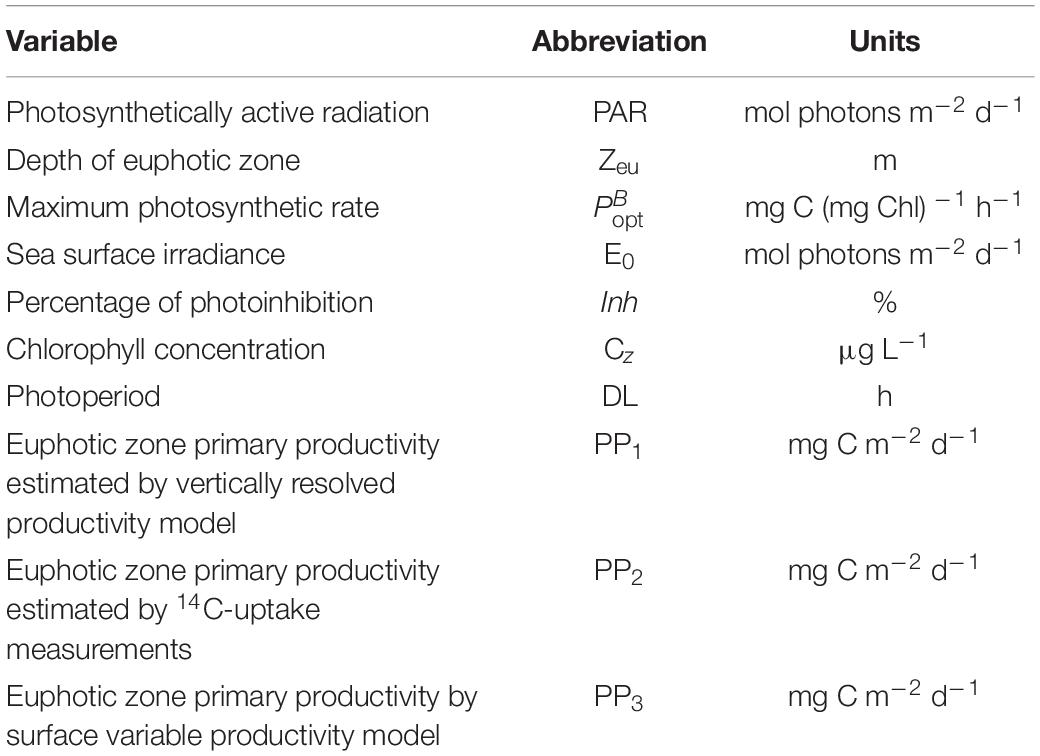
Table 1. The variables used in the two bio-optical models and their units, and the types of primary productivity estimates.
Results
Vertical Distributions of Temperature, σt, Chlorophyll, and Nitrate
The temperature ranges encountered during AR29, RB1904 and TN368 cruises were 5.9– 18.3, 5.6 – 20.9, and 7.0 – 25.8°C, respectively (Figures 2, 3, 4; additional sections provided in Supplementary Figures 1–3). A salinity front generally separated coastal waters from the more saline, Gulf Stream waters and at times restricted water movement off the shelf, but the strength and location of the front varied temporally (Figures 2–4; transects near the beginnings and ends of the three cruises). During the summer the 34.5 isohaline did not penetrate to the surface, so the location of the front was chosen as the shallowest penetration of that isohaline. These sections were chosen to help us to understand how temperature, the position of front and chlorophyll affect primary productivity (Figures 2–4).
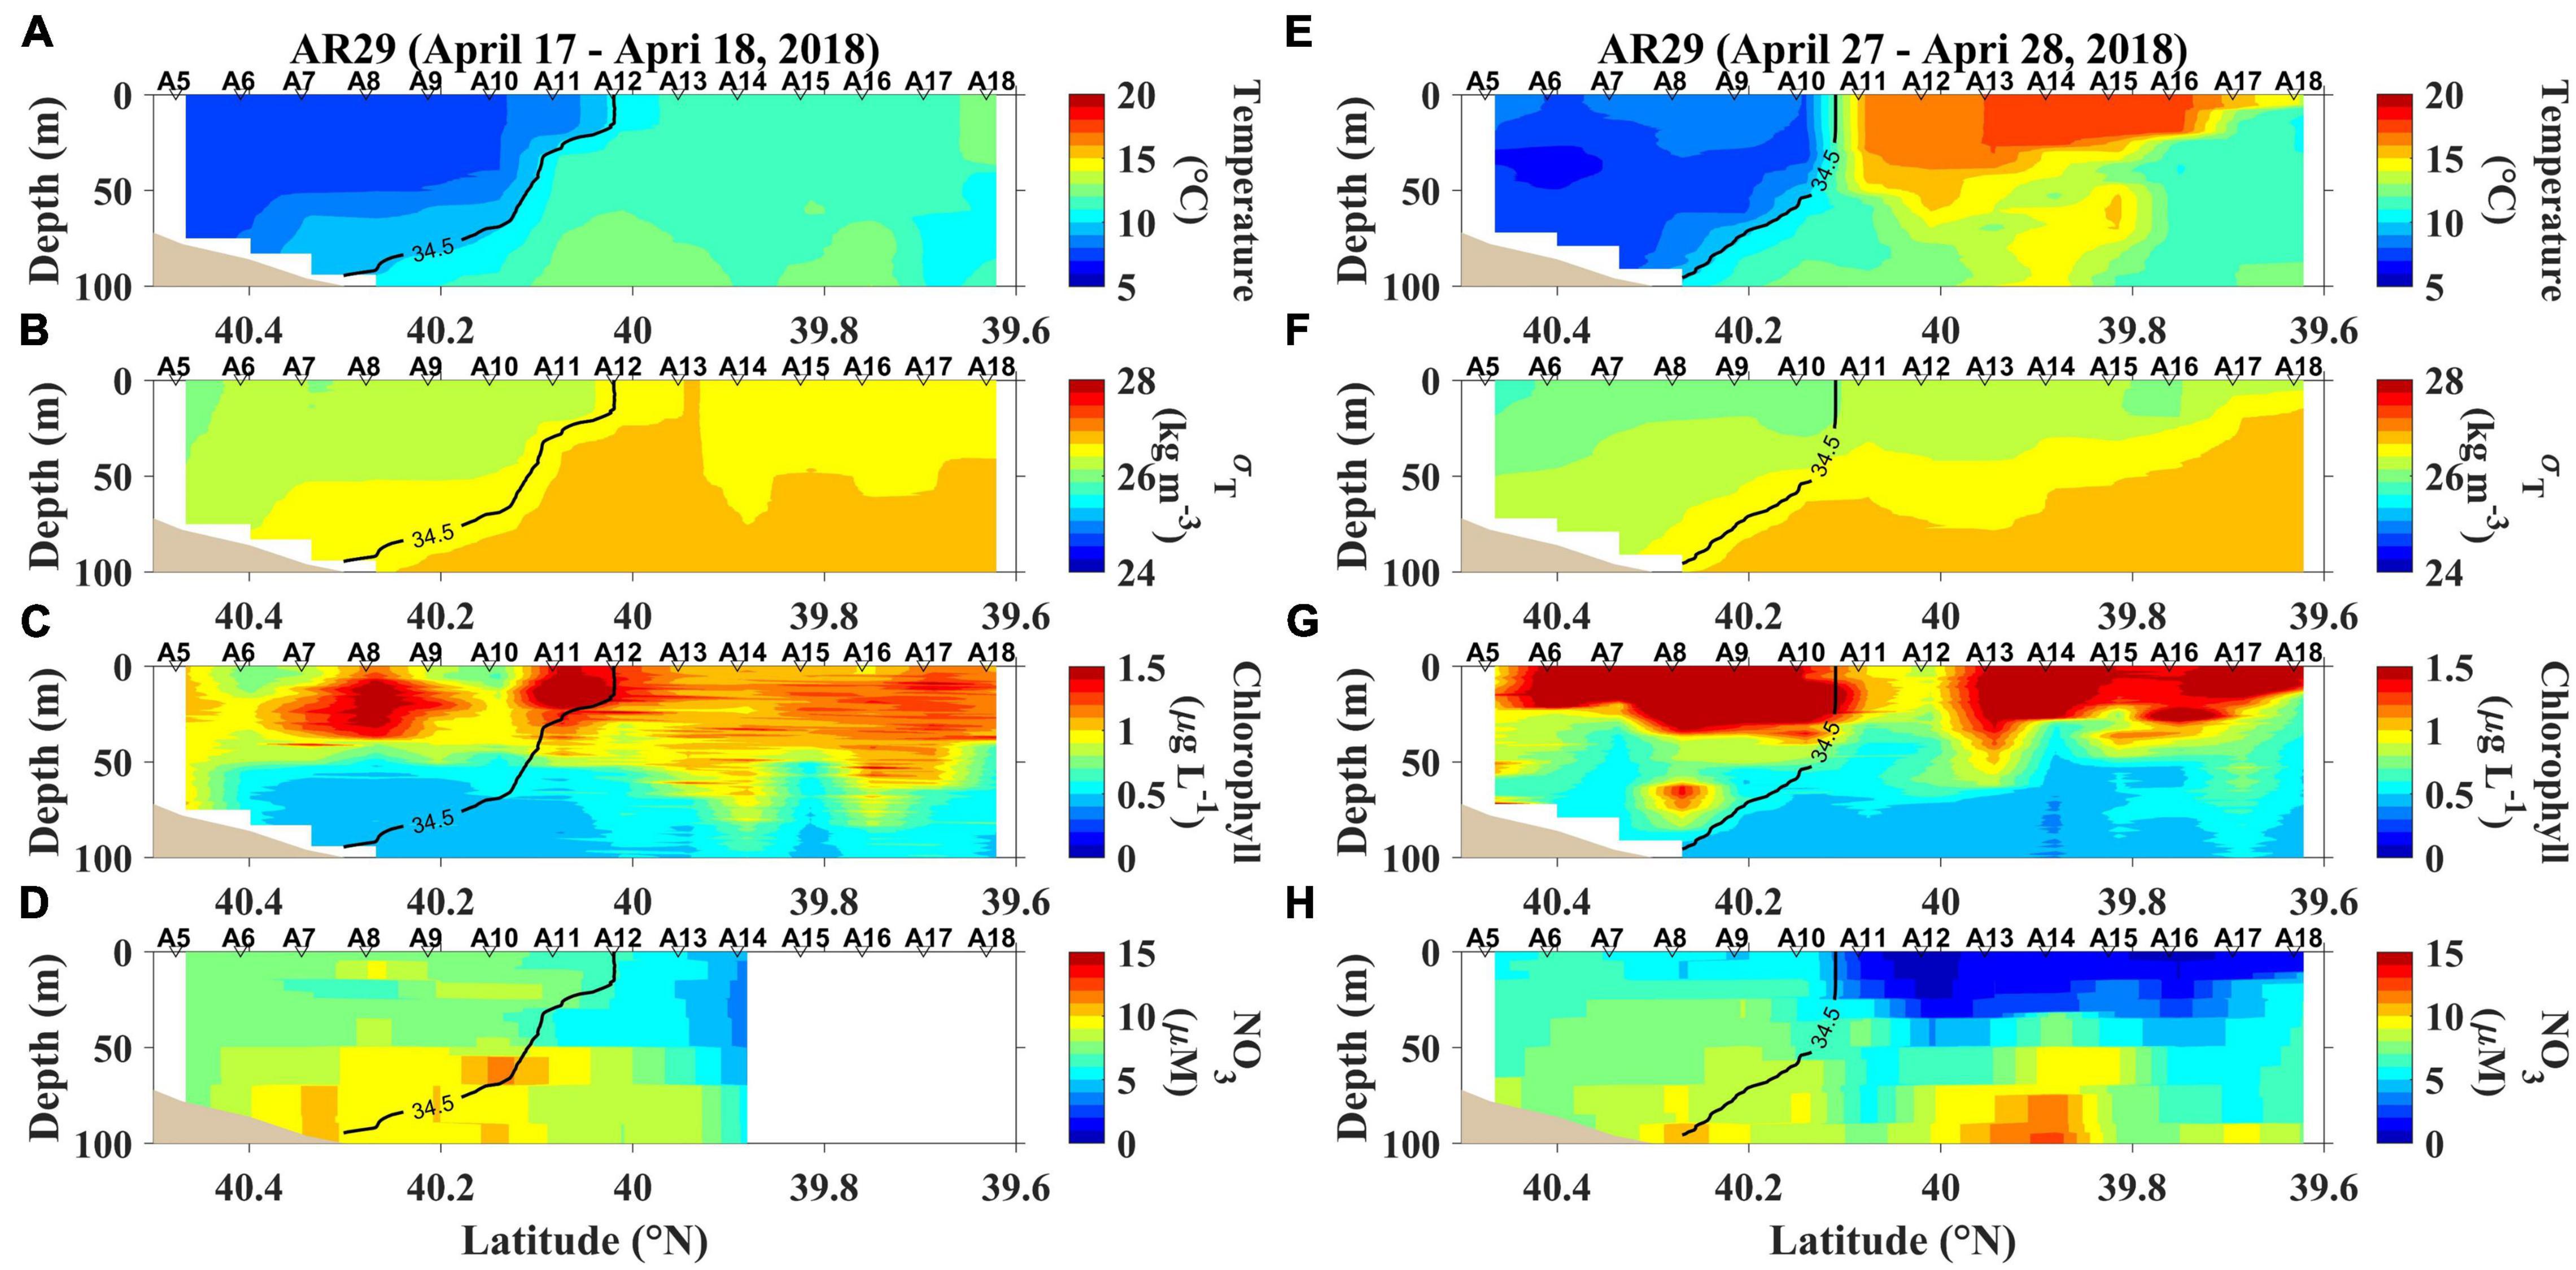
Figure 2. The first and last section occupied during AR29. (A) temperature, (B) density (expressed as σT), (C) chlorophyll and (D) nitrate concentrations (NO3) sampled from April 17–18, 2018, and (E) temperature, (F) density (expressed as σT), (G) chlorophyll and (H) nitrate concentrations (NO3) sampled from April 27–28, 2018.
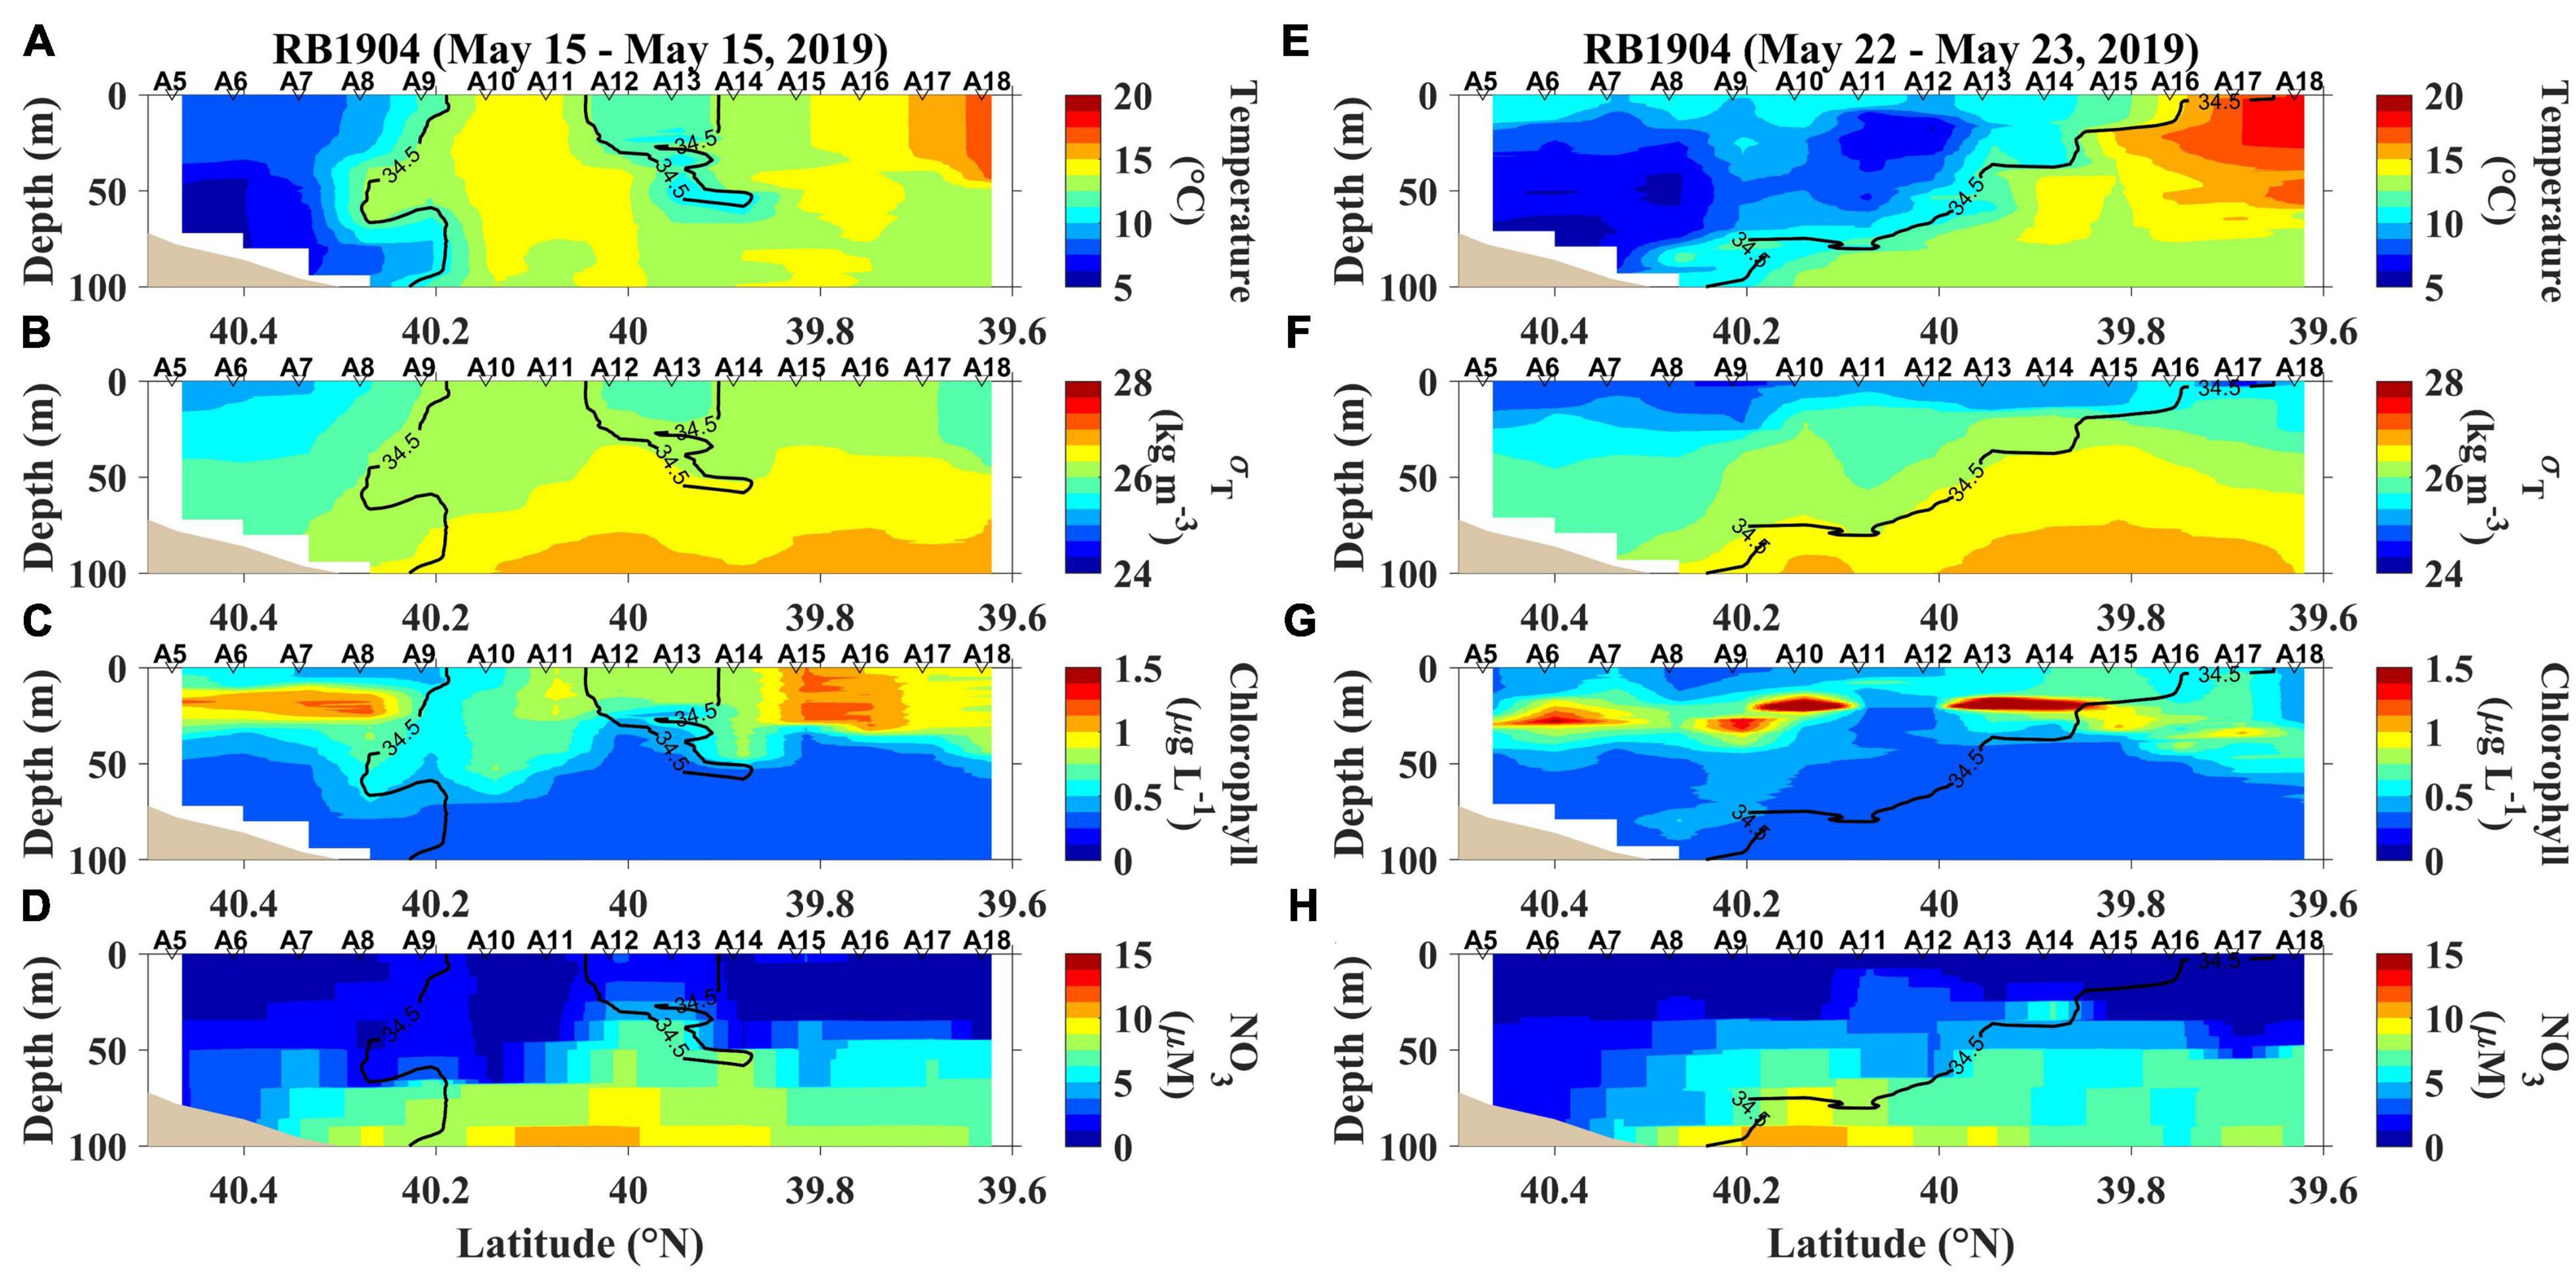
Figure 3. The first and last section occupied during RB1904; (A) temperature, (B) density (expressed as σT), (C) chlorophyll and (D) nitrate concentrations (NO3) sampled on May 15, 2019, and (E) temperature, (F) density (expressed as σT), (G) chlorophyll and (H) nitrate concentrations (NO3) sampled from May 22–23, 2019.
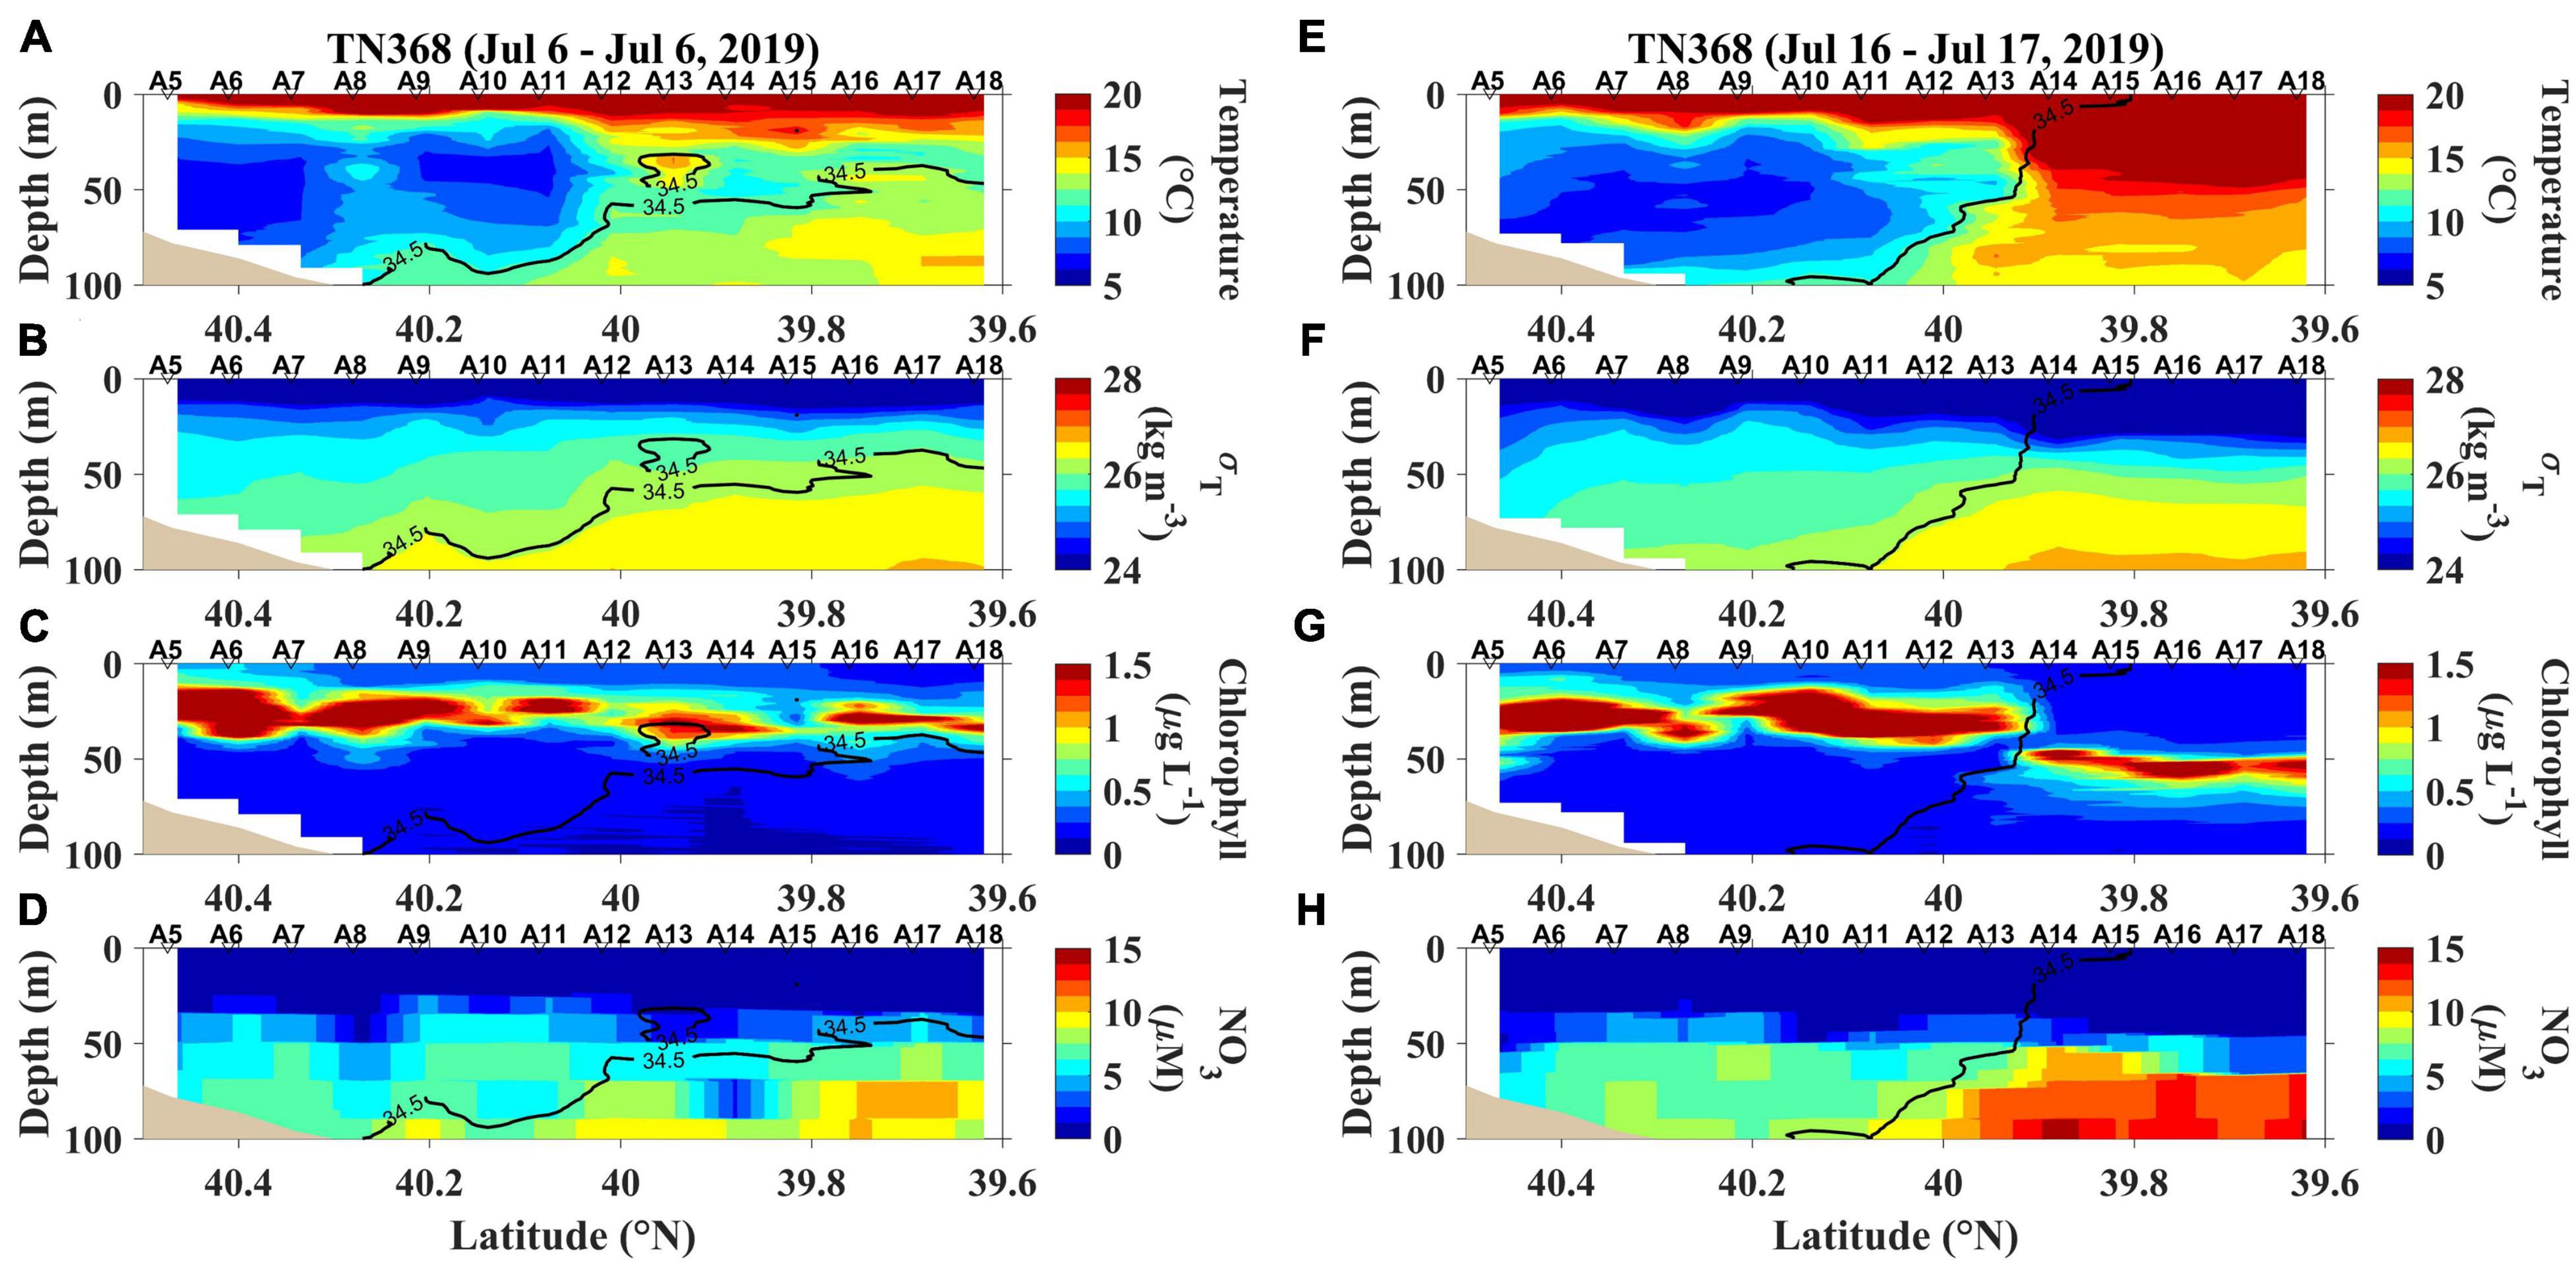
Figure 4. The first and last section occupied during TN368; (A) temperature, (B) density (expressed as σT), (C) chlorophyll and (D) nitrate concentrations (NO3) sampled on July 6, 2019, and (E) temperature, (F) density (expressed as σT), (G) chlorophyll and (H) nitrate concentrations (NO3) sampled from July 16–17, 2019.
Temperature increased markedly from inshore to offshore during AR29 (Figures 2A,E), and on April 25, 2018, the offshore area was substantially warmer (> 15°C; Supplementary Figure 1) than that inshore. The inner shelf’s chlorophyll was initially relatively low, but increased through time. Chlorophyll in offshore waters was elevated during the entire cruise. From April 17 to April 24, offshore movement of the front (the position of the 34.5 isohaline) was consistent with a westward motion of the front oriented in a WNW-ESE direction. The spring inshore bloom was at times dominated by Phaeocystis pouchetii, but the chlorophyll offshore was dominated by diatoms (Smith et al., 2021). Nitrate concentrations exceeded 5 μM inshore but less in offshore waters. By the end of the cruise offshore water nitrate concentrations were less than 1 μM (Figures 2D,H).
During RB1904, we observed two shelf-break eddies (Figure 3). From May 22-May 23 the subsurface shelf water was indicative of upwelling at the front, resulting in high nitrate water from the deeper part of the shelf being brought into the euphotic zone. A warm-core ring to the southeast of our sampling propagated north and west during sampling, which caused upwelling and may have led to substantial chlorophyll enhancement. The chlorophyll is enhanced by May 17 due to the effect of the ring streamer (Supplementary Figure 2). High abundance of diatoms also was observed at the offshore edge of the front during RB1904 (Oliver et al., 2022). Nitrate concentrations were low (2 μM or less) in the surface layer, but during the first transect a clear increase was noted in the frontal region (Figure 3D).
During TN368, surface temperatures were increased by solar radiation absorption and in turn generated strong stratification in the upper 30 m throughout the entire transect (Figure 4). Low-salinity shelf water was pulled southward by the ring streamer, and the 34.5 isohaline didn’t reach the surface (Figure 4). The stratification flattened isopycnals in the upper ocean (Figure 4), facilitating exchange of water masses across the front. As a result, the shelf water characteristics in the surface layer extended to station A18 (Figure 4 and Supplementary Figure 3). The strong stratification reduced the transport of nutrients into the surface layer, leading to low surface chlorophyll levels and elevated subsurface chlorophyll accumulations (Figure 4). Nitrate concentrations were very low (<0.5 μM in the upper 25 m) over the entire transect (Figure 4D,H).
Chlorophyll concentrations in the frontal area averaged ∼1.2 μg L–1 in early spring, 0.8 μg L–1 in late spring, and 0.7 μg L–1 in summer, although they were not statistically different (Figure 5). In AR29 chlorophyll concentrations averaged 1.2, 1.1, and 1.1 μg L–1 in the three regions. Mean chlorophyll concentrations in offshore waters decreased through time (from 1.2 to 0.4 μg L–1). In summer, chlorophyll generally decreased with distance from the coast: 0.9 μg L–1 in inshore areas, 0.6 μg L–1 at the front and 0.4 μg L–1 in offshore areas (Figure 5), whereas there was no marked trend in early and late spring. There was no obvious chlorophyll enhancement at the front in any season based on mean chlorophyll levels.
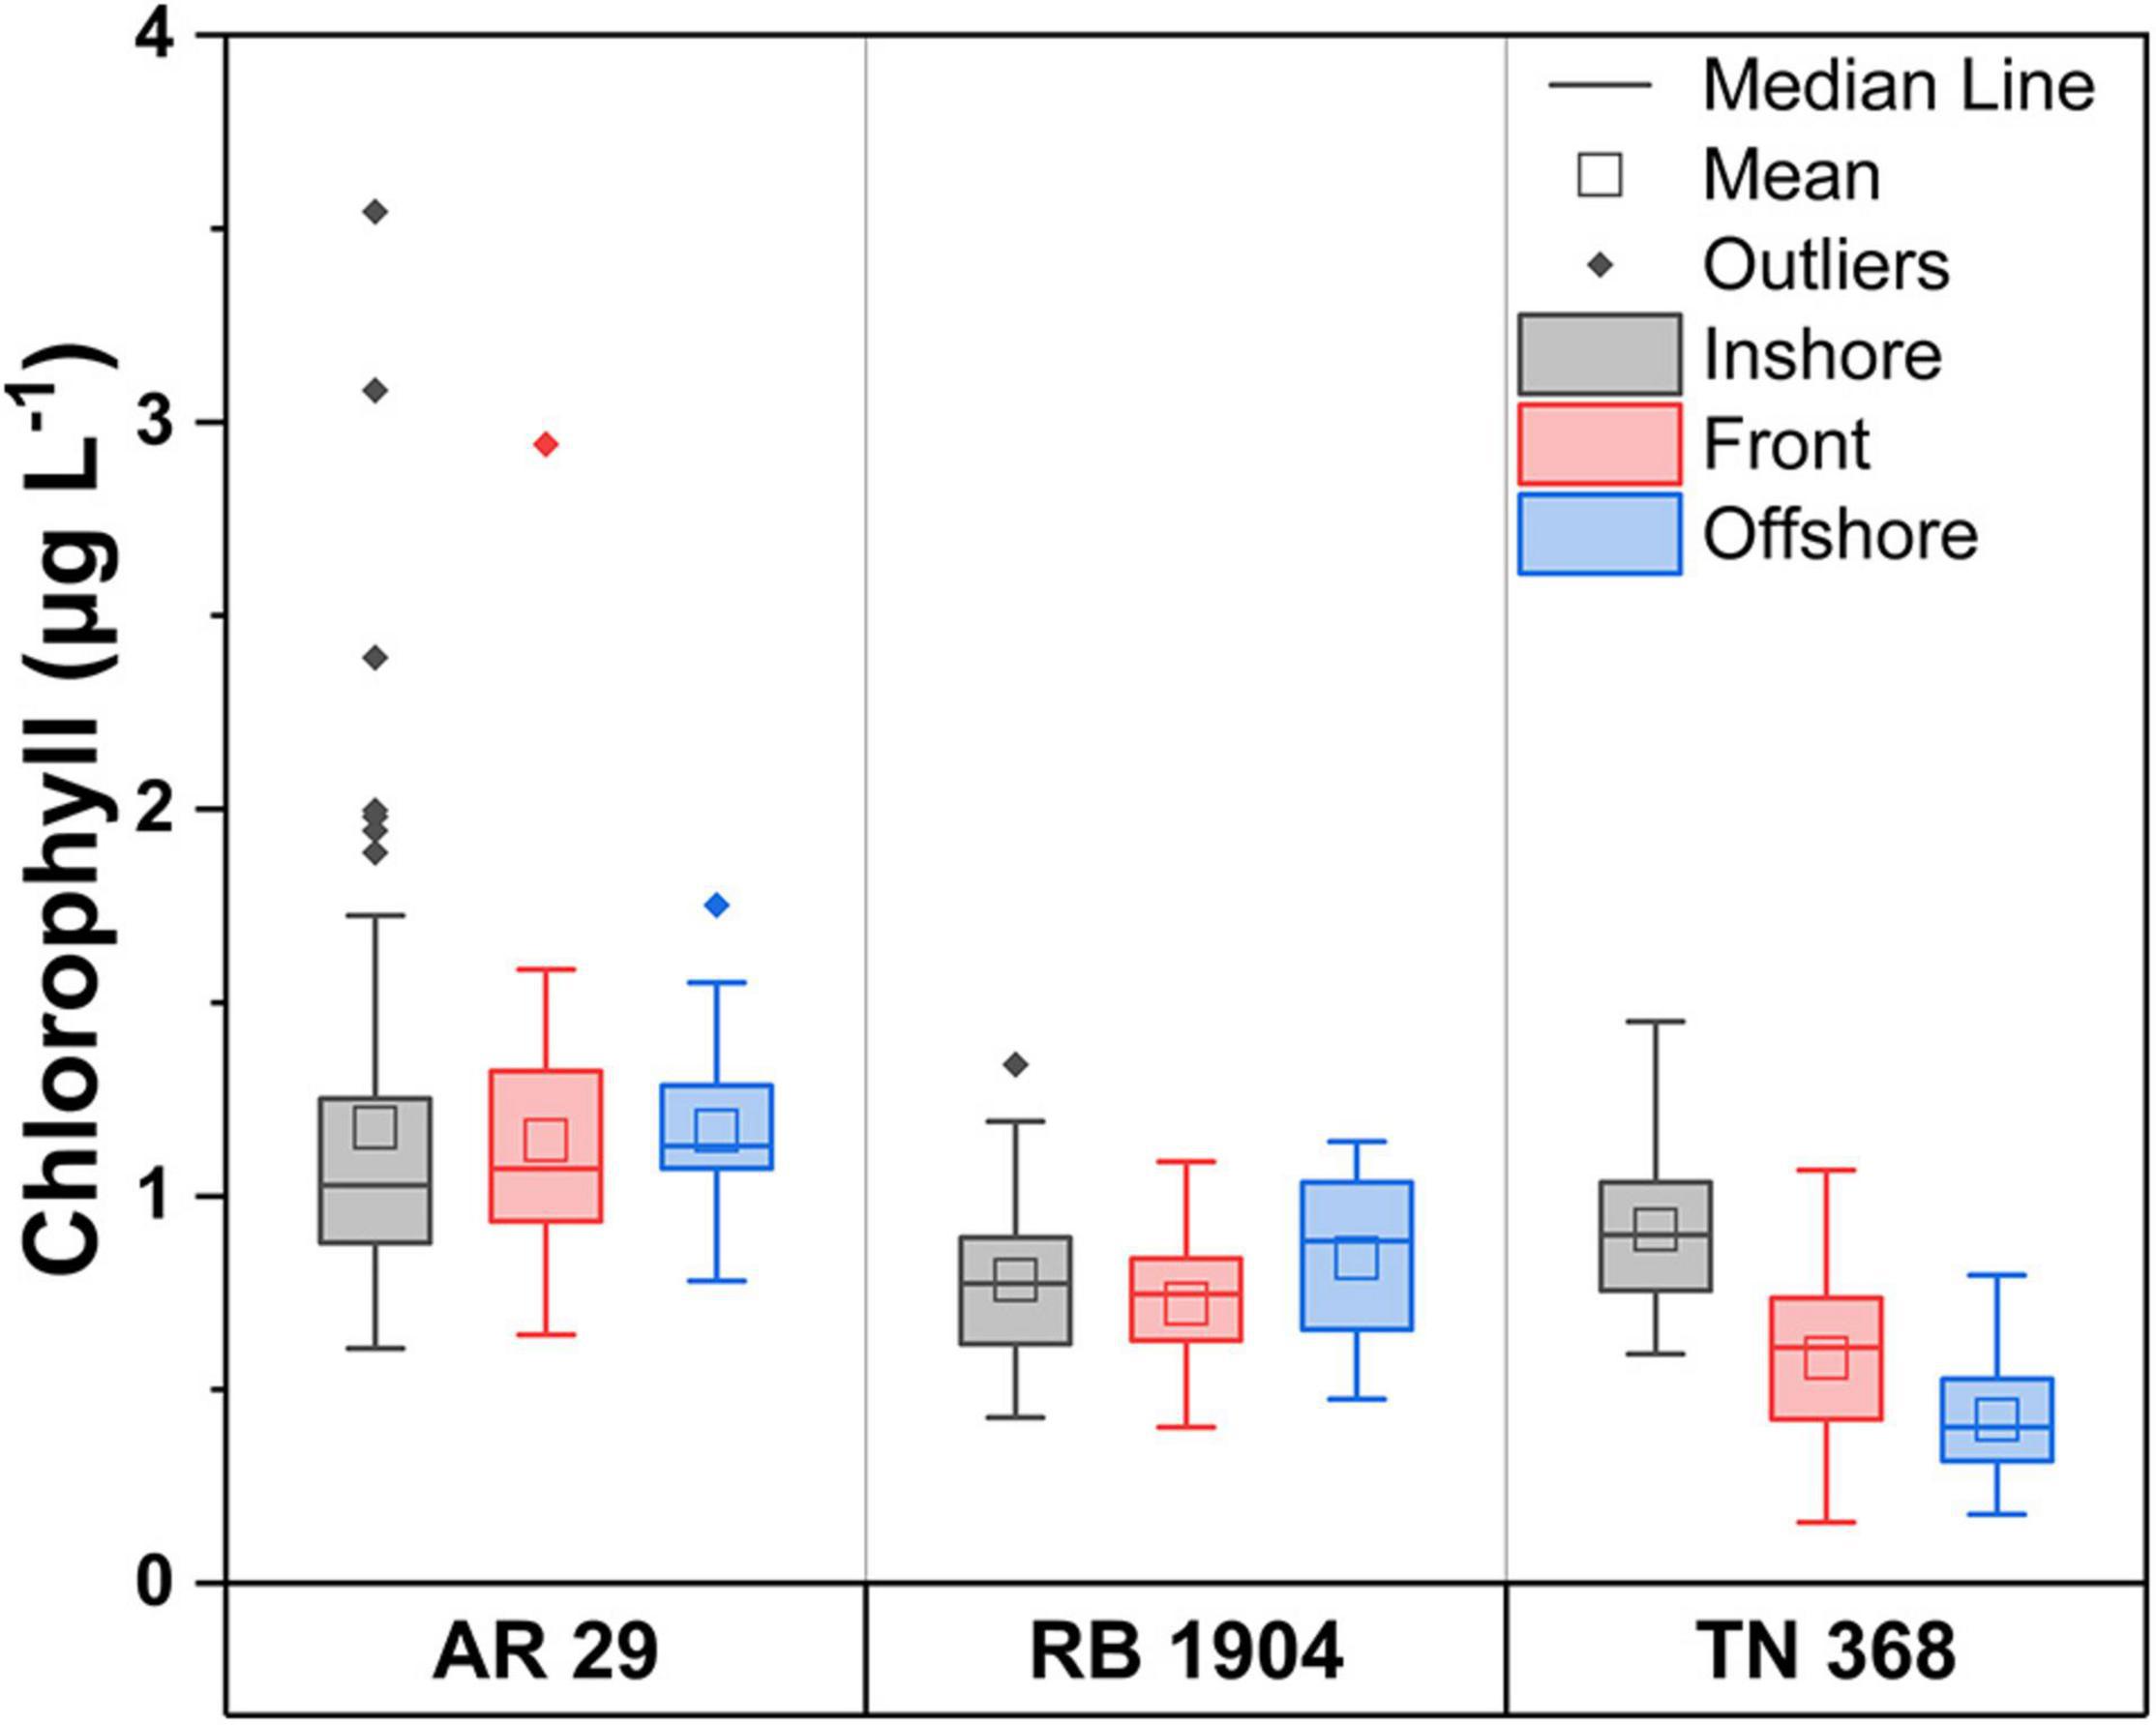
Figure 5. The distribution of chlorophyll at stations inshore of the front, near the front, and offshore of the front within the three cruises. The dots outside of the boxes are extreme values that were not included in the means. Error bars represent the standard deviations.
Productivity Estimates
Primary productivity was measured using a vertically resolved bio-optical model (PP1), 14C-uptake incubations (PP2), and surface variable estimates (PP3; Tables 2–4). The euphotic zone depths (and standard deviations) were 40.7 ± 12.2, 35.2 ± 6.6, and 39.2 ± 9.3 m during the AR29, RB1904, and TN368 cruises, suggesting that light reached similar depths in each cruise to support water column photosynthesis. Mixed layer depths decreased from early spring to summer due to the temperature effects on stratification. At most stations, the primary productivity measured via 14C-incubations was greater than the estimates of either the vertically resolved model or the surface variable estimates (Tables 2–4), but certainly within the range based on the Campbell et al. (2002) comparison. The average primary productivity was measured by 14C-incubations in early spring was ca. 1,560 mg C m–2 d–1, and decreased to 1,090 mg C m–2 d–1 in late spring and 456 mg C m–2 d–1 in summer. The vertically resolved model productivity averaged 575, 444, and 292 mg C m–2 d–1 in AR29, RB1904, and TN368. Primary productivity estimated from surface parameters was larger than those of the vertically resolved model and similar to those measured isotopically: 1,510, 1,000 and 524 mg C m–2 d–1 during the three cruises.
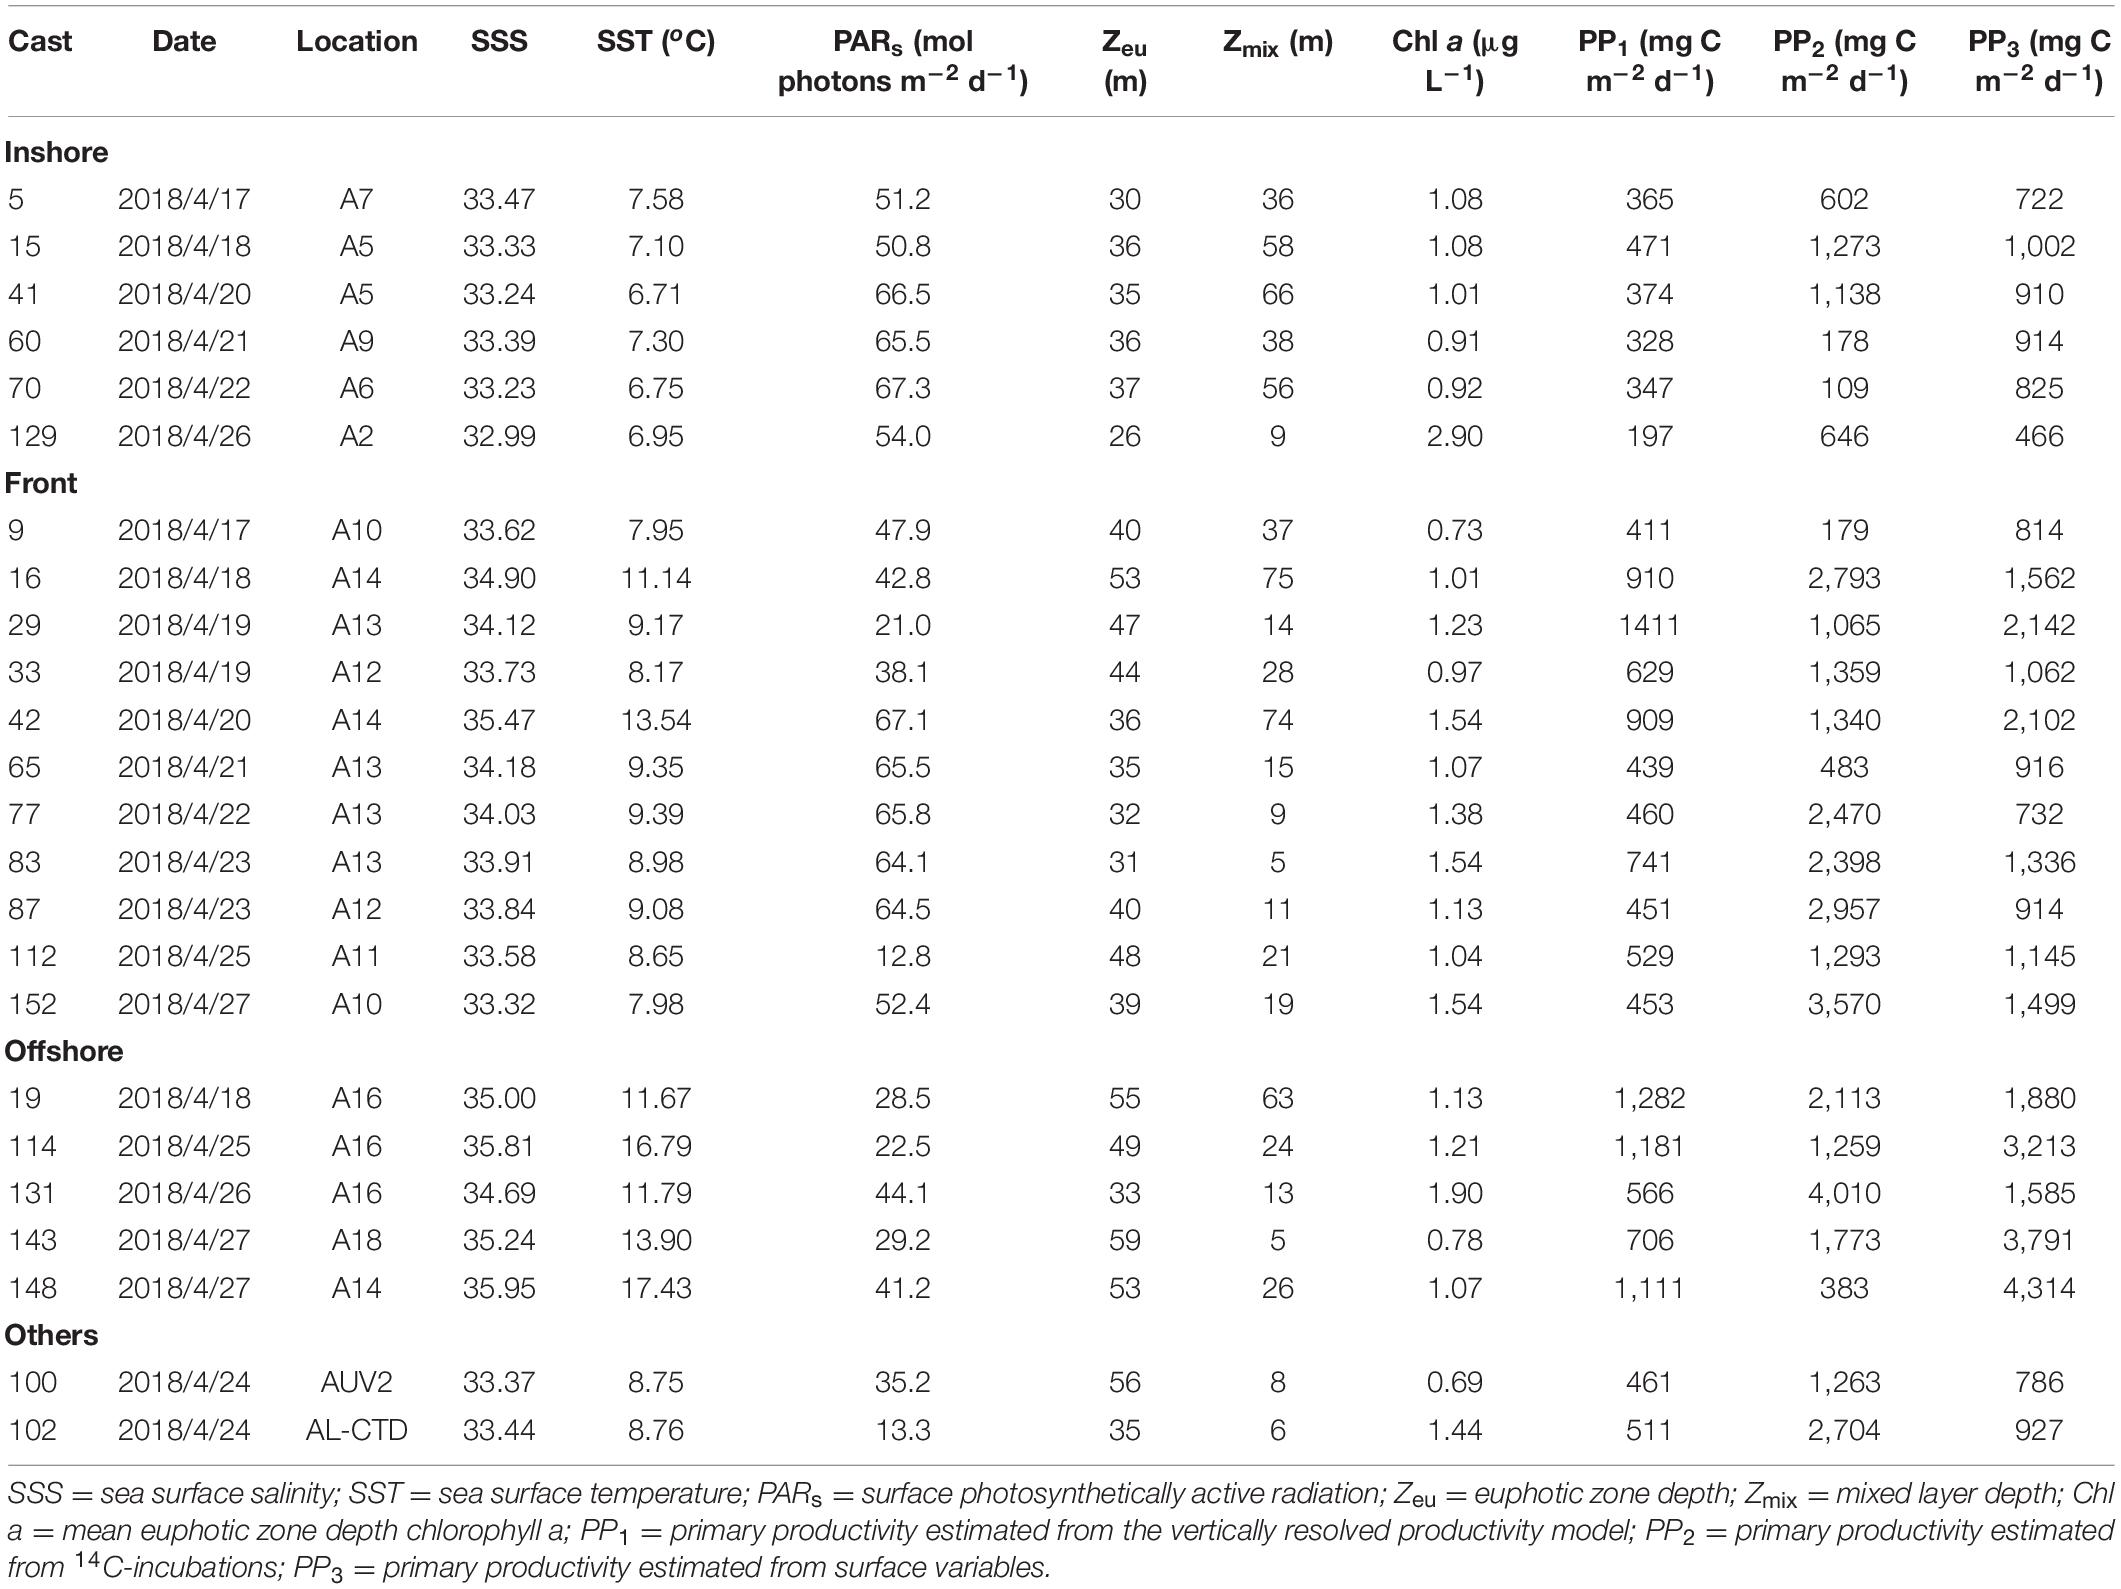
Table 2. Primary productivity during AR29.
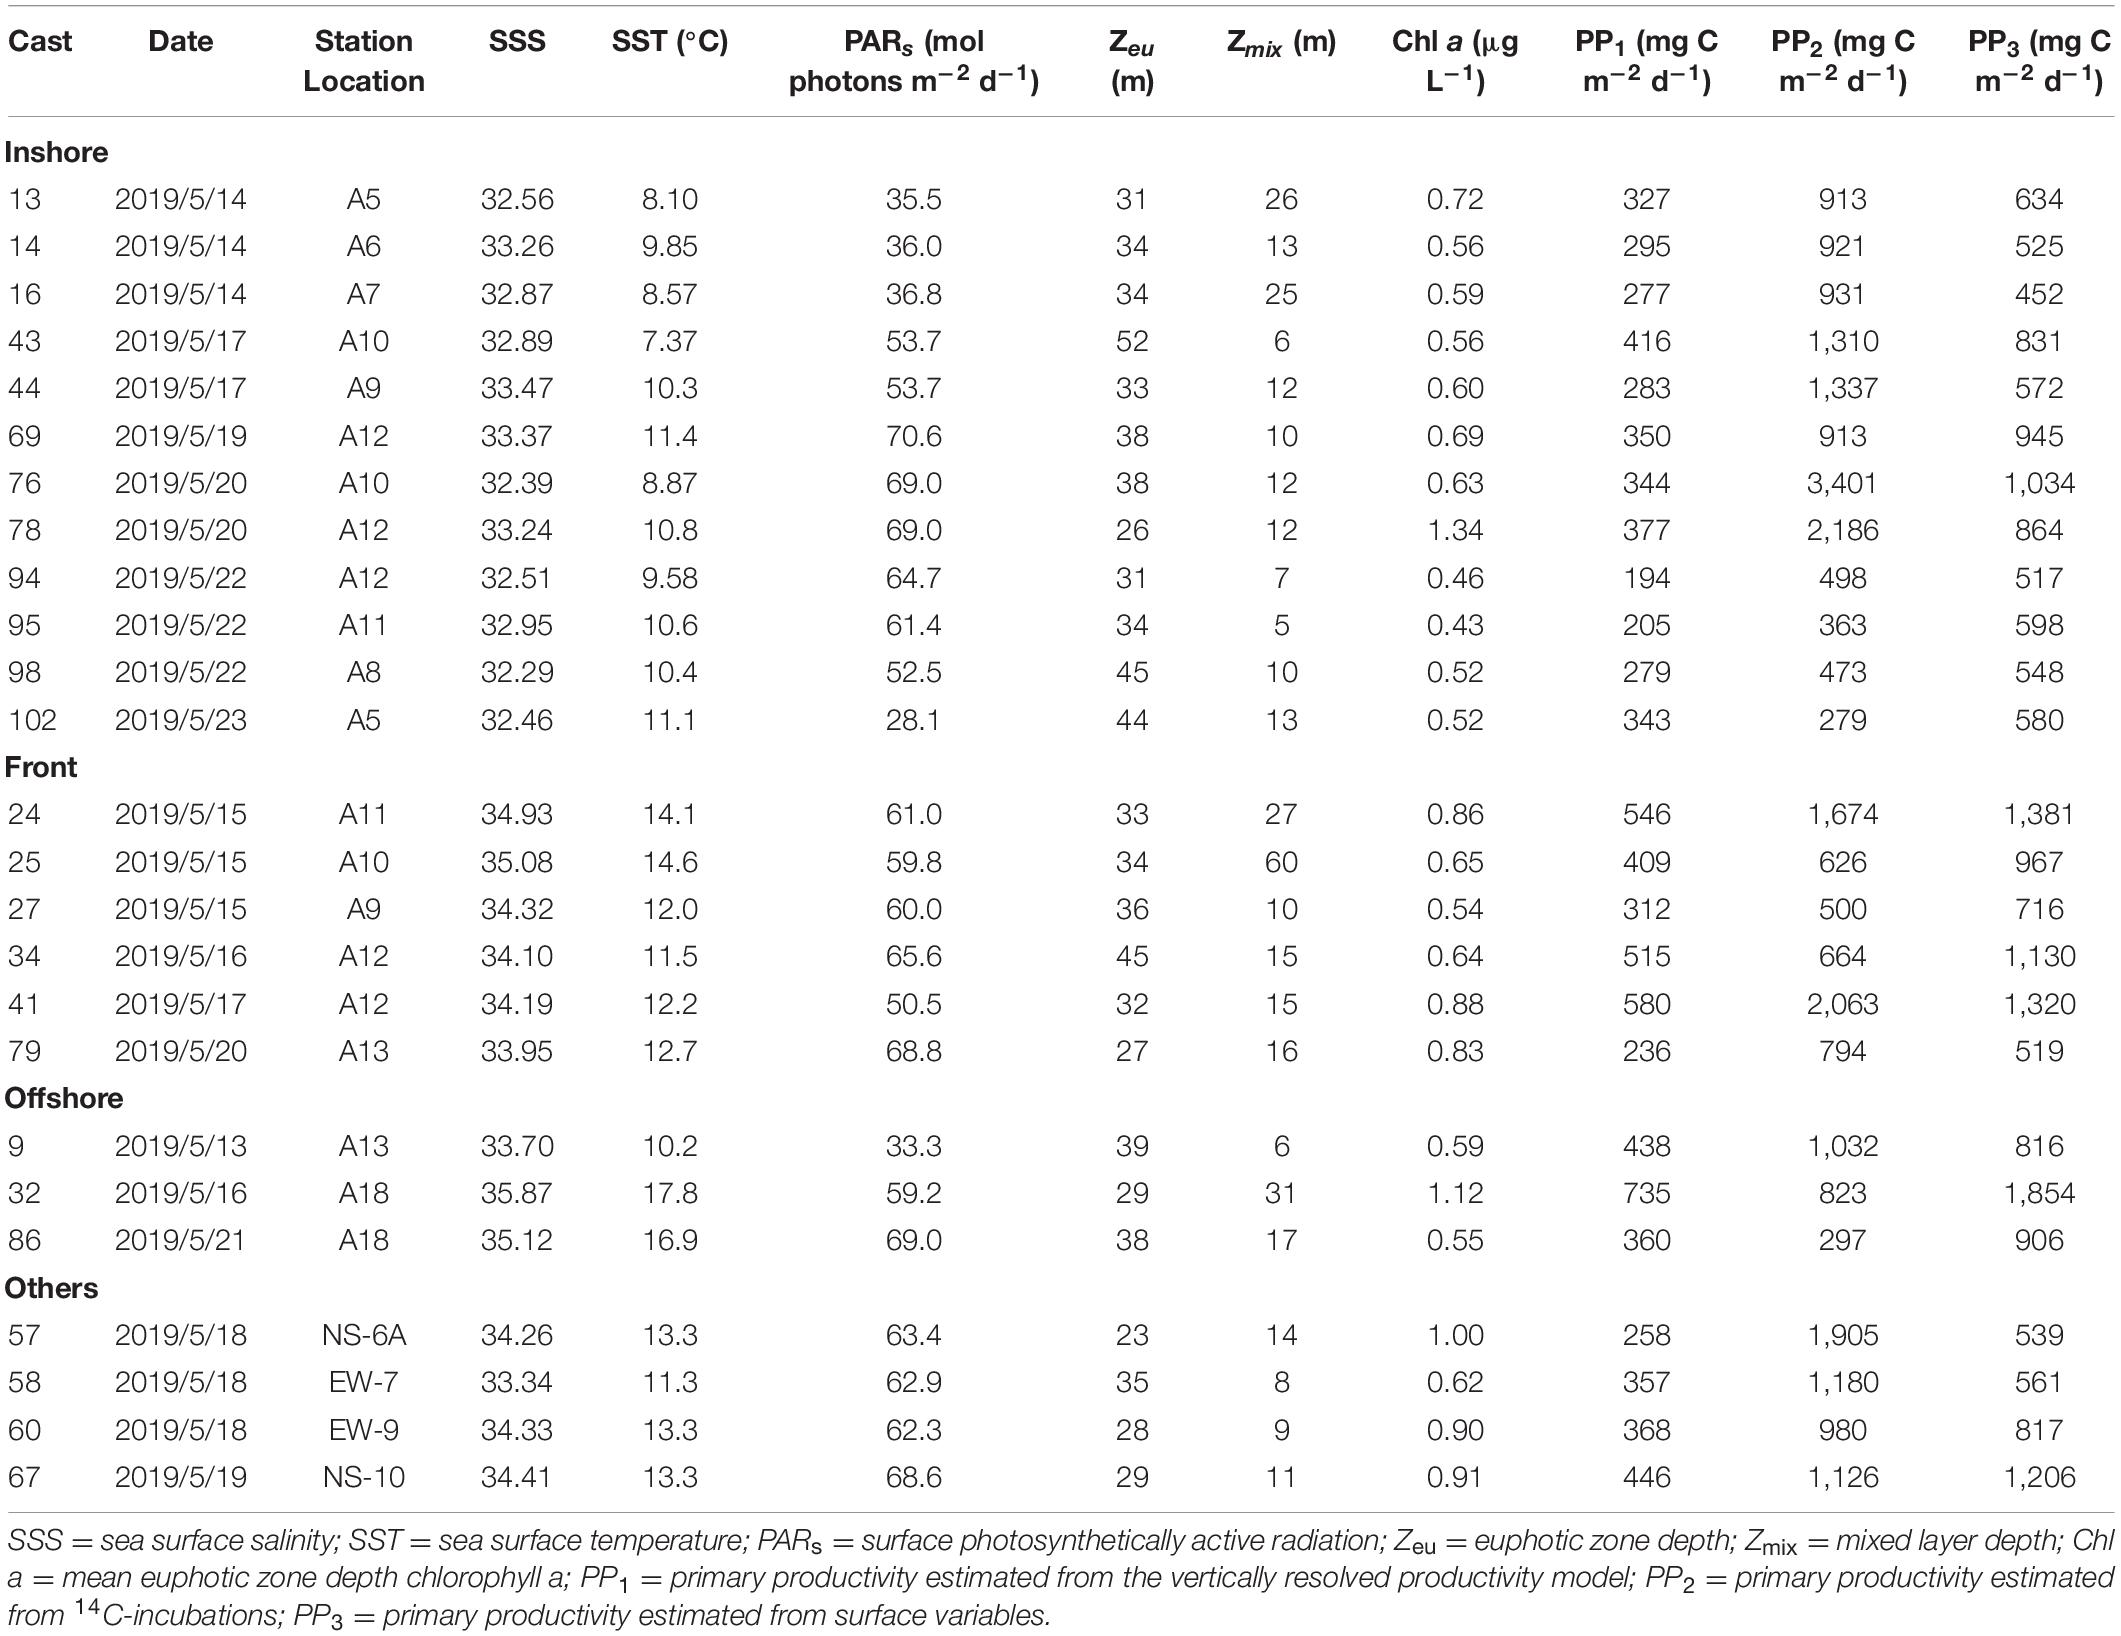
Table 3. Primary productivity during RB1904.
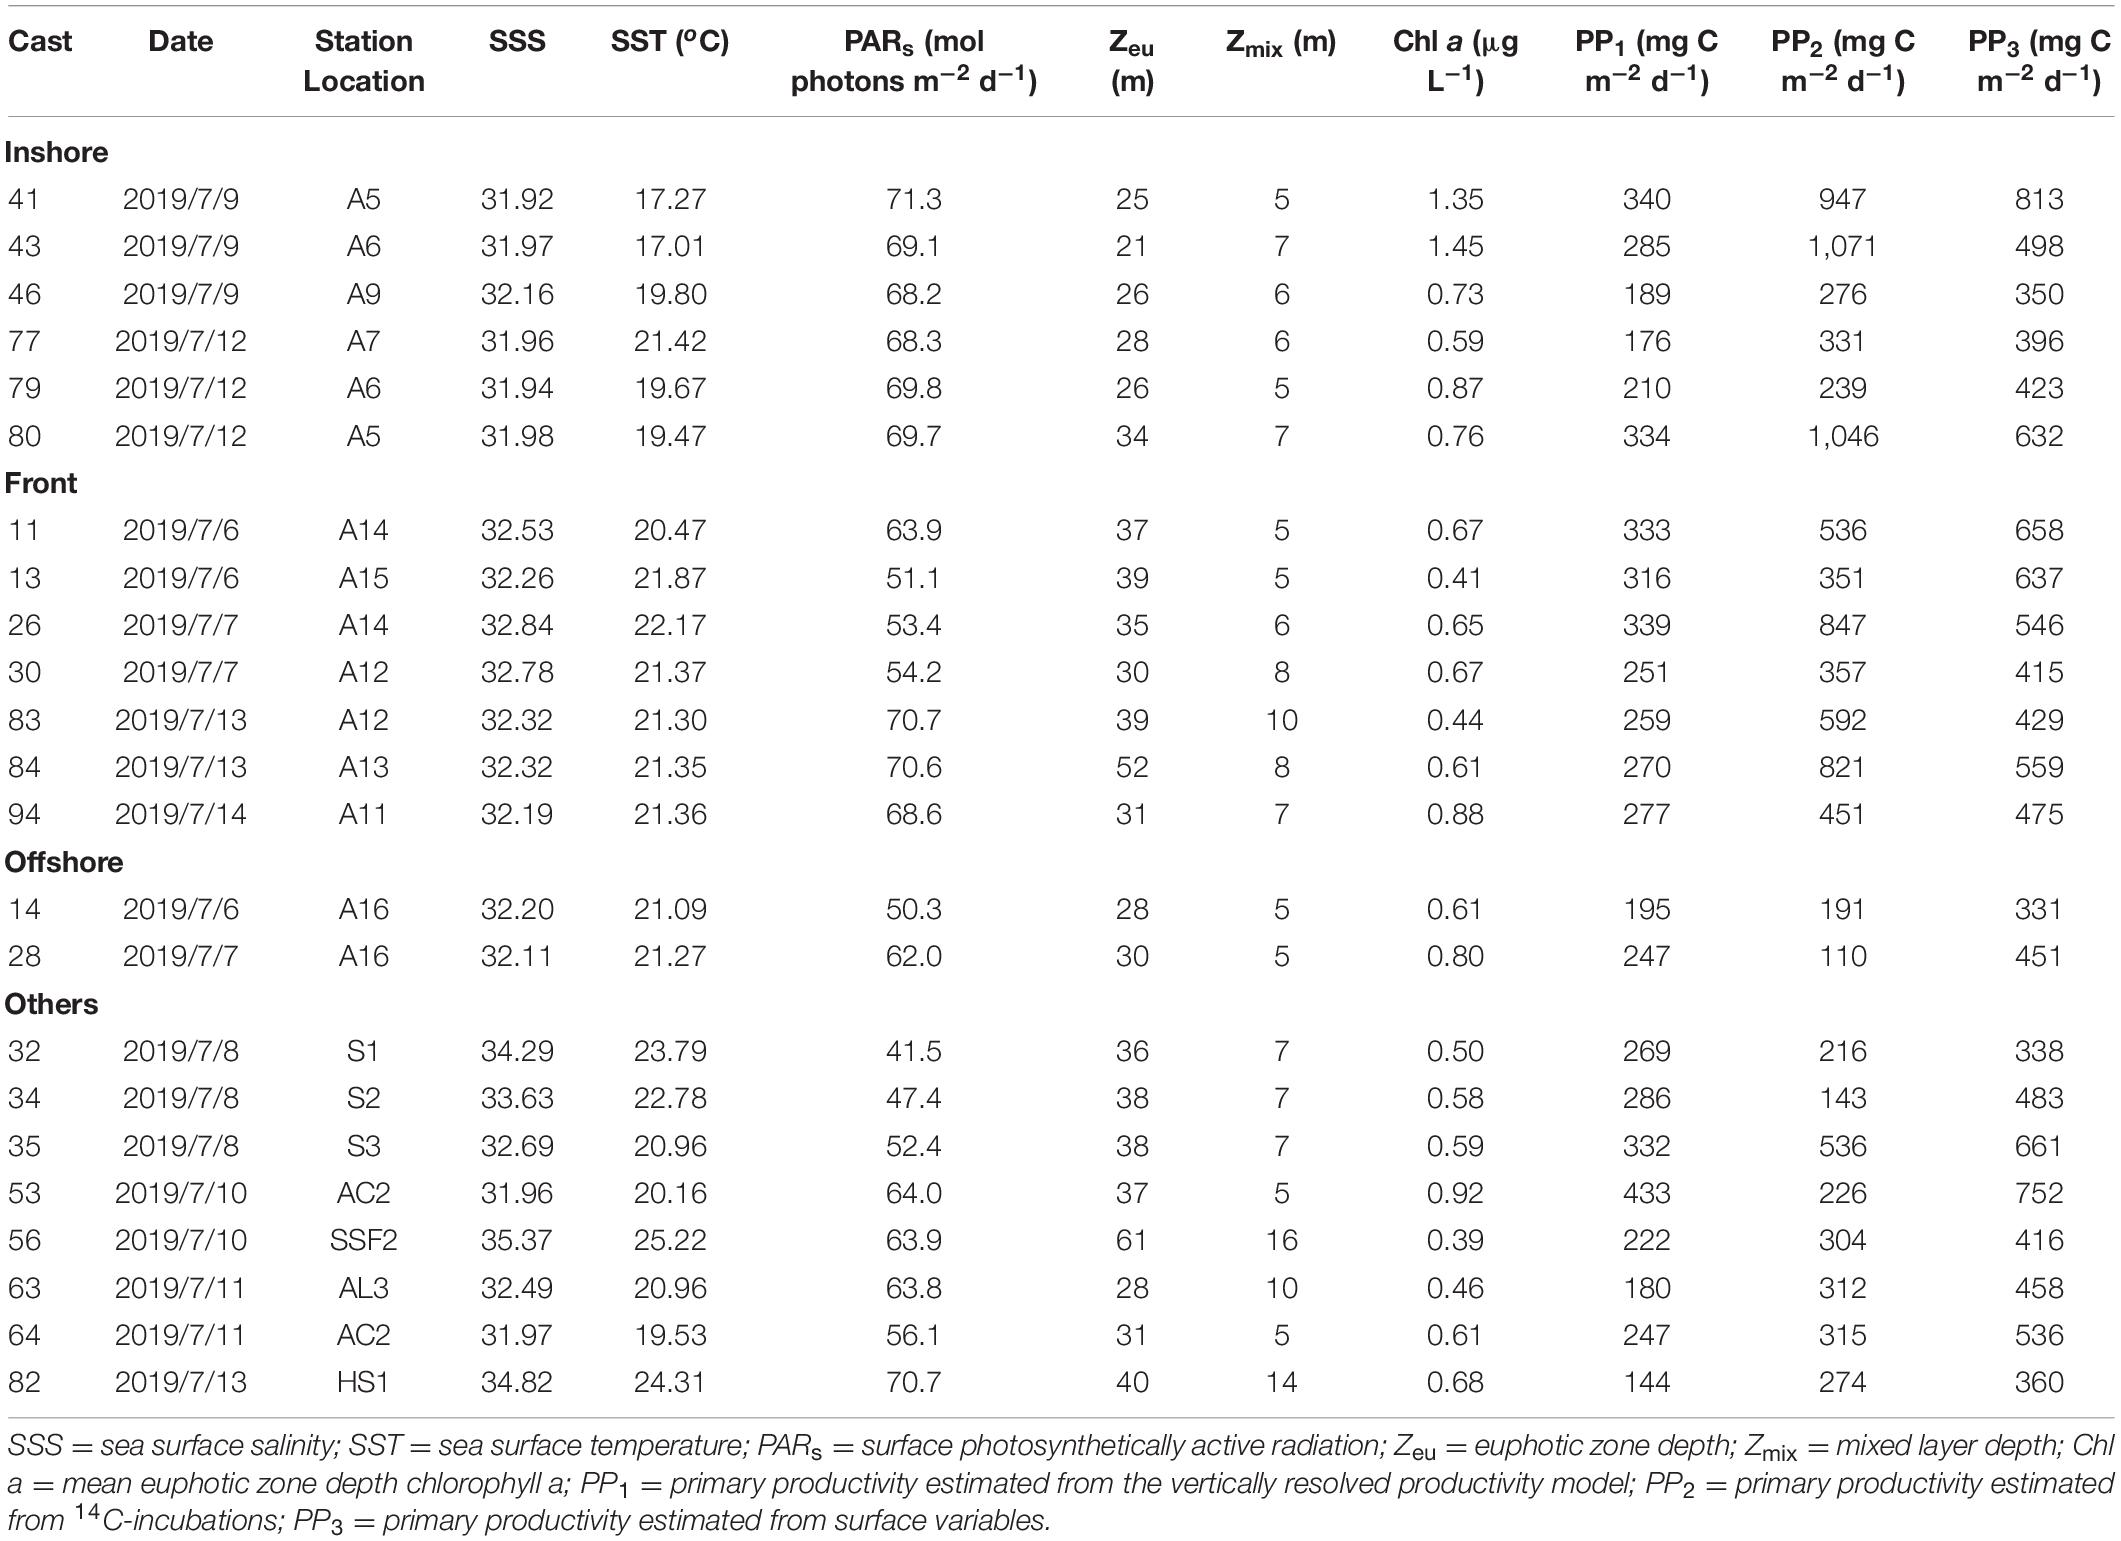
Table 4. Primary productivity during TN368.
As assimilation numbers (productivity per unit chlorophyll) are influenced by nutrients, we investigated the relationship of the maximum assimilation number within those stations where 14C-incubations were completed and nitrate concentrations at that isolume (data not shown). We found no significant correlation in any cruise, suggesting nutrients did not have a major impact on regulating maximum photosynthetic rates.
The Distribution of Primary Productivity
The distribution of primary productivity in early spring increased from inshore to offshore when estimated by the bio-optical model and surface variables estimates, but the 14C-estimates suggested a slight productivity enhancement near the front (Figure 6). Individual transects derived from the vertically resolved model suggested a temporary enhancement as well (Figures 6, 7). In late spring the same spatial trend with chlorophyll occurred: an increase with distance from the coast. Any frontal enhancement in RB1904 could not be resolved due to the limited number of 14C-incubations completed inshore. During TN368 productivity decreased from inshore to offshore as determined by all three estimates (Figures 6, 7) and paralelled the chlorophyll distribution (Figure 5). During early spring, primary productivity of the inshore area was low likely due to the relatively weak stratification, although a bloom of the haptophyte Phaeocystis occurred and increased productivity slightly (Smith et al., 2021). During late spring productivity was greatest in the deep, warmer waters influenced by the Gulf Stream intrusions and short productivity pulses driven by Ekman restratification (Oliver et al., 2022), and in summer was greatest on the continental shelf.
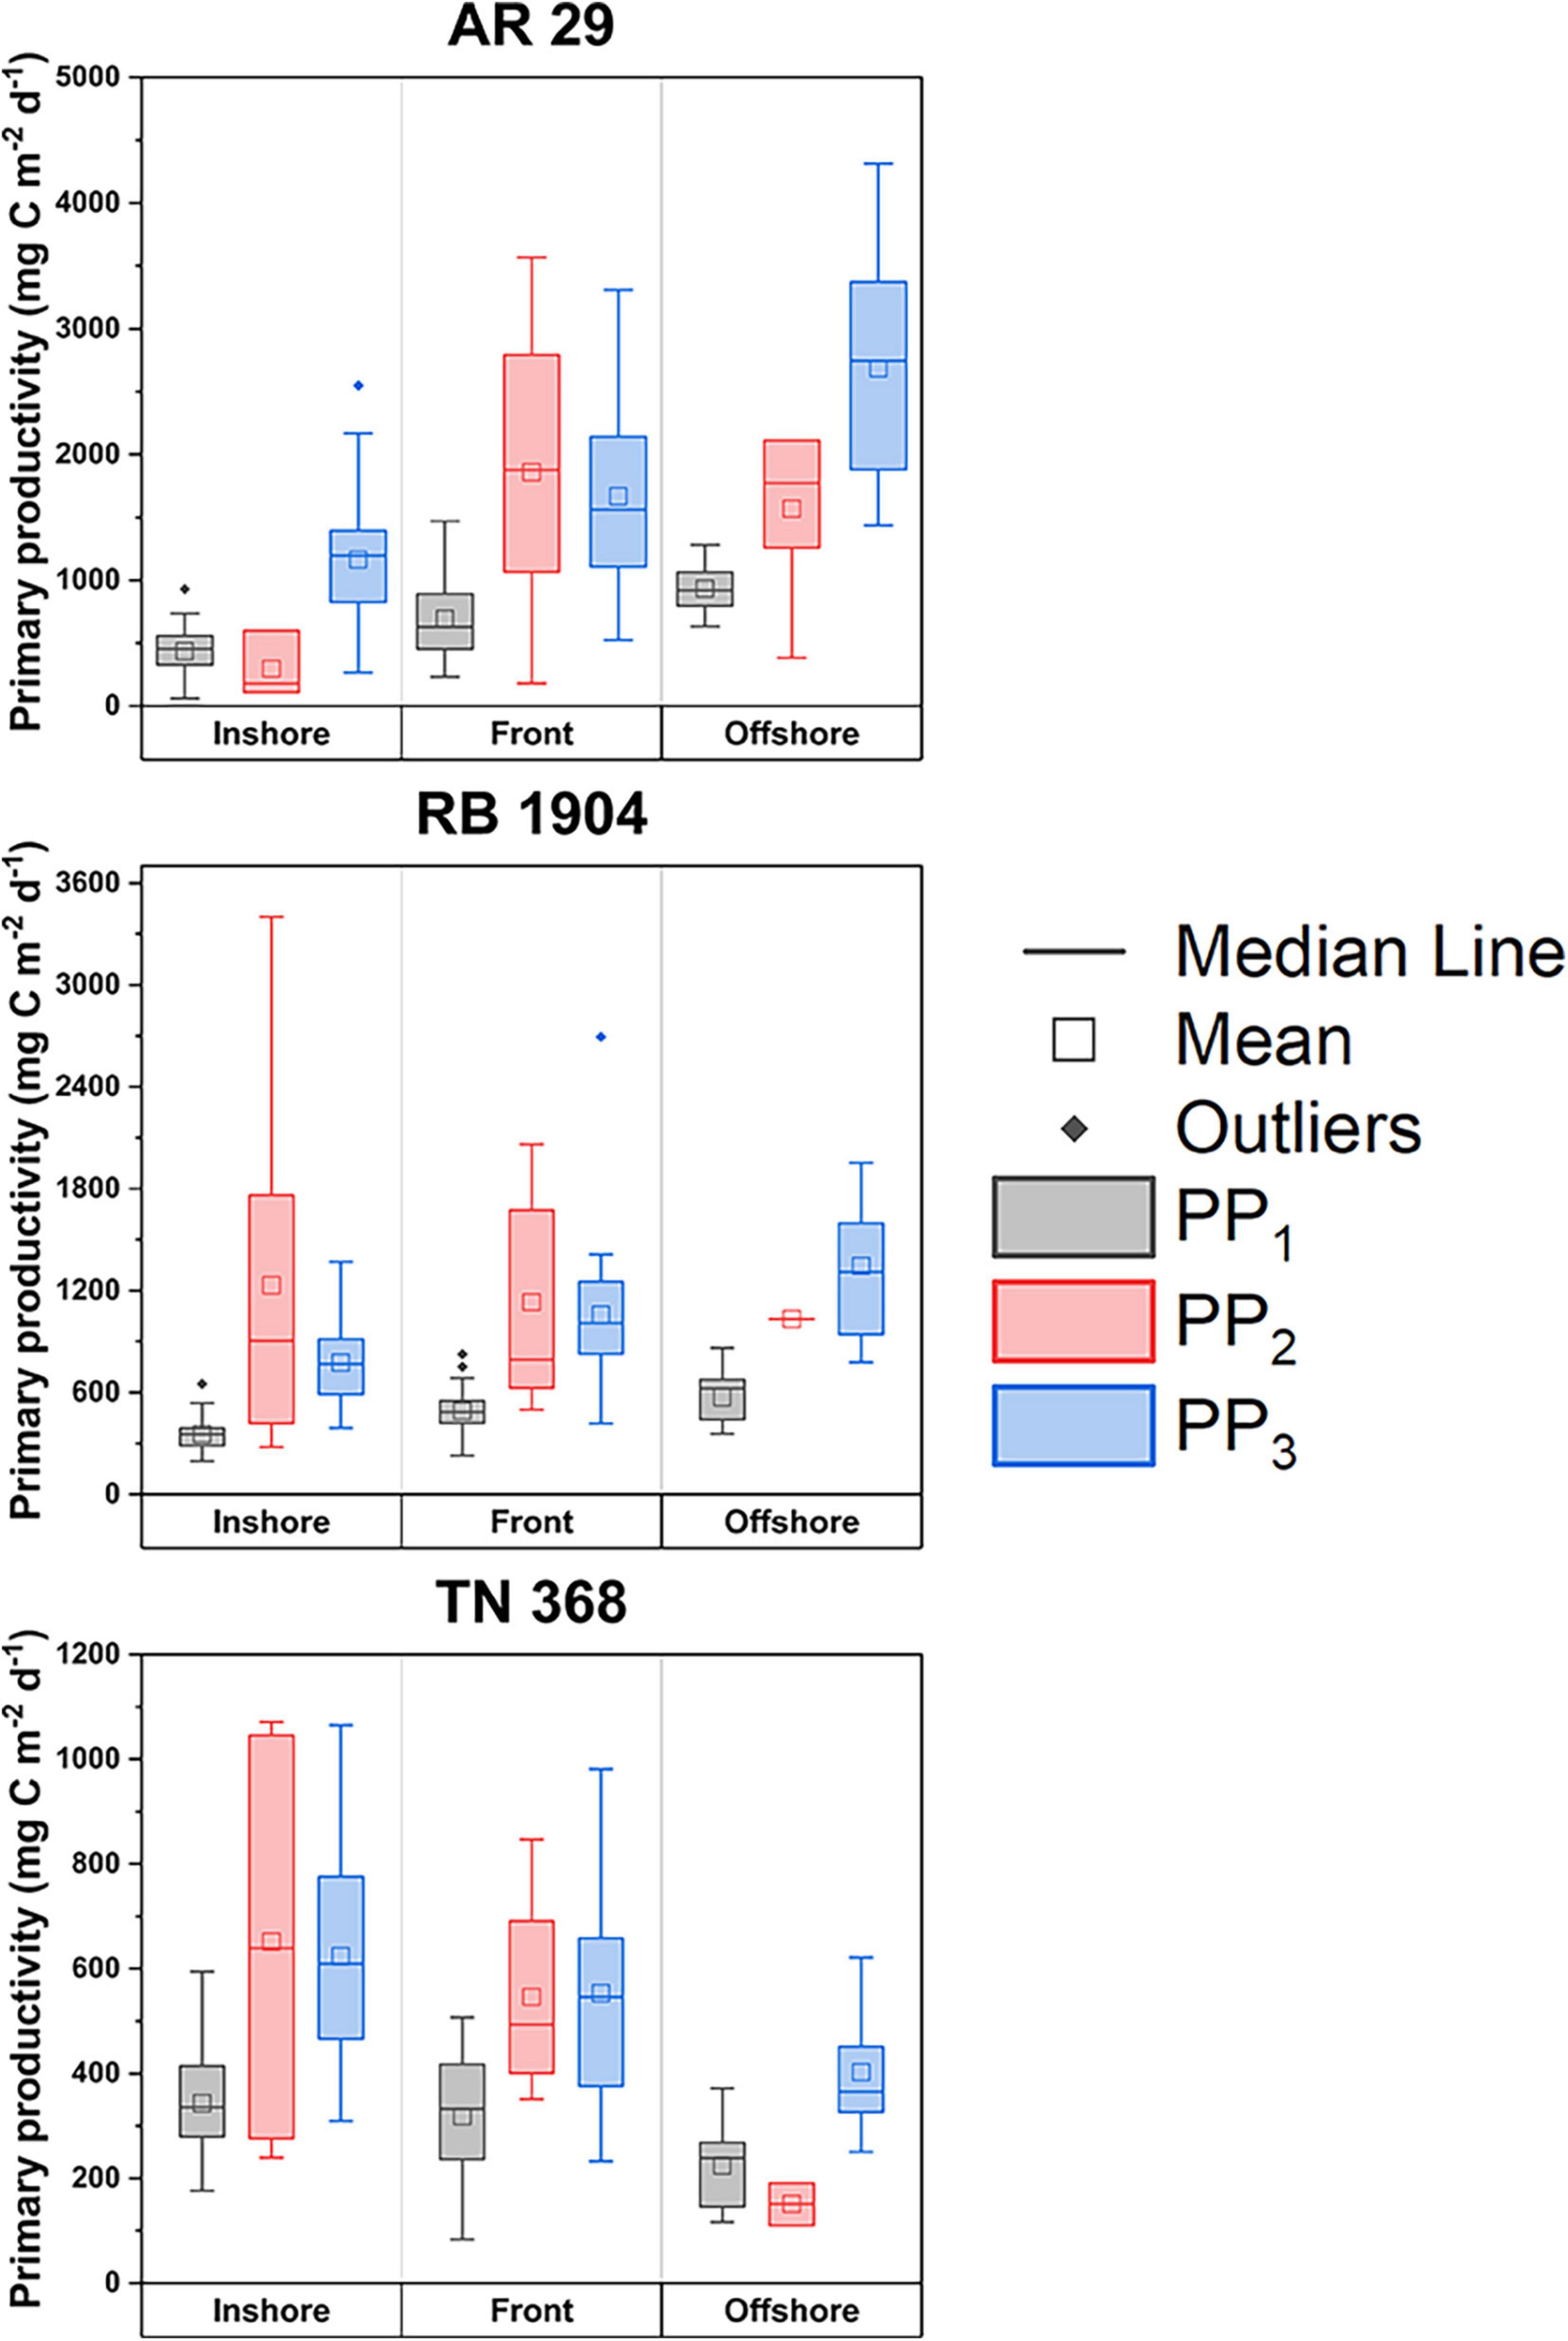
Figure 6. The distribution of average primary productivity at stations inshore of the front, near the front, and offshore of the front within the three cruises. The dots outside of the boxes are extreme values that were not included in the means. Error bars represent the standard deviations.
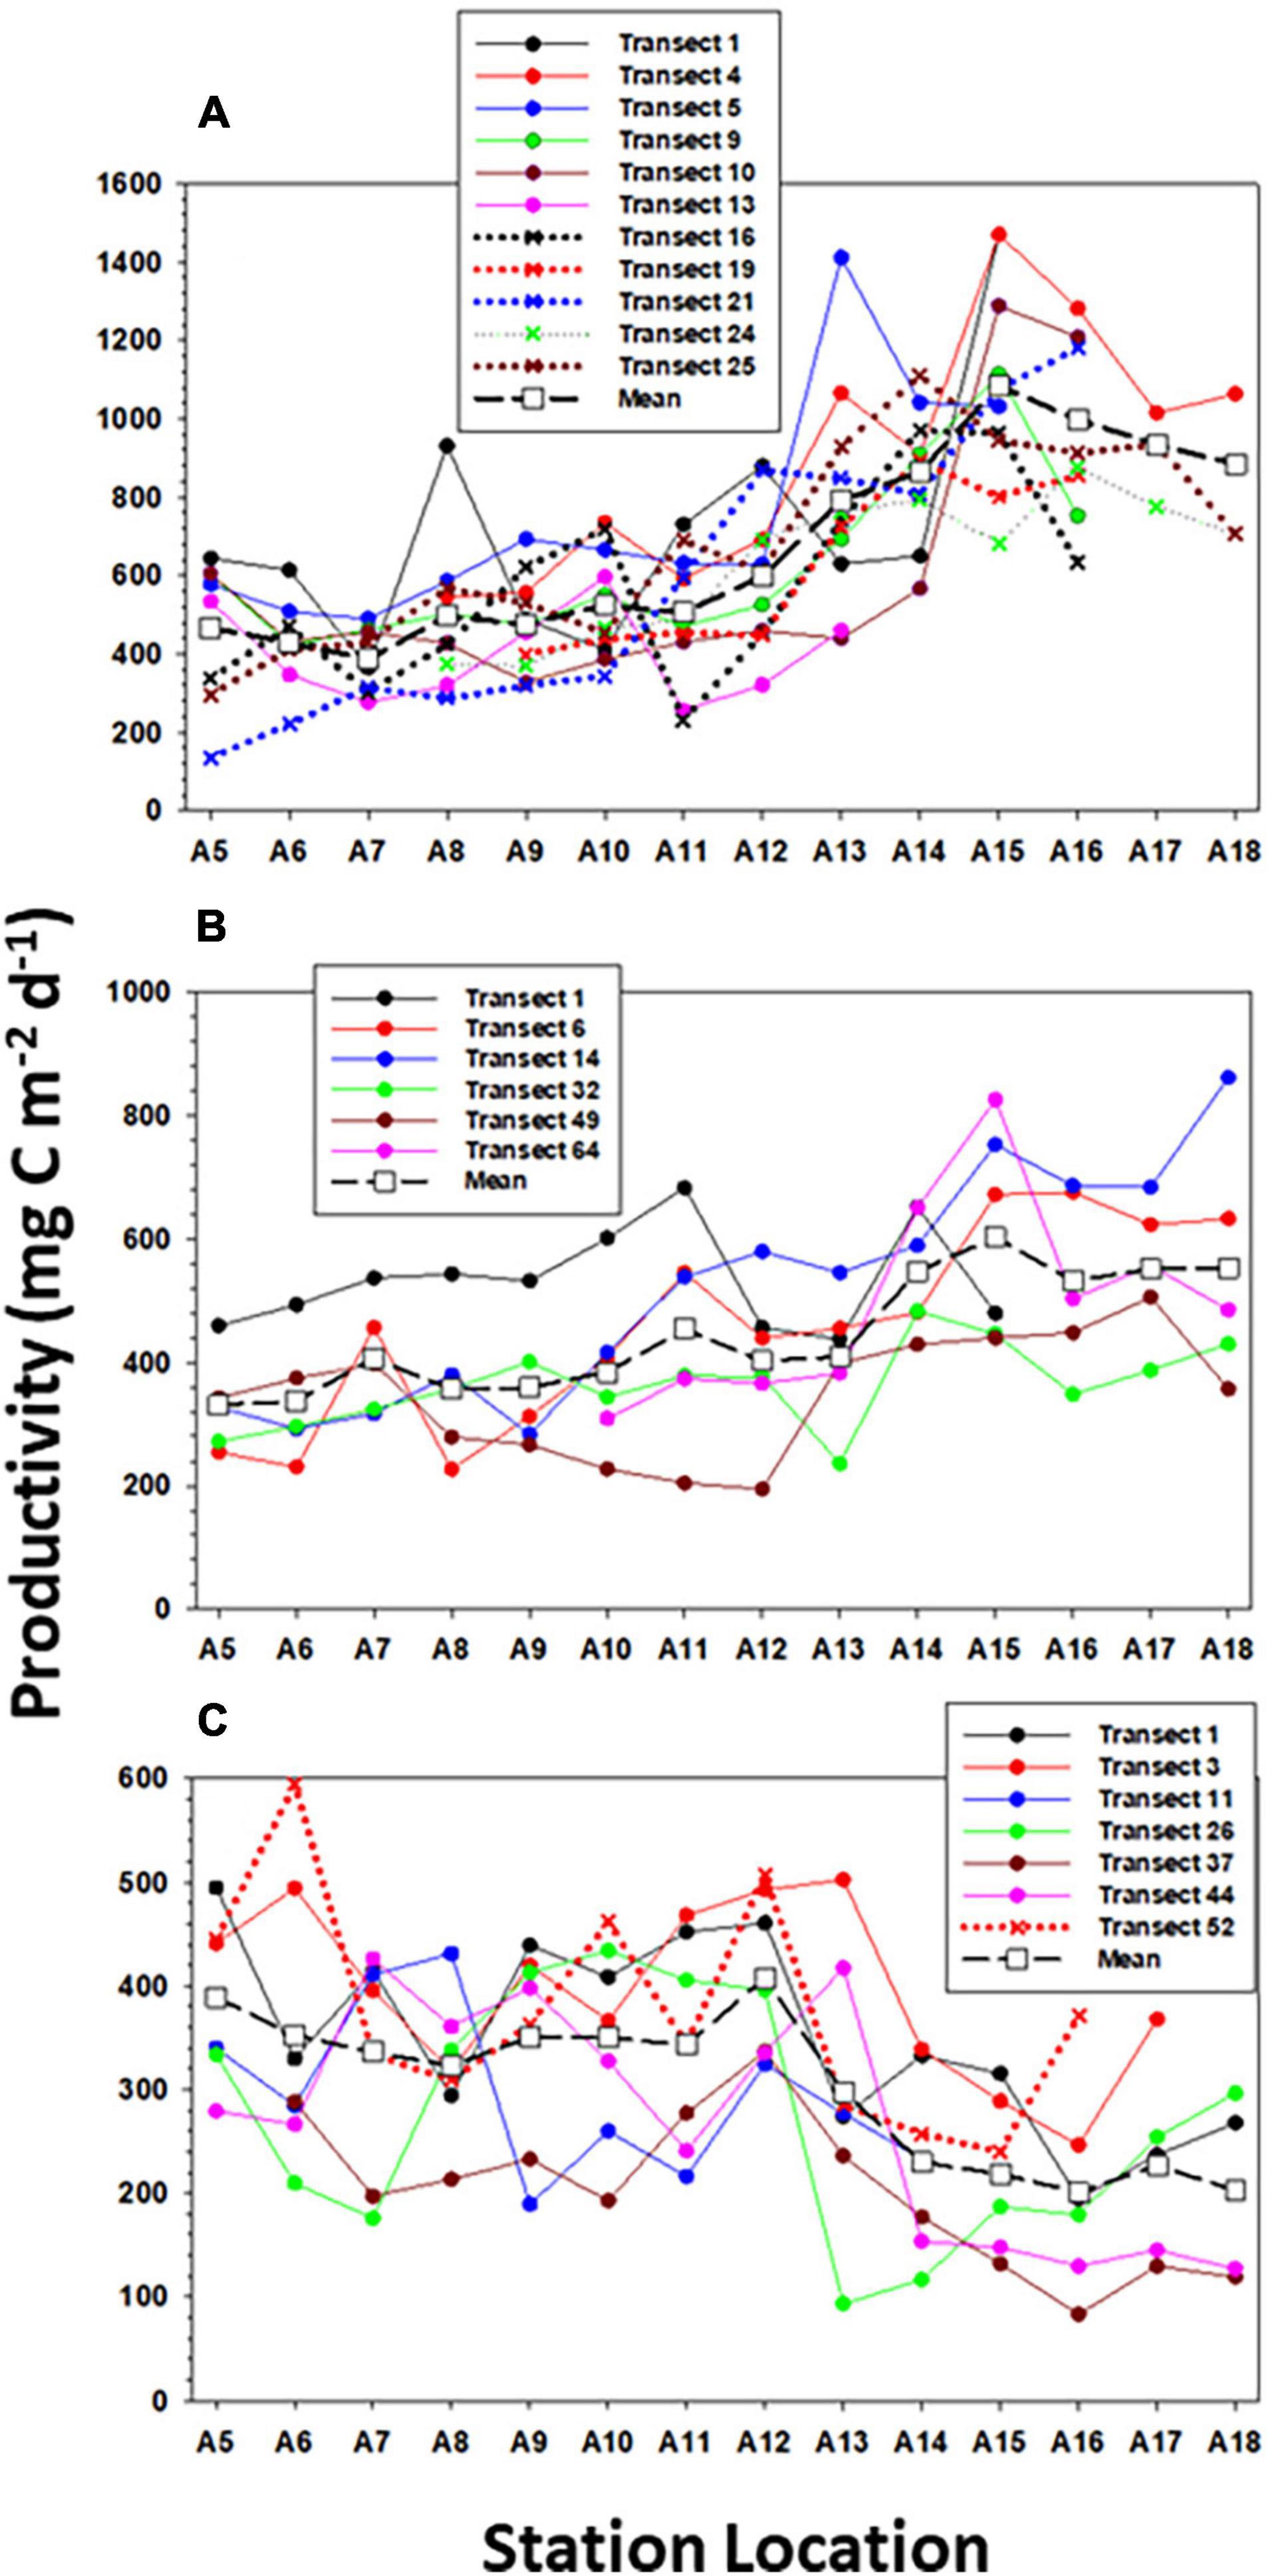
Figure 7. The distribution of primary productivity determined by the vertically resolved productivity model along all transects occupied within (A) AR29, (B) RB1904, and (C) TN368.
The spatial distribution of primary productivity estimated by the vertically resolved productivity model of each transect in the three cruises indicated that there was a slight primary productivity enhancement in many of the transects (Figures 6, 7), but the increase was only statistically significant in two of the 24 transects. Specifically, there was a statistically significant increase in productivity in 1 of 11 transects in AR29, 1 of 6 transects in RB1904, and none in TN368 (P < 0.05; t-test), although slight increases at the shelf break locations occurred within five transects in each cruise. This suggests that a productivity enhancement can and does occur in the shelf-break region, but is not consistent through time; furthermore, its magnitude is such that it is difficult to clearly identify unless specifically targeted by mesoscale sampling. Such modest spatial intensifications may not last for extended periods of time. That is, two consecutive transects showed different patterns of productivity, and if it was enhanced at the front in one, it was rarely enhanced in one sampled immediately before or after (usually a matter of 48 h). As a result, such increases will not be apparent in satellite composites of chlorophyll or productivity estimates.
The Relationship Among the Three Methods
To understand the relationship between the two models and the 14C-method, we examined productivity relationships among all three estimates (Figure 8). We observed that the primary productivity of all three estimates increased and decreased at the same time, which is not surprising as all are largely a function of chlorophyll, irradiance and temperature (despite the fact that the surface variable estimates do not include photoinhibition, and the 14C-incubations could be impacted by factors such as the change of temperature of flowing seawater during incubations and the changing meteorological patterns (clouds) in space as the ship moved). There were significant differences between the productivity estimated by bio-optical model and 14C-uptake (P < 0.05, t-test), but no significant difference in all three cruises between the productivity measured via the surface variable estimates and 14C-incubations. We believe the estimates derived by bio-optical model may be more representative of the true productivity, although some substantial variations at selected stations remain unexplained.
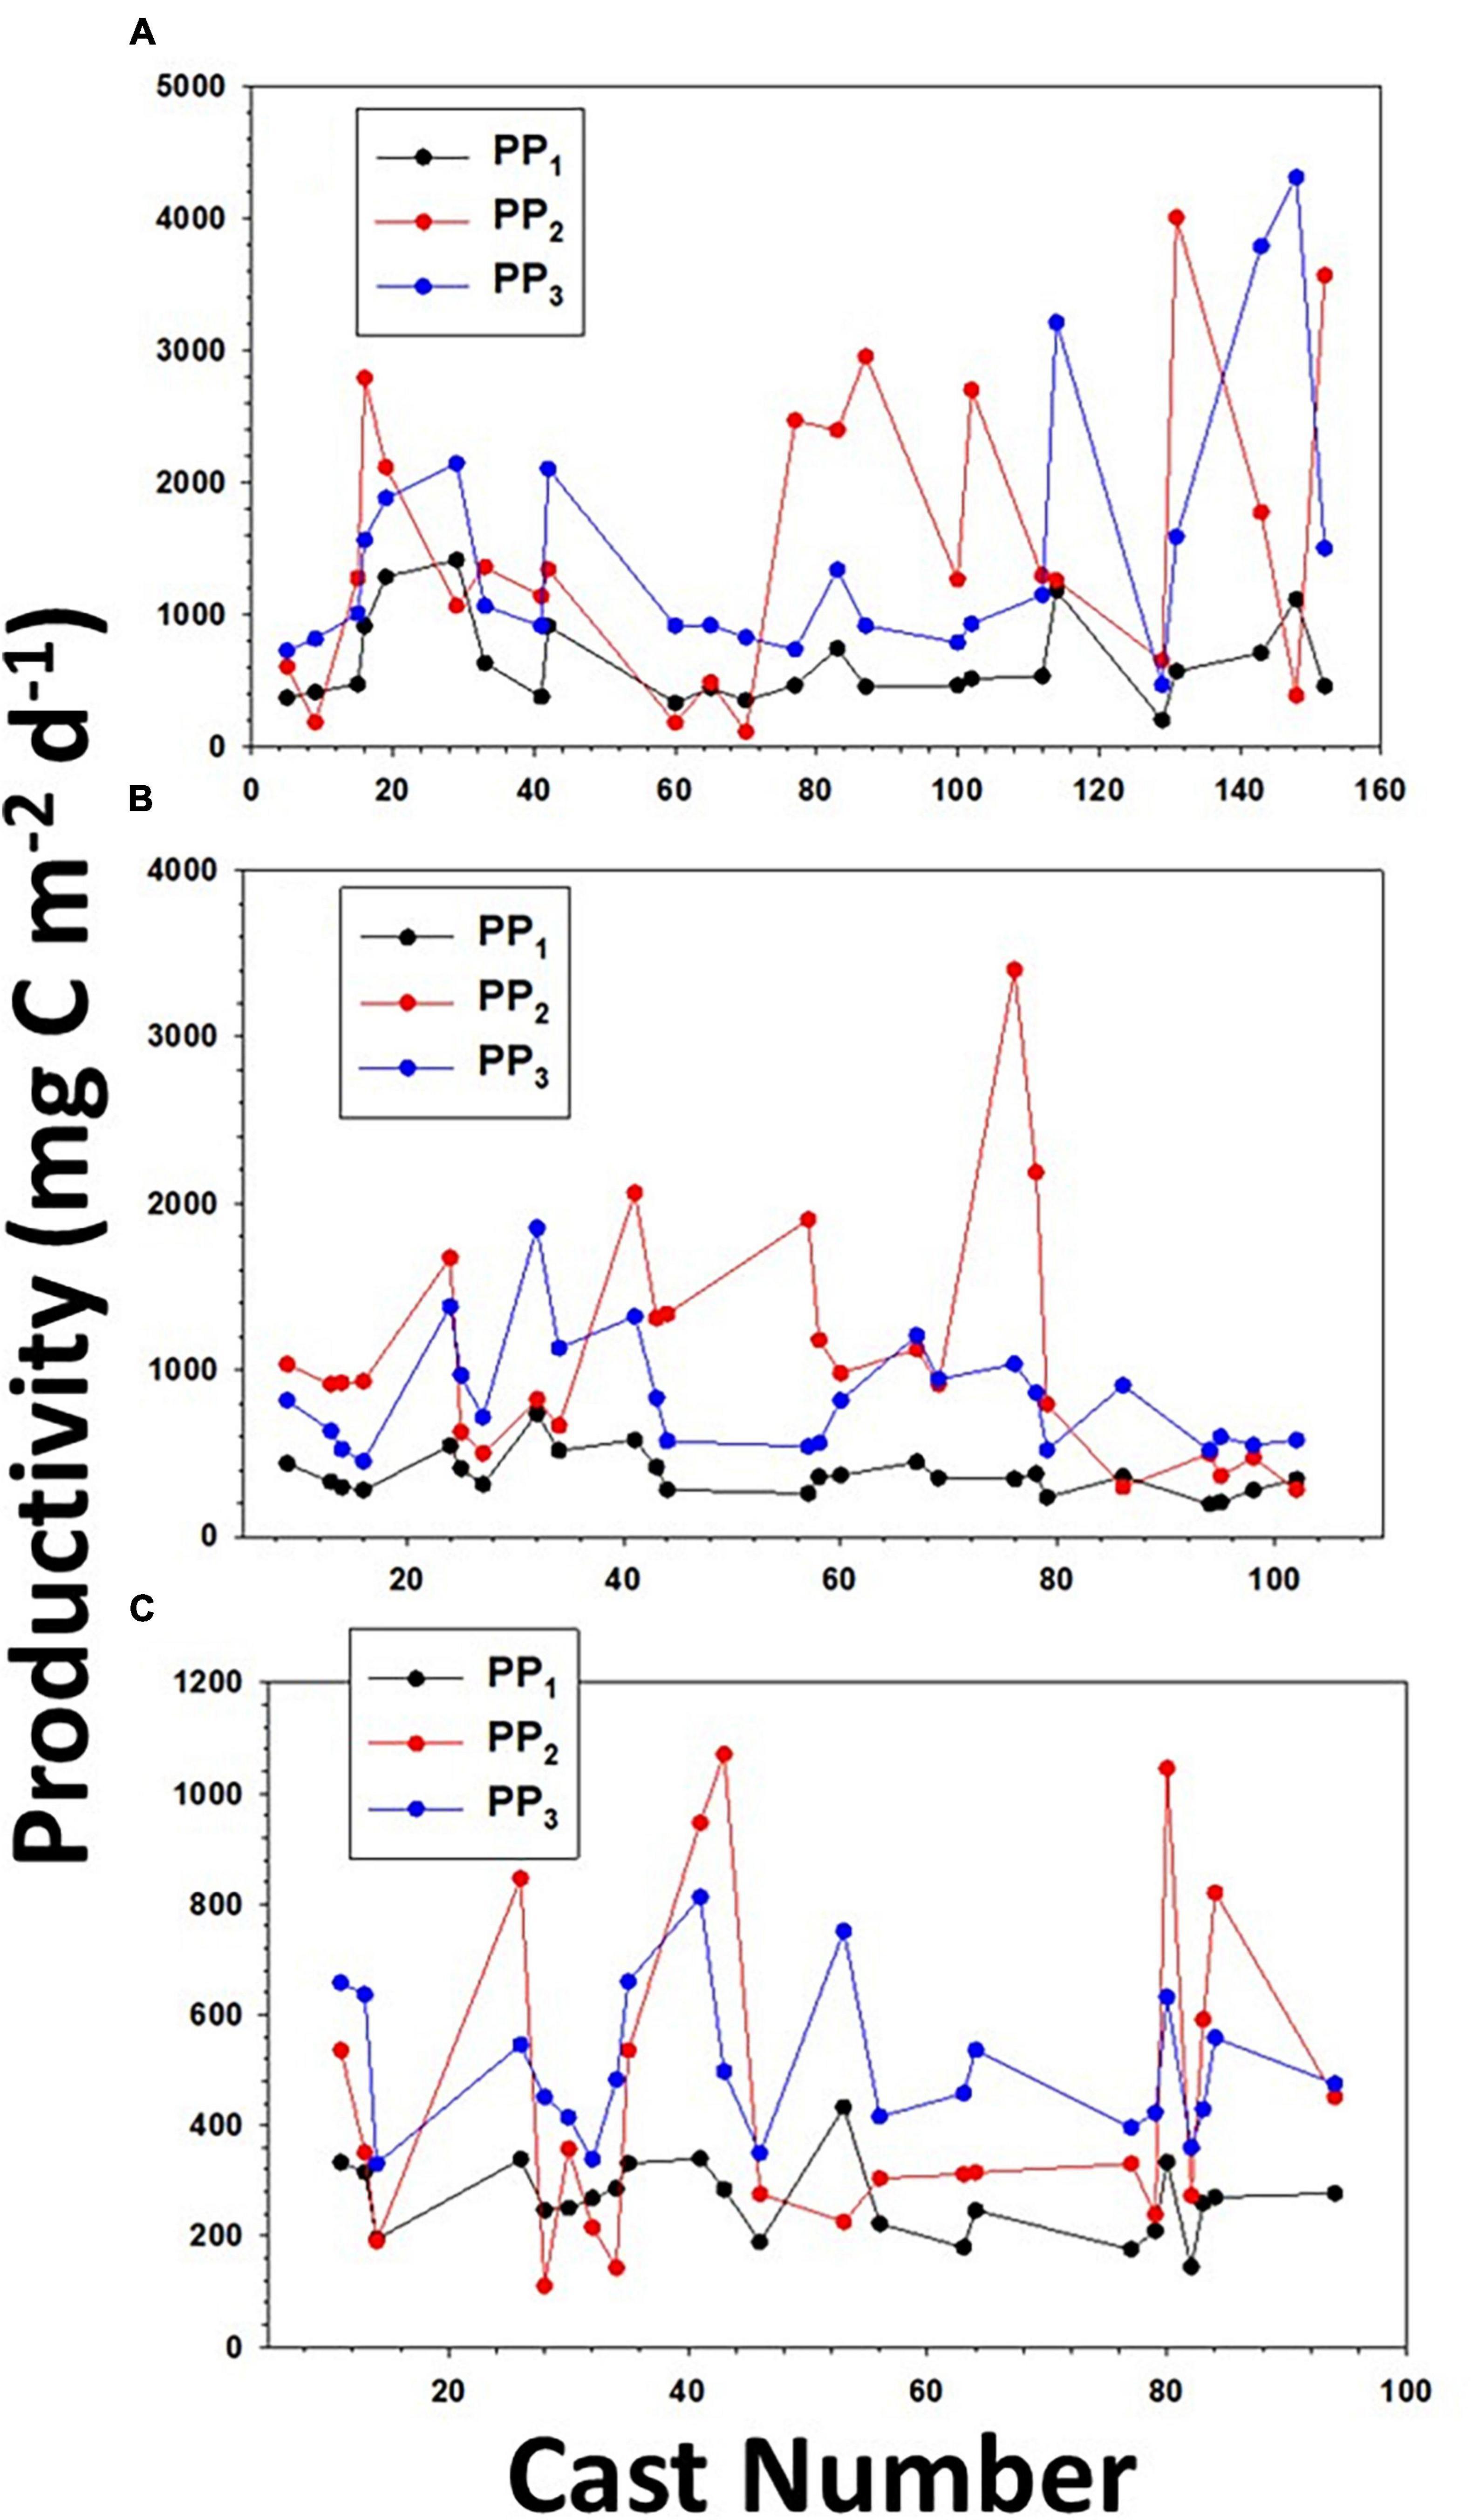
Figure 8. The distribution of primary productivity determined by the vertically resolved productivity model (PP1), 14C-uptake (PP2), and by the surface variable productivity model (PP3) along (A) AR29, (B) RB1904, and (C) TN368.
Discussion
The 14C-incubation method is highly sensitive and historically has been the preferred method for measuring productivity in the ocean. However, there are still uncertainties and biases due to a lack of agreement on standardized methods. Some of the concerns and uncertainties include the different size of incubation bottles (usually not larger than 250 ml), the use of trace-metal clean sampling, the incubation technique, the various lengths of incubations (up to 48 h), and the different post-incubational treatment of samples. It has been suggested that the 14C-method may overestimate primary production (Peterson, 1978), and that isotopic measurements underestimate total productivity unless they include the release of dissolved organic carbon during incubations (Gosselin et al., 1997). However, until satellite estimates of chlorophyll, surface temperatures and PAR became available, there was no way to compare independent estimates with the isotopic incubations.
Given the potential influence of temperature on 14C-rates, we hypothesized that the rates measured were either over- or under-estimates (depending on the initial sampling location). To some extent, we found that the vertically resolved bio-optical model gave results that appear to be more robust; furthermore, they clearly resolved productivity at smaller vertical and horizontal scales, and appeared to be less impacted by some of the uncertainties in 14C-measurements. Oliver et al. (2021) found very thin layers of diatoms in offshore waters, and by using a vertically resolved model determined that these thin layers (ca. 3 m in thickness) contributed up to 30% of the integrated productivity at individual stations. Both methods demonstrate that the New England waters are highly productive due to a variety of biological and physical processes occurring at different times of the year, and there exists some short-term productivity enhancements at the shelf break on short time scales. These increases are unlikely to be captured by radioisotope measurements due to the logistics of conducting these types of measurements and usually do not persist long enough to influence satellite chlorophyll determinations, but are included within the vertically resolved model.
Assessing the Impact of Temperature on 14C-Measurements
Temperature is an important factor influencing primary productivity. However, the 14C-incubations experienced a wide temperature variation during the 24-h incubations, as the ship moved between cold and warm waters frequently. Also, temperature varied vertically within the euphotic zone, and these vertical variations were not accounted for during the incubations (that is, all depths were incubated at surface temperatures). We attempted to quantify the vertical and horizontal impacts in two ways. Vertical influences were estimated from the vertically resolved model, where we arbitrarily set the temperatures of all depths to the surface value (temperature directly influencing the optimal productivity depth as per Behrenfeld and Falkowski (1997a) seven-order polynomial relationship). Because the mixed layer and euphotic zone depths were relatively similar, we did not expect a large influence of vertical changes. This proved to be correct for AR29 and RB1904, as the mean change in productivity was ca. 1% (Supplementary Table 2). The vertical temperature effect was greater in TN368, and the overestimate for locations A5 to A12 ranged from 15 – 28% (Supplementary Table 2). These changes largely resulted from the cooler temperatures at the inshore stations at depth, resulting in increases in 14C-productivity due to increased temperatures during incubation of deeper samples.
For estimates of temperature effects driven by horizontal variations, we estimated the time that each 14C-sample was in an altered temperature (one different from its original sampling depth) and calculated the change (increase or decrease) in productivity by estimating the photosynthetic rate at each temperature using the photosynthesis-temperature relationship (Behrenfeld and Falkowski, 1997a). We then estimated the degree of under- or over-estimate for each incubation (Supplementary Table 3). We hypothesized that the 14C-values would be overestimates at inshore stations in AR29 and RB1904 due to the temperature effect, since those cruises had the largest spatial gradients in temperature, and that 14C-uptake rates from offshore stations would be reduced. This was partially correct, in that the change was a function of the direction that the ship moved (offshore into warmer waters, or inshore into colder waters). 14C-productivity during AR29 was likely overestimated at locations A2-A6 by ca. 27%; offshore locations (Stations A14-A18) likely had the productivity reduced by ca. 13%. A similar pattern was observed in RB1904: at inshore locations (A5-A7) 14C-productivity was increased by 19%, and offshore stations had the productivity reduced by 8%, although substantial variability was introduced by the direction of ship movement (Supplementary Table 3). Changes within TN368 were less pronounced, as surface temperatures were more uniform. Productivity changes in that cruise ranged from a 1.7% increase to a decrease of 12.5%. Temperature effects on incubations can be significant and need to be considered using traditional isotopic procedures, especially in regions with marked in situ temperature gradients.
Is the Shelf Break a Site of Enhanced Productivity?
Our composite data do not reveal an enhancement of primary production at the shelf break, although at certain times there does appear to be a slight increase (Figure 7). Zhang et al. (2013) using a simple NPZ model suggested that there should be an enhancement at the shelf break during spring and summer based on increased nutrient fluxes from the slope water into the euphotic zone. They also noted that such increases in biomass were not apparent in the satellite or observational data, a finding confirmed by Oliver et al. (2022). Oliver et al. (2022) did find ephemeral increases in biomass at the shelf break due to Ekman restratification driven by winds, but that event was short-lived, as the winds that stimulated the bloom were in the opposite direction as the prevailing winds. Our results from the vertically resolved productivity model suggested that during certain transects there appeared to be a slight enhancement near the shelf break. Indeed, during AR29 five out of 11 transects showed an increase at the shelf break from the vertically resolved model results; during RB1904 and TN368 five (out of 6) and five out of seven showed a shelf-break increase. However, during three cruises only 1, 1, and 0 transects manifested a significant increase. Furthermore, those enhancements were modest, and as a result, productivity at the shelf break is not increased relative to the rates observed on the shelf and slope (Figure 6) in either the 14C-uptake rates or those modeled from surface variables.
Summary
While numerous physical mechanisms potentially can increase nutrient fluxes into the euphotic zone at the shelf break in the Mid-Atlantic Bight (e.g., Linder et al., 2004; Zhang et al., 2013), extensive surveys using multiple methods were able to define limited periods of enhanced productivity – consistent with the ephemeral increases found by Oliver et al. (2022). Our results do not address the physical forcing of the system and only assess the results of these physical processes. The region is clearly a site of substantial fisheries and higher trophic level accumulations, but the food web likely does not benefit substantially from any increased productivity based on shelf-break features. To understand the underlying causes of such a large system productivity, a full food-web analysis is needed with sampling at small (<10 km) horizontal scales. The continental shelf is being influenced by large-scale processes that in turn are being driven by climate change (e.g., increased interactions with warm core rings, bringing nutrients onto the shelf and compensatory flows of high biomass waters offshore; Gawarkiewicz et al., 2019; Zhang et al., in prep), so the impact of the shelf break on the regional food web and biogeochemical cycles may increase in coming decades.
Data Availability Statement
The datasets presented in this study can be found in online repositories. The names of the repository/repositories and accession number(s) can be found below: All data used in these analyses can be obtained from the BCO-DMO data repository (https://www.bco-dmo.org/project/748894).
Author Contributions
JM wrote the manuscript and analyzed the data. WS conducted the field work, helped analyze the data, and wrote the manuscript. Both authors contributed to the article and approved the submitted version.
Funding
This research was supported by the National Science Foundation (Grant No. 1657855) and Shanghai Jiao Tong University.
Conflict of Interest
The authors declare that the research was conducted in the absence of any commercial or financial relationships that could be construed as a potential conflict of interest.
Publisher’s Note
All claims expressed in this article are solely those of the authors and do not necessarily represent those of their affiliated organizations, or those of the publisher, the editors and the reviewers. Any product that may be evaluated in this article, or claim that may be made by its manufacturer, is not guaranteed or endorsed by the publisher.
Supplementary Material
The Supplementary Material for this article can be found online at: https://www.frontiersin.org/articles/10.3389/fmars.2022.824303/full#supplementary-material
References
Behrenfeld, M. J., and Falkowski, P. G. (1997a). Photosynthetic rates derived from satellite-based chlorophyll concentration. Limnol. Oceanogr. 42, 1–20. doi: 10.4319/lo.1997.42.1.0001
Behrenfeld, M. J., and Falkowski, P. G. (1997b). A consumer’s guide to phytoplankton primary productivity models. Limnol. Oceanogr. 42, 1479–1491. doi: 10.4319/lo.1997.42.7.1479
Campbell, J., Antoine, D., Armstrong, R., Arrigo, K., Balch, W., Barber, R., et al. (2002). Comparison of algorithms for estimating ocean primary production from surface chlorophyll, temperature, and irradiance. Glob. Biogeochem. Cycles 16, 9–1. 9-1-9-15, doi: 10.1029/2001gb001444
Gardner, W. D., Richardson, M. J., and Smith, W. O. Jr. (2000). Seasonal patterns of water column particulate organic carbon and fluxes in the Ross Sea, Antarctica. Deep Sea Res. II 47, 3423–3449. doi: 10.1016/S0967-0645(00)00074-6
Gawarkiewicz, G., Todd, R. E., Zhang, W., Partida, J., Gangopadhyay, A., Monim, M.-U.-H., et al. (2019). The changing nature of shelf-break exchange revealed by the OOI Pioneer Array. Oceanography 31, 60–70. doi: 10.5670/oceanog.2018.110
Gosselin, M., Levasseur, M., Wheeler, P. A., Horner, R. A., and Booth, B. C. (1997). New measurements of phytoplankton and ice algal production in the Arctic Ocean. Deep Sea Res. II 44, 1623–1644. doi: 10.1016/S0967-0645(97)00054-4
Houghton, R. W., Aikman, F., and Ou, H. W. (1988). Shelf-slope frontal structure and cross-shelf exchange at the New England shelf-break. Cont. Shelf. Res. 8, 687–710. doi: 10.1016/0278-4343(88)90072-6
Knap, A. H., Michaels, A., Close, A. R., Ducklow, H., and Dickson, A. G. (1996). Protocols for the Joint Global Ocean Flux Study (JGOFS) Core Measurements. Paris: UNESCO.
Linder, C. A., and Gawarkiewicz, G. (1998). A climatology of the shelfbreak front in the Middle Atlantic Bight. J. Geophys. Res. 103, 18,405–18,423. doi: 10.1029/98JC01438
Linder, C. A., Gawarkiewicz, G. G., and Pickart, R. S. (2004). Seasonal characteristics of bottom boundary layer detachment at the shelfbreak front in the Middle Atlantic Bight. J. Geophys. Res. 109:C03049. doi: 10.1029/2003JC002032
Lozier, M. S., and Gawarkiewicz, G. (2001). Cross-frontal exchange in the Middle Atlantic Bight as evidenced by surface drifters. J. Phys. Oceanogr. 31, 2498–2510. doi: 10.1175/1520-048520010312.0.CO;2
Marra, J., and Barber, R. T. (2004). Phytoplankton and heterotrophic respiration in the surface layer of the ocean. Geophys. Res. Lett. 31:L09314. doi: 10.1029/2004GL019664
Marra, J., Dickey, T., Chamberlin, W. S., Ho, C., Granata, T., Kiefer, D. A., et al. (1992). Estimation of seasonal primary production from moored optical sensors in the Sargasso Sea. J. Geophys. Res. 97, 7399–7412. doi: 10.1029/92JC00408
Marra, J., Houghton, R. W., Boardman, D. C., and Neale, P. J. (1982). Variability in surface chlorophyll-a at a shelf-break front. J. Mar. Res. 40, 575–591.
Marra, J., Houghton, R. W., and Garside, C. (1990). Phytoplankton growth at the shelf-break front in the Middle Atlantic Bight. J. Mar. Res. 48, 851–868. doi: 10.1357/002224090784988665
Marra, J. F., Barber, R. T., Barber, E., Bidigare, R. R., Chamberlin, W. S., Goericke, R., et al. (2021). A database of ocean primary productivity from the 14C method. Limnol. Oceanogr. Lett. 1, 107–111. doi: 10.1002/lol2.10175
Oliver, H., Zhang, W. G., Smith, W. O. Jr., Alatalo, P., Chappell, P. D., Hirzel, A. J., et al. (2021). Diatom hotspots driven by western boundary current instability. Geophys. Res. Lett. 48:e2020GL091943. doi: 10.1029/2020GL091943
Oliver, H., Zhang, W. G., Smith, W. O. Jr., Archibald, K., Hirzel, A., Sosik, H. M., et al. (2022). Ephemeral surface chlorophyll enhancement at the New England shelf break driven by Ekman restratification. J. Geophys. Res. 127, e2021JC017715. doi: 10.1029/2021JC017715
O’Reilly, J. E., and Busch, D. A. (1984). Phytoplankton primary production on the northwestern Atlantic shelf. Rapp. P.V. Reun. Cons. Int. Explor. Mer. 183, 255–268. doi: 10.1016/j.ecss.2014.12.047
Peterson, B. J. (1978). Radiocarbon uptake: its relation to net particulate carbon production. Limnol. Oceanogr. 23, 179–184. doi: 10.4319/lo.1978.23.1.0179
Platt, T., and Jassby, A. D. (1976). The relationship between photosynthesis and light for natural assemblages of coastal marine phytoplankton. J. Phycol. 12, 421–430. doi: 10.1111/j.1529-8817.1976.tb02866.x
Ryan, J. P., Yoder, J. A., Barth, J. A., and Cornillon, P. C. (1999a). Chlorophyll enhancement and mixing associated with meanders of the shelf break front in the Mid-Atlantic Bight. J. Geophys. Res. 104, 23,479–23,493. doi: 10.1029/1999JC900174
Ryan, J. P., Yoder, J. A., and Cornillon, P. C. (1999b). Enhanced chlorophyll at the shelfbreak of the Mid-Atlantic Bight and Georges Bank during the spring transition. Limnol. Oceanogr. 44, 1–11. doi: 10.4319/lo.1999.44.1.0001
Smith, W. O. Jr., Marra, J., Hiscock, M. R., and Barber, R. T. (2000). The seasonal cycle of phytoplankton biomass and primary productivity in the Ross Sea, Antarctica. Deep Sea Res. II 47, 3119–3140. doi: 10.1016/S0967-0645(00)00061-8
Smith, W. O. Jr., Zhang, W. G., Hirzel, A., Stanley, R. H. R., Meyer, M. G., Sosik, H. M., et al. (2021). A regional, early spring bloom of Phaeocystis pouchetii on the New England continental shelf. J. Geophys. Res. 126:e2020JC016856. doi: 10.1029/2020JC016856
Townsend, D. W., Thomas, A. C., Mayer, L. M., Thomas, M. A., and Quinlan, J. A. (2006). “Oceanography of the Northeast Atlantic continental shelf,” in The Sea: The Global Coastal Ocean: Interdisciplinary Regional Studies and Syntheses 14, eds A. R. Robinson and K. H. Brink (Boston, MA: Harvard University Press), 119–168.
Xu, Y., Chant, R., Gong, D., Castelao, R., Glenn, S., and Schofield, O. (2011). Seasonal variability of chlorophyll a in the Mid-Atlantic Bight. Cont. Shelf Res. 31, 1640–1650. doi: 10.1016/j.csr.2011.05.019
Yoder, J. A., McClain, C. R., Feldman, G. C., and Esaias, W. E. (1993). Annual cycles of phytoplankton chlorophyll concentrations in the global ocean: a satellite view. Glob. Biogeochem. Cycles 7, 181–193. doi: 10.1029/93GB02358
Yoder, J. A., Schollaert, S. E., and O’Reilly, J. E. (2002). Climatological phytoplankton chlorophyll and sea surface temperature patterns in continental shelf and slope waters off the northeast U.S. coast. Limnol. Oceanogr. 47, 672–682. doi: 10.4319/lo.2002.47.3.0672
Yoder, O., Reilly, J. E., Barnard, A. H., Moore, T. S., and Ruhsam, C. M. (2001). Variability in coastal zone color scanner (CZCS) chlorophyll imagery of ocean margin waters off the US East Coast. Cont. Shelf Res. 21, 1191–1218. doi: 10.1016/s0278-4343(01)00009-7
Zhang, W. G., and Gawarkiewicz, G. G. (2015). Length scale of the finite-amplitude meanders of shelfbreak fronts. J. Phys. Oceanogr. 45, 2598–2620. doi: 10.1175/jpo-d-14-0249.1
Zhang, W. G., Gawarkiewicz, G. G., McGillicuddy, D. J. M. Jr., and Wilkin, J. L. (2011). Climatological mean circulation at the New England Shelf Break. J. Phys. Oceanogr. 41, 1874–1893. doi: 10.1175/2011jpo4604.1
Zhang, W. G., McGillicuddy, D. J., and Gawarkiewicz, G. G. (2013). Is biological productivity enhanced at the New England shelfbreak front? J. Geophys. Res. 118, 517–535. doi: 10.1002/jgrc.20068
Keywords: primary productivity, Mid-Atlantic Bight, vertically resolved model, temperature, chlorophyll, 14C-uptake, continental shelf
Citation: Ma J and Smith WO Jr (2022) Primary Productivity in the Mid-Atlantic Bight: Is the Shelf Break a Location of Enhanced Productivity? Front. Mar. Sci. 9:824303. doi: 10.3389/fmars.2022.824303
Received: 29 November 2021; Accepted: 13 January 2022;
Published: 07 February 2022.
Edited by:
Kuoping Chiang, National Taiwan Ocean University, TaiwanReviewed by:
Frank Dehairs, Vrije University Brussel, BelgiumTerry Whitledge, Retired, Fairbanks, AK, United States
Copyright © 2022 Ma and Smith. This is an open-access article distributed under the terms of the Creative Commons Attribution License (CC BY). The use, distribution or reproduction in other forums is permitted, provided the original author(s) and the copyright owner(s) are credited and that the original publication in this journal is cited, in accordance with accepted academic practice. No use, distribution or reproduction is permitted which does not comply with these terms.
*Correspondence: Walker O. Smith Jr., d29zQHZpbXMuZWR1