 Lise Helen Ofstad
 Hjálmar Hátún
 Torstein Pedersen
 Petur Steingrund
 Bjarni Mikkelsen
94% of researchers rate our articles as excellent or good
Learn more about the work of our research integrity team to safeguard the quality of each article we publish.
Find out more
ORIGINAL RESEARCH article
Front. Mar. Sci., 04 March 2022
Sec. Marine Ecosystem Ecology
Volume 9 - 2022 | https://doi.org/10.3389/fmars.2022.823066
This article is part of the Research TopicPhysical Drivers of Biogeographical Shifts in the Northeastern Atlantic – and Adjacent ShelvesView all 19 articles
Adult anglerfish conduct annual migrations between spawning areas and feeding areas; for Faroese waters this migration has so far not been described. Therefore, anglerfish migration and distribution in Faroese waters was investigated by mark-recapture studies, including data storage tags, as well as data from scientific trawl surveys, commercial trawlers and gillnetters. The fish distribution was compared to hydrographical conditions such as sea surface- and bottom temperature. A clear seasonal offshore-onshore migration was observed. Anglerfish occupied shallower waters (<200 m) during summer and deeper waters, especially on the western side of the Faroe shelf, during winter. This seasonal movement was most evident for sexually mature fish longer than 70 cm indicating spawning in deep waters during winter. Further, during winter anglerfish experienced cold water, which indicated that they were distributed close to the main interface of cold water masses surrounding the shelf. The fish were mostly located in warm water (6.5–11°C) and seldom occurred in colder waters than 4°C. Anglerfish appeared generally inactive, only around 5% of the total data storage tag recordings showed more than 5 m vertical movement between two subsequent hourly recordings. This vertical activity varied seasonally by being higher during winter than summer and diurnally by being higher during night time than day time, indicating that sunrise and day length played an important role in vertical movements.
Anglerfish (genus Lophius) have an affinity for the relatively warm water masses of the mid-latitudes. The anglerfish species Lophius piscatorius in the northeast Atlantic is a boreal fish, which generally is distributed between the Straits of Gibraltar and the western Mediterranean Sea (Caruso, 1983) in the south, Icelandic waters in the west (Solmundsson et al., 2010) and the Barents Sea in the north (Thangstad et al., 2006). They occupy mainly muddy to gravel bottom biotopes, from the sublittoral zone to depths of around 1,000 m (Caruso, 1983; Mouritsen, 2007). Unlike the boreal zones on land, the oceanic edges of the important boreal biogeographical zone domain shift horizontally from year to year, and even more rapidly on a vertical basis.
Migration between different habitats is a common behavior among fish populations (Wootton, 1990). Seasonal migration has been directly observed or hypothesized to exist among various Lophius species such as L. litulon in Japanese waters (Yoneda et al., 2002), L. americanus in the northwest Atlantic (Steimle et al., 1999; Richards et al., 2008), L. budegassa (Landa et al., 2001) and L. piscatorius (Laurenson et al., 2005) in the northeast Atlantic. Such migration could be due to spawning- and/or feeding activities, or as a response to thermal conditions (Wootton, 1990). Countercurrent migrations to spawning grounds are considered important as this allows passive egg and larval drift back onto suitable nursery areas (Harden-Jones, 1968) and has been suggested for L. piscatorius (Laurenson et al., 2001). The thermal window with optimal performance for fishes are typically narrowest for spawners, eggs and larvae and wider for juveniles and growing adults (Pörtner and Farrell, 2008), and it is expected that spawning L. piscatorius also have a narrow temperature preference.
The marine environment in the northeastern Atlantic is highly influenced by the presence of Modified North Atlantic Waters (MNAW) with temperatures around 8°C (Hansen and Østerhus, 2000; Figure 1), which is a mixture of waters with origin from the North Atlantic Current, the Bay of Biscay and from the cold subpolar gyre (SPG). The hydrographic properties of the MNAW are influenced by variations in the dynamics of the SPG, which regulates the relative contribution of cold/low-saline subarctic and warm/salty Atlantic source waters to the mixed MNAW (Hátún et al., 2005). A major weakening of the SPG after the mid-1990s resulted in a warming/salinification of the water masses in the northeastern Atlantic, and a major expansion of the boreal biogeographical zone, exemplified by a sudden northwestward expansion of both blue whiting in Faroese waters (Hátún et al., 2009a,b) and anglerfish in Icelandic waters (Solmundsson et al., 2010).
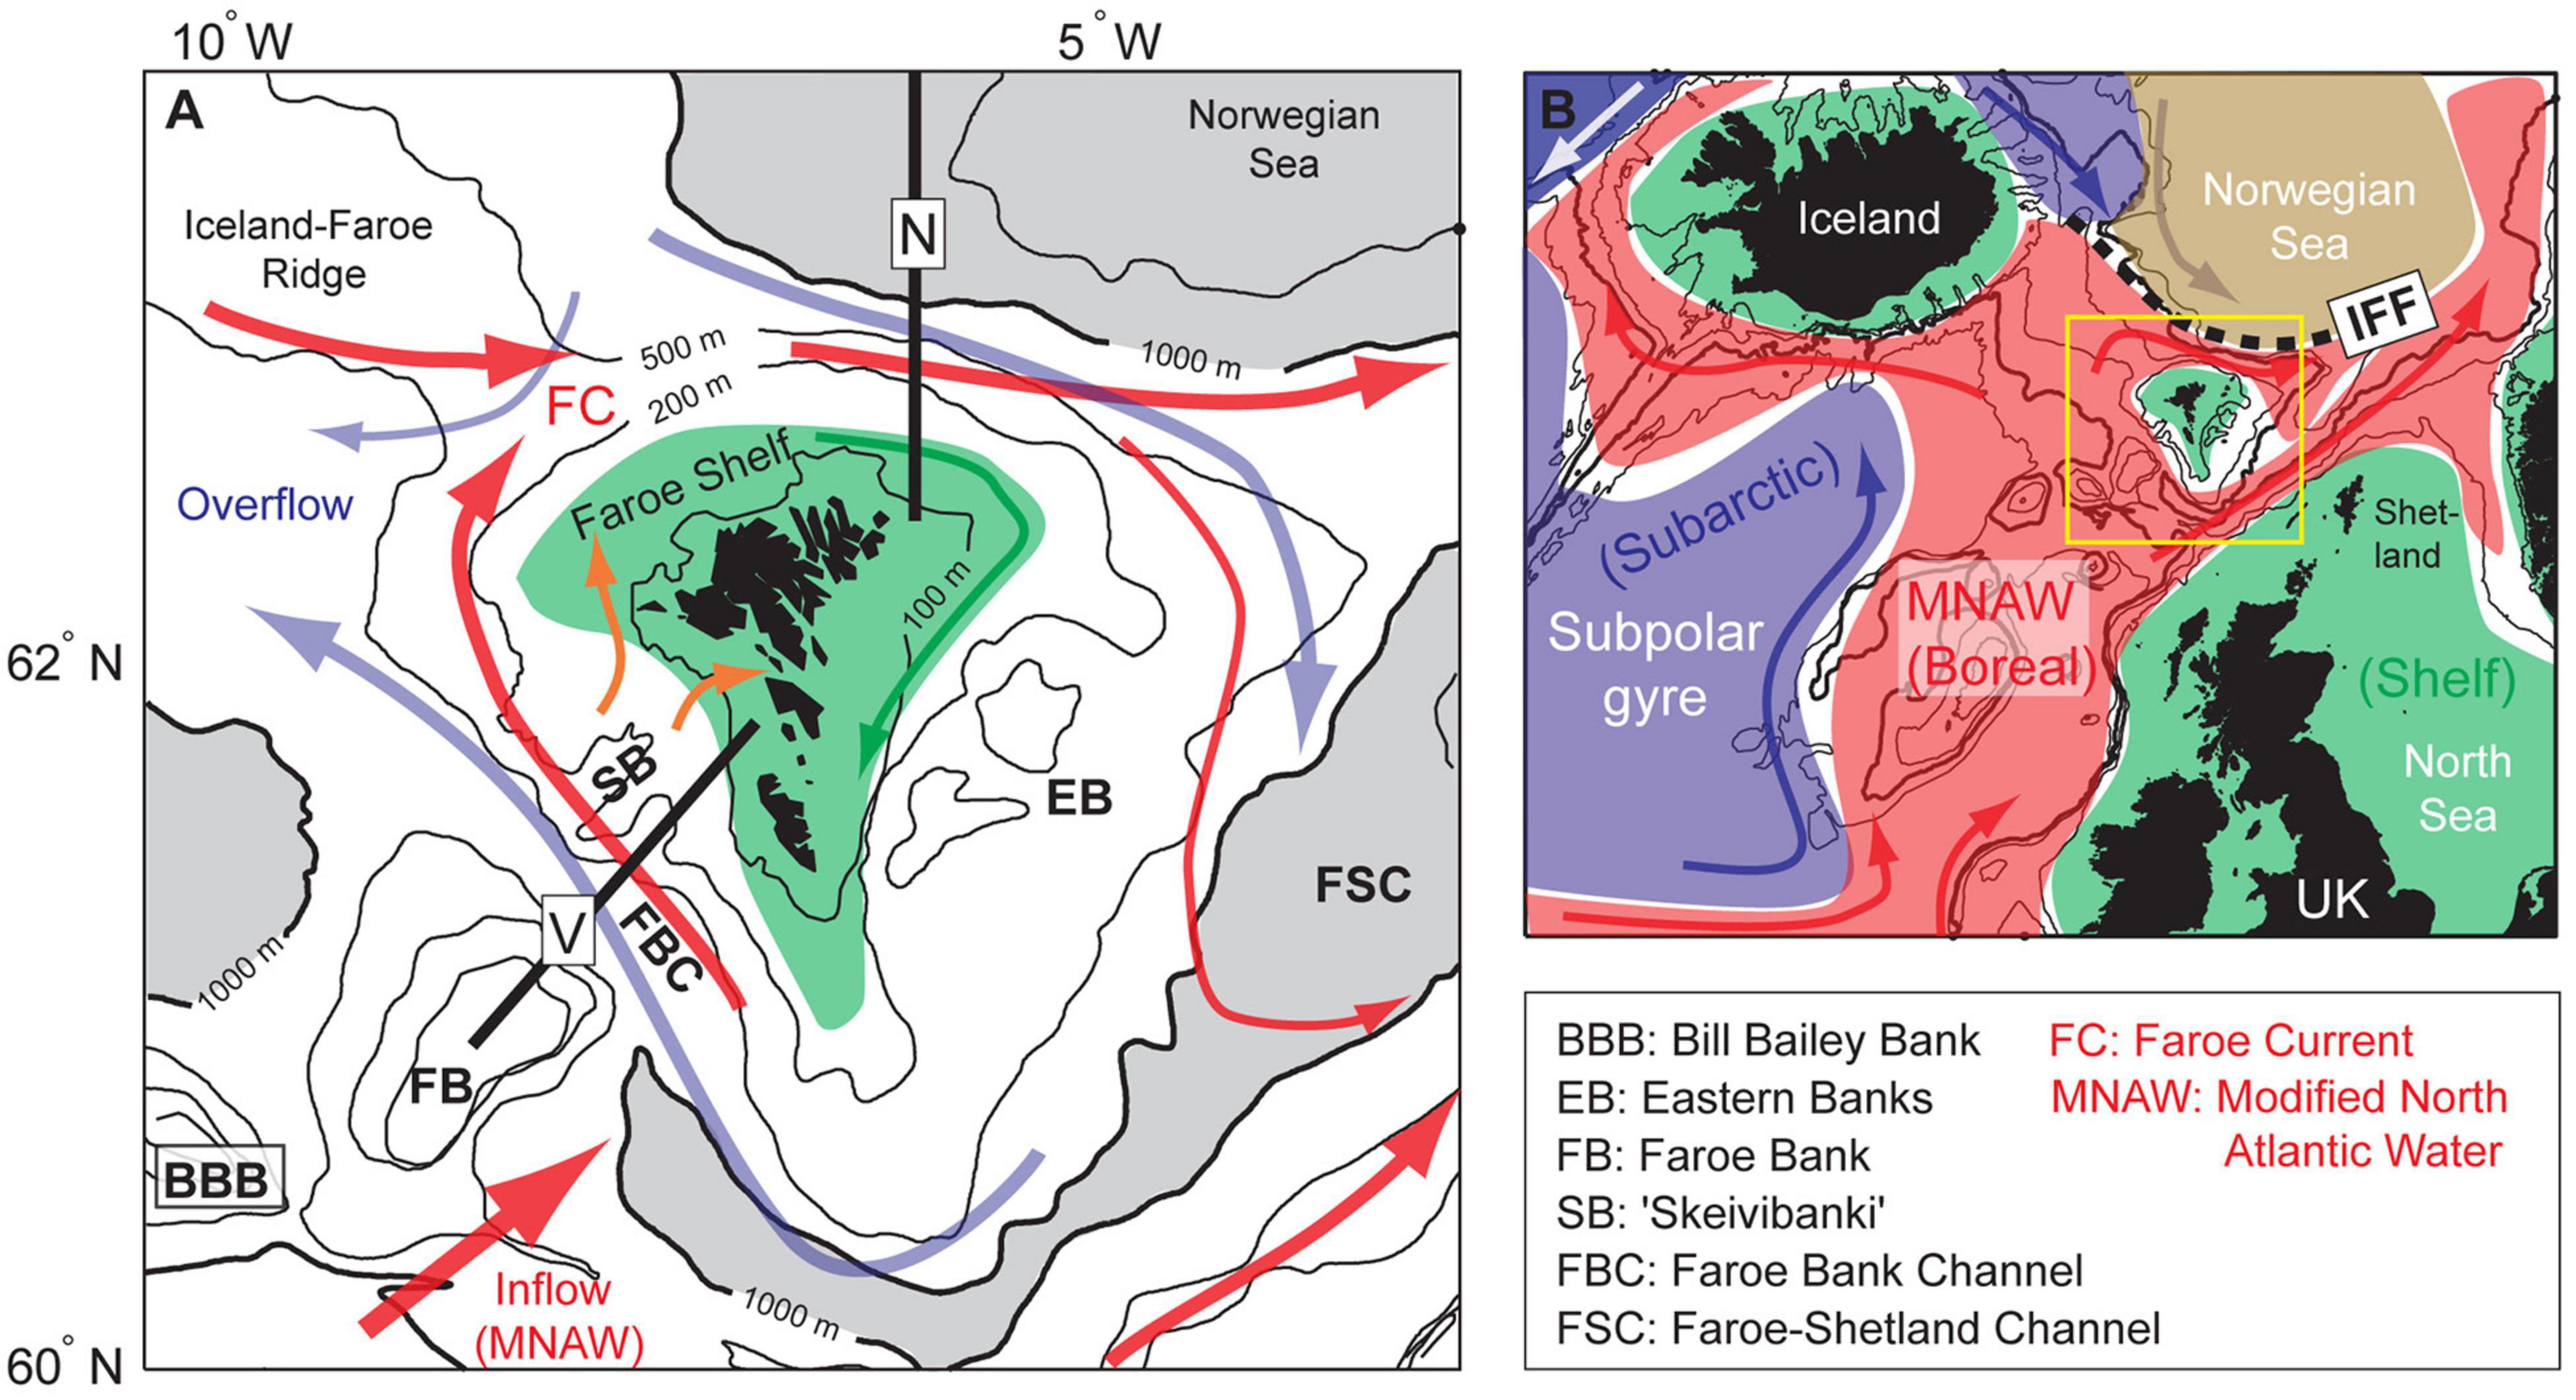
Figure 1. Overview over (A) the Faroe shelf study region and (B) the broader surroundings, colored by the main biogeographic zones (subarctic- blue, boreal- red and shelves- green). The yellow square in panel (B) outlines the domain in panel (A), and the black dashed line represents the Iceland-Faroe Front (IFF). Red arrows indicate relatively warm Atlantic currents and blue arrows show cold currents, which in panel (A) are comprised of deep overflows. The green arrow in panel (A) represents the clockwise central shelf circulation, while the orange arrows illustrate the main onto-shelf flows. Locations of two standard hydrographic transects (Sections N and V) are shown with black lines. The 100, 200, 500, 1,000 and, 2,000 m depth contours are shown in panel (A), and the deepest regions (>1,000 m) are gray shaded.
Faroe Islands are located on the Iceland-Scotland ridge (62°N, 7°W, Figure 1), and are embedded in the poleward flow of MNAW both on the northern and southern side of the Faroe Plateau. The environment around Faroe Islands is characterized by strong temperature gradients, and the biogeographical zonation is three dimensional in these waters (Cisewski et al., 2021). Very cold water (<0°C) flows equatorward across the seafloor of the Iceland-Scotland ridge (500–800 m), and there is a very sharp thermocline – the main interface – between this overflow and the inflow of MNAW. This interface constitutes a biogeographic boundary between boreal species [e.g., cod (Gadus morhua), haddock (Melanogrammus aeglefinus)] above/to the south and Arctic and subarctic species below/to the north [e.g., Greenland halibut (Reinhardtius hippoglossoides)]. This interface intersects the Faroe Plateau at 400–500 m depths, and outcrops in the surface north of the Faroes, as the Iceland-Faroe Front (Figure 1). On the Faroe Plateau, a tidal front at around 120 m depths partly separates the Central Shelf waters from the Outer Shelf (Larsen et al., 2008; Eliasen et al., 2017a) and the surrounding oceanic waters. There are, however, three main conduits on the western side of the shelf which carry oceanic/Outer Shelf waters directly onto the central shelf (Hátún et al., 2013; Eliasen et al., 2017b). The central shelf is suggested to function as a retention area that keeps fish eggs/larvae and other planktonic organisms on the shelf (Gaard and Steingrund, 2001). The shallow water around the Faroe Plateau probably serves as a nursery ground for juvenile anglerfish in Faroese waters (Ofstad et al., 2013).
Anglerfish feeding areas are generally in shallow shelf waters (<200 m), notably areas where they are well camouflaged by the bottom substrate and are visible to attract potential fish prey by using their distinctive fishing rod (Laurenson et al., 2004). Although large adult anglerfish are able to eat large predatory fish, e.g., Greenland halibut, and occasionally even also seabirds (Perry et al., 2013), their main prey in European waters are Norway pout (Trisopterus esmarki) and blue whiting (Micromesistius poutassou) (Fariña et al., 2008).
Little is known about the spawning areas of anglerfish in the northeast Atlantic and seasonal spawning and feeding migrations (ICES, 2018). It has been speculated that spawning may take place in deep water (>300 m), e.g., west of the British Isles (Tåning, 1943; Hislop et al., 2001). Also, there are indications of anglerfish spawning areas in Norwegian fjords (Bjelland and Asplin, 2007), in Icelandic waters (Solmundsson et al., 2010) and in Faroese waters (Tåning, 1943; Ofstad and Laurenson, 2007; Ofstad et al., 2013). The spawning areas in Faroese waters seem to be located southwest of the Faroe Plateau (“Skeivibanki” area) and in the Faroe Bank area (Ofstad et al., 2013). Observations of spawning males and females, egg ribbons and pelagic anglerfish larvae suggest that the main spawning season is from February to April (Ofstad et al., 2013). Long distance migration of L. piscatorius has been reported from mark-recapture experiments, with movements between Shetlandic-, Norwegian-, Icelandic- and Faroese waters (Laurenson et al., 2005; Thangstad et al., 2006). However, the migration rate is generally very low, indicating low mixing between these areas.
Although anglerfish rest on the seabed when feeding, they are also known to swim pelagically, and can even reside near the surface at times. Anglerfish are caught near the surface (pelagic) over deep water (>1,000 m) (Hislop et al., 2001; Solmundsson et al., 2010). Periodical vertical movements have been documented from one tagged L. americanus, which was most active during nights (Rountree et al., 2008).
Lophius piscatorius are common in Faroese waters (Mouritsen, 2007) while L. budegassa very seldomly have been caught in this area (Thangstad et al., 2006). The anglerfish stock in Faroese waters appears to be productive (Ofstad, 2013) and anglerfish have traditionally been taken as bycatch in the demersal trawl fisheries (e.g., for cod, haddock and saithe). Landings data of anglerfish in Faroese waters exist back to 1903 (Jákupsstovu, 2004). The direct fishery for anglerfish started in the early 1990s (Reinert, 1995). For the last three decades, small trawlers (<700 HP) and gillnetters have landed more than 90% of the anglerfish catches in Faroese waters. The fishery and management in Faroese waters is described in Thangstad et al., 2006 and ICES, 2021.
The aims of this paper were to investigate whether anglerfish undertake seasonal horizontal and vertical migrations and, if demonstrated, investigate possible drivers for such migrations such as reproduction and spawning, feeding and hydrographical conditions. Particularly, it was analyzed whether there were seasonal differences in: (i) horizontal and depth distributions and displacement distances and (ii) vertical activity level of anglerfish.
Various methods have been used to investigate migration and movement of fish; such as information from commercial fisheries and/or catch rates from surveys (Armannsson et al., 2007), tagging by conventional tags (Solmundsson et al., 2005; Armannsson et al., 2007) and data storage tags (DSTs, Rountree et al., 2008; Armannsson and Jonsson, 2012). Here we present results of horizontal and vertical migration of anglerfish L. piscatorius in Faroese waters using all these methods and we relate these migrations to hydrographical conditions.
Landing data of anglerfish in Faroese waters date back to 1903 to 2003 (Jákupsstovu, 2004). Since 2000, catch data in tons by area and gear have been derived from Statistics Faroe Islands1 and official annual total catches from Faroese Coastal Guard.2
To map and compare the spatial distribution of anglerfish in May–October (summer) and in November–April (winter), logbooks from eight single trawlers (<700 HP) and three gillnetters that were targeting anglerfish in the period 2000–2010 were used. The logbooks had information on date, position and catch. To visualize the location of the main fishing areas the logbook information was split into small statistical squares (0.05°N by 0.10°W) and mapping only those squares with more than one haul and where anglerfish constituted more than 50% of the catch in weight.
In addition to information from the commercial fishery, anglerfish data were also available from the annual trawl groundfish surveys during spring (February–April) and summer (August–September), as well as from dedicated anglerfish surveys during the years 2002–2003. Anglerfish catch in kg/h, lengths and trawl depths from the annual groundfish trawl surveys on the Faroe Plateau in February/March and August and on the Faroe Bank in March/April and September for the period 2000–2020 were used in this study. The Faroese bottom groundfish surveys are described in ICES (2021). The survey data from the plateau and the bank are merged, and presented as a spring season (February–April) and a summer season (August and September) (Table 1). In addition, data from two dedicated anglerfish surveys in February 2002 and 2003, using bottom trawl equipped with a tickler chain, were used. These anglerfish surveys covered the shallow fishing area east of the Faroe Islands at depths from 100 to 200 m, the fishing area southwest of the Faroe Islands (“Skeivibanki,” 200–350 m) and on the Faroe Bank at depths from 100 to 900 m.
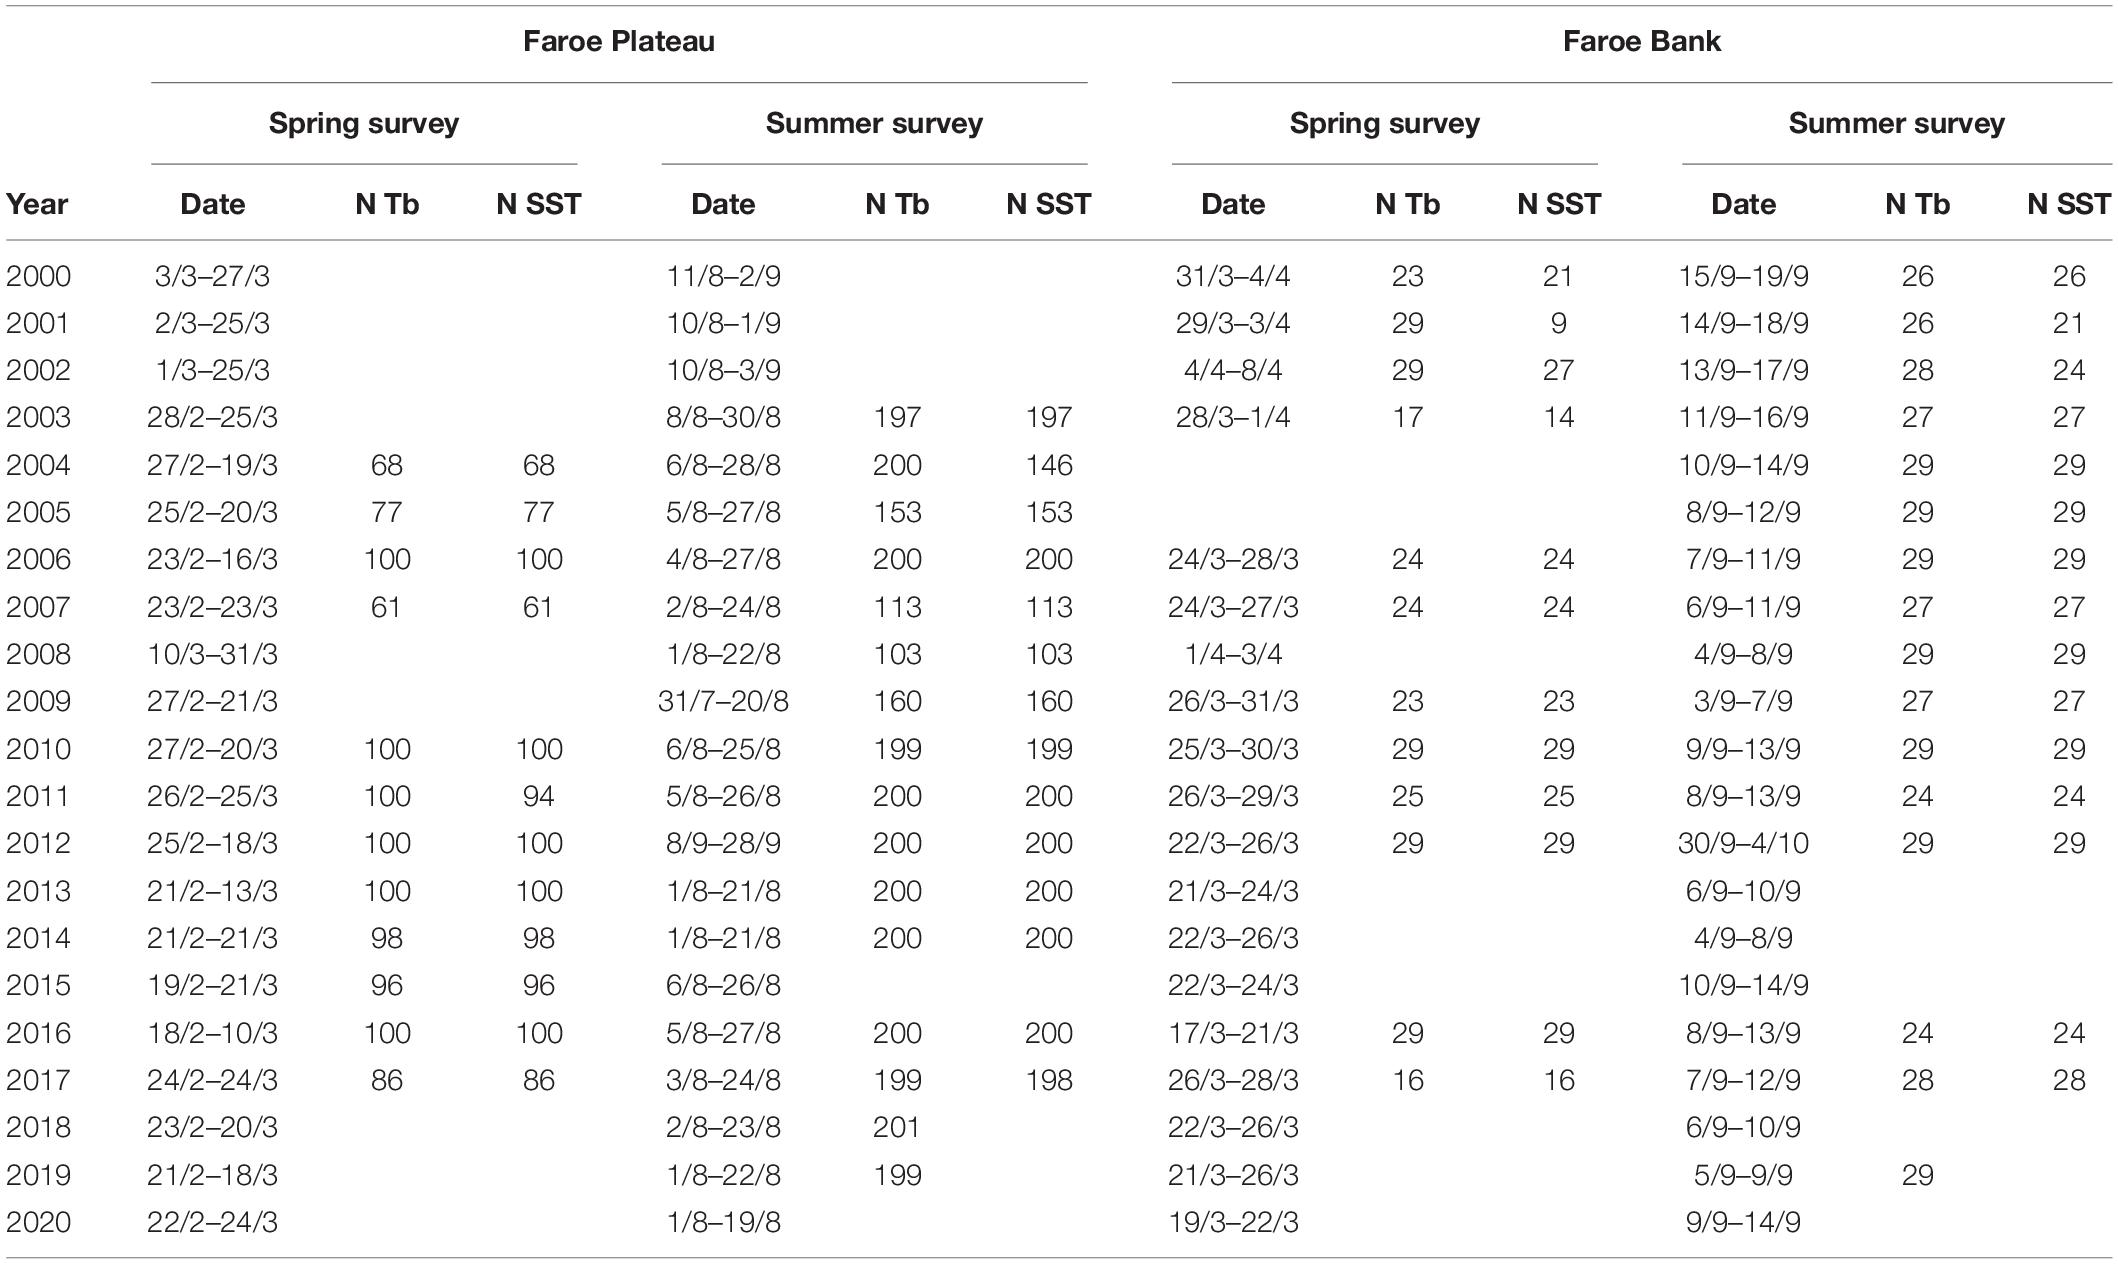
Table 1. Year, date and number (N) of stations where bottom temperatures (Tb) and sea surface temperatures (SST) were registered in the annual spring- and summer groundfish surveys on the Faroe Plateau and on the Faroe Bank.
For visualization of spatial distributions on maps, anglerfish kg/h from each individual annual groundfish trawl survey were first log-transformed [y = ln(value + 1)], then gridded using Objective Mapping (Bohme and Send, 2005), and finally back-transformed (ey). The annual fields were averaged prior to plotting. In addition, a cumulative frequency distribution (cdf) was applied to plot the frequency of the depth and bottom temperature measurements vs. anglerfish catch (kg/h) for the Faroe Plateau surveys for the period 2003–2019 (Table 1), following the example of Perry and Smith (1994). The null hypothesis of random association between anglerfish catch (kg/h) in the research trawl surveys and the habitat variable (depth or bottom temperature) were examined using a randomization procedure. A total of 2,000 randomizations were performed in each test and a p-value was calculated based on a test-statistic for deviation between the cdf for the habitat and the cdf for the catch-weighted habitat function (Perry and Smith, 1994). The mean depth distribution of anglerfish was calculated by splitting all length data pooled for 2000–2020 from the Faroe Plateau groundfish surveys and anglerfish surveys into 10 cm bins and where the mean depths and associated 95% confidence intervals were calculated in R (R Core Team, 2014).
We used the subpolar gyre index, described in Hátún and Chafik (2018), as a proxy for the general hydrographic (Hátún et al., 2005) and biogeographic (Hátún et al., 2009b) states in the northeastern Atlantic. A low gyre index reflects warm and saline conditions and a high index reflects colder and fresher waters around the Faroes.
During the scientific spring and summer surveys, some trawl hauls were complemented by samplings of bottom temperatures and sea surface temperatures (SSTs) (Table 1). The bottom temperatures were recorded by Starmon mini and/or Starmon TD sensors,3 attached to the trawl doors, while the SST were obtained from temperature recordings from the cooling water intake of the research vessel. Bottom temperature registrations, averaged over each individual trawl haul, were available from some of the annual groundfish surveys (see Table 1). These data have been mapped for each respective spring and summer surveys using Objective Mapping (Bohme and Send, 2005), and subsequently averaged, in order to obtain the seasonal climatologies for each individual season.
Temperature data from two vertical standard hydrographic sections (V and N), sampled during February and late August/early September during the years 2013–2019 have been utilized. Section V extends from the Faroe Bank, across the Faroe Bank Channel and onto the Faroe shelf, while the meridional Section N (at 6°W) stretches from the north Faroe shelf and into the central parts of the Norwegian Sea (Figure 1). Averaged sections from the two seasons are visualized using the software Ocean Data View (ODV, R. Schlitzer, 20074).
Anglerfish migration in Faroese waters was investigated by mark-recapture data, and a mark-recapture project, using gillnetters, was carried out during two periods, 2005–2006 and 2009–2011, using both conventional spaghetti tags (N = 436) and Data Storage Tags (DSTs) (N = 55) (Table 2). The conventional tags were t-anchor tags from Floy tag Inc., Seattle, United States (FD-89sl, 3” total length, 1” monofilament, orange color). The DSTs were of the DST milli type produced by Star-Oddi (see text footnote 3), recording depth (pressure) and temperature, and where also a 10 cm yellow plastic tube was attached as an external marker (Supplementary Figure 1).
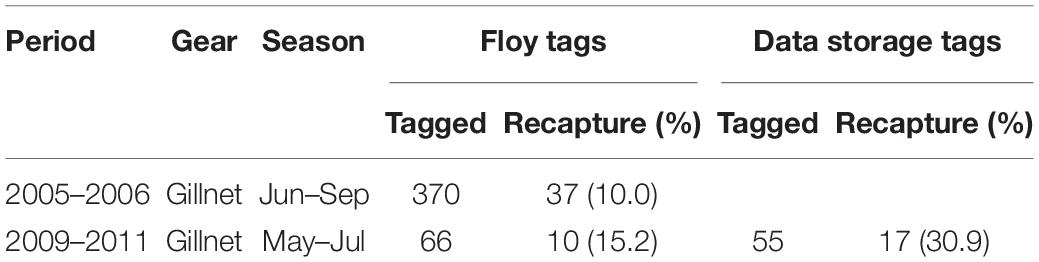
Table 2. Overview of the Faroese mark-recapture project of anglerfish tagged from gillnets north of the Faroe Islands.
Anglerfish were tagged with conventional tags attached to the tail muscle, on fish of lengths from 53 to 124 cm. A new procedure was used for attaching the DSTs, that were inserted subcutaneously dorsally (Supplementary Figure 1; Richards et al., 2011) and not inside the buccal cavity as used in a pilot project (Thangstad et al., 2006). Details on the tagging procedure are provided in Ofstad (2013). The DSTs were programmed to record temperature and depth minimum once every hour. In addition more intensive recordings were applied for selected time intervals (Ofstad, 2013). However, here only data recorded once every hour were used, the first three days of data were excluded and only fish recaptured more than one month after tagging were used in the analysis. Recapture rate of anglerfish tagged from gillnets in Faroese waters was relatively high, 10% for conventional tags and 27% for DSTs (Table 2).
In order to investigate potential changes in migration during the year, data was divided in four seasons; (November–February, March–April, May–August, and September–October). Vertical activity was defined as instances when the fish changed depth by more than 5 m from one registration to the next registration 60 min later, and only DST data recordings every full hour (e.g., 12:00, 13:00) were used. A vertical activity index (%) was calculated as total number of vertical activity registrations × 100/total registrations for a given time period (each month or by each hour of the day in each season). The vertical activity index was calculated for the 10 DSTs individually. The vertical activity index (%) by month was used to investigate whether anglerfish had seasonal changes in vertical activity, whereas the vertical activity index (%) by hour (of day in particular seasons) explored seasonal changes in diurnal vertical activities. Hours of high vertical activity were calculated as the hours per month where the vertical activity index was larger than 3% (Ofstad, 2013). The sun angle at the Faroe Islands (62°N, 7°W) was calculated using the solar position algorithm by Reda and Andreas (2004) (Supplementary Table 1).
The anglerfish catches in Faroese waters reached a maximum of more than 5,000 tons in 2005–2006, thereafter dropping to moderately high values of around 2,200–2,500 tons in 2008–2011, and declined to low pre-1995 values of less than 1,400 tons in 2012–2018 (Figure 2). The catches have again increased to moderately high values of around 2,600 tons in 2019–2020.
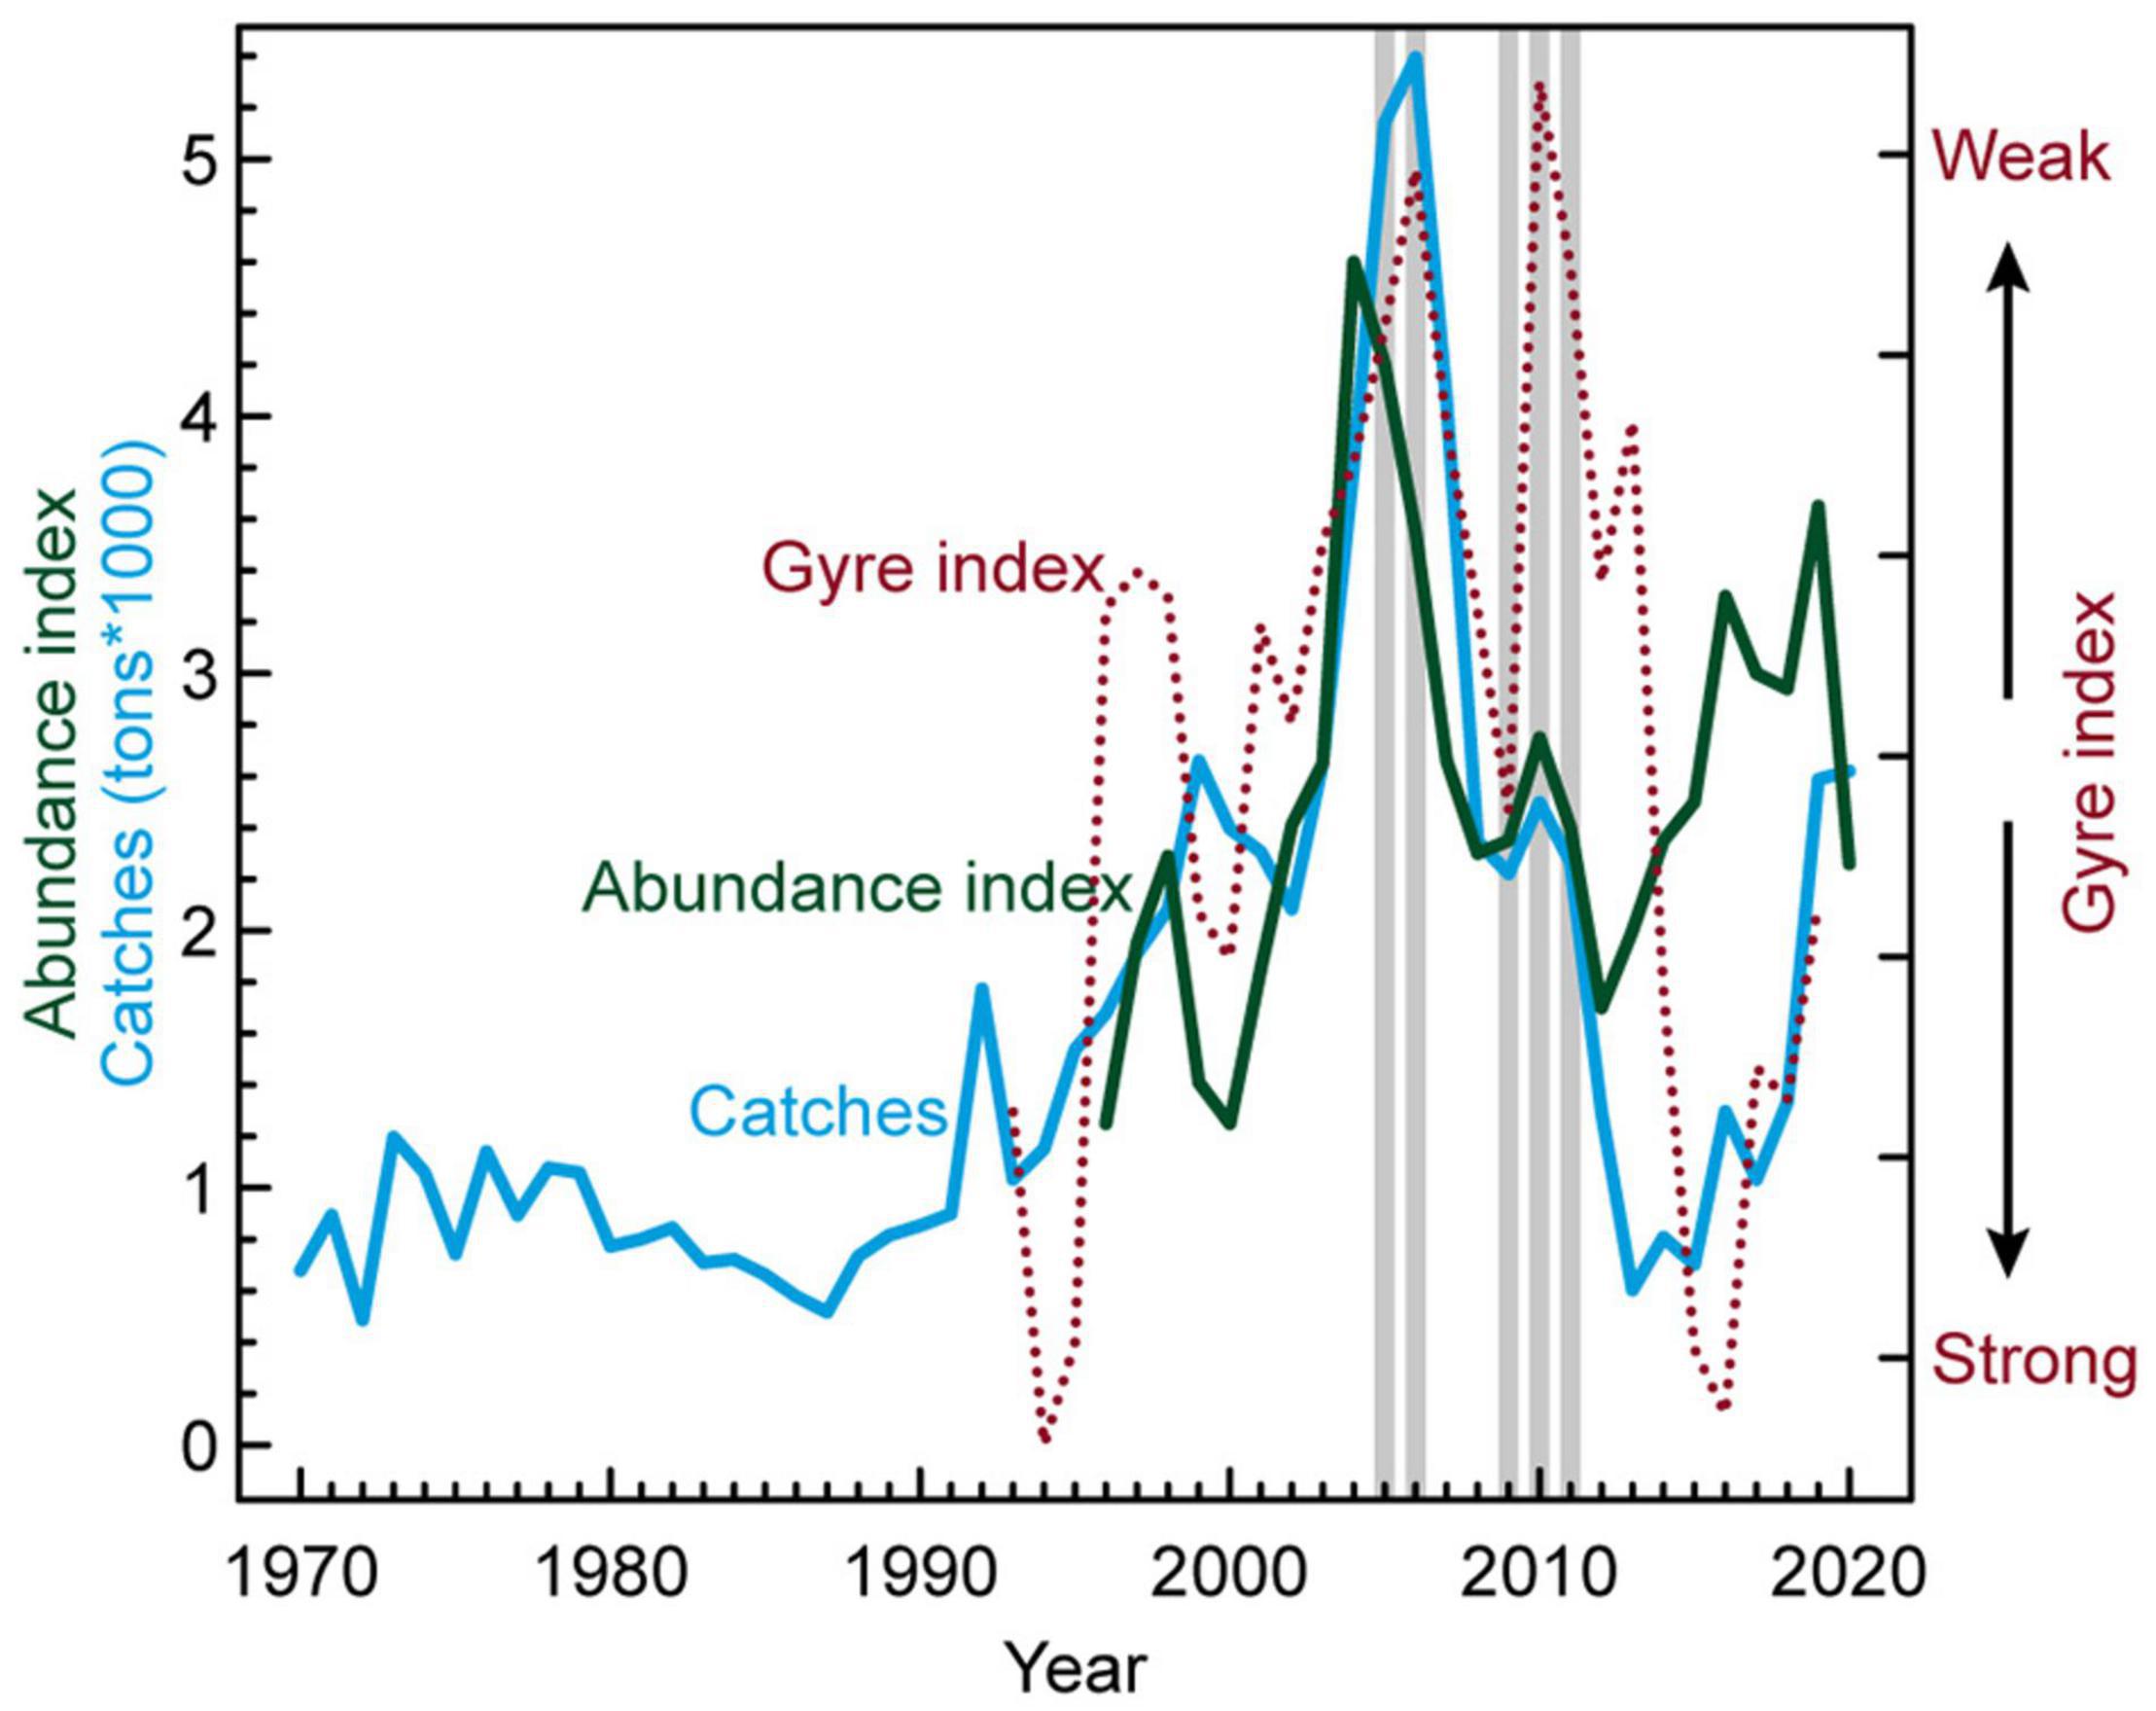
Figure 2. Catches of anglerfish in Faroese waters (1970–2020), abundance index of proportion of anglerfish-hauls in the summer groundfish survey (1996–2020) and the gyre index (1993–2019). The gillnet anglerfish tagging years are indicated with gray vertical bars. The northeastern Atlantic is anomalously warm when the gyre index is weak.
There appears to be a link between the increase and decrease in anglerfish landings (abundance) in Faroese waters and a weakening and subsequently intensification of the subpolar gyre index (SPG, Figure 2). The SPG weakened abruptly in 1996 (note inverse gyre index scale in Figure 2), and was in a generally weakened state, with warm and saline conditions in the NE Atlantic (low gyre index), until 2013. During the years 2014–2016, the SPG strengthened back to the strong state of the early 1990s (Hátún and Chafik, 2018), but it has yet again weakened to moderate size/strength in 2019.
The first tagging period (2005–2006) thus coincided with very high anglerfish catches/abundances, while the second tagging initiative occurred during a period with moderate catches/abundances (2009–2011), as emphasized with the gray bars in Figure 2.
Commercial logbook data showed that the main anglerfish fishing areas for small trawlers (<700 HP) differed during the year with a deeper distribution in November–April (Figure 3A) than during May–October (Figure 3B). There were two distinct trawl fishing areas in winter; one southwest of the Faroe Islands, where there is an indentation in the Faroe slope called “Skeivibanki,” and the other one southeast of the Faroes, in a region referred to as the Eastern Banks (Eliasen et al., 2016). During summer, most of the trawling activity took place along an area on the shallower central shelf, north and east of the Faroe Islands (Figure 3B). Note that this shallow area was only open for small trawlers (<700 HP), mainly during May to August (ICES, 2021).
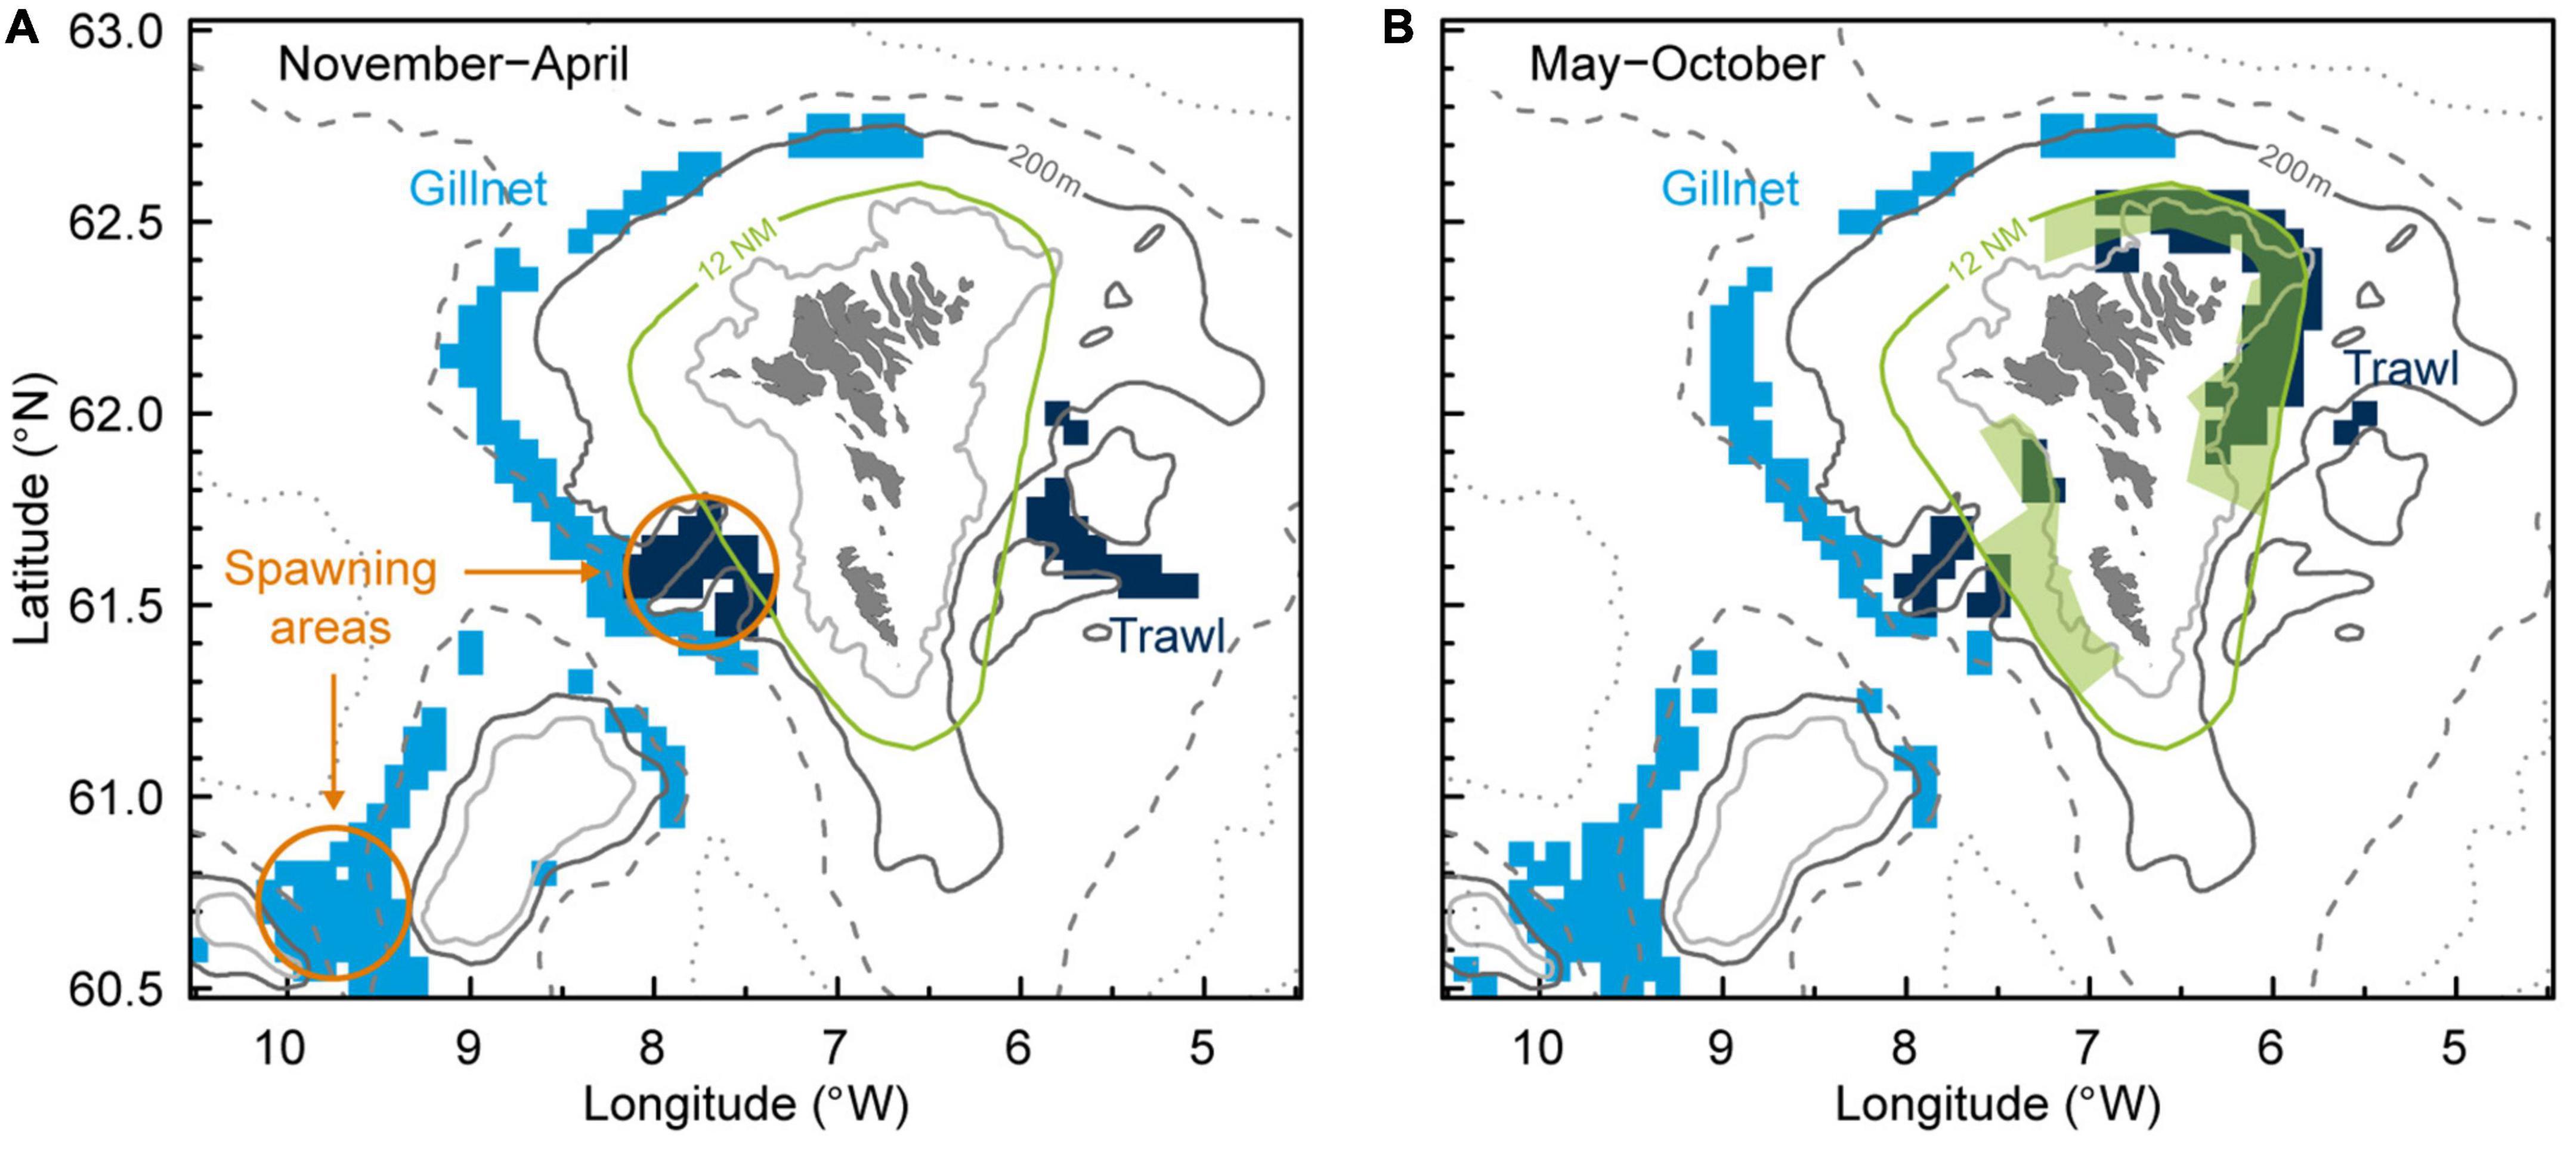
Figure 3. Main anglerfish fishing areas in Faroese waters (anglerfish constituted more than 50% of the catch in weight per settings/hauls) are shown for gillnet and trawl less than 700 HP in panel (A) November–April and (B) May–October. Depth contours shown for 100, 200, 500, and 1,000 m. Anglerfish spawning areas are indicated as orange circles (Ofstad et al., 2013). Note that there are both annually and seasonally closed areas for trawling, on both the Faroe Plateau and Faroe Bank (ICES, 2021), and that some shallower areas inside 12 NM around the Faroe Islands are only open for small trawlers (<700 HP) during summer (green areas).
There was no apparent seasonal shift in the gillnet fishery. The gillnetters were fishing in deep waters (>380 m) on the slopes west and north of the Faroe Islands, in addition to the area between the Faroe Bank and Bill Bailey Bank farther west (Figure 3). The gillnetters are restricted to fish deeper than 380 m on the shelf area, except for one gillnetter that was allowed to fish shallower in an area north of the Faroe Islands.
Catches from the annual spring- and summer groundfish surveys on the Faroe Plateau and on the Faroe Bank generally overlap and confirm the spatial patterns derived from the commercial fishing activity. The spatial distribution of anglerfish was well described by the surveys (Figures 4A,B). The cumulative distribution functions for bottom depth and catch-weighted depths deviated significantly for both the spring survey (p = 0.0005) (Figure 5A) and the summer survey (p = 0.0005) (Figure 5B), indicating that anglerfish occupy a deeper depth range within the survey area during the spring survey and oppositely, anglerfish occupy a shallower depth range during the summer survey. Note that the catch rates were much higher in August than in March (2.6 vs. 1.2 kg/h, Supplementary Table 2).
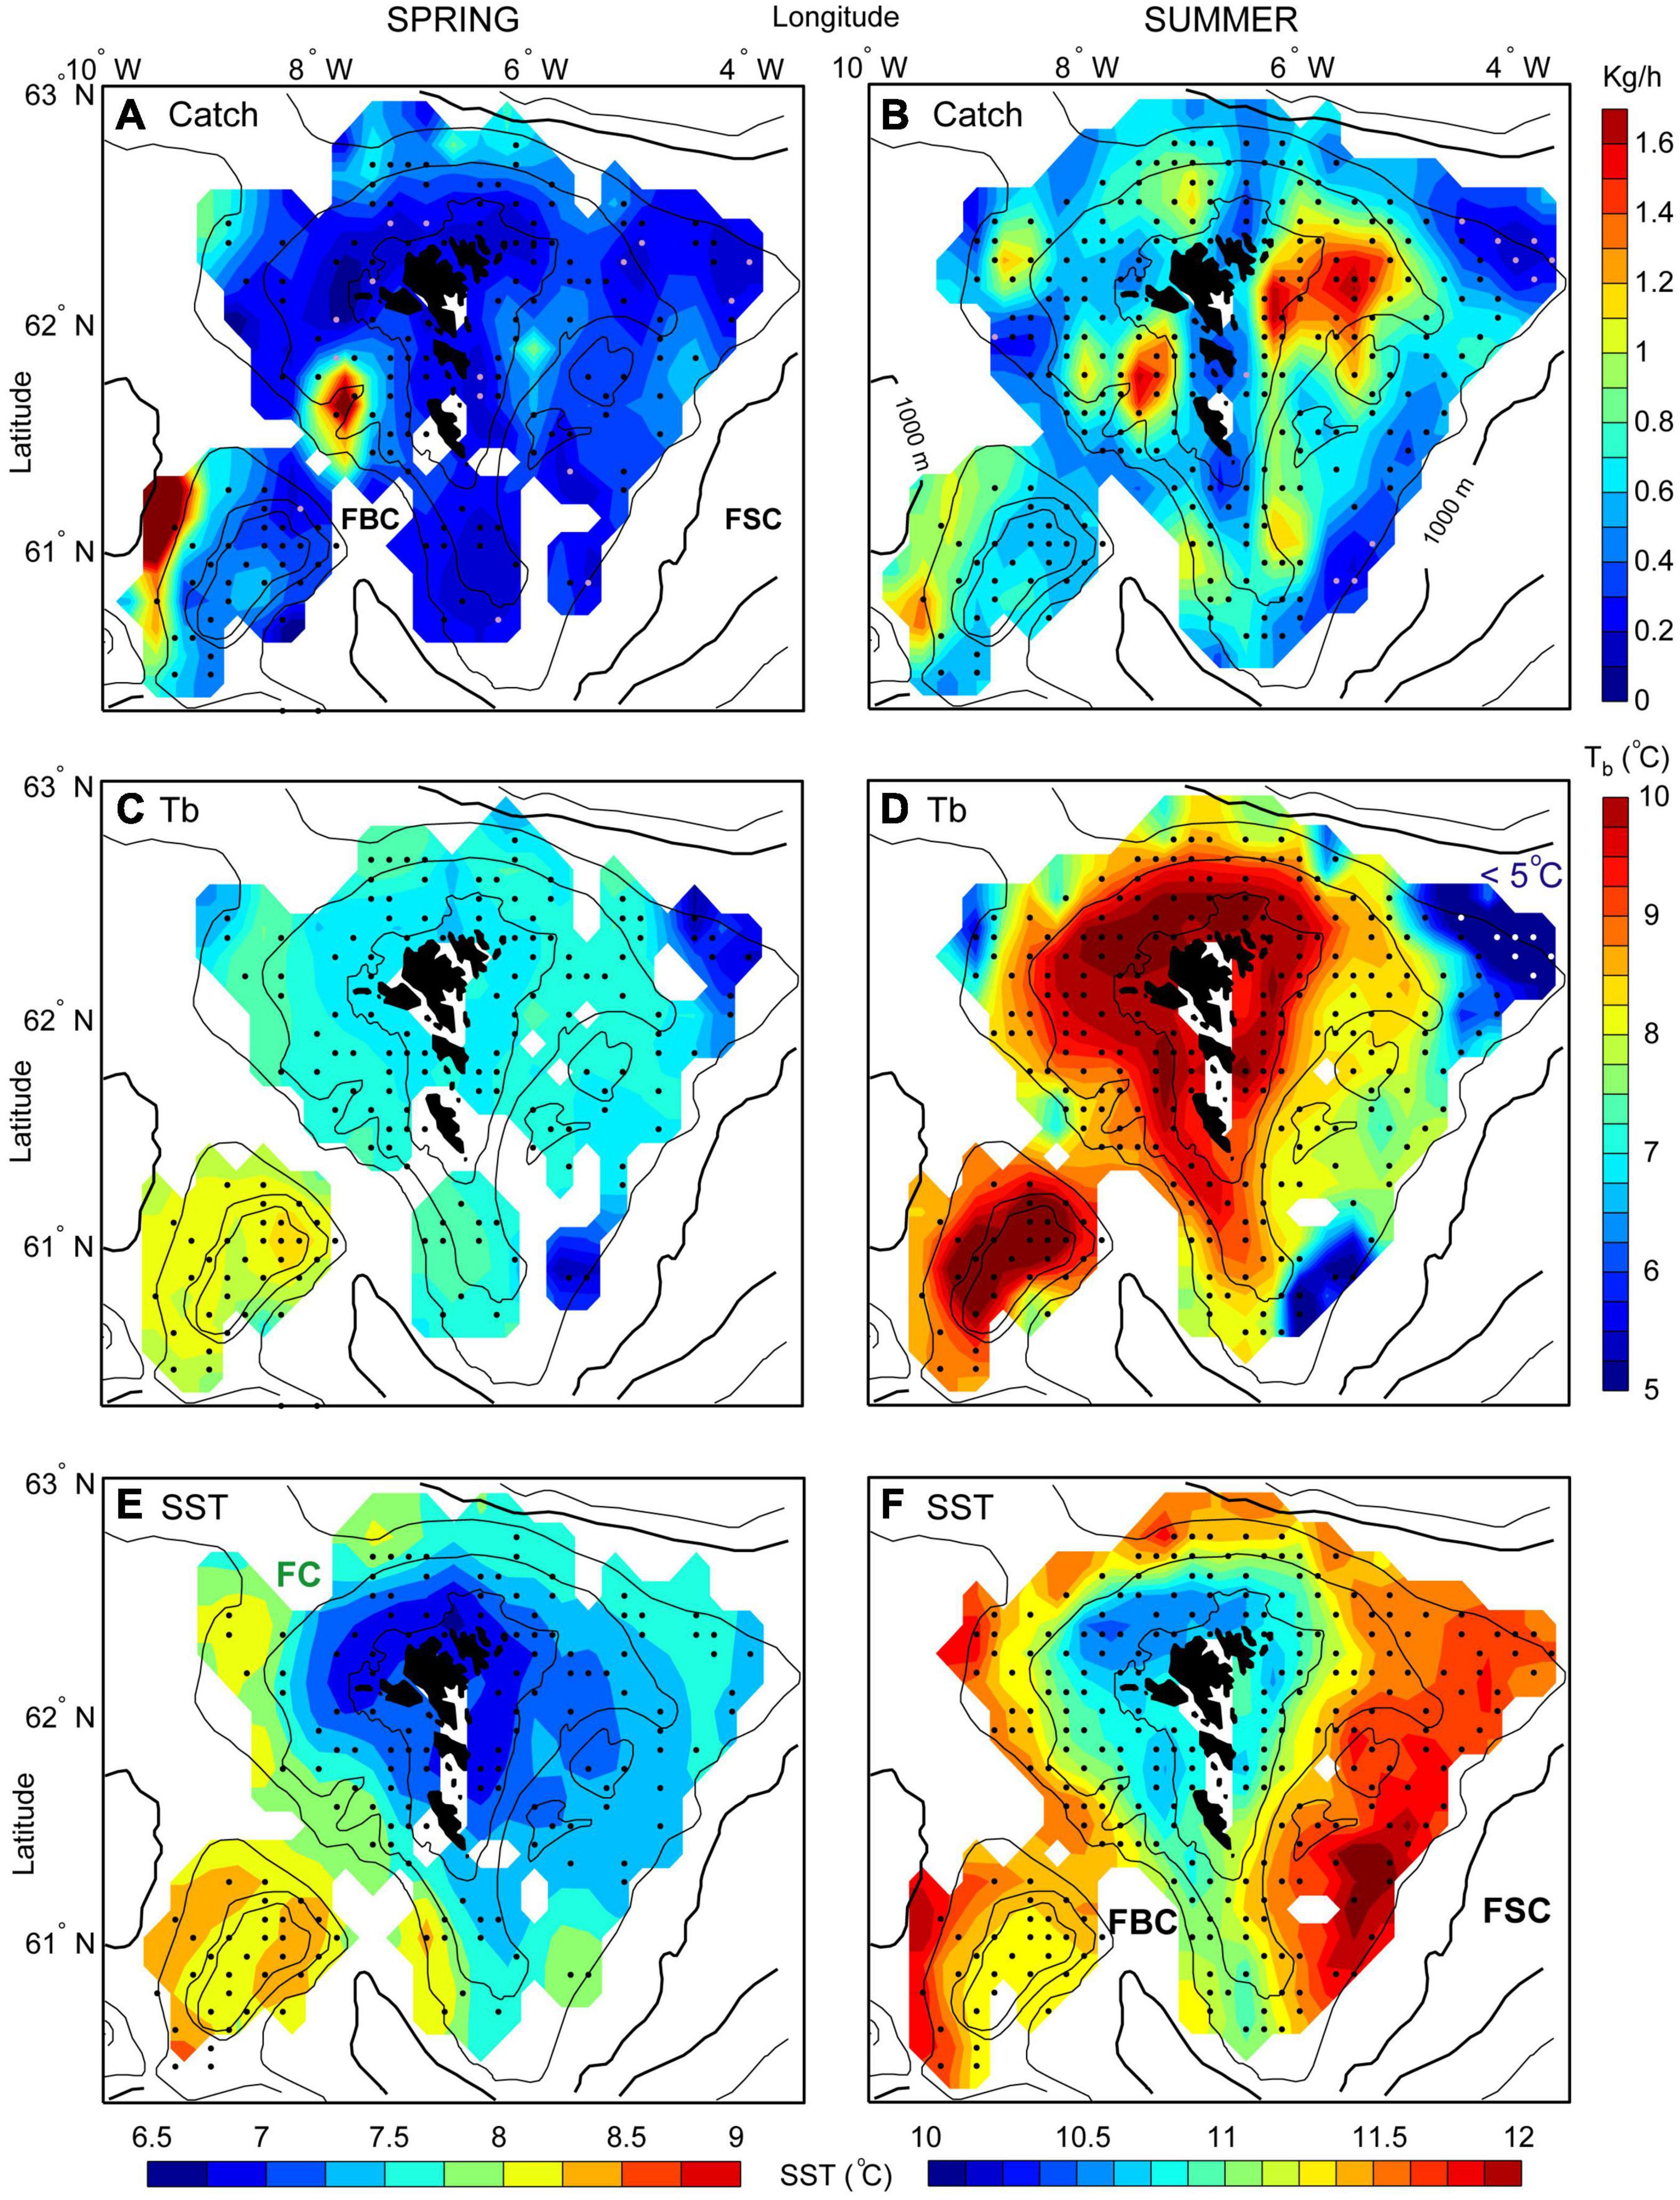
Figure 4. Distribution of anglerfish (catch, kg/h), bottom temperatures (Tb) and Sea Surface Temperature (SST) in Faroese waters from two annual Faroese groundfish surveys in spring (A,C,E) and summer (B,D,F). The data are gridded for each seasonal survey, and averaged over the years 2000–2020 (see “Materials and Methods”). The 100, 200, 500, and 1,000 m depth contours are shown. The black dots [and a few light purple dots when 0 anglerfish is caught in panels (A,B)] represent standard trawl station positions for each season. Note that the darkest blue coloring in panel (D) can have temperatures lower than 5°C (indicated by the white dots). FBC, Faroe Bank Channel; FSC, Faroe-Shetland Channel. Note that the color scales are different for the catch, Tb and SST data.
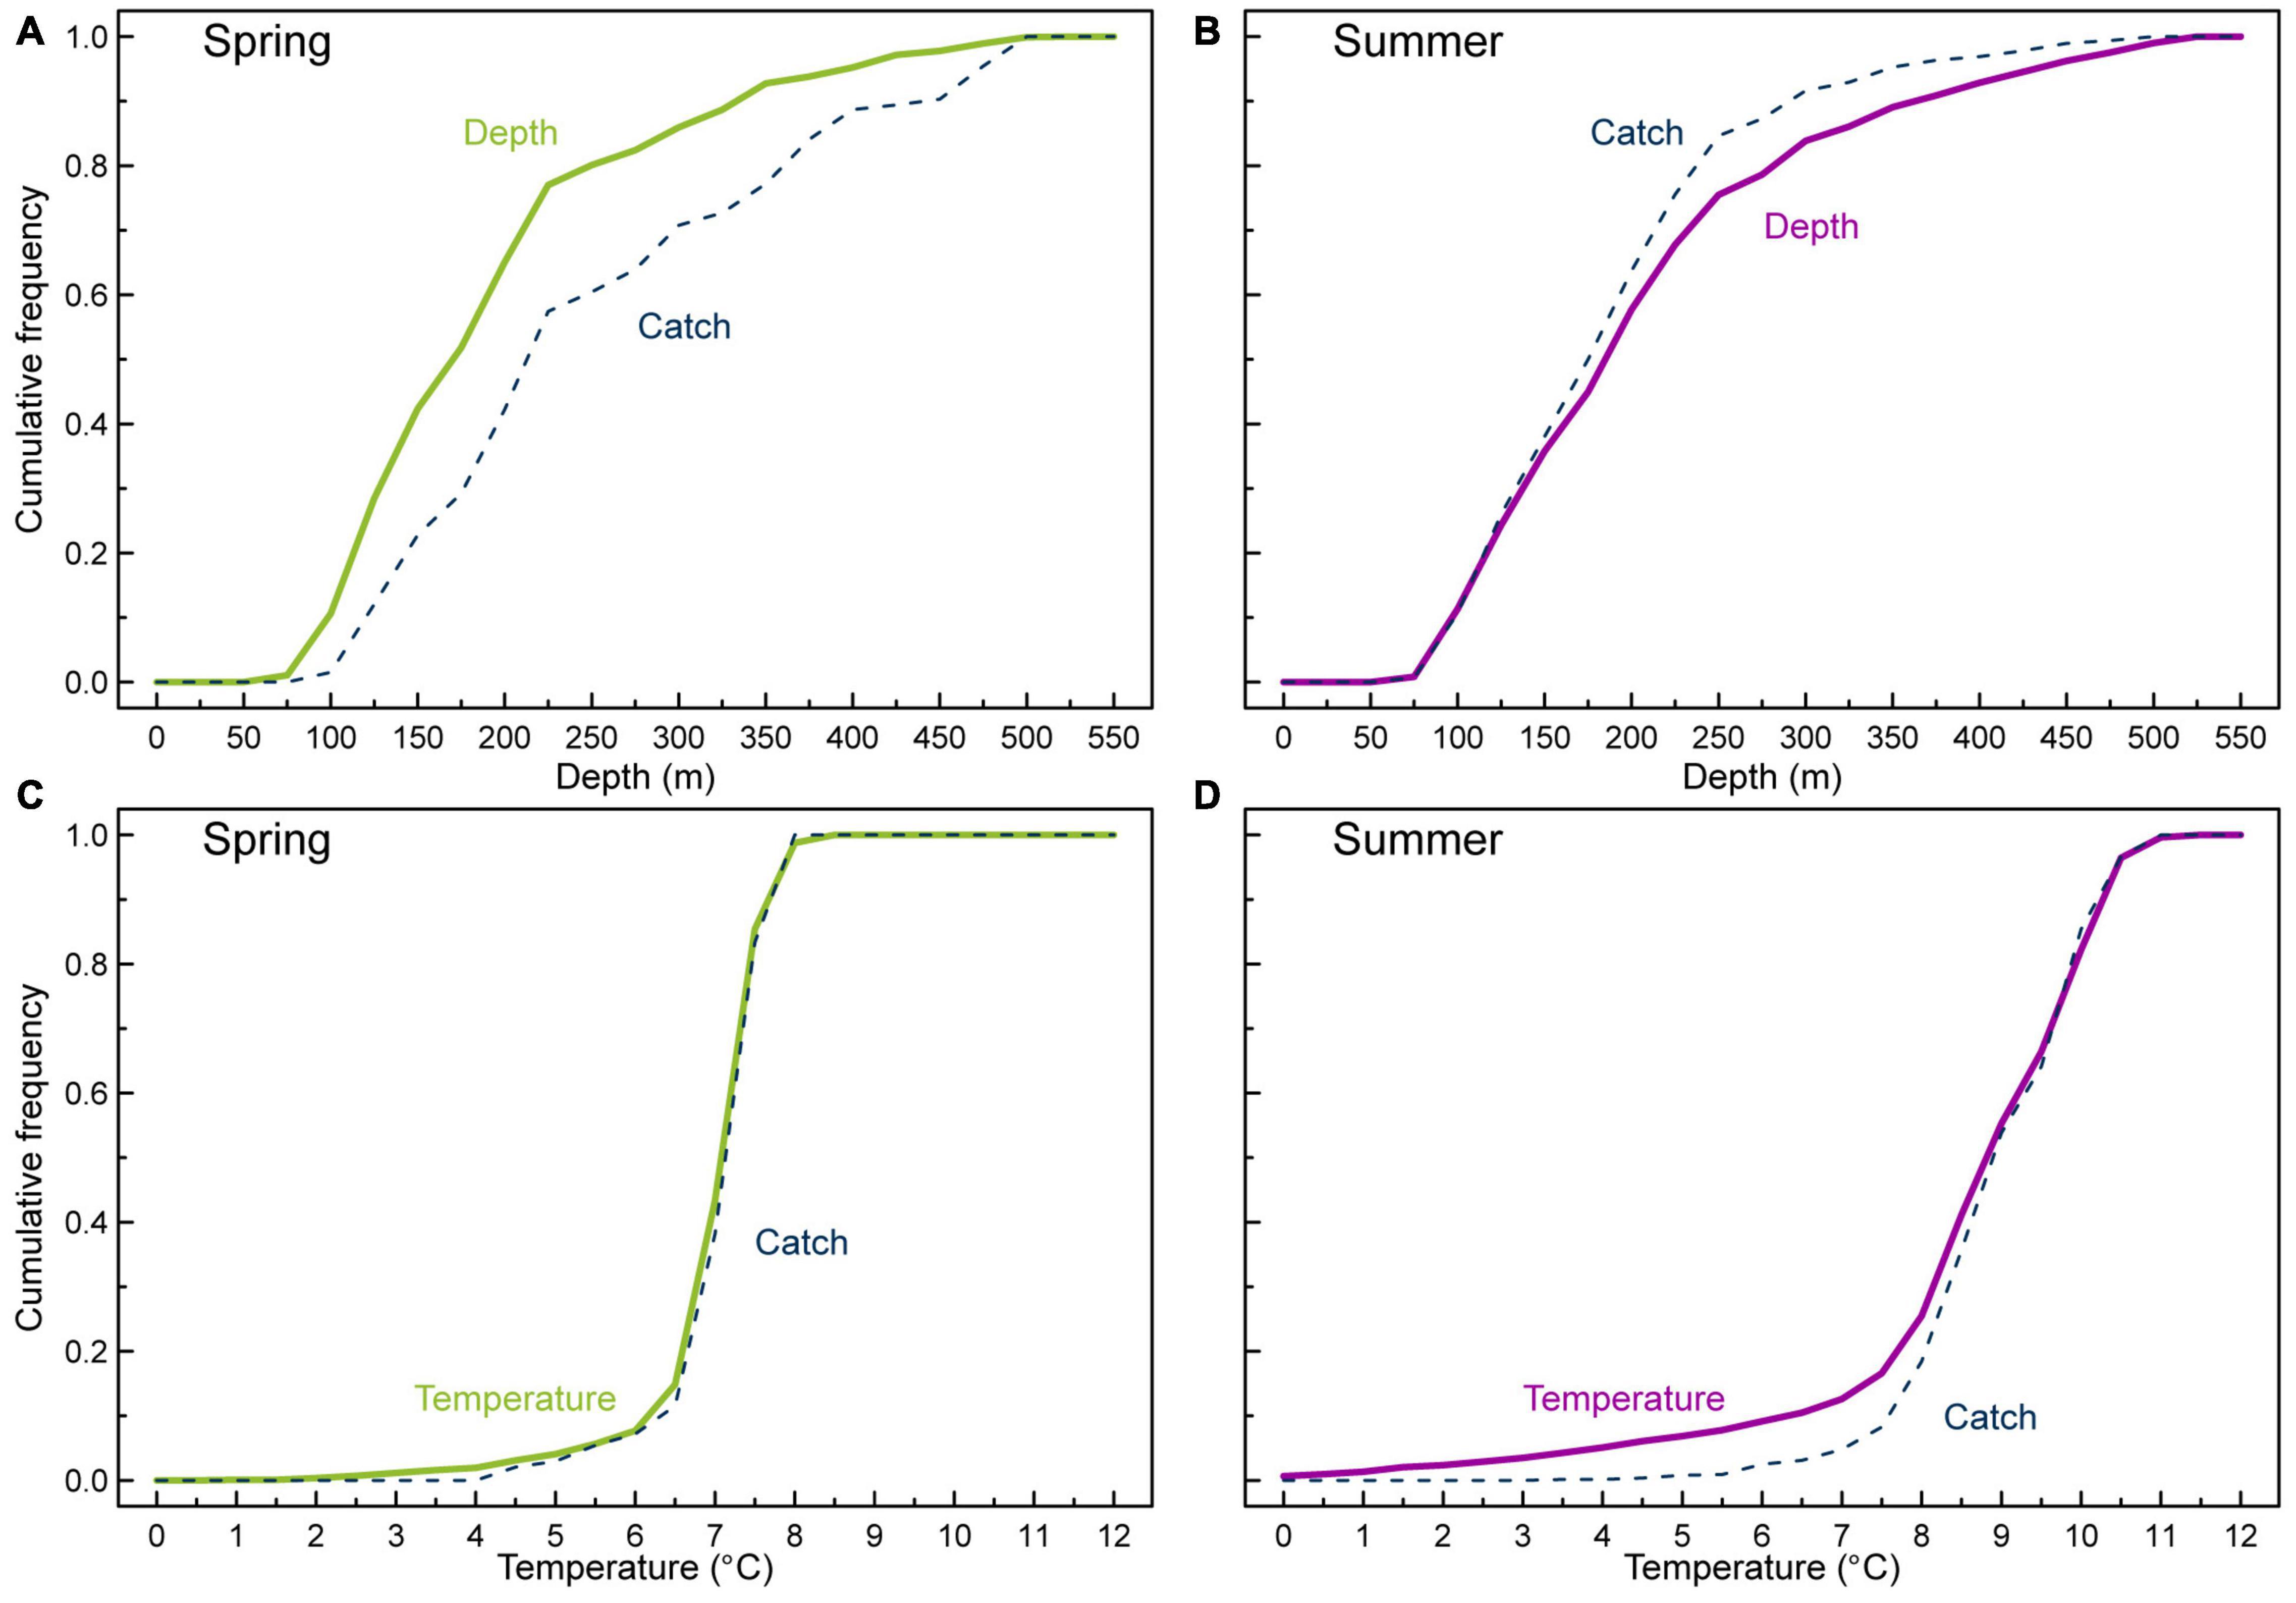
Figure 5. Cumulative frequency distribution of depth and temperature together with anglerfish catch weighted functions from the Faroe Plateau surveys for spring (A,C) and summer (B,D).
During the main spawning period in February–April, anglerfish clearly congregated in the “Skeivibanki” area and to the west of the Faroe Bank (Figure 4A). There was also a small concentration of fish east of the Faroe Islands (∼6°W), however slightly shallower than what appeared from the trawl fisheries (see Figure 3A). The fish abundance in this eastern region was much lower than in the two western areas. Anglerfish also congregated in deeper waters along the northwestern margin of the Faroe slope (Figure 4A).
Anglerfish concentrations were more spread out during August–September, compared to spring, and there was a clear movement toward shallower waters (Figure 4B). There were still high abundances NW off the Faroe Bank, and just inside the “Skeivibanki” area, in a region previously referred to as the Western Region (Hátún et al., 2013). The highest abundances during late summer were, however, on the eastern side of the Faroe shelf (∼62°N, 6°W), where also large trawling activity took place (Figure 3B).
Survey data from the Faroe Plateau showed that the medium sized anglerfish (40–60 cm) generally occupied the shallowest waters (Figure 6), while both the smaller fish (<40 cm) and especially the larger fish (>60 cm) occupied deeper waters. This difference was most pronounced during the spring surveys when the small fish moved out to ∼250–300 m depths, and the largest fish moved to depths deeper than 250 m whereas the medium size anglerfish occupied the 150–250 m depth range. During the summer surveys, all fish sizes generally stayed in waters shallower than 250 m (Figure 6).
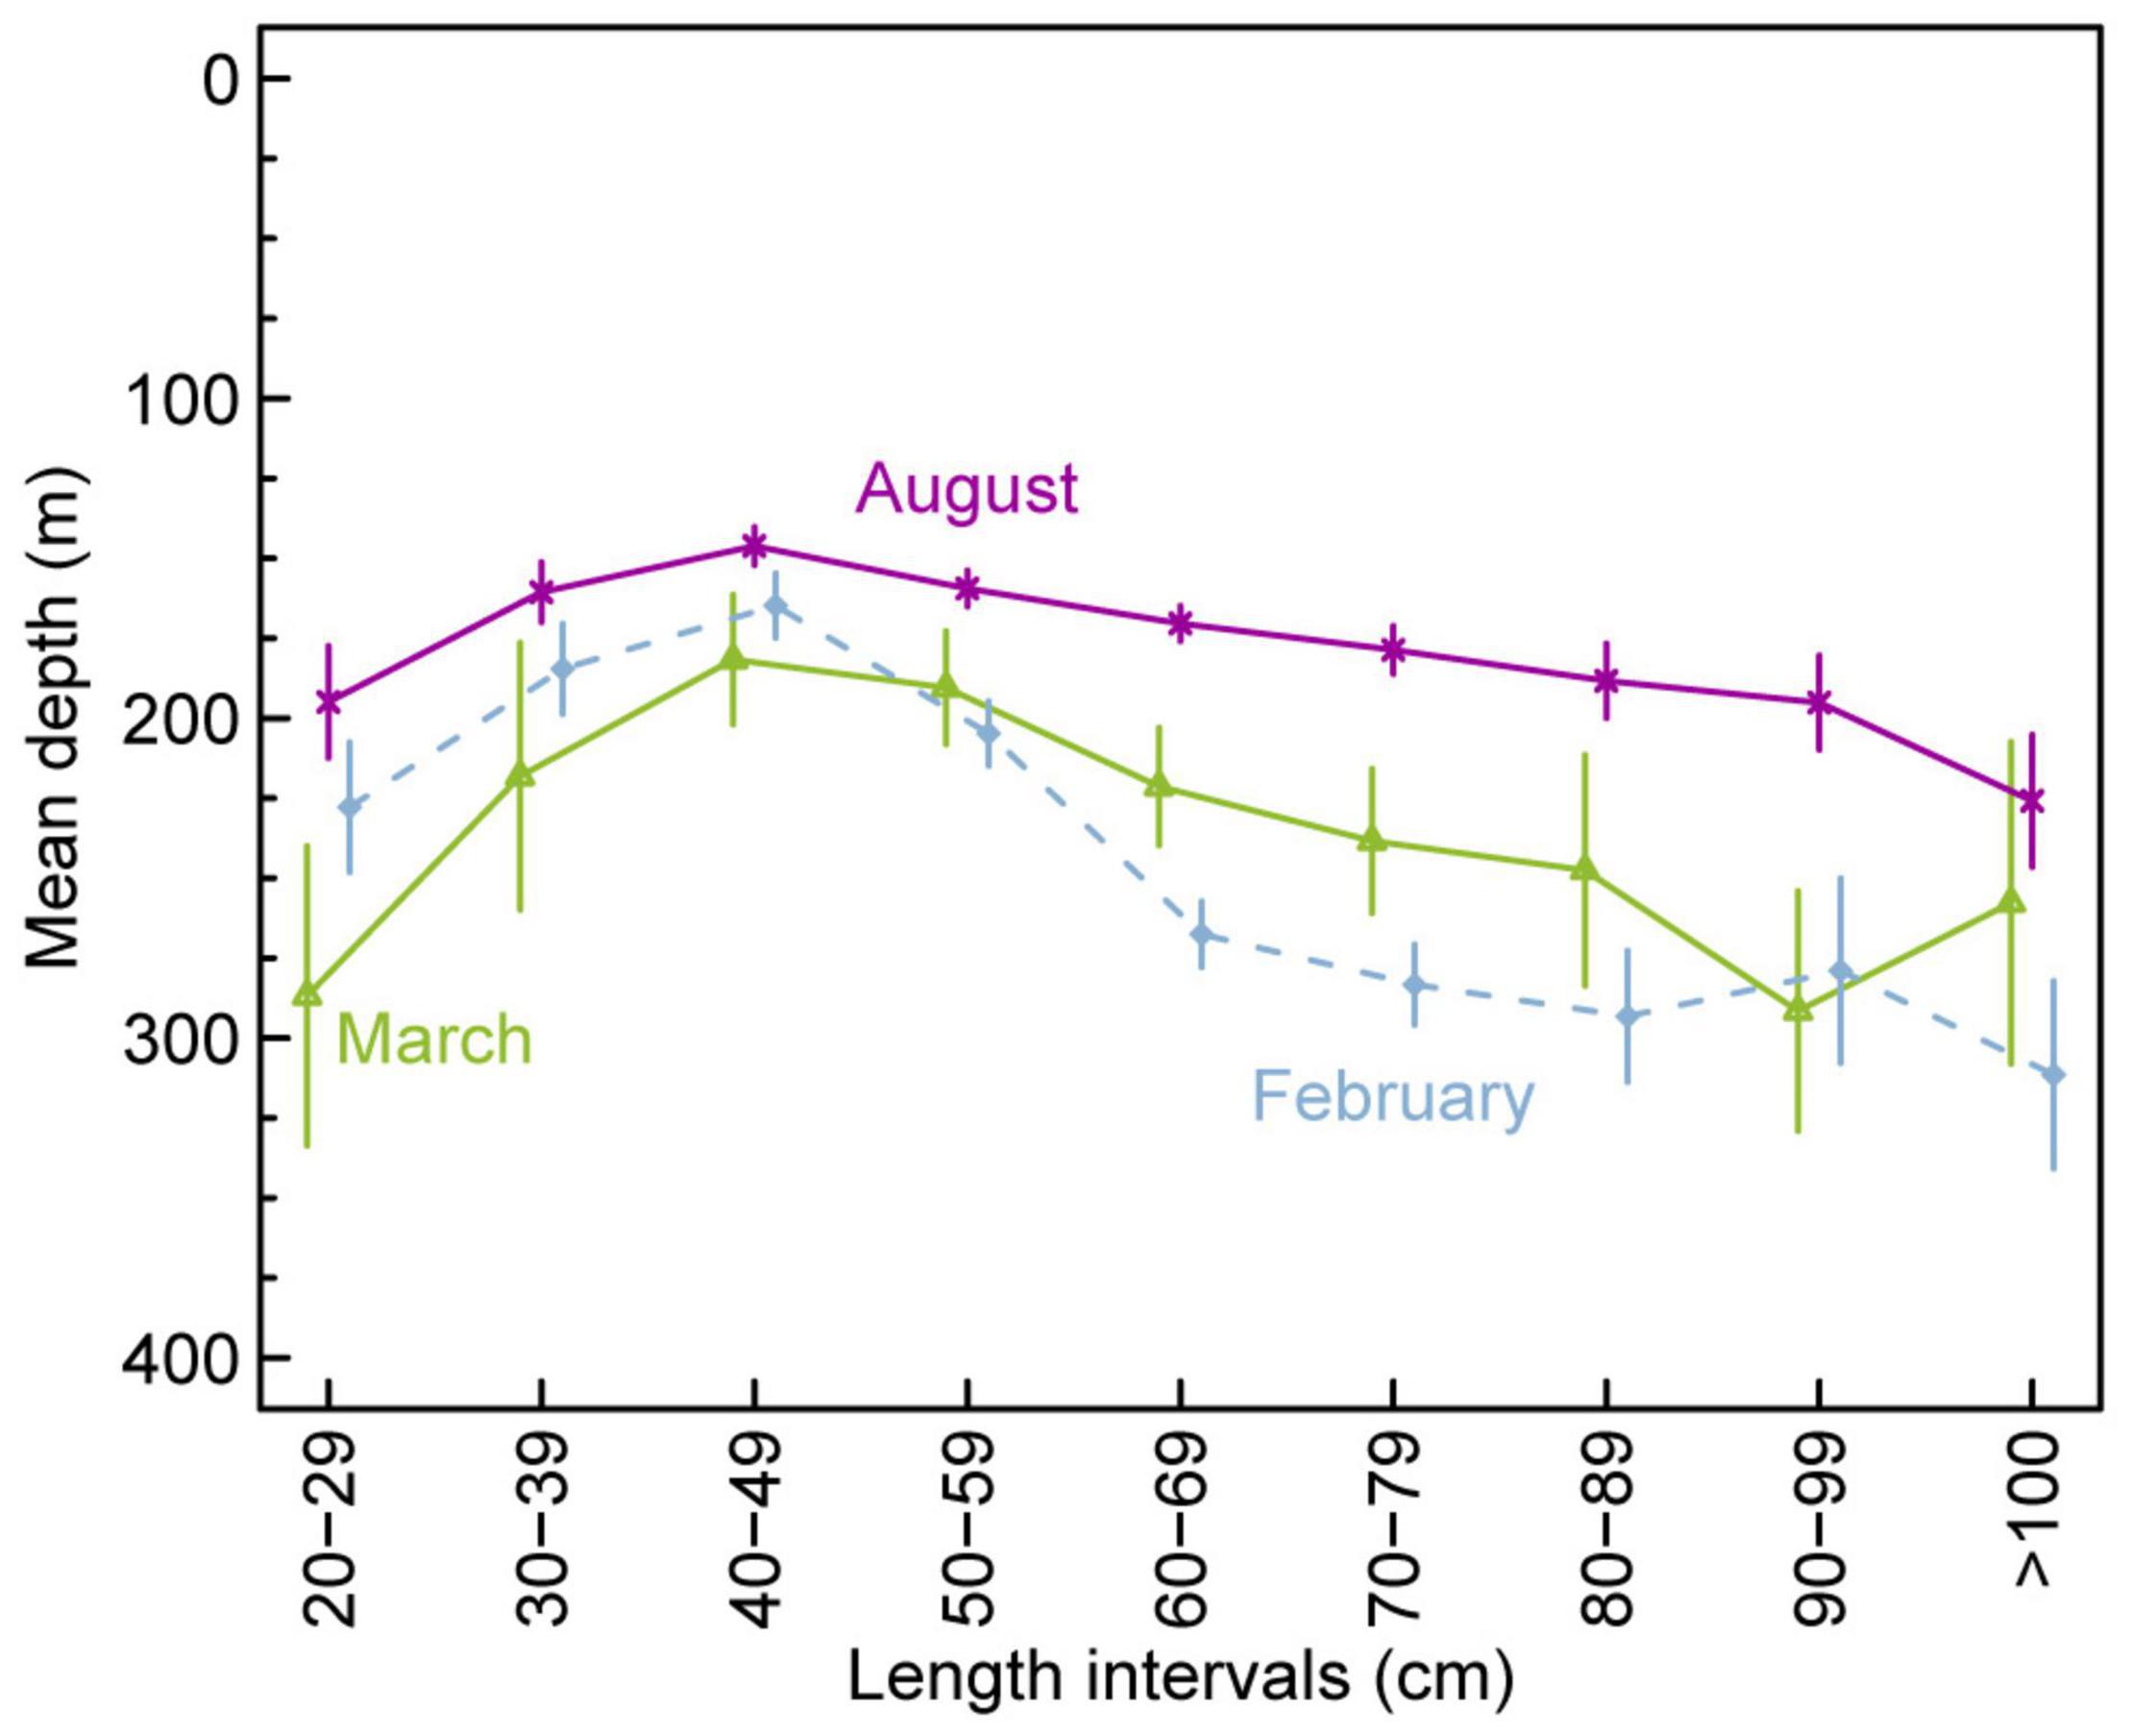
Figure 6. Mean depth distribution of anglerfish versus anglerfish size from the groundfish survey (2000–2020) on the Faroe Plateau in late February/March (lime) and August (purple line), and from the anglerfish survey during February in 2002 and 2003 (stippled light blue line). The bars indicate 95% confidence intervals.
Averaged (years) horizontal surface and bottom temperature fields, based on data from the groundfish surveys (2000–2020, Table 1), and averaged vertical transects (2013–2020) from the Faroe Bank across the Faroe Plateau and north into the Norwegian Sea, provided an oceanographic context that was vital for the interpretation of both the survey-based anglerfish distributions and the fish tag data (see below).
During spring, the study region was characterized by relatively high temperatures on the western side of the Faroe Plateau, and along the clockwise path of the Faroe Current around the plateau. This was evident both in the bottom temperatures (Figure 4C) and in the sea surface temperatures (SSTs) (Figure 4E). Lateral temperature gradients between oceanic and shelf waters were therefore much stronger on the western and northern sides, compared to the eastern side. Bottom temperatures in the spawning regions at “Skeivibanki” and along the NW slope were around 7–7.5°C during this period, while the region NW of the Faroe Bank was dominated by water layers warmer than 8°C. Temperatures on the central shelf were below 7°C, both at the bottom and at the surface (Figures 4C,E, 7A), and thus lower than the surrounding water masses. A closer inspection of the temperature registrations from the trawl hauls showed that anglerfish in spring were mainly caught in temperatures from 5 to 8°C (c.f. Figures 4A,C and Supplementary Table 2). The cumulative distribution functions for temperature and catch-weighted temperatures from the spring survey did not deviate significantly (p = 0.42) (Figure 5C), indicating that anglerfish were not seeking out a particular range of temperatures within the survey area during this season.
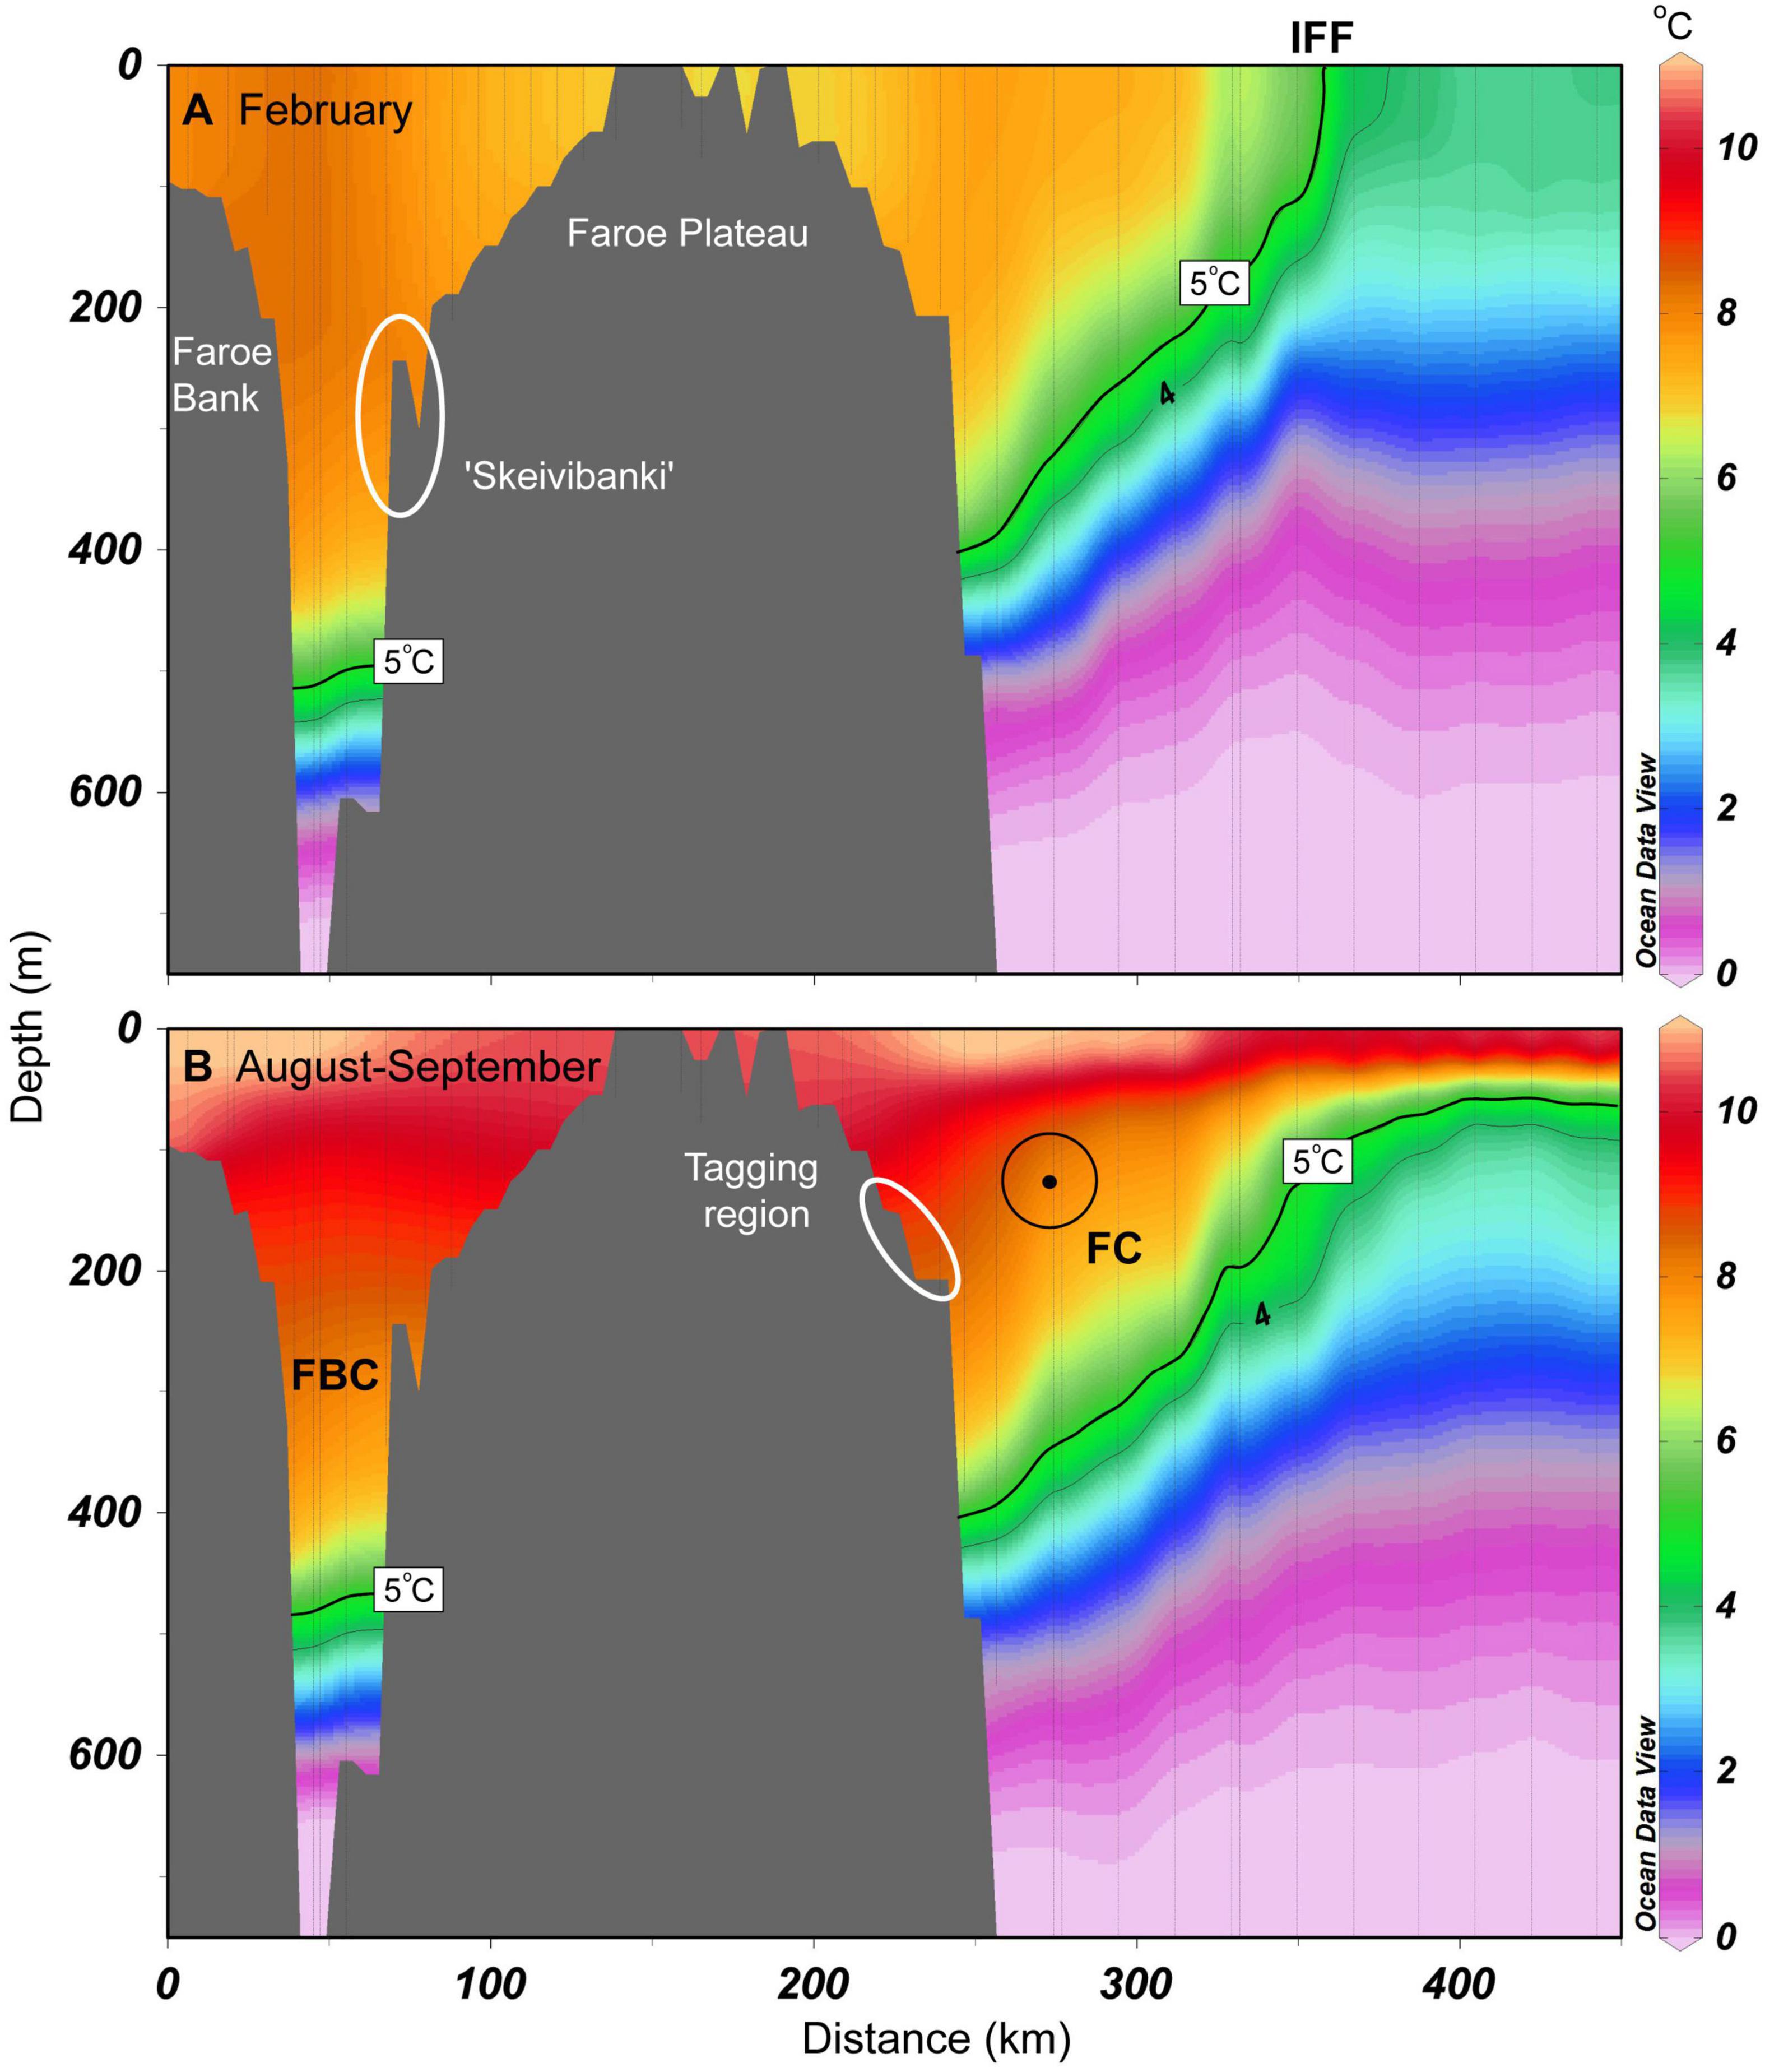
Figure 7. Average temperature sections (2013–2018) from the Faroe Bank, across the Faroe Plateau and following Section N toward north during (A) February and (B) late August/early September. The 5°C isotherm (and weakly the 4°C) is emphasized with black lines. This illustrates the lower tolerance of anglerfish, and it also coincides with the main interface between the upper MNAW and the underlying cold overflow source waters. Ovals show the spawning region near “Skeivibanki” (A) and the tagging region (B). FBC, Faroe Bank Channel; IFF, Iceland-Faroe Front; FC, Faroe Current (directed out of the paper).
A firmly established tidal front in late summer created a “halo” around the plateau, located between the 100 and 200 m isobaths (Figures 4D,F). SST was still lowest within the halo, while the bottom temperatures on the central shelf were higher than in deeper waters. During the August survey, the largest catches of anglerfish were taken within, or at the boundary of, this “halo” (c.f. Figures 4B,D,F) at bottom temperatures in the range 8–10.5°C, and SSTs in excess of 10.8°C. A closer trawl-by-trawl inspection revealed significant catches in waters as cold as 5.5°C, suggesting that anglerfish did seek the locations where the main interface intersected the seafloor, also during summer (Supplementary Table 2). The cumulative distribution functions for temperature and catch-weighted temperatures from the summer survey deviated significantly (p = 0.002) (Figure 5D), indicating that anglerfish were seeking out a warmer temperature range within the survey area.
Very few anglerfish were caught in temperatures below 5°C (Figures 5C,D and Supplementary Table 2). This isotherm, which marks the vertical boundary between the Atlantic water above, and subarctic and overflow waters below (i.e., the main interface, Cisewski et al., 2021; Hátún et al., 2021), was, on average, located at ∼500 m depths in the Faroe Bank Channel (Figure 7). It intersected the seafloor at ∼450 m at the northern Faroe slope, from where it ascended northwards, and outcropped at the surface as the Iceland-Faroe Front (at ∼350 km in Figure 7B). The position of this interface was roughly the same in spring and summer, although strong near-surface thermal stratification in August/September obscured any clear outcropping in the Iceland-Faroe Front.
The bottom temperature maps show two “cold spots” (<5°C) along the border of the Faroe-Shetland Channel, which reveals locations where the main interface intercepts the seafloor (Figures 4C,D). At the NE corner of the Faroe Plateau (∼62.5°N, 4.5°W), cold waters from underneath the Faroe Current turned southwards into the Faroe-Shetland Channel and near the southern tip of the plateau (∼61°N, 6°W), cold waters from the Faroe-Shetland Channel pressed up against this deeper part of the plateau (the Eastern Banks) (Berx et al., 2013). Anglerfish completely avoided these cold spots, as is emphasized by the light dots in Figure 4D. At the NW side of the plateau (∼62.5°N, 8.5°W), there was a third region with relatively cold bottom water, which likely reflected the presence of Iceland-Faroe Ridge overflow water (Beaird et al., 2016).
The results from 60 recaptured anglerfish tagged with conventional tags showed that the displacement distances between tagging position and recapture position ranged from 2.4 to 636.0 km. Of the anglerfish tagged from gillnets north of the Faroe Islands in summer (May–August), only 27% of the recaptures from the winter period November–February had displacement distances of less than 30 km. Most of these fish moved from the tagging region north of the Faroe Islands and southwest to the “Skeivibanki” region with depths >200 m, bordering the Faroe Bank Channel (Figure 8A). In addition, in the period March–April, some of the tagged fish were recaptured on the slope southwest of the tagging site. In contrast, 82% of the fish recaptured during the following summer (May–August) had displacement distances of less than 30 km and almost all were recaptured at depths less than 200 m (Figure 8B). This could suggest homing migration behavior since the fish were recaptured relatively close to the tagging site. The homing behavior is further supported by two anglerfish recaptured with DSTs in June and July at around 200 m depth close to the tagging site, after one year in liberty, during which period they had also been in deep water (<300 m) in the winter (Supplementary Figure 3). Only two out of 60 recaptured anglerfish had performed long distance migrations, one recaptured in Icelandic waters and one in Norwegian waters.
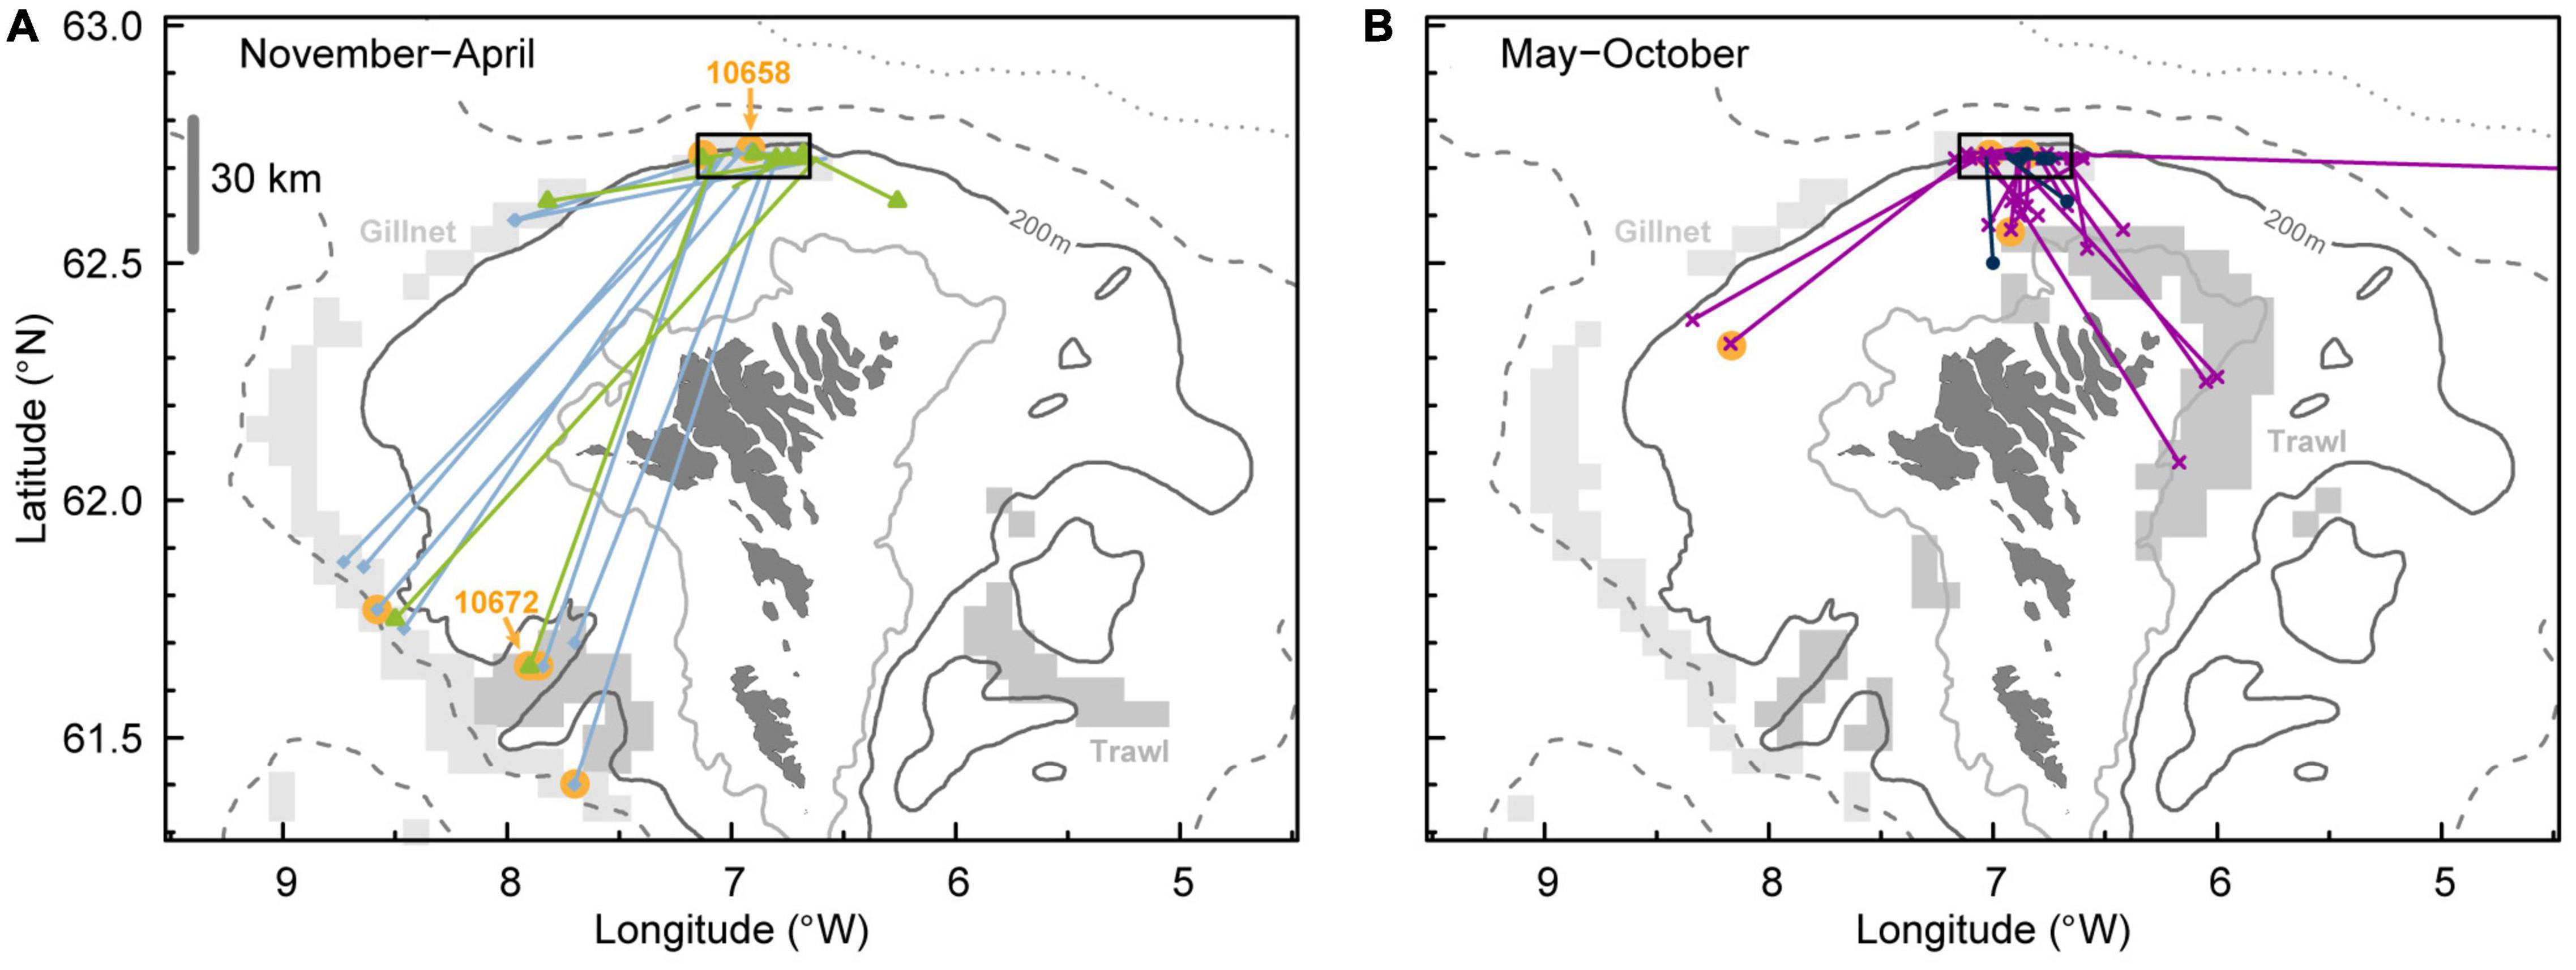
Figure 8. Horizontal movements of anglerfish tagged from gillnet north of the Faroe Islands (black rectangle) mainly in May–August. Recaptures during winter/spring are shown in panel (A), differentiated between November–February (light blue) and March–April (lime). Recaptures during summer/fall are shown in panel (B), differentiated between May–August (purple) and September–October (dark blue). The orange dots represent recapture of anglerfish with data storage tags and results from DST 10672 and DST 10658 are presented in Supplementary Figures 2, 3. Depth contours are shown for 100, 200, 500 (dashed), and 1,000 m (dotted). The main fishing areas are presented for small trawlers (gray rectangles) and gillnetters (light gray rectangles) (from Figure 3).
A total of 10 DST tagged anglerfish, >70 cm long at tagging and with time at liberty of more than three months, were recaptured. All 10 fish showed large shifts in distribution depths (Figure 9A), which reflects a clear offshore-onshore seasonal migration. Similar to the survey data, the tagged fish occupied shallow waters (<200 m depth) during the summer (May–September) and deep waters (>300 m) during the winter (November–February) (Table 3 and Figure 9A). Intermittent periods were recognized in September–October and March–April, when the depth distributions showed a transitional phase.
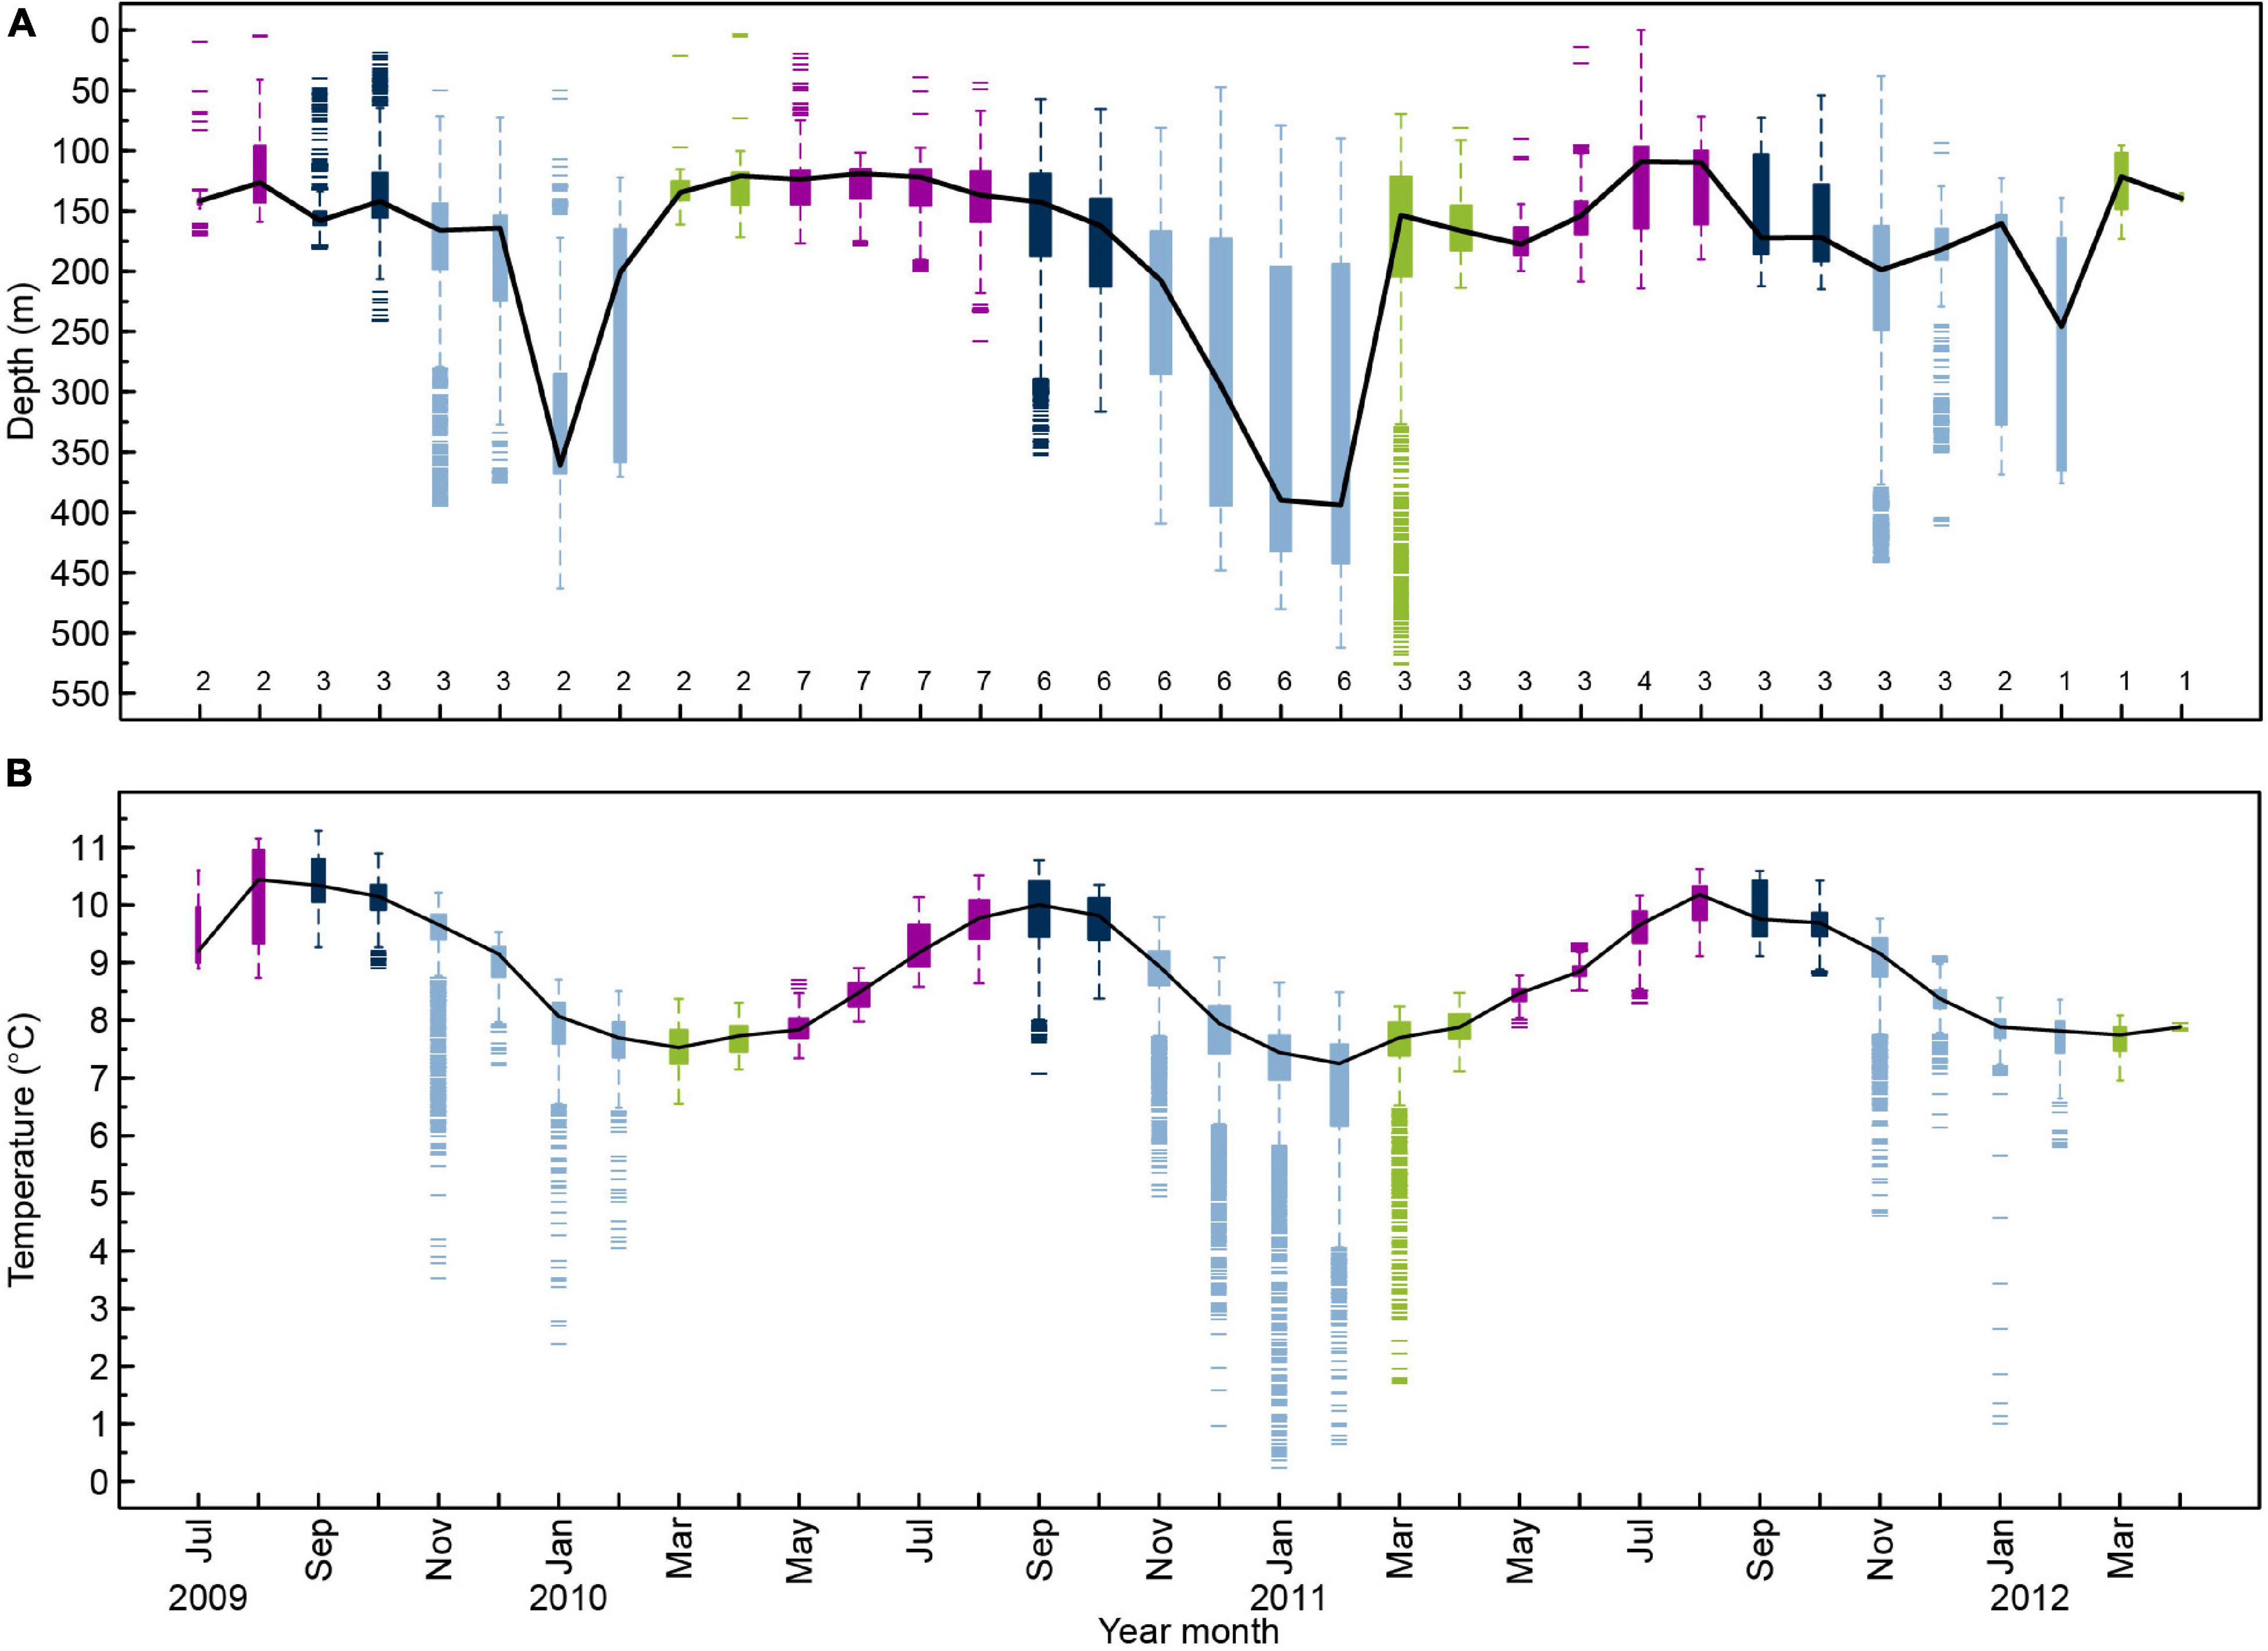
Figure 9. Distributions of (A) depth and (B) ambient temperature per month for the period July 2009 to April 2012 from pooled DST data of 10 anglerfish larger than 70 cm. The numbers inside the x-axis is number of anglerfish. The black line is the median, the box represents the upper and lower quartile, the error bars are upper and lower extremes (excluding outliers) and the short lines are outliers. The outliers are defined as values 1.5 times larger than the inter-quartile range. The width of the box indicates the sample size (a broader box indicates larger sample size). The colors indicate different seasons.
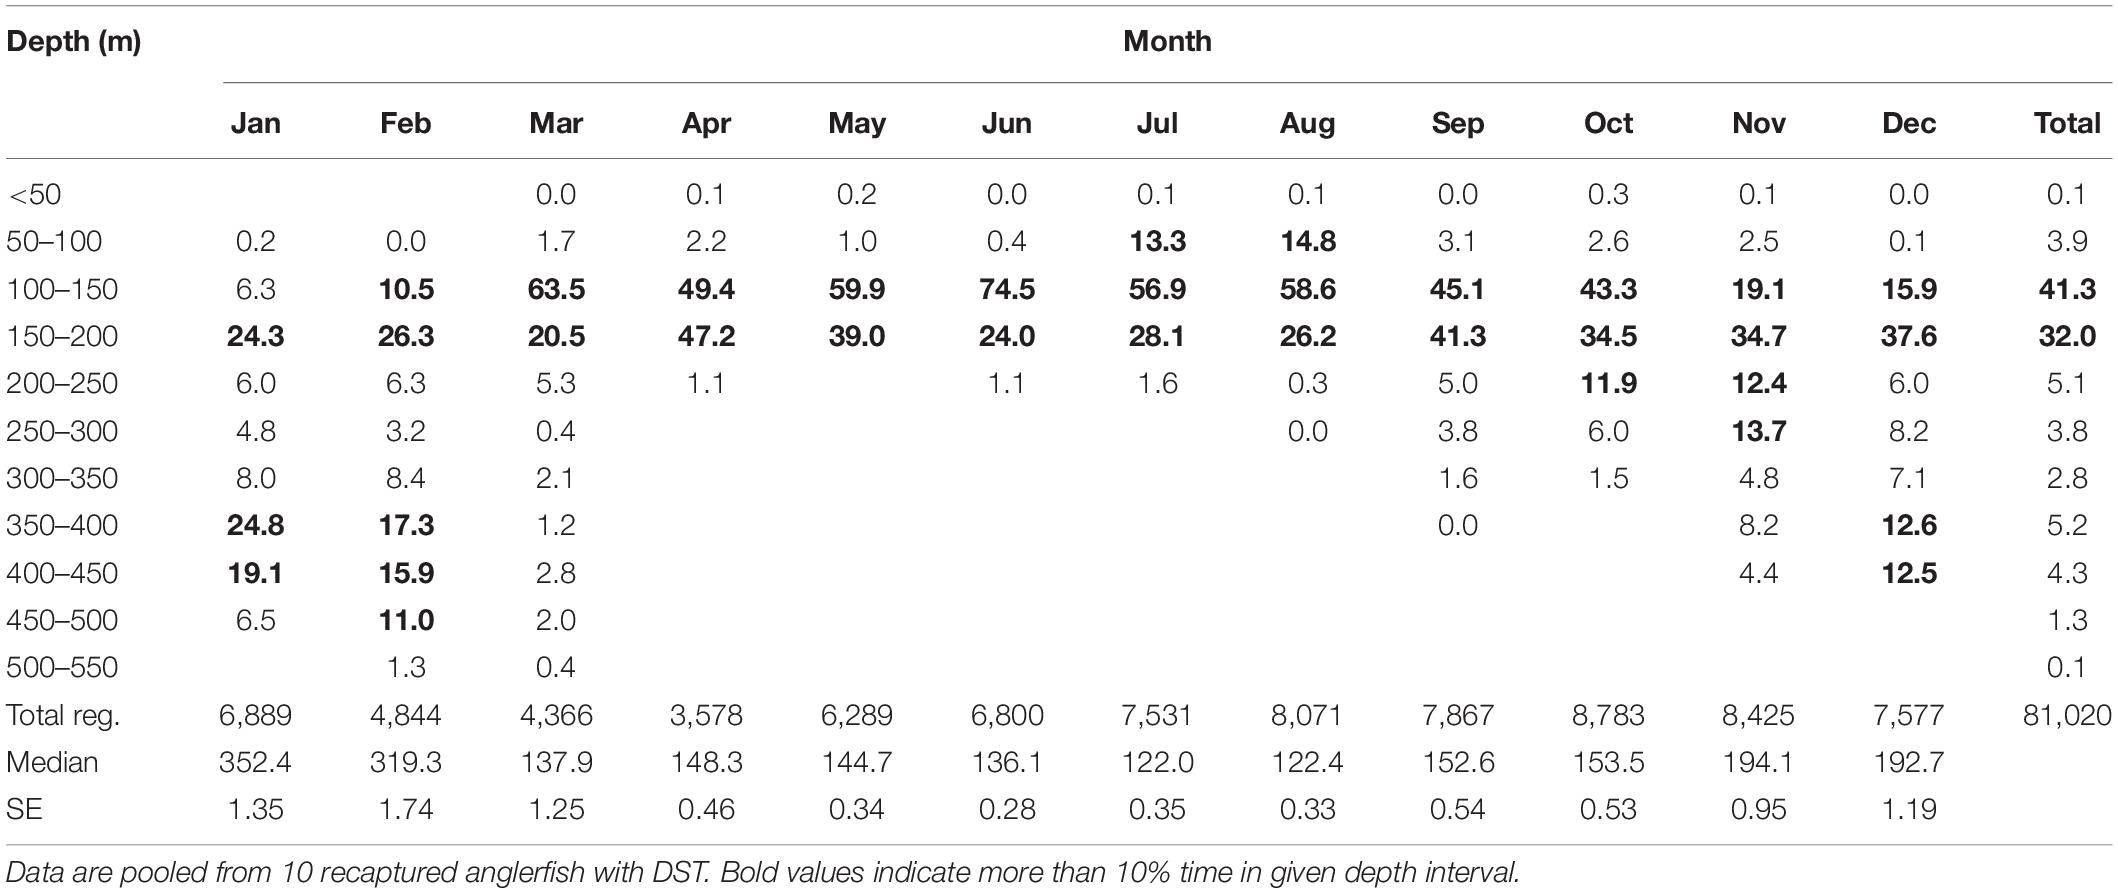
Table 3. Depth registrations once per hour as percentages of total registrations per months.
The DSTs ambient temperature readings showed that anglerfish mostly occupied water warmer than 7°C, regardless of the time of the year (Figure 9B and Table 4). During spring (February–March), the fish occupied waters of around 7°C, which is the typical bottom temperature at the slope of the Faroe Plateau during this season (Figures 4, 7). The deepest registration was 525 m. Although anglerfish rarely moved deeper than 450 m (Figure 9A), the DSTs occasionally recorded water temperatures much colder than 7°C, in extreme case below 2°C (Figure 9B and Supplementary Figures 2, 3). This coincided with vertical undulations of the main interface (Figure 7; Cisewski et al., 2021; Hátún et al., 2021), which can lift frigid overflow type waters up toward the areas inhabited by anglerfish, probably the spawning region of anglerfish – both at the west and north Faroe slope. This dynamics was exemplified by hourly shifts in temperature for single fishes by as much as >6°C (from 0.2 to 6.5°C) (Supplementary Figures 2, 3). This rapid temperature change (0.7–5.6°C) from one hour to the next was only registered in the deeper water during winter (November–February, Figure 9B). Anglerfish never occupied cold water masses below 4°C for longer periods than one day.
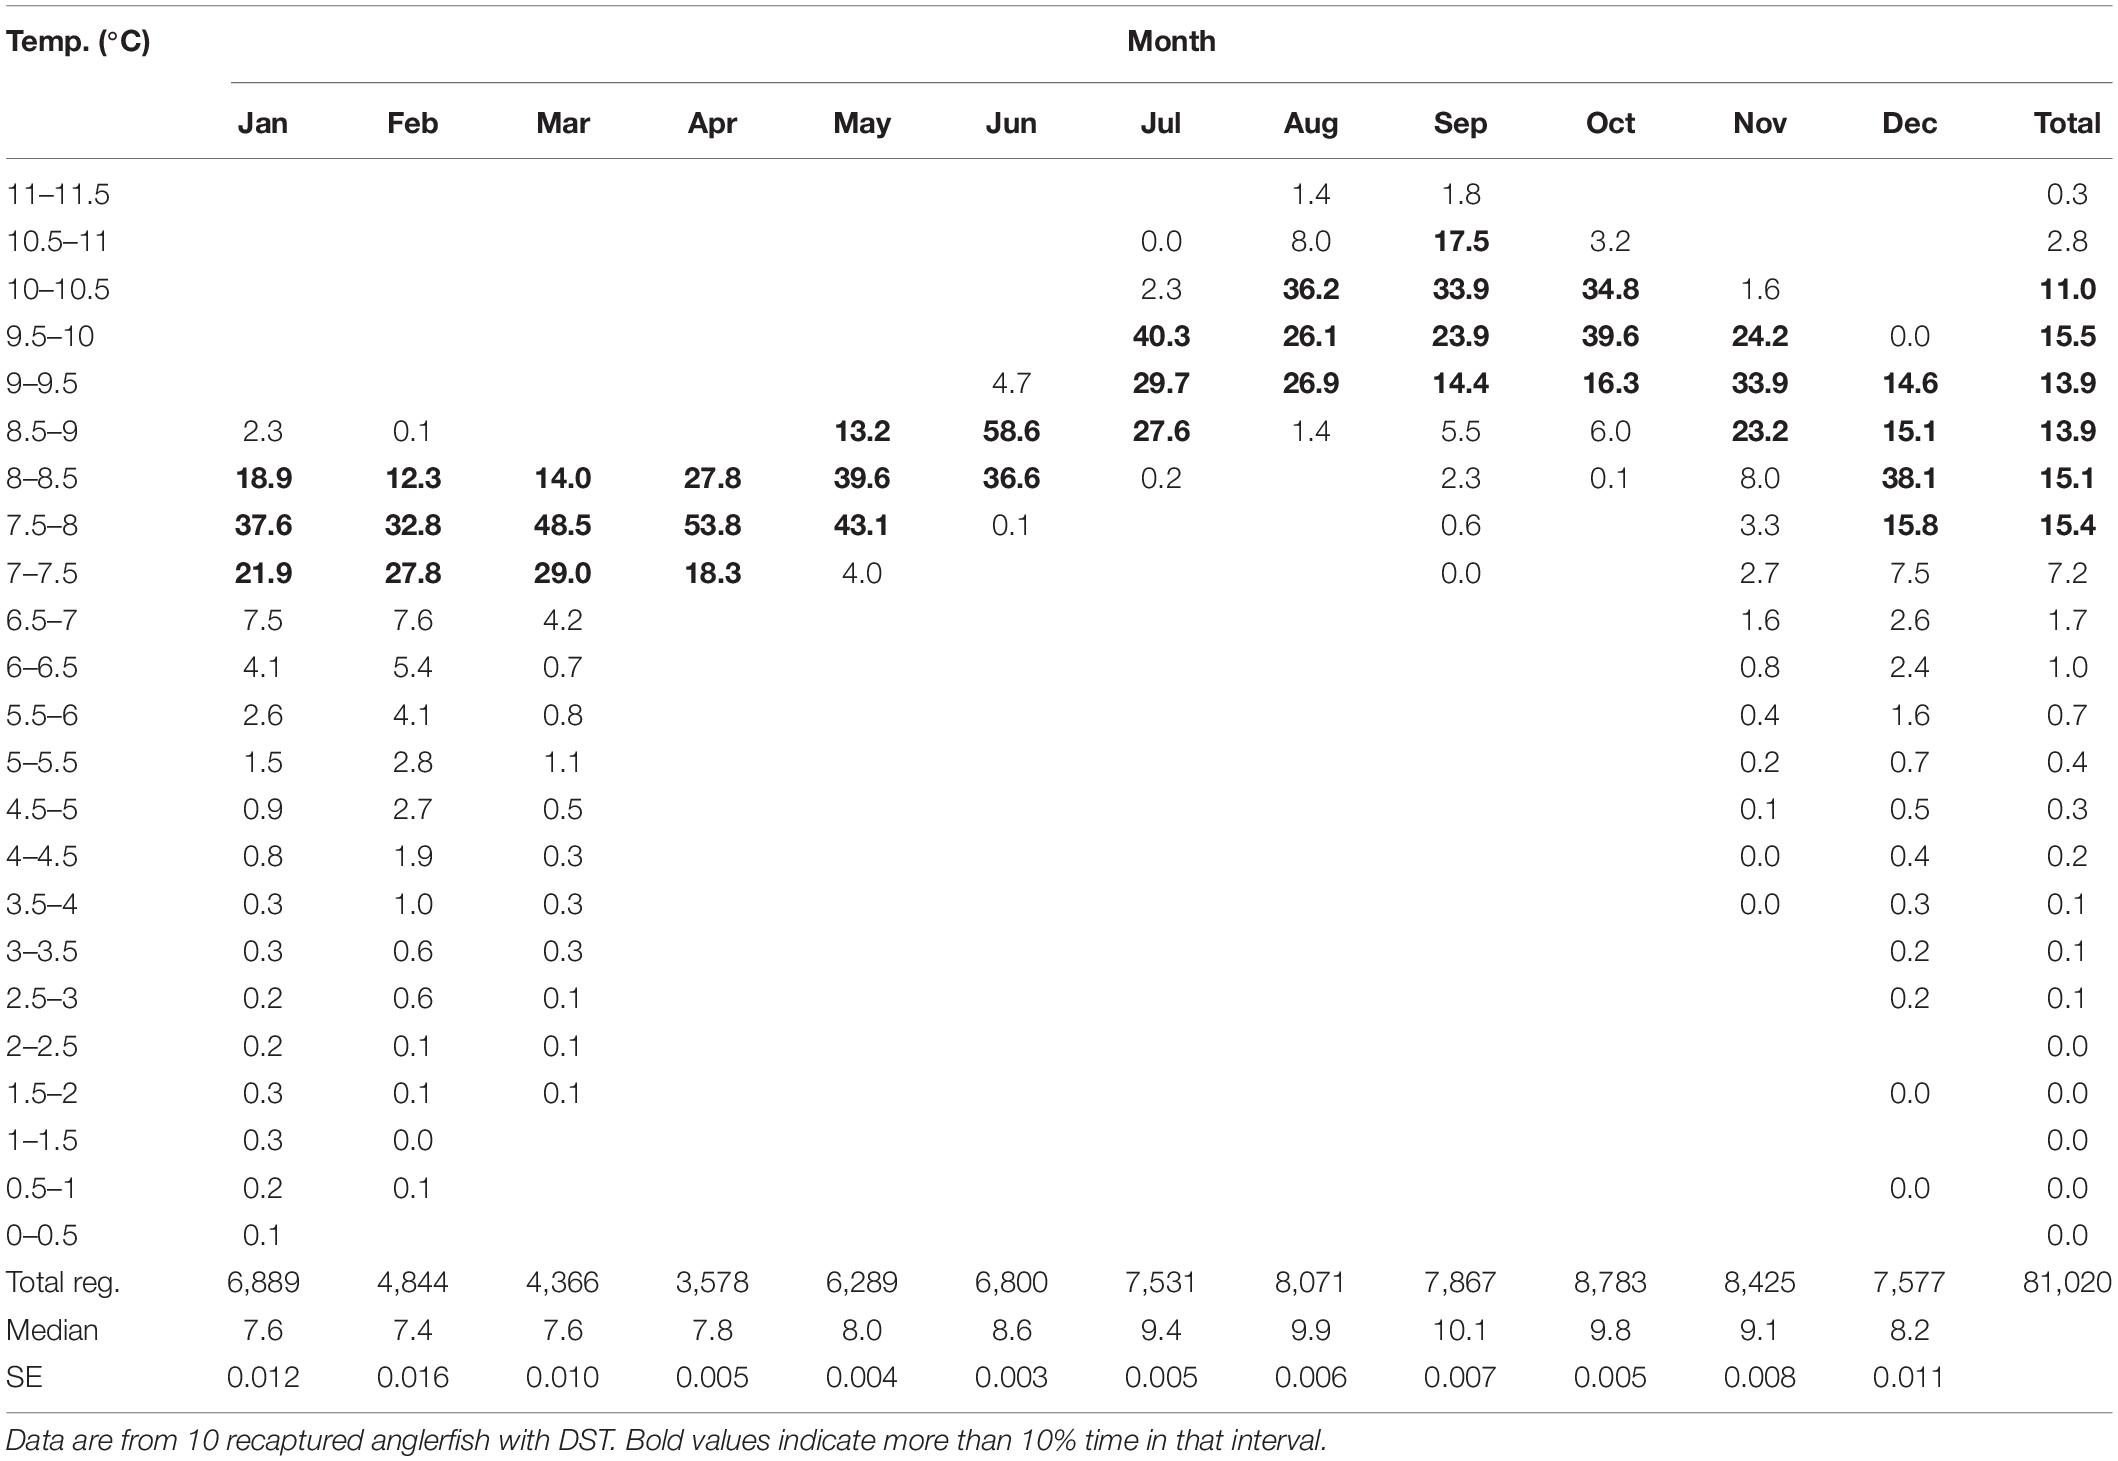
Table 4. Temperature registrations once per hour as percentages of total registrations per months.
During late summer, the fish were distributed in waters of 9–10.5°C (Table 4). This result complied with the average depth distribution of anglerfish, spatially (Figure 4B) and vertically (Figure 9A), and with the average bottom temperatures at these locations and during this season (Figures 7B, 9B).
Individual anglerfish apparently undertook pronounced vertical migrations as shown by the rapid changes in depth from >150 to 0–80 m (Figure 9A and Supplementary Figures 2, 3). Presumed vertical movement pattern, which was observed during all months of the year, almost always resulted in the occupation of a different bottom depth when settled to the bottom again (Supplementary Figures 2, 3).
Incidences of vertical activity for anglerfish in Faroese waters amounted to 5% of all depth registrations, and were more frequent during the late autumn and winter time than during the summer time (Figure 10A). There was also a close linkage between vertical activity and the timing of sunrise and sunset (Supplementary Table 1) as the fish were most active during the night and became passive soon after sunrise (Figure 10B). The linkage between the activity index and the timing of sunrise and sunset holds for all seasons (November–February, March–April, May–August and September–October), and there were therefore more hours of high vertical activity during the day in winter time than during the day in summer time (Figure 10B).
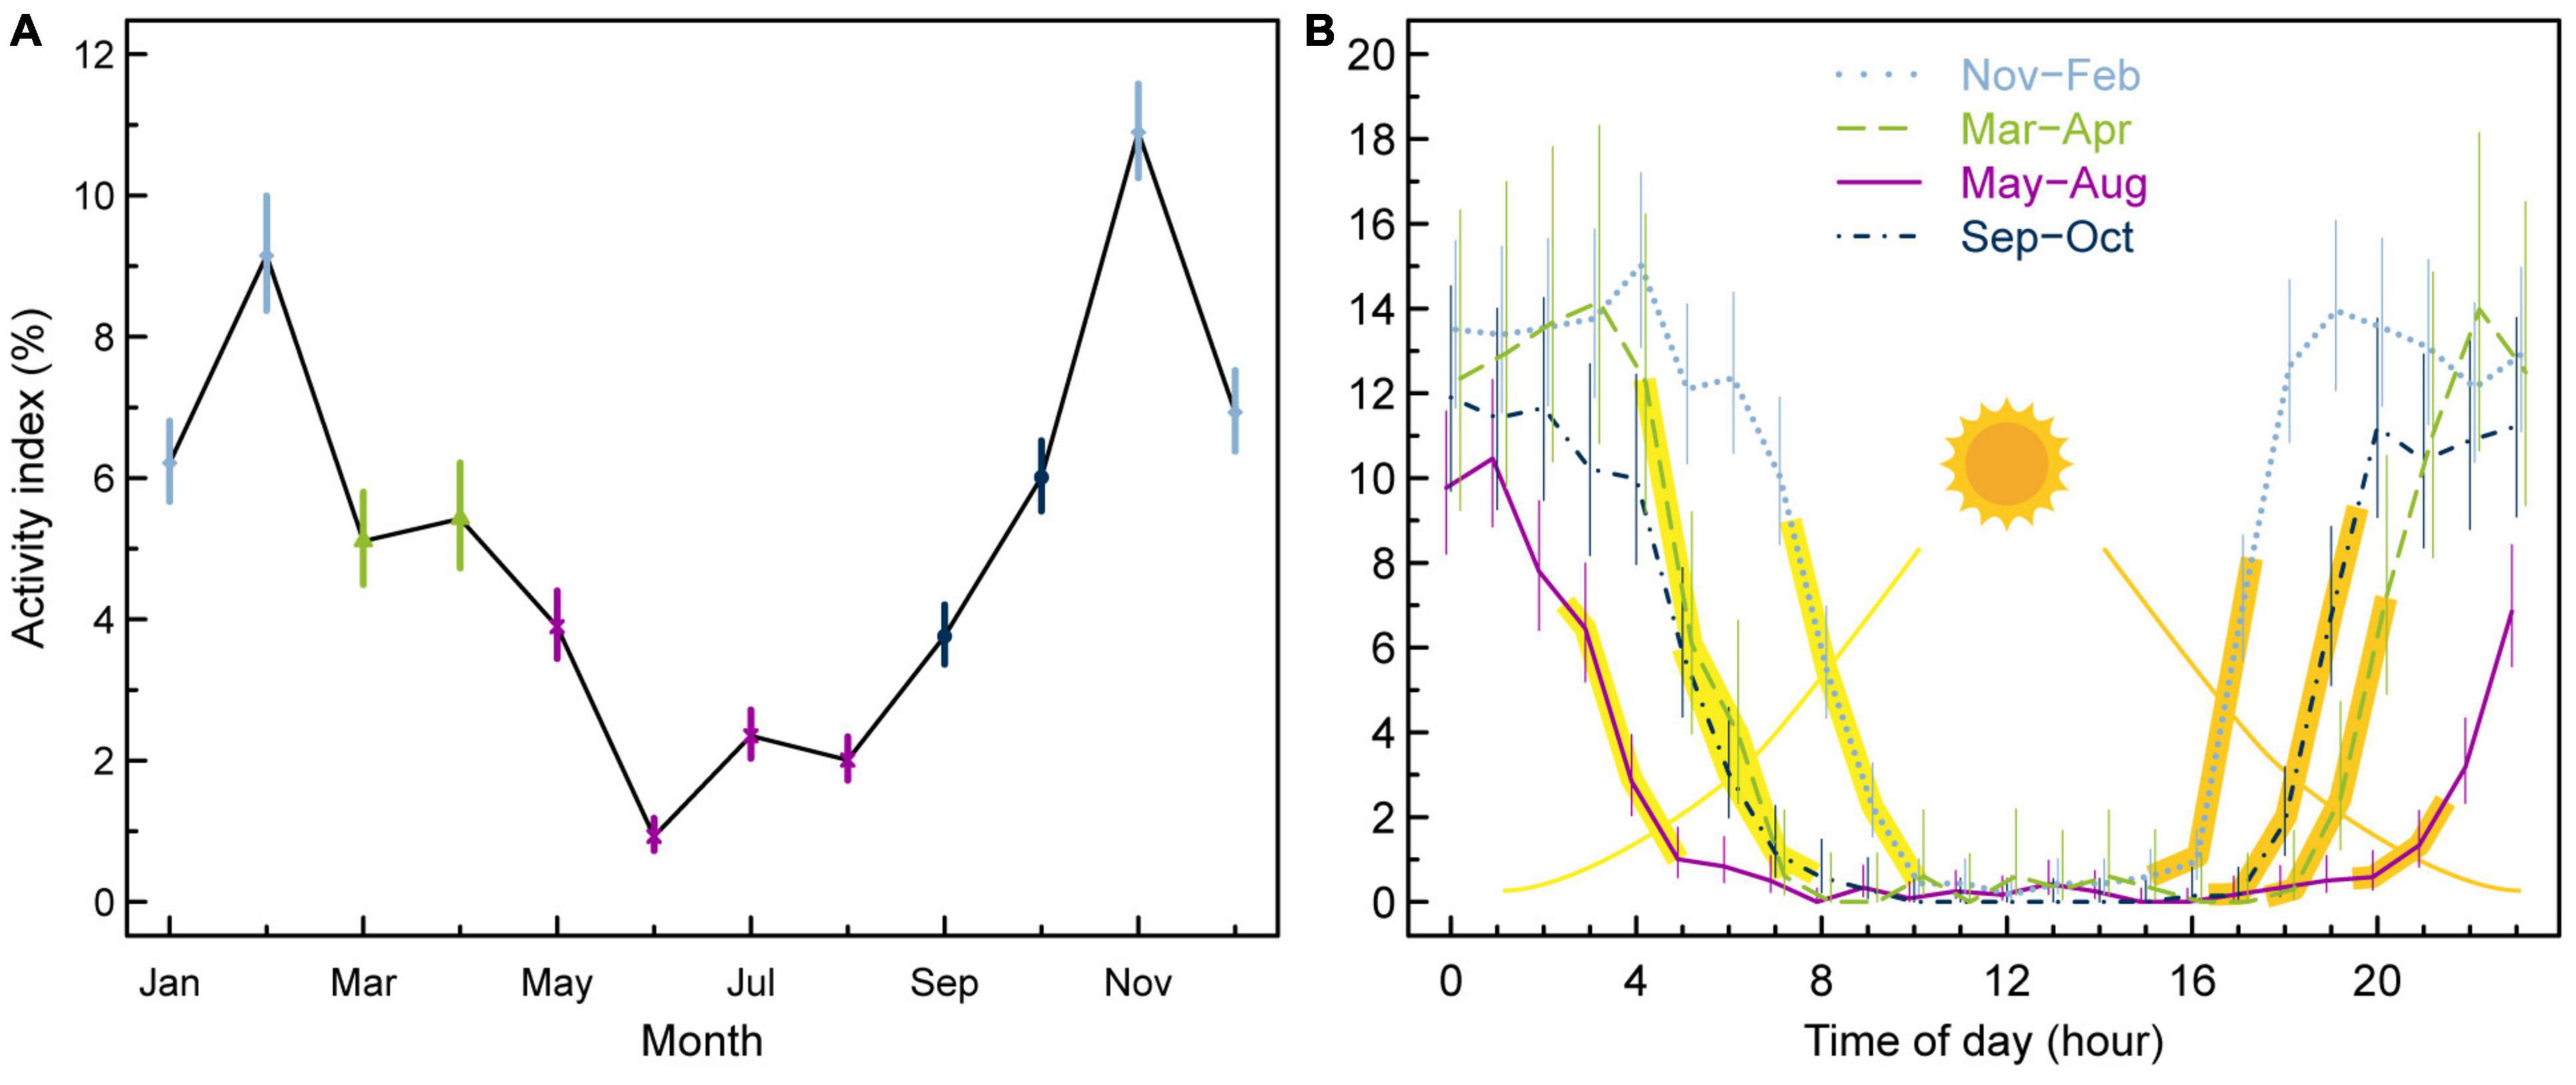
Figure 10. Activity index (%) per month (A) and per hour of the day (B) for four seasons from pooled DST data of 10 anglerfish larger than 70 cm. The yellow/orange areas indicate the ranges of sunrise/sunset for the different periods (Supplementary Table 1). The error bars indicate 95% confidence intervals.
Our study region on and around the Faroe Plateau and the Faroe Bank is located close to cold-side boundaries of the boreal biogeographic zone, both horizontally and laterally. The southwestern approach of the Atlantic water currents makes the western side of the Plateau warmer, while the eastern side is colder, and thus closer to the edge of the boreal zone. Immediately under the Atlantic waters, and north of the Iceland-Faroe Front, the environment is much colder and truly (Sub-) Arctic.
The boreal anglerfish in Faroese waters generally occupies Atlantic waters, and is therefore in favorable temperature conditions. Because of the sharp lateral and vertical temperature gradients between the Atlantic and subarctic waters, anglerfish may, however, approach their distribution limit during their seasonal migration to deeper layers. Small changes to the marine climate may therefore influence the dynamics of this fish stock.
The previously reported two-step weakening of the subpolar gyre around 1997 and 2003 (Hátún et al., 2005), and the following “borealization” of the northeastern Atlantic (Hátún et al., 2009b), did apparently result in increased abundances of anglerfish in Faroese waters (Figure 2). The fish tag data, used in the present study, were obtained from this warm period.
A clear seasonal offshore-onshore migration of anglerfish in Faroese waters is revealed by the DSTs data, and this pattern is further supported by the recaptures of conventionally tagged anglerfish, depth distribution of anglerfish caught in surveys and logbook data from commercial trawlers. The overall pattern showed that the fish congregated at “Skeivibanki” on the western side of the Faroe Plateau, and along the northwestern slope of the Faroe Bank during the winter/spring spawning period (Figures 3A, 4A). This pattern, and results in Tåning (1943); Ofstad and Laurenson (2007), and Ofstad et al. (2013), suggests that the two mentioned locations are spawning hotspots for anglerfish. Anglerfish migrate offshore from the Faroe shelf in November to February, which is the spawning season (Ofstad and Laurenson, 2007; Ofstad et al., 2013), and more than 80% of the anglerfish with high gonadosomatic indices or with maturity stage of ripe or running gonads were caught deeper than 200 m mainly in the “Skeivibanki” area and west of Faroe Bank in the period January to April (Ofstad et al., 2013).
The “Skeivibanki” region is located upstream of a main conduit of oceanic water onto the Faroe shelf (Figure 1), and this influx will therefore advect the offspring onto the Faroe Plateau. Ofstad et al. (2013) showed that the depth distribution of small anglerfish (<50 cm) was relatively stationary, and concluded from this evidence that the Faroe Plateau, shallower than around 300 m, is a nursery area.
After spawning in late winter/spring, adult anglerfish migrate shoreward and disperse over the Faroe Plateau, although with congregation in relatively shallow waters east of the islands (Figure 4B). The waters northwest of the Faroe Bank, and near “Skeivibanki” are, however, still occupied during summer. The shallower distribution in the summer (Figure 6), at depths between 100–200 m, indicates that, in addition to being a nursery area, the Faroe Plateau is probably also a main feeding area. Diet analyses indicated that the stomach fullness index in summer time was higher in shallow water (<200 m) compared to deep waters (>200 m) (Ofstad, 2013). Also, many potential prey species, such as cod (Gadus morhua), haddock (Melanogrammus aeglefinus), blue whiting (Micromesistius poutassou), Norway pout (Trisopterus esmarkii) and lemon sole (Microstomus kitt), were available in relative high abundance at these depths in summer (Steingrund et al., 2009).
Tagging data demonstrate that anglerfish migrated more than 30 km from the feeding areas to their spawning site during the winter season and arrived “home” again to their feeding area, close to the tagging site, the following summer (see example in Supplementary Figure 3). During summer, however, anglerfish were fairly stationary. We therefore hypothesize that anglerfish undertake homing migrations, similar to the behavior of cod in Faroese waters (Joensen et al., 2005). Faroese anglerfish were very rarely recaptured in foreign waters which is in accordance with previous mark-recapture studies showing low mixing between regions (Laurenson et al., 2005; Thangstad et al., 2006). The seasonal movement pattern of anglerfish in Faroese waters thus seems to fit nicely into the concept of the fish migration triangle (Harden-Jones, 1968) with the nursery area located on the Faroe Plateau, and where adult fish migrate off the Faroe Plateau during the winter to deeper spawning areas, especially in the “Skeivibanki” area and back onto the Faroe Plateau for feeding in summer.
Seasonal migration was also shown for anglerfish in Shetland waters from conventional tagging, where recaptured fish had moved offshore in November to April (Laurenson et al., 2005). This suggested that anglerfish dispersed from inshore grounds in autumn, and Shetland fishermen informed that the areas toward the shelf edge were targeted in the winter period due to high catch rates (Laurenson et al., 2005). Such migration was also shown for L. americanus on Georges Bank (Siemann et al., 2018). Similar seasonal shifts in distribution have been observed for other fish species on the Faroe Plateau, including cod (Tåning, 1940; Ottosen et al., 2017), saithe (Pollachius virens) (Homrum, 2012) and plaice (Pleuronectes platessa) (Tåning, 1943).
The DSTs show that anglerfish migrate into deeper waters after November, and generally occupy depths of 350–400 m, during winter (Figure 9A). This was close to the average position of the main interface between warm Atlantic water and the cold underlying Arctic water (Figure 7).
The boreal anglerfish clearly has an affinity for warmer waters, and were seldom caught in waters with temperatures below 4°C, which is the same lower limit as reported for Icelandic waters (Solmundsson et al., 2010) and Norwegian waters (Anonymous, 2012). However, tags on fish that resided stationary at around 400 m depths recorded rapid temperature drops to below 2°C (Figure 9 and Supplementary Figures 2, 3), which demonstrates that anglerfish positioned themselves in, or near, the zone where internal bores carry cold waters upslope. This behavior was, however, only evident during the November–March period. Anglerfish are apparently attracted toward this interface during the spawning period. The reason for this behavior is, however, not known, but there may be several possibilities.
Anglerfish spawn their eggs in long (up to 10 m) gelationous and buoyant ribbons, supposedly in a single batch (Bowman, 1920; Afonso-Dias and Hislop, 1996; Fariña et al., 2008). The bowl-shaped deep just north of “Skeivibanki” creates a retention system, which could provide ideal conditions for fish to congregate and ensure successful fertilization. The main inflow of zooplankton rich oceanic waters takes place in the near-surface layers between “Skeivibanki” and the inner Faroe shelf (Rasmussen et al., 2014; Eliasen et al., 2017a; Jacobsen et al., 2018) and this could be optimal for larval feeding and survival. The fact that spawning anglerfish encounter the interface could be caused by their preference for the mentioned deep, where also internal bores likely carry cold water upslope. In this way, the attraction toward the interface might just be a coincident.
Active search for the specific density layers in the interface could be to the assure neutral buoyancy, which can keep the eggs away from either the bottom or the water surface, where the predation pressure likely is high. It could also be a search for optimal temperatures and/or oxygen conditions for the gelatinous egg ribbons, found in the strong clines associated with the interface. Since the anglerfish are resident in the spawning area for an extended period, they probably also need to feed, therefore the large biomasses congregating along the interface (Cisewski et al., 2021) could be an attraction mechanism. The main interface is located deeper at lower latitudes (Hátún et al., 2021), which coincide with that spawning occurs in deeper waters for anglerfish south of the Faroes (Hislop et al., 2001). This could be a sign that anglerfish generally are attracted to the border of the main interface where oceanographic gradients provide the best long term/overall spawning success.
Anglerfish in the pelagic zone have previously been observed and H. C. Müller wrote about observations of anglerfish in the surface already 150 years ago (Joensen, 1965). Tuna-longliners and blue whiting trawl surveys in April over deep waters as well as pelagic 0-group survey on the Faroe Plateau in June/July have all reported pelagic anglerfish catches (Faroe Marine Research Institute, Unpublished data). Despite vertical movements, anglerfish were inactive 95% of the time, so it is evidently a demersal species. There are several hypotheses for the vertical movement behavior of anglerfish, such as individuals undertaking short horizontal shifts (Hislop et al., 2000), spawning/feeding migration using tidal currents (Laurenson et al., 2005), pelagic feeding excursions and prolonged stay either for spawning or feeding (Solmundsson et al., 2010). Perhaps some of the vertical activity in deep water during winter could be spawning “rises” as seen for Atlantic halibut (Hippoglossus hippoglossus) (Armsworthy et al., 2014).
We have shown that the vertical activity of anglerfish is closely linked to the sun angle, and therefore light intensity (Figure 10B). The fish rest shortly after sunrise, and move vertically soon after sunset. This diurnal vertical variability is also evident for fish residing at depth of several hundred meters, where ambient day-night contrast is very small. We therefore find it unlikely that light intensity directly triggers vertical motion of anglerfish. The sun angle, on the other hand, closely controls Dial Vertical Migration of a large biomass of mesopelagic and pelagic species in Faroese waters (Cisewski et al., 2021), which, in turn, could trigger motion of the predatory anglerfish. The movement of biota toward the seafloor during the day hours likely motivates anglerfish to start feeding, and thus to reside motionless on the seafloor while attracting prey fish with their fishing rod. Higher vertical activity during night was also shown from pop-up satellite tags in Icelandic waters (V. Sigurðsson, Personal Communications) and for a single DST tagged individual of L. americanus in the northwest Atlantic (Rountree et al., 2008).
Vertical activity was also higher during winter compared to summer, which partly can be explained by the evident diurnal cycle, with more activity in the dark hours during winter. The seasonal cycle is probably also linked to the pronounced seasonal offshore-onshore migration during the year. Anglerfish are slow swimmers and likely perform selective tidal migrations between spawning and feeding areas (Laurenson et al., 2005), as has also been documented for Atlantic cod (Righton et al., 2007). This means moving up from the seafloor when currents are in the desired direction, and staying at the bottom, when currents are opposing. The apparent attraction toward the main interface during winter could also introduce vertical motion, since this interface undulates on tidal to monthly time scales (Cisewski et al., 2021).
Vertical migration of anglerfish has been documented also in other areas in the northeast Atlantic, both from DSTs (Thangstad et al., 2006) and from pelagic catches of anglerfish (Hislop et al., 2000; Laurenson et al., 2005; Thangstad et al., 2006; Solmundsson et al., 2010) and from pop-up satellite tags in Icelandic waters (V. Sigurðsson, Personal Communications) and vertical migration was also observed for cod on the Faroe Plateau (Ottosen et al., 2017).
There are various possibilities for the findings in this paper that could be investigated in the future, e.g., further analysis of the DST results of the 10 anglerfish to seek more details in the anglerfish behavior and migratory path. Mark-recapture experiments with both conventional tags and DSTs could be repeated, preferably in other places on the Faroe Plateau and on the Faroe Bank, to investigate for additional spawning areas. A potential northward shift in the distribution of anglerfish in the Northeast Atlantic, in response to climate change and increasing temperatures, could be investigated with the aim to reveal effects on prey fish populations.
The main findings in this study documented that anglerfish in Faroese waters performed seasonal offshore-onshore migrations, staying in shallow waters (<200 m) during the summer and in deep waters (>250 m) during winter. Also, that anglerfish were mostly located in boreal water with a temperature range of 6–11°C and rarely colder than 4°C. Anglerfish appeared mainly inactive, but for 5% of the time they displayed vertical movements, and they were most vertically active during winter on the seasonal scale and during night on a daily scale. This is the first time a clear seasonal offshore-onshore migration is demonstrated in Faroese waters from DSTs. Here is also provided the first documentation of a seasonal and daily pattern in vertical activity of anglerfish, and both aspects provide new valuable insights into the movement and migration pattern of anglerfish in Faroese waters.
The raw data supporting the conclusions of this article will be made available by the authors, without undue reservation.
Ethical review and approval was not required for the animal study because the samples were taken from scientific research trips and from commercial catches, which do not fall under the national or EU legislation regarding animal welfare.
LO, HH, TP, and PS developed the main idea. LO compiled and analyzed the anglerfish data. HH contributed with information on the oceanography. LO and HH wrote the manuscript, with feedback from TP, PS, and BM. All authors approved the submitted version.
This research was funded by the Faroe Marine Research Institute, Faroese Research Council, and Faroese Fisheries Research Fund.
The authors declare that the research was conducted in the absence of any commercial or financial relationships that could be construed as a potential conflict of interest.
All claims expressed in this article are solely those of the authors and do not necessarily represent those of their affiliated organizations, or those of the publisher, the editors and the reviewers. Any product that may be evaluated in this article, or claim that may be made by its manufacturer, is not guaranteed or endorsed by the publisher.
Thanks to the late Rógvi Mouritsen and Kristian Zachariassen for help with the anglerfish tagging, the skipper Kristin Wilhelmsen and the crew onboard gillnetter “Gudrun” for help during the tagging trips and the crew onboard the research vessel “Magnus Heinason” for help during anglerfish surveys and tagging trips, Chevonne Angus for discussions of the DST placement, Eydna í Homrum for comments on earlier drafts and the two reviewers for comments. We also thank all the fishermen that have delivered tagged anglerfish and staff at the Faroe Marine Research Institute for their help.
The Supplementary Material for this article can be found online at: https://www.frontiersin.org/articles/10.3389/fmars.2022.823066/full#supplementary-material
Supplementary Figure 1 | Illustration of how the red Floy t-tag and the data storage tag were attached dorsally on an anglerfish. This fish was recaptured after 12 days at sea. The data storage tag was inserted surgically under the anglerfish skin with a yellow plastic tube as a marker outside and the red Floy-tag was fastened by a tagging gun.
Supplementary Figure 2 | (A) Illustration of results from data-storage tag 10672. Tagged 7. May 2010, 81 cm length. Recaptured north of “Skeivibanki” 15. January 2012 (Figure 8A), 97 cm in length. 618 days of liberty. (B) Extraction of incidences of internal bores which carry cold water upslope.
Supplementary Figure 3 | (A) Illustration of results from data-storage tag 10658. Anglerfish, 72 cm, tagged 25/7-2009, north of the Faroe Islands and recaptured 17/2-2011 not far from tagging site (Figure 8A), 83 cm in length. 571 days at liberty. (B) Extraction of incidences of vertical movements in shallow waters and likely incidences of internal bores in deep waters which carry cold water upslope.
Afonso-Dias, I. P., and Hislop, J. R. G. (1996). The reproduction of anglerfish Lophius piscatorius Linnaeus from the north-west coast of Scotland. J. Fish Biol. 49, 18–39.
Armannsson, H., and Jonsson, S. T. (2012). Vertical migrations of saithe (Pollachius virens) in Icelandic waters as observed with data storage tags. ICES J. Mar. Sci. 69, 1372–1381.
Armannsson, H., Jonsson, S. T., Neilson, J. D., and Marteinsdottir, G. (2007). Distribution and migration of saithe (Pollachius virens) around Iceland inferred from mark-recapture studies. ICES J. Mar. Sci. 64, 1006–1016.
Armsworthy, S. L., Trzcinski, M. K., and Campana, S. E. (2014). Movements, environmental associations, and presumed spawning locations of Atlantic halibut (Hippoglossus hippoglossus) in the northwest Atlantic determined using archival satellite pop-up tags. Mar. Biol. 161, 645–656. doi: 10.1007/s00227-013-2367-5
Beaird, N. L., Rhines, P. B., and Eriksen, C. C. (2016). Observations of seasonal subduction at the Iceland-Faroe Front. J. Geophys. Res. Ocean 121, 4026–4040. doi: 10.1002/2015JC011501
Berx, B., Hansen, B., Østerhus, S., Larsen, K. M., Sherwin, T. J., and Jochumsen, K. (2013). Combining in situ measurements and altimetry to estimate volume, heat and salt transport variability through the Faroe-Shetland Channel. Ocean Sci. 9, 639–654. doi: 10.5194/os-9-639-2013
Bjelland, O., and Asplin, L. (2007). Are Norwegian Fjords Important Spawning Areas for Anglerfish (Lophius piscatorius)? Copenhagen: ICES.
Bohme, L., and Send, U. (2005). Objective analyses of hydrographic data for referencing profiling float salinities in highly variable environments. Deep. Res. II Top. Stud. Oceanogr. 52, 651–664.
Bowman, A. (1920). The eggs and larvae of the angler Lophius piscatorius L. in Scottich waters. Rep. Fish. Board Scotland 11, 1–55.
Caruso, J. H. (1983). The systematics and distribution of the lophiid anglerfishes. 2. Revisions of the genera Lophiomus and Lophius. Copeia 1983, 11–30.
Cisewski, B., Hátún, H., Kristiansen, I., Hansen, B., Larsen, K. M. H., Eliasen, S. K., et al. (2021). Vertical migration of pelagic and mesopelagic scatterers from ADCP backscatter data in the Southern Norwegian Sea. Front. Mar. Sci. 7:542386. doi: 10.3389/fmars.2020.542386
Eliasen, S. K., Hansen, B., Larsen, K. M. H., and Hátún, H. (2016). The exchange of water between the Faroe Shelf and the surrounding waters and its effect on the primary production. J. Mar. Syst. 153, 1–9. doi: 10.1016/j.jmarsys.2015.08.004
Eliasen, S. K., Hátún, H., Larsen, K. M. H., and Jacobsen, S. (2017a). Faroe shelf bloom phenology – The importance of ocean-to-shelf silicate fluxes. Cont. Shelf Res. 143, 43–53. doi: 10.1016/j.csr.2017.06.004
Eliasen, S. K., Larsen, K. M. H., Hansen, B., and Rasmussen, T. A. S. (2017b). Phenologically distinct phytoplankton regions on the Faroe Shelf - identified by satellite data, in-situ observations and model. J. Mar. Syst. 169, 99–110. doi: 10.1016/j.jmarsys.2017.01.015
Fariña, A. C., Azevedo, M., Landa, J., Duarte, R., Sampedro, P., Costas, G., et al. (2008). Lophius in the world: a synthesis on the common features and life strategies. ICES J. Mar. Sci. 65, 1272–1280.
Gaard, E., and Steingrund, P. (2001). Reproduction of Faroe plateau cod: spawning grounds, egg advection and larval feeding. Fróðskaparrit 48, 87–103. doi: 10.1002/9781119460701.ch3
Hansen, B., and Østerhus, S. (2000). North Atlantic-Nordic Seas exchanges. Prog. Oceanogr. 45, 119–208.
Hátún, H., and Chafik, L. (2018). On the recent ambiguity of the North Atlantic subpolar gyre index. J. Geophys. Res. Oceans 123, 5072–5076.
Hátún, H., Chafik, L., and Larsen, K. M. H. (2021). The Norwegian Sea gyre – a regulator of Iceland-Scotland ridge exchanges. Front. Mar. Sci. 8:694614. doi: 10.3389/fmars.2021.694614
Hátún, H., Payne, M. R., and Jacobsen, J. A. (2009a). The North Atlantic subpolar gyre regulates the spawning distribution of blue whiting (Micromesistius poutassou). Can. J. Fish. Aquat. Sci. 66, 759–770. doi: 10.1139/f09-037
Hátún, H., Payne, M. R., Beaugrand, G., Reid, P. C., Sandø, A. B., Drange, H., et al. (2009b). Large bio-geographical shifts in the north-eastern Atlantic Ocean: from the subpolar gyre, via plankton, to blue whiting and pilot whales. Prog. Oceanogr. 80, 149–162. doi: 10.1016/j.pocean.2009.03.001
Hátún, H., Sandø, A. B., Drange, H., Hansen, B., and Valdimarsson, H. (2005). Influence of the Atlantic subpolar gyre on the thermohaline circulation. Science 309, 1841–1843. doi: 10.1126/science.1114777
Hislop, J. R. G., Gallego, A., Heath, M. R., Kennedy, F. M., Reeves, S. A., and Wright, P. J. (2001). A synthesis of the early life history of the anglerfish, Lophius piscatorius (Linnaeus, 1758) in northern British waters. ICES J. Mar. Sci. 58, 70–86. doi: 10.1006/jmsc.2000.0991
Hislop, J. R. G., Holst, J. C., and Skagen, D. (2000). Near-surface captures of post-juvenile anglerfish in the North-east Atlantic – an unsolved mystery. J. Fish Biol. 57, 1083–1087. doi: 10.1006/jfbi.2000.1364
Homrum, E. í. (2012). The Effects of Climate and Ocean Currents on Faroe Saithe. Ph.D. thesis. Tórshavn: Fróðskaparsetur Føroya.
ICES (2018). Report of the Benchmark Workshop on Anglerfish Stocks in the ICES Area (WKANGLER), 12–16 February 2018, Copenhagen, Denmark. Copenhagen: ICES, 177.
Jacobsen, S., Gaard, E., Larsen, K. M. H., Eliasen, S. K., and Hátún, H. (2018). Temporal and spatial variability of zooplankton on the Faroe shelf in spring 1997–2016. J. Mar. Syst. 177, 28–38. doi: 10.1016/j.jmarsys.2017.08.004
Joensen, J. S., Steingrund, P., Henriksen, A., and Mouritsen, R. (2005). Migration of cod (Gadus morhua): tagging experiments at the Faroes 1952–1965. Fróðskaparrit 53, 100–135.
Landa, J., Duarte, R., Fariña, A. C., Bruno, I., and Castro, J. (2001). Mark-Recapture Studies of Black Anglerfish (Lophius budegassa) in the North-Eastern Atlantic: Preliminary Results. Copenhagen: ICES.
Larsen, K. M. H., Hansen, B., and Svendsen, H. (2008). Faroe Shelf Water. Cont. Shelf Res. 28, 1754–1768.
Laurenson, C. H., Hudson, I. R., Jones, D. O. B., and Priede, I. G. (2004). Deep water observations of anglerfish (Lophius piscatorius L.) in the north-eastern Atlantic Ocean by means of remotely operated vehicle. J. Fish Biol. 65, 947–960.
Laurenson, C. H., Johnson, A., and Priede, I. G. (2005). Movements and growth of monkfish Lophius piscatorius tagged at the Shetland Islands, Northeastern Atlantic. Fish. Res. 71, 185–195. doi: 10.1016/j.fishres.2004.08.020
Laurenson, C. H., Priede, I. G., Bullough, L. W., and Napier, I. R. (2001). Where are the Mature Anglerfish? The population biology of Lophius piscatorius in Northern European Waters. Copenhagen: ICES, 15.
Ofstad, L. H. (2013). Anglerfish Lophius piscatorius L. in Faroese Waters. Life History, Ecological Importance and Stock Status. Ph.D. thesis. Tromsø: University of Tromsø, 108.
Ofstad, L. H., and Laurenson, C. H. (2007). Biology of Anglerfish Lophius piscatorius in Faroese Waters. Copenhagen: ICES, 16.
Ofstad, L. H., Pedersen, T., and Steingrund, P. (2013). Maturation, reproduction and early life history of anglerfish Lophius piscatorius in Faroese waters. Fróskaparrit 60, 114–133.
Ottosen, K. M., Pedersen, M. W., Eliasen, S. K., Setingrund, P., Magnussen, E., and Rasmussen, T. A. S. (2017). Migration patterns of the Faroe Plateau cod (Gadus morhua, L.) revealed by data storage tags. Fish. Res. 195, 37–45. doi: 10.1016/j.fishres.2017.06.014
Perry, M. C., Olsen, G. H., Richards, R. A., and Osenton, P. C. (2013). Predation on dovekies by goosefish over deep water in the Northwest Atlantic Ocean. Northeast. Nat. 20, 148-154.
Perry, R. I., and Smith, S. J. (1994). Identifying habitat associations of marine fishes using survey data: an application to the Northwest Atlantic. Can. J. Fish. Aquat. Sci. 51, 589–602. doi: 10.1139/f94-061
Pörtner, H. O., and Farrell, A. P. (2008). Physiology and climate change. Science 322, 690–692. doi: 10.1016/j.virol.2017.08.015
R Core Team (2014). R: A Language and Environment for Statistical Computing. Vienna: R Foundation for Statistical Computing.
Rasmussen, T. A. S., Olsen, S. M., Hansen, B., Hátún, H., and Larsen, K. M. H. (2014). The Faroe shelf circulation and its potential impact on the primary production. Cont. Shelf Res. 88, 171–184. doi: 10.1016/j.csr.2014.07.014
Reda, I., and Andreas, A. (2004). Solar position algorithm for solar radiation applications. Sol. Energy 76, 577–589. doi: 10.1016/j.solener.2003.12.003
Reinert, J. (1995). “Deep water resources in Faroese waters to the south, southwest and west of the Faroes - a preliminary account,” in Deep-Water Fisheries of the North Atlantic Oceanic Slope’, ed. A. G. Hopper (Dordrecht: Kluwer Academic Publisher), 201–225. doi: 10.1007/978-94-015-8414-2_6
Richards, A., Moser, J., Dunnigan, B., and Alade, L. A. (2011). Archival tagging methods for monkfish. Trans. Am. Fish. Soc. 140, 582–586. doi: 10.1080/00028487.2011.584802
Richards, R. A., Nitschke, P. C., and Sosebee, K. A. (2008). Population biology of monkfish Lophiusamericanus. ICES J. Mar. Sci. 65, 1291–1305. doi: 10.1093/icesjms/fsn108
Righton, D., Quayle, V. A., Hetherington, S., and Burt, G. (2007). Movements and distribution of cod (Gadus morhua) in the southern North Sea and English Channel: results from conventional and electronic tagging experiments. J. Mar. Biol. Assoc. U. K. 87, 599–613. doi: 10.1017/s0025315407054641
Rountree, R. A., Gröger, J. P., and Martins, D. (2008). Large vertical movements by a goosefish, Lophius americanus, suggests the potential of data storage tags for behavioral studies of benthic fishes. Mar. Freshw. Behav. Physiol. 41, 73–78. doi: 10.1080/10236240801934065
Siemann, L. A., Huntsberger, C. J., Leavitt, J. S., and Smolowitz, R. J. (2018). Summering on the bank: seasonal distribution and abundance of monkfish on George Bank. PLoS One 13:e0206829. doi: 10.1371/journal.pone.0206829
Solmundsson, J., Jonsson, E., and Bjornsson, H. (2010). Phase transition in recruitment and distribution of monkfish (Lophius piscatorius) in Icelandic waters. Mar. Biol. 157, 295–305. doi: 10.1007/s00227-009-1317-8
Solmundsson, J., Palsson, J., and Karlsson, H. (2005). Fidelity of mature Icelandic plaice (Pleuronectes platessa) to spawning and feeding grounds. ICES J. Mar. Sci. 62, 189–200. doi: 10.1016/j.icesjms.2004.11.012
Steimle, F. W., Morse, W. W., and Johnson, D. L. (1999). Goosefish, Lophius americanus, Life History and Habitat Characteristics. Washington: NOAA, 31.
Steingrund, P., Clementsen, D., and Mouritsen, R. (2009). Higher food abundance reduces the catchability of cod (Gadus morhua) to longlines on the Faroe Plateau. Fish. Res. 100, 230–239. doi: 10.1016/j.fishres.2009.08.002
Tåning, Å. V. (1940). Migration of cod marked on the spawning places off the Faroes. Meddr. Komm. Danmarks Fisk.-og Havunders. Ser. Fiskeri 10.
Tåning, Å. V. (1943). Lophius. In Report on the Danish Oceanographical Expeditions 1908–1910 to the Mediterranean and Adjacent Seas. Biology. II:30.
Thangstad, T., Bjelland, O., Nederaas, K. H., Jónsson, E., Laurenson, C. H., and Ofstad, L. H. (2006). Anglerfish (Lophius spp.) in Nordic Waters. TemaNord 2006:570.
Keywords: anglerfish, data storage tag, hydrography, Faroe Islands, Lophius piscatorius, mark-recapture, migration
Citation: Ofstad LH, Hátún H, Pedersen T, Steingrund P and Mikkelsen B (2022) Horizontal and Vertical Migration of Anglerfish Lophius piscatorius in Relation to Hydrography in Faroese Waters. Front. Mar. Sci. 9:823066. doi: 10.3389/fmars.2022.823066
Received: 26 November 2021; Accepted: 24 January 2022;
Published: 04 March 2022.
Edited by:
Stefano Aliani, Consiglio Nazionale delle Ricerche (CNR), ItalyReviewed by:
Steven Campana, University of Iceland, IcelandCopyright © 2022 Ofstad, Hátún, Pedersen, Steingrund and Mikkelsen. This is an open-access article distributed under the terms of the Creative Commons Attribution License (CC BY). The use, distribution or reproduction in other forums is permitted, provided the original author(s) and the copyright owner(s) are credited and that the original publication in this journal is cited, in accordance with accepted academic practice. No use, distribution or reproduction is permitted which does not comply with these terms.
*Correspondence: Lise Helen Ofstad, bGlzZW9AaGF2LmZv
Disclaimer: All claims expressed in this article are solely those of the authors and do not necessarily represent those of their affiliated organizations, or those of the publisher, the editors and the reviewers. Any product that may be evaluated in this article or claim that may be made by its manufacturer is not guaranteed or endorsed by the publisher.
Research integrity at Frontiers
Learn more about the work of our research integrity team to safeguard the quality of each article we publish.