 Robert A. Ronconi1,2*David J. Lieske3Laura A. McFarlane Tranquilla2Sue Abbott2Karel A. Allard4Brad Allen5Amie L. Black6
 François Bolduc7Gail K. Davoren8,9Antony W. Diamond9David A. Fifield10Stefan Garthe11
 Carina Gjerdrum1April Hedd10,12Mark L. Mallory13Robert A. Mauck14Julie McKnight1William A. Montevecchi12Ingrid L. Pollet13,15
 Isabeau Pratte1,13Jean-François Rail7Paul M. Regular12,16Gregory J. Robertson10Jennifer C. Rock4Lucas Savoy17,9Katherine R. Shlepr9
 Dave Shutler13Stephanie C. Symons9Philip D. Taylor13,18Sabina I. Wilhelm18
- 1Canadian Wildlife Service, Environment and Climate Change Canada, Dartmouth, NS, Canada
- 2Birds Canada, Sackville, NB, Canada
- 3Department of Geography and Environment, Mount Allison University, Sackville, NB, Canada
- 4Canadian Wildlife Service, Environment and Climate Change Canada, Sackville, NB, Canada
- 5Maine Department of Inland Fisheries and Wildlife, Bangor, ME, United States
- 6Science and Technology Branch, Environment and Climate Change Canada, National Wildlife Research Centre, Ottawa, ON, Canada
- 7Canadian Wildlife Service, Environment and Climate Change Canada, Quebec, QC, Canada
- 8Department of Biological Sciences, University of Manitoba, Winnipeg, MB, Canada
- 9Atlantic Laboratory for Avian Research, University of New Brunswick, Fredericton NB, Canada
- 10Wildlife Research Division, Science and Technology Branch, Environment and Climate Change Canada, Mount Pearl, NL, Canada
- 11Research and Technology Center (FTZ), Kiel University, Büsum, Germany
- 12Psychology Department, Memorial University of Newfoundland, St. John’s, NL, Canada
- 13Department of Biology, Acadia University, Wolfville, NS, Canada
- 14Department of Biology, Kenyon College, Gambier, OH, United States
- 15Biology Department, Dalhousie University, Halifax, NS, Canada
- 16Fisheries and Oceans Canada, Northwest Atlantic Fisheries Center, St. John’s, NL, Canada
- 17Biodiversity Research Institute, Portland, ME, United States
- 18Canadian Wildlife Service, Environment and Climate Change Canada, Mount Pearl, NL, Canada
Conservation of mobile organisms is difficult in the absence of detailed information about movement and habitat use. While the miniaturization of tracking devices has eased the collection of such information, it remains logistically and financially difficult to track a wide range of species across a large geographic scale. Predictive distribution models can be used to fill this gap by integrating both telemetry and census data to construct distribution maps and inform conservation goals and planning. We used tracking data from 520 individuals of 14 seabird species in Atlantic Canada to first compare foraging range and distance to shorelines among species across colonies, and then developed tree-based machine-learning models to predict foraging distributions for more than 5000 breeding sites distributed along more than 5000 km of shoreline. Despite large variability in foraging ranges among species, tracking data revealed clusters of species using similar foraging habitats (e.g., nearshore vs. offshore foragers), and within species, foraging range was highly colony-specific. Even with this variability, distance from the nesting colony was an important predictor of distribution for nearly all species, while distance from coastlines and bathymetry (slope and ruggedness) were additional important predictors for some species. Overall, we demonstrated the utility of tree-based machine-learning approach when modeling tracking data to predict distributions at un-sampled colonies. Although tracking and colony data have some shortcomings (e.g., fewer data for some species), where results need to be interpreted with care in some cases, applying methods for modeling breeding season distributions of seabirds allows for broader-scale conservation assessment. The modeled distributions can be used in decisions about planning for offshore recreation and commercial activities and to inform conservation planning at regional scales.
Introduction
There is considerable interest in using seabirds to identify ecologically important marine areas (Hooker and Gerber, 2004; Lascelles et al., 2016; Krüger et al., 2017; Hindell et al., 2020). Seabird marine distributions, both around colonies and offshore, may be key information sources for designating Marine Protected Areas (MPAs) (Hyrenback et al., 2000; Ronconi et al., 2012; Davies et al., 2021) or proposing other conservation measures (Arcos et al., 2012; O’Brien et al., 2012; Sonntag et al., 2012; Augé et al., 2018). Globally, seabirds are threatened by a broad range of anthropogenic activities at sea (Cury et al., 2011; Zydelis et al., 2013; Lieske et al., 2019) which necessitates marine conservation planning to mitigate threats. Moreover, seabirds are considered important indicators of marine ecosystem processes (Piatt et al., 2007), and because they are readily observable and tracked, they may serve as sentinels for broad-scale marine conservation planning for other marine top predators (Hazen et al., 2019; Hindell et al., 2020).
Fundamentally, setting priorities for marine area conservation is a spatial allocation decision-making process, and is more likely to succeed when information about biological resources can be combined with an assessment of threats and risks of interacting with those threats (Le Corre et al., 2012; Montevecchi et al., 2012; Lieske et al., 2020). For instance, cumulative risks can be assessed by overlaying multiple spatial layers (Halpern et al., 2008; Ban et al., 2010) to better understand spatial patterns of offshore marine anthropogenic threats. Understanding the foraging areas of certain seabird species can highlight areas of importance to a species and where individuals might be particularly vulnerable during the breeding season (Thaxter et al., 2012; Soanes et al., 2016; Wakefield et al., 2017; Cleasby et al., 2020). Such information forms the base upon which considerations for marine conservation can be layered to provide direct protection of seabirds from threats or indirect protection through conservation of their prey base and habitats.
Seabird foraging areas may be quantified in many ways, the simplest being the delineation of foraging ranges as maximum distributions around breeding colonies (Thaxter et al., 2012; Oppel et al., 2018). A maximum radius approach, however, does not consider underlying habitat associations and is further complicated by significant within and among individual, species, colony, and annual variation (Thaxter et al., 2012; Soanes et al., 2016; Camprasse et al., 2017). Model-based approaches offer a way to relate foraging distributions to important constraints, such as interactions between distance to a colony and underlying habitat requirements, and allow better estimation of geographic areas where a species is most likely to be present (Soanes et al., 2016; Wakefield et al., 2017; Baylis et al., 2019). Furthermore, because it is logistically and financially intractable to obtain tracking information from all species across all of their breeding sites, a modelling approach that incorporates data on species-specific and colony-based foraging areas for sampled colonies provides a way to extrapolate distributions to other colonies that have no tracking data, thereby addressing critical information gaps (Grecian et al., 2012; Gaston et al., 2013; Wakefield et al., 2017; Hindell et al., 2020). Although foraging ranges may be applied as a preliminary tool to investigate important marine areas for breeding seabirds (Thaxter et al., 2012), such foraging radii extrapolation can be further improved with consideration of colony population sizes (Grecian et al., 2012; Jovani et al., 2016) and density dependent effects (Wakefield et al., 2017), indicating the predicted abundance of birds within a particular foraging radius.
While attending the colony, seabirds are central place foragers, and thus are geographically constrained (Orians and Pearson, 1979). This means that their feeding areas and foraging decisions are constrained by how far they can fly from a colony before having to return to incubate eggs or feed chicks. Seabird distribution during the nesting period is limited by a complex set of interacting factors including time and energetic constraints associated with flight and commuting distance (Houston and McNamara, 1985), competition with conspecifics (Elliott et al., 2009; Wakefield et al., 2013), availability of prey within foraging ranges (Birt et al., 1987; Burke and Montevecchi, 2009), as well as both dynamic and static marine habitat variables affecting prey distribution, such as oceanographic fronts and bathymetry (Weimerskirch, 2007; Bost et al., 2009; Soanes et al., 2016). Taken together, these constraints can determine and control the realized foraging ranges of breeding seabirds (Gaston et al., 2013).
We used tracking data and a machine-learning approach to model distributions of seabirds around colonies as a function of distance from colony sites, coastlines, and shelf breaks, as well as associations with seafloor characteristics such as depth, slope, and ruggedness. Constructing this model based on static environmental variables ensured that central place foraging constraints could be captured (e.g. Wakefield et al., 2017) while still maintaining sufficient generalizability for predictions to be applicable to other colonies. Machine-learning techniques such as Boosted Regression Trees (BRT) make no assumptions about the functional forms of relationships with the predictors, are flexible in handling missing data, and can easily capture complex, non-linear interactions (De’ath and Fabricius, 2000; Lieske et al., 2018) such as those that may underlie seabird foraging distributions. Similarly, Hindell et al. (2020) used BRT to model multi-species tracking data to develop broad-scale, predictive maps for marine conservation planning in the Southern Ocean.
Using tracking data compiled from 2005 to 2016, we investigated foraging ranges of 14 of the 21 marine bird species that regularly breed in Atlantic Canada, representing different families, modes of foraging, and positions in marine food webs: pursuit-diving piscivores (5 species), a plunge-diving piscivore (1), surface-feeding piscivores and scavengers (6), surface-feeding planktivore (1), and a benthic foraging seaduck (1). Our objectives were to 1) describe marine bird foraging ranges as a function of several environmental covariates, 2) examine inter- and intraspecific variability in foraging ranges, comparing against available literature, and 3) develop a predictive modeling approach to make region-wide species distribution models for breeding seabirds in Atlantic Canada. The latter objective used BRT model-derived predictions combined with information on colony size from a comprehensive colony database of more than 3500 sites surveyed between 1996 and 2016. Our goal was to better describe and predict the marine distribution of a suite of species around breeding colonies, thereby creating the first layer of information for identifying important marine areas, and laying an enhanced groundwork for assessing risks and setting conservation priorities in Atlantic Canada (Lieske et al., 2020).
Methods
Study Area and Species
This study focused on seabirds and one seaduck species (hereafter “seabird” unless specifically referring to seaducks) tracked in Atlantic Canada (Figure 1) including Newfoundland and Labrador (NL), Nova Scotia (NS), New Brunswick (NB), Prince Edward Island (PEI), and Quebec(QC). Major eco-regions in this area include the Bay of Fundy (NB/NS), Scotian Shelf (NS), Laurentian Channel (NS/NL), Gulf of Saint Lawrence (NB/PEI/NS/NL/QC), Grand Banks (NL), and Labrador Shelf (NL). Seabird colony data (site locations and census numbers) were obtained from all provinces (see below). Tracking data were obtained from government and academic researchers from studies in all provinces except Prince Edward Island (no known studies in this province). We studied 14 seabird species in Atlantic Canada representing five foraging guilds (Table 1, see also Table S1 for sample sizes and study years). Study species encompassed most breeding seabird species from this region, for which tracking data were available: common eider (Somateria mollissima dresseri), Leach’s storm-petrel (Hydrobates leucorhous), northern gannet (Morus bassanus), great black-backed gull (Larus marinus), herring gulls (L. smithsoniansus), black-legged kittiwake (Rissa tridactyla), common tern (Sterna hirundo), Arctic tern (S. paradisaea), roseate tern (S. dougallii), razorbill (Alca torda), Atlantic puffin (Fratercula arctica), common murre (Uria aalge), thick-billed murre (U. lomvia), and black guillemot (Cepphus grylle).
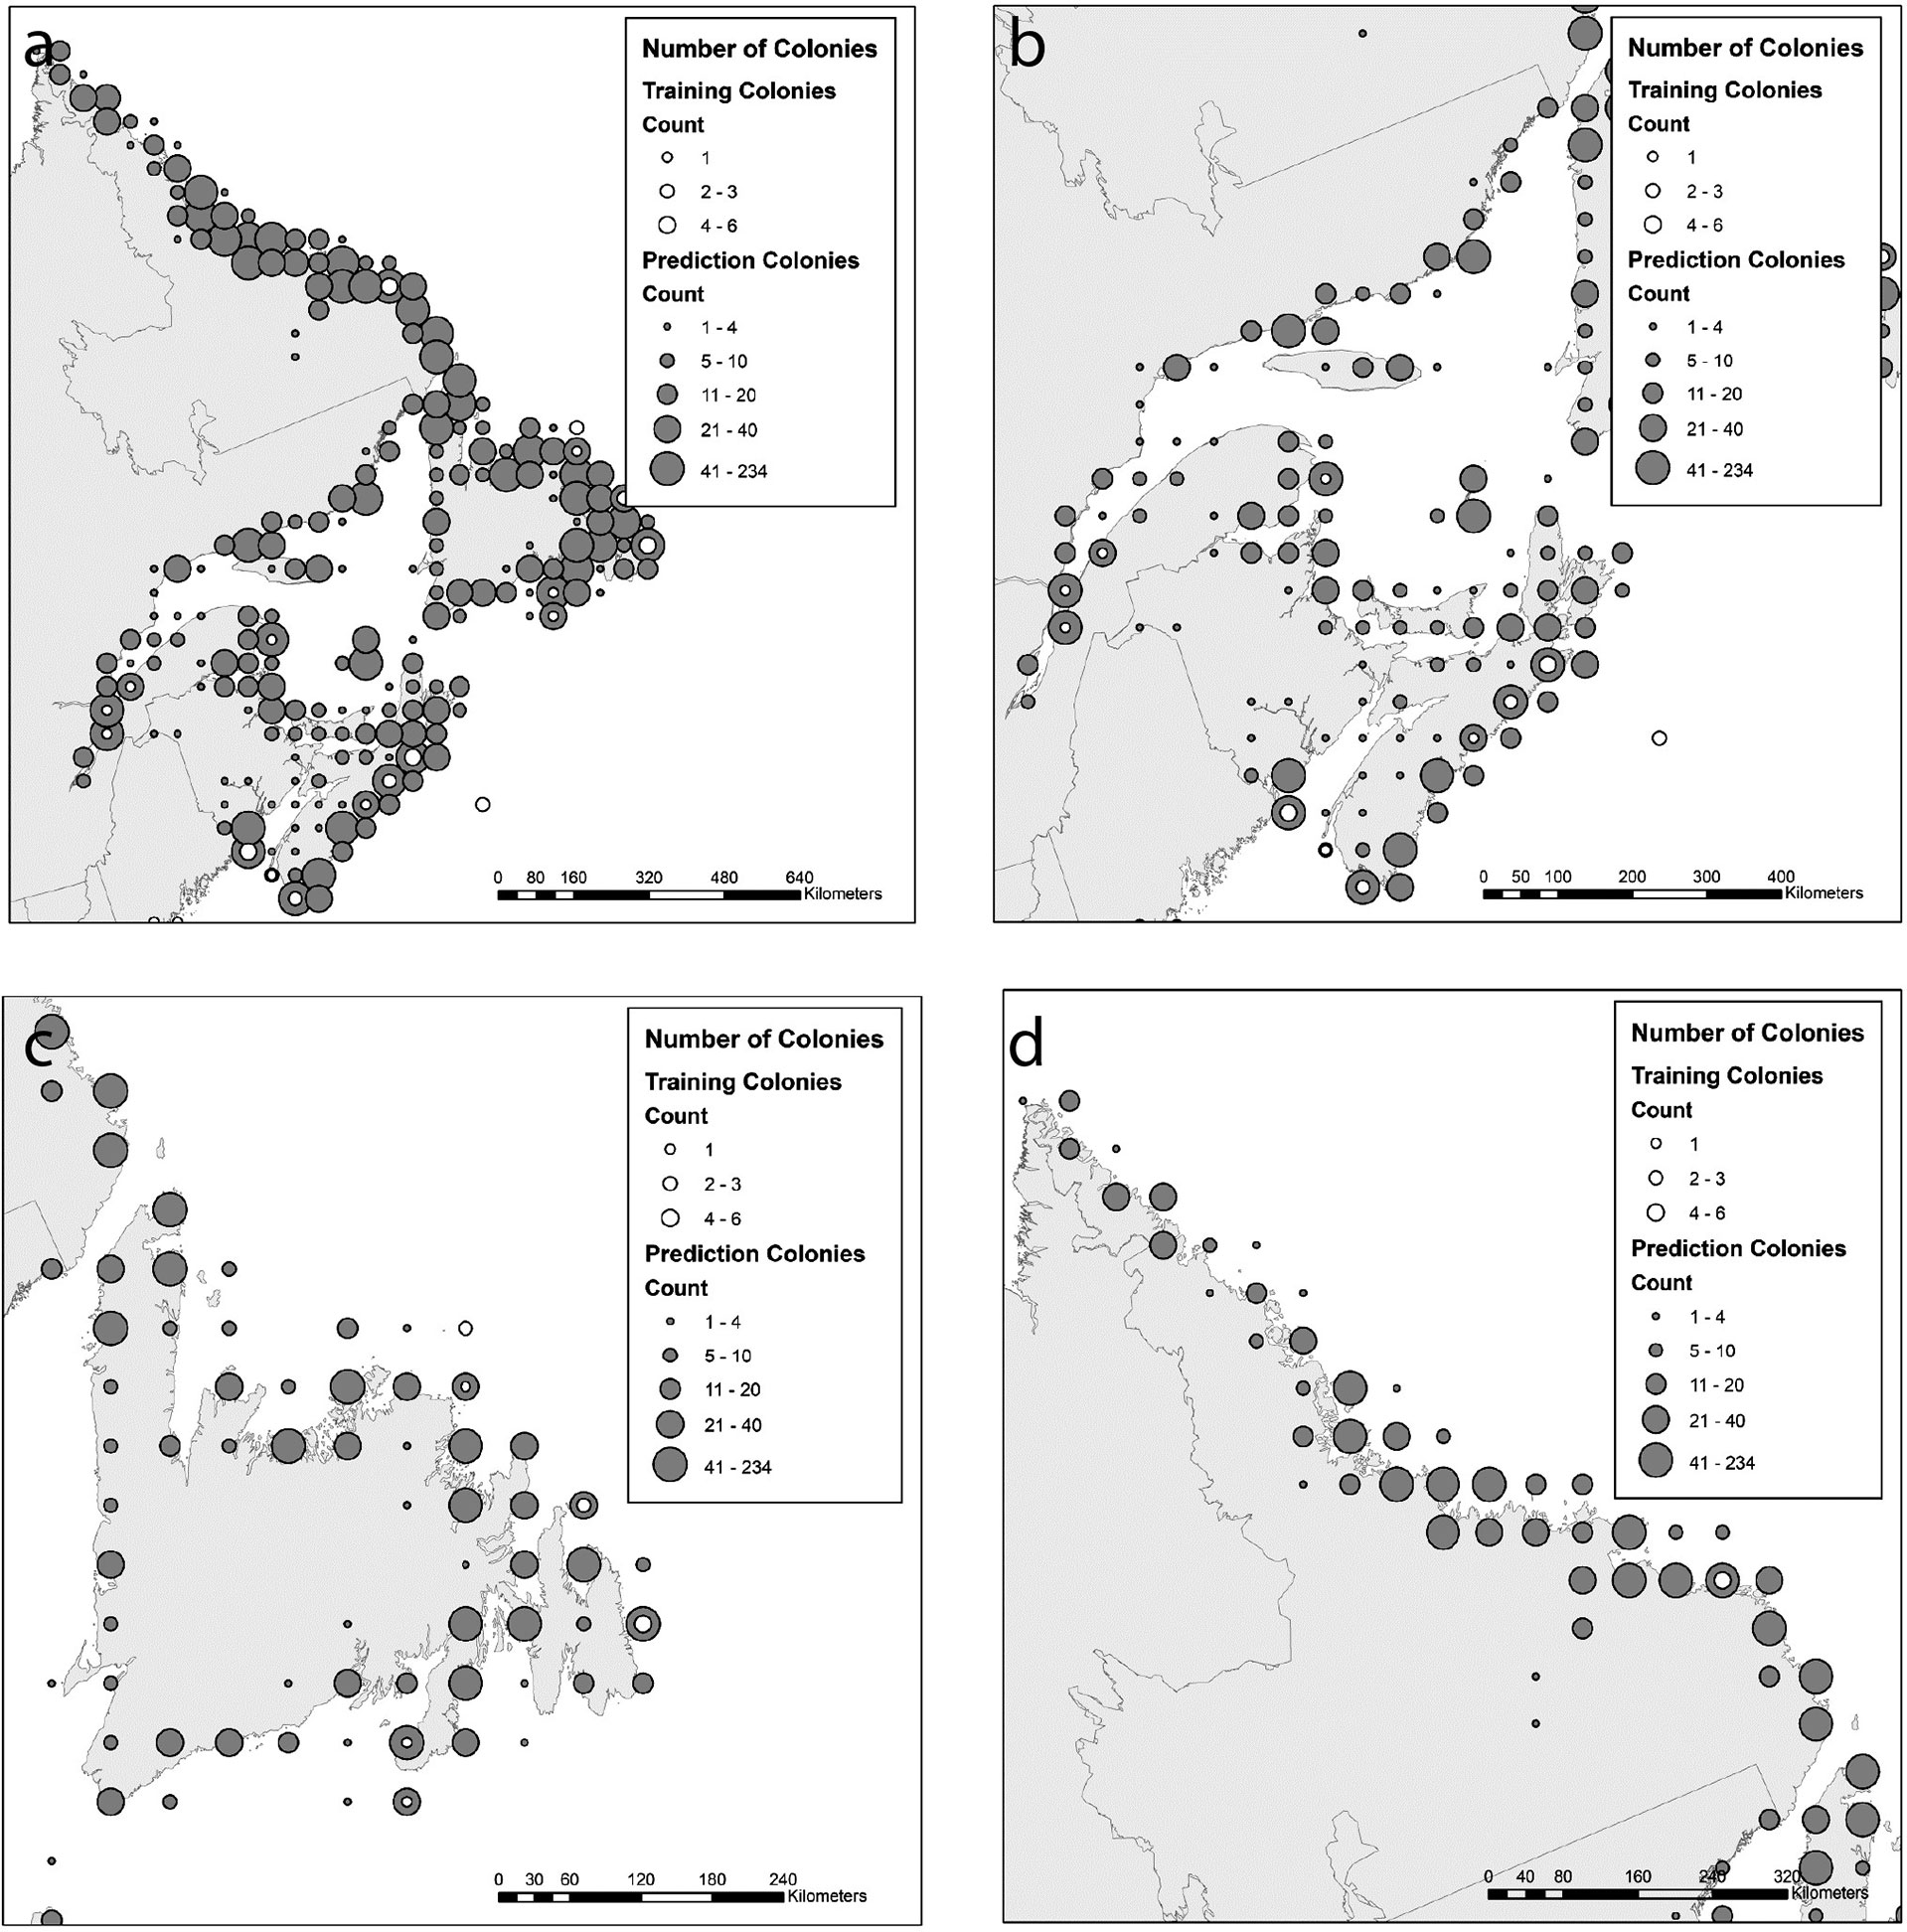
Figure 1 Distribution of colonies from which birds were tracked (hollow circles, “training colonies”) as well as the colonies for which model predictions were applied (solid circles). Model predictions were applied to individual colonies, but colonies are shown here for visualization purposes as numbers of colonies (counts) binned across the landscape. A region-wide view is shown (A), as well as finer scale maps of the Scotian Shelf/Bay of Fundy/Gulf of St. Lawrence (B), island of Newfoundland (C), and Labrador (D).

Table 1 Study species names, abbreviations, foraging guilds, and tag types.
Colony Data
A comprehensive seabird colony database from Environment and Climate Change Canada (Atlantic Colonial Waterbird Database, Banque informatisée des oiseaux de mer au Québec; http://donnees.ec.gc.ca/data/species/assess/atlantic-colonies-density-analysis/) contained more than 8,000 colony records (species-colony combinations) for five Canadian provinces (Figure 1), most of which were accompanied by estimates of population size, dating back to the 1960s. In Quebec, our analysis included only colonies from the Gulf of St. Lawrence, thus excluding colonies from the northern Arctic coastlines. From this, we extracted the largest known colony size for each site and species in the last 20 years (1996 to 2016), resulting in 3556 unique sites (colony locations) and 5318 species-colony combinations. As a precautionary approach, by selecting the largest known population size per species at each site within that period, we account for variation in survey timing, survey methods, cyclical natures of some populations, and declining colonies that might recover – this is meant to capture the recent potential for seabird distributions in a given area and to ensure consistency across sites. By including colony data from the most recent 20 years, data represented both current and past colony locations and helped identify not only the important colonies, but the range of possibilities (i.e., if some colonies had disappeared). This selection also ensured that remote, less frequently visited colony sites were not excluded from the analysis.
Tracking Data
Tracking data were obtained from 520 tag deployments between 2005-2016 at 23 sites, providing 43 independent datasets (species-site combinations; Table 2 and Figure 1). At the time, this included all known telemetry studies using devices enabling geographic positions of breeding seabirds in Atlantic Canada, plus additional data from common eiders from two colonies in Maine, USA, and from Leach’s storm-petrel from one colony in France (Saint Pierre and Miquelon). These included unpublished data (Black, 2006; Symons, 2018; and other unpublished sources) as well as reassessment of previously published data on terns (Rock et al., 2007a; Rock et al., 2007b; Pratte et al., 2021), gulls (Maynard & Ronconi, 2018; Anderson et al., 2019; Shlepr et al., 2021), alcids (Regular et al., 2013; Pratte et al., 2017; Gulka et al., 2019), northern gannet (Garthe et al., 2007; Garthe et al., 2011; Montevecchi et al., 2012), Leach’s storm-petrel (Pollet et al., 2014; Hedd et al., 2018), and common eider (Mallory et al., 2020).
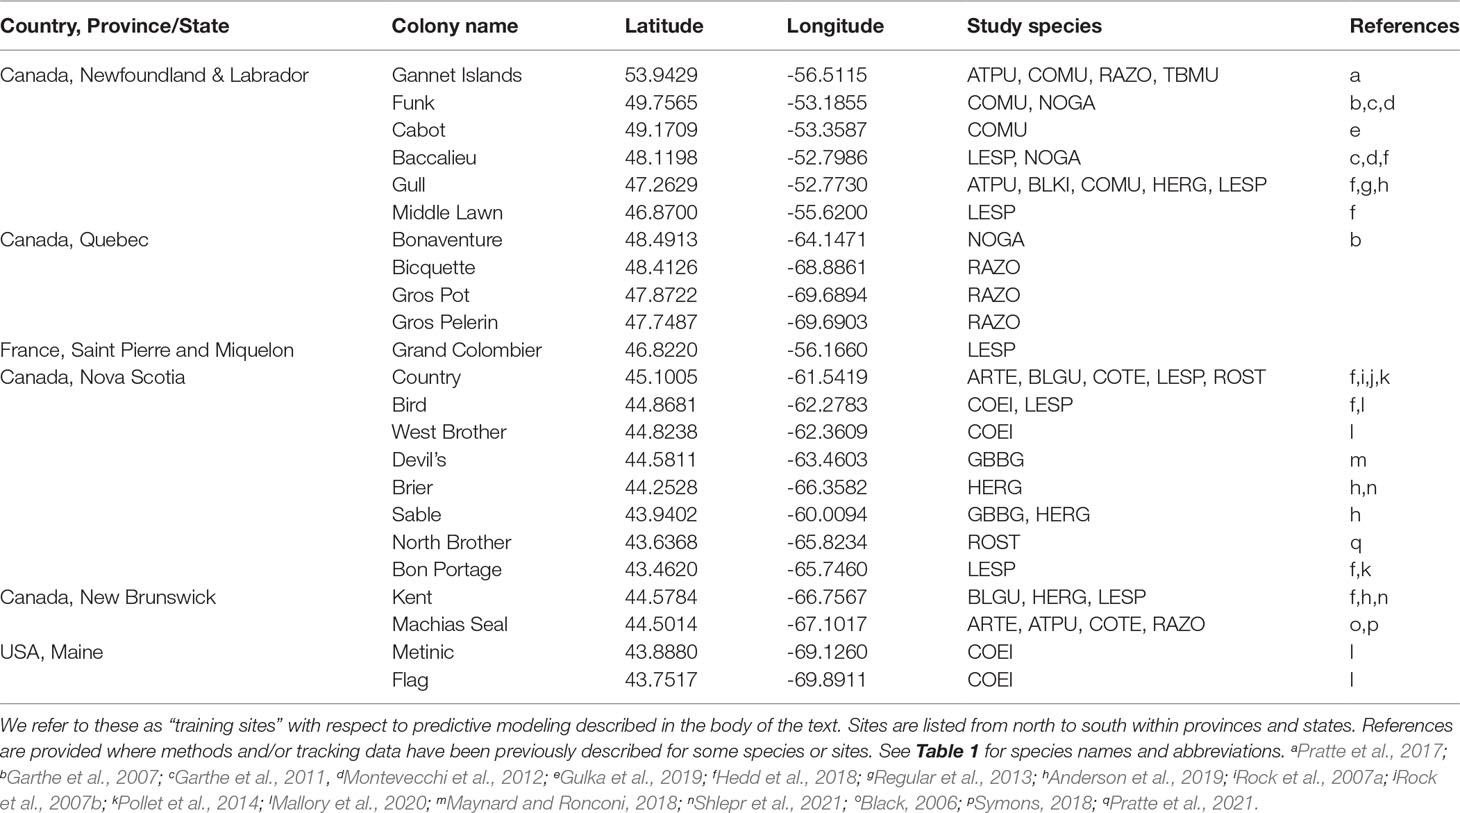
Table 2 Study species and sites where tracking devices were deployed (see Table 3 for tracking effort).
Species were tracked with different tag types (Table 1 and Table S1, Supplementary Material), each of which have differences in accuracy and location frequency. Though location data frequency (i.e. number of locations per day) varied considerably among species and tag types, the predictive modeling analyses (see below) were done at the site/colony level; therefore we were able to maintain the maximum amount of data at each site, but ensured that there was consistent processing among individuals within species-site combinations. The following data quality considerations were applied. Ten species were tracked with GPS tags with expected positional accuracy of < 15 m. Great black-backed gulls (Sable Island) and common eiders (all sites) were tracked with Platform Terminal Transmitters (PTTs) and we used the highest accuracy location classes of 2 and 3 (expected accuracy <1000 m and <500 m, respectively; Nicholls et al., 2007). Herring gulls on Sable Island were tracked with GPS-PTT which collected GPS locations at regular intervals of 1 to 2 h, and Argos (PTT) locations every 4 days when tags transmit data to satellites. For these GPS-PTT data we applied Bayesian state-space models to estimate locations at regular (1-h) intervals, giving higher weighting to GPS locations and higher accuracy PTT locations (Jonsen et al., 2005), thus providing estimated locations likely as accurate as most of the GPS data. Bayesian models treated GPS locations as “fixed” locations, used a hierarchical first-difference correlated random walk (hDCRW), was run in batches on groups of 4 birds, and modeled with Markov chain Monte Carlo method with 10,000 iterations (thinned every 10th record) after a burn-in of 40,0000 iterations. Geolocation-Sensing (GLS) tags were used to track Leach’s storm-petrels at all sites (see Pollet et al., 2014; Hedd et al., 2018 for details and data processing). GLS tags have an estimated error of approximately 180 ± 114 (SD) km (Phillips et al., 2004), and given that foraging ranges vary from 500-1500 km for this species, this error still provides a reasonably accurate estimation of at-sea distribution (Hedd et al., 2018). VHF data were obtained from studies of common and Arctic terns (Black, 2006; Rock et al., 2007a) which rely on aerial surveys to obtain location estimates, thus providing limited, but the only, tracking data available for these species. Roseate terns were tracked by VHF tags at Country Island (Rock et al., 2007b) and GPS at North Brother Island (Pratte et al., 2021).
All tags were deployed on breeding adults. Most species were tracked only during the breeding season, except common eiders, herring gulls, and great black-backed gulls, from which we used a breeding-season subset of the year-round tracks. We retained common eider locations from 0-60 days after the estimated hatch date for each colony, when females attend young in crèches as they disperse from nest sites (Goudie et al., 2000). Within this period, we also excluded locations > 30 km from nest sites to account for presumed unsuccessful breeders, which began early migrations (Goudie et al., 2000). For both herring and great black-backed gulls, we included locations during incubation and early chick-rearing, up to 30 days before and after average hatch dates for each colony. For gulls, we also excluded data for presumed unsuccessful breeders that left colonies prematurely, prior to 30 days post-hatch.
To concentrate on locations associated with foraging activity, including transits to foraging areas, we excluded locations associated with colony attendance and focused the analysis on breeding season at-sea distribution for all study species. This was also necessary to make data comparable among species and study sites because not all tag types recorded locations when individuals were at a colony. The proportion of locations obtained for each colony was highly variable depending on tag type, tag programming, and species behaviour. To standardize within species among colonies, and omit “colony attendance”, we used the following criteria. For burrow-nesting Leach’s storm-petrels tracked with GLS, we omitted locations within 50 km of the colony (7% of the data), because these devices had low accuracy in location estimates (see above). For herring and great black-backed gulls which may forage on land and in the intertidal areas of their nesting colonies, we omitted locations within 200 m of nest sites (data associated with localized activities including incubation, chick provisioning, and roosting; 55-59% of the data), but retained locations which occurred on land in other parts of their colonies/islands.
For all other species, a polygon was traced around the colony perimeter using the polygon tool in GoogleEarth, exported as kml files and imported into program R where they were converted to standard internal representations (e.g. SpatialPolygons[DataFrame]) using readOGR function of package ‘rgdal’ (Bivand et al., 2013). These polygons were drawn in consideration of raw tracking data plotted in GoogleEarth to identify and encompass associated roosting sites on colonies or adjacent rocky outcrops (which may not have appeared in the shoreline layer, below). We measured distance of points to the polygons (on the WGS84 ellipsoid) using dist2Line function in package ‘geosphere’ (Hijmans, 2014) and determined if points were “on land” using the gContains function of package ‘rgeos’ (Bivand and Rundel, 2013). We then excluded all points “on land” and at-sea within 20 m of the colony edge (selected as an expected buffer against the accuracy of the shoreline perimeter and the location error of the GPS data). This buffer excluded the following data for each species: common eider (4%), northern gannet (1%), razorbill (37%), Atlantic puffin (5%), common murre (20%), thick-billed murre (48%), black guillemot (26%), roseate tern (73%), and black-legged kittiwake (25%). No locations were excluded from the VHF data collected for tern species, as these were not tracked in the colonies.
Data Quality
Given the wide range of species in this study and associated variability in tracking technology as well as sample sizes, we provide a qualitative assessment of data reliability used to assess foraging ranges and as inputs to predictive distribution models (below). This assessment is not incorporated into modeled results, but is provided to facilitate interpretation and understand the likely reliability of the results.
For each study species, we scored quality and quantity of tracking data, and the completeness and accuracy of colony data, on a scale of 1 (low) to 3 (high): the sum of the scores represent the overall reliability of the model inputs on a scale of 4 (minimum) to 12 (maximum). Quality of tracking data is based on device type: VHF and GLS (code 1), PTT (2), and GPS (3). Quantity of tracking data is based on a combination of the number of individuals, number of sites, and number of bird locations. Examples of low (1) scores include low numbers of location data (terns, common eider), tracking of few individuals (black guillemots) and/or few colonies (black-legged kittiwakes). In contrast, examples of high (3) quantity of data include high sampling intensity (common murre) and/or tracking of many individuals across multiple sites (herring gull, razorbill, Leach’s storm-petrel). Colony data are scored based on their completeness (likelihood that all colony locations are represented in the database) and expected accuracy with respect to population estimates (which may vary by the census method and/or availability of recent estimates). For example, low scores are associated with species that are infrequently censused or difficult to census at colonies (e.g. black guillemot, common eider), and high scores are associated with species that are frequently censused, easy to observe, and accurately counted (e.g. northern gannet, common murre).
While it was beyond the scope of this paper to assess effects of tags on the behaviour and reproduction of each study species, it should always be considered that attaching devices to birds may disrupt their normal behaviours and movements. Species like gulls, terns, and storm-petrels seem to experience slight or no effects of tagging (Pollet et al., 2014; Thaxter et al., 2016; Seward et al., 2021), yet other species groups, such as the auks, may be more prone to negative effects of logger attachment (Paredes et al., 2005; Symons and Diamond, 2019) and, thus, tracking data may be less representative of true foraging behaviours.
Foraging Ranges
Distance from a colony and distance to coastline were used to describe and compare foraging ranges and habitats among species. For each location we measured distance to individuals’ colonies using the distance function of package ‘argosfilter’ (Freitas, 2012). For the study area coastline, we used version 1.0 of the CanCoast shoreline database compiled from the Canadian National Topographic Database, Geobase, and Landsat 7/SPOT imagery (Smith et al., 2013). Distance to nearest coastline was measured for each location using the dist2Line function. For gulls, which may use inland terrestrial habitat, we further quantified “on land” locations using the gContains function with a polygon of the entire coastal area, and inland locations were transformed to negative values so that distances from coastline measurements ranged from positive (marine) to negative (terrestrial) values, relative to the coast (value of zero).
For each species-site combination, we determined the maximum range (distance from colony) of all individuals, as is frequently reported in literature on foraging ranges (Thaxter et al., 2012; Soanes et al., 2016), and the maximum distance to nearest coastline. Because these metrics are sensitive to outlier individual birds or trips, we additionally report the 99th percentile distances for each species-site combination, which better represents the typical maximum for a given site. Furthermore, we report the mean maximums among individuals for each species-site, thus characterizing typical ranges within populations. Finally, to illustrate how densities of birds may differ with respect to distance from coastlines, we summarize distance to shore of all locations pooled into distance bins: inland (gulls only), 0-1, 1-10, 10-100, and >100 km from coastline.
Predictive Species Distribution Models
Pre-Processing
To support the calculation of species-specific, colony-centered distribution models (see Statistical modelling), analysis grids were constructed for each tracked individual, centered on the breeding colony of the bird. Because of differences in sampling effort between colonies, resulting from disparities in the performance of different tracking devices as well as the fact that some colonies had more tracked individuals than others, the density of positions (per grid cell) was converted to relative density (RDi,k):
where i = a particular grid cell location, k = a particular tracked bird, and N = the total number of grid cells in the surface. As a final pre-processing step, grids from each tracked individual were combined (concatenated) to form a single RD grid prior to habitat modelling (see Statistical modelling).
The maximum extent of each grid was empirically defined as the mean of the maximum observed foraging distances across the training colonies. The analysis grids for most species were 2-km resolution, except for the herring gull (5-km), northern gannet (5-km), and Leach’s storm-petrel (12-km) where a combination of very large foraging distances and computing performance warranted greater spatial aggregation.
Predictor Variables
Prior to statistical modelling, six variables were generated for each grid cell, though different combinations were used for different groups of species (Table 3). Bathymetry (BATH), both marine (bathymetry) as well as terrestrial (elevation), was estimated for all species using the 30-arc second resolution ETOPO 2v2 grid, from which slope (SLOPE) and ocean floor/terrain ruggedness (RUGGED) were derived at the same spatial resolution.
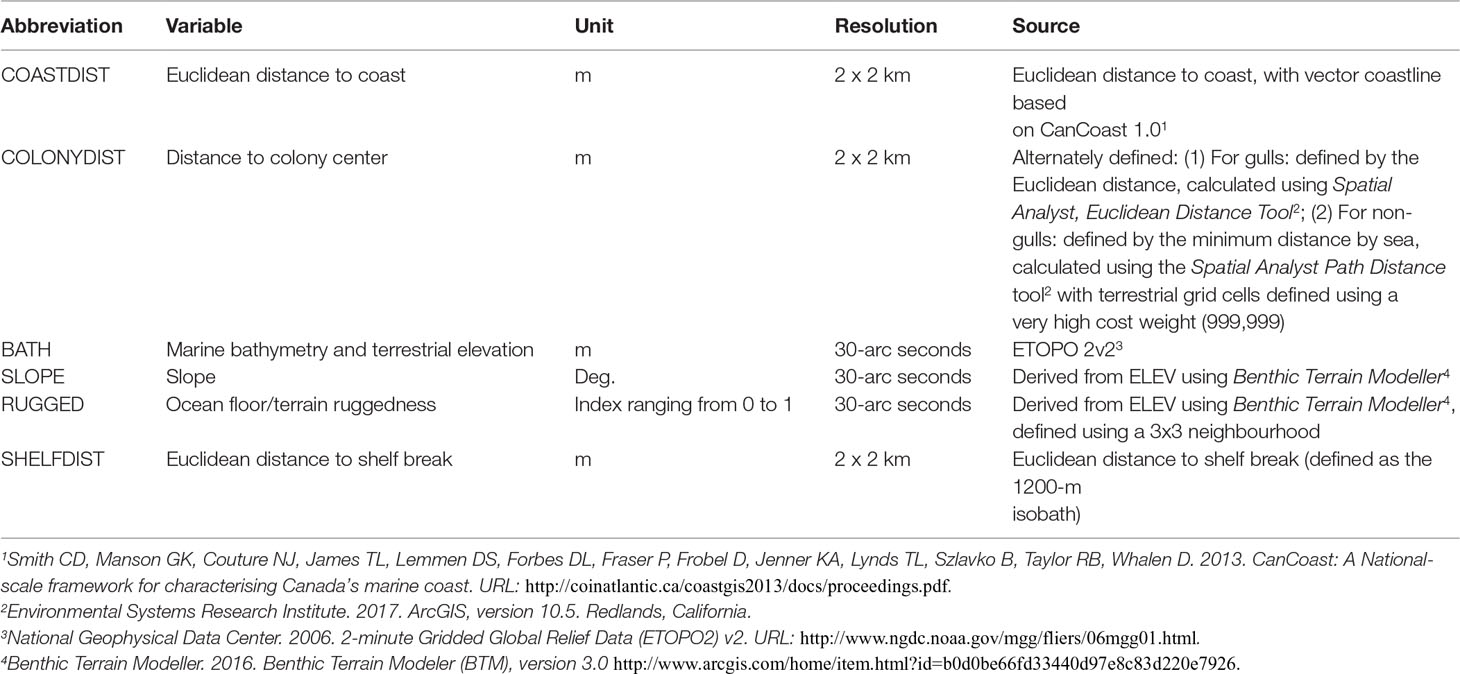
Table 3 Environmental predictor variables used to construct colony-centered species distribution models.
The remaining three variables were planimetric in nature and defined at a resolution of 2- x 2-km. Distance to coast (COASTDIST), where the reference coastline was delineated using the CanCoast 1.0 vector coastline database, was calculated for each species/species group as the shortest straight-line (Euclidean) distance. Distance to colony (COLONYDIST) was defined for all species, but in two different ways depending upon the group. For gulls, which travel over land, simple Euclidean distance to the colony center was employed. For all other (i.e., non-gull) species, distance to colony center was defined using the minimum distance by sea, calculated using the Path Distance procedure of ESRI (2015). This procedure allowed for the specification of surface travel weights and, in this case, terrestrial grid cells were defined as having a very high cost weight of 999,999, with water having a value of 1. Distance to shelf break (SHELFDIST), a variable used only in the model for the Leach’s storm-petrel, was calculated as the Euclidean distance to the 1200-m isobath.
Statistical Modelling
The procedure for construction of statistical models is outlined in Figure 2, and employed BRT (see Friedman, 2001). The BRT algorithm has been described as a “slow learning” technique where predictions are constructed additively, sequentially, and incrementally (Elith et al., 2008; James et al., 2013). Data were not bootstrap-sampled nor was the response variable directly modelled; rather the attention of the model-fitting procedure is focused on the residual or unexplained variation (James et al., 2013). The BRT algorithm was implemented using the gbm R package of Ridgeway (2012), with tuning parameters defined as follows: learning rate of 0.01, 2000 trees per iteration, and a tree (interaction) depth of 3. Given the specification of the BRT interaction depth parameter (k=3), importance values reflect complicated three-way interactions between predictor variables.
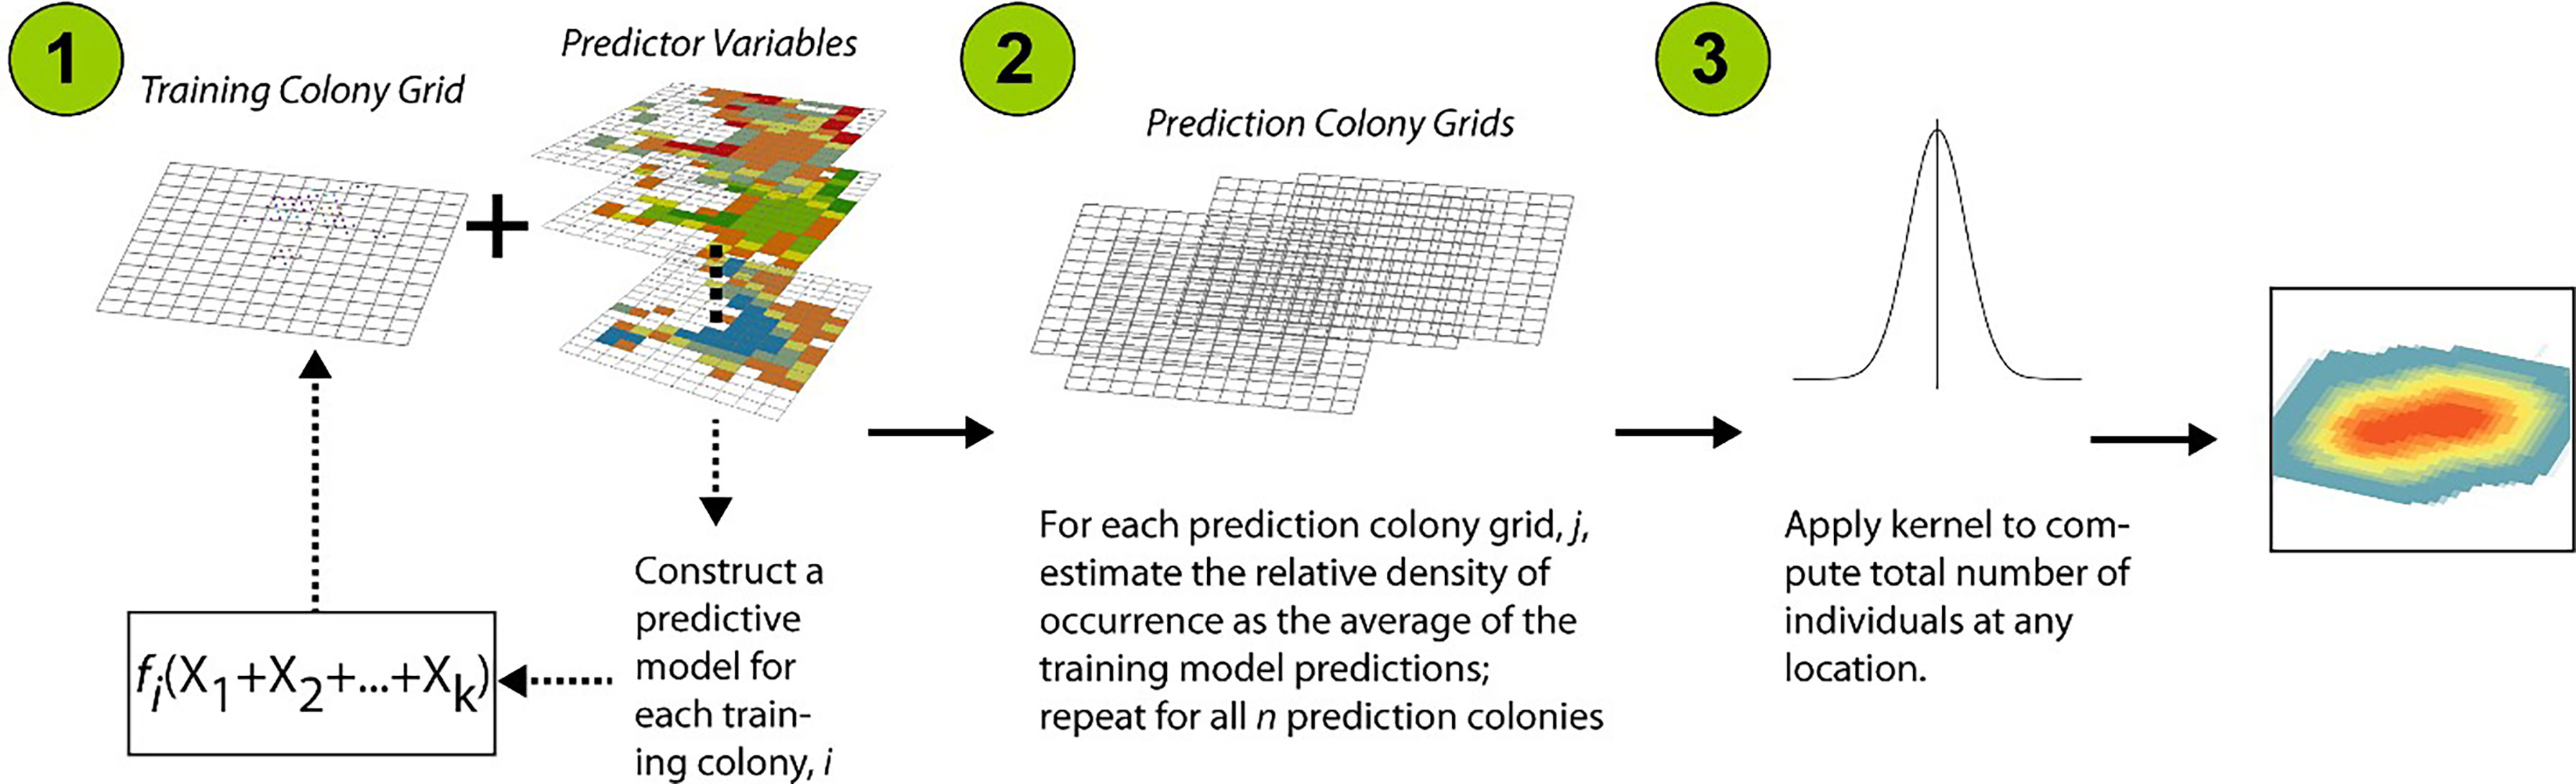
Figure 2 Flowchart illustrating the procedure for statistical modelling: (1) using training colonies, construct colony-specific, Boosted Regression Tree (BRT) models, (2) average the predictions derived from each colony-specific model, for each prediction colony grid, and (3) apply a kernel density smoother to the immediate nearest neighbours, defined using a radius equal to the diagonal distance of the prediction grid cell, to compute the total number of individuals at any location.
BRT models were constructed for each training colony using one of two possible combinations of predictor variables to estimate :
~ f(COASTDIST, COLONYDIST, BATH, SLOPE, RUGGED) (2)
for all species except Leach’s storm-petrel, which was modelled as:
~ f(COASTDIST, COLONYDIST, BATH, SLOPE, RUGGED, SHELFDIST) (3)
Predicted RD values (), derived from each of the colony-specific training models, were combined by averaging, and re-scaled from 0 to 1 to yield an estimated probability of grid cell usage (P̂):
The estimated number of individuals per grid cell, per colony(), was estimated as the product of the colony size, C, times the probability of grid cell usage by individuals from that colony,
for grid cell location i, and colony j.
Total number of individuals, per grid cell, per colony, were combined together as spatially overlapping points, and a kernel density moving window applied (using a nearest-neighbour distance equivalent to 1.41 * grid cell resolution) to estimate the total number of individuals present at that location (see Figure 2). The resulting prediction surface represented the final estimate of the number of individuals, from all colonies, at any given location.
Prediction error was assessed using a 10-fold cross-validation procedure, with 70% of randomly-chosen analysis grid cells selected for model training, and 30% withheld for error assessment. Error was measured using mean mean-square prediction error (Mean MSE) calculated over the ten iterations.
Results
Tracking data from 520 individuals yielded 9,291 bird-tracking days, and 390,461 locations after filtering out locations for colony attendance (Table S1 and Supplementary Material). Tracking effort among species varied widely due to the types of tags used and number of years tracked. Northern gannets and gulls, tracked by data-rich GPS and PTT across multiple sites and years, comprised 41% and 38% of the locations, respectively. The remainder of the data includes other species tracked by GPS (~19%), Leach’s storm-petrels tracked by GLS (~1%), common eiders tracked by PTT (0.3%) and terns tracked by VHF (0.04%). The quality and the quantity of the tracking data likely influence reliability of empirical results (e.g., measured foraging ranges). The relative quality of tracking and colony data used in this study highlight some important differences among species or species groups (Table 4). Alcids (except black guillemots), herring gulls, and the northern gannets had the highest quality owing to the availability of tracking data from multiple sites and well-censused colonies. Terns (except roseate tern), common eiders, and black guillemots had the lowest quality scores, typically due to limited availability of tracking data. Nonetheless, we expect the predictive distribution models to be more robust to variations in data density, because tracking positions were counted and represented as relative densities within analysis grids (see Discussion regarding additional considerations of reliability). Still, predictions are not possible when colony locations are not known; therefore, incomplete colony data (e.g. black guillemot, common eider, black-legged kittiwake) may lead to the largest source of error with respect to predictive distribution models.
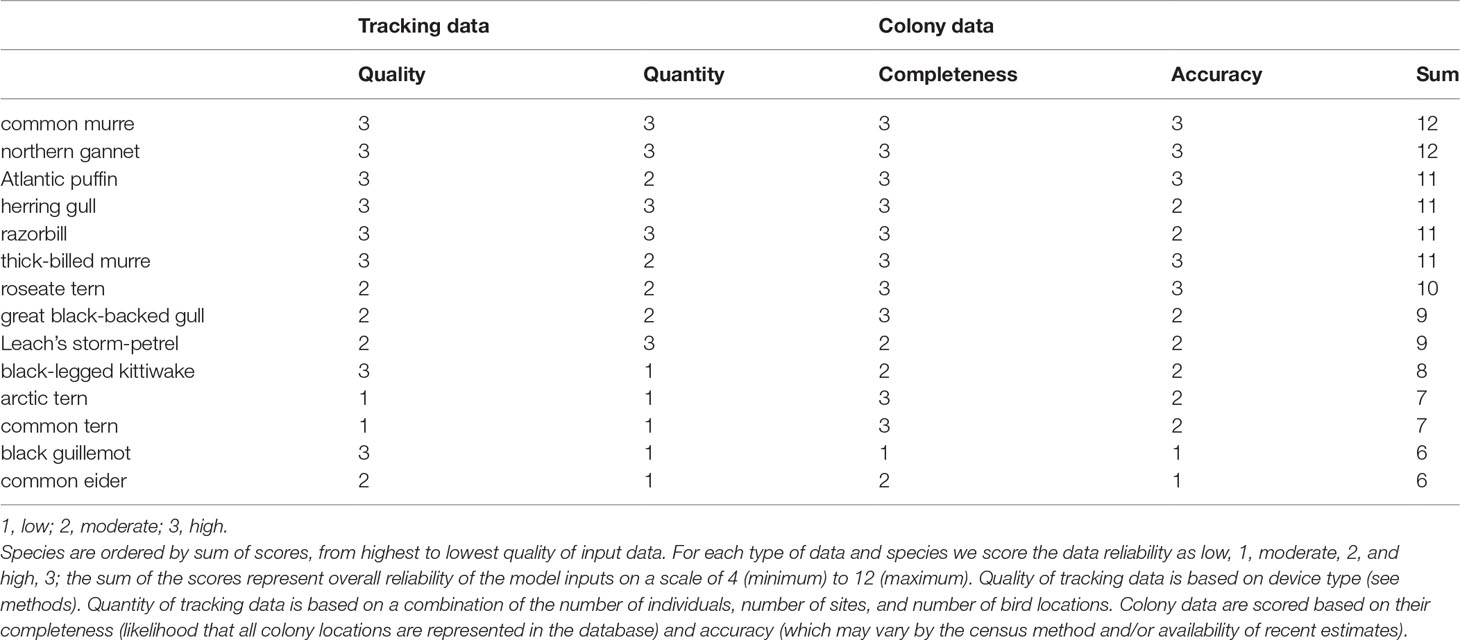
Table 4 Qualitative assessment of the data used as inputs to the predictive distribution models.
Foraging Ranges
Foraging ranges spanned more than 1,000 km for Leach’s storm-petrel to less than 20 km for coastal species such as common eider, black guillemot, and terns (Table 5 and Figure 3). In general, species that travel farther from colony sites also travel farther from coastline, yet this is not always the case (Figure 3). Comparisons of distance from colony and distance to coast (Figure 3) suggest clusters of species groups including short-range and nearshore (common eider, roseate tern, and gulls), medium range (razorbill, common murre, Arctic and common terns), long-range and nearshore (northern gannet and black-legged kittiwake), and long-range and offshore (Atlantic puffin and thick-billed murre). Leach’s storm-petrel foraged extremely far from colonies, nearly always far offshore, at an order of magnitude greater than all other species.
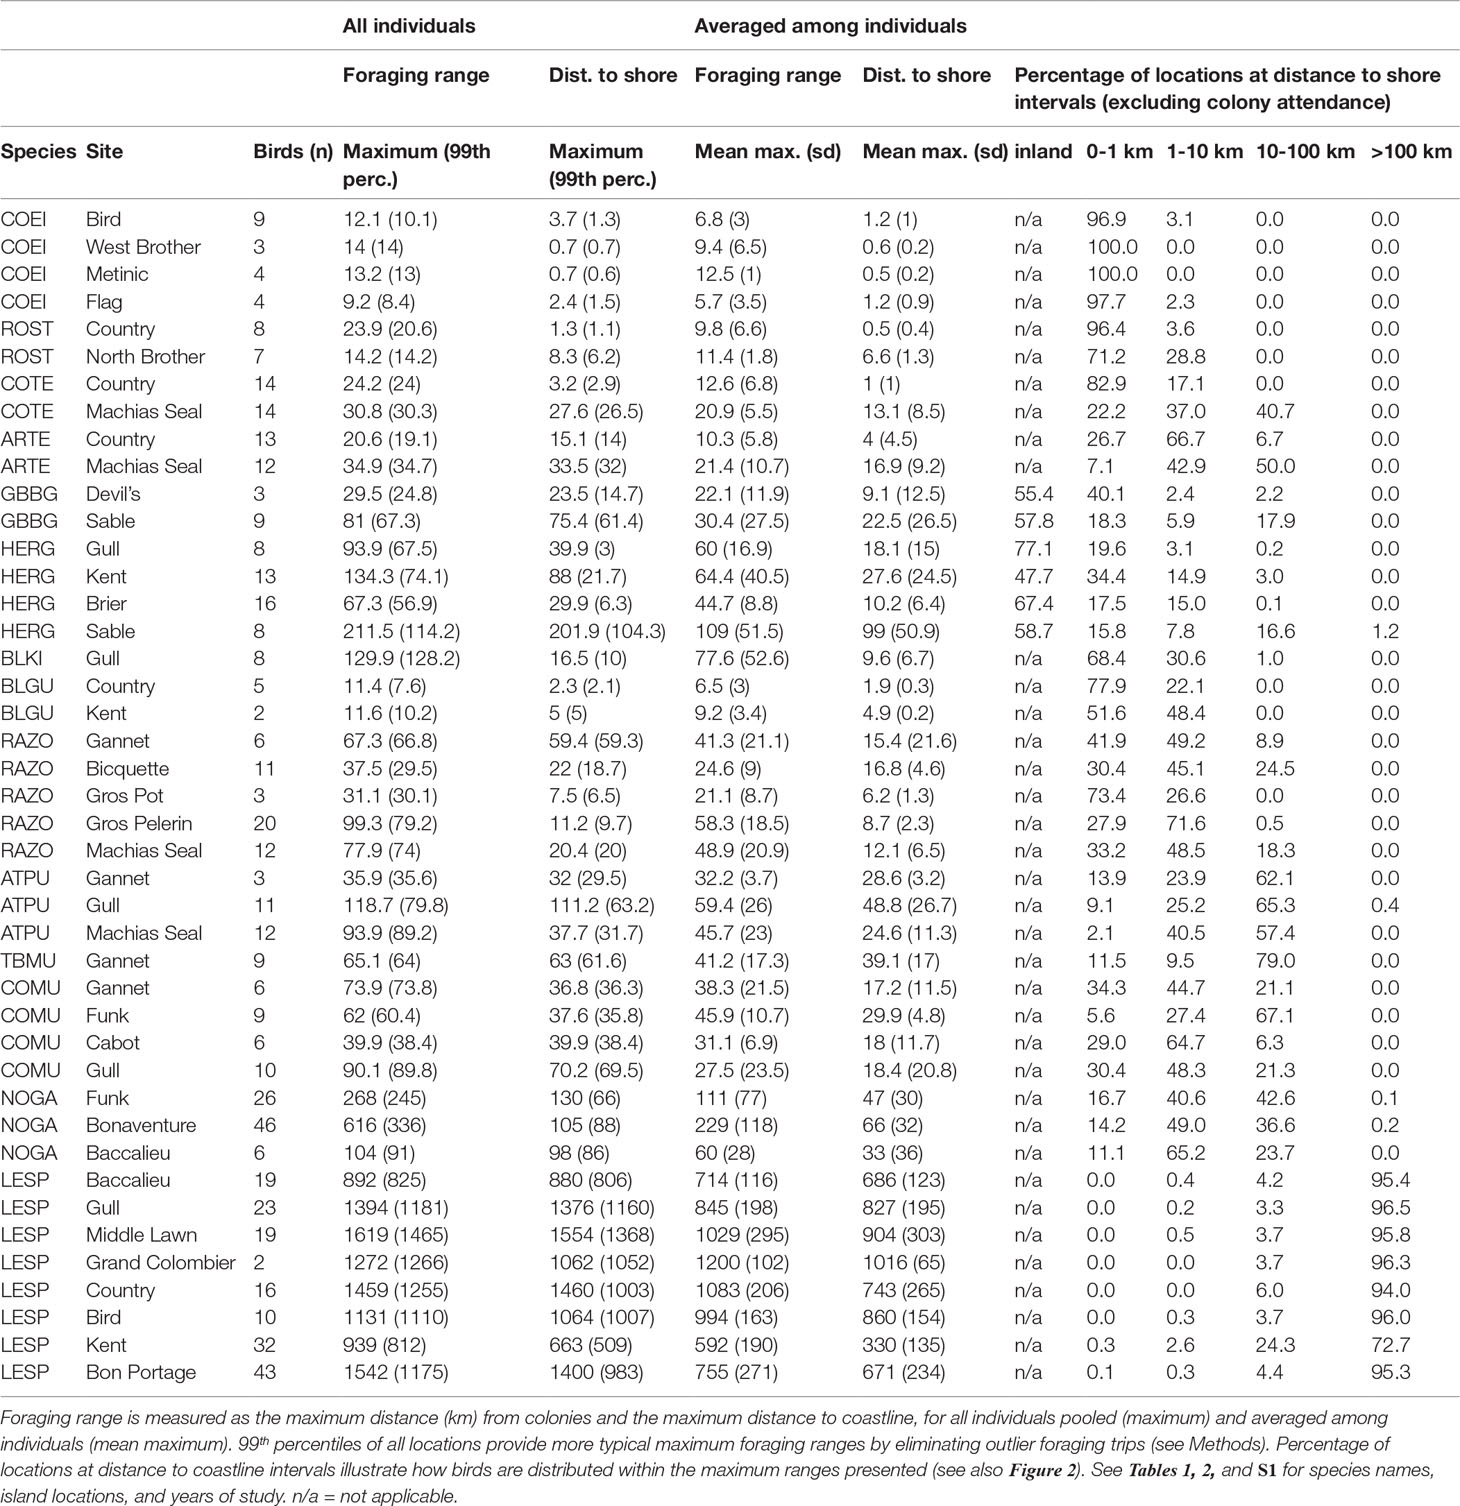
Table 5 Summary of breeding season foraging ranges of 14 species from 23 colonies.
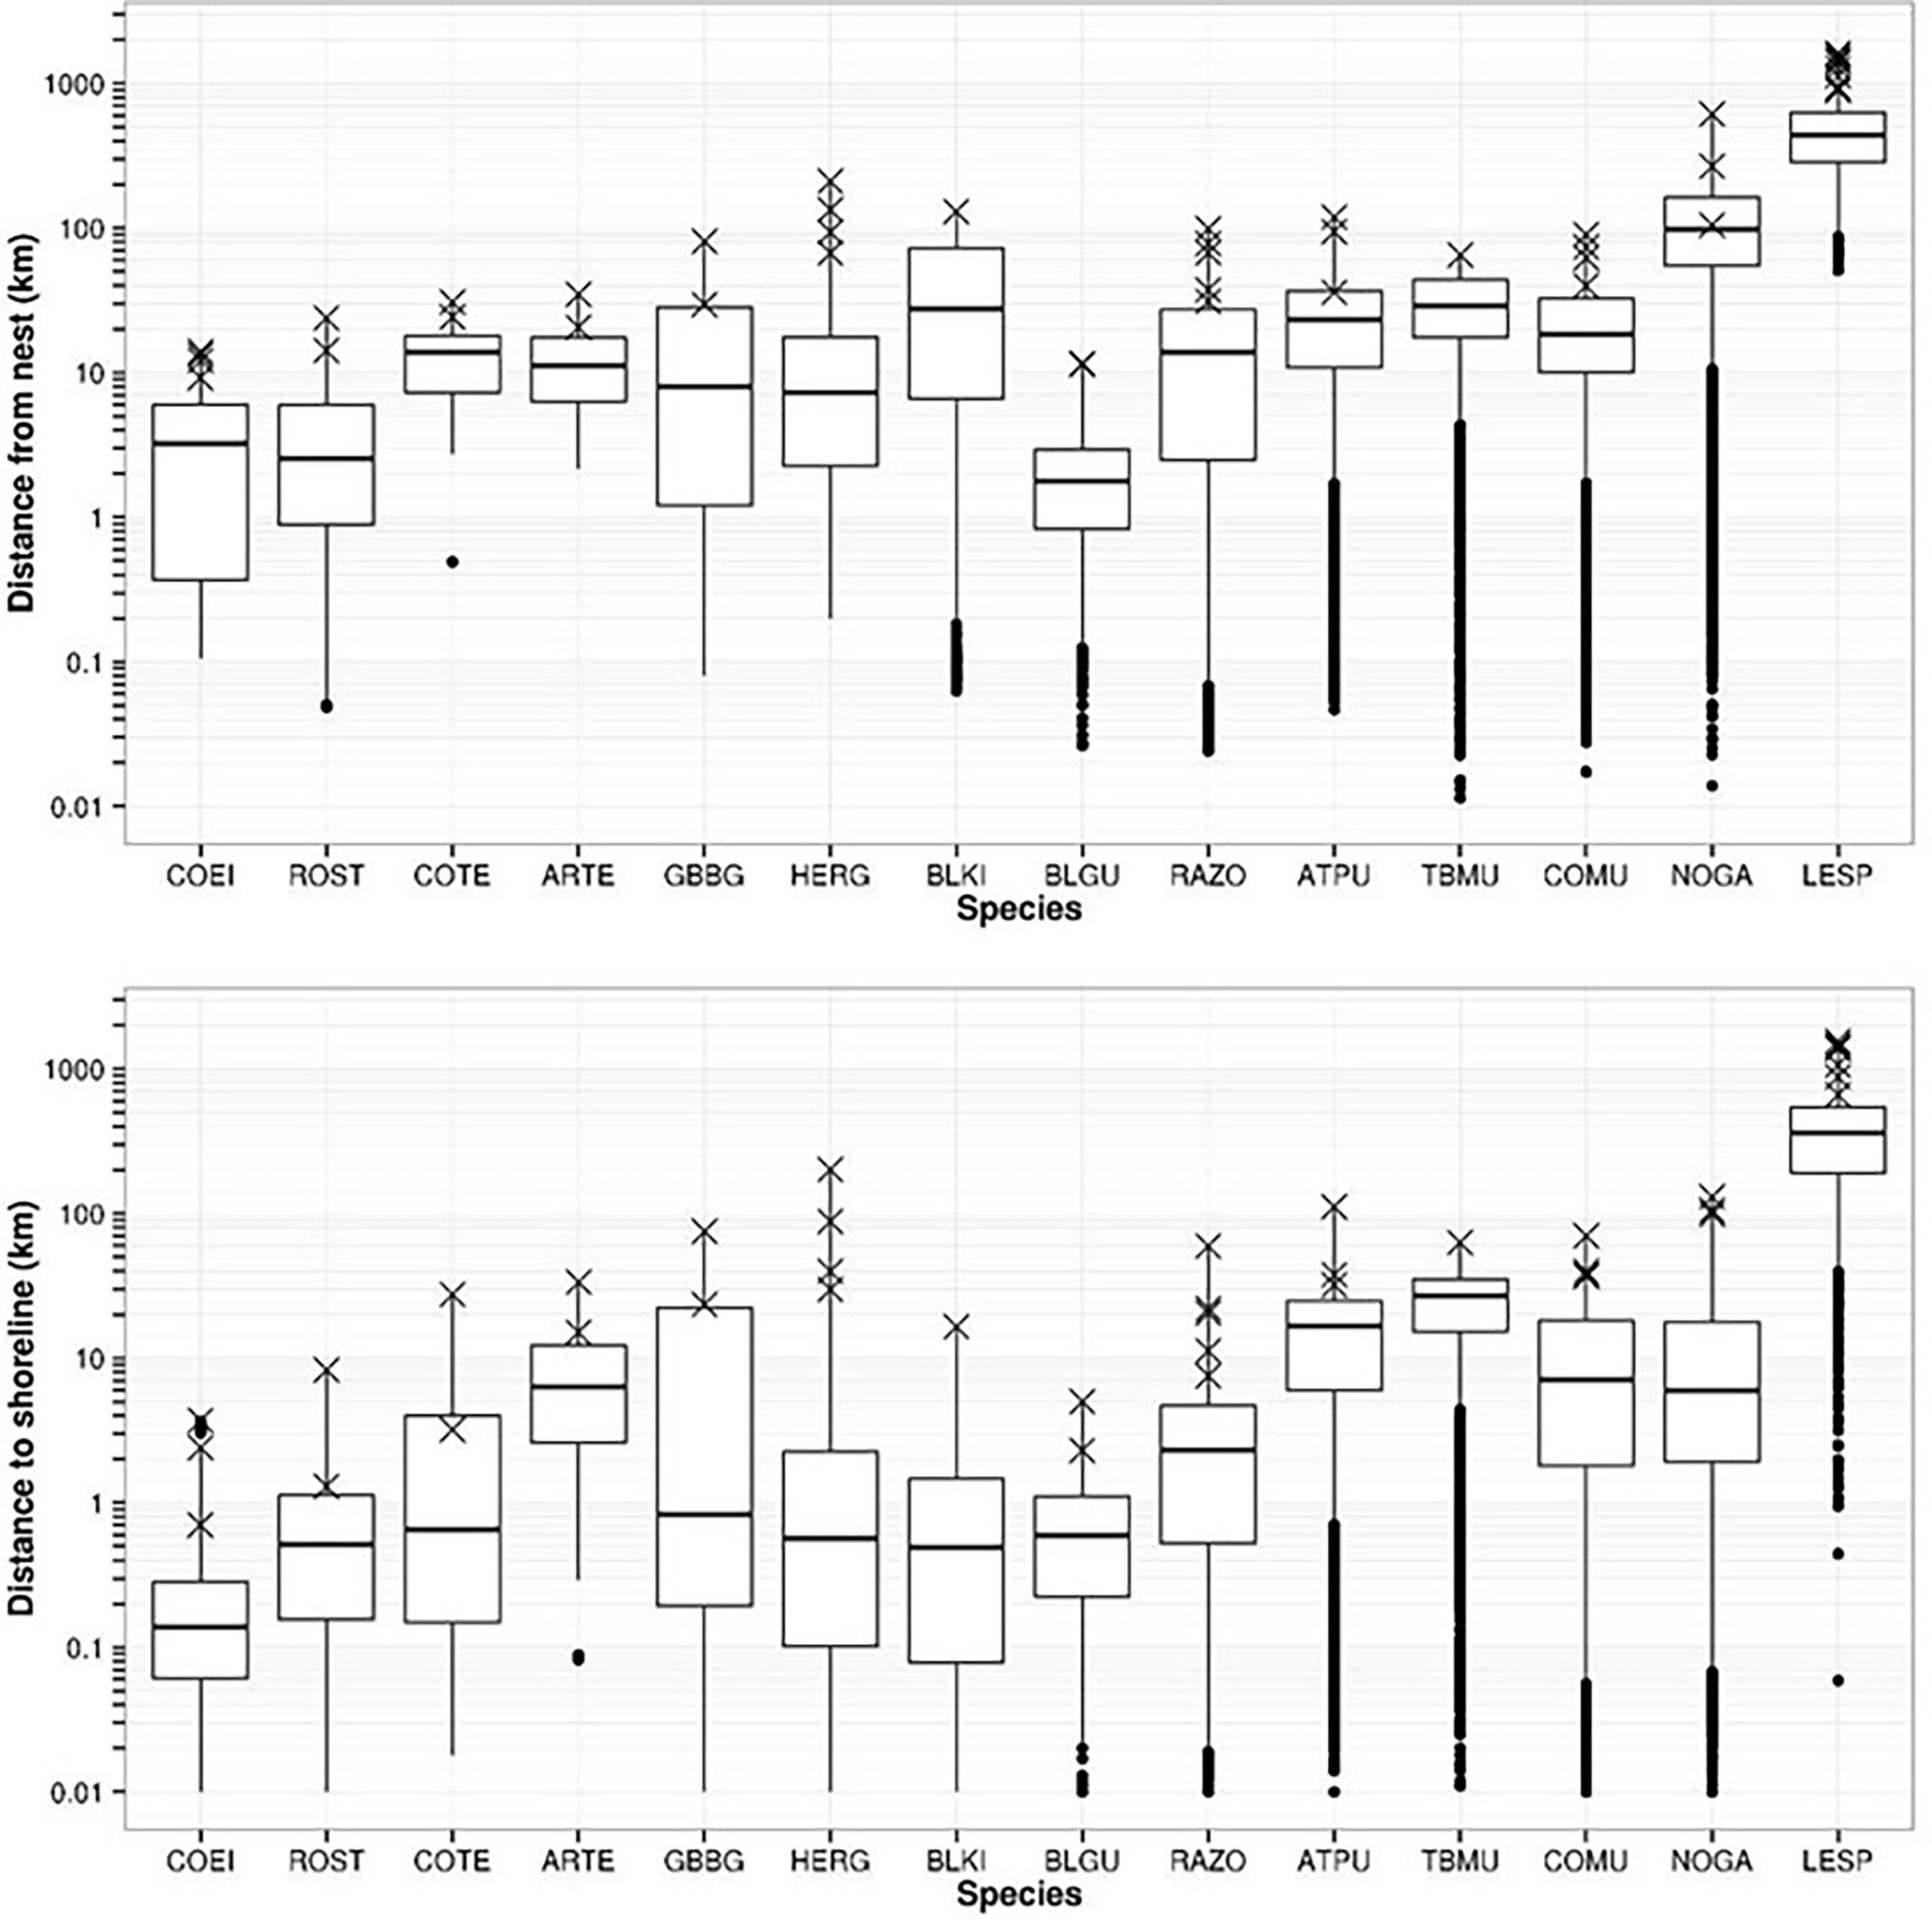
Figure 3 Distribution of tracking data for 14 seabird species (codes in Table 1 caption) with respect to distance from colony sites (upper panel) and distance to coastline (lower panel). Boxplots show median distance, 1st and 3rd quantiles, 95% confidence intervals (whiskers), and outliers (dots). Data are pooled among sites for each species, but “X” represents maximum foraging ranges for each tracked colony (taken from Table 4).
Distance from colony and/or distance to coastline differed among colonies for each species (Table 5). Colony-specific differences in foraging ranges are likely a result of local habitats or greater distance of colonies from mainland coastlines (e.g., Machias Seal Island and Funk Island). Colony-specific differences in foraging ranges and distance to coastline were also evident from density plots of raw tracking data, and highlight strong variability in foraging ranges that are well below “mean maximum” levels (Figure 4, with additional species presented in Supplementary Material Figure S1). For example, although maximum foraging ranges for Atlantic puffin may be ~ 100 km at some sites, peak densities in tracked locations occur near 5, 20, and 50 km from colonies, and nearly always within 40 km of land (Figure 4). Similarly, herring gulls tracked from four colonies had considerable variability in peak densities from colonies (ranging from 40-60 km maximum distance depending on colony), but strong convergence on coastal areas.
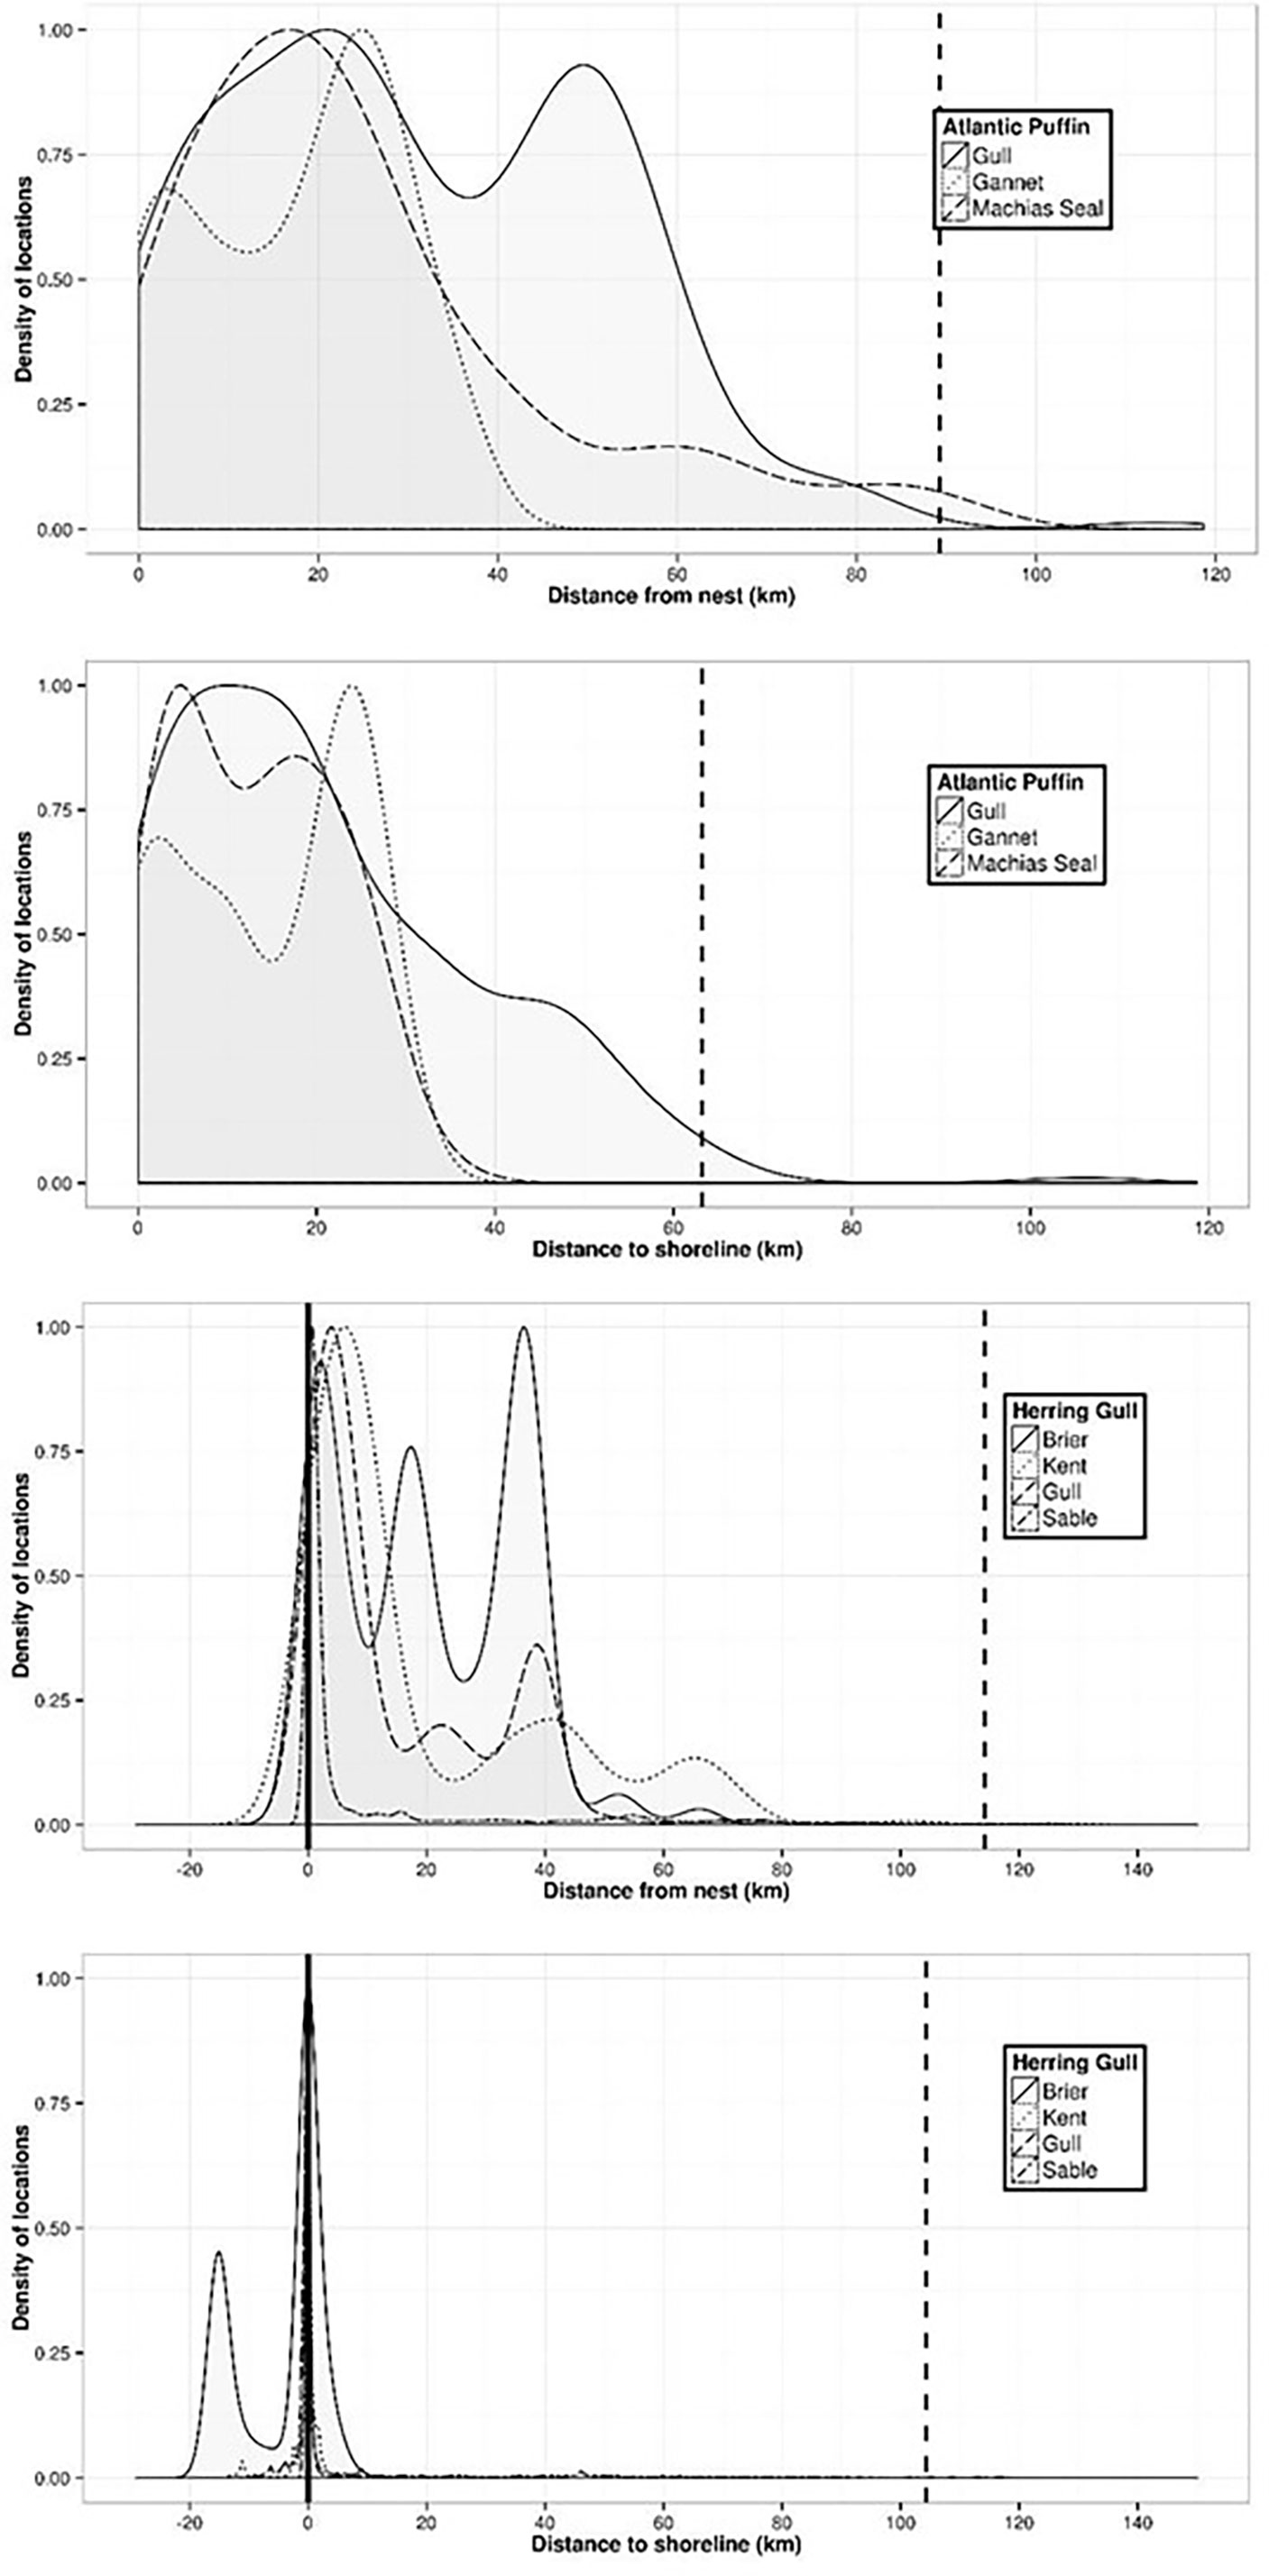
Figure 4 Smoothed density estimates of telemetry locations with respect to distance from colony (i.e. nest site; upper panels) and distance to coastline (lower panels) for Atlantic puffin and herring gull (see Supplemental Materials Figure S1 for plots of other species). Density estimates are scaled from 0 to 1 for each study colony, where a density of 1 occurs at the distance where the highest density of locations occurs. Dashed vertical lines show 99th percentile of distance measurements (Table 5).
We compared our results to those from a literature review (Thaxter et al., 2012, and also Masden, 2012; Shoji et al., 2015) which reported on the same species, primarily from studies in the eastern North Atlantic (Table 6). Overall, maximum and mean maximum foraging ranges were quite similar for most species, though large differences were observed with common eider (maximum range of 14 km vs. 80 km previously reported), herring gull (mean maximum ranges 2.1 times larger in the current study), and Leach’s storm-petrel (mean maximum approx. 14 times larger than reported by Thaxter et al., 2012), owing mostly to limited or poor data available when the original review was conducted.
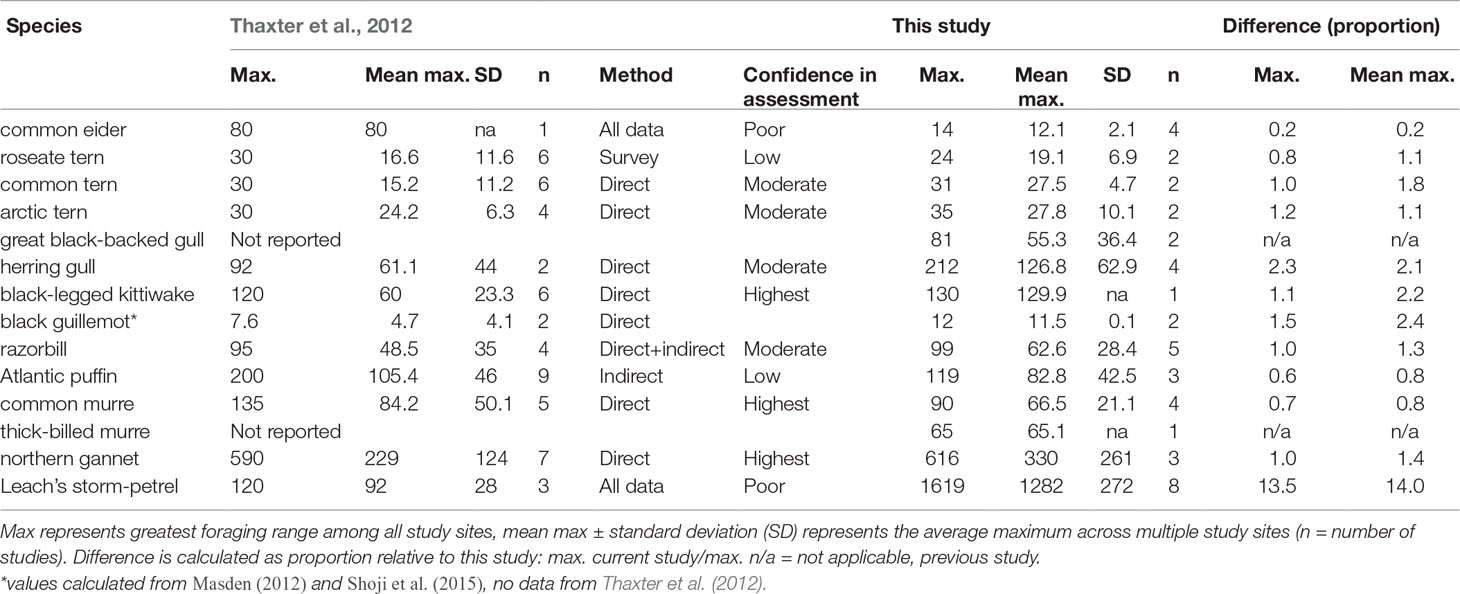
Table 6 Summary of species-specific breeding season foraging ranges (km), comparing results of the current study against a comprehensive literature review (Thaxter et al., 2012).
Predictive Species Distribution Models
The relative importance of each predictor variable varied by species, though some predictors were common to most (Table 7). Distance to colony (COLONYDIST) was the first or second most influential predictor for 12 of the 13 species, whereas distance from coastlines (COASTDIST) was the first or second most influential predictor for six species. Other influential predictors were seafloor slope (SLOPE) for two species (common eider, razorbill) and terrain/seafloor ruggedness (RUGGED) for two species (roseate tern and great black-backed gull). Bathymetry (BATH) was the second most influential predictor for three species groups: terns, black-legged kittiwake, and Leach’s storm-petrel (Table 7).
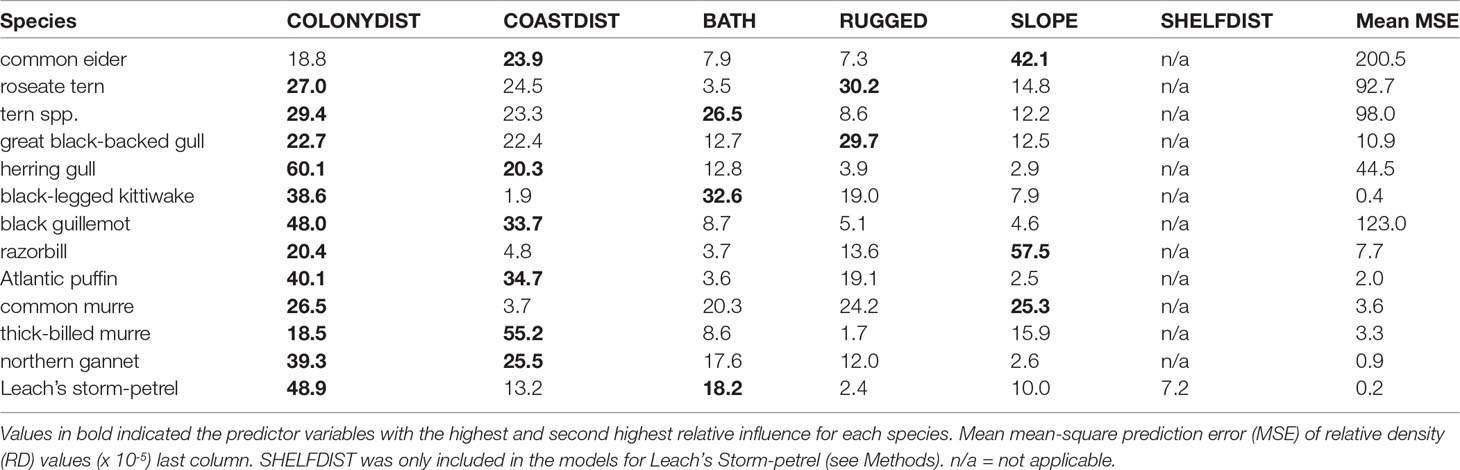
Table 7 Relative influence (%) of environmental predictor variables (see Table 3), based on a BRT predictive model trained using all individuals pooled, and an interaction depth (k) equal to three.
Prediction error, assessed for the averaged BRT predictions, showed that errors tended to be higher for the terns, which were at least partially tracked using VHF receivers, as well as common eider and black guillemot, which had lowest numbers of tracked individuals.
Maps derived from the predictive models varied considerably by species (Figure 5 and S2). Common murre, which we describe as a medium range species, had distributional halos several orders of magnitude larger than those of the black guillemots, and at the regional scale were primarily concentrated near the very large colony of Funk Island, Newfoundland, in contrast to the smaller colonies in southern New Brunswick and Nova Scotia (Figure 5A). Herring gull, which had similar 99th percentiles for foraging distances as common murre, were present at many more colonies (1,207 vs. 65) including some inland colonies (e.g. Lake Melville, Labrador) (Figure 5B). The presence of this species at numerous colonies, combined with a propensity to forage in coastal and terrestrial zones (Figure 5B), made herring gulls ubiquitous throughout Atlantic Canada. However, regional hotspots were observed in the St. Lawrence estuary, the northern Gulf of St. Lawrence, the Gaspé Peninsula and northeastern New Brunswick, eastern Newfoundland, and the Bay of Fundy. As a short-range species, black guillemot were notably discrete in their occurrence, owing to their small foraging ranges, and concentrated at colonies primarily along the Labrador coastline in the northern portion of the study area (Figure 5C). Important concentrations of this species also occurred off the Gaspé Peninsula, Anticosti Island, and the Magdalen Islands. More localized and isolated breeding colonies occurred in the Grand Manan Archipelago and off the southwest coast of Nova Scotia. As a species that over the past 20 years is only known to have occurred at eight different colony sites, the northern gannet was particularly concentrated around the large colonies of Bonaventure and Bird Rock in the Gulf of St. Lawrence, and Cape St. Mary’s, Newfoundland (Figure 5D). Distribution maps of the other species are provided in the supplemental materials (Figure S2).
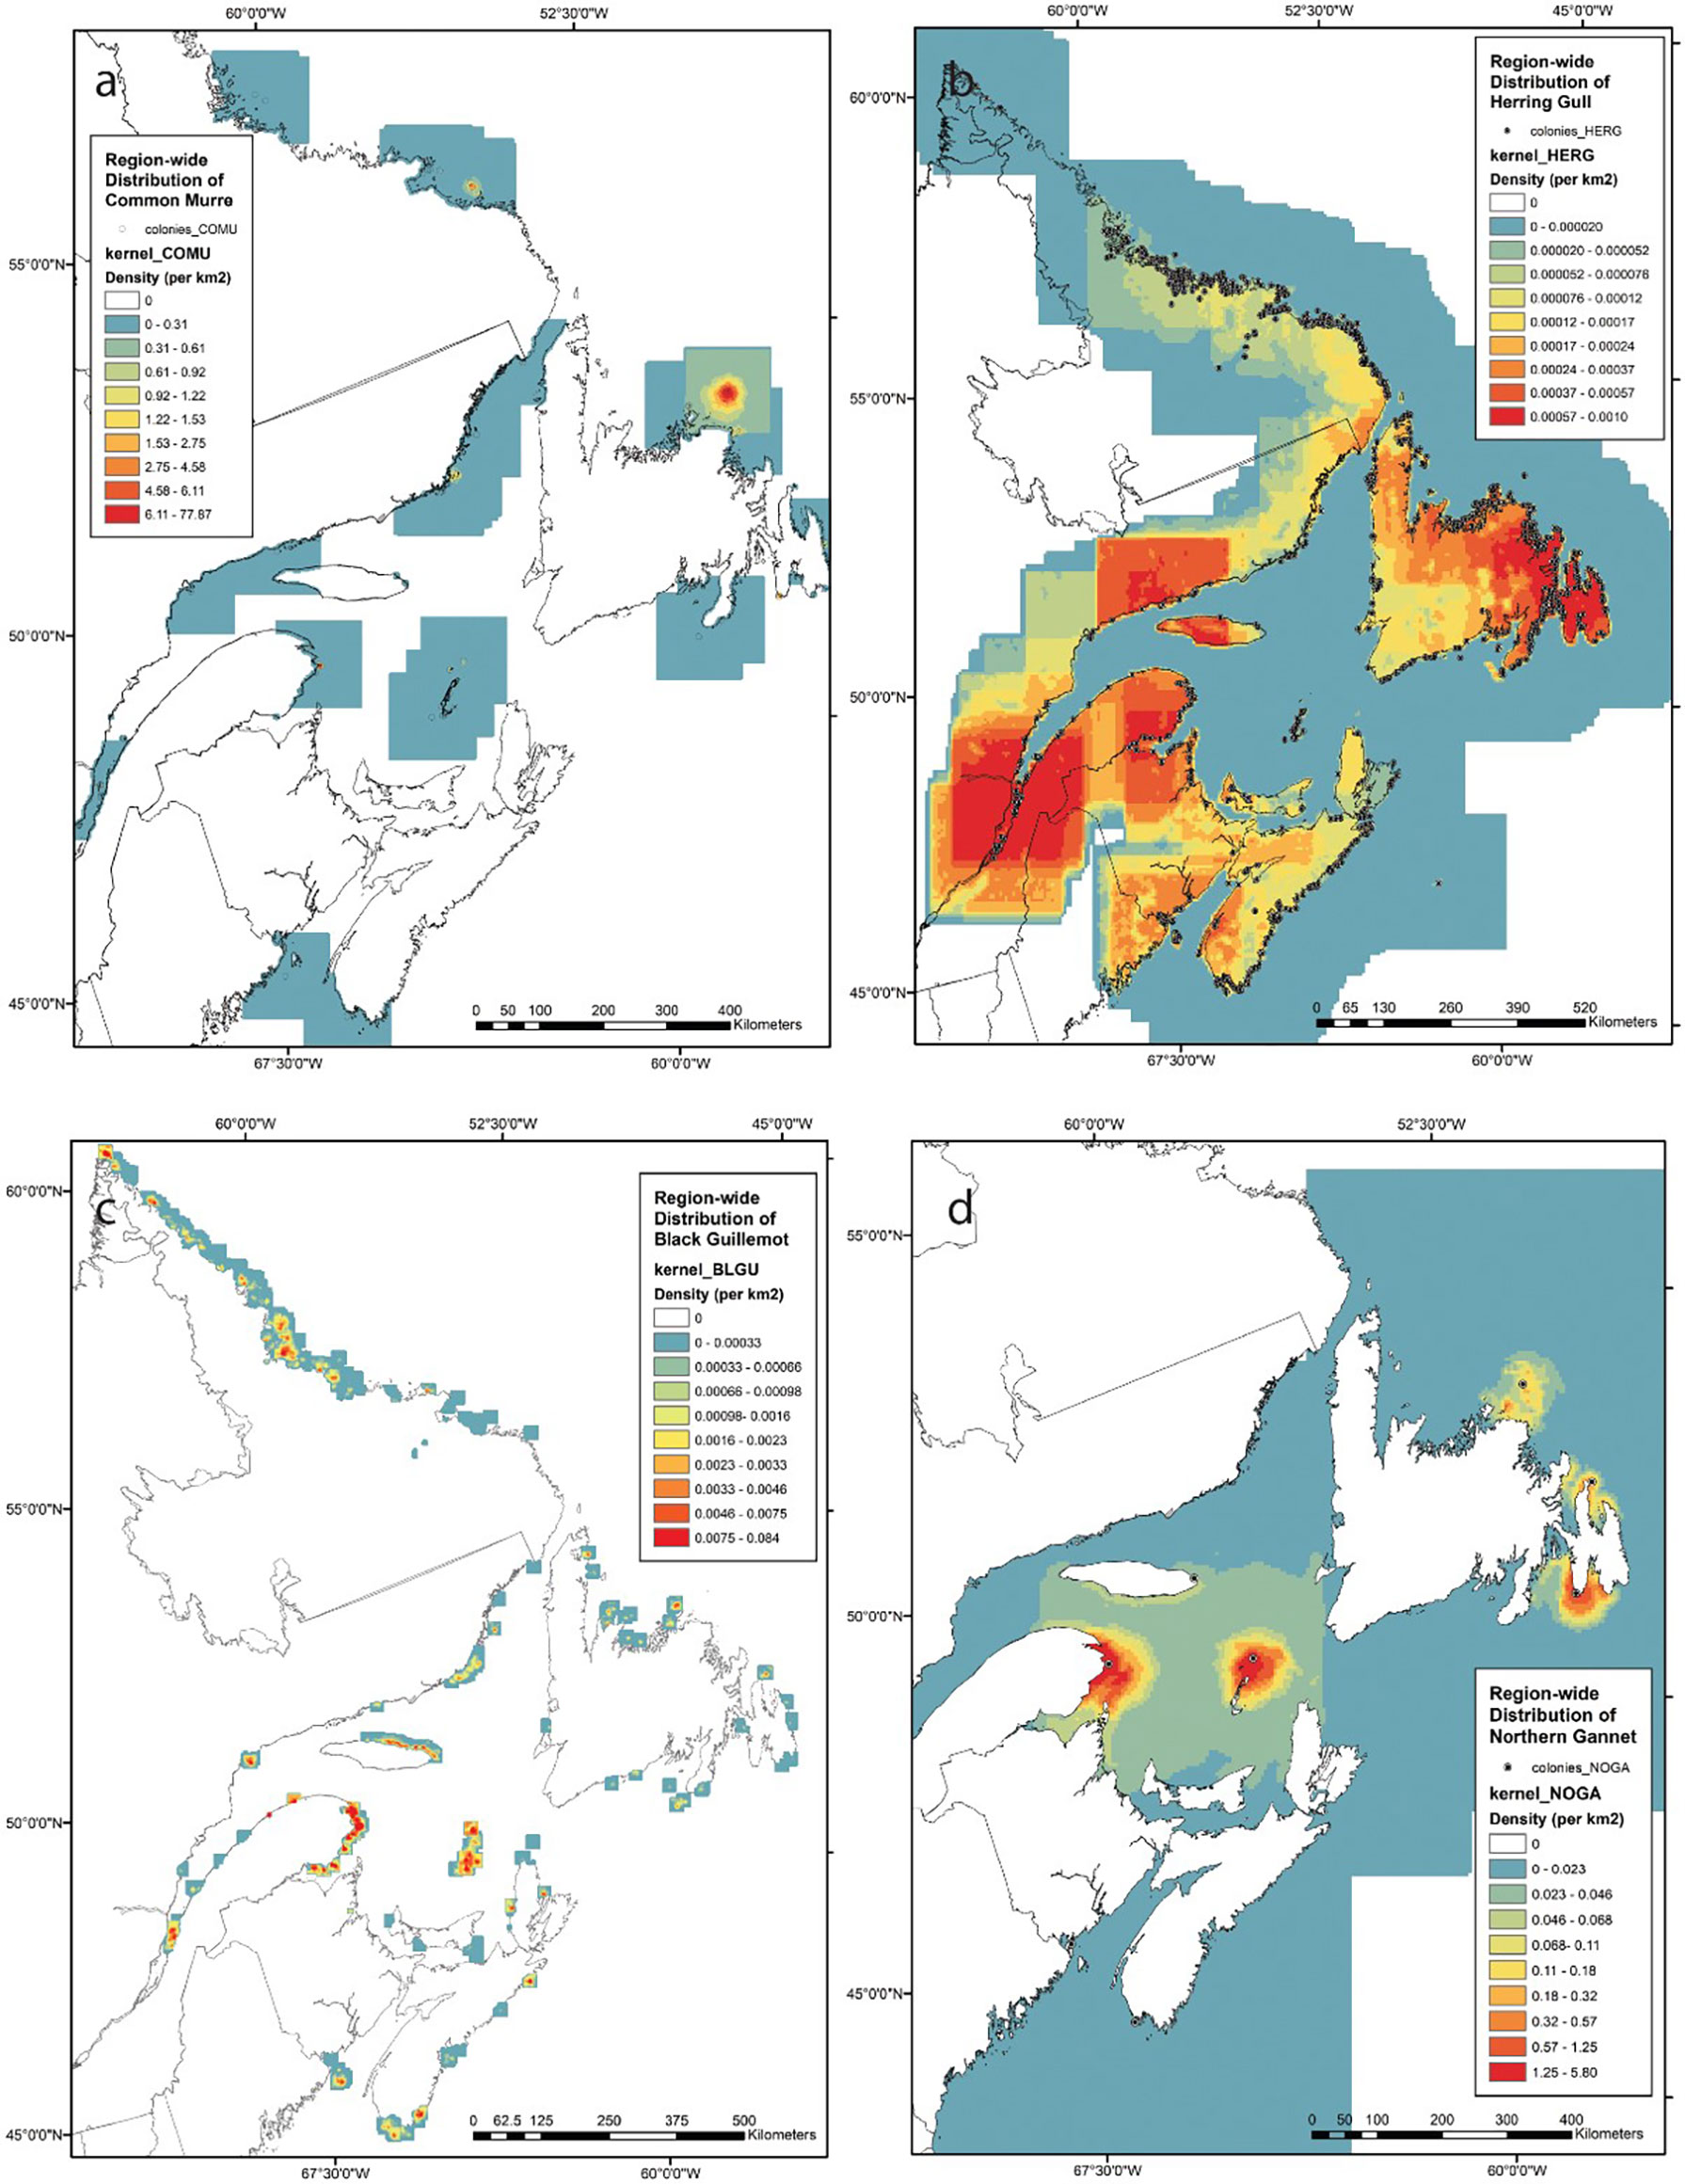
Figure 5 Predictive models of the region-wide distribution of seabird abundance around breeding colonies for (A) common murre (COMU), (B) herring gull (HERG), (C) black guillemot (BLGU), and (D) northern gannet (NOGA). See Supplemental Materials (Figure S2) for maps of other species. Boosted Regression Trees (BRT) were used to model the relative density of tracking locations for each species separately. BRT models were then used to predict abundance distribution, using maximum colony size (based on census data gathered between 1996 and 2016) for each colony, and a kernel smoother applied to estimate abundance distribution region-wide.
Discussion
Using tracking data and a predictive Boosted Regression Tree method, we were able to describe foraging distributions for the majority of seabirds and colonies in Atlantic Canada. Tracking data from 520 birds illustrated variability in foraging ranges among species and sites, but provided a robust dataset for modeling predictive distributions around colonies. Foraging ranges and distance to shoreline helped describe species distributions by guilds and highlight that space use is more nuanced than just “maximum foraging range” (Thaxter et al., 2012). Using predictive density surface modelling, we were able to map the spatial “footprint” of breeding seabirds among more than 5000 colonies distributed along more than 5000 km of shoreline, which enhances our toolkit and opportunities for conservation planning at a landscape scale, rather than the site-by-site approach typically viewed from individual tracking datasets.
Foraging Ranges
Foraging ranges have been proposed as a tool for preliminary assessment to help identify important areas for seabird conservation (BirdLife International, 2010; Thaxter et al., 2012; Oppel et al., 2018). Taken together, summary statistics (Table 3) and density plots (Figures 4 and S1) in this study suggest that use of absolute maximum foraging ranges for sites may dramatically over-estimate typical foraging ranges for any given species. This is consistent with Soanes et al. (2016) who recommended using mean values of all previously reported maxima, informed further by bathymetric data. Alternatively, our approach using predictive density surface modeling provides a realistic presentation of breeding seabird distribution which weights foraging ranges (up to a maximum) along with habitat constraints (such as distance to shorelines) in combination with colony sizes.
Not surprisingly, we observed large variability in foraging ranges of this diverse group of species. Nonetheless, the comparisons presented here provide useful metrics for conservation planning around seabird colonies in marine areas of Atlantic Canada. Moreover, similarities in ranges among species identify groupings that may simplify conservation planning, for example, when MPA boundaries or other conservation measures are to be established around mixed-species colonies (Oppel et al., 2018). This highlights the scales at which conservation measures should be considered from local scales of < 10 km for coastal terns, gulls, and eiders, to meso-scales up to 100 km for most alcids, and large scales of 100s of km for northern gannet and Leach’s storm-petrel. These scales are generally in agreement with previously reported foraging ranges for these species (Garthe et al., 2007; Thaxter et al., 2012; Pollet et al., 2014; Shoji et al., 2015; Soanes et al., 2016), with some exceptions (Table 6).
Within our study area, we documented considerable intraspecific variability in foraging ranges and distance from coastlines. Foraging effort and ranges may also be influenced by interspecific competition within colonies (Delord et al., 2020; Petalas et al., 2021) as well as density-dependent intraspecific competition and interference driven by colony size (Lewis et al., 2001; Grecian et al., 2012; Gaston et al., 2013; Jovani et al., 2016) and local prey abundance and/or prey condition (Burke and Montevecchi, 2009; Elliott et al., 2009). We were unable to formally test this with our data given the small number of tracked colonies for each species (in contrast to Wakefield et al., 2017). Intraspecific variability in foraging ranges can also be associated with prey-base differences and local foraging conditions, prey quality, and habitat characteristics, which may also vary from year-to-year (Burke and Montevecchi, 2009; Elliott et al., 2009). Additionally, there is a growing body of evidence that individual-level specialization may exist within seabird populations (Woo et al., 2008; Ceia and Ramos, 2015; Phillips et al., 2017; Maynard and Ronconi, 2018), further reinforcing the need for tracking data to include a large sample of individuals (Soanes et al., 2013; Lascelles et al., 2016). Given that some species in our study were tracked at only a few sites, a few individuals, and/or few years, considerations of data quality (Table 4) should be taken when interpreting results.
Predictive Models
Despite the widespread intraspecific variability in foraging ranges, it is not practical (logistically or financially) to track most species, or large numbers of individuals, from representative colonies across their range. Therefore, predictive distribution models are the most effective way to synthesize information from multiple telemetry studies to visualize the relative distribution of species over a wide area (e.g. Hindell et al., 2020). Furthermore, by incorporating location and census data from current as well as past colony sites, it becomes possible to not only delineate recent hotspots of occurrence, but also help to identify important breeding areas from the recent past. This is important for conservation planning of endangered species such as roseate tern, where knowledge of potentially suitable sites permit the identification of candidate locations for future colony re-establishment (Environment Canada, 2015).
To our knowledge, this study is the first attempt to model breeding seabird distributions for an entire community of species over such a wide area using a partially-historical collection of tracking data, though recent studies (Wakefield et al., 2017; Reisinger et al., 2018; Baylis et al., 2019; Hindell et al., 2020) have applied comparable modelling frameworks to synthesize broad-scale patterns in other contexts. Predictive models have tended to be constructed for single species, breeding at a few colonies (Grecian et al., 2012; Gaston et al., 2013), and some multi-species tracking assessments from single locations may not employ predictive modelling at all (e.g., Le Corre et al., 2012; Young et al., 2015; Requena et al., 2020). This study developed a method for modeling breeding season distributions which is: (1) applicable and comparable across species and guilds; (2) allows for broader-scale conservation assessment and supports more comprehensive priority setting; and (3) generates predictions for breeding seabirds that naturally supplements information obtained for non-breeding seabirds based on tracking (Grecian et al., 2016; Krüger et al., 2017) and at-sea survey data (Arcos et al., 2012; Wong et al., 2014). The main end product of this analytical approach was a series of large-area distribution maps.
A number of factors impinged upon the choice of analysis framework. First, there was a significant volume of data in need of processing (520 tagged individuals, yielding over 600,000 positions), which demanded a robust and flexible modelling approach. Second, the historical nature of the tracking data meant that positions had been gathered under different environmental conditions, using different protocols, and employing different types of transmitters, which resulted in variation in the quantity of information available for each species. Third, both tracking as well as colony census data were gathered over a wide time interval. The first two considerations were addressed through the use of a gridded analysis, which permitted calculation of relative densities, thereby providing a standardized way to assess distributions across species. Similarly Wakefield et al. (2017) used a gridded approach with location intensities, but modeled habitat associations with mixed-effects GLMs, possible because of the large number of locations for each tracked individual. Alternatives to analysis of gridded data (relative densities) is the use of simulated tracks which produce pseudo-absences, or areas where animals could have occupied (Hindell et al., 2020), but these required high quality tracking data which could be modeled/simulated, which was not always the case with our data (e.g. limited or infrequent time intervals to the data). With regards to the third consideration, the fact that colony sizes were defined as the maximum over a 20-year period meant that temporal variation was rolled into an aggregate summary. While this represented a loss in temporal detail, it allowed for a comprehensive summary of the biological importance of a very large number of widely-distributed breeding locations for each species. Furthermore, the results of the predictive modelling demonstrated that static variables (bathymetric and distance-based) were effective at capturing species-specific constraints on foraging range, while at the same time acting as proxies for conditions known to affect biological productivity (Mann and Lazier, 2006).
A key aspect of the methods for predictive modelling was the use of machine learning (ML), specifically BRTs. ML-based frameworks have previously been applied to model the distribution of coastal and pelagic seabirds (Yen et al., 2004; Oppel et al., 2012; Reisinger et al., 2018; Hindell et al., 2020), primarily because of their capacity to flexibly and robustly deal with the high variability typically observed in at-sea survey data. ML techniques are adept at handling “noisy” or missing data, i.e., data which do not meet the distributional assumptions of traditional statistical models. In the case of BRT models, non-linear responses are easily accommodated, and do not require a priori specification of a functional form of the predictors, which is particularly useful in ecological contexts when the correct functional form (e.g., increasing linear, exponential, unimodal) is not known or cannot be assumed in advance (De’ath and Fabricius, 2000; Hochachka et al., 2007). Furthermore, specification of deeper tree depths provides a way to capture complicated, multi-way interactions.
Predictive modeling provided several key findings with respect to the environmental predictor variables that influenced distributions of breeding seabirds in Atlantic Canada. First, distance from a breeding colony was one of the primary factors contributing to all species predictions, a result consistent with other central place foragers (Wakefield et al., 2017; Baylis et al., 2019). The exception was for common eiders where seafloor slope and distance to coastlines had greater influence on predictive distributions, likely because this species is not restricted to central place foraging once broods hatch and females disperse to rear chicks (Goudie et al., 2000). Likewise, distance from coastlines was an important predictor for other near-shore foragers such as herring gull and black guillemot, as well as northern gannet which is both a long-range and nearshore forager. Bathymetry, including depth, slope, and seafloor ruggedness, showed species-specific emphasis on predictions, similar to other predictive modeling studies of these species (Wakefield et al., 2017).
Data and Model Limitations
Though the resulting species distribution models from our study provide a comprehensive layer which may be used for various conservation planning initiatives (e.g., Lieske et al., 2020), these outputs warrant careful discussion about our assumptions and data limitations, which may lead to sources of error. Errors may arise from three sources including: 1) representativeness of tracking data; 2) accuracy and completeness of colony data; and 3) ability for machine-learning models to produce ecologically realistic predictive models.
Tracking data formed the foundation of our species distribution models with the assumption that patterns observed at one or more colonies may be representative of the species more generally. However, there is a wide body of literature suggesting that, in general, seabirds show intraspecific plasticity in foraging activities (e.g., Garthe et al., 2007; Gaston et al., 2013; Camprasse et al., 2017), likely to accommodate variability in food availability around colonies (Harding et al., 2013). As such, a large number of tracked individuals, across multiple years, may be required to properly define foraging areas at a given colony (Soanes et al., 2013; Lascelles et al., 2016; Wakefield et al., 2017). Some of the largest mean-squared prediction errors of our output models were observed for species that had few individuals tracked (e.g., black guillemot) or had less tracking data per individual (e.g., common eider, tern species). Lascelles et al. (2016) suggest that between 25 and 50 foraging trips are required within a group to be representative of a population, a target which was not met by several species in our study (black guillemot, tern species, common eider). Moreover, accuracy of different tracking devices may influence model outcomes (Quillfeldt et al., 2017); thus, problems of prediction error may have been exacerbated by use of lower-accuracy tracking data from satellite transmitters (e.g. common eider) and VHF tags (tern species), in contrast to species tracked by GPS tags. Therefore, variability in the quality and quantity of our tracking data may reduce reliability of distribution models for some species.
In addition to tracking data, species distribution models were built upon information on colony locations and population size, and consequently model outputs will be contingent on availability of complete and accurate census data. The colonial seabird monitoring program in Atlantic Canada spans more than four decades, and includes data on species which are surveyed on a three- to 10-year cycle (e.g. Wilhelm et al., 2016), others that are surveyed opportunistically at longer intervals (e.g. Wilhelm et al., 2015), as well as ad hoc inventory from other sources (e.g., Ronconi and Wong, 2003). Accuracy of population estimates can also vary depending on the survey methods (aerial estimates vs. ground counts). To buffer against this variability within the colony database, we invoked a decision to use the largest population size for each species and colony within the most recent 20 years. A qualitative assessment of the colony data highlights species that may be underrepresented in our models (Table 4). Specifically, species distribution models may be incomplete for black guillemot which are notoriously difficult to census because they breed in small and often widely dispersed colonies (Ronconi and Wong, 2003), as well as the common eider, which is more regularly assessed by winter aerial surveys than by breeding colony estimates (Bowman et al., 2015).Notwithstanding the issues identified with respect to tracking and colony input data, other aspects of predictive modeling can generate additional variation in outputs. Models were based on distance from colonies, distance to coastlines, and other static environmental predictors associated with bathymetry. Soanes et al. (2016), for example, demonstrated that bathymetric constraints can help refine foraging ranges derived from a maximum radius approach. Alternatively, additional environmental covariates, such as dynamic oceanographic variables, may improve predictability of models, at a cost of increased complexity (Wakefield et al., 2017; Baylis et al., 2019). Though dynamic, local-scale environmental factors could more accurately depict distributions at the site (colony) level, this omission was deliberate and necessary to achieve our objectives of broad-scale mapping, particularly considering limited tracking data for some species. Moreover, even when dynamic oceanographic variables are included in predictive models, distance from a colony may still be among the strongest predictors for breeding seabirds as central place foragers (Baylis et al., 2019). We suggest that our current models provide robust distribution mapping for broad-scale assessment and conservation planning initiatives (Lieske et al., 2020). However, further refinement of these models is required for local, site-level, conservation and management action (e.g. delineating MPA boundaries; Lascelles et al., 2012).
Conservation Implications
Ultimately, describing species-specific seabird distribution across a wide geographic range is beneficial for conservation planning in expanding how we think about protecting seabird habitat. Globally, there are ~ 1,600 seabird colonies designated as Important Bird Areas (IBAs, www.birdlife.org), yet these sites generally represent land-based breeding sites, sometimes including seaward boundaries associated with foraging areas that are crucial to breeding seabirds. Conservation managers should also be interested in applying conservation action to the marine areas surrounding these sites, and therefore, management and conservation actions around these sites will require practical designation of foraging areas, ideally using tracking data to identify local differences in foraging range, strategies, and habitat preferences (Oppel et al., 2018; Requena et al., 2020). Given that it is unrealistic and impractical that all birds from IBAs (or other key colonies) be tracked, the predictive modelling approach is a constructive solution.
Identifying MPAs is a key part of the Convention on Biological Diversity, which had a target of 10% marine protection by 2020 (CBD, Convention on Biological Diversity 2010), and calls for new targets for 30% marine protection by 2030 (www.campaignfornature.org). However, the ephemeral and dynamic nature of the ocean and its wildlife present obvious difficulties for creating static protected boundaries (Hyrenback et al., 2000). Inter-annual changes in behaviour or prey distribution may cause seabirds to react differently across years (e.g., northern gannet: Garthe et al., 2011; Warwick-Evans et al., 2016), potentially foraging in different locations and at different scales (e.g., if the colony grows larger). However, evidence suggests that reducing near-colony competition for forage fish, through no-take fishing zones, improves foraging efficiency (and also reduces bycatch risk) of birds living at that colony and is likely to encourage them to forage nearer home, within protected marine zones (Pichegru et al., 2012; Sydeman et al., 2021). Despite extensive mobility and variation among seabird species, MPAs with discrete boundaries around key seabird colonies can still provide foraging habitat protection for seabird species despite the patchy nature of ocean environments (Young et al., 2015). However, MPAs are just one tool for marine biodiversity conservation, and long-distance foraging ranges of some seabirds argue for greater, and perhaps increasingly innovative, ocean management beyond MPA or jurisdictional boundaries (Yorio, 2009; Lascelles et al., 2016; Oppel et al., 2018; Beale et al., 2021). Understanding seabird distributions across a wider geographic region can help frame conservation objectives and put marine spatial planning into perspective.
In summary, the analysis framework employed in this study is an approach for synthesizing empirically-derived distributional information (based on individual tracking and colony survey data), for a diverse community of organisms, to visualize spatial patterns of occurrence for a large region. By highlighting core areas of breeding activity for each of the species, planners and decision makers will now have access to a comprehensive set of tools to better understand where marine birds are actually concentrated in Atlantic Canada. Such information not only offers a way to identify gaps in protection, but can also be used to assess the potential for negative interactions with particular types of human activity (Lieske et al., 2020). This provides a landscape scale approach towards conservation planning, which can then be supplemented by region- or site-specific studies, with more precise tracking devices and fine-scale modeling, to developed more accurate and targeted conservation strategies.
Data Availability Statement
The datasets presented in this study can be found in online repositories. The names of the repository/repositories and accession number(s) can be found below: https://zenodo.org/record/3631468#.YrIZsnbMLcs.
Ethics Statement
The animal study was reviewed and approved by various institutional Animal Care Committees, which are detailed in the original publications of the tracking data (references in Table 2).
Author Contributions
RR, DL, LM, and SA contributed to the conception and design of the study. RR and DL organized the data and performed the analysis. RR wrote the first draft of the manuscript. DL wrote sections of the manuscript. KA, BA, AB, FB, GD, AD, DF, SG, CG, AH, MM, RM, JM, WM, ILP, IP, J-FR, PR, GR, JR, LS, KS, DS, SS, PT, and SW contributed tracking and colony data. All authors contributed to the manuscript revision and approved the submitted version.
Funding
This study was funded by Environment and Climate Change Canada through the Atlantic Ecosystems Initiative (grant GCXE16R138 awarded to Birds Canada), as well as the New Brunswick Wildlife Trust Fund and the Nova Scotia Habitat Conservation Fund.
Conflict of Interest
The authors declare that the research was conducted in the absence of any commercial or financial relationships that could be construed as a potential conflict of interest.
Publisher’s Note
All claims expressed in this article are solely those of the authors and do not necessarily represent those of their affiliated organizations, or those of the publisher, the editors and the reviewers. Any product that may be evaluated in this article, or claim that may be made by its manufacturer, is not guaranteed or endorsed by the publisher.
Acknowledgments
Additional financial and/or logistical support was provided by Mount Allison University (Geospatial Modeling Lab), Birds Canada, and Environment and Climate Change Canada’s Canadian Wildlife Service. The vast amount of tracking data compiled for this study was the result of numerous grants to the co-authors of this manuscript, details of which can be found in previous publications cited herein.
Supplementary Material
The Supplementary Material for this article can be found online at: https://www.frontiersin.org/articles/10.3389/fmars.2022.816794/full#supplementary-material
References
Anderson C. M., Gilchrist H. G., Ronconi R. A., Shlepr K. R., Clark D. E., Weseloh D. V. C., et al. (2019). Winter Home Range and Habitat Selection Differs Among Breeding Populations of Herring Gulls in Eastern North America. Movement Ecol. 7, 8. doi: 10.1186/s40462-019-0152-x
Arcos J. M., Bécares J., Villero D., Brotons L., Rodriguez B., Ruiz A. (2012). Assessing the Location and Stability of Foraging Hotspots for Pelagic Seabirds: An Approach to Identify Marine Important Bird Areas (IBAs) in Spain. Biol. Conserv. 156, 30–42. doi: 10.1016/j.biocon.2011.12.011
Augé A. A., Dias M. P., Lascelles B., Baylis A. M. M., Black A., Boersma P. D., et al. (2018). Framework for Mapping Key Areas for Marine Megafauna to Inform Marine Spatial Planning in the Falkland Islands: A Case Study. Mar. Policy 92, 61–72. doi: 10.1016/j.marpol.2018.02.017
Ban N. C., Alidina H. M., Ardron J. A. (2010). Cumulative Impact Mapping: Advances, Relevance and Limitations to Marine Management and Conservation, Using Canada’s Pacific Waters as a Case Study. Mar. Policy 34, 876–886. doi: 10.1016/j.marpol.2010.01.010
Baylis A.M.M, Tierney M., Orben R.A., Warwik-Evans V., Wakefield E., Grecian W.J.., . (2019). Important at-Sea Areas of Colonial Breeding Marine Predators on the Southern Patagonian Shelf. Sci. Rep. 9, 8517. doi: 10.1038/s41598-019-44695-1
Beale M., Dias M., Phillips R., Oppel S., Haszin C., Pearmain E., et al. (2021). Global Political Responsibility for the Conservation of Albatrosses and Large Petrels. Sci. Adv. 7 (10), 2375–2548. doi: 10.1126/sciadv.abd7225
BirdLife International (2010). Marine Important Bird Areas Toolkit: Standardized Techniques for Identifying Priority Sites for the Conservation of Seabirds at Sea (Cambridge, UK: BirdLife International).
Birt V. L., Birt T. P., Goulet D., Cairns D. K., Montevecchi W. A. (1987) Ashmole’s halo: direct evidence for prey depletion by a seabird. Marine Ecology Progress Series. 40, 205–208.
Bivand R., Keitt T., Rowlingson B. (2013). Rgdal: Bindings for the Geospatial Data Abstraction Library ( R package version 0.8–11). Available at: https://cran.r-project.org/package=rgdal.
Bivand R., Rundel C. (2013). Rgeos: Interface to Geometry Engine - Open Source (GEOS) ( R package version 0.3-2). Available at: https://cran.r-project.org/package=rgeos.
Black A. L. (2006). Foraging Area Characteristics of Arctic Terns (Sterna Paradisaea) and Common Terns (Sterna Hirundo) Breeding on Machias Seal Island. MSc Thesis Vol. 97 (Fredericton, NB, Canada: University of New Brunswick).
Bost C. A., Cotte C., Bailleul F., Cherel Y., Charrassin J. B., Guinet C., et al. (2009). The Importance of Oceanographic Fronts to Marine Birds and Mammals of the Southern Oceans. J. Mar. Syst. 78, 363–376. doi: 10.1016/j.jmarsys.2008.11.022
Bowman T. D., Silverman E. D., Gilliland S. G., Leirness J. B. (2015). “Status and Trends of North American Sea Ducks: Reinforcing the Need for Better Monitoring,” in Ecology and Conservation of North American Sea Ducks. Studies in Avian Biology. Eds. Savard J.-P. L., Derksen D. V., Esler D., Eadie J. M. (New York, NY: Vol. 46), CRC Press), 1–27.
Burke C. M., Montevecchi W. A. (2009). The Foraging Decisions of a Central Place Foraging Seabird in Response to Fluctuations in Local Prey Conditions. J. Zool. 278, 354–361. doi: 10.1111/j.1469-7998.2009.00584.x
Camprasse E. C., Cherel Y., Bustamante P., Arnould J. P., Bost C. A. (2017). Intra- and Inter-Individual Variation in the Foraging Ecology of a Generalist Subantarctic Seabird, the Gentoo Penguin. Mar. Ecol. Prog. Ser. 578, 227–242. doi: 10.3354/meps12151
CBD (Convention on Biological Diversity) (2010) COP10 Decision X2, Target 11. Available at: https://www.cbd.int/decision/cop/?id=12268.
Ceia F. R., Ramos J. A. (2015). Individual Specialization in the Foraging and Feeding Strategies of Seabirds: A Review. Mar. Biol. 162, 1923–1938. doi: 10.1007/s00227-015-2735-4
Cleasby I. R., Owen E., Wilson L., Wakefield E. D., O’Connell P., Bolton M. (2020). Identifying Important at-Sea Areas for Seabirds Using Distribution Models and Hotspot Mapping. Biol. Conserv. 241, 108375. doi: 10.1016/j.biocon.2019.108375
Cury P. M., Boyd I. L., Bonhommeau S., Anker-Nilssen T., Crawford R. J. M., Furness R. W., et al. (2011). Global Seabird Response to Forage Fish Depletion—One-Third for the Birds. Science 334, 1703. doi: 10.1126/science.1212928
Davies T.E., Carneiro A.P.B., Tarzia M., Wakefield E., Hennicke J.C., Frederiksen M. (2021). Multispecies Tracking Reveals a Major Seabird Hotspot in the North Atlantic. Conserv. Lett. 14, e12824. doi :10.1111/conl.12824
De’ath G., Fabricius K. E. (2000). Classification and Regression Trees: A Powerful Yet Simple Technique for Ecological Data Analysis. Ecology 81, 3178–3192. doi: 10.1890/0012-9658(2000)081[3178:CARTAP]2.0.CO;2
Delord K., Barbraud C., Pinaud D., Letournel B., Jaugeon B., Goraguer H., et al. (2020). Movements of Three Alcid Species Breeding Sympatrically in Saint Pierre and Miquelon, Northwestern Atlantic Ocean. J. Ornithol. 161 (2), 359–371. doi: 10.1007/s10336-019-01725-z
Duong T. (2017). Available at: http://www.mvstat.net/tduong.
Elith J., Leathwick J. R., Hastie T. (2008). A Working Guide to Boosted Regression Trees. J. Anim. Ecol. 77, 802–813. doi: 10.1111/j.1365-2656.2008.01390.x
Elliott K. H., Woo K. J., Gaston A. J., Benvenuti S., Dall’Antonia L., Davoren G. K. (2009). Central-Place Foraging in an Arctic Seabird Provides Evidence for Storer-Ashmole’s Halo. Auk 126, 613–625. doi: 10.1525/auk.2009.08245
Environment Canada. 2015. Action Plan for the Roseate Tern (Sterna dougallii) in Canada. Species at Risk Act Action Plan Series. Environment Canada, Ottawa. iv + 13 pp. https://www.canada.ca/en/environment-climate-change/services/species-risk-public-registry/action-plans/roseate-tern-2015.html
Freitas C. (2012). Argosfilter: Argos Locations Filter (R package version 0.63). Available at: https://CRAN.R-project.org/package=argosfilter.
Friedman J. H. (2001). Greedy Function Approximation: A Gradient Boosting Machine. Ann. Stat 29, 1189–1232. doi: 10.1214/aos/1013203451
Garthe S., Montevecchi W. A., Chapdelaine G., Rail J.-F., Hedd A. (2007). Contrasting Foraging Tactics by Northern Gannet (Sula Bassana) Breeding in Different Oceanographic Domains With Different Prey Fields. Mar. Biol. 151, 687–694. doi:10.1007/s00227-006-0523-x
Garthe S., Montevecchi W. A., Davoren G. K. (2011). Changes in Prey Fields Trigger Different Foraging Tactics in a Large Central-Place Foraging Marine Predator. Limnology Oceanography 56, 802–812. doi:10.4319/lo.2011.56.3.0802
Gaston A. J., Elliott K. H., Ropert-Coudert Y., Kato A., Macdonald C. A., Mallory M. L., et al. (2013). Modeling Foraging Range for Breeding Colonies of Thick-Billed Murres Uria Lomvia in the Eastern Canadian Arctic and Potential Overlap With Industrial Development. Biol. Conserv. 168, 134–143. doi: 10.1016/j.biocon.2013.09.018
Goudie R. I., Robertson G. J., Reed A. (2000). Common Eider (Somateria Mollissima), The Birds of North America. Ed. Rodewald P. G. (Ithaca: Cornell Lab of Ornithology).
Grecian W. J., Witt M. J., Attrill M. J., Bearhop S., Becker P. H., Egevang C., et al. (2016). Seabird Diversity Hotspot Linked to Ocean Productivity in the Canary Current Large Marine Ecosystem. Biol. Lett. 12, 20160024. doi: 10.1098/rsbl.2016.0024
Grecian W. J., Witt M. J., Attrill M. J., Bearhop S., Godley B. J., Grémillet D., et al. (2012). A Novel Projection Technique to Identify Important at-Sea Areas for Seabird Conservation: An Example Using Northern Gannets Breeding in the North East Atlantic. Biol. Conserv. 156, 43–52. doi: 10.1016/j.biocon.2011.12.010
Gulka J., Ronconi R. A., Davoren G. K. (2019). Spatial Segregation Contrasting Dietary Overlap: Niche Partitioning of Two Sympatric Alcids During Shifting Resource Availability. Mar. Biol. 166, 115. doi: 10.1007/s00227-019-3553-x
Halpern B. S., McLeod K. L., Rosenberg A. A., Crowder L. B. (2008). Managing for Cumulative Impacts in Ecosystem-Based Management Through Ocean Zoning. Ocean Coast. Manage. 51, 201–211. doi: 10.1016/j.ocecoaman.2007.08.002
Harding A., Paredes R., Suryan R., Roby D., Irons D., Orben R., et al. (2013). Does Location Really Matter? An Inter-Colony Comparison of Seabirds Breeding at Varying Distances From Productive Oceanographic Features in the Bering Sea. Deep-Sea Res. Part II: Topical Stud. Oceanogr. 94, 178–191. doi: 10.1016/j.dsr2.2013.03.013
Harrell F. E. (2001). Regression Modeling Strategies: With Applications to Linear Models, Logistic Regression, and Survival Analysis (New York: Springer).
Hastie T., Tibshirani R., Friedman J. (2001). The Elements of Statistical Learning: Data Mining, Inference, and Prediction (New York: Springer).
Hazen E. L., Abrahms B., Brodie S., Carroll G., Jacox M. G., Savoca M. S., et al. (2019). Marine Top Predators as Climate and Ecosystem Centinels. Front. Ecol. Environ. 17, 565–574. doi: 10.1002/fee.2125
Hedd A., Pollet I. L., Mauck R. A., Burke C. M., Mallory M. L., McFarlane Tranquilla L. A., et al. (2018). Foraging Areas, Offshore Habitat Use and Colony Segregation by Incubating Leach’s Storm-Petrels in the Northwest Atlantic. PLoS ONE13(5):e0194389. doi: 10.1371/journal.pone.0194389
Hijmans R. J. (2014). Geosphere: Spherical Trigonometry ( R package version 1.3-8). Available at: https://cran.r-project.org/package=geosphere.
Hindell M. A., Reisinger R. R., Ropert-Coudert Y., Hückstädt L. A., Trathan P. N., Bornemann H., et al. (2020). Tracking of Marine Predators to Protect Southern Ocean Ecosystems. Nature 580 (7801), 87–92. doi: 10.1038/s41586-020-2126-y
Hochachka W. M., Caruana R., Fink D., Munson A., Riedewald M., Sorokina D., et al. (2007). Data-Mining Discovery of Pattern and Process in Ecological Systems. J. Wildlife Manage. 71, 2427–2437. doi: 10.2193/2006-503
Hooker S. K., Gerber L. R. (2004). Marine Reserves as a Tool for Ecosystem-Based Management: The Potential Importance of Megafauna. Bioscience 54, 27–39. doi: 10.1641/0006-3568(2004)054[0027:MRAATF]2.0.CO;2
Houston A. I., McNamara J. M. (1985). A General Theory of Central Place Foraging for Single-Prey Loaders. Theor. Popul. Biol. 28, 233–262. doi: 10.1016/0040-5809(85)90029-2
Hyrenback K. D., Forney K. A., Dayton P. K. (2000). Marine Protected Areas and Ocean Basin Management. Aquat. Conservation: Mar. Freshw. Ecosyst. 10, 437–458. doi: 10.1002/1099-0755(200011/12)10:6%3C437::AID-AQC425%3E3.0.CO;2-Q
James G., Witten D., Hastie T., Tibshirani R. (2013). An Introduction to Statistical Learning (New York: R. Springer).
Jonsen I. D., Flemming J., Myers R. A. (2005). Robust Statespace Modeling of Animal Movement Data. Ecology 86, 2874–2880. doi : 10.1890/04-1852
Jovani R., Lascelles B., Garamszegi L. Z., Mavor R., Thaxter C. G., Oro D. (2016). Colony Size and Foraging Range in Seabirds. Oikos 125, 968–974. doi: 10.1111/oik.02781
Justice A. C., Covinsky K. E., Berlin J. A. (1999). Assessing the Generalizability of Prognostic Information. Ann. Internal Med. 130, 515–524. doi: 10.7326/0003-4819-130-6-199903160-00016
Krüger L., Ramos J. A., Xavier J. C., Grémillet D., González-Solís J., Kolbeinsson Y., et al. (2017). Identification of Candidate Pelagic Marine Protected Areas Through a Seabird Seasonal-, Multispecific- and Extinction Risk-Based Approach. Anim. Conserv. 20, 409–424. doi: 10.1111/acv.12339
Lascelles B. G., Langham G. M., Ronconi R. A., Reid J. B. (2012) From hotspots to site protection: Identifying Marine Protected Areas for seabirds around the globe. Biological Conservation 156 : 5-14 https://doi.org/10.1016/j.biocon.2011.12.008.
Lascelles B. G., Taylor P. R., Miller M. G. R., Dias M. P., Oppel S., Torres L., et al. (2016). Applying Global Criteria to Tracking Data to Define Important Areas for Marine Conservation. Diversity Distributions 22, 422–431. doi: 10.1111/ddi.12411
Le Corre M., Jaeger A., Pinet P., Kappes M. A., Weimerskirch H., Catry T., et al. (2012). Tracking Seabirds to Identify Potential Marine Protected Areas in the Tropical Western Indian Ocean. Biol. Conserv. 156, 83–93. doi: 10.1016/j.biocon.2011.11.015
Lewis S., Sherratt T. N., Hamer K. C., Wanless S. (2001). Evidence of Intra-Specific Competition for Food in a Pelagic Seabird. Nature 412, 816–819. doi: 10.1038/35090566
Lieske D. J., McFarlane Tranquilla L., Ronconi R. A., Abbott S. (2019). Synthesizing Expert Opinion to Assess the at-Sea Risks to Seabirds in the Western North Atlantic. Biol. Conserv. 233, 41–50. doi: 10.1016/j.biocon.2019.02.026
Lieske D. J., McFarlane Tranquilla L., Ronconi R. A., Abbott S. (2020). Seas of Risk: Assessing the Threats to Colonial Nesting Seabirds in Eastern Canada. Mar. Policy 115, 103863. doi: 10.1016/j.marpol.2020.103863
Lieske D. J., Schmid M. S., Mahoney M. (2018). “Ensembles of Ensembles: Combining the Predictions From Multiple Machine Learning Methods,” in Machine Learning for Ecology and Sustainable Natural Resource Management. Eds. Humphries H., Magness D., Huettmann F. (Cham: Springer), 109–121.
Mallory M. L., Ronconi R. A., Allen R. B., Dwyer C., Lair S., Mallory C. D., et al. (2020). Annual Movement Patterns of American Common Eiders (Somateria Molllissima Dresseri). Wildlife Biol. 2020(2): 1–10. wlb.00665. doi: 10.2081/wlb.00665
Mann K. H., Lazier J. R. N. (2006). Dynamics of Marine Ecosystems: Biological-Physical Interactions in the Oceans (Blackwell Publishing).
Masden E. (2012) Project Report SG20: Assessing the Potential Impacts of Marine Renewable Energy Developments on Black Guillemots in the Pentland Firth ( Report to the Marine Alliance for Science and Technology for Scotland). Available at: http://www.masts.ac.uk/media/4462/sg20_sgs_final_report_-_masden.pdf (Accessed 08-Sep-2017).
Maynard L. D., Ronconi R. A. (2018). Foraging Behaviour of Great Black-Backed Gulls Larus Marinus Near and Urban Centre in Atlantic Canada: Evidence of Individual Specialization From GPS Tracking. Mar. Ornithol. 46, 27–32.
Montevecchi W. A., Hedd A., McFarlane Tranquilla L., Fifield D. A., Burke C. M., Regular P. M., et al. (2012). Tracking Seabirds to Identify Ecologically Important and High Risk Marine Areas. Biol. Conserv. 156, 62–71. doi: 10.1016/j.biocon.2011.12.001
Nicholls D. G., Robertson C. J. R., Murray M. S. (2007). Measuring Accuracy and Precision for CLS:Argos Satellite Telemetry Locations. Notornis 54, 137–157.
O’Brien A. H., Webb A., Brewer M. J., Reid J. B. (2012). Use of Kernel Density Estimation and Maximum Curvature to Set Marine Protected Area Boundaries: Identifying a Special Protection Area for Wintering Red-Throated Divers in the UK. Biol. Conserv. 156, 15–21. doi: 10.1016/j.biocon.2011.12.033
Oppel S., Bolton M., Carneiro A. P. B., Dias M. P., Green J. A., Masello J. F., et al. (2018). Spatial Scales of Marine Conservation Management for Breeding Seabirds. Mar. Policy 98, 37–46. doi: 10.1016/j.biocon.2011.11.013
Oppel S., Meirinho A., Ramirez I., Gardner B., O’Connell A. F., Miller P. I., et al. (2012). Comparison of Five Modelling Techniques to Predict the Spatial Distribution and Abundance of Seabirds. Biol. Conserv. 156, 94–104.
Orians G. H., Pearson N. E. (1979). “On the Theory of Central Place Foraging,” in Analyses of Ecological Systems. Eds. Horn D. J., Mitchell R. D., Stairs G. R. (Ohio, USA: Ohio State University Press), 154–177.
Paredes R., Jones I. L., Boness D. J. (2005). Reduced Parental Care, Compensatory Behaviour and Reproductive Costs of Thick-Billed Murres Equipped With Data Loggers. Anim. Behav. 69, 197–208. doi: 10.1016/j.anbehav.2003.12.029
Petalas C., Lazarus T., Lavoie R. A., Elliott K. H., Guigueno M. F. (2021). Foraging Niche Partitioning in Sympatric Seabird Populations. Sci. Rep. 11 (1), 1–12. doi: 10.1038/s41598-021-81583-z
Phillips R. A., Silk J. R. D.,, Croxall J. P., Afanasyev V., Briggs D. R. (2004) Accuracy of geolocation estimates for flying seabirds. Marine Ecology Progress Series266: 265–272. https://www.int-res.com/abstracts/meps/v266/p265-272/
Phillips R. A., Lewis S., González-Solís J., Daunt F. (2017). Causes and Consequences of Individual Variability and Specialization in Foraging and Migration Strategies of Seabirds. Mar. Ecol. Prog. Ser. 578, 117–150. doi: 10.3354/meps12217
Piatt I. J. F., Sydeman W. J., Wiesse F. (2007). Introduction: A Modern Role of Seabirds as Indicators. Mar. Ecol. Prog. Ser. 352, 199–204. doi: 10.3354/meps07070
Pichegru L., Ryan P. G., van Eeden R., Reid T., Grémillet D., Wanless R. (2012). Industrial Fishing, No-Take Zones and Endangered Penguins. Biol. Conserv. 156, 117–125. doi: 10.1016/j.biocon.2011.12.013
Pollet I. L., Ronconi R. A., Jonsen I. D., Leonard M. K., Taylor P. D., Shutler D. (2014). Foraging Movements of Leach’s Storm-Petrels Oceanodroma Leucorhoa During Incubation. J. Avian Biol. 45, 305–314. doi: 10.1111/jav.00361
Pratte I., Robertson G. J., Mallory M. L. (2017). Four Sympatrically Nesting Auks Show Clear Resource Segregation in Their Foraging Environment. Mar. Ecol. Prog. Ser. 572, 243–254. doi: 10.3354/meps12144
Pratte I., Ronconi R. A., Craik S. R., McKnight J. (2021). Spatial Ecology of Endangered Roseate Terns and Foraging Habitat Suitability Around a Colony in the Western North Atlantic. Endangered Species Res. 44, 339–350. doi: 10.3354/esr01108
Quillfeldt P., Engler J. O., Silk J. R. D., Phillips R. A. (2017). Influence of Device Accuracy and Choice of Algorithm for Species Distribution Modelling of Seabirds: A Case Study Using Black-Browed Albatrosses. J. Avian Biol. 48: 1549–1555. doi: 10.1111/jav.01238
Randin C. F., Dimbock C., Dullinger S., Zimmermann N. E., Zappa M., Guisan A. (2006). Are Niche-Based Species Distribution Models Transferable in Space? J. Biogeogr. 33, 1689–1703. doi: 10.1111/j.1365-2699.2006.01466.x
Regular P. M., Hedd A., Montevecchi W. A. (2013). Must Marine Predators Always Follow Scaling Laws? Memory Guides the Foraging Decisions of a Pursuit-Diving Seabird. Anim. Behav. 86, 545–552. doi: 10.1016/j.anbehav.2013.06.008
Reisinger R. R., Raymond B., Hindell M. A., Bester M. N., Crawford R. J. M., Davies D., et al. (2018). Habitat Modelling of Tracking Data From Multiple Marine Predators Identifies Important Areas in the Southern Indian Ocean. Diversity Distributions 24, 535–550. doi: 10.1111/ddi.12702
Requena S., Oppel S., Bond A. L., Hall J., Cleeland J., Crawford R. J. M., et al. (2020). Marine Hotspots of Activity Inform Protection of a Threatened Community of Pelagic Species in a Large Oceanic Jurisdiction. Anim. Conserv. 23: 585–596. doi: 10.1111/acv.12572
Ridgeway G. (2012) Generalized Boosted Models: A Guide to the Gbm Package. Available at: http://gradientboostedmodels.googlecode.com/git/gbm/inst/doc/gbm.pdf.
Rock J. C., Leonard M. L., Boyne A. W. (2007a). Do Co-Nesting Arctic and Common Terns Partition Foraging Habitat and Chick Diets? Waterbirds 30, 579–587. doi: 10.1675/1524-4695(2007)030[0579:DCAACT]2.0.CO;2
Rock J. C., Leonard M. L., Boyne A. W. (2007b). Foraging Habitat and Chick Diets of Roseate Tern, Sterna Dougallii, Breeding on Country Island, Nova Scotia. Avian Conserv. Ecol. 2, 4. doi: 10.5751/ACE-00126-020104
Ronconi R. A., Wong S. N. P. (2003). Estimates of Changes in Seabird Numbers in the Grand Manan Archipelago, New Brunswick, Canada. Waterbirds 26, 462–472. doi: 10.1675/1524-4695(2003)026[0462:EOCISN]2.0.CO;2
Ronconi R. A., Lascelles B. G., Langham G. M., Reid J. B., Oro D. (2012) The role of seabirds in Marine Protected Area identification, delineation, and monitoring: Introduction and synthesis. Biological Conservation 156, 1–4. https://doi.org/10.1016/j.biocon.2012.02.016.
Seward A., Taylor R. C., Perrow M. R., Berridge R. J., Bowgen K. M., Dodd S., et al. (2021). Effect of GPS Tagging on Behaviour and Marine Distribution of Breeding Arctic Terns Sterna Paradisaea. Ibis 163, 197–212. doi: 10.1111/ibi.12849
Shlepr K. R., Ronconi R. A., Hayden B., Allard K. A., Diamond A. W. (2021). Estimating the Relative Use of Anthropogenic Resources by Herring Gull (Larus Argentatus) in the Bay of Fundy, Canada. Avian Conserv. Ecol. 16 (1), 2. doi: 10.5751/ACE-01739-160102
Shoji A., Elliott K. H., Greenwood J. G., McClean L., Leonard K., Perrins C. M., et al. (2015). Diving Behaviour of Benthic Feeding Black Guillemots. Bird Study 62, 217–222. doi: 10.1080/00063657.2015.1017800
Smith C. D., Manson G. K., James T. L., Lemmen D. S., Couture N. J., Forbes D. L., et al. (2013) CanCoast: A National-Scale Framework for Characterizing Canada’s Marine Coasts. Available at: http://dusk.geo.orst.edu/ICAN_EEA/ICAN6/13-CanCoast.pdf.
Soanes L. M., Arnould J. P. Y., Dood S. G., Summer M. D., Green J. A. (2013). How Many Seabirds do We Need to Track to Define Home-Range Areas? J. Appl. Ecol. 50, 671–679. doi: 10.1111/1365-2664.12069
Soanes L. M., Bright J. A., Angel L. P., Arnould J. P. Y., Bolton M., Berlincourt M., et al. (2016). Defining Marine Important Bird Areas: Testing the Foraging Radius Approach. Biol. Conserv. 196, 69–79. doi: 10.1016/j.biocon.2016.02.007
Sonntag N., Schwemmer H., Fock H. O., Bellebaum J., Garthe S. (2012). Seabirds, Set-Nets, and Conservation Management: Assessment of Conflict Potential and Vulnerability of Birds to Bycatch in Gillnets. ICES J. Mar. Sci. 69, 578–589. doi: 10.1093/icesjms/fss030
Sydeman W. J., Hunt G. L. Jr., Pikitch E. K., Parrish J., Piatt J., Boersma P. D., et al. (2021). South Africa’s Experimental Fisheries Closures and Recovery of the Endangered African Penguin. ICES J. Mar. Sci. 78, 3538–3543 doi: 10.1093/icesjms/fsab231
Symons S. C. (2018). Ecological Segregation Between Two Closely Related Species: Exploring Atlantic Puffin and Razorbill Foraging Hotspots Vol. 93 (University of New Brunswick: M.Sc. thesis).
Symons S. C., Diamond A. W. (2019). Short-Term Tracking Tag Attachment Disrupts Chick Provisioning by Atlantic Puffins Fratercula Arctica and Razorbills Alca Torda. Bird Study 66: (1), 53–63. doi: 10.1080/00063657.2019.1612850
Thaxter C. B., Lascelles B., Sugar K., Cook A. S. C. P., Roos S., Bolton M., et al. (2012). Seabird Foraging Ranges as a Preliminary Tool for Identifying Candidate Marine Protected Areas. Biol. Conserv. 156, 53–61. doi: 10.1016/j.biocon.2011.12.009
Thaxter C. B., Ross-Smith V. H., Clark J. A., Clark N. A., Conway G. J., Masden E. A., et al. (2016). Contrasting Effects of GPS Device and Harness Attachment on Adult Survival of Lesser Black-Backed Gulls Larus Fuscus and Great Skuas Stercorarius Skua. Ibis 158, 279–290. doi: 10.1111/ibi.12340
Wakefield E. D., Bodey T. W., Bearhop S., Blackburn J., Colhoun K., Davies R., et al. (2013). Space Partitioning Without Territoriality in Gannets. Science 341, 68–70. doi: 10.1126/science.1236077
Wakefield E. D., Owen E., Baer J., Carroll M. J., Daunt F., Dodd S. G., et al. (2017). Breeding Density, Fine-Scale Tracking, and Large-Scale Modeling Reveal the Regional Distribution of Four Seabird Species. Ecol. Appl. 27, 2074–2091. doi: 10.1002/eap.1591
Warwick-Evans V., Atkinson P. W., Arnould J. P. Y., Gauvain R., Soanes L., Robinson L. A., et al. (2016). Changes in Behaviour Drive Inter-Annual Variability in the at-Sea Distribution of Northern Gannets. Mar. Biol. 163, 156. doi: 10.1007/s00227-016-2922-y
Weimerskirch H. (2007). Are Seabirds Foraging for Unpredictable Resources? Deep Sea Res. Part II: Trop. Stud. Oceanography 54, 211–223. doi: 10.1016/j.dsr2.2006.11.013
Wilhelm S. I., Mailhiot J., Arany J., Chardine J. W., Robertson G. J., Ryan P. C. (2015). Update and Trends of Three Important Seabird Populations in the Western North Atlantic Using a Geographic Information System Approach. Mar. Ornithol. 43, 211–222.
Wilhelm S. I., Rail J.-F., Regular P. M., Gjerdrum C., Robertson G. J. (2016). Large-Scale Changes in Abundance of Breeding Herring Gulls (Larus Argentatus) and Great Black-Backed Gulls (Larus Marinus) Relative to Reduced Fishing Activities in Southeastern Canada. Waterbirds 39 (sp1), 136–142. doi: 10.1675/063.039.sp104
Wong S. N. P., Gjerdrum C., Morgan K. H., Mallory M. L. (2014). Hotspots in Cold Seas: The Composition, Distribution, and Abundance of Marine Birds in the North American Arctic. J. Geophysical Res. - Oceans 119, 1691–1705. doi: 10.1002/2013JC009198
Woo K. J., Elliott K. H., Davidson M., Gaston A. J., Davoren G. K. (2008). Individual Specialization in Diet by a Generalist Marine Predator Reflects Specialization in Foraging Behaviour. J. Anim. Ecol. 77, 1082–1091. doi: 10.1111/j.1365-2656.2008.01429.x
Yen P. P. W., Huettmann F., Cooke F. (2004). A Large-Scale Model for the at-Sea Distribution and Abundance of Marbled Murrelets (Brachyramphus Marmoratus) During the Breeding Season in Coastal British Columbia, Canada. Ecol. Model. 171, 395–413. doi: 10.1016/j.ecolmodel.2003.07.006
Yorio P. (2009). Marine Protected Areas, Spatial Scales, and Governance: Implications for the Conservation of Breeding Seabirds. Conserv. Lett. 2, 171–178. doi: 10.1111/j.1755-263X.2009.00062.x
Young H. S., Maxwell S. M., Conners M. G., Shaffer S. A. (2015). Pelagic Marine Protected Areas Protect Foraging Habitat for Multiple Breeding Seabirds in the Central Pacific. Biol. Conserv. 181, 226–235. doi: 10.1016/j.biocon.2014.10.027
Zydelis R., Small C., French G. (2013). The Incidental Catch of Seabirds in Gillnet Fisheries: A Global Review. Biol. Conserv. 162, 76–88. doi: 10.1016/j.biocon.2013.04.002
Keywords: tracking, seabirds, machine-learning, conservation planning, North Atlantic
Citation: Ronconi RA, Lieske DJ, McFarlane Tranquilla LA, Abbott S, Allard KA, Allen B, Black AL, Bolduc F, Davoren GK, Diamond AW, Fifield DA, Garthe S, Gjerdrum C, Hedd A, Mallory ML, Mauck RA, McKnight J, Montevecchi WA, Pollet IL, Pratte I, Rail J-F, Regular PM, Robertson GJ, Rock JC, Savoy L, Shlepr KR, Shutler D, Symons SC, Taylor PD and Wilhelm SI (2022) Predicting Seabird Foraging Habitat for Conservation Planning in Atlantic Canada: Integrating Telemetry and Survey Data Across Thousands of Colonies. Front. Mar. Sci. 9:816794. doi: 10.3389/fmars.2022.816794
Received: 17 November 2021; Accepted: 06 June 2022;
Published: 13 July 2022.
Edited by:
Jorge M. Pereira, University of Coimbra, PortugalCopyright © 2022 Ronconi, Lieske, McFarlane Tranquilla, Abbott, Allard, Allen, Black, Bolduc, Davoren, Diamond, Fifield, Garthe, Gjerdrum, Hedd, Mallory, Mauck, McKnight, Montevecchi, Pollet, Pratte, Rail, Regular, Robertson, Rock, Savoy, Shlepr, Shutler, Symons, Taylor and Wilhelm. This is an open-access article distributed under the terms of the Creative Commons Attribution License (CC BY). The use, distribution or reproduction in other forums is permitted, provided the original author(s) and the copyright owner(s) are credited and that the original publication in this journal is cited, in accordance with accepted academic practice. No use, distribution or reproduction is permitted which does not comply with these terms.
*Correspondence: Robert A. Ronconi, cm9iZXJ0LnJvbmNvbmlAZWMuZ2MuY2E=