 Grzegorz Różyński
 Grzegorz R. Cerkowniak
- Institute of Hydro-Engineering, Polish Academy of Sciences, Gdańsk, Poland
The paper presents a study on the insufficient resilience of three coastal lake barriers at the central part of the Polish Baltic Sea coast. Environmental qualities of those lakes belonging to the NATURA2000 network dictate efforts aimed at their conservation through the maintenance of the barriers. The use of recently elaborated high resolution geological surveys demonstrated previously underestimated severe sand scarcity and indicated high threats of enhanced erosion, breaching and overtopping of the barriers. Next, the investigation of alongshore variation of nearshore wave energy dissipation, basing on the available bathymetric records and the concept of ordinary and empirical equilibrium profiles, identified potential erosion hot spots along the barriers. Finally, the XBeach model was applied to simulate the effects of rare, heavy storms with the recurrence period of 20 years with and without climate change induced sea level rise. Overall, the results demonstrated high susceptibility of the barriers to frequent fragmentation and allowed for recommendations of protection measures minimizing interference into the natural landscapes. The novelty of the paper consists in the assessment of aftermaths of extreme events by combining recent advances in coastal geology and climate change effects.
Introduction
Recent scientific evidence (BACC II, 2015) suggests that there is a widely accepted consensus as to the consequences of climate change for Baltic Sea region:
(1) An increase in air temperature in all seasons, observed in recent decades, will persist; cold winter and warm summer extremes are expected to change more than the average conditions, contributing to greater instability of coastal areas;
(2) The summer sea-surface temperature is expected to increase by about 2°C (4°C) in the southern (northern) sub-basins of the Baltic Sea;
(3) A drastic decrease in sea-ice cover is expected, augmenting the exposure to hydrodynamic forces in winter; however, sea ice is likely to remain in winters in the northern Baltic Sea;
(4) Annual mean storm surges are expected to grow by 10 cm without accounting for the large scale sea level rise or land uplift in the Baltic Sea area;
(5) The sea level rise will rise by 0.7 m (±0.3 m) until the end of the 21st century.
These consequences will jointly have negative effects on the stability of sandy beaches in the Baltic Sea:
(1) Warmer seawater will substantially reduce the extent and duration of ice cover, thereby largely diminishing protection against hydrodynamic forces in late autumns and winters;
(2) The imminent sea level rise will move shoreward the wave action, leading to more frequent direct wave attack on dune feet during storms and greater depletion of sediment;
(3) Reduction of mean and maximum sea level air pressure (SLP) during the passage of cyclones for last decades (Sepp et al., 2018) will produce multi-faceted and irregular growth of hydrodynamic regimes and further increase sediment fluxes.
The endangered coastal morphological units encompass south Baltic sandy beaches with dune strips and soft postglacial cliffs (Łabuz, 2015), where sand and till often form geological layer cakes, sometimes with lenses of pressurized groundwater. Moreover, their susceptibility to erosion can be further aggravated when they rest on fragmented layers of weak lacustrine, organic sediments, lying shallowly under thin layers of Holocene sands. Sandy beaches are common along the entire south Baltic region from Scania in Sweden through the German Baltic coast, the Polish coast, the Russian exclave of Kaliningrad region, the coasts of Lithuania, Latvia and Estonia and the Russia’s coast in the Gulf of Finland. Thus, the study has a pan-Baltic impact and it can be realistically expected that similar sedimentary conditions are commonly encountered at other marine basins.
The selection of three coastal lake barriers for the investigations was dictated by recent observations: their erosion rates are in the range of 1.5 m/year since 2002 (Łabuz, 2018), the beaches are generally low and narrow, ca. 25–35 m wide between the shoreline and the dune foot and do not provide sufficient protection during storms. Sand deficit results in frequent exposures of the abrasion platform after autumn/winter storms. This platform is composed of tills, gravels and peats; particularly the peats produce higher risk of erosion upon direct contact with waves.
The current study consists of three major elements:
(1) Recently elaborated, detailed mapping of coastal sediments along the entire Polish coastline was analyzed (Uścinowicz et al., 2007a). Done in relatively high horizontal/vertical resolution of 1:10,000/1:500, it contains invaluable information on composition and stratification of coastal sediments, which aid in more accurate determination of the resilience of coastal units against erosion. High resolution of geological cross-shore profiles, spaced every 8 km on average gave way for fairly accurate assessments of sand volumes as a key indicator of beach resilience against hydrodynamic forces.
(2) More detailed assessments of coastal morphology were provided by the available bathymetric cross-shore profiles, spaced every 500 m. They were examined by ordinary and recently elaborated empirical equilibrium profiles to identify potential locations of erosion hot spots.
(3) These investigations were complemented by the simulations of the effects of heavy storms with the recurrence period of 20 years with and without the climate change induced sea level rise. These simulations were done with the XBeach package.
The main aim of the paper is to shed new light on the looming feedback between the pre-existing coastal sediments and climate change, producing greater wave energy fluxes to coastal regions. They can mobilize currently stable weaker sediments, blanketed by thin layers of Holocene sands. In this context, the accurate mapping of sedimentary stratification in the coastal region is so important, as the role of non-negligible formations of weaker sediments like lacustrine deposits, largely ignored in past surveys and analyses, can be highlighted. The presented analysis can therefore be suitable for all morphological units, where geological stratification is found to be complex enough to trigger sand scarcity under climate change. Next, the novel insights into coastal geology were combined with the analysis of alongshore wave energy dissipation patterns, aimed at identification of potential erosion hot spots in the barriers, favoring formation of “privileged” locations of breaching and overtopping. Finally, XBeach simulations were employed to determine the resilience of dunes against such phenomena. Those analyses jointly allowed for determination of possible options for improving the resilience of the barriers using the paradigm of minimum “gray” intervention into protected landscapes, biotopes and habitats.
The paper structure reflects these objectives. First, detailed site description is provided, including brief depictions of past investigations to explain the study context. Next, the analyses and their results are described. Finally, they are discussed and summarized in conclusions and recommendations for further studies.
Site Description
The Polish Baltic Sea coast measures 428 km according the national coastal chainage of coastal authorities with km 0 at the border with Russia on Vistula Lagoon Spit to km 428 at the border with Germany, Figure 1A. The study area is shown in Figure 1B. It shows that this coastal strip generally retains SW-NE orientation, which means it is usually exposed to storms running from W and NW, which are prevailing wind direction – see extreme wind roses in Figure 1C (Bierstedt et al., 2015). The storms driven by northerly (N) winds are not rare as well, so such shoreline orientation favors alternations of littoral drift during extreme events.
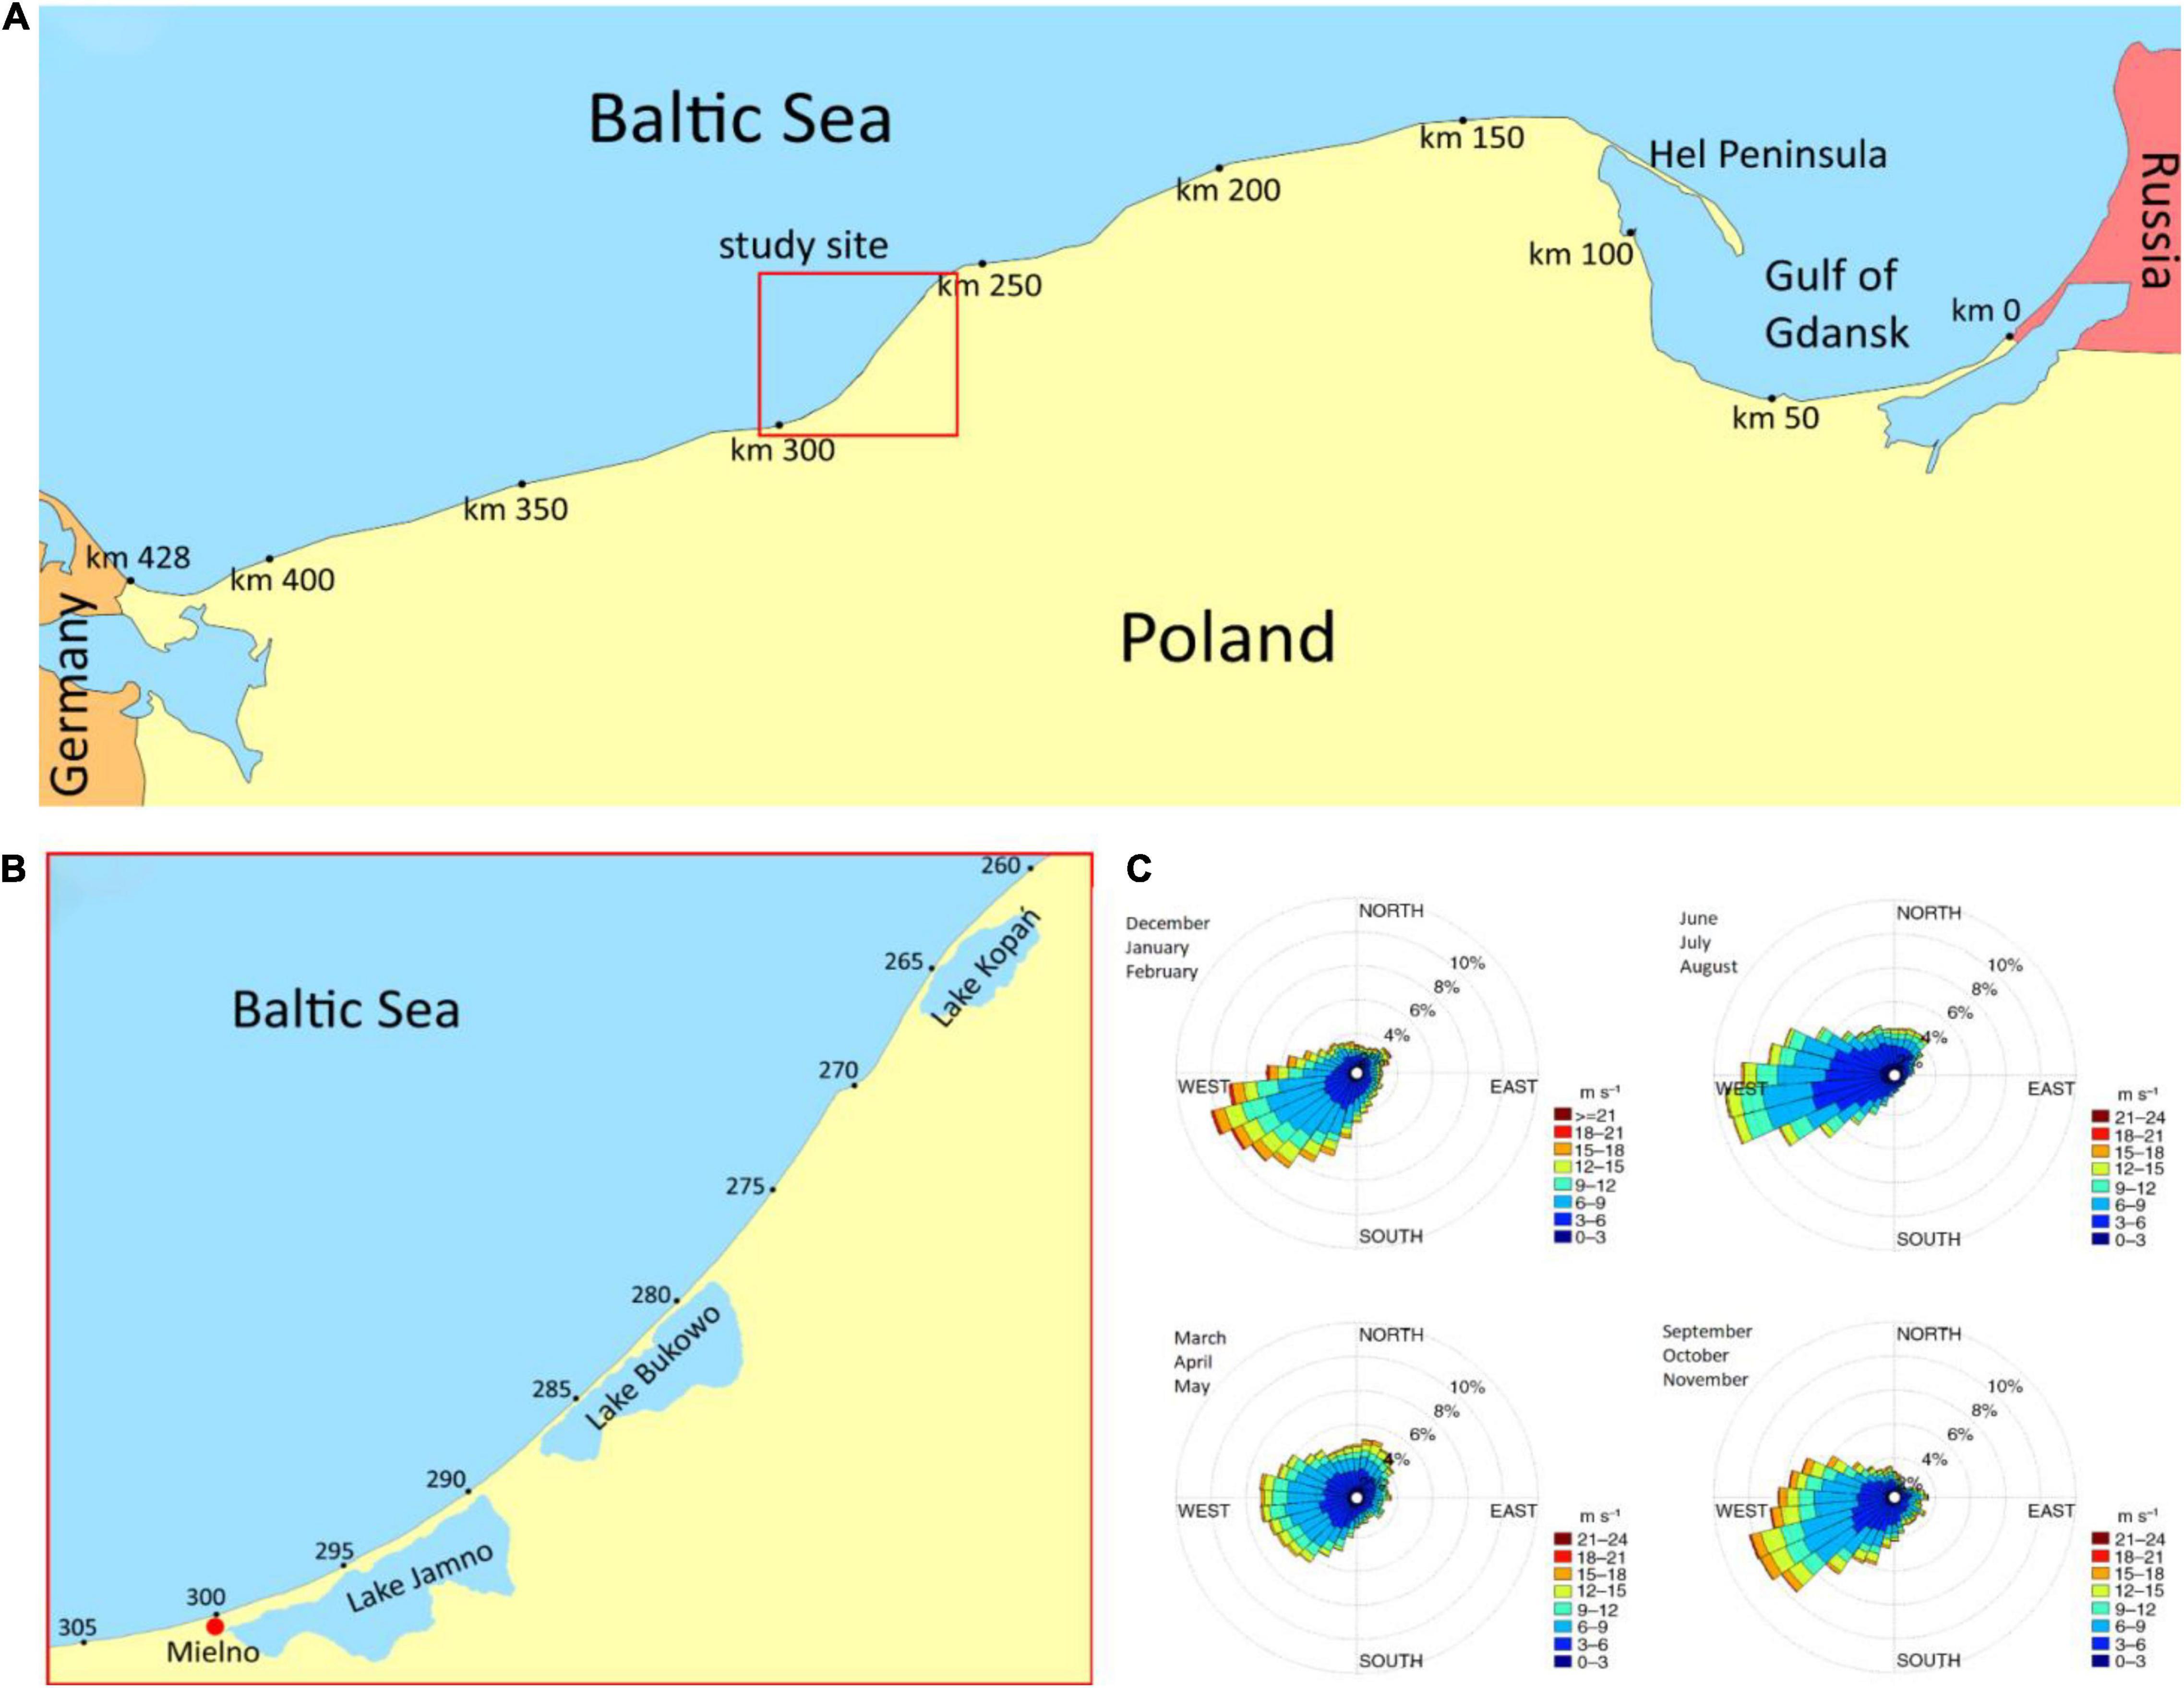
Figure 1. Study area: global view (A), study area (B), spring, summer, autumn and winter wind roses, after [***] (C).
The western barrier detaches Lake Jamno from the Baltic Sea and extends between km 289 and 300 of the chainage. The morphology of its emerged part near the outlet from the lake to the sea is shown in Figure 2 top left: the beach is narrow and low, but the dune massif is fairly robust. Nevertheless, the placement of geo-textile apron and a boulder mattress, located just before the dune foot, demonstrates that erosion is expected and efforts are already made to mitigate sediment depletion from the dune. Figure 2 top right presents a bird view of the central Lake Bukowo barrier. It encompasses the strip between km 278 and 289 of the national chainage, so it is almost adjacent to Lake Jamno.
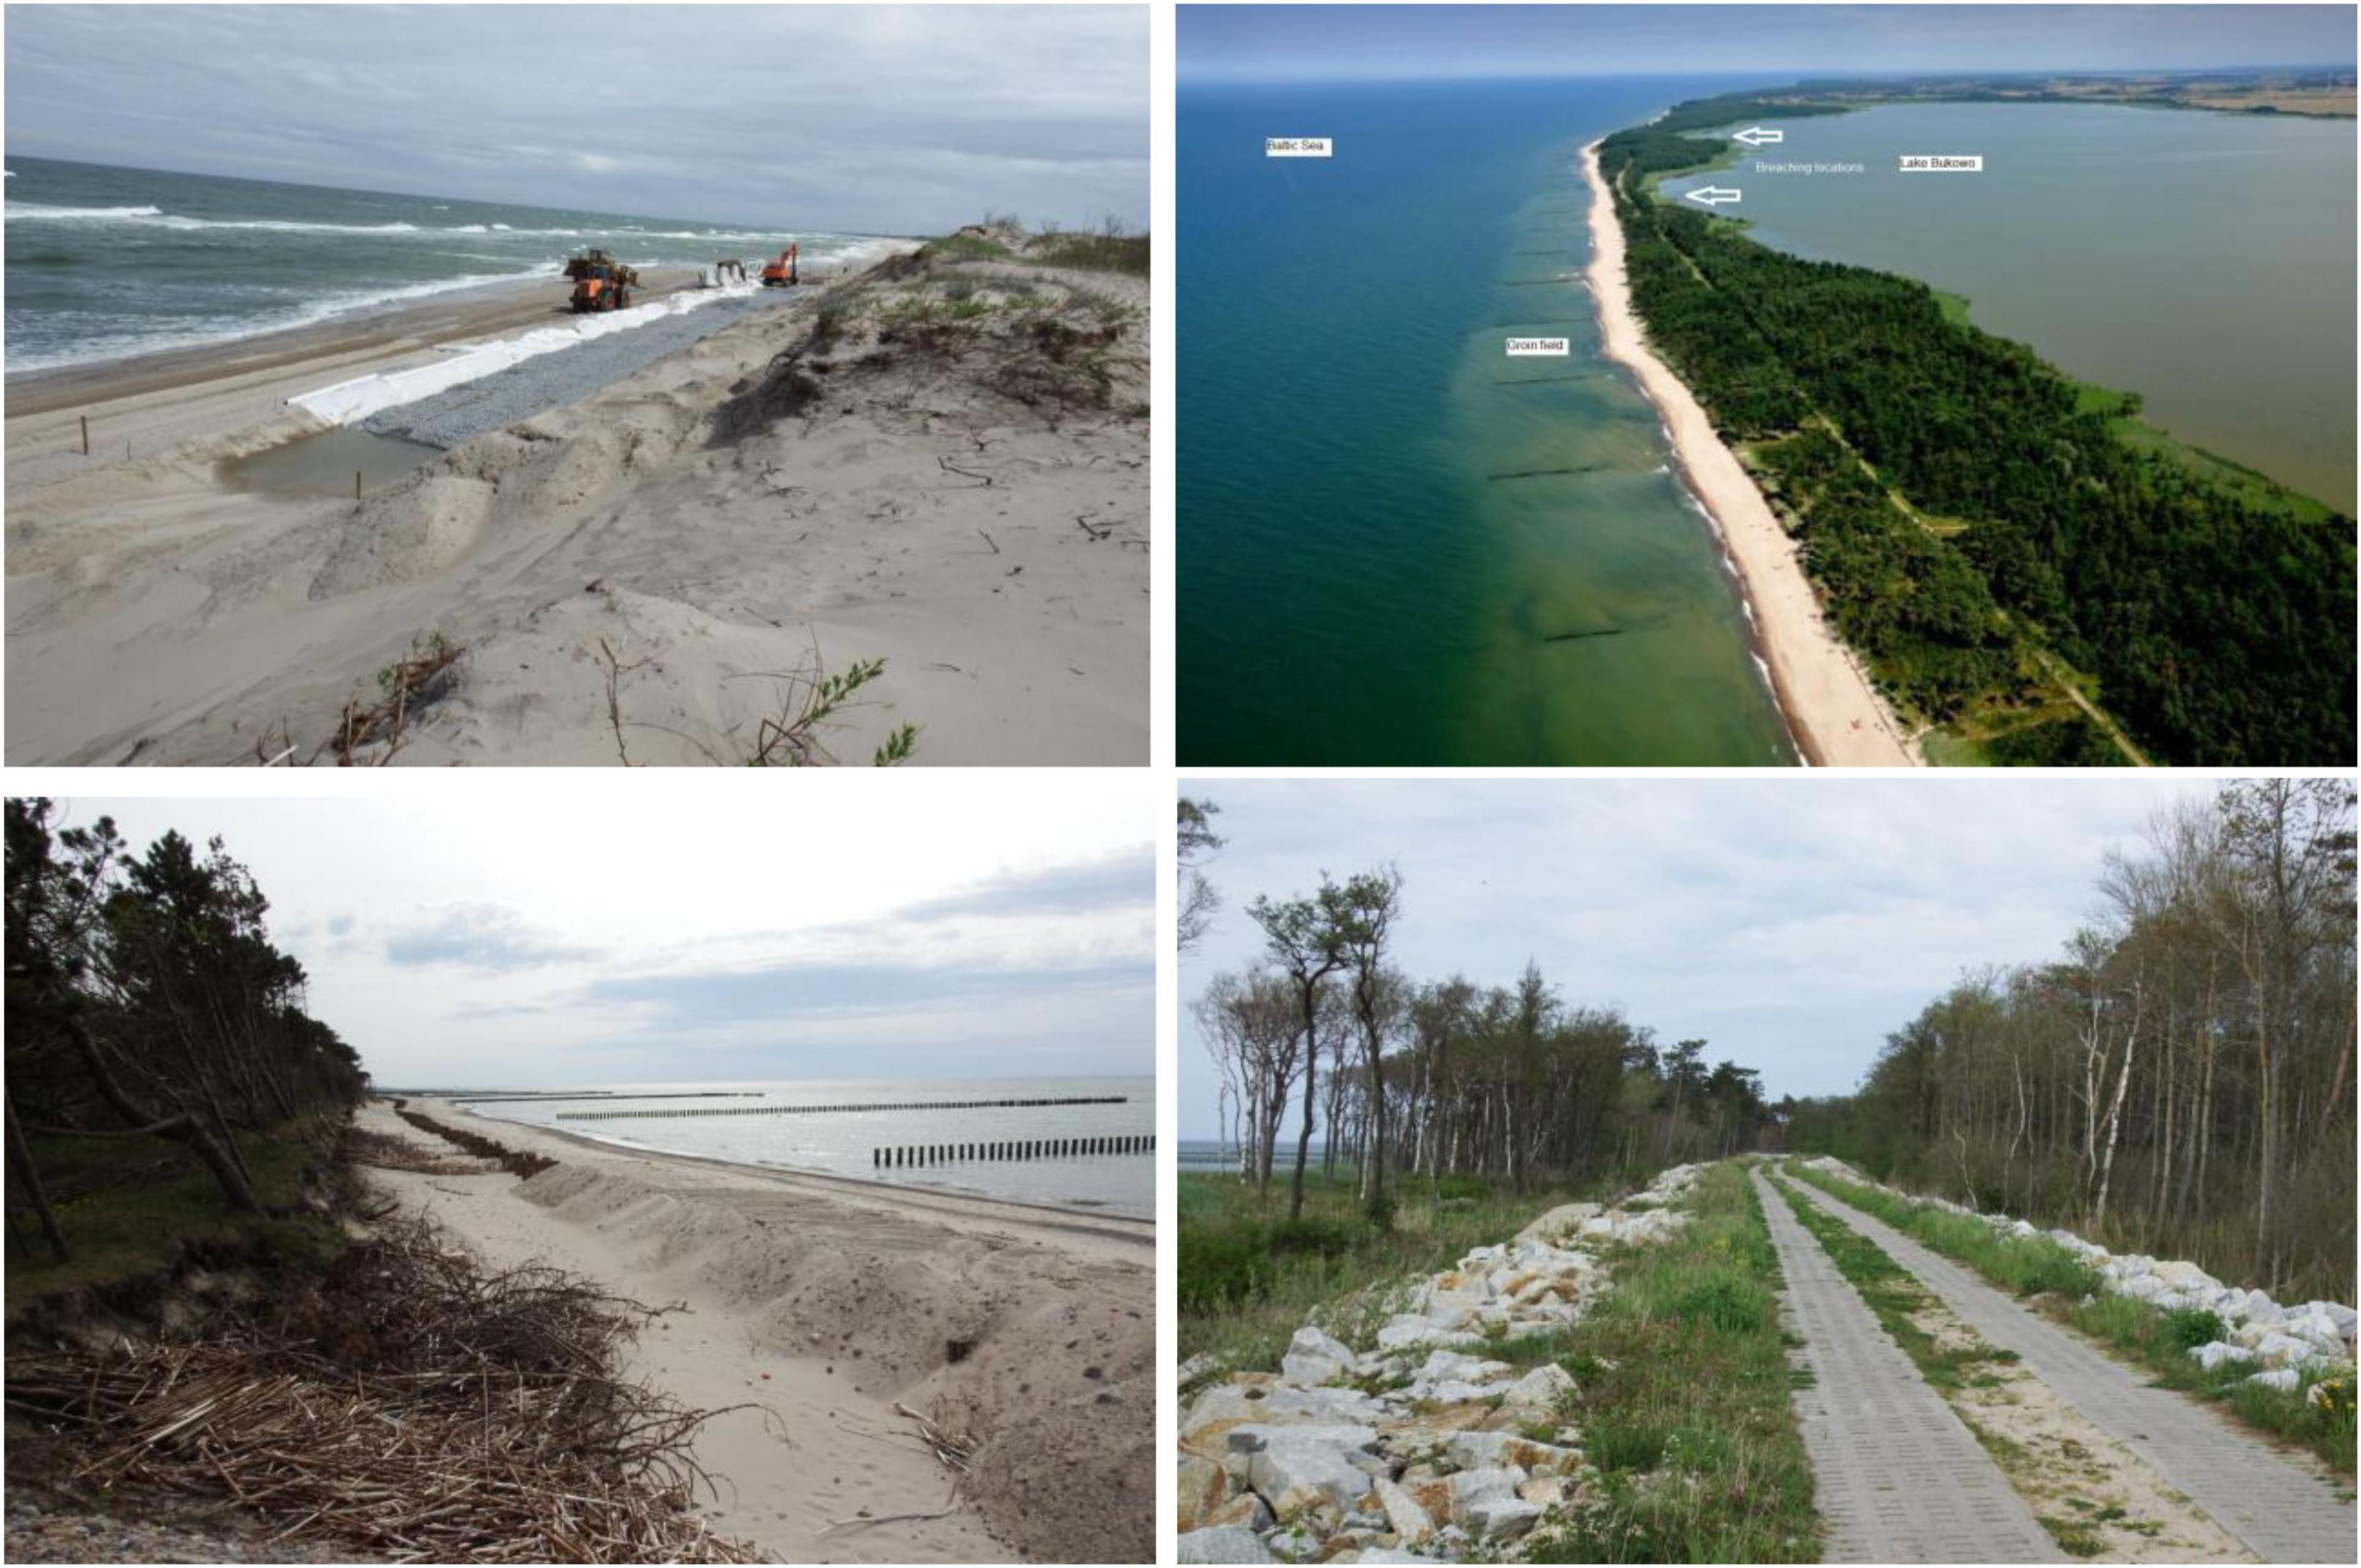
Figure 2. Jamno barrier near outlet from lake in 2015,photo. G. Różyński - top left; Bukowo barrier, adapted from www.darlowo.naszemiasto.pl - top right; Kopań barrier in 2015, photo. G. Różyński - bottom left; storm barrage on lake Kopań barrier in 2015, photo. G. Różyński - bottom right.
This barrier is very narrow at two locations, indicating likely breaching spots and general affinity to fragmentation. The beach itself is very narrow as well; the groins demonstrate that efforts were already taken to alleviate imminent erosion. Upon closer inspection though it can be seen that most groins are detached from the shoreline. Such conditions are always very dangerous as they foster development of privileged longshore current pathways near the shoreline, producing deep scours. For this reason, integrity of the barrier can be further compromised under climate change, so permanent human intervention is inevitable.
The shortest, eastern coastal barrier separates Lake Kopań from the Baltic Sea. It extends between km 261 and 267 of the chainage. Figure 2 bottom left presents some of its characteristic features. It is low and suffers from sand deficit, so an extensive groin field made of sparsely spaced pine tree trunks, often detached from the shoreline can be seen. Another measure to retain sand is a wooden fence made of sticks trapping the sand moving under the wind force. Sand scarcity forced artificial filling of this fence by sediment delivered during construction of a storm barrage, located just behind dune relics. Their disappearance demonstrates the underlying intention for the erection of this barrage to prevent breaching events. The barrage is presented in Figure 2 bottom right: its core is made of large natural boulders, buried in the sand but alien to local environment -their prevalence was the main reason to call this structure a barrage instead of “embankment,” which could suggest a weaker structure, mainly made of sand. Large boulders are intended to secure sufficient resilience against breaching (and overtopping); simultaneously the barrage is used as access road for maintenance purposes In general, Lake Kopań barrier is the most heavily protected, reflecting very high exposure to disasters. Generally, sediment scarcity is evident at three barriers and the extent of human intervention indicates the importance of erosion, breaching and overtopping threats for local coastal management.
The severity of sand deficit is well demonstrated by past extreme events, producing either severe dune losses and breaching events. The first such event was reported in 1558 (Rączkowski and Sroka, 2007) inundating the town of Darłowo, located between lakes Kopań and Bukowo, some 3 km into land. Even more devastating events occurred afterward: in 1604, 1666 and 1690 (Rączkowski and Sroka, 2007); the last event also silted up the outlet from Lake Jamno, heavily affecting all local economy. Further disasters occurred in 1693, 1722 and 1801 (Rączkowski and Sroka, 2007). In the early 20th Century heavy storms occurred in 1913, 1914, 1921/22 (Rączkowski and Sroka, 2007), the storm from 1914 breached the barrier of Lake Bukowo over 700 m near the outlet, another breaches of this barrier occurred in 1921/22 and again in 1962. Moreover, the three storms from early 20th Century depleted ca. 100 m wide land strip east of Darłówko, i.e., on Lake Kopań barrier and in its direct proximity. As a result of gradual weakening of this barrier it was breached over 200 m in 1981 and over 600 m in 1983; these two events led to initiation of the construction of the barrage, Figure 2 bottom right: it was started in 1987, but progressed very slowly - the last 830 m were erected by 2013 largely using the EU funding. It demonstrates how scarce resources were used to at least mitigate the looming long-term danger of permanent loss of not only the Kopań barrier but also the other two.
The maintenance of the barriers is of vital importance for ecological reasons and local communities. The barriers themselves have little environmental significance due to their low natural biodiversity (grasses and shrubs capable of survival in saltish environment), exacerbated by anthropogenic pressures. However, Lake Bukowo and Kopań belong to NATURA 2000 network together with adjacent wetlands (PLH320041 and PLH320059 resp.) (Official Journal of the European Union, 2019). These reservations measure 32.63 km2 and 11.655 km2, respectively, and both are intended to retain and restore important ecosystem services, such as habitats for fish, birds and other animals. Precariousness of these three lakes is related to their extreme pollution sensitivity as shallow water bodies with limited water exchange. On the other hand, limited and intermittent intrusions of brackish water from the Baltic Sea during storm surges provide unique conditions for reproduction and survival of fishes living in both fresh and brackish environment, contributing very positively to local biodiversity. These shallow lakes offer perfect spawning conditions. Also, vast shallow stretches near their waterlines are covered with reeds that provide excellent habitats for birds. The adjacent wetlands further enrich biodiversity serving as habitats for other species of birds, amphibians and mammals. Thus, the lakes deliver unique and extensive ecosystem services that must be protected. Also, both reservations are perfect destinations for qualified tourism (sailing, kite-surfing and angling). Sun and seabathing prevail in SW part of Lake Jamno barrier and at NW corner of that lake. Although the local community (Mielno town and surroundings, see Figure 1B) has only about 5,000 permanent residents, it gave 664 thousand overnight stays in July–August 2017 (ekoszalin, 2022), which amounted to 8% of all such stays in Polish coastal zones in that year. This number demostrates importance of the tourist sector for local community and the need for maintenance of coastal barrier, on which their existence largely depends.
Coastal resilience in Poland gradually became important research topic over the last decades. The global condition of the Polish coast was investigated in Dubrawski and Zawadzka-Kahlau (2006) and Dubrawski et al. (2008). As regular surveys of nearshore bathymetry were rare in the past, emerged beach characteristics could only be measured. Taken between 1957 and 2002, those records were focused on the determination of coastal resilience against storms with predefined return periods Tp. In the most simplistic analysis the values of Tp were related to the maximum height of dunes or cliffs (Dubrawski and Zawadzka-Kahlau, 2006). Tp may generally represent both the postulated as well as the actual beach safety level, securing its survival when exposed to a storm with the return period Tp. Furthermore, (Dubrawski and Zawadzka-Kahlau, 2006) includes the shoreline change rates between 1875 and 1979. A clear erosion trend was observed at the coastal barriers; for Lake Kopań the observed rate of erosion in that period was −0.37 m/yr, for the remaining two it was estimated at −0.42 m/yr. Another contribution by Dubrawski and Zawadzka-Kahlau (2006) was the investigation of sediment granulometry along the Polish coast. Sediment sampling locations included the dune crest and foot, mid-beach, the shoreline, bar crests and troughs, and offshore slopes. Then, mean sediment diameters for the submerged part of each profile were determined to evaluate the mean sediment diameter D50, representative of the entire submerged profiles. It was found to vary between 0.183 and 0.248 mm, which means that the sand along the Polish coast are fairly uniform and can be generally classified as fine sand, (Wentworth, 1922).
The contribution provided by Dubrawski et al. (2008) documented an extensive monitoring campaign of nearshore bathymetry and dry beach topography between 2004 and 2006. It encompassed 969 bathymetric profiles, spaced every 500 m along the entire Polish coastal zone. The profiles were geodetically fixed, so each of them had a predetermined origin and azimuth for future cross-comparisons. The surveys embraced the dune or cliff foot, emerged beach and sea bottom down to –1 m below msl; seaward extensions of those profiles were terminated beyond the −10 m ordinate. Using this vast bathymetric dataset a shoreface volume-based parameter of coastal safety was introduced (Dubrawski et al., 2008). The choice of its onshore and offshore boundary was dictated by safety requirements derived from: (1) observations of the morphologies of emerged beaches, (2) desired resilience against storms with Tp = 100 years, and (3) the results of the monitoring of nearshore bathymetry. Hence, the onshore boundary for the determination of shoreface volume was set at z1 = 2 m above msl, assumed as the elevation of dune foot. The offshore boundary for determination of shoreface sediment volume was set at the ordinate z2 = 6 m. It is consistent with the shallowest identified annual depth of closure, (Różyński et al., 1999). The shoreface sediment volume based safety criterion was elaborated for 608 profiles collected at the open sea coast. The resulting mean shoreface volume was 1,494.8 ≈ 1,500 m3/m with the corresponding standard deviation 391.6 m3/m and a relatively low coefficient of variation of 0.26. The value of 1,500 m3/m was adopted as the lowermost limit of coastal safety/sufficient beach resilience against a storm with Tp = 100 years for the entire Polish coast, implicitly including the Gulf of Gdańsk and Hel Peninsula. Performance of this criterion was thoroughly examined in Różyński (2018). The comparison of shoreline change rates observed between 1875 and 1979 on the open sea coast along at least 2 km long segments and the shoreface volumes obtained from the bathymetric campaign of 2004–2006 revealed that insufficient resilience at eroding segments was determined correctly at 20 out of 34 segments (59%) (Różyński, 2018). Similar juxtaposition for stable/accreting segments found that out that of 16 out of 26 stable segments (62%) had the shoreface volumes greater than 1,500 m3/m (Różyński, 2018R). These descriptors demonstrate fair performance of shoreface sediment volume as beach resilience criterion. Therefore, it can be applied for basic assessment of coastal stability. However, the volume of 1,500 m3/m was derived upon two implicit assumptions: (1) sand saturation along the whole open sea coast, and (2) uniformity of sand characteristics (D50 ≈ const.) there: particularly the former is a radical simplification of actual sedimentary conditions at many beach segments.
In the local context of the three studied barriers past observations revealed high susceptibility to inundations driven by mild but long lasting storm surges; for example, a surge of 0.7 m above msl may almost produce a temporary merger of the lakes Jamno and Bukowo (Majewski et al., 1983). More insight into storm surge characteristics was given in Wiśniewski et al. (2009). The highest surge of 159 cm above the msl was reported at Darłowo in 1914—it coincided with the breaching of Lake Bukowo barrier. Consequently, the highest surge of 216 cm above msl in the entire history of mareographic records on the Polish coast was reported at Kołobrzeg, located between km 330 and 335 Figure 1A in 1874. Statistical analysis of this long series revealed that surges of 150 cm above msl can occur roughly every 10 years (Wiśniewski et al., 2009). As Kołobrzeg is located some 20 km west of Lake Jamno, it demonstrates that the barriers experience the impacts of high surges once per decade on average and this rate is expected to rise under climate change. Finally, a global condition of the three barriers was laid out in Kruk-Dowgiałło et al. (2018): the whole coastal segment between the NE end of Lake Kopań barrier and the SW end of Lake Jamno barrier was classified as vast erosion embayment. Structural, background erosion tendencies there can be attributed to general scarcity of sand not only at the study area, but also along vast coastal segments west of it (Uścinowicz et al., 2007a). Therefore, the prevailing west-to east longshore sediment transport is not saturated and is unable to sufficiently contribute to beach recovery in calm periods after heavy storms.
Materials and Methods
The first new material applied to the studies on coastal resilience in Poland, are the high resolution geological maps and cross-sections of the Polish coastal region (Uścinowicz et al., 2007a). Elaborated more than a decade ago they remained largely unexplored until digitization as the maps and cross-sections of 1:10,000 (1:500) horizontal (vertical) resolution. They cover the entire Polish coast and the cross-shore geological cross-sections are spaced every 8 km on average. Several alongshore cross-sections through the dunes/cliffs, shoreline and nearshore seabed are also available for better data integrity. This detailed dataset offers a huge potential for a multitude of new insights on future coastal evolution under climate change. An exemplary cross-section through Lake Kopań barrier at km 262.75 is presented in Figure 3. It shows the geological structure between +2 m and –6 m ordinates. A thin blanket of marine sand covers the nearshore seabed; its thickness is in the order of 2 m. Furthermore, the dune is rather low and thin, so it will not resist harsher hydrodynamic regimes combined with sea level rise for a long time. In general, the bulk of the shore is composed of postglacial till, weakened by the lenses of marine and lacustrine mud. It clearly demonstrates low resilience of this barrier against storms. Other cross-sections that were used in the study include that at lake Bukowo at km 288.3 and Jamno at km 294.05 of the national chainage, Figures 4, 5.
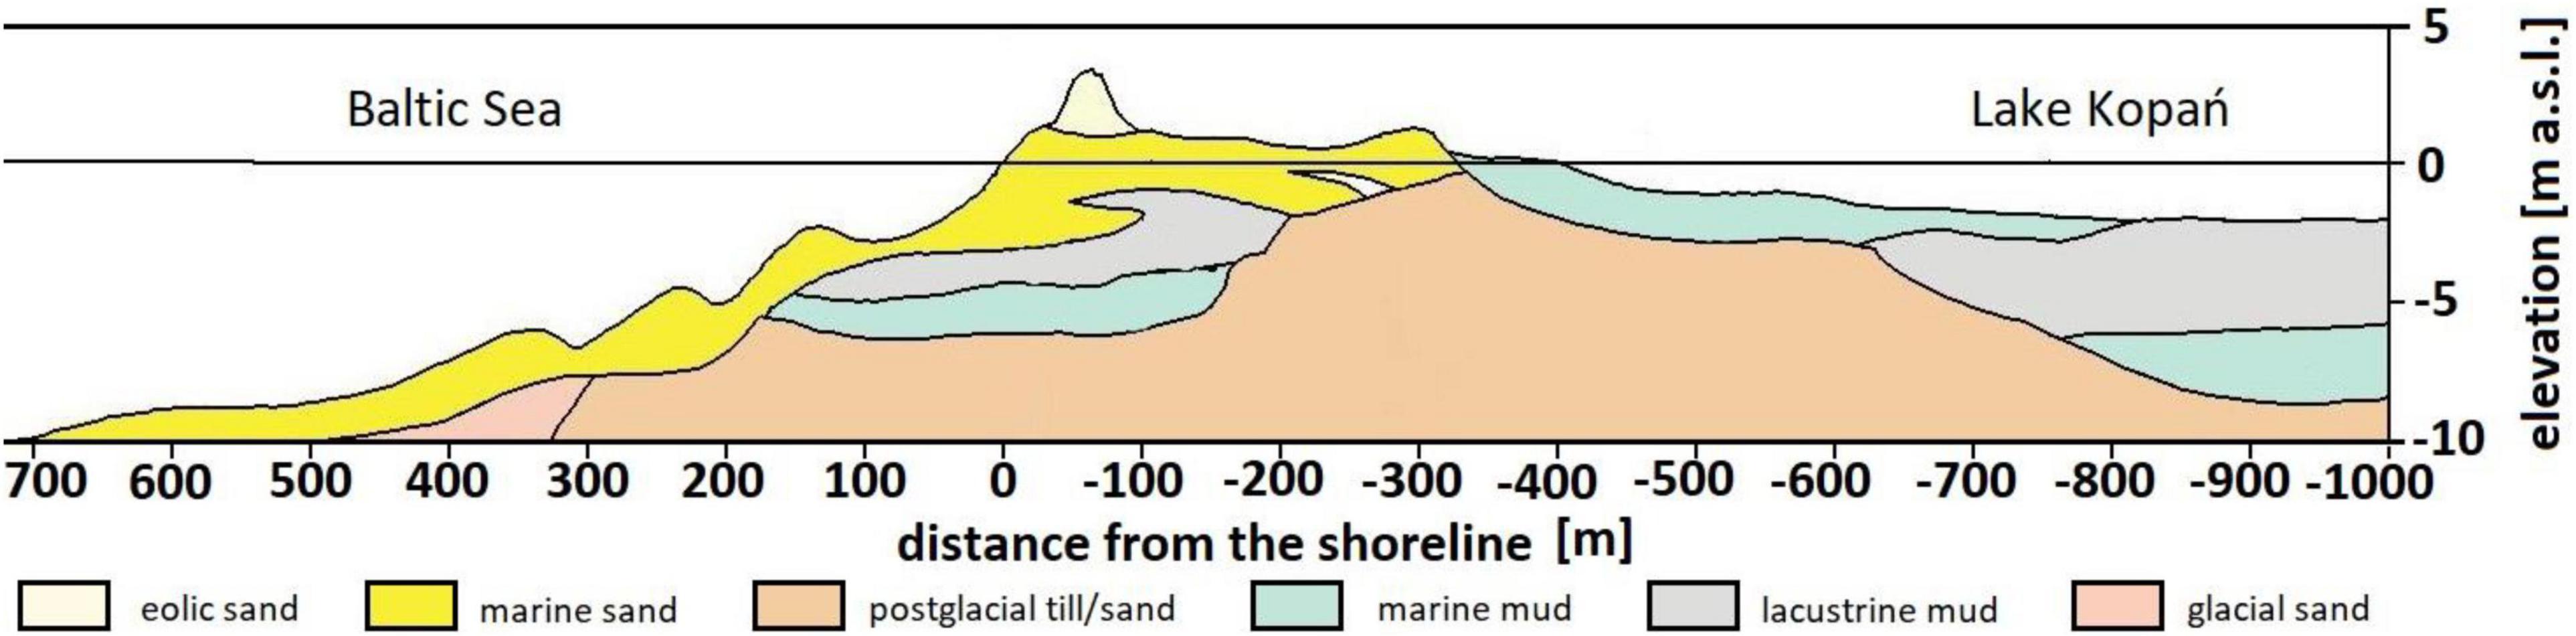
Figure 3. Lake Kopań barrier cross-section at km 262.75 [after Uścinowicz et al. (2007b)].
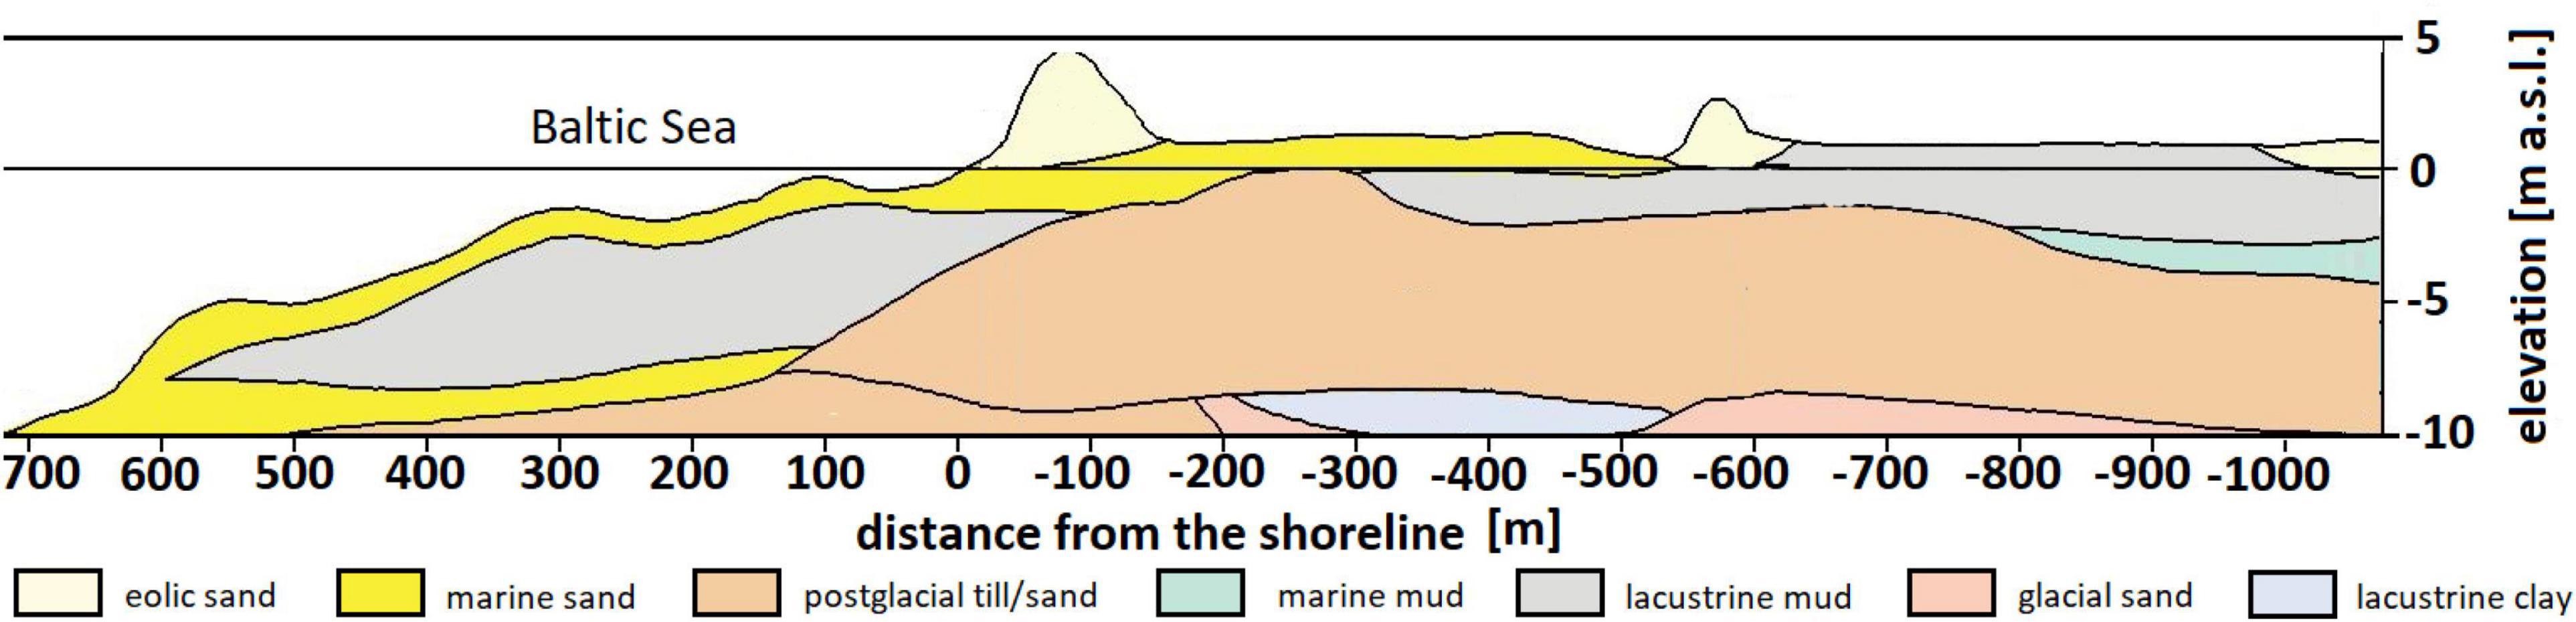
Figure 4. Lake Bukowo barrier cross-section at km 288.3 [after Uścinowicz et al. (2007c)].
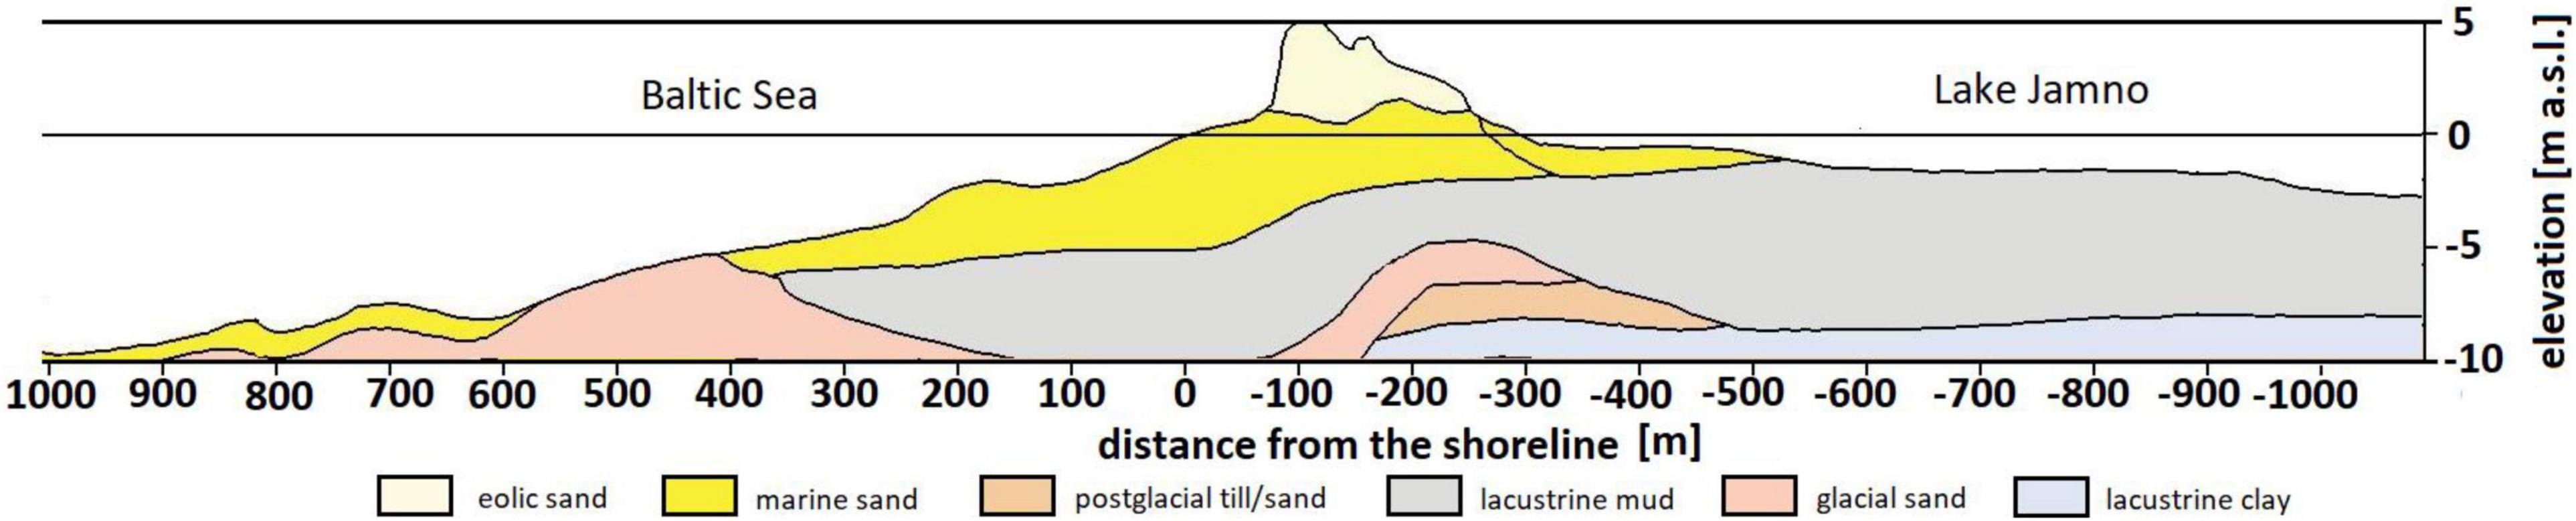
Figure 5. Lake Jamno barrier cross-section at km 295.05 [after Uścinowicz et al. (2007d)].
The second data set utilized in the study are the bathymetric profiles of the study area collected in 2006 (Dubrawski et al., 2008), and geo-referenced to the coastal chainage. Spaced every 500 m they constitute the most comprehensive data set on nearshore bathymetry to date (September 2021) along the entire Polish coast. They provided important clues for determination of alongshore variability of wave energy dissipation at the study area using a novel methodology that closely approximates the measured seabed with its monotonic components using the Singular Spectrum Analysis (SSA) (Różyński, 2020). It is capable of resolving a beach profile into additive components, associated with the eigenvalues of a covariance matrix of that profile; the eigenvalues are ranked and the largest corresponds to the component R1 in Figure 6. It was able to roughly well reproduce the profile configuration between −3 and −10 m ordinates. Addition of the consecutive components R2 to R5, see Figure 6, associated with 2nd, 3rd, 4th and 5th eigenvalue ultimately yielded quite an accurate reproduction of the entire profile. Hence, the SSA method, applied for bathymetric profiles, allows for determination of wave energy dissipation basing solely on nearshore seabed configuration by assuming a fully developed wave breaking regime in the surf zone during extreme events. Thus, no direct hydrodynamic measurements were needed.. The application of SSA method reveals the inflection point for an overwhelming majority of profiles, which indicates the offshore limit of saturated wave breaking regime (Różyński, 2020), where the reconstructed approximate seabed is roughly upward concave: such morphology points to the presence of the equilibrium profile conditions. Thus wave energy dissipation between that point and the shoreline can be evaluated by the least square fit of Dean equilibrium profile parameter A. The upward concave Dean curve relates the seabed depth h and offshore distance x with a power relationship:
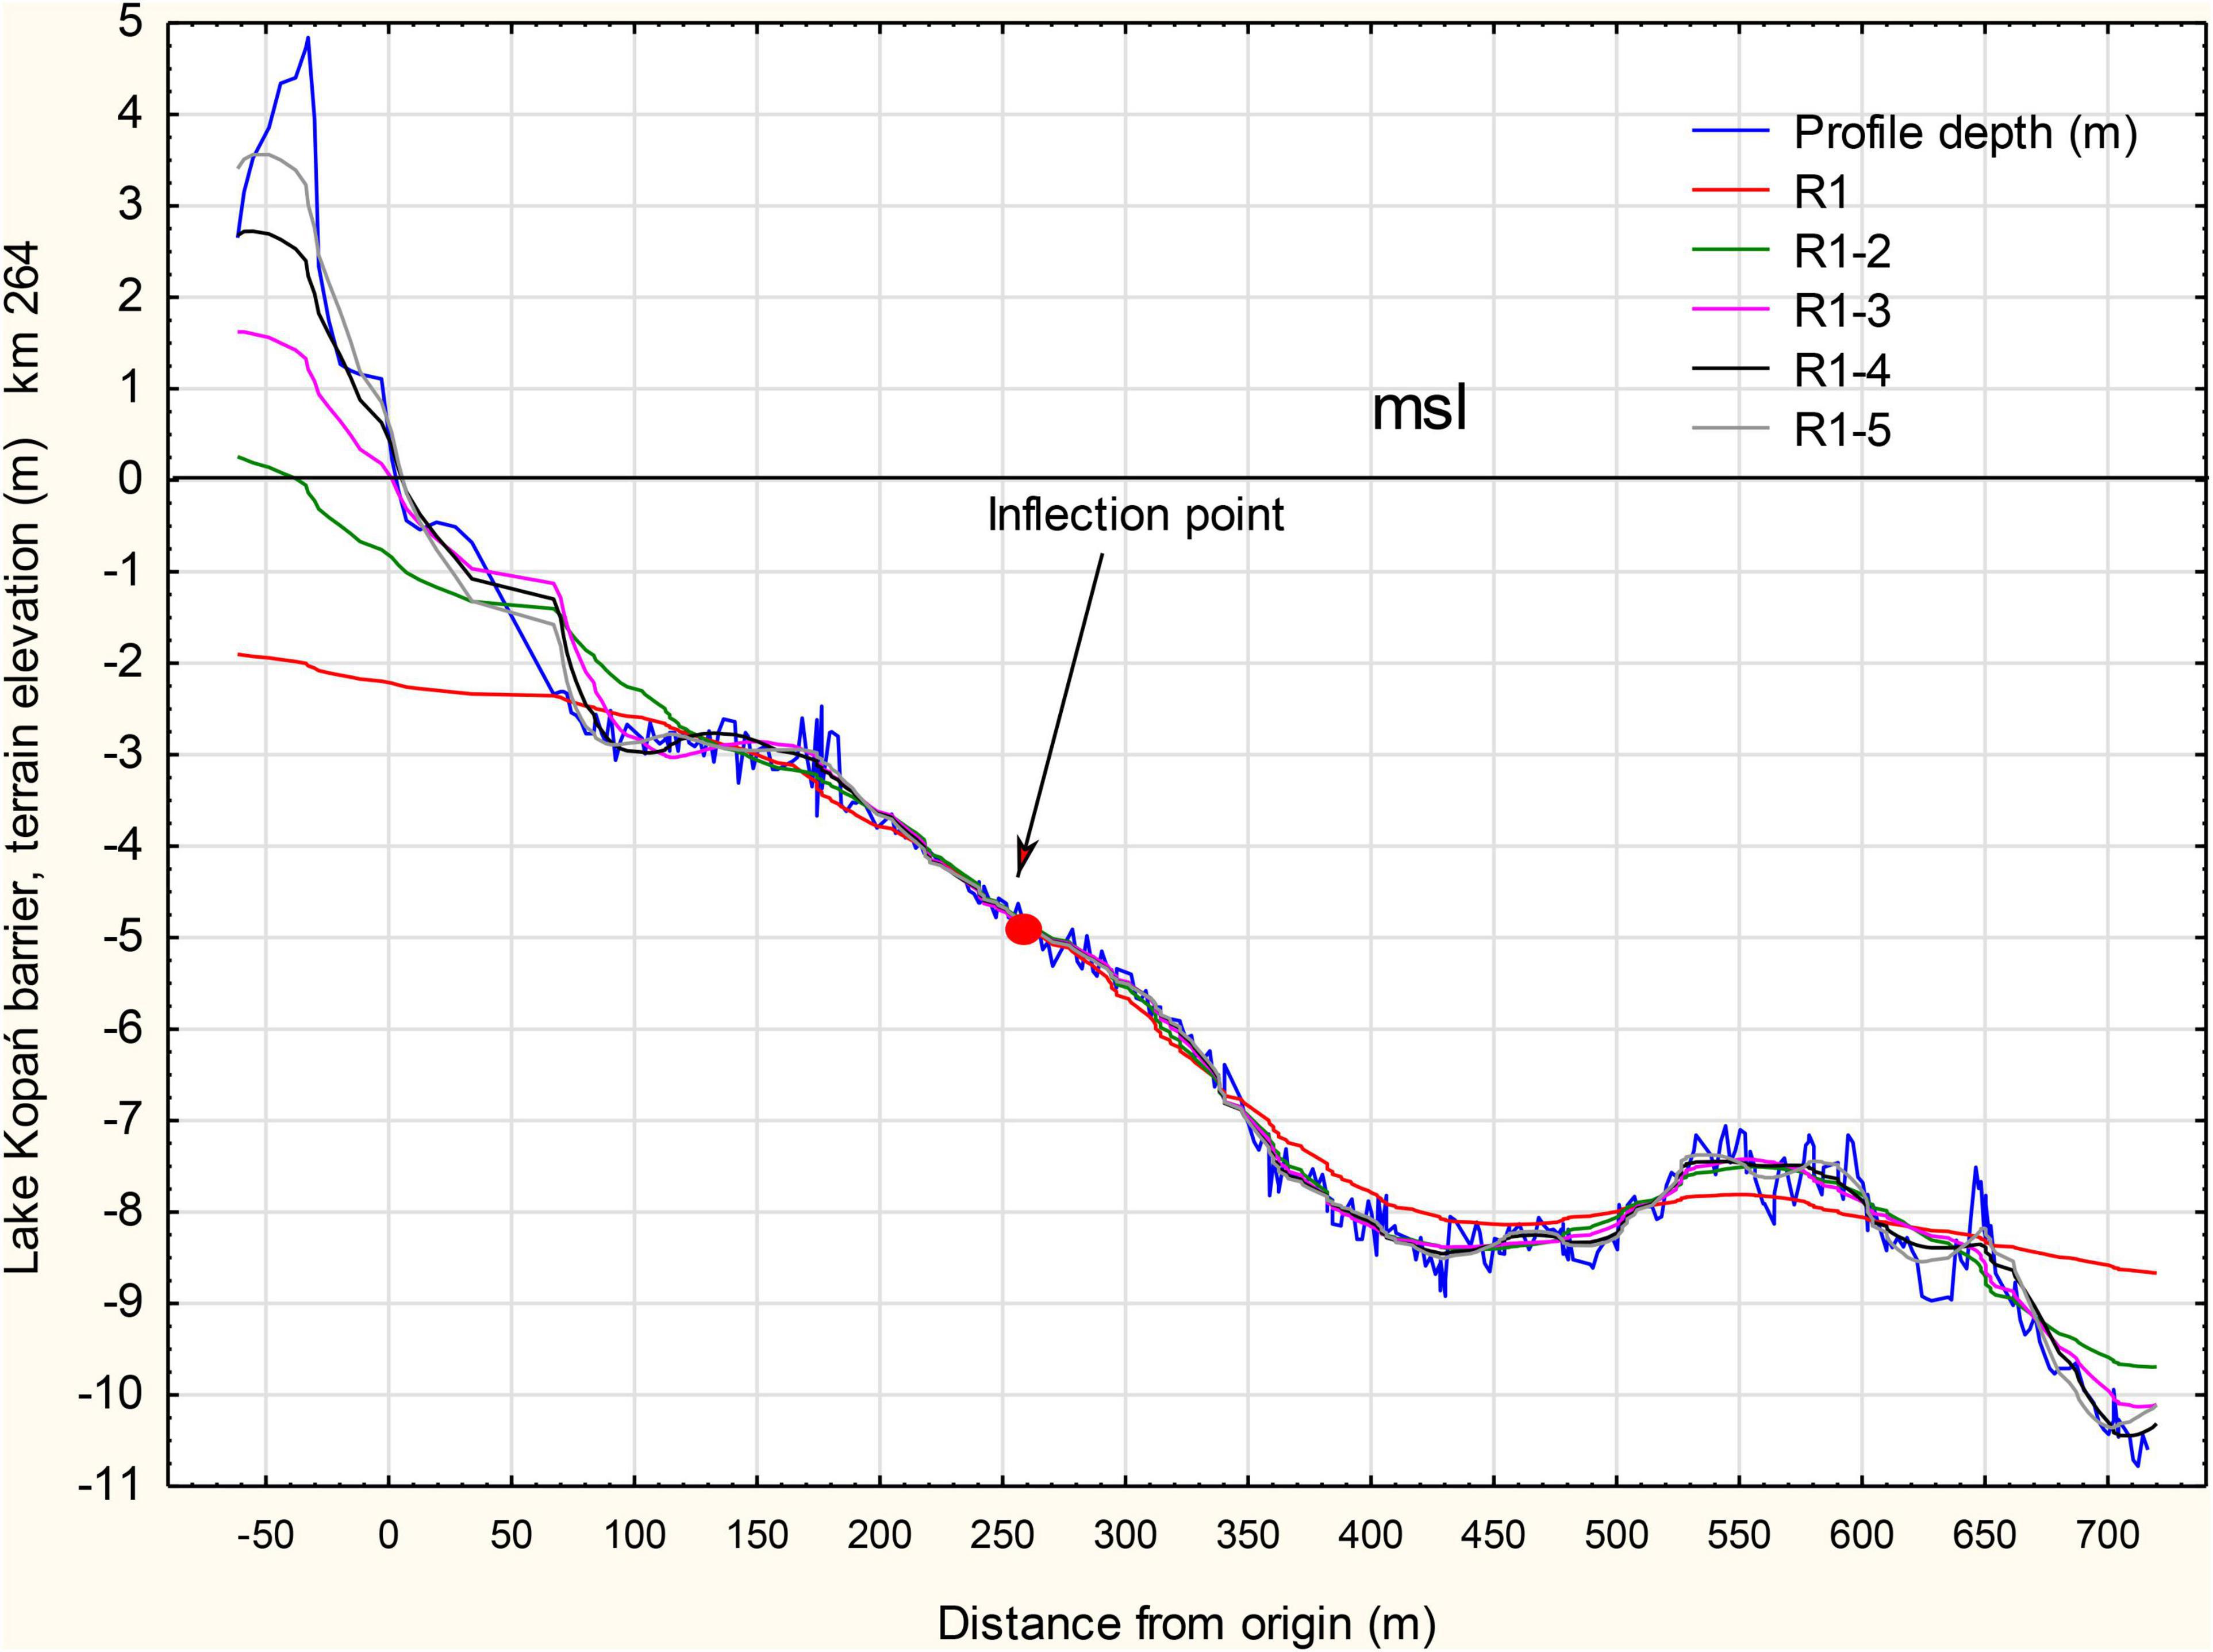
Figure 6. Approximation of nearshore bathymetry with summed monotonic components of SSA decomposition, Lake Kopań barrier, km 264.
This coefficient directly corresponds to wave energy dissipation Er (W/m3) in unit volume of water, see e.g., Coastal Engineering Manual (2008):
In Equation 2, ρ is the specific gravity of water, usually 1,000 kg/m3, g = 9.81 m/s2 is the acceleration of gravity, and γ = H/h is the wave breaking index; it is the only parameter that is set a priori upon expert judgment; for Baltic Sea conditions it is widely accepted to be equal to 0.78. The coefficient A is directly related to the mean sediment diameter D50 (Coastal Engineering Manual, 2008), so alongshore variations in D50 can be investigated with this method. Constant wave energy dissipation in unit volume of water Er [W/m3] is automatically determined once the parameter A is least square fitted to a measured beach profile. Finally, the amount of wave energy dissipated over the seabed onshore the inflection point is evaluated as, (Różyński, 2021):
The Equation 3 is the consequence of fully developed wave breaking in the water column above the Dean curve. Occasionally, nearshore bathymetry is more complex and exhibits two inflection points with two zones of saturated wave breaking; the description how wave energy dissipation is computed at such locations using the same basic concept is available in Różyński (2020). Interestingly, the Equation 3 can be transformed in such a way that Ed is independent of the Dean coefficient and the depth of inflection point hinfl is the only morphological parameter that controls wave energy dissipation, see Różyński (2021):
This formulation allows for direct assessment of alongshore variability of wave energy dissipation in order to find potential erosion hot spots. If the dissipated wave energy Ed is significantly lower at several adjacent profiles with respect to those in the neighboring areas, then more energy will have to be dissipated by direct attack on emerged beach and dunes in that area, producing higher risks of beach loss. Importantly, hinfl does take into account possible variations of sand granulometry: for hinfl = const. Ed remains the same, but for finer (coarser) grains the corresponding distance offshore xinfl is greater (shorter) and the Dean coefficient smaller (greater). Therefore, this approach is particularly useful when equilibrium-like profiles, morphologically similar to “true” equilibrium profiles on sand saturated beaches, are formed in geologically heterogeneous coastal units, where the concept of sand saturation cannot be applied with confidence.
The third vital component of the study is local hydrodynamics and the potential impact of climate change. The XBeach package was used in those analyses and the modeling embraced conditions expected at the end of 21st Century. The sea level rise of 0.7 m was assumed, following BACC II (2015). Moreover, hydrodynamic conditions included the impacts of extreme events with the return periods of 20, 50 and 100 years. Their parameters originate from Boniecka et al. (2013), where the periods, lengths and significant heights of waves were determined using methodologies elaborated by e.g., British Standard Code of practice for Maritime structures (2000) or Dnv-Os-J101 (2011), Table 1. The periods and lengths of the extreme waves do not differ significantly for the return periods of 20, 50 and 100 years. By contrast, the significant wave height still demonstrated a notable increase for the return periods between 20 and 100 years. The saturation of wave period and length results directly from the fetch limited character of the almost landlocked Baltic Sea, which explains why weaker coastal formations could survive in the environment not affected by climate change. Consequently, following again (British Standard Code of practice for Maritime structures, 2000), or (Dnv-Os-J101, 2011), the duration of extreme events in simulations was set at 3 h, that is they were intended to capture the effects of the peak of extreme events.
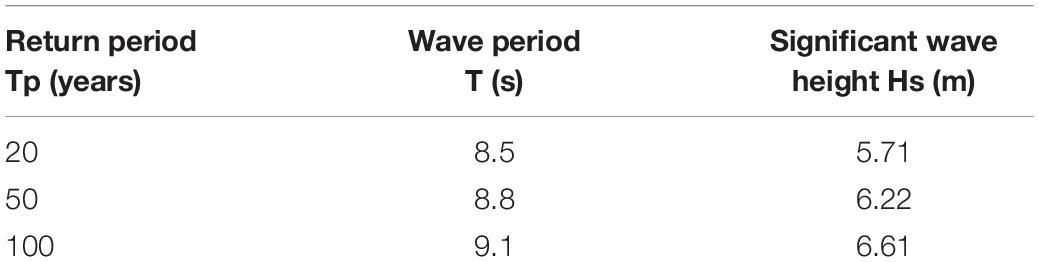
Table 1. Extreme hydrodynamic wave parameters, after Boniecka et al. (2013).
Results and Discussion
High resolution geological profiles were examined with respect to the volumes of sand between +2 and −6 m ordinates. For Lake Kopań barrier, Figure 3, the sands form a thin layer and significant part of the cross-section is composed of weak marine and lacustrine organic soils (mud) resting on a massive core of post-glacial tills and sands. The volume of sand between +2 and −6 m ordinates is only ca. 660 m3, whereas the total volume of sediments is just ca. 1,270 m3, vs. the 1,500 m3 safety criterion. It illustrates drastic sand deficit and highlights the high risk of erosion and overtopping over a low dune strip and the low barrier proper. Over longer time the sand can be depleted to uncover the organic deposits and thereby expose the barrier to breaching by direct contact of those sediments with hydrodynamic forces.
For Lake Bukowo, Figure 4, the volume of sand at the geological profile at km 288.3 is only 800 m3 vs. the total sediment volume of 2,560 m3, most of which are lacustrine organic deposits. Thus, the risk of breaching is much lower than at the Kopań barrier, but due to sand scarcity and prevalence of weaker organic deposits the situation will be gradually aggravated under climate change conditions, when direct exposure of those sediments to hydrodynamic forces can occur.
For Lake Jamno barrier, Figure 5, the cross-section at km 294.05 demonstrates that the stratum of till lies well beneath the potential range of marine forces and that lacustrine mud forms the only significant non-sandy layer. The sand volume between +2 and −6 m on the seaward side was evaluated at ca. 1,400 m3 and the total volume of all sediments at 1,800 m3. Also, the dune strip is much higher with a crest reaching 5 m above the msl. Thus, this barrier seems to be on the verge of safety in terms of erosion and overtopping, at least at that particular location.
The geological profiles demonstrate that Lake Kopań barrier is the weakest and thus very likely to succumb to hydrodynamic forces in the coming decades unless vast intervention is taken. For Lake Bukowo the barrier appears significantly more resilient, but it can be expected it will be gradually worn down in future under climate change. Finally, Lake Jamno barrier appears the most robust. High resolution geological cross-sections vividly demonstrated previously unexpected high precariousness of the studied barriers. Also, they showed the most dramatic situation of Lake Kopań barrier; the recently completed barrage will definitely require significant maintenance in future. For Lake Bukowo apparent stability of the barrier can be suddenly interrupted the moment weak sediments become exposed. Lake Jamno barrier appears to be the safest at the moment, which means it is more difficult to breach. Nevertheless, it is not immune to overtopping, so its long-term survival cannot be guaranteed without interventions.
The second main line of the investigations was concentrated on alongshore variations of wave energy dissipation, based on beach profiles obtained during the bathymetric surveys of 2006. Visual inspection of those profiles found that the beach at Kopań barrier is generally steep with only one bar present. Similar pattern was observed at Jamno barrier. By contrast the beach at Bukowo barrier is more heterogeneous with one or two bars; the barrier is weakest in the center. The assessments of sediment volumes are put together in Table 2; careful examination of those volumes allowed for the following provisional conclusions:
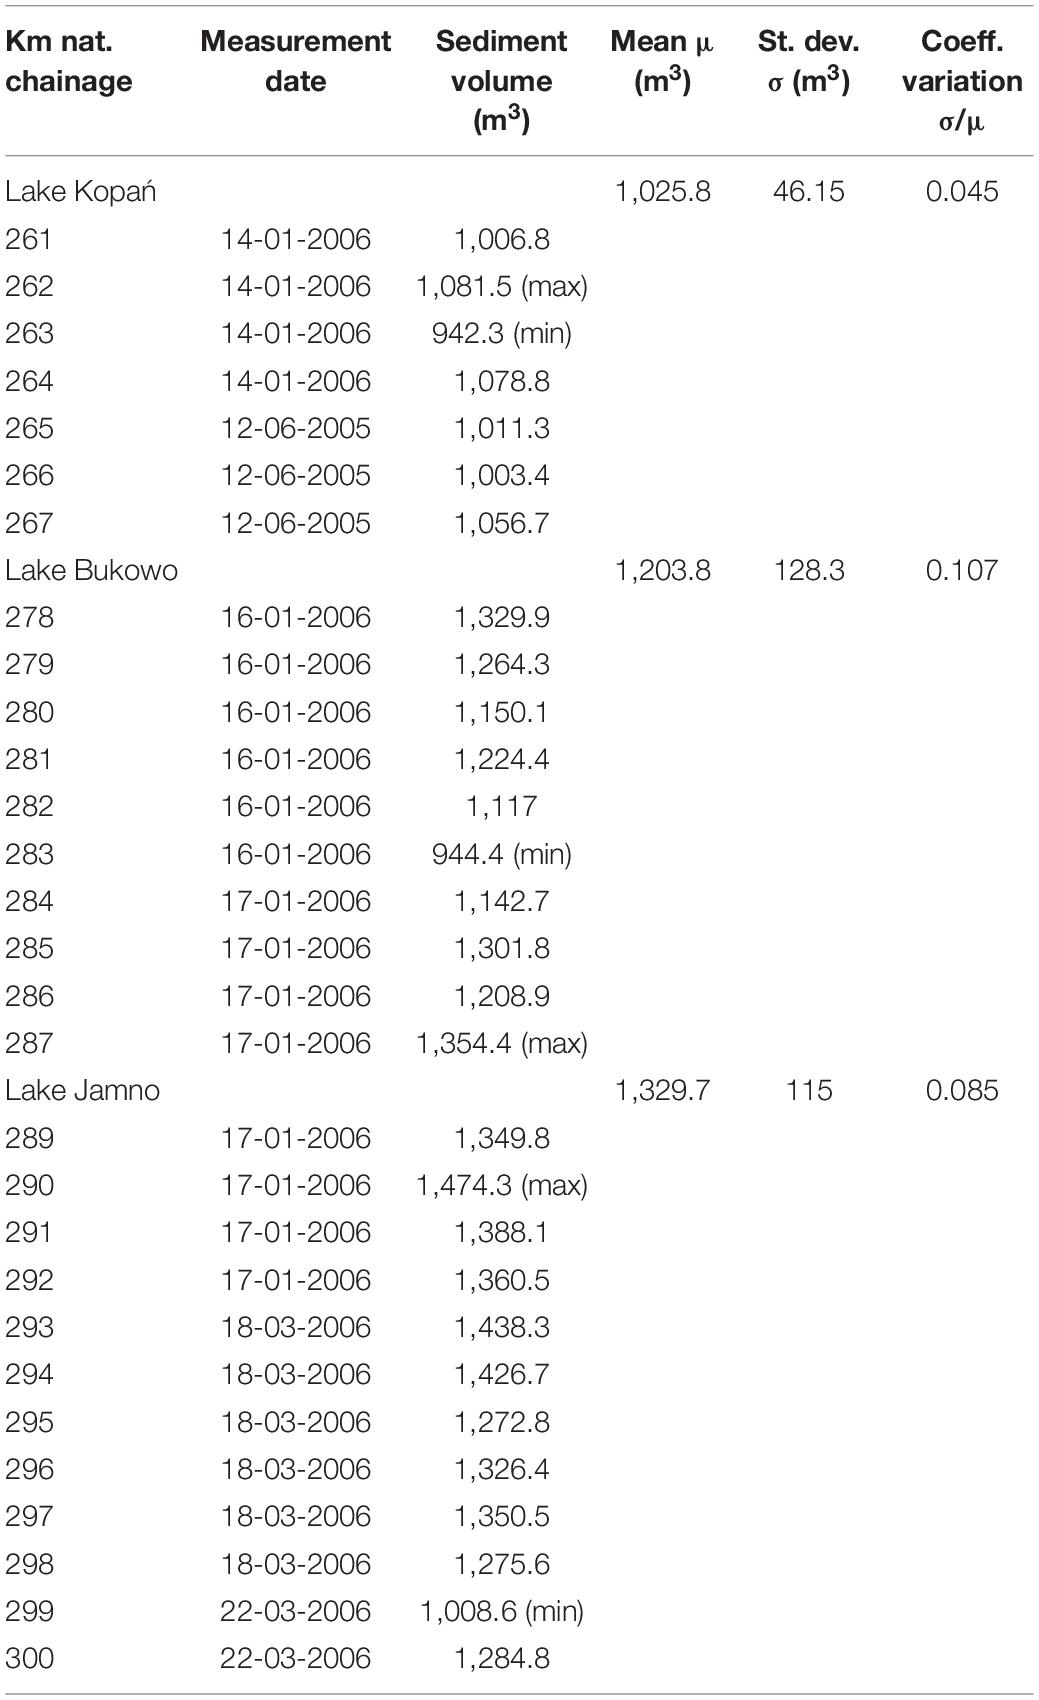
Table 2. Sediment volumes between +2 and −6 m ordinates based on seabed survey of 2005-6.
(1) The Kopań barrier features the lowest sediment volumes (1,025.8 m3 on average), indicating poor resilience against erosion; the Bukowo barrier is somewhat more resilient (1,203.8 m3) and the Jamno barrier exhibit the greatest resilience 1,329.7 m3). Nevertheless, they all remain below the reference safety level of 1,500 m3.
(2) The coefficients of variation are low for all barriers, demonstrating substantial alongshore morphological seabed uniformity.
(3) The resilience of Bukowo barrier is significantly lower than that identified from the geological profile at km 288.3; in fact this profile lies between Jamno and Bukowo barriers. The resilience is lowest in the center of the barrier (km 282 and 283).
Some insight into granulometric composition of sandy sediments along the three barriers could be obtained by fitting the Dean parameter A to the recorded raw beach profiles and then relating them to the mean sediment diameter D50. For the Kopań barrier the average Dean parameter was evaluated at A = 0.119, for Bukowo A = 0.105 and for Jamno A = 0.097; these values reflect the greatest steepness of the barrier at Kopań, some milder beach at Bukowo and still milder at Jamno. Using the relationship A = 0.41⋅(D50)0.94 (Hanson and Kraus, 1989), the values of D50 were ascertained at 0.27 mm at Kopań, 0.23 mm at Bukowo and 0.22 mm at Jamno. These estimates are roughly consistent with general observations reported in Dubrawski and Zawadzka-Kahlau (2006) and point to high degree of sediment homogeneity.
The assessment of wave energy dissipation on the three barriers was executed using two approaches—ordinary Dean functions and the concept of monotonic approximate seabed proposed in Różyński (2020). It should be kept in mind that very large dissipation potential over the nearshore seabed may point to large offshore/longshore sediment migration during extreme events followed by profile steepening and re-configuration by sediment depleted from emerged beach and dunes. In case of sediment scarcity such situation means imminent shoreline retreat. On the other hand, low dissipation denotes that wave energy will be released on the beach and dune, which may lead to overtopping events and ultimately to the breeching of the barrier. Thus, “safe” wave energy dissipation process should occur between those extremes.
The wave energy dissipation assessment with the Dean functions, which assumed that all dissipation occurred onshore the –6 m isobaths, are contained in Table 3. Scrutiny of that Table can be summarized as follows:
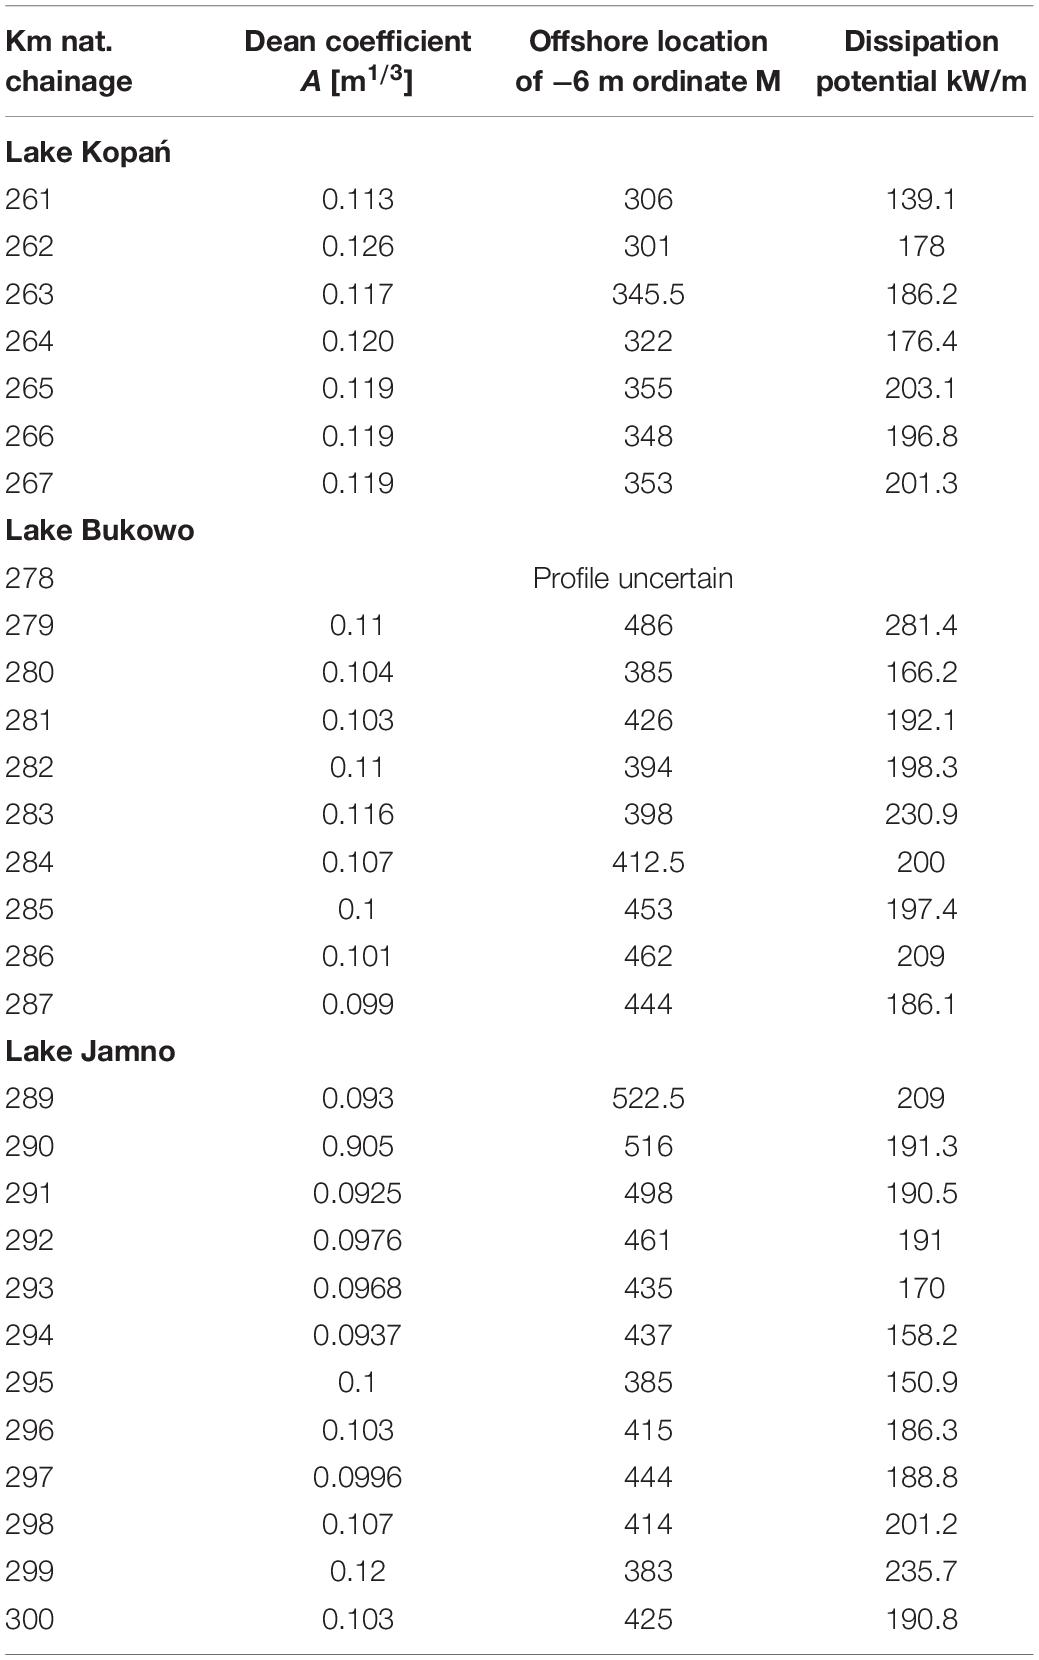
Table 3. Wave energy dissipation for seabed survey 2005-6 using Dean function concept.
(1) Wave energy dissipation along Lake Kopań barrier grows from NE to SW from almost 140 kW/m to some 200 KW/m; therefore, its northern stretch seems more exposed to overtopping and breaching,
(2) No particular pattern could be deduced for the dissipation at Lake Bukowo barrier; adjacent profiles exhibit large discrepancies,
(3) Lake Jamno barrier is clearly weaker at its center, so this region appears to be most prone to breaching events,
(4) The surf zone at Kopań barrier is narrowest, so beach profiles there are the steepest. It is corroborated by the greater values of Dean parameter evaluated for that barrier; it points again to the greatest exposure of Kopań barrier to sediment depletion.
The analysis of wave energy dissipation with the concept of approximate monotonic seabed onshore the inflection point is presented in Table 4. For the Kopań barrier roughly the same pattern is observed, i.e., the NE corner with lower and SW one with higher dissipation potential. There are notable exceptions at km 261 (northeastern-most profile) with 139.1 KW/m (Table 3) vs. 248.8 KW/m (Table 4), and at km 264 with 176.4 KW/m (Table 3) vs. 106 KW/m (Table 4). Such discrepancies highlight impacts of local seabed features, e.g., bar steepness. It should not be surprising, as they clearly point to marked alongshore variations of wave energy dissipation process in nearshore regions. On the other hand, the Dean functions tend to average out such local features, which may sometimes lead to wrong identification of possible localized erosion spots. For Bukowo the analysis with approximate monotonic seabed concept revealed the same lack of any general pattern of wave energy dissipation. Thus, the results were quite similar to those obtained using the Dean functions. However, the estimates of energy dissipation were vividly lower at 6 out of 9 profiles. The most drastic ones were found at km 285 with 197.4 KW/m (Table 3) vs. only 97 KW/m (Table 4), and km 287 with 186.1 KW/m (Table 3) vs. just 59 KW/m (Table 4). Only at km 283 the Dean function based estimate was lower with 230.9 KW/m (Table 3) vs. 286.1 KW/m (Table 4). In all, these results again highlight the role of local morphological features; its persistence could only be ascertained when more geo-referenced measurements are available. Finally, the results for the Jamno barrier followed a similar general outcome as for the Bukowo barrier; at 9 out of 12 beach profiles the wave energy dissipation was found lower than that evaluated with the Dean functions. The most notable discrepancy was found at km 297 with 188.8 KW/m (Table 3) vs. only 94.2 KW/m (Table 4). Importantly, the lowest dissipation was identified again in the central part of the barrier at km 294 and 295. At km 294 both methods produced the values of 158.2 KW/m (Table 3) vs. 143.4 KW/m (Table 4), whereas at km 295 the values of 150.9 KW/m (Table 3) vs. 132.9 KW/m (Table 4) were received. In brief, both methods of evaluation of wave energy dissipation proved to be valuable tools for the examination of beach resilience against erosion: the use of Dean profiles reveals general characteristics of given coastal segments, whereas the approximate monotonic seabed concept allows for detailed, profile by profile identification of potential erosive hot spots. Also, it appears that the Dean functions provide the upper and the approximate monotonic seabed the lower limit of wave energy dissipation assessment. In all, full potential of the proposed methodology will be exploited, when more comprehensive surveys of nearshore bathymetry are done, because they will allow for elaboration of full spatiotemporal characteristics of neashore seabed and shoreline evolution, in particular the evolution and persistence of erosion hot spots, development of local trends in coastal evolution and the growing impacts of climate change.
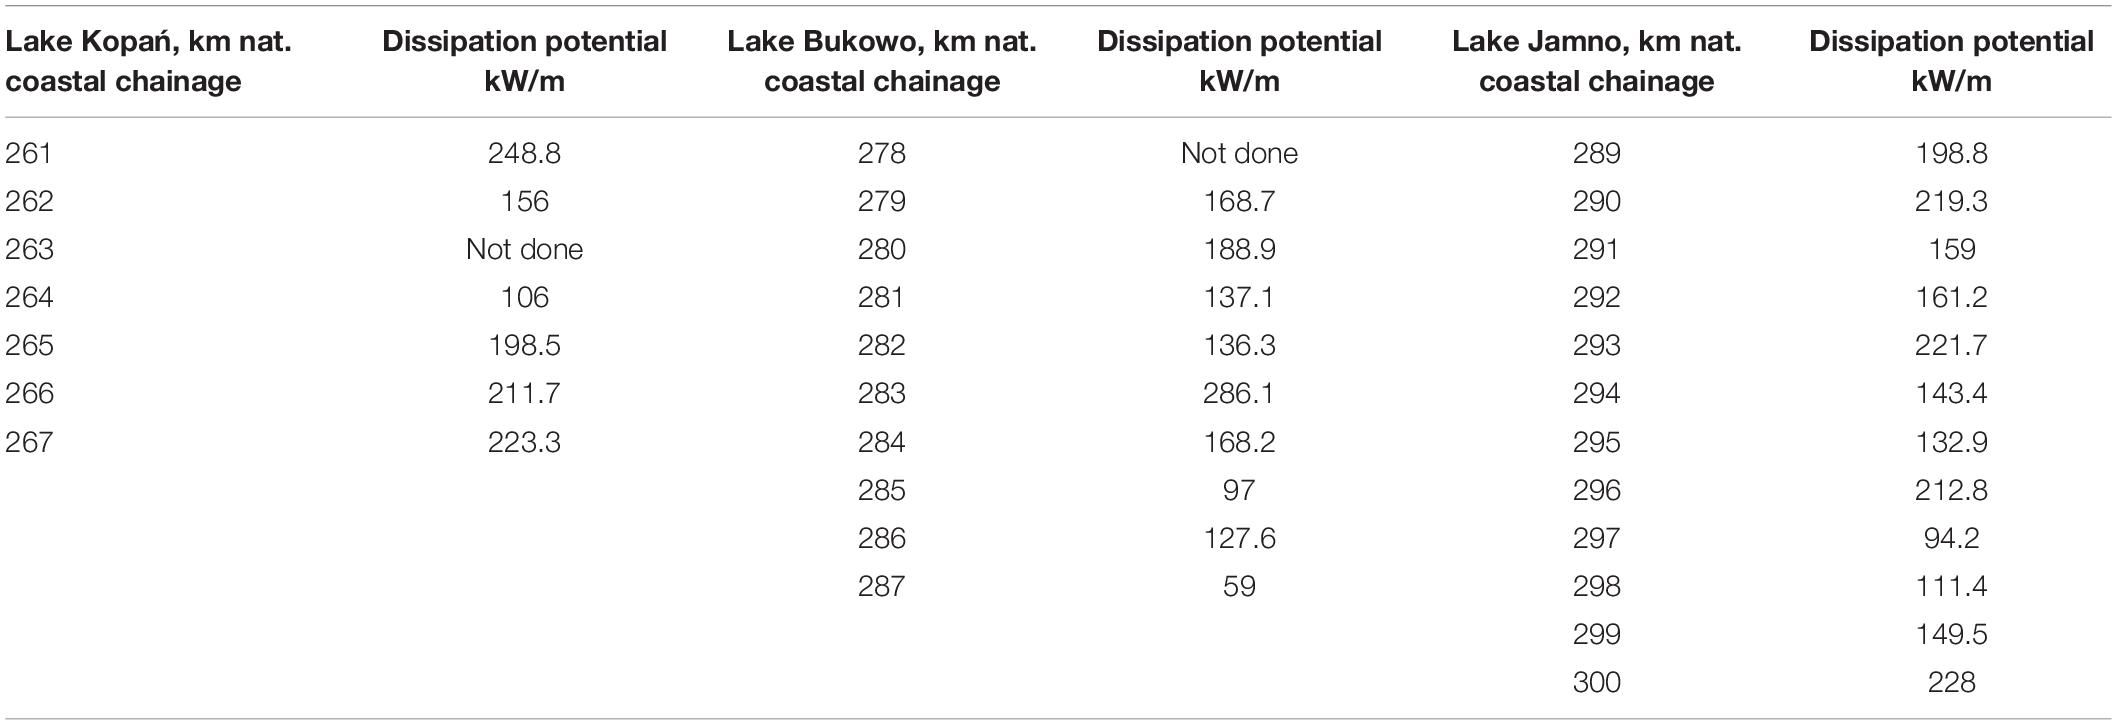
Table 4. Wave energy dissipation for seabed survey of 2005-6 using monotonic seabed concept.
The third, major part of the analysis consisted of simulations of effects of extreme events on the three barriers. They were executed using the XBeach package for conditions of an event with the recurrence period of 20 years. Thus, following Boniecka et al. (2013), the (peak) wave period was set at T = 8.5 s and the significant wave height at Hs = 5.71 m. Next, following Wiśniewski et al. (2009) the value of storm surge was set at 1.3 m, roughly corresponding to the return period of 20 years; the sea level rise effect was included by adding extra 0.7 m, jointly producing a storm lea level of 2 m above the current msl. Finally, following British Standard Code of practice for Maritime structures (2000) and Dnv-Os-J101 (2011), the duration of event was set at 3 h, i.e., the effects of storm peak were investigated. Other assumptions included a westerly wave approach, reflecting the prevailing wave approach, so the angle between the studied beach profiles and the azimuth of wave approach was 30°. This oblique approach was also intended to reduce unrealistic zones of sediment depletion/deposition, usually observed for shore normal wave approach in the absence of longshore sediment transport. As regards the modeling rationale, it was assumed at this stage of investigations that the shoaling effect and the resulting wave breaking are the prime drivers of beach evolution, so 1D modeling framework was assumed and the following settings were adopted:
(1) The JONSWAP spectrum was adopted with default peak concentration coefficient γ = 3.3 and cosine power 2s directional spreading model with s = 20;
(2) Maximum (minimum) frequency range was set at 1 Hz corresponding to the wave period T = 1 s (0 Hz and T = ∞);
(3) The wave breaking parameter was set at γb = 0.78, which is a typical value for short and steep waves in the Baltic Sea: it departs from default XBeach the value of 0.55, which produced unrealistic results – earlier initiation of wave breaking unrealistically reduced the impact of storms on the dunes – it was the only non-default parameter value adopted in the simulations after some initial preliminary runs;
(4) Chezy bottom friction coefficient c = 55 was adopted, assuming that the friction dissipates only very small portion of wave energy;
(5) The wave approach sector of ± 45° about the main westerly wave direction was defined; its directional resolution was coarsely parameterized with the bin angle of 20°, which was deemed sufficient for 1D simulations.
The XBeach simulations were carried out for two variants: (a) the storm surge of 1.3 m corresponding to the recurrence period of 20 years, and (b) the same surge of 1.3 m plus 0.7 m attributed to sea level rise, producing the total surge of 2 m. Figure 7 presents the results of the simulation for Lake Kopań at km 266 for the surge of 1.3 m. It can be seen that seabed changes embraced the area between the dune foot and the trough deep in close shoreline proximity; it indicates sediment depletion from the emerged beach and the dune. Even though the bar offshore that trough was not reconfigured, the dune was completely obliterated, which means that the storms statistically recurring every 20 years will produce overtopping of the barrier and (vast) intrusion of saline water without any climate change induced sea level rise. The longshore extent of overtopping at Lake Kopań barrier can be very wide; Figure 3, showing the geological cross-section and beach configuration at km 262: the dune there is as flimsy as it is at km 266, where the storm consequences were simulated. Hence, protection of Lake Kopań in the form of the barrage, presented in Figure 2 bottom right, appears to be a reasonable approach. Ultimately, it should be extended along the entire barrier to ensure the protection of biodiversity of the lake and surrounding marshes in a NATURA2000 area. It will result in ability to control salinity regimes in the lake, which should allow only limited intrusions of marine water through the inlet during storms. The western and eastern terminus of the barrier can be identified upon inventory of morphological and volumetric parameters of the dunes along the barrier. The results for 2 m surge were not shown, because they were almost identical to those for the surge of 1.3 m. This means that even without climate change effects Lake Kopań barrier is already extremely vulnerable.
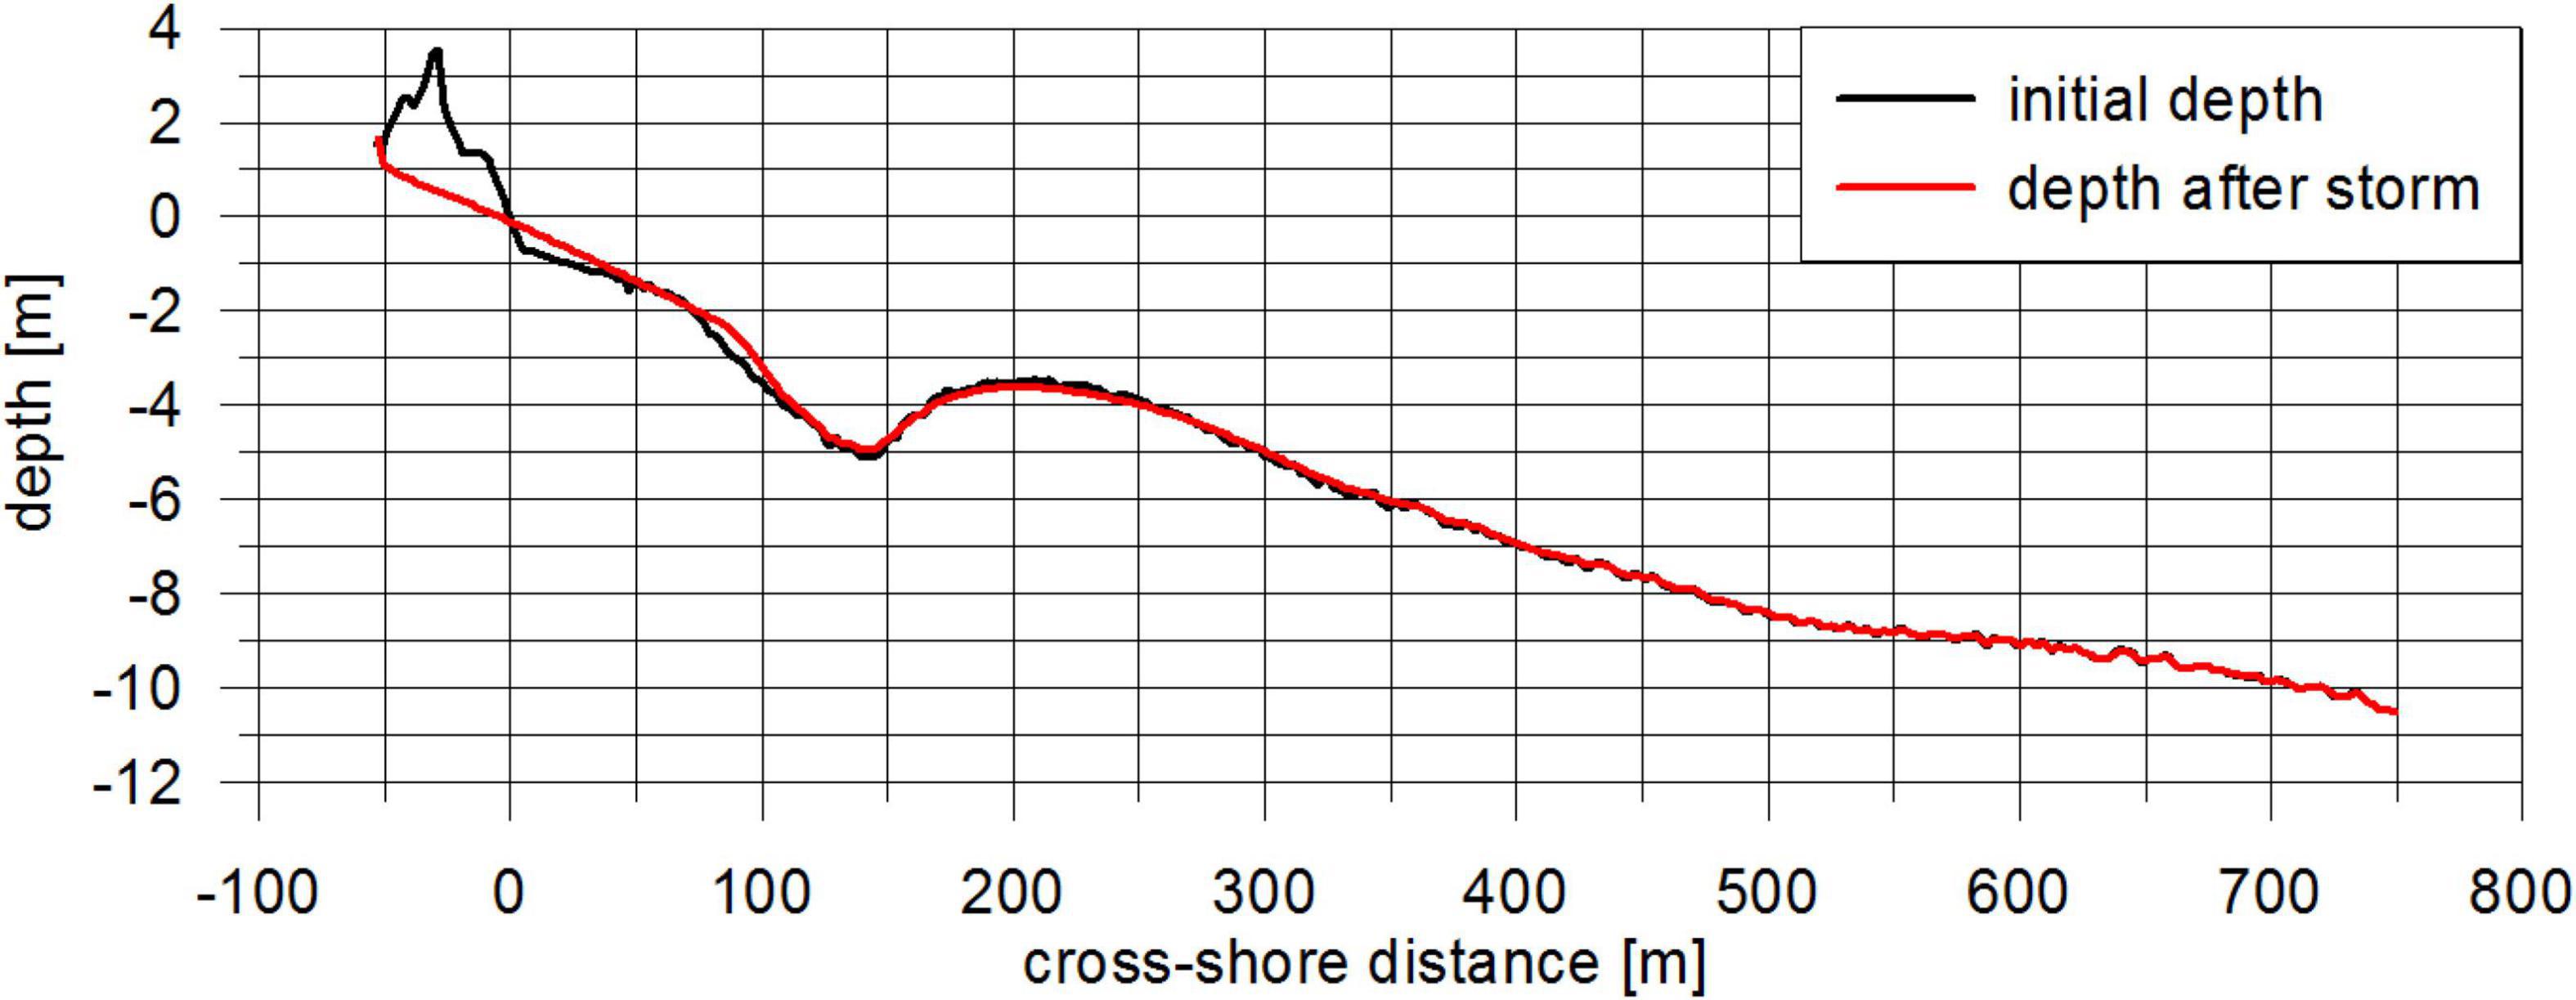
Figure 7. Results of simulation of storm effect for Kopań barrier, km 266, total surge 1.3 m.
Figure 8 demonstrates results of the simulation for Lake Bukowo at km 285. The dune there is much more robust. The cross-shore range of dune height of 6 m and more above msl is in the order of 50 m and more. The results for both surges indicated that such robust dunes survived the storm despite losing 5–10 m of their massif facing the sea. This is a very positive outcome, because it demonstrates that such dune configuration provides decent protection against overtopping and breaching of the barrier, also under the consequences of climate change. Moreover, it indicates another avenue of the protection of vulnerable barriers by maintaining sufficiently large dune strip. For this purpose, detailed inventory of dune morphology and volume along the barrier should be executed. Finally, it will remain to be decided whether the reconstruction of dunes should include construction of built-in gabions inside their massifs to provide additional protection and minimize dune retreat after heavy storms. Such practices are common near the root of Hel Peninsula, Figure 1A, where post-storm maintenance consists in beach fills of the beach and the dune, executed soon after the heavy storm so that the gabions are buried again. In this way, minimum interference into the natural landscape is achieved, harmful wave reflections against exposed gabions are prevented and the sediment budget is improved.
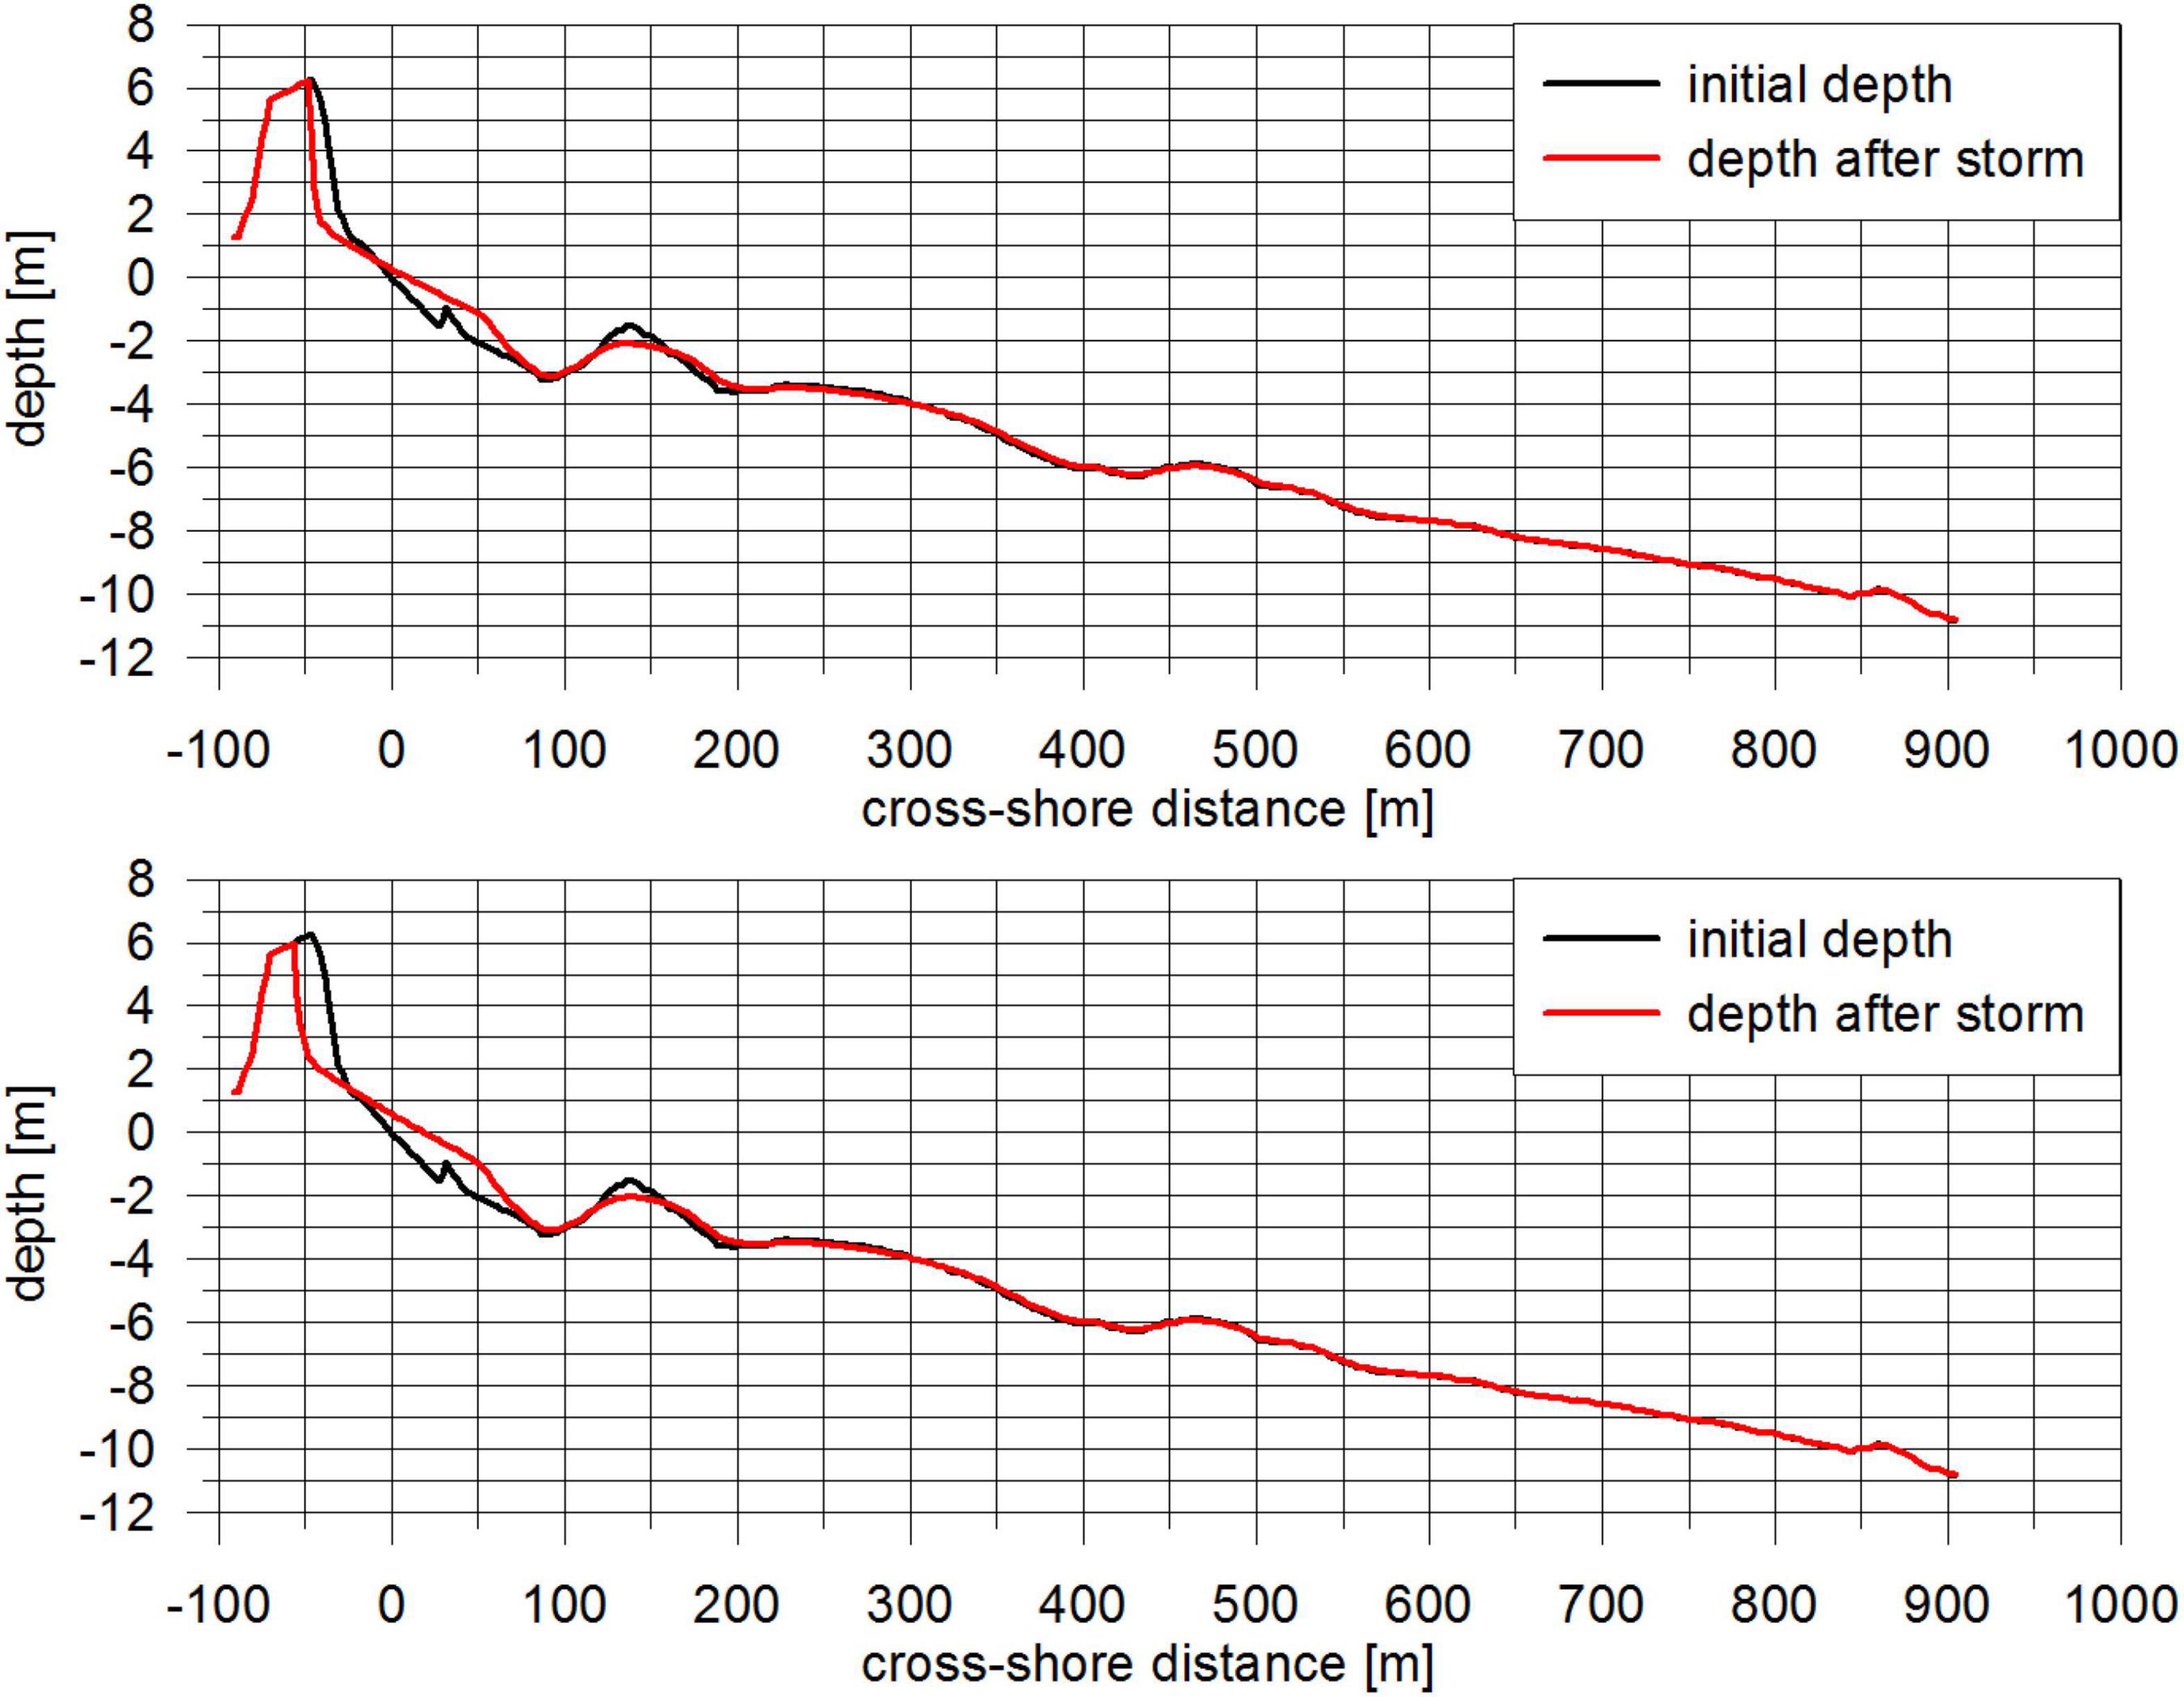
Figure 8. Results of simulation of storm effect for Bukowo barrier, km 285: surge 1.3 m (top), 2 m (bottom).
Figure 9 presents the result of simulation for Lake Jamno barrier at km 295 and the surge of 1.3 m. The results are very similar to those obtained for Lake Kopań barrier: the dune was completely obliterated, which indicates the barrier is unable to prevent overtopping by storms statistically occurring 5 times per century without climate change effects. Hence, the results for 2 m surge were not shown. Obliteration of the dune does not mean that the maintenance of the barrier will require construction of another storm barrage. Such conclusion is justified by the results for Lake Bukowo indicating that sufficient protection can be achieved by building-up and maintaining the dune strip with the approximate width of 50 m and height of ca. 5 m (about 250 m3/m). It should be expected that dunes with gabion reinforcement will not need such big volumes and will be equally effective. On the other hand, they will require quick post-storm nourishments to prevent undesired wave reflections against the gabions.
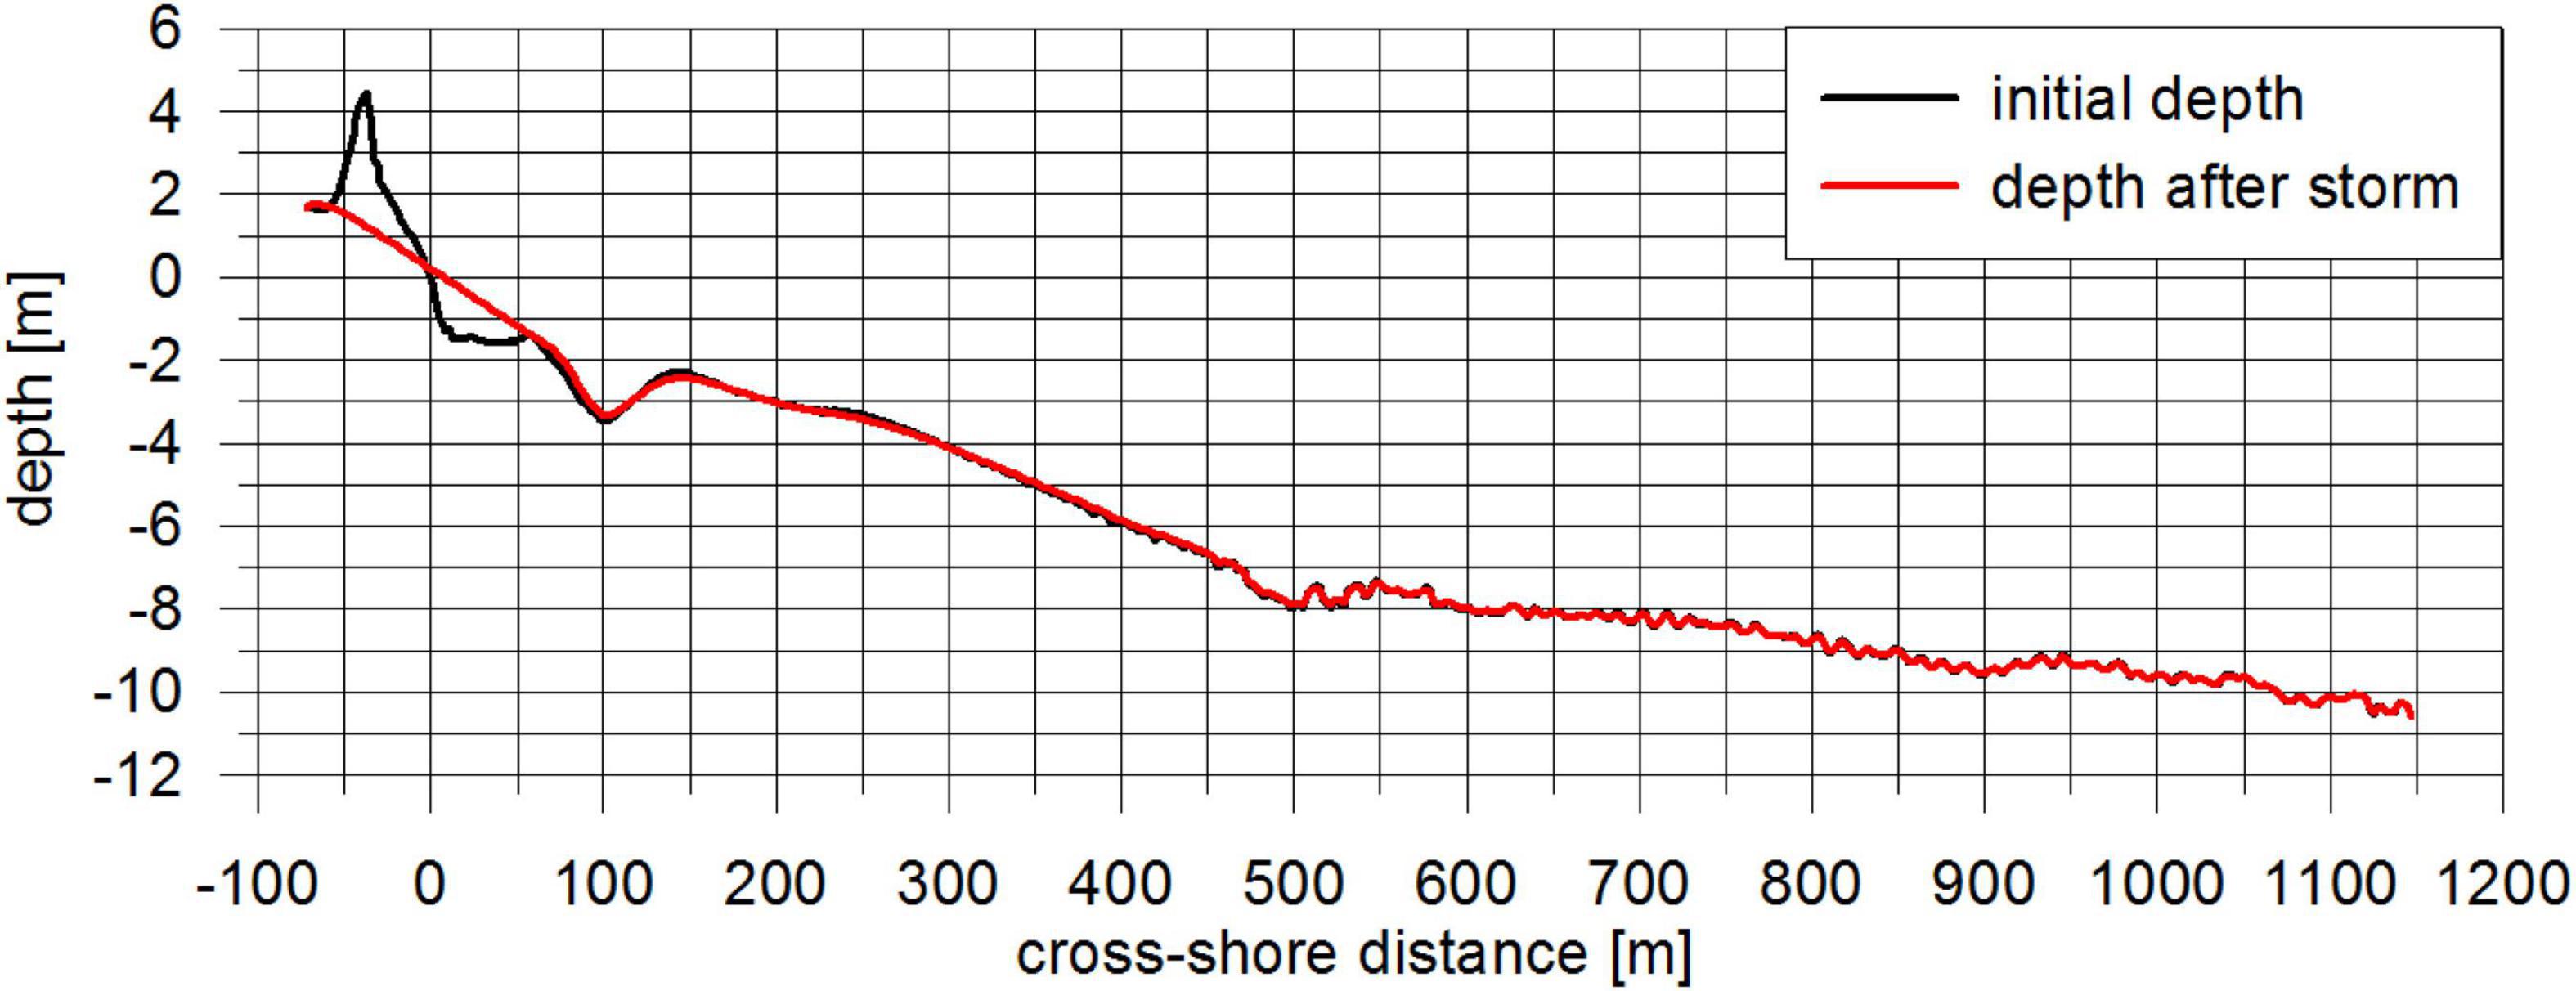
Figure 9. Results of simulation of storm effect for Jamno barrier, km 295, total surge 1.3 m.
Conclusion and Recommendations
(1) The analysis of geological information revealed very precarious condition of coastal lake barriers on Poland’s Baltic Sea coast due to severe scarcity of sand in their bodies and adjacent nearshore zone. The extent of precariousness was not accounted for in previous research. Sand scarcity combined with climate change effects can enhance the rate of degradation of the barriers without human interventions.
(2) The equilibrium profiles revealed the steepest nearshore seabed slope at lake Kopań barrier. Together with geological information it gives grounds for the conclusion that this barrier is the most fragile: construction of artificial barrage there is a practical confirmation of this statement. Moreover, this method can localize erosion hot spots, but the joint assessment of geological cross-sections, equilibrium profiles and XBeach simulations show that the conditions of the dunes has the greatest impact on survival of the barriers in future.
(3) The XBeach simulations showed that even without climate change effects at least two barriers will be experiencing breaching and overtopping events during storms statistically occurring every 20 years. Again, it illustrates the urgent need for their maintenance. Furthermore, the simulations demonstrated that dune condition is the most crucial element of any maintenance strategy: a sufficiently wide dune at lake Bukowo survived the storm with 20 years of recurrence period also when the sea level rise of 0.7 m was added.
(4) The maintenance of important ecosystem services at protected NATURA 2000 areas of barrier lakes will be the most vital driver of coastal protection of their barriers. The most pressing issue is stabilization of dunes:simple replenishment of sand, either by wooden sediment traps, like the fences seen in Figure 6 bottom left, or by the placement of sand by bulldozers will be insufficient and short lasting. A solution like that seen in Figure 2 top left (geo-textile apron covered by stone mattress, placed in front of dune foot) can be recommended, although ultimately, the dune should be artificially reconstructed and reinforced with built-in gabion core in its massif. Such solution should provide ultimate last resort defense preventing breaching of the barriers during ultra-long events once the dune sediment is depleted. The maintenance of such artificial dunes by quick post-storm nourishment of the massif should be relatively straightforward and much less expensive than the construction of two additional storm barrages at Bukowo and Jamno. The barrage at Lake Kopań barrier demonstrates its weakest character, also evidenced by the XBeach simulation showing that the dune there entirely collapsed after 3 h of harsh hydrodynamic regime without any climate change effects.
(5) Reinforcement of dunes should be done together with the repair of groin fields at Lake Bukowo and Kopań. When applied together with beach fills the groins usually extend the residence lifetime of the fill by ca. 30 %, (Różyński et al., 2012). This positive effect can be also deduced from XBeach simulations that demonstrated that the sediment depleted from the dunes moved offshore between the shoreline and deepest trough; repaired groins will therefore serve to extend the residence time of that sand in the nearshore region, slowing down the ultimate sediment loss from the system by unsaturated longshore sediment transport. Groins detached from the shoreline must be repaired at earliest possible convenience as they vastly accelerate the erosion by creation of privileged pathways for the highly concentrated longshore current.
(6) In general, protection of the barriers can still be achieved using the soft measures with minimum use of artificial materials (geo-textiles, PVC coated wire for gabion boxes) in intermediate perspective. This conclusion is supported by the XBeach simulation of storm consequences at Lake Bukowo, which demonstrated that the dune there has sufficient volume to survive very heavy events. Alongshore seabed variations, identified with approximate equilibrium profiles, can aid in identification of the most breaching prone locations. Nevertheless, local dune condition remains critical for high likelihood of breaching/overtopping events.
(7) The simulations did not show tendencies toward exposure of weaker sediments to wave action. In general, no significant seabed changes caused by the storm were observed at intermediate depths, beyond the deepest trough. It again demonstrates that most protection effort should be concentrated on dune maintenance, at least in mid-21st Century perspective and that the (repaired) groins should be used as a secondary measure.
(8) The study can serve as outline for studying similar systems made from mixed sand-silt-loam-clay sediments. Such systems can be encountered in areas of past glaciations; e.g., the vast area in the south Baltic Sea from the Baltic coasts of Denmark through Germany, Poland, Kaliningrad exclave of Russia, Lithuania, Latvia and Estonia, up to the Russian shores in the Gulf of Finland. Other areas belonging to various marine basins may become vulnerable as a result of the climate change induced loss of permanent ice cover exposing mixed sedimentary deposits to wave action.
Data Availability Statement
The raw data supporting the conclusions of this article will be made available by the authors, without undue reservation.
Author Contributions
GR contributed to research concept and execution of part of computations (50%). GRC contributed to execution of part of computations (50%). Both authors contributed to the article and approved the submitted version.
Funding
This research presented in this manuscript was financed and conducted under the EU H2020 project large scale RESToration of COASTal ecosystems through rivers to sea connectivity (REST-COAST), Grant No: 101037097.
Conflict of Interest
The authors declare that the research was conducted in the absence of any commercial or financial relationships that could be construed as a potential conflict of interest.
Publisher’s Note
All claims expressed in this article are solely those of the authors and do not necessarily represent those of their affiliated organizations, or those of the publisher, the editors and the reviewers. Any product that may be evaluated in this article, or claim that may be made by its manufacturer, is not guaranteed or endorsed by the publisher.
References
BACC II (2015). The BACC II Author Team. Regional Climate Studies. Second Assessment of Climate Change for the Baltic Sea Basin. Cham: Springer. doi: 10.1007/978-3-319-16006-1
Bierstedt, S. E., Hünicke, B., and Zorita, E. (2015). Variability of wind direction statistics of mean and extreme wind events over the Baltic Sea region. Tellus A Dyn. Meteorol. Oceanogr. 67:29073. doi: 10.3402/tellusa.v67.29073
Boniecka, H., Gajda, A., Gawlik, W., Marcinkowski, T., Olszewski, T., Szmytkiewicz, M., et al. (2013). Monitoring and investigations of the current condition of the coast–assessment of efficiency of coastal protection under ‘Coastal Protection Program’. Maritime Inst. Gdańsk Int. Rep. 6793:250.
British Standard Code of practice for Maritime structures (2000). British Standard Code of practice for Maritime structures Part 1. General Criteria, BS 6349: Part 1. London: The British Standards Institution.
Coastal Engineering Manual (2008). stocktickerCEM (Coastal Engineering Manual) Part stocktickerIII-3, Cross-Shore Sediment Transport Processes. Washington, DC: US Army Corps of Engineers.
Dubrawski, R., Gawlik, W., Zawadzka, E., Boniecka, H., and Gajecka, A. (2008). The Elements of Morhodynamic Monitoring of the Polish Coast. Gdańsk: Wydawnictwo Instytutu Morskiego, 1–113.
Dubrawski, R., and Zawadzka-Kahlau, E. (2006). The Future of Coastal Protection of the Polish Coast. Gdańsk: Wydawnictwo Instytutu Morskiego, 1–302.
ekoszalin (2022). Available online at: www.ekoszalin.pl (accessed January 18, 2022).
Hanson, H., and Kraus, N. (1989). GENESIS, Generalized Model for Simulating Shoreline Change. Technical Rep. CERC 89-19, 1-252. Washington, DC: U.S. Army Engineer Waterways Experiment Station.
Kruk-Dowgiałło, L., Michałek, M., Boniecka, H., Typiak, M., Mioskowska, M., Błeńska, M., et al. (2018). Draft prediction of environmental impacts of spatial management plans for internal waters, territorial sea and exclusive economic zone in 1:200,000 scale. Maritime Inst. Gdańsk Int. Rep. 7127: 522.
Łabuz, T. (2015). “Chapter: 20 Environmental impacts—coastal erosion and coastline changes,” in The BACC II Author Team, Second Assessment of Climate Change for the Baltic Sea Basin, Regional Climate Studies (Berlin: Springer), 381–396. doi: 10.1007/978-3-319-16006-1_20
Łabuz, T. (2018). Erosion of sandbar dunes of Koszalin Bay resulting from extreme storm events Barbara and Axel from the turn of 2016 and 2017. Geogr. Rev. 90, 435–477. doi: 10.7163/PrzG.2018.3.3
Majewski, A., Dziadziuszko, Z., and Wiśniewska, A. (1983). A monograph of storm floods 1951-1975. Wkił 1983:215.
Official Journal of the European Union (2019). COMMISSION IMPLEMENTING DECISION (EU) 2019/18 of 14 December 2018 Adopting the Twelfth Update of the List of Sites of Community Importance for the Continental Biogeographical Region (Notified Under Document C(2018) 8528). Available online at: https://eur-lex.europa.eu/legal-content/EN/TXT/?qid=1601462979429&uri=CELEX:32019D0018 (accessed september 30, 2020).
Rączkowski, W., and Sroka, J. (2007). The History and Culture of the Sławno Land. Maitland, NSW: Region Publishers, 1–32.
Różyński, G. (2018). Critical examination of shoreface sediment volume as an indicator of coastal stability in Poland. J. Waterway Port Coast. Ocean Eng. 144. doi: 10.1061/(ASCE)WW.1943-5460.0000449 [Epub ahead of print].
Różyński, G. (2020). Parameterization of erosion vulnerability at coasts with multiple bars: a case study of Baltic Sea coastal segment in Poland. Coast. Eng. 159:103723. doi: 10.1016/j.coastaleng.2020.103723 Ró?zyt’nski
Różyński, G. (2021). Unexpected property of dean-type equilibrium beach profiles. J. Waterway Port Coast. Ocean Eng. 147:06021001. doi: 10.1061/(ASCE)WW.1943-5460.0000664
Różyński, G., Basiński, T., Ostrowski, R., Pruszak, Z., Schönhofer, J., Skaja, M., et al. (2012). Deteriorated Groynes. Coastal Wiki. Available online at: http://www.coastalwiki.org/coastalwiki/Deteriorated_groynes (accessed January 18, 2022).
Różyński, G., Pruszak, Z., Okrój, T., and Zeidler, R. B. (1999). “Depth of closure and seabed variability patterns,” in Proceedings of the 26th ICCE Conference (Reston, VA: American Society of Civil Engineers (ASCE)), 2926–2939. doi: 10.1061/9780784404119.222
Sepp, M., Post, P., Mändla, K., and Aunap, R. (2018). On cyclones entering the Baltic Sea region. Boreal Environ. Res. 23, 1–14.
Uścinowicz, S., Zachowicz, J., and Przeździecki, P. (2007a). Geodynamic map of Polish Baltic Sea coastal region. Sheets 1-64. Polish Nat. Geol. Inst.
Uścinowicz, S., Zachowicz, J., and Przeździecki, P. (2007b). Geodynamic map of Polish Baltic Sea coastal region. Sheet 21. Wicie Polish Nat. Geol. Inst.
Uścinowicz, S., Zachowicz, J., and Przeździecki, P. (2007c). Geodynamic map of Polish Baltic Sea coastal region. Sheets 18 łazy. Polish Nat. Geol. Inst.
Uścinowicz, S., Zachowicz, J., and Przeździecki, P. (2007d). Geodynamic map of Polish Baltic Sea coastal region. Sheet 17 Unieście. Polish Nat. Geol. Inst.
Wentworth, C. K. (1922). A scale of grade and class terms for clastic sediments. J. Geol. 30, 377–392. doi: 10.1086/622910
Keywords: Baltic Sea, climate change, coastal lake barriers, coastal sediments, nearshore hydrodynamics
Citation: Różyński G and Cerkowniak GR (2022) Resilience of Coastal Lake Barriers in Poland in Light of Geological and Bathymetric Data and Hydrodynamic Simulations. Front. Mar. Sci. 9:815405. doi: 10.3389/fmars.2022.815405
Received: 15 November 2021; Accepted: 07 January 2022;
Published: 09 February 2022.
Edited by:
Matteo Postacchini, Marche Polytechnic University, ItalyReviewed by:
Justin Shawler, College of William & Mary, United StatesAlessandra Saponieri, University of Salento, Italy
Copyright © 2022 Różyński and Cerkowniak. This is an open-access article distributed under the terms of the Creative Commons Attribution License (CC BY). The use, distribution or reproduction in other forums is permitted, provided the original author(s) and the copyright owner(s) are credited and that the original publication in this journal is cited, in accordance with accepted academic practice. No use, distribution or reproduction is permitted which does not comply with these terms.
*Correspondence: Grzegorz Różyński, Z3J6ZWdvcnpAaWJ3cGFuLmdkYS5wbA==