- 1State Key Laboratory of Numerical Modeling for Atmospheric Sciences and Geophysical Fluid Dynamics, Institute of Atmospheric Physics, Chinese Academy of Sciences, Beijing, China
- 2State Key Laboratory of Cryospheric Science, Northwest Institute of Eco-Environment and Resources, Chinese Academy of Sciences, Lanzhou, China
- 3College of Earth and Planetary Sciences, University of Chinese Academy of Sciences, Beijing, China
- 4Center for Ocean Mega-Science, Chinese Academy of Sciences, Qingdao, China
- 5Beijing Institute of Applied Meteorology, Beijing, China
The effects of ocean chlorophyll on the mode water subduction rate in the subtropical mode water (STMW) and central mode water (CMW) in Pacific Ocean are investigated by performing two ocean-only experiments, using two different solar radiation penetration schemes, one with and one without chlorophyll effects. The biological impacts on mixed layer depth (MLD), upper ocean temperature and density are analyzed. Results show that the subduction rates of both STMW and CMW are increased with the effects of ocean chlorophyll. The increase in the subduction rate is mainly caused by the increased lateral induction term, which is related to larger MLD gradient in early spring in the chlorophyll experiment.
Introduction
The winter mixed layer depth (MLD) in the northwestern and central Pacific Ocean shows significant seasonal variation. It reaches a maximum (approximately 200 m) in March (Figure 1A) along the Kuroshio Extension region. Separating the deep mixed layer from the shallow one in the rest of the subtropical gyre is a transition zone called the MLD front. At the cross point of the MLD front and outcropping line, water is inducted from the deep mixed layer into the main thermocline by the southeastward Sverdrup flow, forming a local potential vorticity (PV) minimum (Kubokawa, 1999; Xie et al., 2000; Xie et al., 2010). These vertically homogeneous water masses are called mode water. The subtropical mode water (STMW) was identified by Masuzawa (1969) and with vertical uniform layer of 25.2-25.6 σθ. It is formed just south of the Kuroshio and Kuroshio Extension between ~132°E and near the dateline. Nakamura (1996) identified the central mode water (CMW) with uniform layer of σθ 26.0-26.5. CMW is formed north of the Kuroshio Extension. A composite analysis of Argo data in 2003-2008 demonstrated that lighter (denser) CMW is formed at 33°-39°N (39°-43°N) extending from ~142°E to 160°W (Oka et al., 2011).
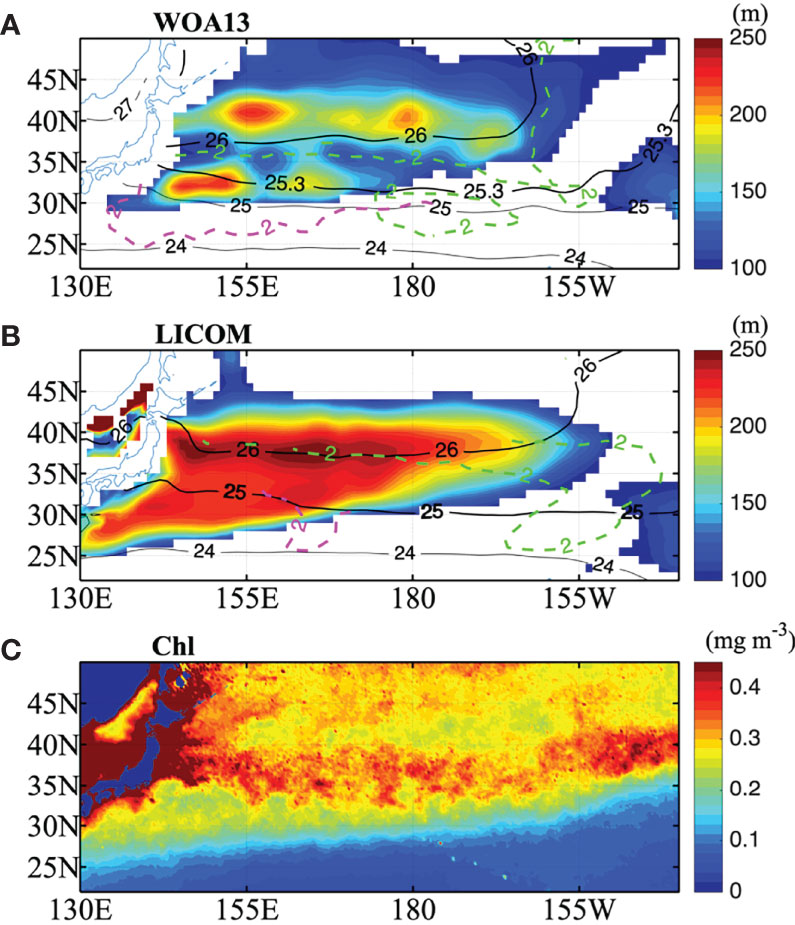
Figure 1 Figure 1 |(A) March climatology of the mixed layer depth larger than 100 m (shaded) and the density at the surface (black solid line) for WOA13 along with the PV= 2.0×10⁻¹⁰ m-1 s-1 on 25.3 σθ (magenta dashed) and 26 σθ (green dashed), bold solid black contour shows surface density at 25.3 σθ and 26 σθ . (B) is the same as (A) but for LICOM except dashed contour for PV= 2.0×10⁻¹⁰ m-1 s-1 on 25 σθ and 26 σθ , and bold solid contour for surface density at 25 σθ and 26 σθ . The lighter low PV layer (megenta dashed) corresponds to the core layer of the STMW, while the denser layer (green dashed) corresponds to the core layer of the CMW. (C) March climatology of chlorophyll concentration in mg m-3. The chlorophyll data is satellite-retrieved from the Sea-viewing Wide Field-of-view Sensor (SeaWiFS) covering the period from September 1997 to December 2007.
The winter MLD in the mode water formation region is mainly caused by local surface cooling (Iwamaru et al., 2010) and ocean dynamic associated with westward propagating Rossby waves from the central North Pacific (Qiu and Chen, 2005), which could cause pycnocline depth anomalies, modify the upper ocean stratification and wintertime mixed layer (Sugimoto and Hanawa, 2010; Lin et al., 2020). Mode water memorizes wintertime ocean-atmosphere interactions and might reemerge in the surface mixed layer in the subsequent winter (Bingham, 1992; Qiu and Chen, 2006; Oka and Qiu, 2012) and is believed to play an important role in climate variability (Hanawa and Kamada, 2001).
In addition to dynamic and thermodynamic processes, some biological processes, such as phytoplankton in the euphotic layer, can also affect the upper mixed layer through their impacts on the vertical distribution of solar radiation (Lewis et al., 1983; Lin et al., 2007; Ma et al., 2014; Ma et al., 2021). The chlorophyll in the ocean could trap more heat in the upper layer, and less solar radiation could reach the subsurface. As a result, chlorophyll could affect the vertical distribution of penetrative solar radiation and modulate the upper ocean temperature and MLD. Earlier studies have shown that the existence of phytoplankton could result in surface warming, subsurface cooling, and mixed layer shoaling (e.g., Lewis et al., 1983; Lewis et al., 1990; Sathyendranath et al., 1991; Siegel et al., 1995). Other studies found that ocean biological effects could lead to SST cooling in the equatorial Pacific upwelling region (Nakamoto et al., 2001; Anderson et al., 2007; Lin et al., 2007), the eastern tropical Indian Ocean (Liu et al., 2012a; Ma et al., 2015) and the South China Sea (Ma et al., 2012). With the uneven distribution of chlorophyll in the upwelling region, horizontal and vertical density gradients could change, and lead to strengthened upwelling, decreased sea surface temperature (SST) and shallower MLD. In addition, the ocean chlorophyll also has a cooling effect in strong vertical mixing regions like the north Arabian Sea (Ma et al., 2014) and in mid-latitudes of the world’s oceans (Ma et al., 2021). In strong mixing regions, biological impacts on MLD are weak as solar penetration cannot affect such a deep depth. So, the biological impacts on MLD are closely related to the local dynamics.
Most previous studies on the effects of ocean chlorophyll have focused on the tropics, and little attention has been given to the mid-latitudes. In fact, ocean biological effects should not be neglected in the mid-latitudes. The chlorophyll concentration (Chl) shows a band of high values (>0.3 mg m -3) in the region of 30°-40°N in the North Pacific during the spring bloom (Figure 1C). Ma et al. (2021) found that SST cools (warms) and MLD shoals with biological effects in the mid-latitudes of the North Pacific Ocean during winter (spring). And the biological impacts on MLD are not evenly distributed. According to Xie et al. (2000), the winter MLD distribution is key to mode water formation. Therefore, we further want to know whether and to what extent ocean biological effects could impact the mode water subduction rate in the north and central Pacific region.In the present study, the effects of ocean chlorophyll on the mode water subduction rate in the northwestern and central Pacific region were investigated by comparing two numerical experiments. The rest of the paper is organized as follows. In Section 2, we describe the model and experiments used in the study. In Section 3, we analyze the biological effects on the mode water subduction rate and investigate the mechanism. In Section 4, we summarize these results.
Model and Experiments
Observational Data
The climatological ocean temperatures and salinities used for density and PV are from World Ocean Atlas 2013 (WOA13) (Locarnini et al., 2013; Zweng et al., 2013), with a resolution of 1° × 1°. Satellite-retrieved Chl data from the Sea-viewing Wide Field-of-view Sensor (SeaWiFS) (http://oceandata.sci.gsfc.nasa.gov/SeaWiFS/Mapped/Monthly/9km/chlor/) are used in the present study to analyze the ocean chlorophyll effect. The data are monthly and cover the period from September 1997 to December 2007.
Model Description
The model used in this study is the State Key Laboratory of Numerical Modeling for Atmospheric Sciences and Geophysical Fluid Dynamics (LASG)/Institute of Atmospheric Physics (IAP) Climate System Ocean Model (LICOM), version 2 (Liu et al., 2004a; Liu et al., 2004b; Liu et al., 2012b). The zonal resolution of LICOM in the present study is 1°. The meridional resolution is 0.5° between 10°S and 10°N and then gradually decreases to 1° at 20° (N/S). The model has 30 levels in the vertical direction, with 15 uniform 10 m levels in the upper ocean and 15 nonuniform levels below 150 m. The forcing of the ocean model comes from both the Corrected Inter-Annual Forcing (CIAF) and the Corrected Normal Year Forcing (CNYF) of the Common Ocean-ice Reference Experiments (CORE) dataset (Large and Yeager, 2004).
A double exponential formula is employed to describe the penetration of solar radiation in LICOM:
Where Tr is called transmission function, I is downward solar radiation penetrating to a certain depth z and I0 is the downward solar radiation at sea surface. The first term on the right side of Eq. (1) represents the rapid attenuation in the upper 5m due to absorption of the red end of the spectrum, and the second term represents the attenuation of blue-green light below 10m (Paulson and Simpson, 1977). Jerlov (1968) classified the seawater according to the seawater transparency, and type I is considered to be clear water and with no biology. In LICOM, the seawater was hypothesized to be type I. Following Jerlov (1968), and R, L1 and L2 are set to 0.58, 0.35m and 23m, respectively. The pure water experiment referred to as NOCHL.
In the sensitivity run, the scheme proposed by Ohlmann (2003) is employed to represent the influence of Chl on solar radiation penetration (hereafter referred to as CLIMCHL). In CLIMCHL, all four parameters are functions of Chl (see Equation 5 and 6 of Ohlmann, 2003). In the CLIMCHL run, the 23 m penetration depth approximately corresponds to a Chl of 0.057 mg.m-3. The chlorophyll concentration in present study region is more than 0.057 mg.m-3 and the penetration depth is shallower than 23 m (figure not shown). Therefore, more solar radiation will be absorbed by the upper layer in the CLIMCHL run than in the NOCHL run and less solar radiation will penetrate below. The chlorophyll data used in the CLIMCHL run are the climatological SeaWiFS monthly mean. Both experiments were run for 10 years (1998-2007). More details about the model configuration can be found in Lin et al. (2007).
Model Evaluation
PV is defined as . ρ0 is the reference water density (1024 kg m-3), is the verticwal gradient of potential density, and f is the Coriolis parameter. The MLD is defined as the depth at which the water density is 0.125 kg m-3 denser than the sea surfaces (Levitus, 1983). In observations, the MLD maxima at approximately 200 m show two zonal bands at 40°N and 30°N (Figure 1A), which are key regions for the formation of low PV waters (Kubokawa, 1999). The simulated MLD does not fully capture this feature, with one zonal maxima band in the north of 35°N and with southern edge of MLD front slanting northeastward (Figure 1B). The maximum MLD in the model is deeper than that in the observations, with the maximum simulated MLD reaching up to 250 m. The biases of the MLD are mainly caused by the coarse horizontal resolution of this simulation.
Figure 2 shows the total volume of low PV water (less than 1.5×10⁻¹⁰ m-1 s-1) over the northwestern and central Pacific (135°E-155°W, 25°N-40°N) for the observations from the WOA13 and the LICOM simulation. Low PV water is clustered at 24.9-25.6 σθ and 25.7-26.5 σθ in WOA13. The lighter one is related to subtropical mode water (STMW) and the denser one is related to central mode water (CMW). In LICOM, the total volume of the low PV water for each density class shows a single peak in the CMW range and is clustered at 25.7-26.5 σθ. The mode water properties of CMW in the model are almost matched to the observation in both core layer density and total volume, with a peak at 26 σθ (Figure 2B). For STMW, low PV water in WOA13 is concentrated in narrow density ranges with higher magnitudes, with a peak at 25.3 σθ (Figure 2A). In LICOM, volume of low PV water in each density range is weaker and is almost equally distributed in a broad density range (Figure 2B).
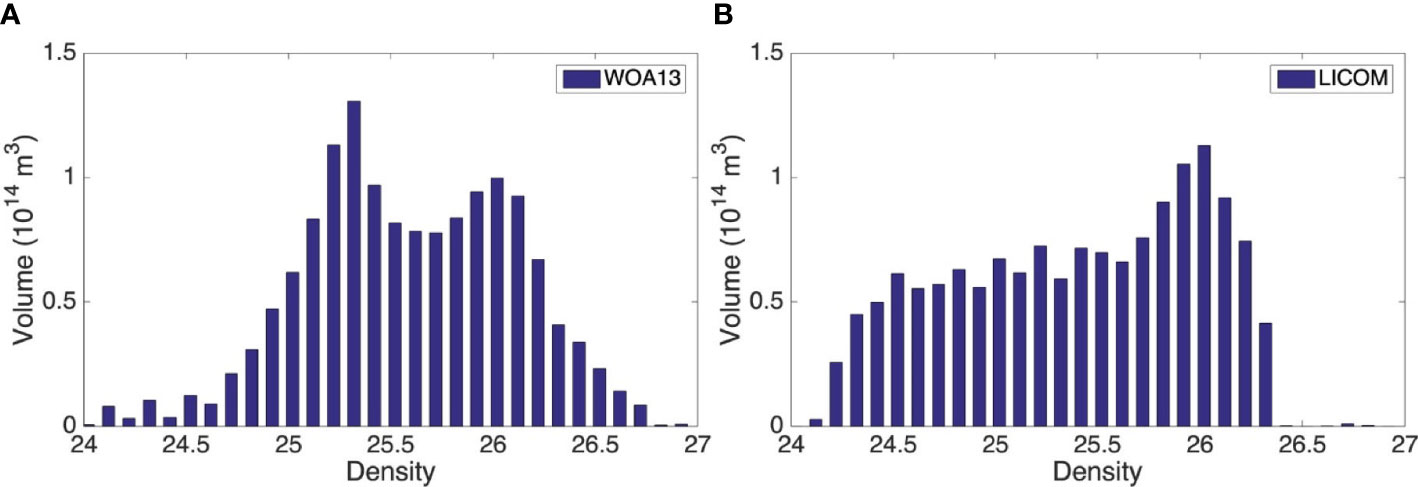
Figure 2 Volume of low PV water (less than 1.5×10⁻¹⁰ m-1 s-1) in March for each density class in the northwestern and central Pacific (135°E-155°W, 25°N-40°N) for (A) WOA13 and (B) LICOM. The interval is 0.1 kg m-3. Depth range is 0-300m.
The weaker PV minimum volume of STMW in model could also be seen in the horizontal distribution of PV minimum in Figure 1. The region between the 25.3 σθ (25 σθ) contour and magenta dashed contour shows the core layers of the STMW formation region for observation (LICOM). According to Kubokawa (1999) and Xie et al. (2000), an isopycnal PV minimum forms where the outcrop line (surface density isoline) intersects a MLD front. In observation, the MLD front is almost zonal, which is almost parallel to the outcrop line especially in the west of dateline (Figure 1A), so the PV minimum is in a broad region but concentrated only in a narrow density range. In the coarse resolution LICOM, the MLD front slants northeastward from the southwestern region of the subtropical gyre, the outcrop lines slant slightly southeastward (Figure 1B). As mode water with minimum PV forms where the outcrop line intersects the MLD front by lateral induction (Xie et al., 2000), the PV minimum is limited to a narrow region but in a wide density range (Figure 1B) and almost equally distributed (Figure 2B). So the low PV tongue of the STMW is smaller in the LICOM than in the observations. The meridional MLD gradient maximum west of dateline in LICOM lies eastward compared to WOA13, so the location of core layer PV minimum in STMW also lies eastward in LICOM.
The northern band of the deep MLD extending to approximately 160°W is related to the CMW, with a denser PV minimum layer (Figure 1). The region between the 26 σθ contour and green dashed contour shows the core layers of the CMW formation region for both observation and LICOM. As the MLD front east of date line in LICOM lies eastward compared to WOA13, the low PV region of CMW in the model extends much farther eastward (Figure 1B).
The seasonal variation in the simulated MLD agrees well with the observations, with the deepest MLD (more than 200 m) in March and the shallowest MLD (less than 20 m) in summer, except that the simulated MLD is deeper than the observed MLD, especially in early spring (Figure 3A). The observed and simulated SSTs also show similar seasonality, except the SST in the model is warmer than that in the observations on average (Figure 3B). The subsurface temperature shows warmer water in the south and cooler water in the north (figure not shown), which leads to lighter water in the south and denser water in the north. As we focus on the difference between experiments, the effects of these biases could be canceled out.
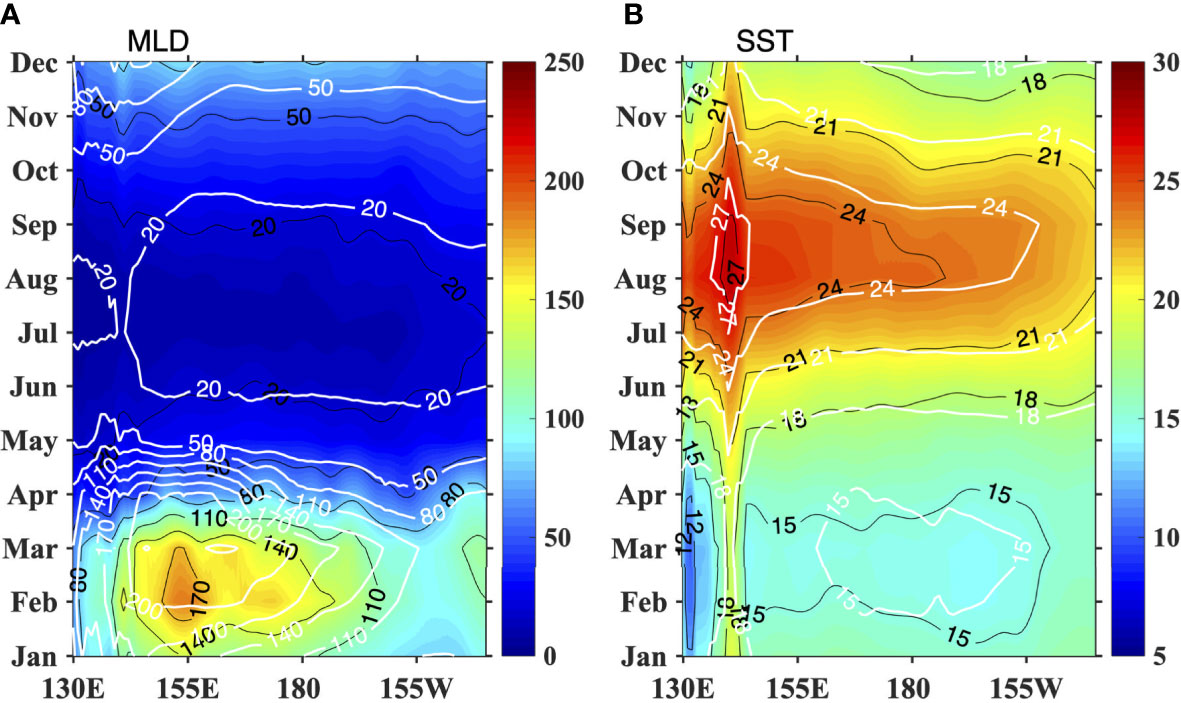
Figure 3 The seasonal variation in (A) MLD (m), (B) SST (°C) averaged between 30°N and 40°N in the north Pacific. The shaded and black contours are for WOA13, and the while contours are for LICOM.
Results and Discussion
Impacts of Ocean Chlorophyll on SST and MLD
Chl in the 30°N-40°N shows strong seasonal variability. Chl could reach to higher than 0.4 mg m-3 during spring bloom (Figures 4A–C) and with a maximum in April (Figure 4B). The SST differences between CLIMCHL and NOCHL are negative in winter and turn to positive in late spring (Figures 4D–F), and reaches a positive peak during June and July (>0.15°C, figure not shown). The statistical significance of SST difference is evaluated using a Student’s t-test. The negative/positive SST difference indicates that chlorophyll could trap less/more solar radiation in the mixed layer. The Chl variation leads to a SST difference of approximately two months. This is because chlorophyll directly affects solar radiation, which controls the temperature tendency, not the temperature (according to the equation for the mixed layer heat budget). Therefore, the temperature difference reaches its peak when chlorophyll decreases.
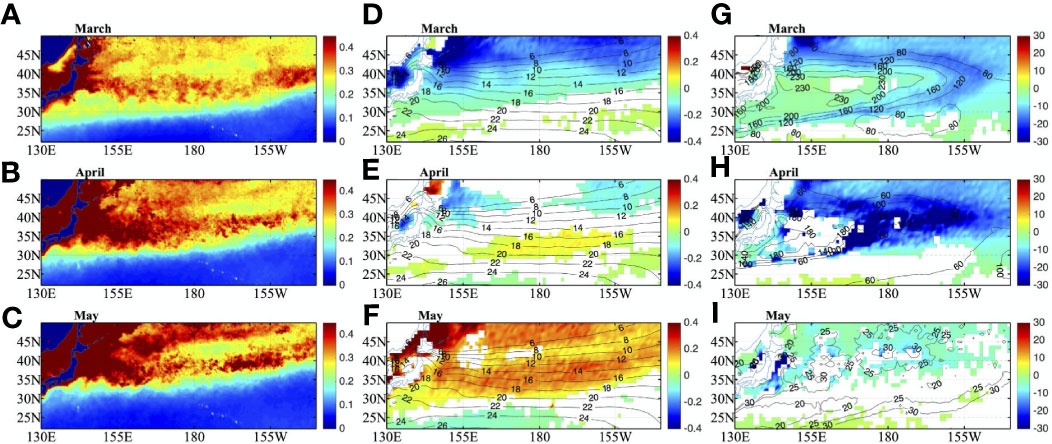
Figure 4 Climatological mean of SeaWiFS chlorophyll concentration (mg m-3) for (A) March, (B) April and (C) May. Shaded in (D–F) are for SST differences between CLIMCHL and NOCHL, and contours are for SST of NOCHL (°C). Shaded in (G–I) are for MLD differences between CLIMCHL and NOCHL, and contours are for MLD of NOCHL (M). SST and MLD differences are at 95% significant level.
Notably, the MLD differences are negative during the spring (Figures 4G–I), with the largest differences in April (>20 m) (Figure 4H). The negative MLD difference indicates that the existence of chlorophyll leads to a shallower MLD. This indicates that the spring bloom in this region could obviously impacts the MLD, and the MLD could be lifted more quickly during April with the existence of chlorophyll. The large negative MLD difference values lies around the MLD front in March (Figure 4G) and almost the whole study region in April (Figure 4H). The more quickly lifted MLD in the CLIMCHL run, which is caused by the larger buoyancy frequency (figure not shown), has a potential impact on the subduction rates in the spring season.
Impacts of Ocean Chlorophyll on Subsurface Density and PV
In addition to the impacts on SST and MLD, chlorophyll can also alter the subsurface temperature and density (Figure 5). At 165°E, the subsurface temperature at approximately 50-300 m for the CLIMCHL run cools by approximately 0.1-0.3°C and further leads to denser water in the subsurface (50 -300 m) in all three months. This could decrease the vertical density gradient at this depth. The temperature differences in the upper 50 m become positive in April, which leads to lighter water. The situation is similar for the section at 170°W but with larger temperature and density differences between experiments. The statistical significance of potential density difference is evaluated using a t-test.
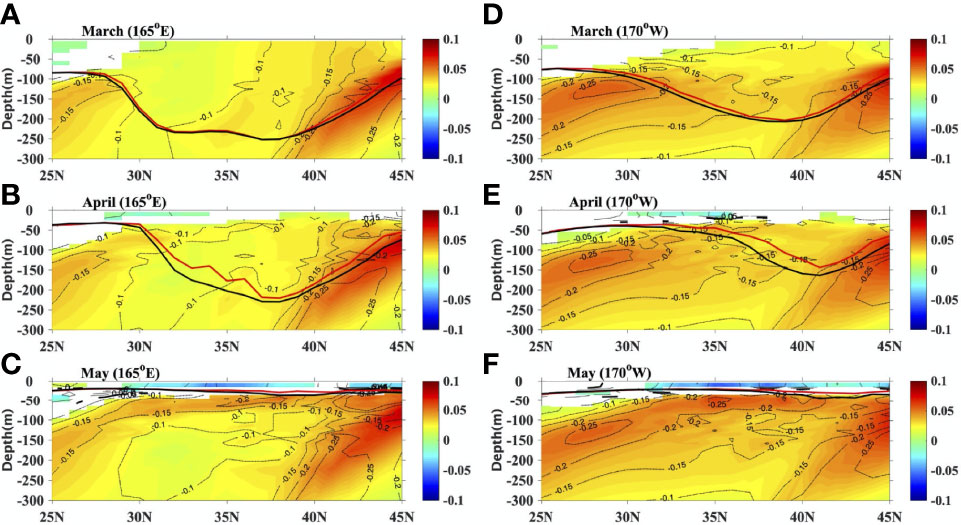
Figure 5 The potential density differences (shaded, CLIMCHL-NOCHL, kg m-3), temperature difference (black contours at 0.05 °C intervals, CLIMCHL-NOCHL) and MLD for NOCHL (blue line, m) and CLIMCHL (red line, m) at 165°E in (A) March, (B) April and (C) May. (D–F) are the same as (A–C) but for 170°W. Only the potential density differences that are statistically significant are shown (95% significant level).
Due to the biological effect on the vertical distribution of solar radiation, the change of vertical density gradient could impact the PV. Mode waters with low PV (less than 2×10⁻¹⁰ m-1 s-1) (Suga and Hanawa, 1995; Nakamura, 1996; Qu et al., 2002) tend to form where the winter MLD front intersects with the outcrop line. Compared with the NOCHL run, the decrease of vertical density gradient (50-300m) in CLIMCHL run leads to a lower PV in the mode water formation region (gray shade in Figure 6). PV decreases about 0.05×10⁻¹⁰ m-1 s-1 in the STMW formation region around 25°-30°N at 165°E (Figure 6A) and about 0.05 - 0.1×10⁻¹⁰ m-1 s-1 in the CMW formation region around 33°-38°N at 170°W (Figure 6B). The statistical significance of PV difference is evaluated using a t-test. Lower PV and more quickly lifted MLD might make the mode water subduct beneath the mixed layer more easily.
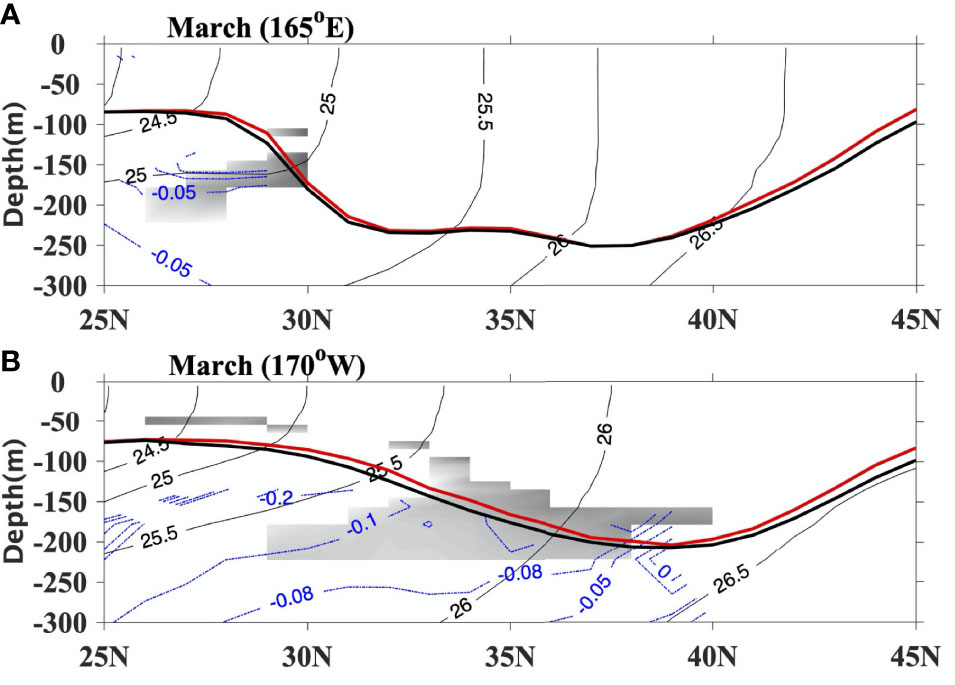
Figure 6 The mean potential density (thin black contours at 0.5 σθ intervals, kg m-3) and PV (gray shade< 2×10⁻¹⁰ m-1 s-1) for NOCHL at (A) 165°E and (B) 170°W in March. Blue contours are PV differences between two experiments (×10-10 m-1 s-1, CLIMCHL-NOCHL), and thick lines show MLD for NOCHL (black line, m) and CLIMCHL (red line, m) in March, respectively. PV< 0.8×10⁻¹⁰ m-1 s-1 are shaded in white. Only the PV differences that are statistically significant are shown (95% significant level).
Impacts of Ocean Chlorophyll on Subduction Rate
According to Qiu and Huang (1995) and Qu et al. (2002), the annual subduction rate Sann can be obtained by integrating the instant subduction rate over one year (T) from the end of the first winter t1 to that of the second winter t2 in a Lagrangian framework. The subduction rate is defined as
The first term on the right-hand side represents the contribution from vertical pumping at the base of the mixed layer, where wmb stands for the vertical velocities at the base of the mixed layer, t1 and t2 denote the first and second March, respectively, and T is one year. The second term represents the contribution from lateral induction due to the slope of the mixed layer base or the MLD gradient, where hm is the MLD. In Lagrangian coordinates, the lateral induction term can be estimated by the difference in the mixed layer depth in the first and second March. In equation 2, the vertical velocities and mixed layer are both from model output. Here, we trace water parcels with a time interval of 5 days and obtain Lagrangian trajectories of the mode water.
The subduction rates due to vertical pumping, lateral induction and the total NOCHL run in the northwestern and central Pacific are shown in Figures 7A–C. The annual subduction rate due to vertical pumping is less than 50 m yr-1 and shows little spatial variation in the NOCHL run (Figure 7A). Lateral induction shows a maximum between 30°N and 40°N, 145°E and 160°W, with values exceeding 100 m yr-1 (Figure 7B). The maximum center lies in a long narrow band around (29°-35°N, 140°E-180) for STMW and a broad region (35-42°N, 180-160°W) for CMW (Figure 7B). The total subduction rate is dominated by the latter and shows a similar pattern to lateral induction, with maximum values exceeding 150 m yr-1 (Figure 7C). The maximum subduction rate lies where the outcrop line intersects the MLD front (Figure 1B).
The differences in annual subduction rates between the two experiments are shown in Figures 7D–F. Compared with the NOCHL run, the horizontal distribution of annual subduction rates in CLIMCHL run is similar to the NOCHL run, just with larger value in the center of the subduction region (Figure not shown). The CLIMCHL run shows little difference (less than 5 m yr-1) from the NOCHL run in the vertical pumping term (Figure 7D) but shows an evident increase in the lateral induction term (5-15 m yr-1) in the region between 30° and 40°N, 145°E and 160°W (Figure 7E), slanting northeastward. The increase is more than 10m/year in the center of the STMW (30°N-35°N, 150°E-180) and CMW (35°N-42°N, 180-160°W). As a result, the total annual subduction rate increases about 5-10% in the key subduction regions (Figure 7F).
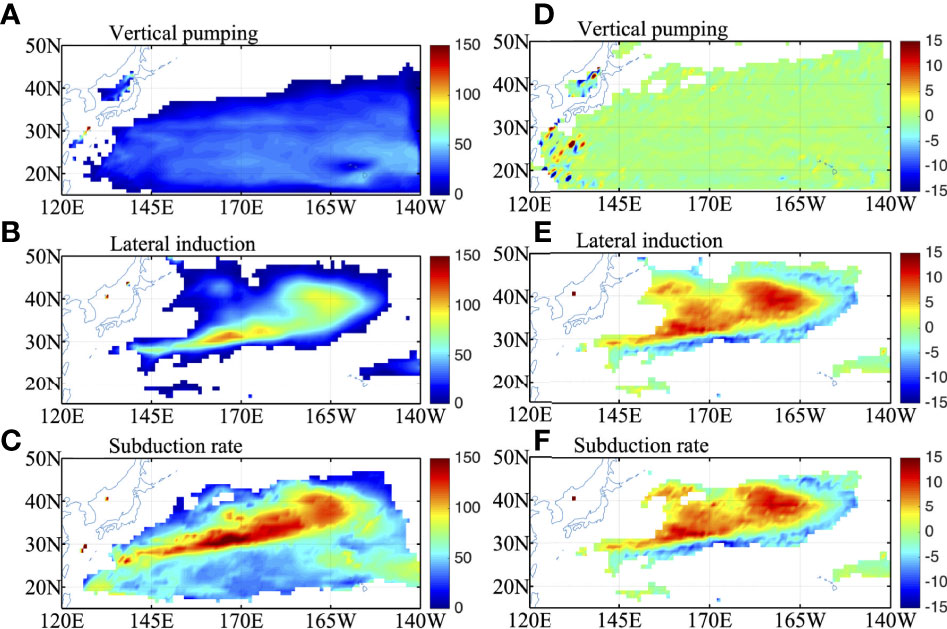
Figure 7 (A) vertical pumping, (B) lateral induction and (C) the total subduction rate in NOCHL run in the north Pacific (m/year). (D–F) are the same as (A–C) but for the differences between the two experiments (CLIMCHL-NOCHL).
To delineate the impacts of ocean chlorophyll on the subduction rate, we computed the distribution with the potential density by integrating it for each 0.1 kg m-3 interval of the density field at the base of the March mixed layer in the northwestern and central Pacific (145°E-160°W, 29°-42°N). In the NOCHL, subduction rate is around 1.0 Sv in density range of 24.8-25.6 kg m-3 and the maximum subduction rate could reach up to 1.4 Sv (Figure 8). The average subduction rate of the CLIMCHL run is larger than that of the NOCHL run in almost all density ranges. The largest differences occur in density range of 26.0-26.4 kg m-3 with an increase of about 5-10%.
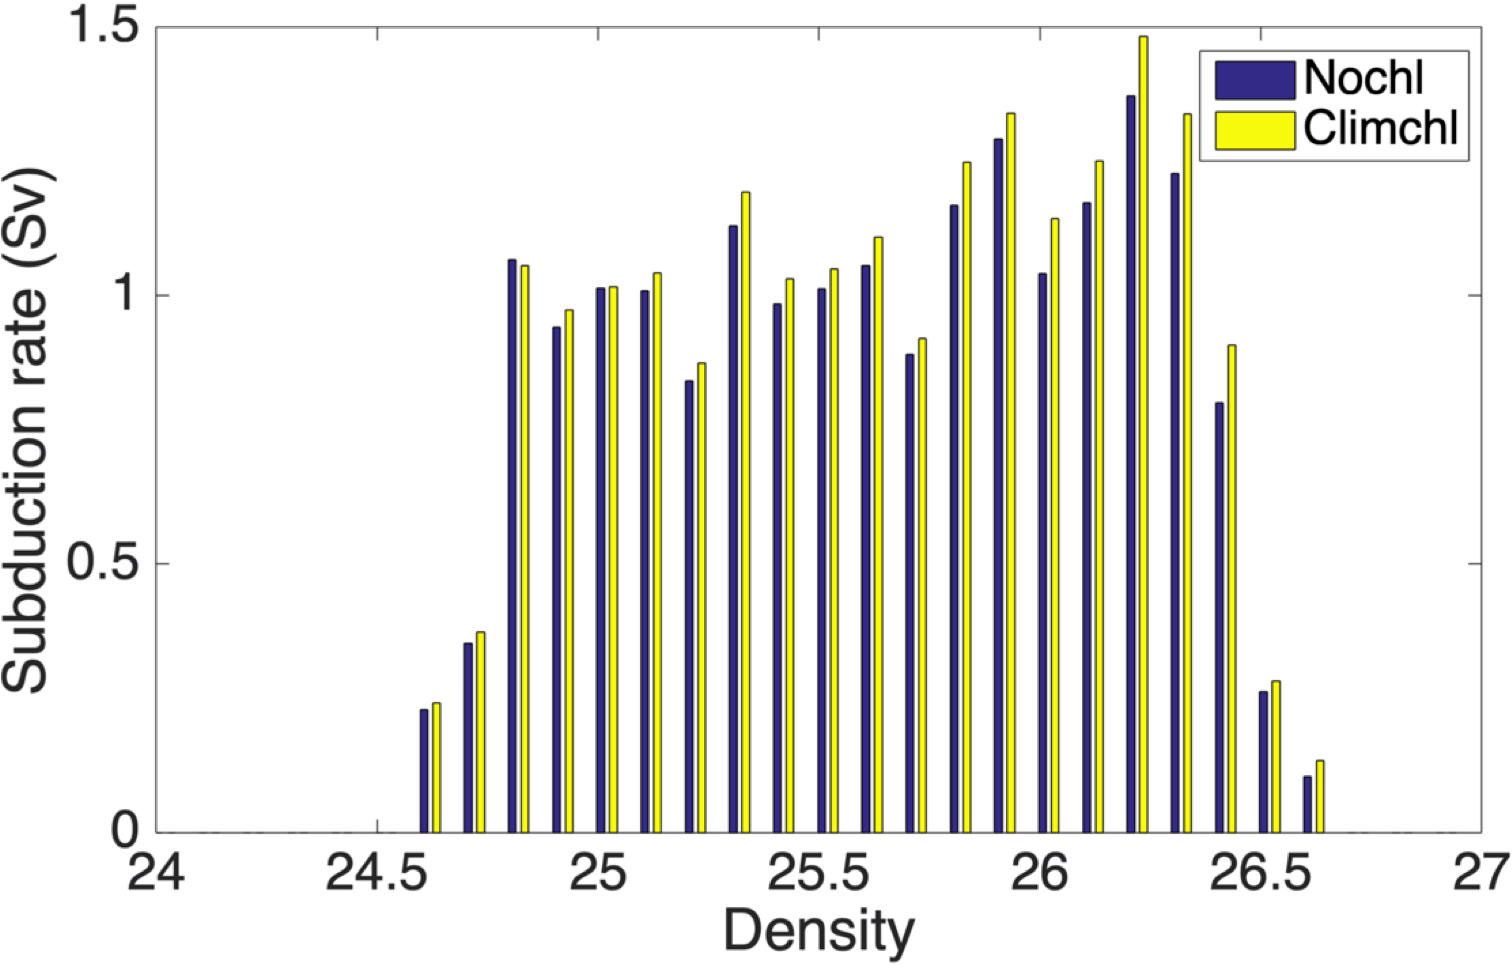
Figure 8 Subduction rate (Sv) for each σθ interval of 0.1 kg m-3 in the northwestern and central Pacific (145°E-160°W, 29°N-42°N) for the NOCHL run (blue bars) and CLIMCHL run (yellow bars).
We have known that the ocean biological effects mainly impact lateral induction, which is associated with MLD front strength. Lateral induction is determined by the MLD difference between the first and second March on the water parcel trajectory (second term on the right-hand side of Eq. (2)). Therefore, either the deeper MLD in the first year or the shallower MLD in the second year could increase lateral induction. Besides, the larger horizontal movement of water parcels could also lead to increase of lateral induction. To investigate how ocean chlorophyll impacts lateral induction, Lagrangian trajectories are compared for the two experiments (Figure 9). Most water parcels between 30°N and 40°N move eastward, and the water parcels in the south (approximately 30°N) move southeastward, with little difference between the CLIMCHL and NOCHL runs, except in regions between 25°N and 35°N near the western boundary (Figure 9). Little difference between trajectories shows that the lateral induction differences between CLIMCHL and NOCHL runs are mainly caused by strength of the MLD front differences, not by the difference of the trajectories.
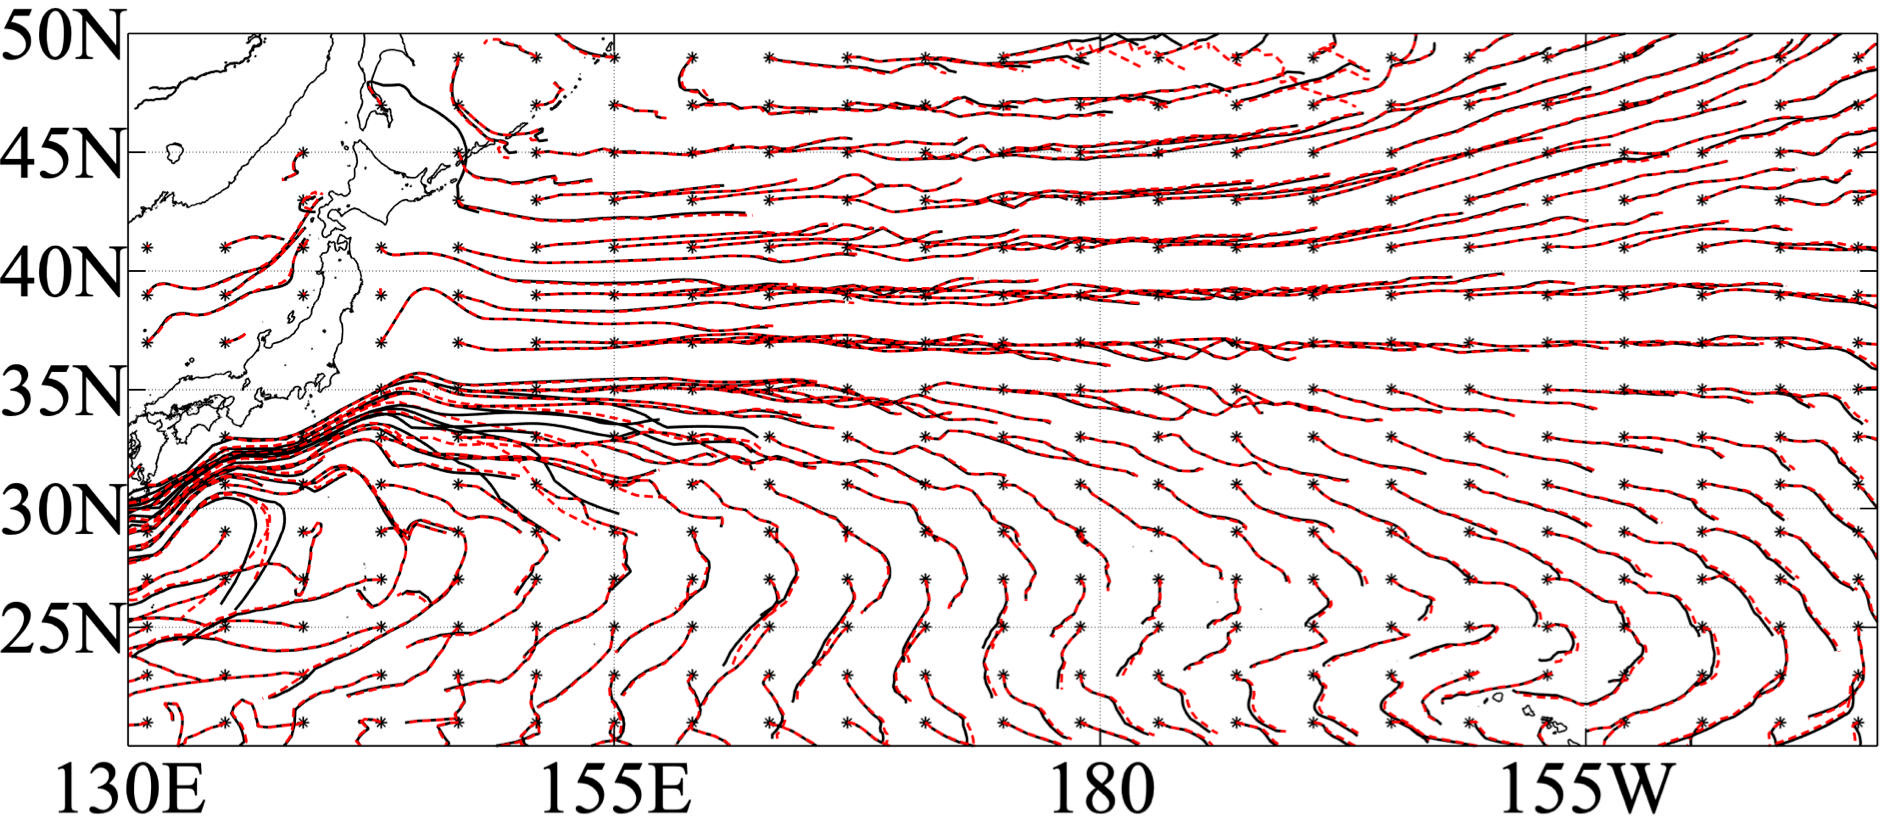
Figure 9 One-year Lagrangian trajectories of water parcels released at the base of the March mixed layer in 2006 for NOCHL (black line) and CLIMCHL (red line). Stars indicate the starting point of the released parcels.
To check whether the lateral induction increase is related to the stronger MLD front, the MLD differences between the two experiments in the first and second years and their differences are shown in Figure 10. In general, the MLD of CLIMCHL is shallower compared with the NOCHL run due to the biological effect, especially in the shallower MLD region. In the first March, MLD differences between CLIMCHL and NOCHL are negative in the study region, with less than 5 m differences in the center of 30°N-40°N and more than 5 m differences around the MLD front (Figure 10A). This indicates that the horizontal MLD gradient of the CLIMCHL run is stronger than that of the NOCHL run. As the water parcels move to the east and south, the MLD is shallower, and the MLD differences between the two experiments increase to more than 10 m in the second March (Figure 10B). As a result, the lateral induction differences between experiments show positive values in the region of 30°N-40°N (Figure 10C), with magnitude more than 10m/year in the center of the STMW (30°N-35°N, 150°E-180) and CMW (35°N-42°N, 180-160°W). That is, the much shallower MLD in the second year leads to an increase in lateral induction in the CLIMCHL run, which is caused by biological effects.
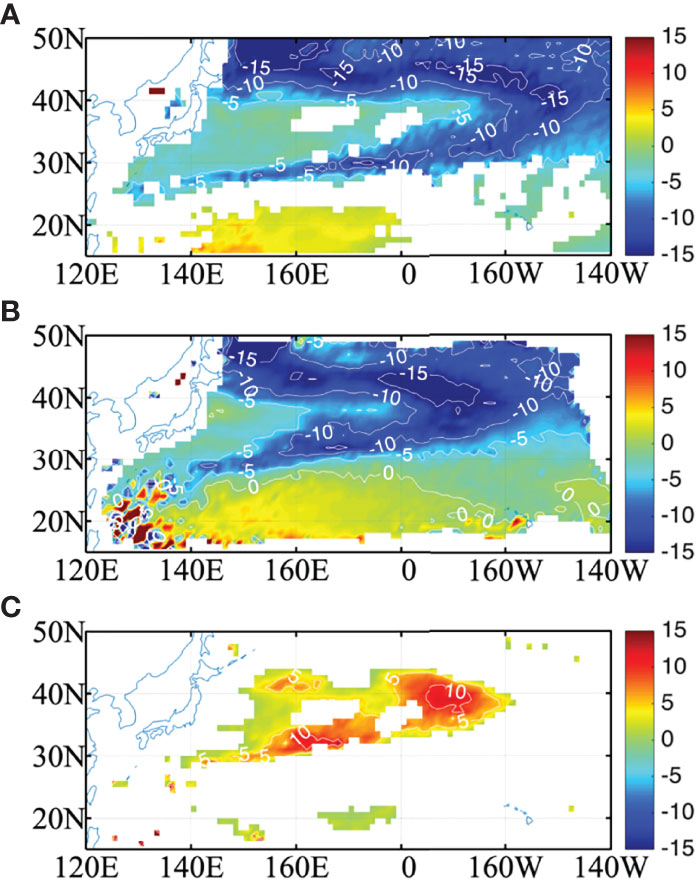
Figure 10 The MLD difference (m) between the two experiments (CLIMCHL-NOCHL) in March of (A) the first year and (B) the second year. (C) is the difference between (A) and (B) (A, B). The MLD differences in (A) are at 95% significant level.
Conclusions
In the present study, we investigated the effects of ocean chlorophyll on the temperature and subduction rate of mode water in the northwestern and central Pacific Ocean. Two ocean model experiments with and without chlorophyll indicate that biology-induced feedback could impact the temperature and density in the northwestern and central Pacific Ocean. The Chl reaches a maximum (>0.3 mg m -3) during spring and a minimum during summer and autumn. During spring blooms, surface water warms, and subsurface water cools with the existence of chlorophyll. The changes in temperature could also impact the vertical density gradient, which lead to a lower PV at 50 m-250 m.
Biological effects also obviously impact the MLD. With the effect of ocean chlorophyll, the MLD is shallower compared with the NOCHL run, and the MLD lifts more quickly in April in the CLIMCHL run. Analysis shows that biological effects could increase the total annual subduction rate about 5-10% in the northwestern and central Pacific Ocean. The subduction rate increase is mainly caused by the increased lateral induction term (5-15 m yr-1). The results show that the increase of lateral induction is affected by the increased horizontal MLD gradient. Ocean chlorophylls lead to a larger MLD gradient in the CLIMCHL run than in the NOCHL run. In the first March, the MLDs of the CLIMCHL and NOCHL runs have little difference in the deep mixed layer region near Kuroshio Extension region. As the water parcels move to the east and south, the much shallower MLD in the second year leads to an increase in lateral induction in the CLIMCHL run.
The present study focused on the effects of seasonal variations in chlorophyll on the mode water subduction rate. On a decadal scale, the chlorophyll trends in the north Pacific Ocean might also play an important role in mode water formation and ultimately impact climate variability. A study by Gregg and Rousseaux (2019) showed total primary production increases decreases in the North Pacific over the 1998 to 2015 time series. The increased chlorophyll might lead to a shallower MLD in the MLD front zone and increase the mode water subduction rate. How the variability in primary production and MLD impacts the mode water subduction rate and climate variability needs to be investigated in future studies.This study is based on a coarse resolution ocean model not including the effect of mesoscale eddy. According to previous studies, mesoscale eddies also enhance the mode water subduction rate, and the magnitude of lateral advection is comparable to the mean flow (Xu et al., 2016; Wang et al., 2020). The biological impacts on subduction rate might be underestimated in present study. Ocean chlorophyll also affects mesoscale activities, such as tropical instability waves (Tian et al., 2019); therefore, the biological effects in the eddy-resolving model need to be investigated. As the ocean-only model are forced by the same wind forcing, there is no atmospheric feedback, the biological effects might be mitigated in the atmosphere–ocean coupled models. This needs to be investigated in future.
Data Availability Statement
The original contributions presented in the study are included in the article/supplementary material. Further inquiries can be directed to the corresponding author.
Author Contributions
JM, do most of the work and write the manuscript; QY, drafting the work and do some analysis; HL, substantial contributions to the conception or design of the work; PL, revising it critically for important intellectual content. JL, provide advice during revision. All authors contributed to the article and approved the submitted version.
Funding
This study was supported by the Special Founds for Creative Research (2022C61540), the National Key R&D Program for Developing Basic Sciences (2020YFA0608902 and 2018YFA0605703), and the Key Program of the National Natural Science Foundation of China (grants 41931183 and 41931182). The authors, HLL and PFL, also acknowledge the technical support from the National Key Scientific and Technological Infrastructure project “Earth System Science Numerical Simulator Facility” (EarthLab).
Conflict of Interest
The authors declare that the research was conducted in the absence of any commercial or financial relationships that could be construed as a potential conflict of interest.
Publisher’s Note
All claims expressed in this article are solely those of the authors and do not necessarily represent those of their affiliated organizations, or those of the publisher, the editors and the reviewers. Any product that may be evaluated in this article, or claim that may be made by its manufacturer, is not guaranteed or endorsed by the publisher.
References
Anderson W. G., Gnanadesikan A., Hallberg R., Dunne J., Samuels B. L. (2007). Impact of Ocean Color on the Maintenance of the Pacific Cold Tongue. Geophys. Res. Lett. 34 (11), L11609. doi: 10.1029/2007gl030100
Bingham F. M. (1992). The Formation and Spreading of Subtropical Mode Water in the North Pacific. J. Geophys. Res. 97, 11177–11189. doi: 10.1029/92JC01001
Gregg W. W., Rousseaux C. S. (2019). Global Ocean Primary Production Trends in the Modern Ocean Color Satellite Record, (1998–2015). Environ. Res. Lett. 14 (12), 124011. doi: 10.1088/1748-9326/ab4667
Hanawa K., Kamada J. (2001). Variability of Core Layer Temperature (CLT) of the North Pacific Subtropical Mode Water. Geophys. Res. Lett. 28 (11), 2229–2232. doi: 10.1029/2000GL011716
Iwamaru H., Kobashi F., Iwasaka N. (2010). Temporal Variations of the Winter Mixed Layer South of the Kuroshio Extension. J. Oceanogr. 66 (1), 147–153. doi: 10.1007/s10872-010-0012-1
Kubokawa A. (1999). Ventilated Thermocline Strongly Affected by a Deep Mixed Layer: A Theory for Subtropical Countercurrent. J. Phys. Oceanogr. 29, 1314–1333. doi: 10.1175/1520-0485
Large W., Yeager S. (2004). Diurnal to Decadal Global Forcing for ocean and Sea-Ice Models: The Data Sets and Flux Climatologies (Boulder, Colorado: National Center for Atmospheric Research), p.105. doi: 10.5065/D6KK98Q6
Levitus S. (1983). Climatological Atlas of the World Ocean. Eos Trans. Am. Geophysical Union 64 (49), 962–963. doi:10.1029/EO064i049p00962-02
Lewis M. R., Carr M.E., Feldman G. C., Esias W., McClain C. (1990). Influence of Penetrating Solar Radiation on the Heat Budget of the Equatorial Pacific. Nature 347, 543–546. doi: 10.1038/347543a0
Lewis M. R., Cullen J.J., Platt T. (1983). Phytoplankton and Thermal Structure in the Upper Ocean: Consequences of Nonuniformity in Chlorophyll Profile. J. Geophys. Res. 88 (C4), 2565–2570. doi: 10.1029/JC088iC04p02565
Lin P, Liu H, Zhang X2007Sensitivity of the Upper Ocean Temperature and Circulation in the Equatorial Pacific to Solar Radiation Penetration Due to Phytoplankton. Adv. Atm. Sci.245765780doi: 10.1007/s00376-007-0765-7
Lin P., Ma J., Chai F., Xiu P., Liu H. (2020). Decadal Variability of Nutrients and Biomass in the Southern Region of Kuroshio Extension. Prog. Oceanogr. 188, 102441. 10.1016/j.pocean.2020.102441
Liu H., Lin P., Yu Y., Zhang X. (2012b). The Baseline Evaluation of LASG/IAP Climate System Ocean Model (LICOM) Version 2. Acta Meteor. Sin. 26, 318–329. doi: 10.1007/s13351-012-0305-y
Liu H., Ma J., Lin P., Zhan H. (2012a). Numerical Study of the Effects of Ocean Color on the Sea Surface Temperature in the Southeast Tropical Indian Ocean: The Role of the Barrier Layer. Environ. Res. Let 7 (2), 024010. doi: 10.1088/1748-9326/7/2/024010
Liu H. L., Yu Y., Li W., Zhang X. (2004b). Manual of the LASG/IAP Climate System Ocean Model (Beijing: Science Press), pp.128. doi: 10.1007/BF02916365
Liu H., Zhang X., Li W., Yu Y., Yu R. (2004a). A Eddy-Permitting Oceanic General Circulation Model and its Preliminary Evaluations. Adv. Atm. Sci. 21, 675–690.
Locarnini R. A., Mishonov A. V., Antonov J. I., Boyer T. P., Garcia H. E., Baranova O. K., et al. (2013). World Ocean Atlas 2013, Volume 1: Temperature. S. Levitus, Ed., A. Mishonov Technical Ed.;. NOAA Atlas NESDIS 73, 40pp. doi: 10.7289/V55X26VD
Ma J., Liu H., Lin P., Zhan H. (2014). Seasonality of Biological Feedbacks on Sea Surface Temperature Variations in the Arabian Sea: The Role of Mixing and Upwelling. J. Geophys. Res. – Oceans 134, 12–19. doi: 10.1002/2014JC010186
Ma J., Liu H., Lin P., Zhan H. (2015). Effects of the Interannual Variability in Chlorophyll Concentrations on Sea Surface Temperatures in the East Tropical Indian Ocean. J. Geophys. Res.- Oceans 120 (10), 7015–7027. doi: 10.1002/2015JC010862
Ma J., Liu H., Lin P., Zhan H. (2021). Effects of the Seasonal Variation in Chlorophyll Concentration on Sea Surface Temperature in the Global Ocean. Acta Oceanol. Sin. 40(11), 50–61. doi: 10.1007/s13131-021-1765-7
Ma J., Liu H., Zhan H., Lin P., Du Y. (2012). Effects of Chlorophyll on Upper Ocean Temperature and Circulation in the Upwelling Regions of the South China Sea. Aquat. Ecosyst. Health Manag. 15 (2), 127–134. doi:10.1080/14634988.2012.687663
Masuzawa J. (1969). Subtropical Mode Water. Deep Sea Res. 16 (5), 463–472. doi: 10.1016/0011-7471(69)90034-5
Nakamoto S., Kumar S. P., Oberhuber J. M., Ishizaka J., Muneyama K., Frouin R. (2001). Response of the Equatorial Pacific to Chlorophyll Pigment in a Mixed Layer Isopycnal Ocean General Circulation Model. Geophys. Res. Lett. 28 (10), 2021–2024. doi: 10.1029/2000gl012494
Nakamura H. (1996). A Pycnostad on the Bottom of the Ventilated Portion in the Central Subtropical North Pacific: Its Distribution and Formation. J. Oceanogr. 52 (2), 171–188. doi: 10.1007/BF02235668
Ohlmann J. C. (2003). Ocean Radiant Heating in Climate Models. J. Clim. 16 (9), 1337–1351. doi: 10.1175/1520-0442(2003)16<1337:Orhicm>2.0.Co;2
Oka E., Kouketsu S., Toyama K., Uehara K., Kobayashi T., Hosoda S., et al. (2011). Formation and Subduction of Central Mode Water Based on Profiling Float Data 2003–08. J. Phys. Oceanogr. 41 (1), 113–129. doi: 10.1175/2010jpo4419.1
Oka E., Qiu B. (2012). Progress of North Pacific Mode Water Research in the Past Decade. J. Oceanogr. 68 (1), 5–20. doi: 10.1007/s10872-011-0032-5
Paulson C. A, Simpson J.J(1977)Irradiance Measurements in the Upper Ocean. J. Phys. Oceanogr. 7(6)952956doi: 10.1175/1520-0485(1977)007<0952:imituo>2.0.co;2
Qiu B., Chen S. (2005). Variability of the Kuroshio Extension Jet, Recirculation Gyre, and Mesoscale Eddies on Decadal Time Scales. J. Phys. Oceanogr. 35 (11), 2090–2103. doi: 10.1175/jpo2807.1
Qiu B., Chen S. (2006). Decadal Variability in the Formation of the North Pacific Subtropical Mode Water: Oceanic Versus Atmospheric Control. J. Phys. Oceanogr. 36 (7), 1365–1380. doi: 10.1175/jpo2918.1
Qiu B., Huang R. X. (1995). Ventilation of the North Atlantic and North Pacific: Subduction Versus Obduction. J. Phys. Oceanogr. 25 (10), 2374–2390. doi: 10.1175/1520-0485
Qu T., Xie S.-P., Mitsudera H., Ishida A. (2002). Subduction of the North Pacific Mode Waters in a Global High-Resolution GCM*. J. Phys. Oceanogr. 32 (3), 746–763. doi: 10.1175/1520-0485
Sathyendranath S., Gouveia A. D., Shetye S. R., Ravindran P., Platt ,. T. (1991). Biological Control of Surface Temperature in the Arabian Sea. Nat. 349 (6304), 54–56. doi: 10.1038/349054a0
Siegel D. A., Ohlmann J. C., Washburn L., Bidigare R. R., Nosse C. T., Fields E., et al. (1995). Solar Radiation, Phytoplankton Pigments and the Radiant Heating of the Equatorial Pacific Warm Pool. J. Geophys. Res. 100 (C3), 4885– 4891. doi: 10.1029/94jc03128
Suga T., Hanawa K. (1995). The Subtropical Mode Water Circulation in the North Pacific. J. Phys. Oceanogr. 25 (5), 958–970. doi: 10.1175/1520-0485
Sugimoto S., Hanawa K. (2010). Impact of Aleutian Low Activity on the STMW Formation in the Kuroshio Recirculation Gyre Region. Geophys. Res. Lett. 37, L03606. doi: 10.1029/2009GL041795
Tian F., Zhang R.-H., Wang X. (2019). A Positive Feedback Onto ENSO Due to Tropical Instability Wave (TIW)-Induced Chlorophyll Effects in the Pacific. Geophys. Res. Lett. 46 (2), 889–897. doi: 10.1029/2018GL081275
Wang R., Cheng X., Xu L., Chen J. (2020). Mesoscale Eddy Effects on the Subduction of North Pacific Eastern Subtropical Mode Water. J. Geophys. Res.: Oceans 125 (5), e2019JC015641. doi: 10.1029/2019jc015641
Xie S.-P., Kunitani T., Kubokawa A., Nonaka M., Hosoda S. (2000). Interdecadal Thermocline Variability in the North Pacific for 1958–97: A GCM Simulation. J. Phys. Oceanogr. 30 (11), 2798–2813. doi: 10.1175/1520-0485(2000)030<2798:Itvitn>2.0.Co;2
Xie S.-P., Xu L., Liu Q., Kobashi F. (2010). Dynamical Role of Mode Water Ventilation in Decadal Variability in the Central Subtropical Gyre of the North Pacific. J. Clim. 24 (4), 1212–1225. doi: 10.1175/2010jcli3896.1
Xu L., Li P., Xie S.-P., Liu Q., Liu C., Gao W. (2016). Observing Mesoscale Eddy Effects on Mode-Water Subduction and Transport in the North Pacific. Nat. Commun. 7 (1), 10505. doi: 10.1038/ncomms10505
Keywords: subduction rate, ocean model, biological effects, North Pacific Ocean, mode water
Citation: Ma J, Yang Q, Liu H, Lin P and Liu J (2022) Effects of Ocean Chlorophyll on the Mode Water Subduction Rate in the Northwestern and Central Pacific Ocean. Front. Mar. Sci. 9:814053. doi: 10.3389/fmars.2022.814053
Received: 12 November 2021; Accepted: 03 June 2022;
Published: 12 July 2022.
Edited by:
Shoshiro Minobe, Hokkaido University, JapanReviewed by:
Yizhen Li, Woods Hole Oceanographic Institution, United StatesShusaku Sugimoto, Tohoku University, Japan
Copyright © 2022 Ma, Yang, Liu, Lin and Liu. This is an open-access article distributed under the terms of the Creative Commons Attribution License (CC BY). The use, distribution or reproduction in other forums is permitted, provided the original author(s) and the copyright owner(s) are credited and that the original publication in this journal is cited, in accordance with accepted academic practice. No use, distribution or reproduction is permitted which does not comply with these terms.
*Correspondence: Hailong Liu, lhl@lasg.iap.ac.cn
 Jinfeng Ma