 Yaoru Pan
 Naeem Ayoub
 Peter Schneider-Kamp
 Mogens Flindt
 Marianne Holmer
94% of researchers rate our articles as excellent or good
Learn more about the work of our research integrity team to safeguard the quality of each article we publish.
Find out more
ORIGINAL RESEARCH article
Front. Mar. Sci., 24 January 2022
Sec. Marine Ecosystem Ecology
Volume 9 - 2022 | https://doi.org/10.3389/fmars.2022.813516
This article is part of the Research TopicAdvances in Understanding Lateral Blue Carbon Export from Coastal EcosystemsView all 6 articles
As part of Blue Carbon ecosystems (BCEs), detached macrophytes can be transported to the coast due to current and wave actions, and then deposited on the shore as beach wrack. To date, the role of beach wrack in the material cycle in BCEs is still unclear. In order to track the fate of beach wrack, this study conducted a monitoring survey on a semi-sheltered beach in Odense Fjord (Denmark) using camera trap data. Deep learning with a VGG network architecture was used to classify the image dataset acquired by the camera trap. The VGG network demonstrated the capability to identify beach wrack from different beach scenes, and the method can provide results on large datasets within a short time (187 images analyzed within 5 min) compared to manual identification of images. By combining the VGG detection with color-based segmentation, beach wrack coverage was determined. To evaluate the impact of ambient conditions on wrack deposition on the shore and relocation back to the sea, wind (including speed and direction), water temperature, and tidal amplitude were analyzed as environmental variables. Partial least squares regression (PLSR) analysis revealed that micro-tidal action with an average amplitude of 0.41 m accelerated the movement of floating macrophytes between the shore and the sea. Despite being exposed to the prevailing southwesterly winds (average speed of 11 m/s), the beach was sheltered due to the location in the inner part of Odense Fjord, limiting the transport of drifting macrophytes from sea to the shore. By using the camera trap to conduct continuous monitoring, this study presents a labor-saving and practical approach to track the dynamics of detached macrophytes deposited on the shore. Furthermore, the application of deep learning in image identification provides a study case for using a large image dataset to assist in ecological studies of dynamic environments.
Detached seagrasses and drifting macroalgae are transported to the shore by currents and waves and deposited as beach wrack (Rodil et al., 2008; Macreadie et al., 2017). Beach wrack is a worldwide phenomenon along coastlines, providing food source and habitat for coastal life in coastal meadows, saltmarshes, and mangroves (Dugan et al., 2003; Macreadie et al., 2017). Furthermore, beach wrack is considered as one of the common ways of exporting detached macrophytes in BCEs in addition to deeper-sea transfer (Duarte, 2017; Duarte and Krause-Jensen, 2017). Compared to the investigation of carbon buried in habitat sediments, exploring the exported part from BCEs is still a challenge, including the part transferred to deeper sea and the part deposited on the shore (Duarte, 2017). Therefore, investigating the deposition pattern of detached macrophytes on the shore is a priority to track the exported part from BCEs, which can assist in thoroughly exploring the fate of this part of exported carbon. Moreover, beach wrack can become a nearshore emission source of greenhouse gases. For instance, it was estimated that global seagrass wrack (around 320 Tg C per year) can release between 1.31 and 19.04 Tg CO2-C per year (Liu et al., 2019). Hence, monitoring of beach wrack is of significance for the exploration of the carbon cycle in BCEs.
Nowadays, most of the studies on beach wrack accumulation are based on field surveys at certain times of the season. For instance, the annual accumulation of Mediterranean seagrass wrack was estimated on the basis of 2-week sampling conducted in spring and summer for 2 years in Mallorca Island, Spain (Jiménez et al., 2017). This way of manually collecting data in the field not only requires a lot of human labor, but also fails to accurately estimate the accumulation of beach wrack on a seasonal or yearly basis. Moreover, the accumulation of beach wrack changes greatly in rough weather or over time scales of hours and days (Jiménez et al., 2017; Perry et al., 2018). For instance, wrack on the shore may return to the sea after a storm or drifting marine vegetation may be washed ashore by forcing waves (Nordstrom et al., 2011; Duarte, 2017). Therefore, it is necessary to find a less labor-intensive method to monitor short- and long-term dynamics of beach wrack accumulation in real time.
Recently, camera technology and handling of large datasets by computer programs have led to an increased use of camera trap data in ecological studies (Norouzzadeh et al., 2018). A camera trap is a type of remote and customized-automatic image collection (O’Connell et al., 2010; Swanson et al., 2015). By providing systematic and detailed information about various species, camera trap images have become a powerful monitoring tool for ecologists to better understand and protect natural ecosystems (Swanson et al., 2015; Norouzzadeh et al., 2018). For example, camera trap images were used to evaluate the spatial and temporal dynamics of the mammalian species in a Tanzanian national park (Swanson et al., 2015). However, there are few studies on monitoring beach wrack with camera traps (Mossbauer et al., 2012). With minimal disturbance for the environment, camera traps enable continuous data collection of beach wrack. Furthermore, camera traps can timely record the distribution of beach wrack, which helps to study the movement of detached macrophytes between marine and terrestrial ecosystems. Yet, it remains a challenge to automatically extract the desired information from the images. The image analysis still mainly depends on manual labor contributions (Norouzzadeh et al., 2018). Although there has been one study using webcams to record beach wrack, beach wrack was visually identified and the distribution area was manually calculated from the images (Mossbauer et al., 2012). As the image database acquired by a camera trap can include from thousands to millions of shooting events, manual identification is time-consuming and needs significant expert knowledge. For instance, the largest project for surveying wildlife with camera traps in the world, carried out in a Tanzanian national park, captured a total of 3.2 million images. The images were classified by about 68 thousand volunteer scientists (Norouzzadeh et al., 2018). Moreover, the manual procedures in analyzing the image cannot fully exploit the captured information, limiting the potential usages of the image database for other research and environmental conservation. Hence, automatic extraction of the valuable information from the camera trap image databases will further promote the application of camera traps in ecological studies.
The objective of this study is to explore the potential of camera traps as tools for short- and long-term beach wrack monitoring. We aim to (1) propose an effective approach to identify beach wrack from a time series of camera trap images and to (2) estimate the contribution of environmental factors to beach wrack dynamics. Furthermore, we aim to develop camera trap into a labor- and cost-saving tool to observe the deposition pattern of detached macrophytes on the shore. This monitoring survey with camera trap can also provide a practical method for monitoring the community and dynamics in habitats in environmental conservation and management.
This study was conducted on a sandy beach (N 55°31′18.8″, E 10°32′25.4″), in the outer part of Odense Fjord (Figure 1). Odense Fjord is located on the Funen Island, Denmark. Funen has an oceanic climate with an annual average temperature of 8.7°C (2000–2010) and an annual average precipitation of 812 mm (Molina-Navarro et al., 2018). Odense Fjord consists of two parts: the inner part with an average water depth of about 0.8 m and the outer part with an average water depth of 2.7 m (Riisgård et al., 2007). The inner fjord accounts for 25% of the whole fjord, where the main tributary is Odense River (Flindt et al., 2016). The outer part exchanges currents with the open sea (Belt Sea) through a narrow opening in the northern fjord, showing more wave activities (Flindt et al., 2016). Eelgrass (Zostera marina) covering about 2% of Odense Fjord, perennial macroalgae (Fucus vesiculosus and Fucus serratus) and opportunistic macroalgae (Ulva lactuca and Chaetomorpha linum) are the main marine macrophytes in the fjord (Kuusemäe et al., 2016). Beach wrack consisted of eelgrass Z. marina, macroalgae F. vesiculosus, green algae Ulva sp. and other red algae that remained unidentified due to their stage of decomposition. During snorkeling surveys in a 0.5 km radius near the coast, patches of seagrass Z. marina, macroalgae F. vesiculosus, and F. serratus were found (Figure 1).
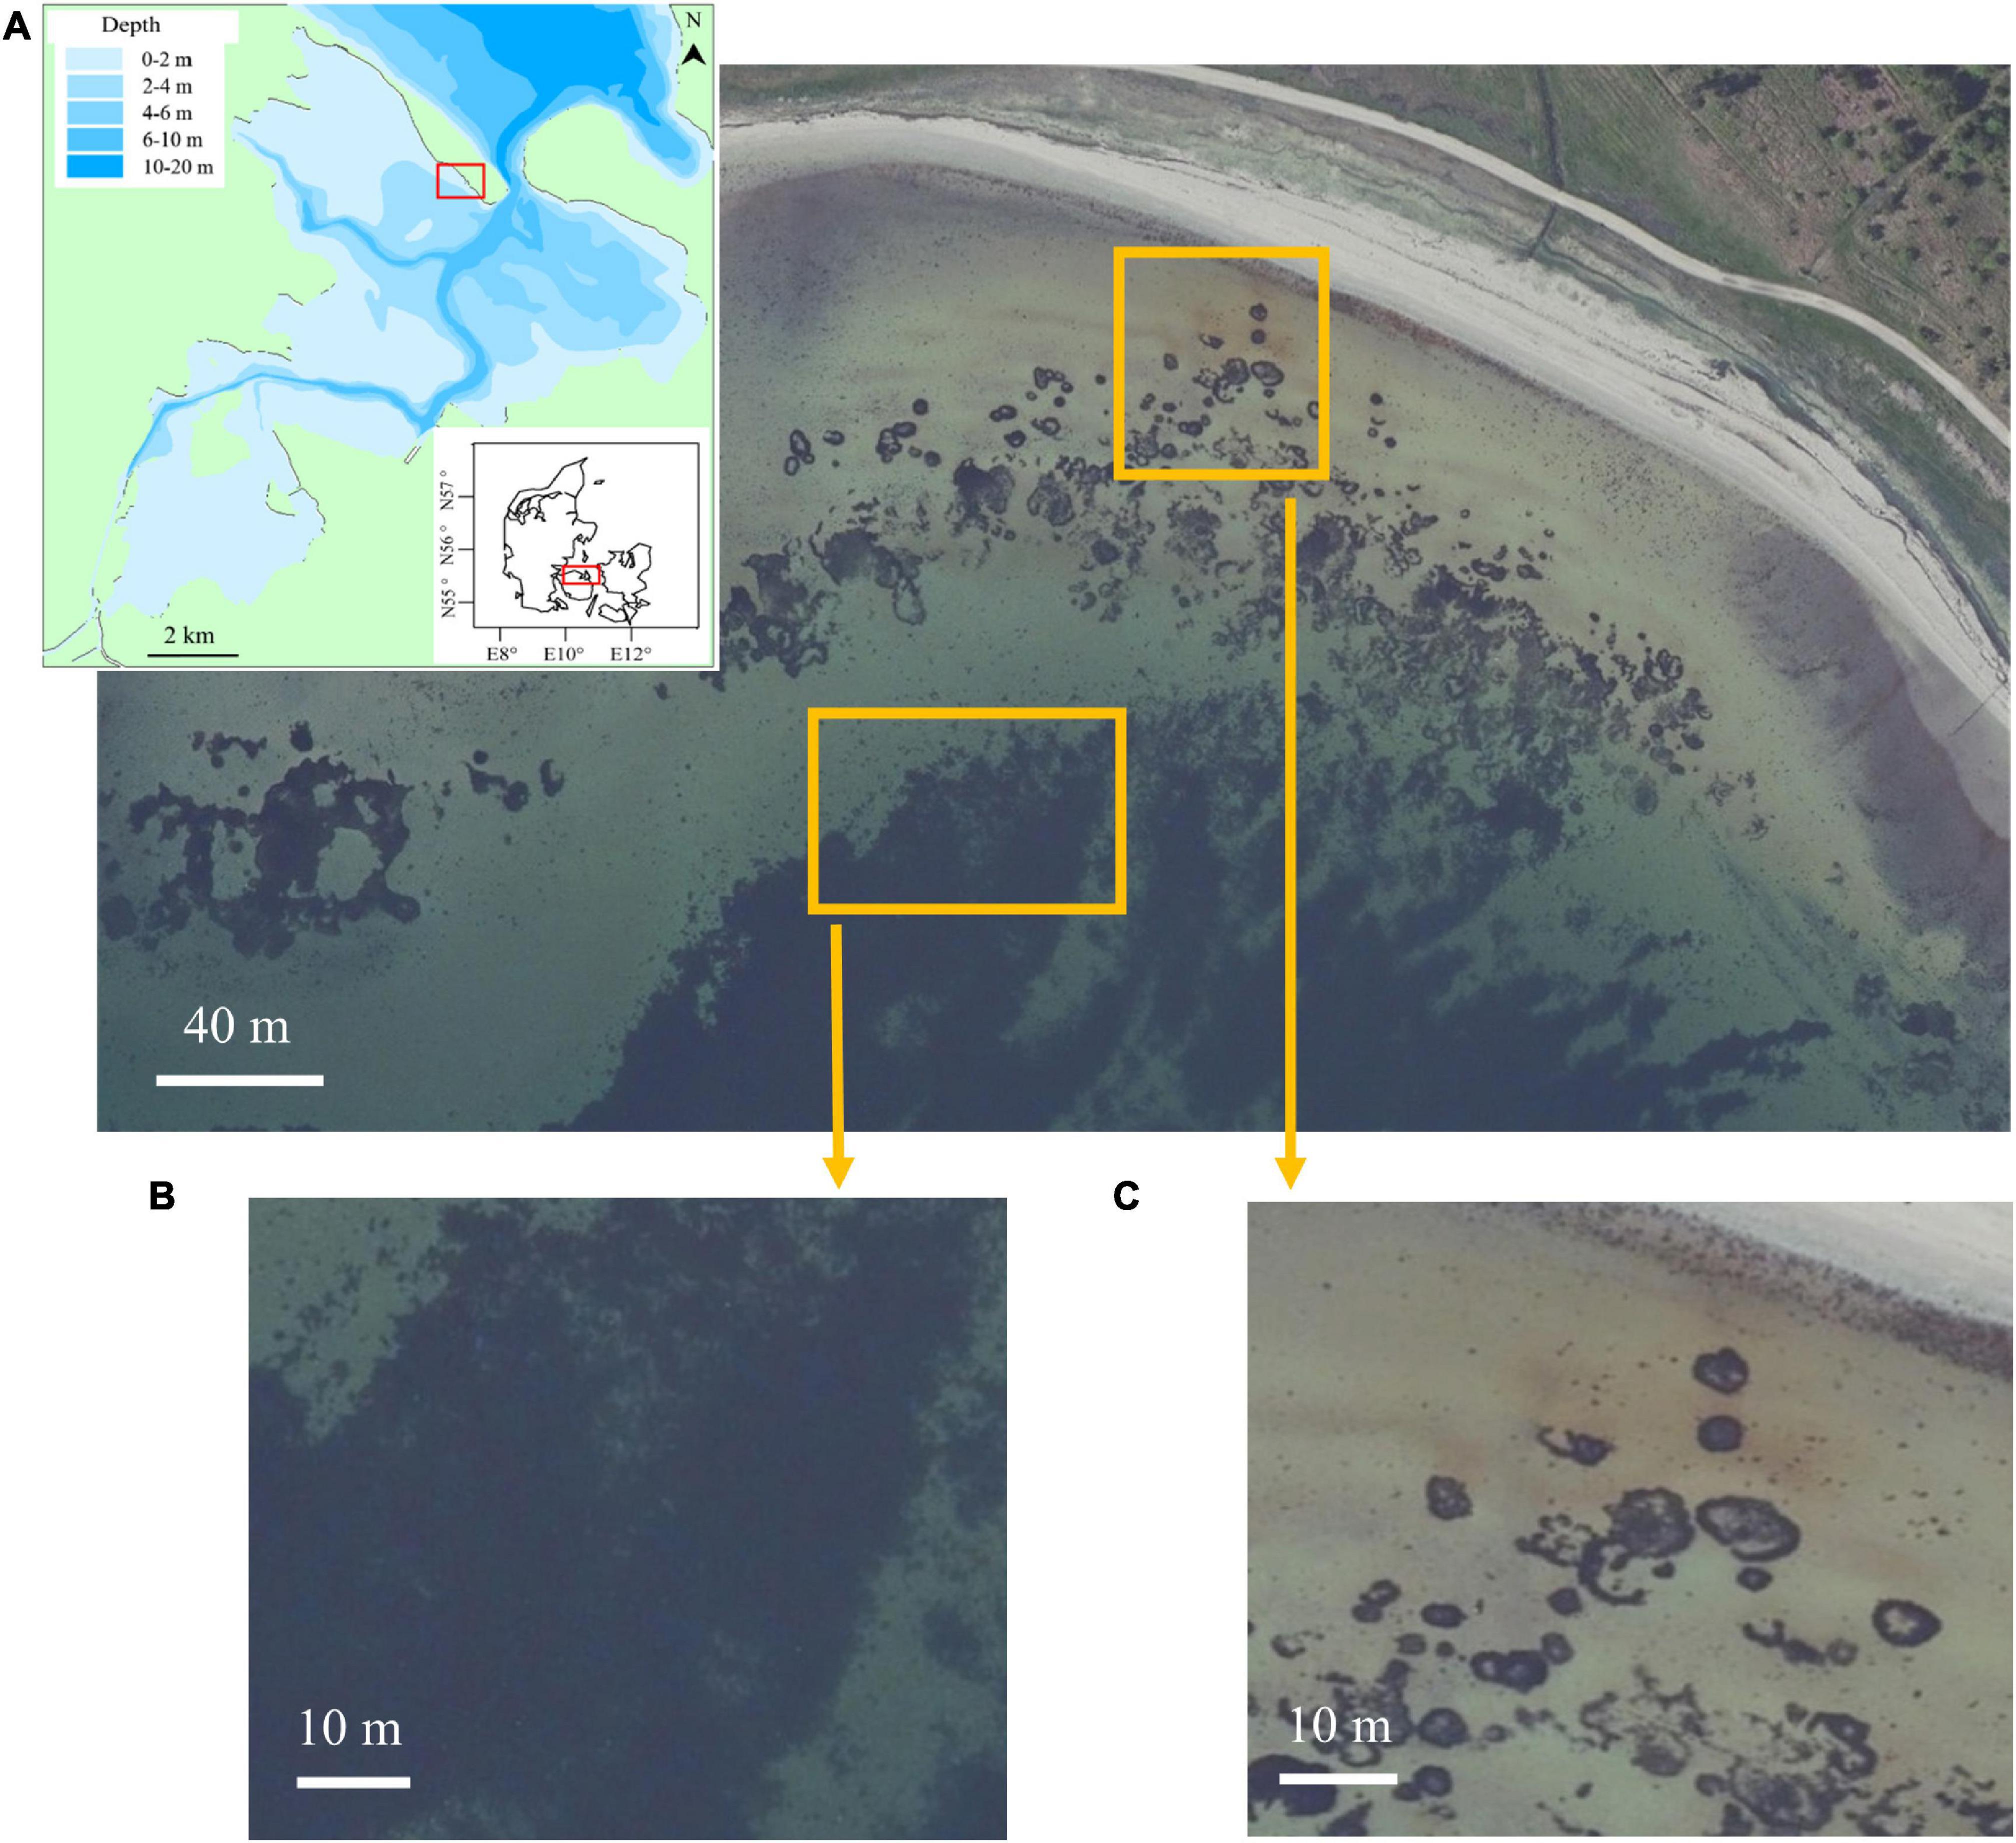
Figure 1. Panel (A) shows the location of the study beach and potential nearshore marine macrophyte subsidies for beach wrack (Denmark’s Area Information, Danmarks Miljøportal). The map in the left corner in panel (A) shows the bathymetry of Odense Fjord, where the study beach is located. Panel (B) is the subsidy area of macroalgae Fucus vesiculosus and Fucus serratus, identified by snorkeling. Panel (C) is the subsidy area of eelgrass, Zostera marina, identified by snorkeling.
By being fixed on a stick, a Seissiger Special-Cam S358E camera trap was placed 0.4 m above the ground to photograph wrack on the shore during 06/12/2019–27/01/2020. The camera trap was mounted with an optical lens and an infrared sensor, which enabled shooting at night. Combined with field measurement, it was estimated that ∼6,000 m2 (120 m × 50 m) of the beach area was shot with an eye-level camera angle (straight ahead). After turning off the movement trigger function and video recording function, the mode of photo-shooting was set with a time interval of 2 h and each shooting took one image. The camera trap was enclosed by a robust and waterproof case, making it suitable for collecting data in the field. In total, 632 images were acquired. Due to the short daylengths in Danish wintertime, around 36% (226 images) of the total achieved images were taken in daylight (mainly during daytime 08:00–16:00). Owing to the limited spectral information of the objects captured in darkness, the images taken in the dark were manually excluded from further image analysis. Furthermore, the out-of-focus images (39 images) caused by rough weather, such as foggy and rainy weather, were also excluded. Hence, about 30% images (187 images) were used for further image analysis.
After the field investigation of beach scenarios, the image dataset was divided into two general categories according to whether the beach was submerged by sea water or exposed to air (Table 1). The beach wrack distribution was divided into categories and subscenes based on the visual interpretation of the beach wrack distribution recorded in the images (Table 1).
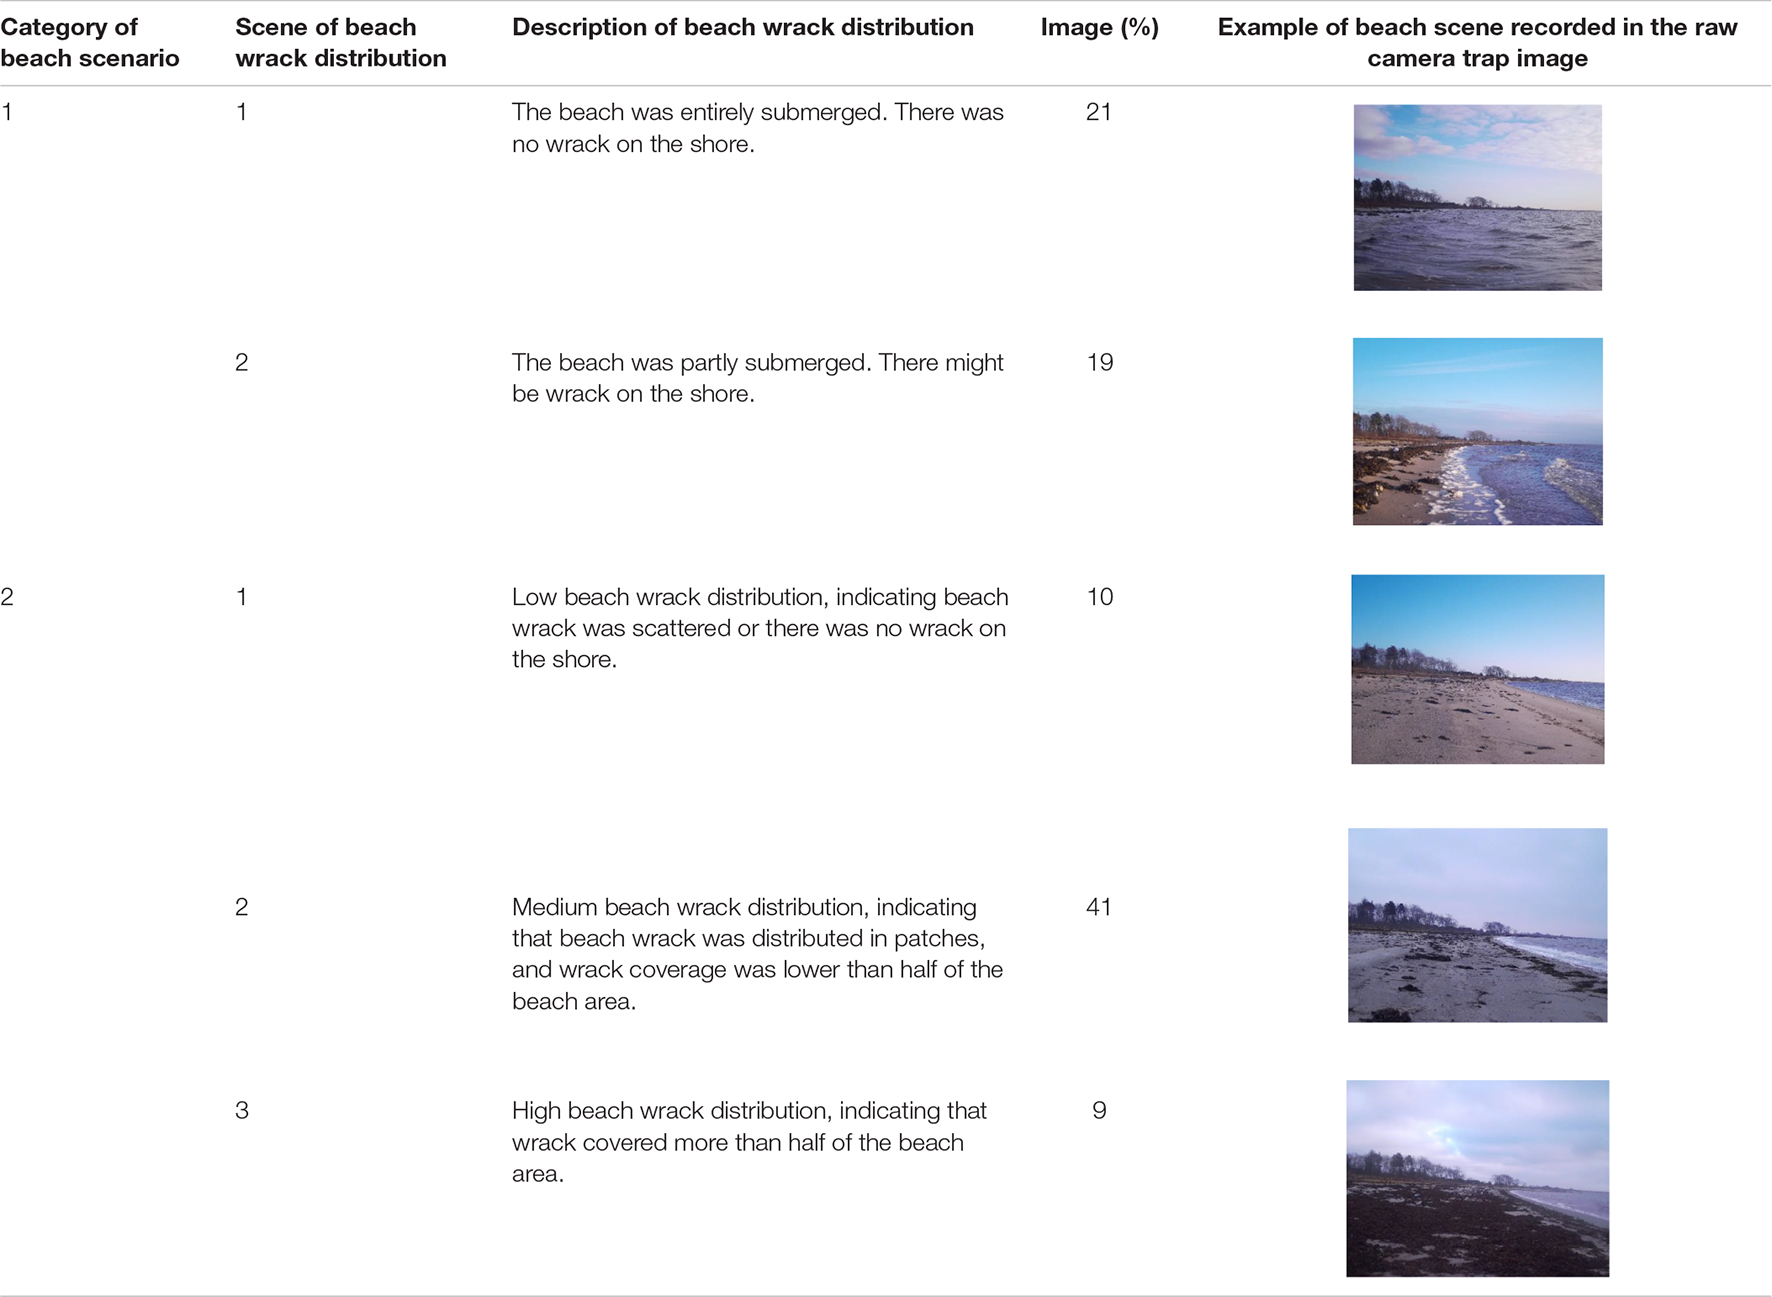
Table 1. Beach scenarios and scenes of wrack distribution on the shore recorded in the camera trap images.
The obtained digital images were in RGB (red, green, and blue) color space where the color components, such as the luminance and chrominance, are presented as a combination of red, green, and blue, resulting in the lack of component quantization (Ganesan and Rajini, 2014; Hassan et al., 2017). With the purpose of fully extracting the information of land objects captured by camera trap, the acquired digital images were converted to the HSV (hue, saturation, and value) model where all the color components in the image can be expressed with different values of color (hue), color depth (saturation), and brightness (value) (Ganesan and Rajini, 2014; Ajmal et al., 2018).
Afterward, the deep learning with a convolutional neural network architecture called VGG-16, developed by the Visual Geometry Group (VGG) from the University of Oxford in 2014 (Simonyan and Zisserman, 2014), was performed to identify beach wrack from the time series camera trap images. In order to reduce the running time and computational burden of the proposed VGG network, the region of interest (ROI) was restricted to the beach part after visual interpretation of the camera trap image. As all the captured images were same size, ROI for all the images was obtained by the trained VGG network after visual interpretation. To describe wrack distribution on the shore, the proportion of wrack pixels in the total number of pixels in the ROI was considered as the coverage of beach wrack. As an algorithm that can locate every pixel in the image, color-based segmentation was applied here to calculate beach wrack coverage based on the identification result by the VGG network (Abu Shmmala and Ashour, 2013). When training the VGG network, the image dataset was randomly divided into 80% for training and 20% for validation. For training purposes, the dataset was manually labeled as water and beach wrack. After 10 epochs of deep learning, the VGG network provided an accuracy of 0.94 with a loss 0.15 on the training dataset and 0.77 accuracy with a loss of 0.43 on the validation dataset.
To further assess the proposed method, manual recognition was applied to evaluate the capability of the proposed method to estimate the coverage of beach wrack in the camera trap images. For this purpose, about 20% of the images were randomly selected from each scene of beach wrack distribution as a verification set for manual recognition. An image interpretation software, eCognition, was used to determine beach wrack coverages in the verification set through manual recognition. By comparing beach wrack coverages achieved by the two methods of manual recognition and the proposed identification method, the accuracy of VGG algorithm for beach wrack identification was evaluated using equation (1).
Where VGG network accuracy represents the accuracy of the VGG network in identifying beach wrack from the image (in %); Coveragemanual represents beach wrack coverage obtained by manual recognition (in %) and CoverageVGG represents beach wrack coverage obtained by the VGG network (in %).
When the beach was fully submerged, beach wrack coverage was zero identified by manual interpretation. In this situation, equation (1) for evaluating VGG network performance could not be used as Coveragemanual = 0. For this fully submerged beach scenario, the average coverage difference of beach wrack identified by the two methods was used to describe the performance of VGG network. Smaller coverage differences indicated better performance of VGG.
All the processes for image analysis described above were performed in OpenCV.
To investigate the impact of ambient environments on beach wrack deposition and relocation, wind (including wind speed and direction), water temperature, and tidal amplitude were considered here as the environmental drivers of beach wrack dynamics. Partial least squares regression (PLSR) was performed in R to evaluate the contribution of environmental factors to beach wrack dynamics.
The environmental data were obtained from the Danish Meteorological Institute (DMI). The hourly wind data were from the station Røsnæs Lighthouse, measuring the wind speed and direction blowing through the Great Belt Strait. The hourly water temperature data were from the measuring station Slipshavn located in the Belt Sea. The tide table from the measuring station in Odense Fjord (Gabet) provided the daily high and low tides. Here, the tidal amplitude was calculated to represent the wave activity. When using PLSR, the environmental variables corresponding to each image event were represented by the average values of the environment factors between two image events.
After detecting the ROI, wrack on the shore was identified by the proposed VGG network, and then beach wrack coverage was estimated (Figure 2). The proposed algorithm demonstrated the ability to identify beach wrack in different beach scenes recorded by a camera trap. Furthermore, the identification ability of the VGG network showed gradual improvements as beach wrack coverage increased on the shore (Table 2). For the two scenes where the beach was partially submerged (Category 1 of beach scenario, Scene 2 of beach wrack distribution) and the beach was not submerged but with scattered wrack (Category 2 of beach scenario, Scene 1 of beach wrack distribution), the VGG network showed similar capabilities of beach wrack identification compared to manual recognition (Table 2). When there was more wrack on the shore (Category 2 of beach scenario, Scene 2 of beach wrack distribution), the VGG network performed better with an identification accuracy of 70.25% (Table 2). When wrack deposition increased further on the shore (Category 2 of beach scenario, Scene 3 of beach wrack distribution), the VGG network had an improved performance in wrack identification of 92.04% accuracy. When it came to the scene where the beach was entirely submerged (Category 1 of beach scenario, Scene 1 of beach wrack distribution), an average of 1.7% of the water was misidentified as beach wrack (Table 2).
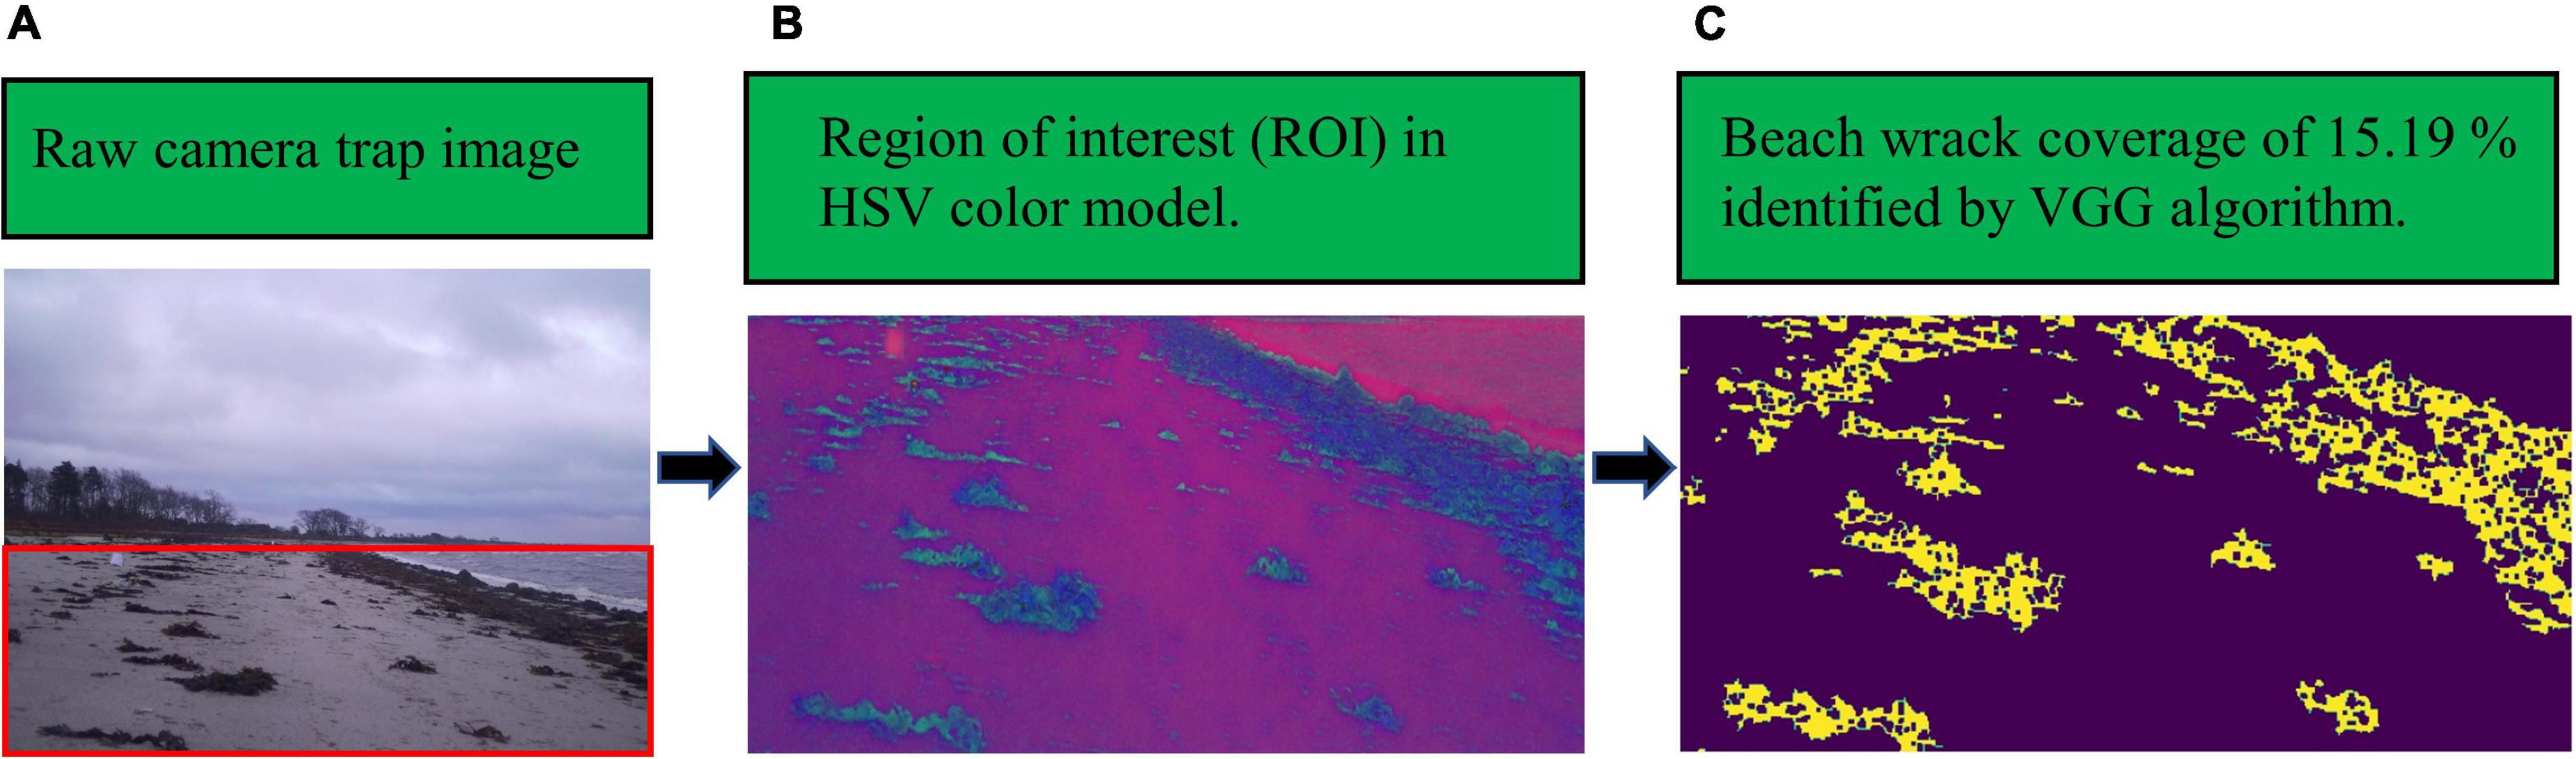
Figure 2. An example of the VGG network identifying beach wrack from a camera trap image: panel (A) is the raw camera trap image in RGB color space, shot at 12:26, 08/12/2019, the red square shows the beach captured in the image (region of interest, ROI); panel (B) is the ROI after conversion to the HSV color model; panel (C) is the beach wrack identification result of the VGG network, highlighted in yellow and showing a coverage of 15.19%.
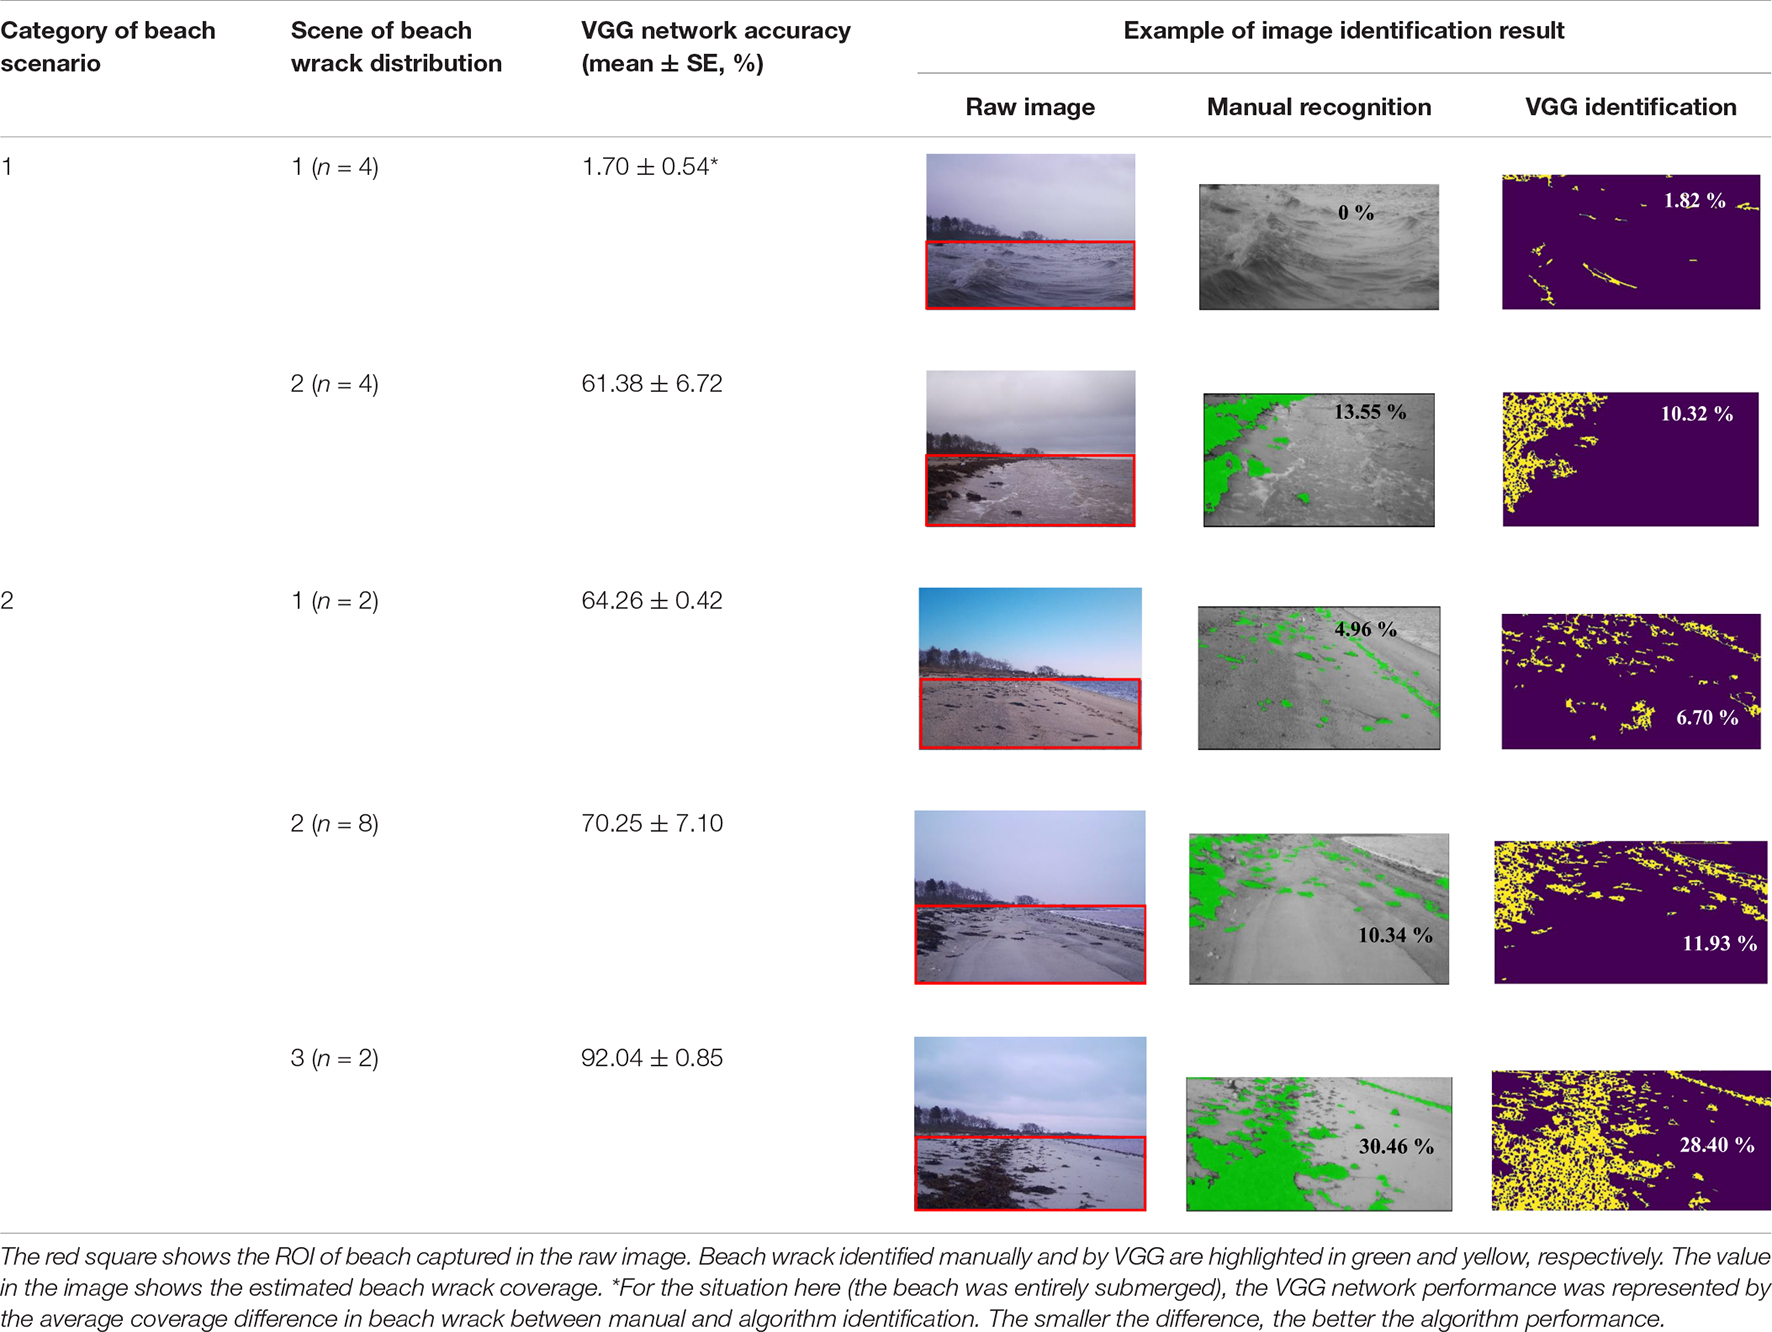
Table 2. The evaluation of VGG algorithm performance in identifying beach wrack obtained from the verification set (20% of images from each beach wrack distribution scene).
During the camera trap monitoring period, the prevailing wind was from southwest, accounting for 61% of the wind events, followed by northwest wind (18% of the wind events) (Figure 3A). About 60% of the prevailing winds were above 10 m/s, and gale events (wind speed above 17 m/s) accounted for 5% of all the wind events. Water temperature ranged from 3.9 to 9.1°C with an average of 6.3°C during the monitoring period (Figure 3B). There was a drop in water temperature from 8°C (on 17/12/2019) to 3.9°C (30/12/2019) during late December 2019. The average tidal amplitude was 0.41 m with the highest value of 0.59 m and the lowest value of 0.25 m (Figure 3C). Unlike the regular tidal cycle twice per day, wind (including speed and direction) and water temperature showed larger changes in December 2019 than in January 2020 (Figure 3). For instance, during the time period of Dec. 8–15 in 2019, wind increased from 12.3 m/s (Time: 03:00 on 10/12/2019) to 21.4 m/s (Time: 22:00 on 10/12/2019). Accordingly, the wind direction changed from north to south (Figure 3A).
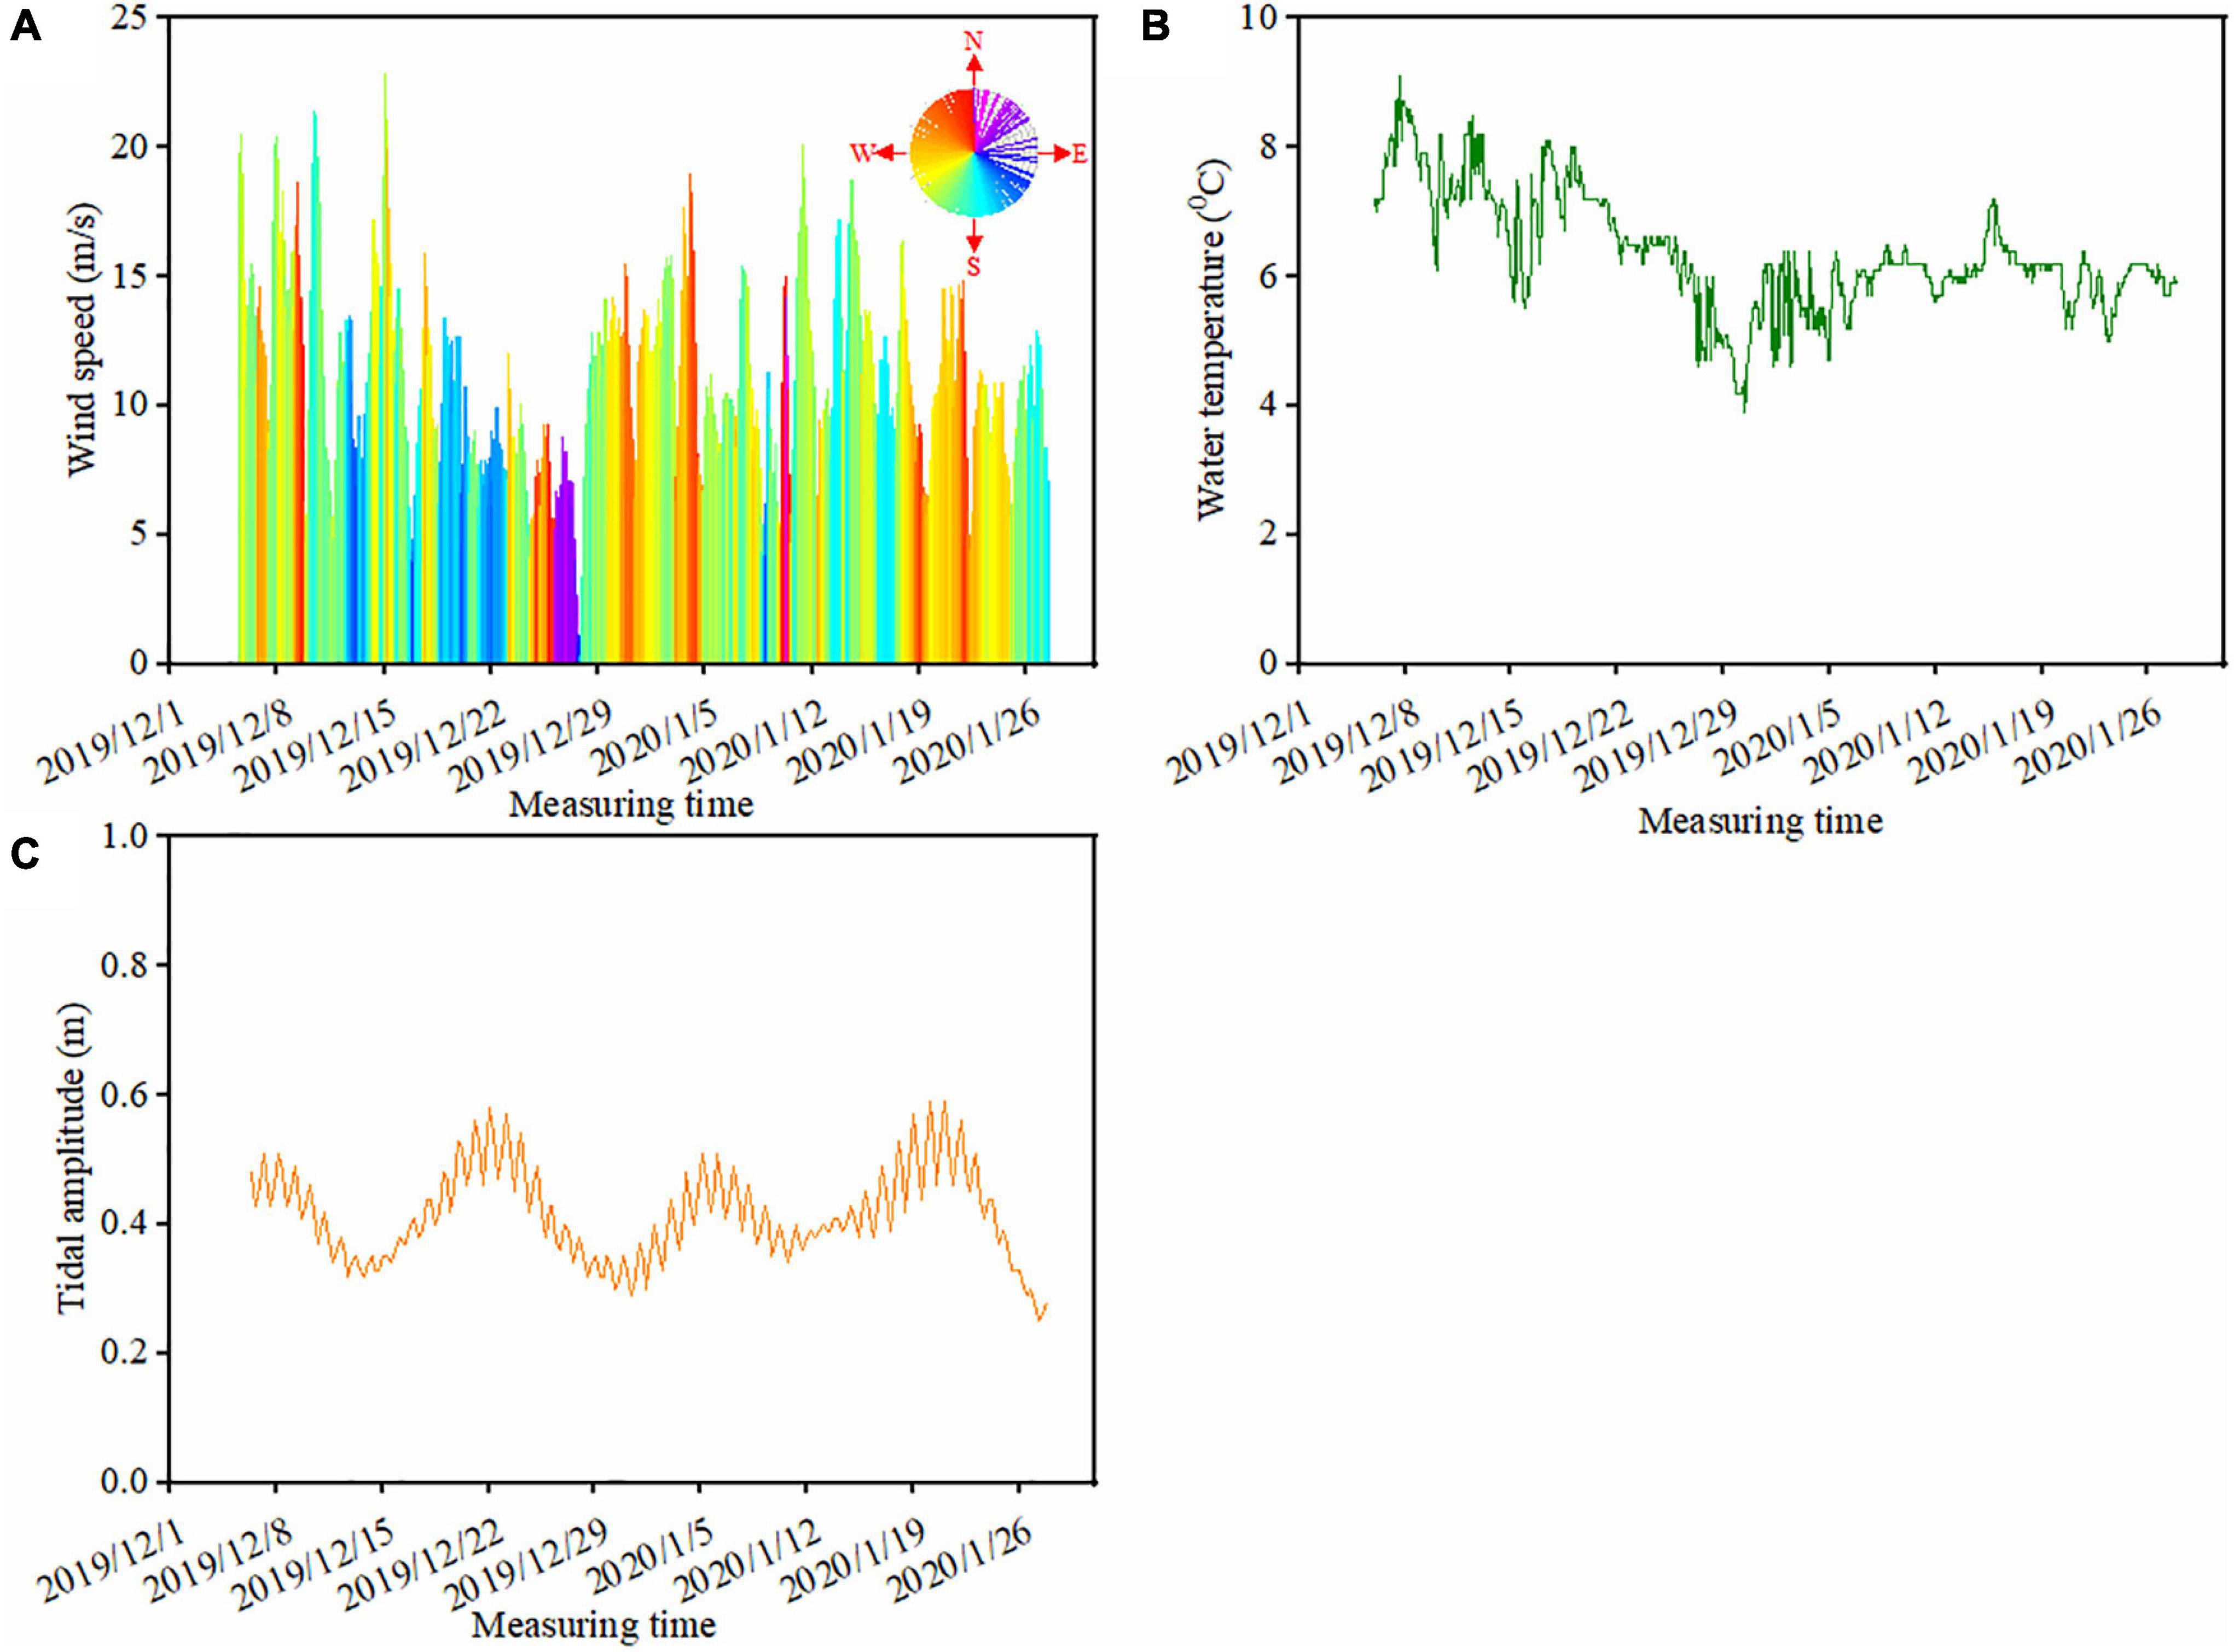
Figure 3. Variation in the ambient environmental factors at the study beach during the monitoring period. Panel (A) is the hourly wind data, where the color of the wind rose in panel (A) indicates the wind direction (0–360°) and the height of the column represents the wind speed (m/s). Panel (B) is the hourly water temperature (°C) and panel (C) is the daily tidal amplitude, representing the difference between the high and low tides (m).
During the nearly 2-month monitoring period, 155 events of wrack deposition on the shore were captured (Figure 4). The maximum beach wrack coverage was up to 63.76% (16:26 on 07/01/2020). Approximately 35% beach wrack events were at a low deposition (< 10% of the beach area). There were about 61% beach wrack events with the coverage of 10–50%. About 4% beach wrack events were with a high deposition (>50% of the beach area). The residence time of the wrack on the shore was very dynamic during the monitoring period (Figure 4). Detached macrophytes could stay constantly on the beach with an average coverage of 15% for about 98 h (Dec. 25–29 in 2019), while they could be frequently washed up onshore and then back to the sea within several hours. For instance, a large amount of drifting macrophytes were washed to the beach in 2 h, leading to an increase in coverage from zero to 45% (14:26–16:26 on 12/12/2019) (Figure 4). Then most of beach wrack was washed back to the sea 16 h later where the coverage of beach wrack decreased to 0.35% (08:26 on 13/12/2019). There were approximately 30 events of beach wrack deposition with such dynamic changes, accounting for 19% events of beach wrack deposition observed during the monitoring period.
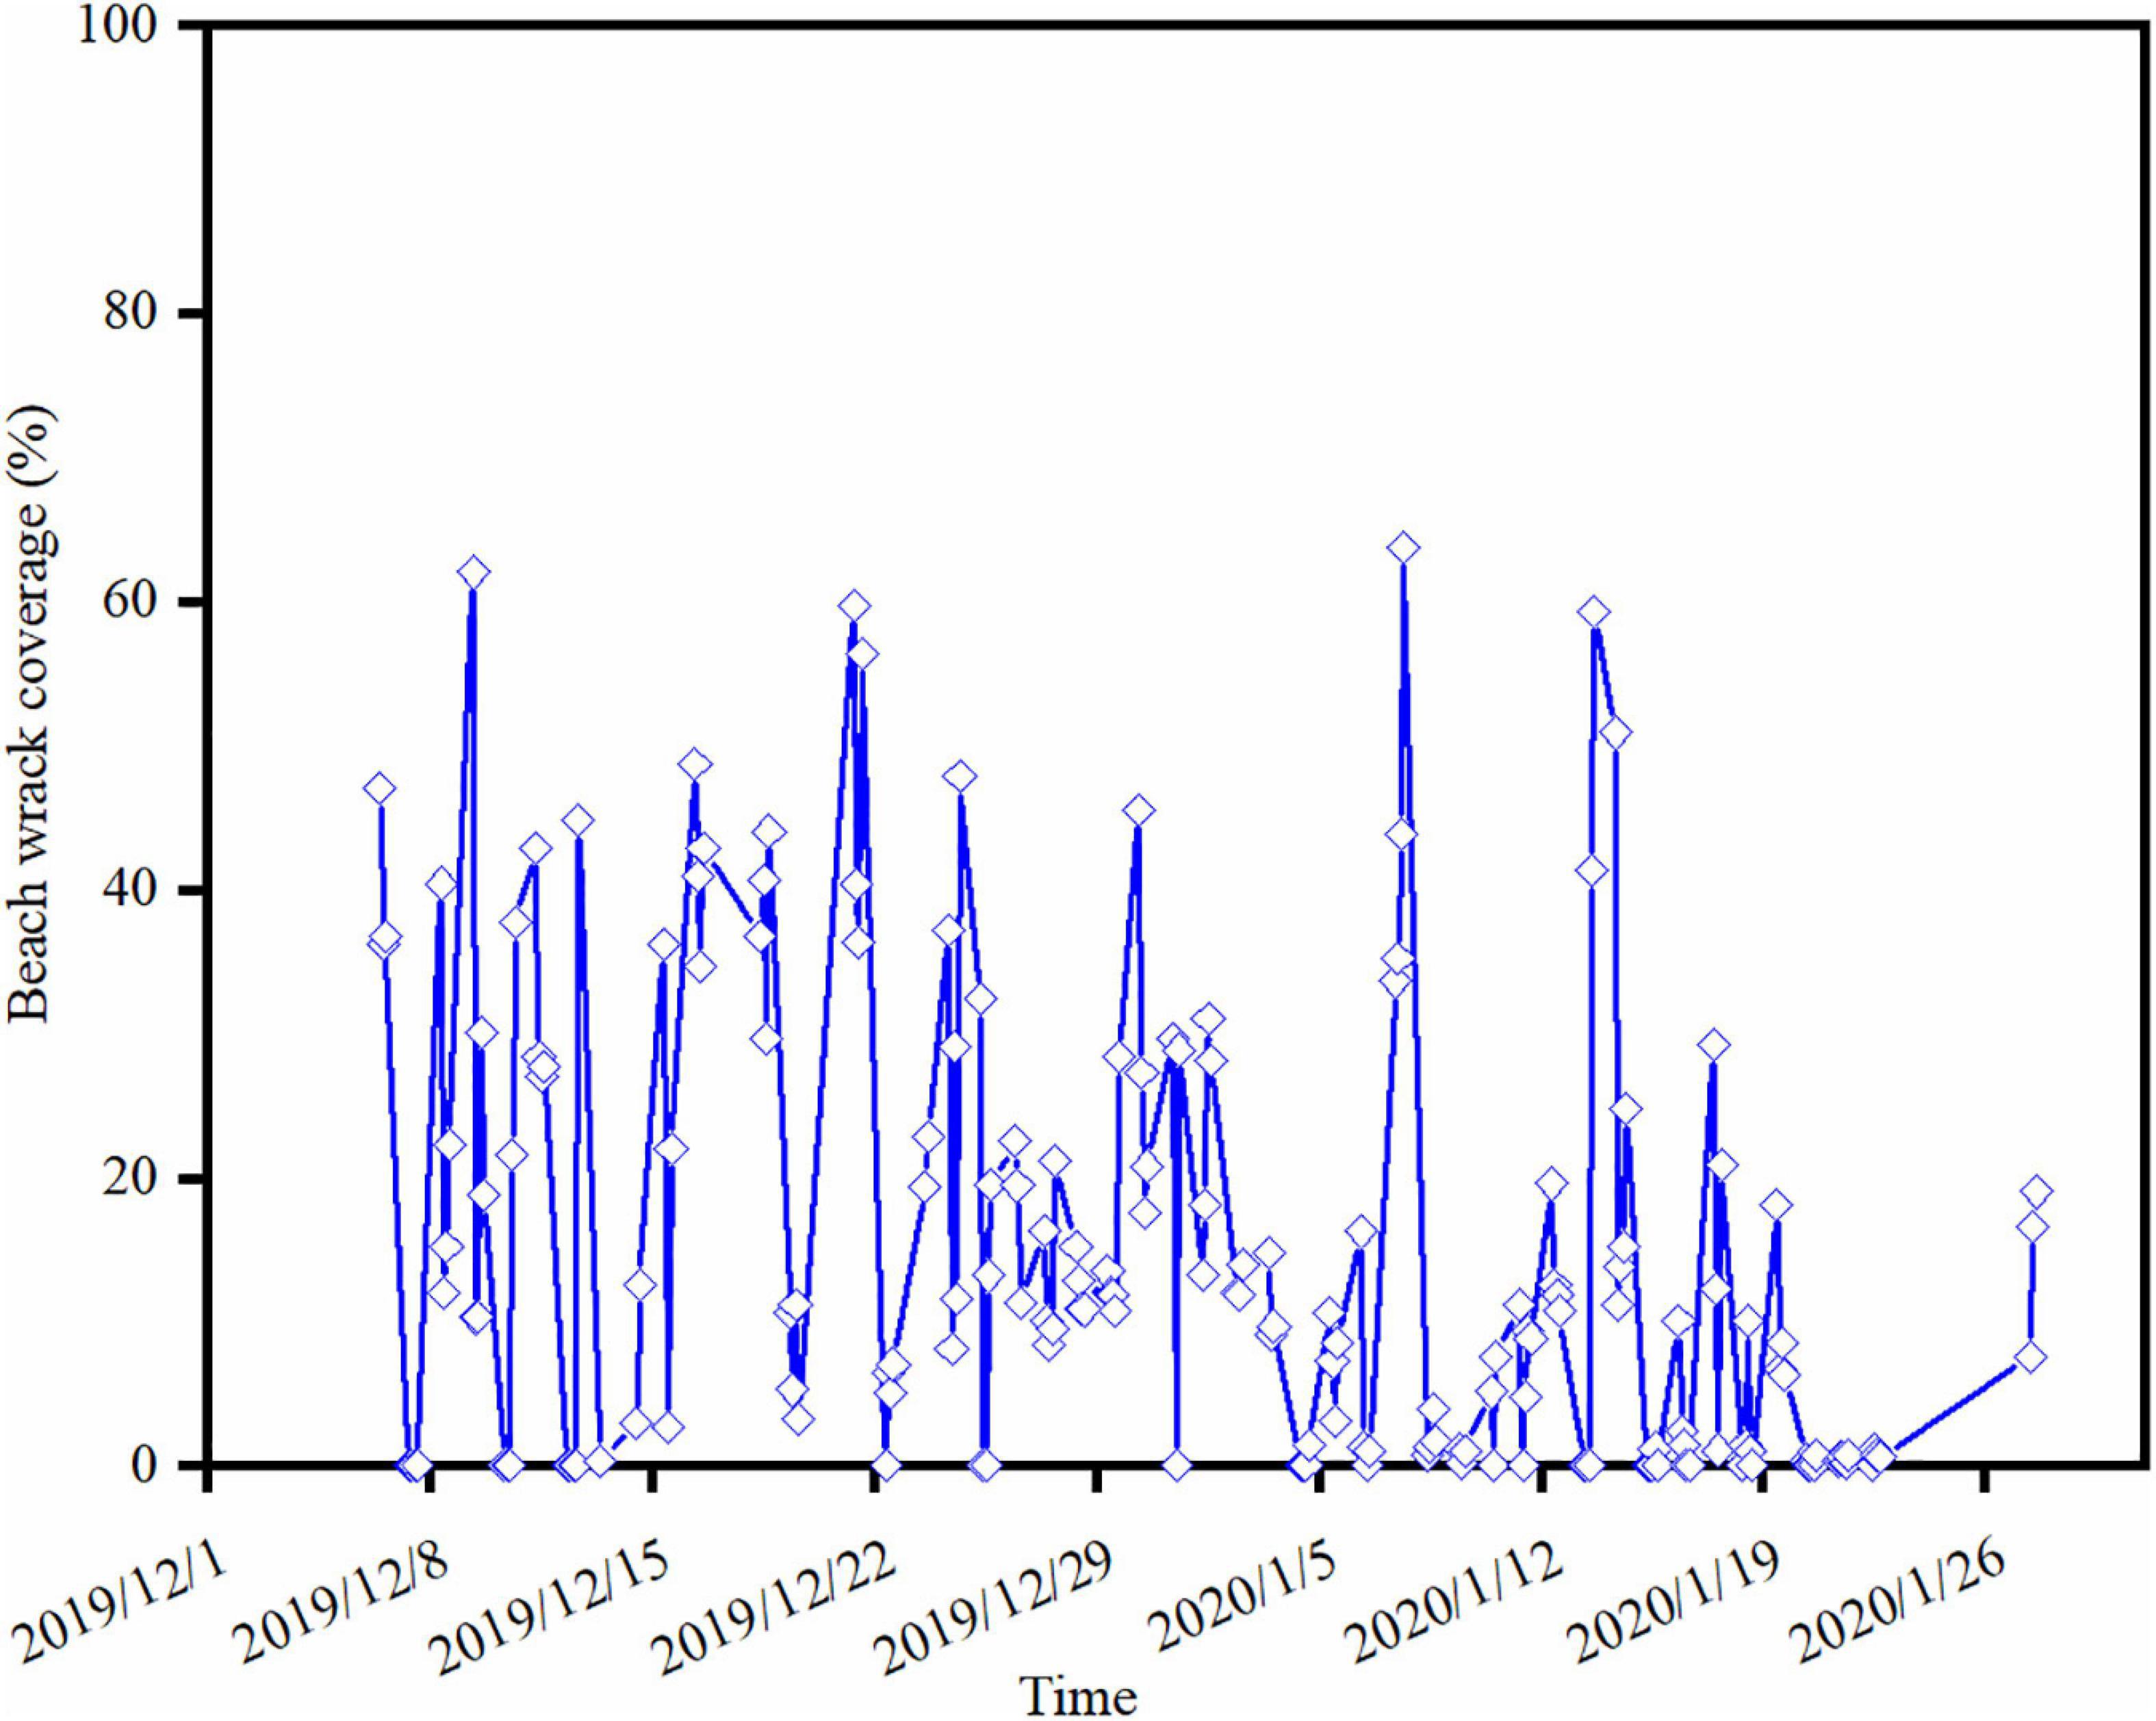
Figure 4. Wrack dynamics on the study beach during the camera trap monitoring period, achieved by the VGG network identification from the image dataset.
Evaluated by PLSR, tidal amplitude had the largest impact on beach wrack deposition, negatively affecting wrack deposition on the shore (regression coefficient = –0.12, Table 3). As tide changed from low to high (flood tide), drifting macrophytes were transported to the beach enhanced by tidal-driven waves, and then brought back to the sea by ebb tide (from high to low), resulting in short time deposition of wrack on the beach. Water temperature showed a positive relationship with beach wrack deposition probably due to the amount of wrack decreased with decreasing water temperature as the growth season ceased in winter as well as the physical fragmentation of beach wrack (regression coefficient = 0.11, Table 3). According to the PLSR result, wind direction had a negative impact on beach wrack deposition, which meant that winds from the directions observed during the monitoring period (including the prevailing southwesterly winds) removed beach wrack from the shore (regression coefficient = –0.08, Table 3). Wind speed showed a positive effect on beach wrack deposition (regression coefficient = 0.05, Table 3), which indicated that higher wind speed increased the movement of floating macrophytes to the shore during the survey period.
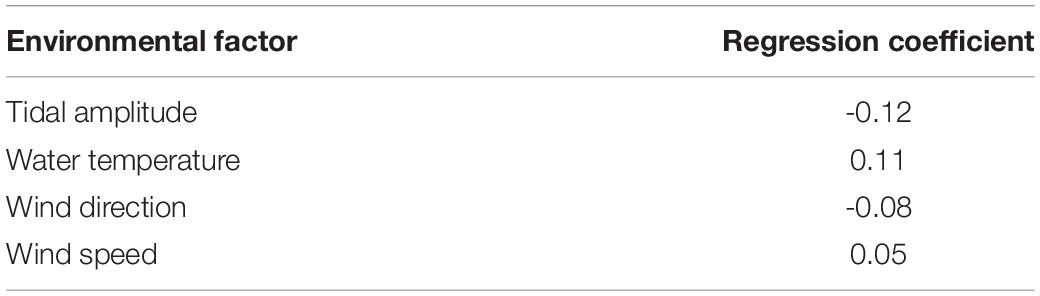
Table 3. Contribution of environmental factors to beach wrack deposition evaluated by Partial least squares regression (PLSR).
With the capability of learning characteristics of image contents, the deep learning method, in general, and the VGG network architecture, in particular, has been applied to a wide range of research fields in recent years, such as detection of leaf disease in agriculture and identification of animals in conservation areas (Simonyan and Zisserman, 2017; Norouzzadeh et al., 2018; Sujatha et al., 2021). Here, the proposed VGG network showed the ability to identify beach wrack in the camera trap images. The performance of the VGG network was generally improved with the increase in areal coverage of wrack in the image. When wrack on the shore increased from scattered (<10% of the beach area) to large areas (>50% of the beach area), the identification accuracy of the VGG network improved from 61 to 92%. The ability of the VGG network to learn the characteristics of beach wrack was enhanced as wrack feature information extracted from the image increased. During the training of the VGG network, some wave shadows were misidentified as beach wrack, especially when the beach was entirely submerged. To improve the identification accuracy of the proposed approach under near submerged beach scenarios, the learning ability of VGG algorithm can be further developed in the future by combining it with other machine learning algorithms during analysis of the image dataset.
This in-situ monitoring survey of beach wrack indicated that camera trap can be applied for real-time monitoring of beach wrack in the field. Traditional methods of manual sampling several times within a specific period can lead to a bias in the estimation of deposition patterns of beach wrack due to the uneven distribution of beach wrack over time. For instance, the daily input and output of floating macrophytes in Biscayne Bay (Florida) was estimated based on three manual sampling times conducted in 1 year (May, August, and December) where each sampling was with a duration of 5–8 days (Biber, 2007). In this study, the application of camera trap to automatically shoot the scene of beach wrack deposition every 2 h provided a labor-saving way to conduct continuous monitoring of beach wrack deposition. In future work, functional sensors, such as multispectral and radar sensors (Klemas, 2013), can be equipped on the camera trap to collect biomass information of beach wrack. Combined with beach wrack coverage estimated by the VGG network, the quantification of beach wrack can contribute to estimation of the production exported from BCEs.
Although some studies have successfully applied Unmanned Aerial Vehicles (UAVs) to map and monitor beach wrack, the operation of UAVs are strictly limited to weather conditions in the field. UAVs are sensitive to wind speeds and have a maximum wind speed tolerance of 10 m/s and requires clear and cloudless weather (Pan et al., 2021). In contrast, camera trap can be applied in a wide range of environmental conditions. Here, the camera trap still performed well in cloudy and rainy weather, and approximately 68% raw images used for the algorithm analysis were shot in cloudy weather (examples in Tables 1, 2) and despite 53% of the wind events exceeded 10 m/s during the monitoring period, the scene of beach wrack deposition was successfully recorded. Furthermore, the ability of the VGG network proposed here to identify beach wrack from a large dataset of images with different shooting backgrounds, also showed that camera trap monitoring was feasible for field data collection. Usually, the qualities of images acquired by camera trap are not as perfect as by manual operation as the shooting conditions of camera trap are affected by external factors in the field, such as the light conditions and weather on site (Norouzzadeh et al., 2018). During the camera trap monitoring period here under rough weather conditions in autumn and winter, there were about 39 blurry images caused by poor shooting light and bad weather, which were manually excluded from image analysis. Additionally, only 30% of the acquired image dataset was analyzed due to the failure of VGG network to detect images taken at night. In future field monitoring, shorter time interval between camera shootings can be set to acquire more images which are qualified for the training of the VGG network. Furthermore, to further save labor work and make full use of the image dataset, VGG network should be developed to identify images shot at both daytime and nighttime as well as the unfocused images. The increase in the number of images will not affect the efficiency of image analysis by the VGG network, as labor inputs are saved to a large degree (Hsing et al., 2018; Tabak et al., 2019). In this study, it took about 20 min to manually recognize and estimate the coverage of beach wrack from one image, whereas it took around 5 min to achieve the image identification results and the estimation of beach wrack coverage from all the 187 images by using the VGG network.
When the method has been sufficiently developed, large datasets can be analyzed very fast, saving hours and days of labor work and increasing the information of beach wrack dynamics significantly. Similarly, in a study using camera trap to monitor wildlife in conservation habitats, it was estimated that >17,000 man hours were saved by relying on deep learning with a VGG network architecture in the process of identification of animals from about 3.2 million camera trap images (Norouzzadeh et al., 2018). Thus, the large image dataset acquired during continuous monitoring by camera traps can be analyzed efficiently using deep learning approaches.
This study demonstrated that deposition and relocation of detached macrophytes on the shore as beach wrack was very dynamic in natural environments. A large amount of floating macrophytes were deposited on the shore in a couple of hours, and then returned to the sea after a short time on the shore. In one event beach wrack coverage increased from zero to 45% in 2 h followed by a decrease to 0.35% within 16 h and the same pattern was repeated on several occasions, indicating that drifting macrophytes were frequently washed between the beach and sea. Similar findings of high dynamics in beach wrack deposition were also observed along the coastline in Baltic Sea and Mediterranean (Hammann and Zimmer, 2014; Jiménez et al., 2017; Chubarenko et al., 2020). For instance, through weekly field sampling in the western Baltic Sea, it was found that beach wrack was relocated to coastal waters within weeks, leading to the decrease of beach wrack amount from ∼2,000 to ∼300 g per meter of beach within weeks (Hammann and Zimmer, 2014).
In this study, where the location was characterized as micro-tidal with an average tidal amplitude of 0.41 m, the tidal amplitude still affected beach wrack deposition with large movements during tidal actions. Similarly, high dynamics in annual deposition of beach wrack (range of 3,594–9,189 g dry weight per meter of beach) was observed under meso- and macro-tidal conditions (range of 2–4 m and >4 m, respectively) (Colombini et al., 2000; Orr et al., 2005; Barreiro et al., 2013). These studies support that regular tidal actions (flood and ebb tides) accelerate the resuspension and redeposition of beach wrack. Furthermore, wind direction had an impact on the wrack deposition, with lowest deposition, when winds were from westerly directions. The beach was generally sheltered being located inside Odense Fjord, but westerly winds removed more wrack from the beach compared to winds from the easterly directions. This finding was supported by previous study on seagrass export to the shore in northwest Mediterranean where beach wrack showed different states on the exposed beach and the sheltered one (steadier on the sheltered beach) under prevailing winds (exceeding 6 m/s) (Jiménez et al., 2017). Similarly, another study found that wind events did impact wrack deposition on both exposed and sheltered beaches along the coastline in Barkly Sound (British Columbia) when wind speed was >2.8 m/s (Orr et al., 2005). In future work, together with local wind patterns (including wind speed and direction), this monitoring survey of beach wrack dynamics can be expanded to beaches with varying exposure to wind directions along coastlines in different regions to investigate the regional pattern of beach wrack deposition.
During the monitoring period, beach wrack deposition generally decreased along with a decrease in the water temperature. The general trend of beach wrack deposition decreasing over time was probably as this survey was conducted in winter, where the growth of macrophytes has ceased after the growth season (Pessarrodona et al., 2019). The decrease in beach wrack was twofold due to the physical fragmentation of wash up as well as decomposition of macrophytes in the fjord and the transport of wrack to deeper waters (outside Odense Fjord). In British Columbia (Canada) coastal area beach wrack accumulated more in winter compared with other seasons (Wickham et al., 2020), whereas a survey along German Baltic coasts found that wrack on the shore increased in late summer and fall (Mossbauer et al., 2012). As the monitoring period here (around 2 months) was relatively short, longer time-scale monitoring survey must be carried out to address seasonal variations.
The proposed approach of real-time monitoring beach wrack with a camera trap not only provided an effective way to track the detached macrophytes exported from BCEs but also a practical solution for the discontinuity of field monitoring data in ecological research. Furthermore, the application of deep learning provided a time- and labor-saving method for the analysis of large image datasets, promoting the application of camera trap in ecological monitoring survey and environmental management. In future work, functional sensors can be equipped on the camera trap to collect biomass information of beach wrack, and longer-time monitoring surveys can be carried out along coastlines in various areas to obtain temporal and spatial patterns of beach wrack deposition.
The original contributions presented in the study are included in the article/supplementary material, further inquiries can be directed to the corresponding author.
MH, MF, and YP contributed to the conception and design of the study. YP, NA, and PS-K analyzed the image database. YP performed the statistical analysis and wrote the first draft of the manuscript. All authors contributed to manuscript revision, read, and approved the submitted version.
This study was supported by the China Scholarship Council (CSC).
The authors declare that the research was conducted in the absence of any commercial or financial relationships that could be construed as a potential conflict of interest.
All claims expressed in this article are solely those of the authors and do not necessarily represent those of their affiliated organizations, or those of the publisher, the editors and the reviewers. Any product that may be evaluated in this article, or claim that may be made by its manufacturer, is not guaranteed or endorsed by the publisher.
We would like to thank Thomas Busk, research assistant at Department of Biology, University of Southern Denmark, for his kind ride to the field.
Abu Shmmala, F., and Ashour, W. M. (2013). Color based image segmentation using different versions of k-means in two spaces. Glob. Adv. Res. J. Eng. Technol. Innov. 1, 30–40.
Ajmal, A., Hollitt, C., Frean, M., and Al-Sahaf, H. (2018). “A comparison of RGB and HSV colour spaces for visual attention models,” in Proceedings of the 2018 International Conference on Image and Vision Computing New Zealand (IVCNZ), (Auckland), 1–6.
Barreiro, F., Gómez, M., López, J., Lastra, M., and De La Huz, R. (2013). Coupling between macroalgal inputs and nutrients outcrop in exposed sandy beaches. Hydrobiologia 700, 73–84.
Biber, P. D. (2007). Hydrodynamic transport of drifting macroalgae through a tidal cut. Estuar. Coast. Shelf Sci. 74, 565–569. doi: 10.1016/j.ecss.2007.04.019
Chubarenko, B., Woelfel, J., Hofmann, J., Aldag, S., Beldowski, J., Burlakovs, J., et al. (2020). Converting beach wrack into a resource as a challenge for the Baltic Sea (an overview). Ocean Coast. Manag. 200:105413.
Colombini, I., Aloia, A., Fallaci, M., Pezzoli, G., and Chelazzi, L. (2000). Temporal and spatial use of stranded wrack by the macrofauna of a tropical sandy beach. Mar. Biol. 136, 531–541. doi: 10.1007/s002270050713
Duarte, C. M. (2017). Reviews and syntheses: hidden forests, the role of vegetated coastal habitats in the ocean carbon budget. Biogeosciences 14, 301–310.
Duarte, C. M., and Krause-Jensen, D. (2017). Export from seagrass meadows contributes to marine carbon sequestration. Front. Mar. Sci. 4:13. doi: 10.1016/j.scitotenv.2020.140185
Dugan, J. E., Hubbard, D. M., Mccrary, M. D., and Pierson, M. O. (2003). The response of macrofauna communities and shorebirds to macrophyte wrack subsidies on exposed sandy beaches of southern California. Estuar. Coast. Shelf Sci. 58, 25–40.
Flindt, M. R., Rasmussen, E. K., Valdemarsen, T., Erichsen, A., Kaas, H., and Canal-Vergés, P. (2016). Using a GIS-tool to evaluate potential eelgrass reestablishment in estuaries. Ecol. Modell. 338, 122–134.
Ganesan, P., and Rajini, V. (2014). “Assessment of satellite image segmentation in RGB and HSV color space using image quality measures,” in Proceeding of the 2014 International Conference on Advances in Electrical Engineering (ICAEE), (Vellore), 1–5.
Hammann, S., and Zimmer, M. (2014). Wind-driven dynamics of beach-cast wrack in a tide-free system. Open J. Mar. Sci. 4:2014.
Hassan, M. R., Ema, R. R., and Islam, T. (2017). Color image segmentation using automated K-means clustering with RGB and HSV color spaces. Glob. J. Comput. Sci. Technol. 17:2017.
Hsing, P. Y., Bradley, S., Kent, V. T., Hill, R. A., Smith, G. C., Whittingham, M. J., et al. (2018). Economical crowdsourcing for camera trap image classification. Remote Sens. Ecol. 4, 361–374.
Jiménez, M. A., Beltran, R., Traveset, A., Calleja, M. L., Delgado-Huertas, A., and Marbà, N. (2017). Aeolian transport of seagrass (Posidonia oceanica) beach-cast to terrestrial systems. Estuar. Coast. Shelf Sci. 196, 31–44.
Klemas, V. (2013). Remote sensing of coastal wetland biomass: an overview. J. Coast. Res. 29, 1016–1028.
Kuusemäe, K., Rasmussen, E. K., Canal-Verges, P., and Flindt, M. R. (2016). Modelling stressors on the eelgrass recovery process in two Danish estuaries. Ecol. Modell. 333, 11–42.
Liu, S. L., Trevathan-Tackett, S. M., Lewis, C. J. E., Ollivier, Q. R., Jiang, Z. J., Huang, X. P., et al. (2019). Beach-cast seagrass wrack contributes substantially to global greenhouse gas emissions. J. Environ. Manag. 231, 329–335.
Macreadie, P. I., Trevathan-Tackett, S. M., Baldock, J. A., and Kelleway, J. J. (2017). Converting beach-cast seagrass wrack into biochar: a climate-friendly solution to a coastal problem. Sci. Total Environ. 574, 90–94.
Molina-Navarro, E., Andersen, H. E., Nielsen, A., Thodsen, H., and Trolle, D. (2018). Quantifying the combined effects of land use and climate changes on stream flow and nutrient loads: a modelling approach in the Odense Fjord catchment (Denmark). Sci. Total Environ. 621, 253–264.
Mossbauer, M., Haller, I., Dahlke, S., and Schernewski, G. (2012). Management of stranded eelgrass and macroalgae along the German Baltic coastline. Ocean Coast. Manag. 57, 1–9.
Nordstrom, K. F., Jackson, N. L., and Korotky, K. H. (2011). Aeolian sediment transport across beach wrack. J. Coast. Res. 59, 211–217.
Norouzzadeh, M. S., Nguyen, A., Kosmala, M., Swanson, A., Palmer, M. S., Packer, C., et al. (2018). Automatically identifying, counting, and describing wild animals in camera-trap images with deep learning. Proc. Natl. Acad. Sci. U.S.A. 115, E5716–E5725.
O’Connell, A. F., Nichols, J. D., and Karanth, K. U. (2010). Camera Traps in Animal Ecology: Methods and Analyses. New York, NY: Springer Science & Business Media.
Orr, M., Zimmer, M., Jelinski, D. E., and Mews, M. (2005). Wrack deposition on different beach types: spatial and temporal variation in the pattern of subsidy. Ecology 86, 1496–1507.
Pan, Y., Flindt, M., Schneider-Kamp, P., and Holmer, M. (2021). Beach wrack mapping using unmanned aerial vehicles for coastal environmental management. Ocean Coast. Manag. 213:105843.
Perry, R. A., Vaudrey, J. M., and Dierssen, H. M. (2018). Long range transport and carbon and nitrogen dynamics of floating seagrass wracks in Greater Florida Bay. Estuar. Coast. Shelf Sci. 209, 7–17.
Pessarrodona, A., Foggo, A., and Smale, D. A. (2019). Can ecosystem functioning be maintained despite climate-driven shifts in species composition? Insights from novel marine forests. J. Ecol. 107, 91–104.
Riisgård, H. U., Lassen, J., Kortegaard, M., Møller, L. F., Friedrichs, M., Jensen, M. H., et al. (2007). Interplay between filter-feeding zoobenthos and hydrodynamics in the shallow Odense Fjord (Denmark)–Earlier and recent studies, perspectives and modelling. Estuar. Coast. Shelf Sci. 75, 281–295.
Rodil, I. F., Olabarria, C., Lastra, M., and López, J. (2008). Differential effects of native and invasive algal wrack on macrofaunal assemblages inhabiting exposed sandy beaches. J. Exp. Mar. Biol. Ecol. 358, 1–13.
Simonyan, K., and Zisserman, A. (2014). Very deep convolutional networks for large-scale image recognition. arXiv [Preprint]. arXiv:1409.1556,
Simonyan, K., and Zisserman, A. (2017). Very deep convolutional networks for large-scale image recognition. arXiv [Preprint]. arXiv:1409.1556,
Sujatha, R., Chatterjee, J. M., Jhanjhi, N., and Brohi, S. N. J. M. (2021). Performance of deep learning vs machine learning in plant leaf disease detection. Microprocess. Microsyst. 80:103615.
Swanson, A., Kosmala, M., Lintott, C., Simpson, R., Smith, A., and Packer, C. (2015). Snapshot Serengeti, high-frequency annotated camera trap images of 40 mammalian species in an African savanna. Sci. Data 2:150026.
Tabak, M. A., Norouzzadeh, M. S., Wolfson, D. W., Sweeney, S. J., Vercauteren, K. C., Snow, N. P., et al. (2019). Machine learning to classify animal species in camera trap images: applications in ecology. Methods Ecol. 10, 585–590.
Keywords: beach wrack, camera trap, real-time monitoring, deep learning, image classification, blue carbon ecosystems
Citation: Pan Y, Ayoub N, Schneider-Kamp P, Flindt M and Holmer M (2022) Beach Wrack Dynamics Using a Camera Trap as the Real-Time Monitoring Tool. Front. Mar. Sci. 9:813516. doi: 10.3389/fmars.2022.813516
Received: 11 November 2021; Accepted: 03 January 2022;
Published: 24 January 2022.
Edited by:
Joseph James Tamborski, Old Dominion University, United StatesReviewed by:
Jenny R. Hillman, The University of Auckland, New ZealandCopyright © 2022 Pan, Ayoub, Schneider-Kamp, Flindt and Holmer. This is an open-access article distributed under the terms of the Creative Commons Attribution License (CC BY). The use, distribution or reproduction in other forums is permitted, provided the original author(s) and the copyright owner(s) are credited and that the original publication in this journal is cited, in accordance with accepted academic practice. No use, distribution or reproduction is permitted which does not comply with these terms.
*Correspondence: Marianne Holmer, aG9sbWVyQHNkdS5kaw==
Disclaimer: All claims expressed in this article are solely those of the authors and do not necessarily represent those of their affiliated organizations, or those of the publisher, the editors and the reviewers. Any product that may be evaluated in this article or claim that may be made by its manufacturer is not guaranteed or endorsed by the publisher.
Research integrity at Frontiers
Learn more about the work of our research integrity team to safeguard the quality of each article we publish.