 Jianhua Kang
 Zhaohe Luo
 Hala. F. Mohamed1,4
 Yu Wang
 Wenlu Lan
94% of researchers rate our articles as excellent or good
Learn more about the work of our research integrity team to safeguard the quality of each article we publish.
Find out more
ORIGINAL RESEARCH article
Front. Mar. Sci., 28 March 2022
Sec. Marine Biogeochemistry
Volume 9 - 2022 | https://doi.org/10.3389/fmars.2022.813401
Photosynthetically produced dissolved organic carbon (PDOC) released by marine phytoplankton has an important significance on the marine carbon cycle and on the growth of heterotopic bacteria (HB). However, PDOC is often neglected in the estimation of global marine primary productivity and carbon sequestration capacity. This work studied the issue of PDOC and its environmental regulation mechanism through field investigation and lab experiments in an estuarine bay during southwest and northeast monsoon. We used the percentage of extracellular release (PER) as a key indicator to evaluate the contribution of PDOC to total primary productivity (TPP). We also compared PER among different seasons and sectors and then analyzed the inter-relationship between PDOC and bacterial carbon demand (BCD), size-fractionated phytoplankton, bacterial production (BP), and TPP. We finally discussed the impact factors of PDOC productivity. The results showed that the average contribution of PDOC to TPP in Qinzhou bay could reach 15% during two seasons, which satisfies about 25% of the carbon requirement by HB in the bay. Multiple factors contribute to the seasonal (SW monsoon 13% < NE monsoon 18%) and sectoral variation (outer bay 26% > middle bay 17% > inner bay 7%) in PER, the most significant of which are salinity and nitrogen to phosphorus ratios. PER is also related to phytoplankton community structure and nutrient limitation, the higher PER in the outer bay is attributed to the dual effect of picophytoplankton being the predominant species and a severe imbalance in the nitrogen to phosphorus ratio, both of which lead to increased phytoplankton PDOC release. On the other hand, the lower PER in the inner bay was mainly due to the dominance of microphytoplankton and nitrogen to phosphorus ratio which is close to the redfield ratio. There is still a non-uniform conclusion on the relationship between PER and TPP, suggesting that this relationship needs to be evaluated not only in a horizontal-independent way but also through seasonal and vertical dimensions. The non-linear relationship between PDOC and BCD found in this study potentially indicated weak coupling between phytoplankton exudation and bacterial metabolism. In addition to phytoplankton exudate, HB is still dependent on other sources of DOC to meet their carbon requirements.
The carbon produced and conserved by living organisms is called biogenic carbon. phytoplankton biogenic carbon includes photosynthetic particulate organic carbon (PPOC) and photosynthetic dissolved organic carbon (PDOC), both of which are essentially achieved through primary production processes. As the name implies, PDOC production is the process by which organic carbon is synthesized by phytoplankton through photosynthesis and eventually released directly into the water in dissolved form (Myklestad, 2000). Early scholars drew their attention to the production of PPOC, arguing that most of the organic matter produced by phytoplankton is retained in the cell body during its lifecycle, and when the cell dies and disintegrates, its cellular components are released into the water column as soluble or colloidal substances (Vollenweider and Nauwerck, 1961). However, as later studies progressed, scientists gradually discovered that a significant fraction of healthy living phytoplankton directly released dissolved organic carbon (DOC), which had remained unmeasured for a long time during the process of phytoplankton synthesis of organic matter (Fogg et al., 1965; Berman and Holm-Hansen, 1974). Sharp (1977) questioned the ability of healthy growing phytoplankton to release dissolved organic matter (DOM), pointing out that the presence of dissolved organic radiocarbon (carbon-14; DO14C) could be due to some artifacts in the experiment, such as immobilization of non-fixed 14C and cell rupture. To avoid possible overestimation, the researchers designed more detailed and precise experiments to address the issues raised by Sharp (1977). For instance, the use of Nuclepore polycarbonate (PC) membranes with low 14C-DOC adsorption instead of Whatman membranes with high 14C-DOC adsorption, based on sample filtration by acidification and aeration, was effective in removing immobilized 14C-dissolved inorganic carbon (DIC) from the filtrate and membranes (Grande et al., 1989; Karl et al., 1998).
In these findings, most of the results disproved Sharp’s view although the quantitative values of PDOC release were found to be considerably lower (Teira et al., 2003; Marañón et al., 2005). At present, a large amount of conclusive evidence has shown that direct PDOC release is a common physiological process in algae (Sieczko et al., 2015; Spilling et al., 2019; Fogg and Watt, 2020). A growing number of studies have confirmed the importance of phytoplankton PDOC release in marine ecosystems and biogeochemical processes (Erin et al., 2015; Livanou et al., 2019; Rao et al., 2021); nevertheless, this small fraction of the ocean’s primary productivity released in the form of PDOC, is still often overlooked and is one of the most serious problems facing research in this area. Most observations of marine primary productivity still measure only the particulate fraction and do not routinely measure the dissolved fraction. Correspondingly, most relevant food web trophic dynamic models, carbon cycle, and carbon balance models also ignore this important part of carbon flow, resulting in an underestimation of global ocean primary productivity and carbon sequestration capacity (Teira et al., 2015). Longhurst et al. (1995) calculated the global annual total primary productivity (TPP) of the oceans to be 45-50 Gt/a by remote sensing models, and this value would increase to 55-62 Gt/a when the neglected PDOC is considered (Marañón et al., 2005), which would greatly reduce the discrepancy in the global carbon budget estimates.
On a small scale, the role of PDOC in the low trophic level of the marine biological pump and microbial loop is also controversial (Wiebe and Smith, 1977; Azam et al., 1983). Peterson (1984) used a carbon flow model to estimate that algal secretion contributed 73% of the nutrients required for bacterial metabolism, but this figure included DOM released by fragmented algae, while Sharp (1984) suggested that the model estimate was approximately 25% overestimated from the true value. Chen et al. (2020) suggested that the microbial loop may receive relatively less organic carbon supply and rely more on PDOC for bacterial support in the future warmer, less productive ocean. Although scholars have failed to agree on the contribution of PDOC to bacteria, there is still some scientific consensus on certain aspects, such as that DOM released directly by phytoplankton may be more important for the maintenance of heterotrophic bacteria (HB) relative to organic matter fed by zooplankton or lysed by algae (Cole et al., 1982; Hansell, 2002; Carlson and Hansell, 2015). They concluded that studying the relationship between HB and PDOC in marine waters would not only map the role of phytoplankton extracellular products in the relationship between bacteria and algae but also help to calculate the efficiency of bacterial secondary production of carbon conversion and estimate the energy flow and carbon flux values of microfood loops, which is of great scientific significance for the ultimate insight into the food web structure and carbon cycling pathways in marine ecosystems (Teira et al., 2015; Livanou et al., 2017).
Photosynthetically produced dissolved organic carbon is part of the phytoplankton photosynthesis product, so the ratio of PDOC to TPP is a very important ecological indicator that is often presented internationally in terms of percentage of extracellular release (PER) (Obernosterer and Herndl, 1995). The calculation of PER is generally expressed using the formula PER = PDOC/(PDOC+PPOC), which indicates the contribution of PDOC to gross primary productivity (Fogg et al., 1965). PER is currently recognized as the most critical and central factor in PDOC research (López-Sandoval et al., 2011), and its environmental regulatory mechanisms are still not well resolved and controversial. Historically, PDOC in laboratory cultures has been measured to be 2–10% of total production (Mague et al., 1980; Myklestad et al., 1989), yet this percentage becomes more variable and generally higher in the field (Marañón et al., 2005; Poulton et al., 2016). Reconciling these differences is challenging, with implications for carbon modeling, carbon sequestration, and microbial loop processes. The prevailing view is that PER fluctuates greatly in different seas, varying between below the detection limit and 68.9% (Sharp, 1977; Morán et al., 1999; Poulton et al., 2016), while the minority argues that PER is essentially constant in different seas, for example, remaining at 13% in coastal areas (Baines and Pace, 1991) and around 20% in upwelling zones and oligotrophic open waters (Marañón et al., 2005). Nagata (2000) and Teira et al. (2001) pointed out that the study of the relationship between TPP and PER needs to be supported by a large amount of data from areas with a large gradient of primary productivity, especially the comparison between eutrophic and oligotrophic seas. Thus, since PDOC data need to be obtained through a large number of field incubation experiments, and the current PDOC data are not sufficient to distinguish the differences in PER at different spatial and temporal levels, the distribution patterns and environmental regulation mechanisms of PER still need to be further mapped and explored.
Qinzhou Bay was selected as the study area (108–109°E, 21.5∼22°N), which is located at the top of the Beibu Gulf of the South China Sea. The climate is characterized by the prevailing southwest (SW) monsoon from May to September and the northeast (NE) monsoon from October to February. Qinzhou Bay is a semi-enclosed natural estuarine zone that is shaped like a gourd and consists of a head, neck, and body with an area covering about 380 km2. Head refers to the Maowei Sea, which belongs to the enclosed inner bay of Qinzhou Bay known as a large oyster farming base in China (Wu et al., 2014). The Maowei Sea presents low salinity because it is an inlet with the Qinjiang and Maoling rivers as the main input runoff, and also has frequent outbreaks of harmful algal blooms due to heavy eutrophication brought about by the influence of agriculture, industry, and fisheries (Xu et al., 2019; Zhu et al., 2021). The neck is the channel that connects the Maowei Sea (inner bay) to the middle bay and is flanked by large mangroves. There is a Qinzhou Port Industrial Zone at the channel mouth, focusing on petroleum, energy, phosphorus, pulp and paper, and other supporting industries. The neck suffers from triple pollution from river discharges, port sewage, and mariculture activities. The body includes the middle and outer bays, especially the outer bay is often defined as a clean sea due to less farming and light pollution (Lai et al., 2014). Since the intrusion of seawater from the South China Sea, the outer bay is characterized by high salinity and low nutrients, especially phosphate which is often below the detection threshold (Qiao et al., 2013; Kang et al., 2020).
There have been some studies on PDOC production by phytoplankton in tropical environments, which have focused particularly on the carbon partitioning into the DOC reservoir (Meador et al., 2010; Meador and Aluwihare, 2014), while the environmental regulation of PDOC production has not been explored in-depth. Hence, a pioneering attempt was made in this regard, to quantify the PDOC productivity and to identify its role on TPP in a tropical coastal Bay. Earlier studies of PER values and their relationship to productivity under different marine and environmental conditions have produced contrasting results (Teira et al., 2001; Marañón et al., 2005), suggesting that the issue is still not well resolved. We assumed that the uncertainty and irregularity in PER are due to large Spatio-temporal differences. In order to try to find its environmental regulation mechanisms, it is particularly appropriate to select an estuarine bay with both eutrophic and oligotrophic characteristics as a study area during different monsoonal periods. Therefore, the present study was aimed to quantify and understand the contribution of PDOC to TPP, reveal the role of autochthonous PDOC to HB in an area with high Spatio-temporal differences. Also, the relationship between PER and environmental parameters and the important factors influencing the release of PDOC by phytoplankton were examined in the bay.
In this study, two individual observations were made in Qinzhou bay during June (SW monsoon) and November (NE monsoon) 2015 for 16 hydrologically different stations. The monitored stations were classified into the following three different sectors: the inner bay (Station 1–5), middle bay (Station 6–13), and outer bay (Station 14–16) (Detailed information is presented in Figure 1). For the response mechanisms of PDOC production to physicochemical processes, this study focused on geochemical parameters such as temperature, salinity, photosynthetically active radiation (PAR), euphotic depth (Zeu), turbidity (TUB), dissolved oxygen (DO), and nutrients. For the ecological response mechanisms of biological processes in PDOC production, our case focused on the biological parameters such as total Chlorophyll a (Chl a), size-fractionated Chl a, PPOC, PDOC, TPP, bacterial abundance (BA), heterotrophic bacterial production (BP), and microphytoplankton.
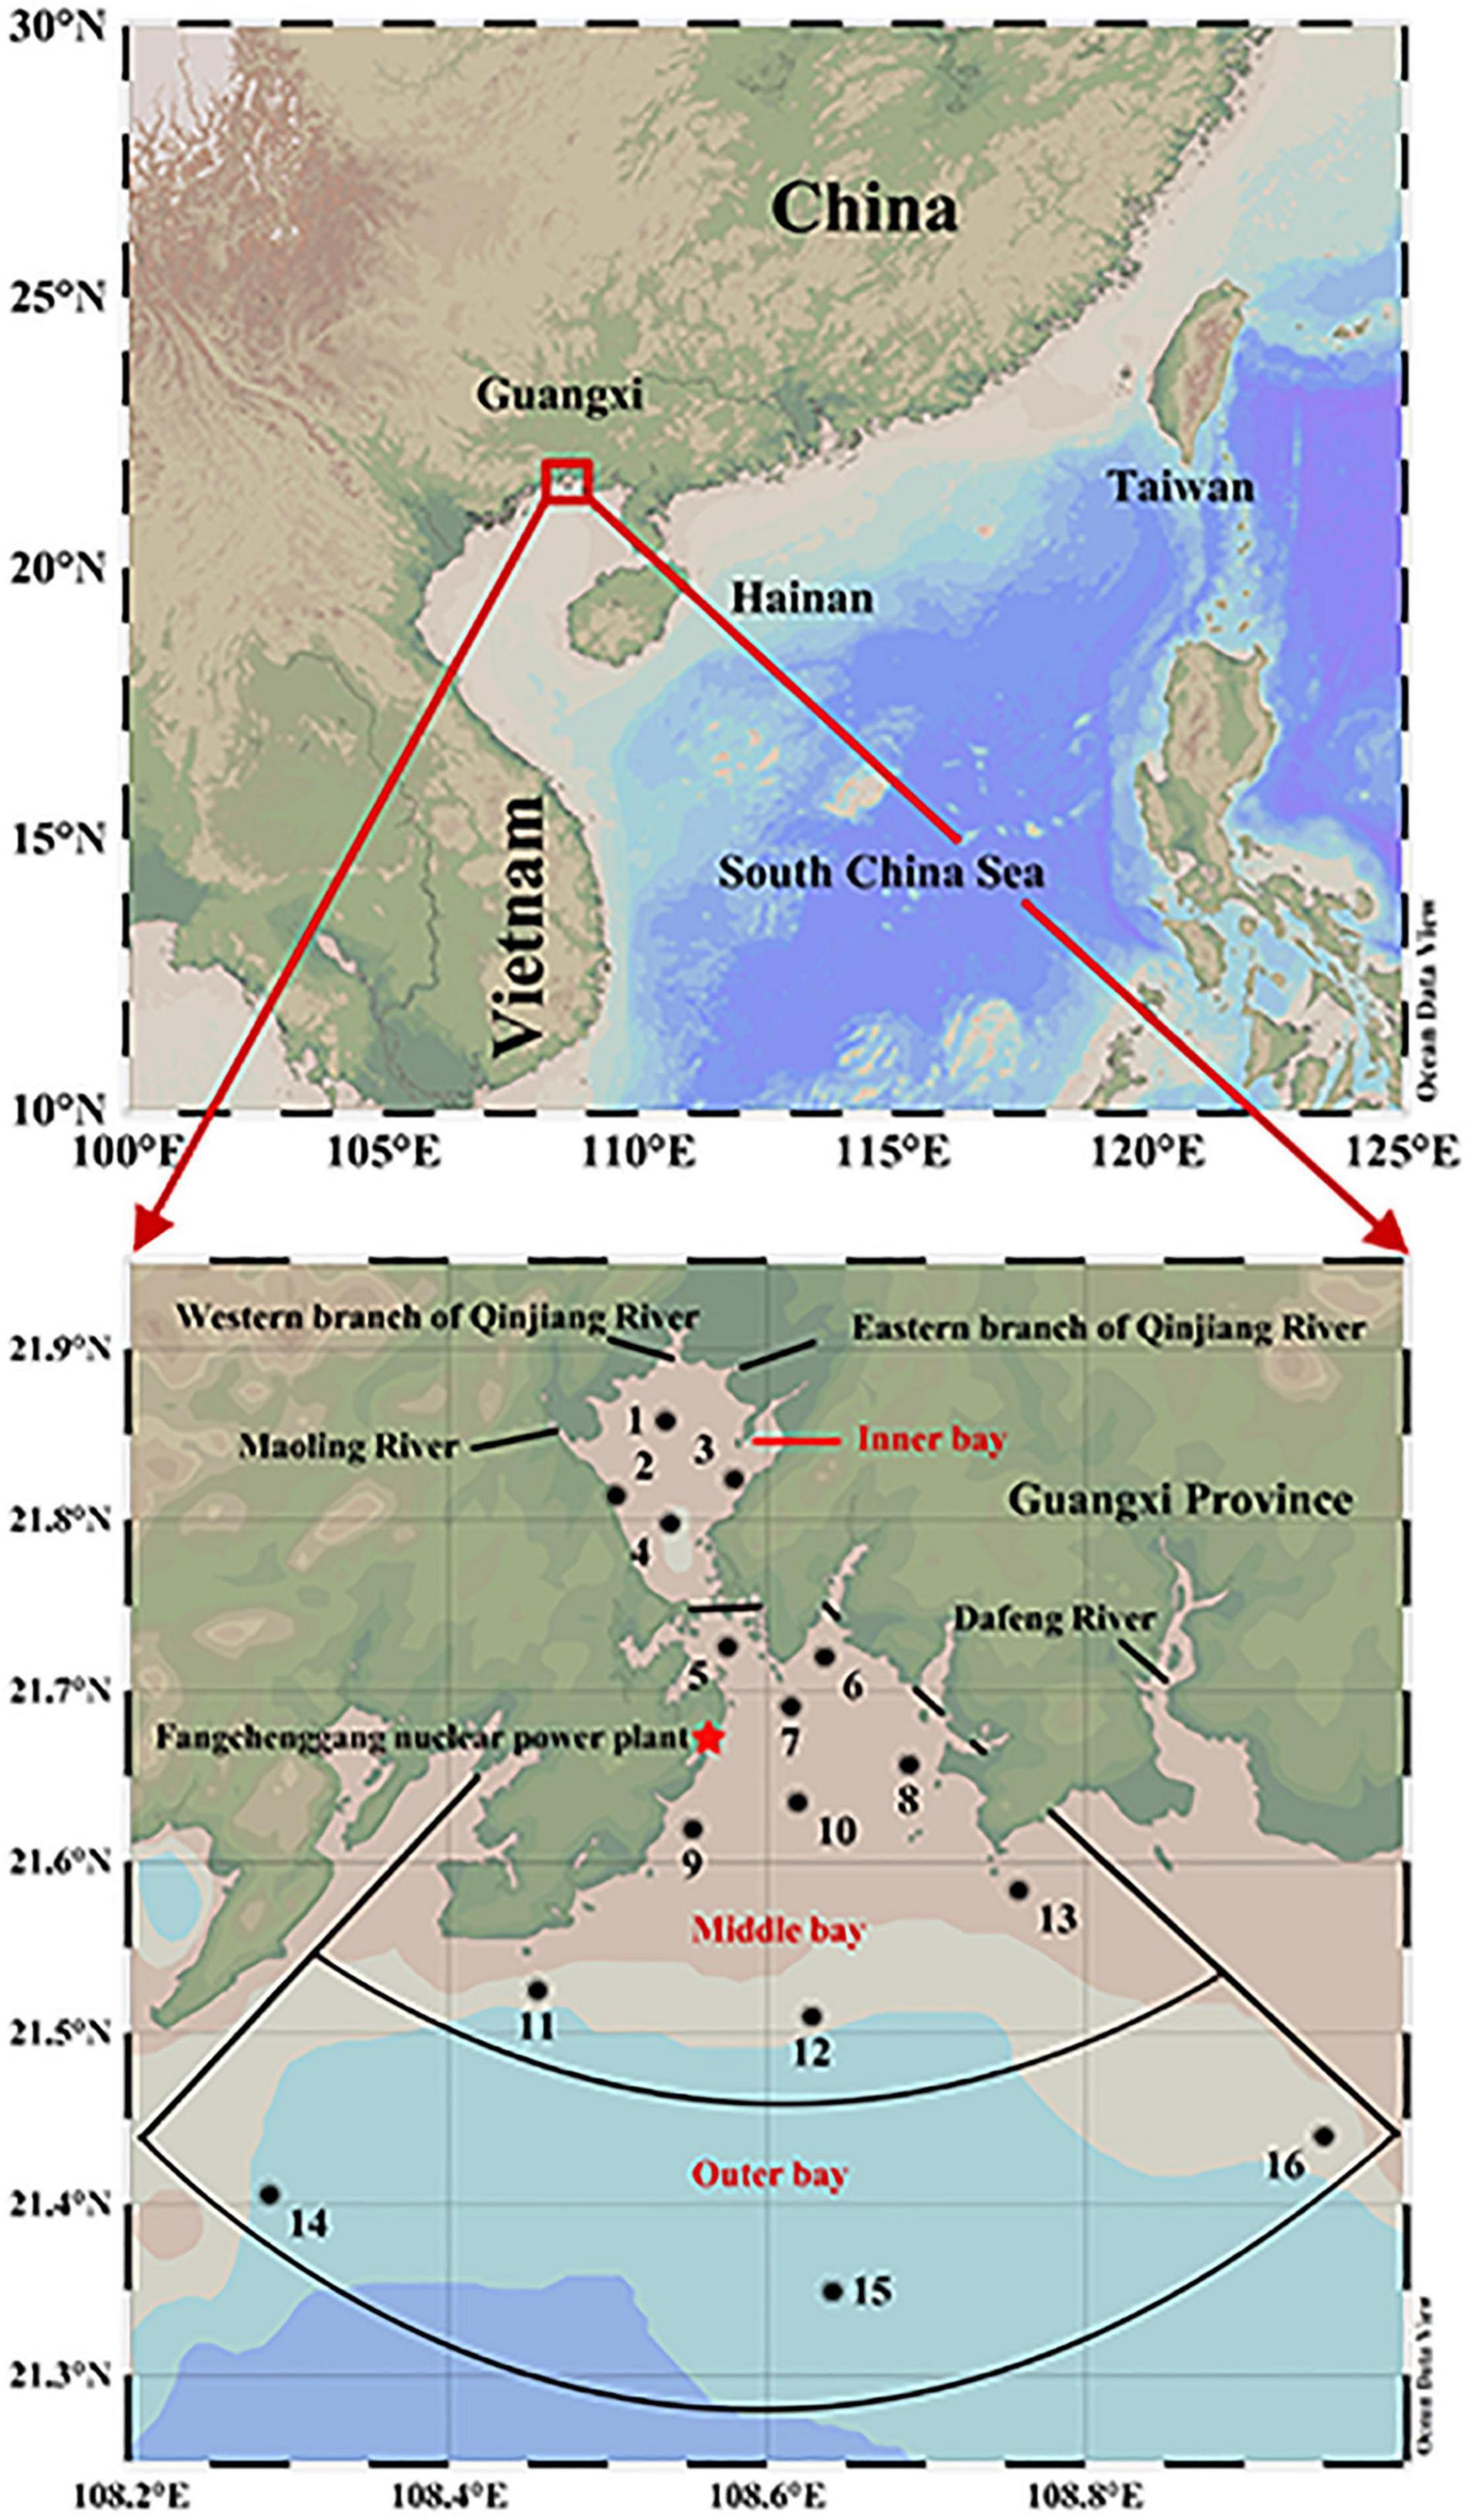
Figure 1. Sampling sites in the Qinzhou Bay.
Water samples were collected from the surface and bottom of Zeu using a Niskin bottle (HYDRO-BIOS, Germany). Physical parameters (temperature and salinity; PAR) were recorded using a CTD system (Seabird 911, United States). Estimates of Zeu correspond roughly to the depth at which surface PAR is reduced to 1% of its surface value (Lee et al., 2007).
Chemical parameters include nitrate, nitrite, ammonium, dissolved inorganic phosphate (DIP), dissolved inorganic silicate (DSi), DO, and TUB. For nutrient determination, water samples were independently homogenized and filtered using a 0.45 μm pore size cartridge, and approximately 300 ml of filtered water was retained in high-density polyethylene bottles which was immediately stored in a freezer at a temperature of −20°C to be further analyzed in the laboratory. Nutrient concentrations were later determined in the laboratory using a QUAATRO Flow AutoAnalyzer (BRAN+LUEBBE, Hamburg, Germany) specially developed for the analysis of waters. All methods were adapted to the methodology of segmented flow analysis and uncertainties were determined following the study of Grasshoff et al. (2009). The dissolved inorganic nitrogen (DIN) data resulted from the sum of nitrite, nitrate, and ammonium data. In addition, the iodometric method was used to measure DO (Garcia and Gordon, 1992). TUB was collected using a DH4 portable analyzer (HACH, Loveland, CO, United States).
Tested biological parameters included total Chl a, size-fractionated Chl a, PPOC, PDOC, TPP, PER, BA, BP, and phytoplankton abundance. The samples to be used for the estimation of the size-fractionated Chl a were fractionated sequentially onto 20, 2, and 0.2 μm polycarbonate membranes. Gravity and vacuum pressures of approximately 0.03 Mpa were applied to the 20 μm membrane to assist filtration through the 2 and 0.2 μm filters. Following filtration, the filters were immersed in 90% acetone and kept at 4°C in the dark for 24 h until Chl a concentration was examined by the fluorometric method (Yentsch and Menzel, 1963) using a 10AU field fluorometer (Turner Designs, San Francisco, CA, United States). The chlorophylls retained on the 20, 2, and 0.2 μm filters were designated as microphytoplankton chlorophyll [Chl a(micro)], nanophytoplankton chlorophyll [Chl a(nano)], and picophytoplankton chlorophyll [Chl a(pico)], respectively. The total Chl a [Chl a(total)] concentration was taken as the sum of the three fractions [Chl a(micro), Chl a(nano), and Chl a(pico)]. PPOC and PDOC were measured using the 14C tracer method (Parsons et al., 1984). Water was sampled from six different depths. A sampling at stations with euphotic zone was taken from the surface and the 50, 30, 10, 5, and 1% daylight level. Acid-cleaned polycarbonate bottles (two in light and one in dark for each depth) were filled with seawater filtered through 200 μm mesh. Samples were incubated in situ for 2–6 h after adding 740 kBq of sodium bicarbonate (NaH14CO3) tracer and then filtered sequentially onto a polycarbonate membrane (0.2 μm pore size, 47 mm diameter) (Millipore, Billerica, MA, United States). Filters were soaked in 1 ml x 0.1 μmol/mL hydrochloric acid (HCl) and allowed to stand in uncapped polycarbonate 20 ml vials for 15 min and stored in dark to be measured for PPOC productivity. After filtration, 10 ml of the filtrate was transferred into 20 ml of scintillation bottles. Then, 500 μl of 1N HCl was added to each bottle to make the pH value around 2 and then treated in an aerated foaming device for 30 min to remove the inorganic 14C to be measured for PDOC productivity. Afterward, 10 ml cocktail (Perkin Elmer, Waltham, MA, United States) was added to each bottle after all samples (PPOC and PDOC) were taken to the laboratory. Total radioactivity counting on bottles was performed on a Tri-Card 3110TR Liquid Scintillation Counter (Perkin Elmer, Waltham, MA, United States). TTP was obtained by summing PPOC and PDOC, and PER was expressed by the ratio of PDOC to TTP (Fogg et al., 1965).
Bacterial abundance was estimated following the acridine orange direct count method (Hobbie et al., 1977). Samples were collected and added to 2% buffered formaldehyde for preservation. A definite amount of samples stained with Acridine Orange (final concentration of 0.01%), which was passed through a 0.2 μm black polycarbonate Nuclepore membrane filter and taken back to the laboratory for counting using an electron fluorescence microscope (Leica, Germany). BP was determined using the 3H- Leucine tracer method (Kirchman et al., 1993). The water sample was collected using a Niskin bottle (HYDRO-BIOS, Kiel, Germany) and 20 ml of water was added to each of the three 50 ml sterile culture tubes, with 1 ml of formaldehyde added to one tube as a control sample and 3H- Leucine added to the other two tubes to achieve a final concentration of 20 nmol/L in the sample. The samples were placed in a deck incubator and incubated in continuous surface seawater for 1–2 h before being terminated by the addition of 1 ml of formaldehyde and finally stored on carbon ice in the sample box. The water sample was filtered through a 25 mm × 0.2 μm microporous membrane and was washed with 3 ml of 5% ice bath trichloroacetic acid solution (TCA) and 80% ice bath ethanol. The filter membrane was removed and placed on absorbent paper, and the ethanol was stored in a scintillation bottle at low temperature after complete evaporation. The membranes were completely dissolved by adding 0.5 ml of ethyl acetate with a pipette gun, followed by adding 10 ml of PE ULTIMA Gold scintillation solution Perkin Elmer, and finally β-counted on a Tri-Card 3110TR liquid scintillation analyzer (Perkin Elmer, Waltham, MA, United States). The bacterial productivity was calculated according to Kirchman et al.’s (1993) equation. To estimate the bacterial respiration (BR), samples were filtered sequentially through 2 μm polycarbonate membrane filters (Millipore, Billerica, MA, United States). Filtrates were collected in six 100 ml borosilicate glass bottles, in which water was allowed to overflow during the filling, with care taken to prevent bubble formation in the silicone tube. Triplicates of the time zero control samples were immediately fixed with Winkler’s reagents (Carritt and Carpenter, 1966). Another set of samples (in triplicates) was placed underwater in darkened, temperature-controlled incubators for 24 h (“dark”) before they were fixed as described for the “zero” bottles above. BR was measured by the change in DO concentrations between before and after incubation. The metabolic rates measured using changes in DO concentrations were converted to carbon respired, assuming a respiratory quotient (RQ) of 1 (Biddanda et al., 1994). Bacterial carbon demand (BCD) was calculated as the sum of BR and BP (López-Sandoval et al., 2011). Bacterial growth efficiency (BGE) is a key factor in determining whether sufficient DOC is released from phytoplankton to support bacterial growth. Thus, the percentage of BGE was calculated as the slope of BP versus the sum of bacterial production and BR (Robinson, 2008).
For phytoplankton quantitative analysis, the settlement method described by Sukhanova (1978) was adopted. A total of 1 L of seawater sample at the surface and bottom was collected respectively, then fixed using phosphate-buffered formalin (final concentration 3%) and stored at 4°C in the dark until further analysis in the laboratory. Furthermore, 10 or 25 ml of each sample was placed in a settling chamber for 24 h then examined using a inverted microscope (Carl Zeiss, Oberkochen, Germany) under the 100X or 200X magnification (Edler and Elbrächter, 2010). Microscopic phytoplankton of >5 μm cell size could be examined. Individual cells were counted regardless of whether they were solitary or in a chain/colony. Phytoplankton was identified to the level of genus or species whenever possible following Hasle et al. (1996), Tomas (1997), and Horner (2002).
In this experiment, Skeletonema costatum and Chaetoceros curvisetus were selected as indicator species of the study on the relationship between PDOC and environmental factors. These two diatoms were chosen because they are the most dominant species within Qinzhou Bay in the NE monsoon and SW monsoon (Figure 2). A total of 43 bottles from each season were kept in five batches of f/2 medium (Guillard and Ryther, 1962), 9 of which were used for temperature, 10 for salinity, 10 for light, 8 for nutrient, and 6 for size-fractionated phytoplankton experiments. Then, 370 kBq of NaH14CO3 tracer was added to each sample before the experiment. Three replicates of each sample were filtered immediately after incubation, and membranes and filtrates were used to determine their PPOC and PDOC, according to the method described in section “Field Sampling and Measurement” of this manuscript. The gradient experimental procedures for the effect of each parameter on PDOC in independent batches of samples are detailed in “Lab Culture Experiments.” For environmental parameters, the general principle of mapping experiments is to ensure that the range of variation of each parameter in the experiment remains largely consistent with the variation of parameters in the field survey.
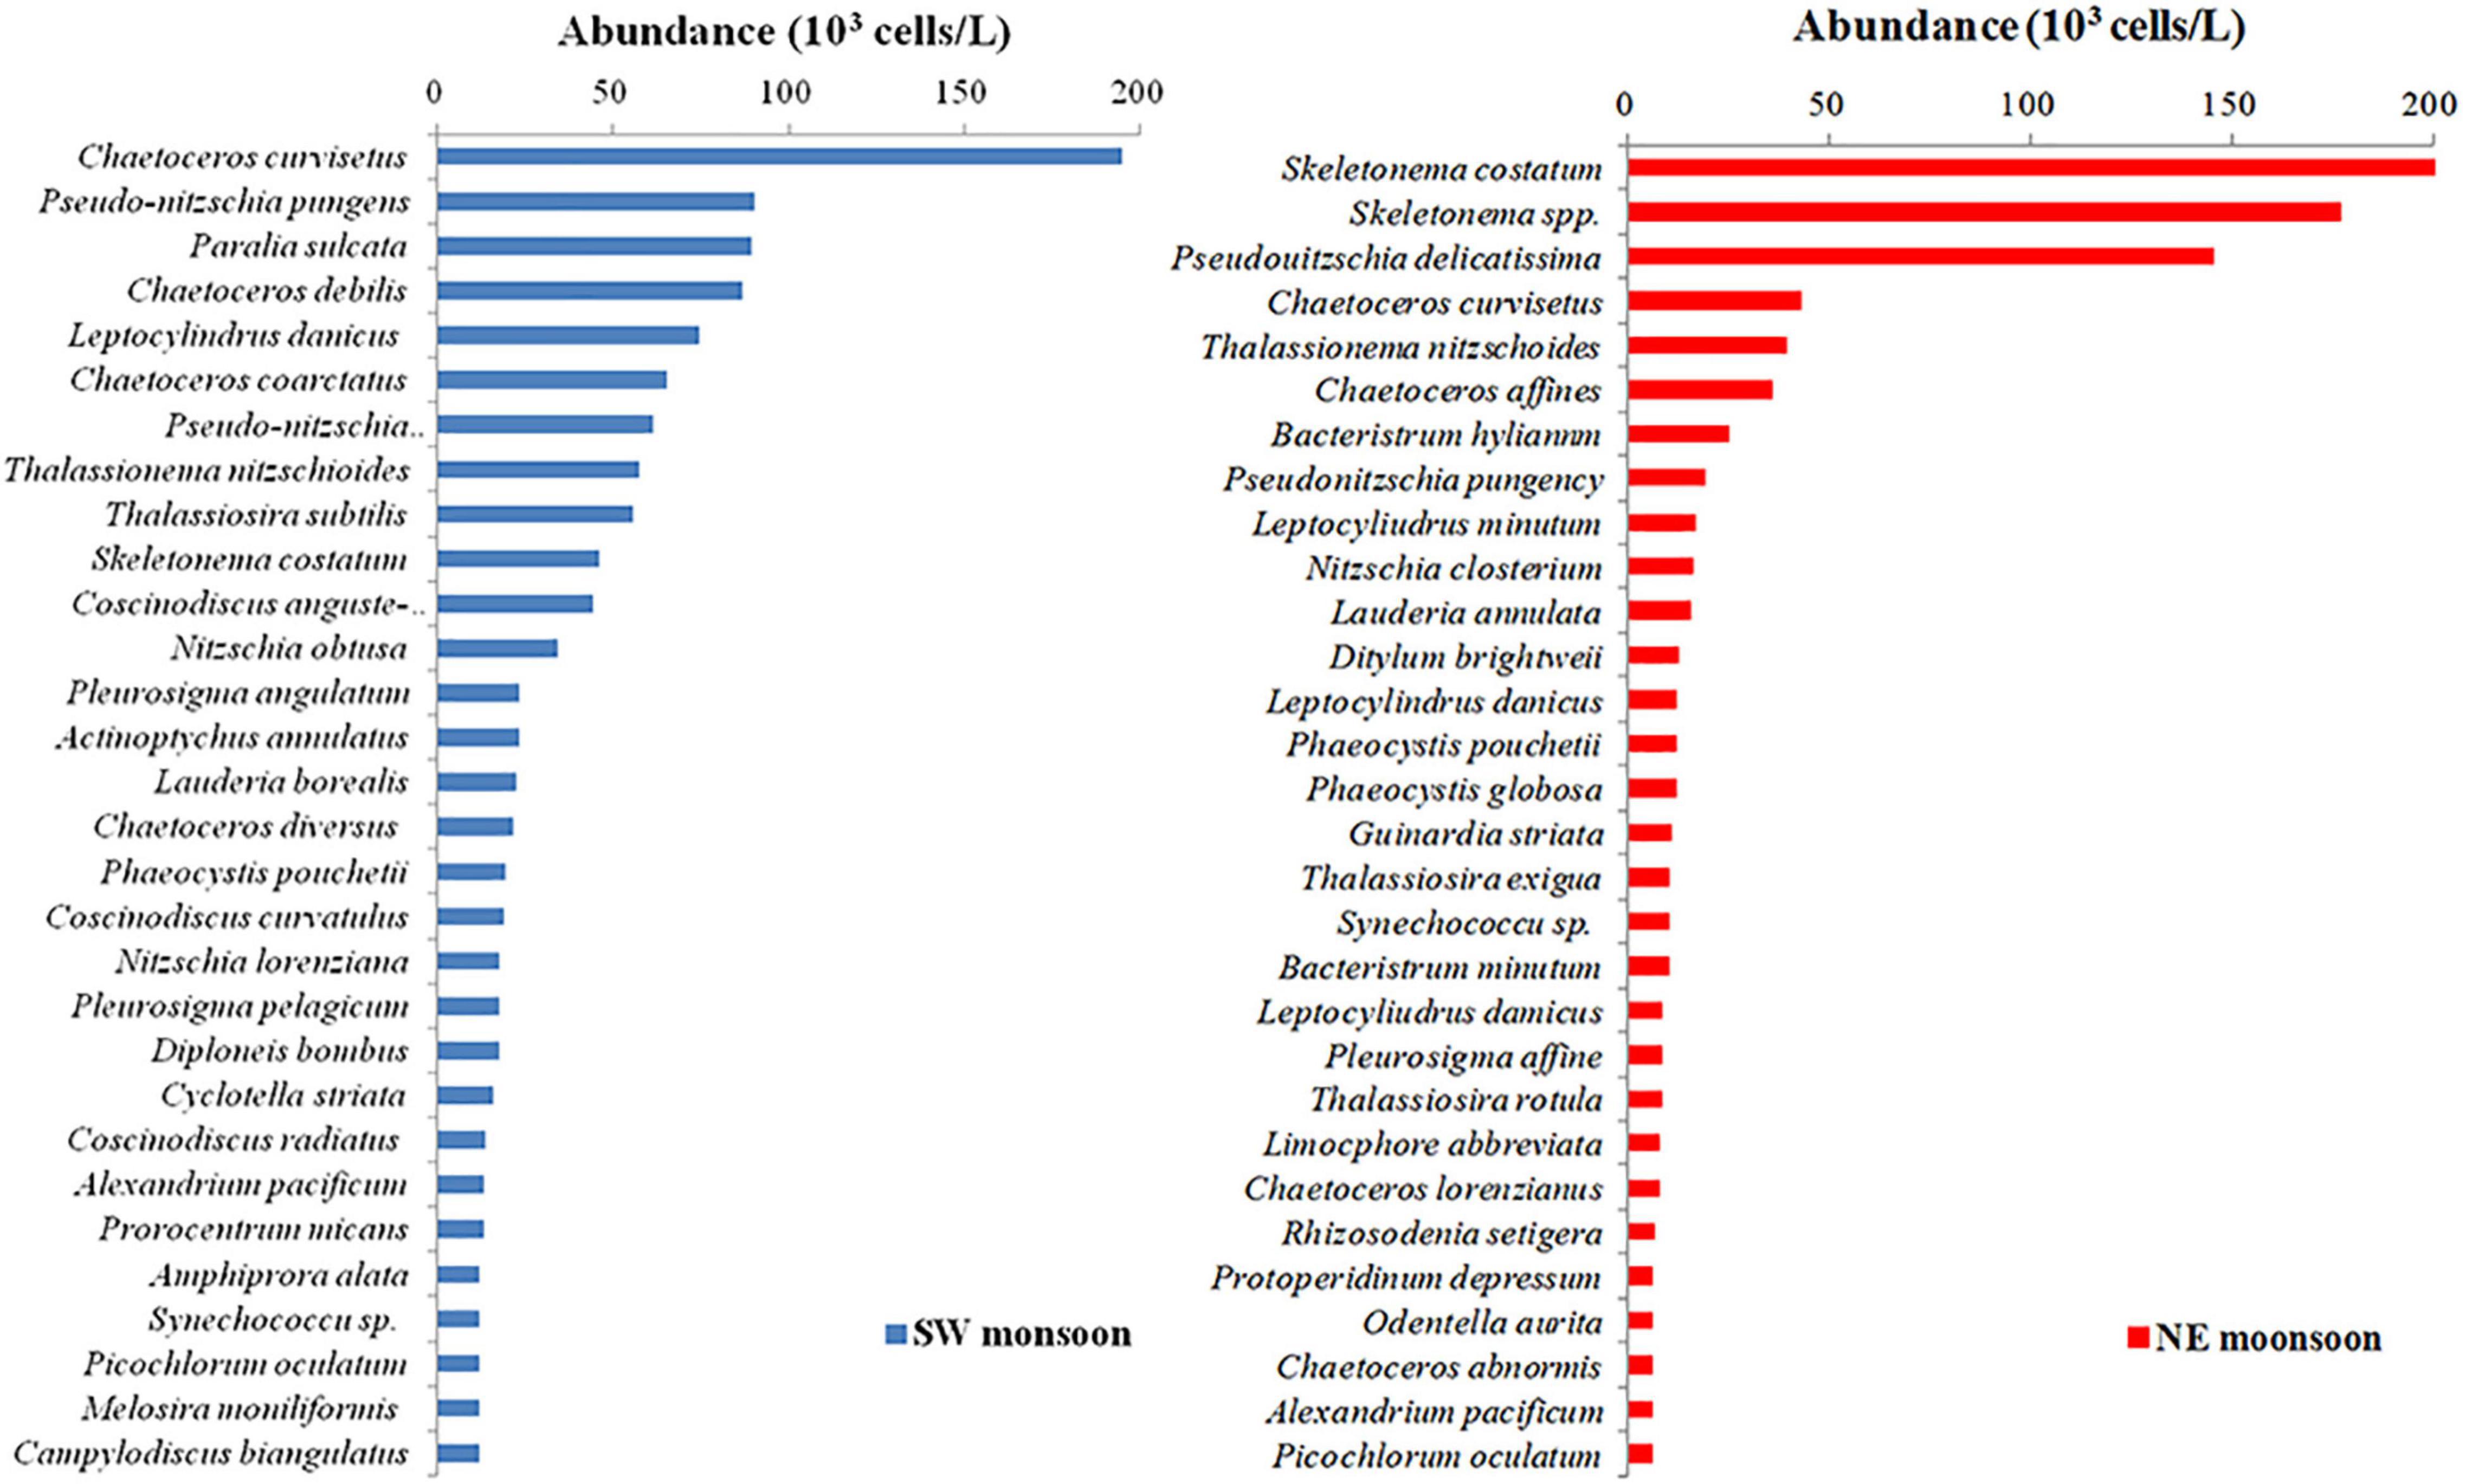
Figure 2. Top 30 ranking of phytoplankton abundance during southwest (SW) and northeast (NE) monsoon in Qinzhou Bay.
For the temperature experiments, nine culture samples from each batch culture (43 in total) were selected for temperature control experiments. The salinity (30) and irradiance (800 μmol/m2⋅s) were set consistently for each sample. The nine incubated samples were placed one by one in nine temperature-controlled incubators (GXZ380, China), which were set at 1°C intervals from 23 up to 31°C in sequence. The total time of the incubation was 24 h throughout the day (light:dark cycle of 12:12 h).
For the salinity control experiments, we adjusted the salinity of 10 samples selected from each batch culture by adding MilliQ ultrapure water (Millipore, Billerica, MA, United States) or NaCl, setting a salinity value every 2 intervals between 14 and 32 (the range of salinity variation in the sector of the dominant species in the field), thus creating 10 pre-experiments with different salinities. All samples with adjusted salinity were incubated together in an incubator (Memmert, Germany) at constant temperature (25°C) and irradiance (800 μmol/m2⋅s) for 24 h (12 h light and 12 h dark).
For the light control experiments, 10 light intensities were set within the irradiance range of 50–1,750 μmol/m2⋅s (50–200 μmol/m2⋅s at 50 μmol/m2⋅s intervals and 500–1,750 μmol/m2⋅s at 250 μmol/m2⋅s intervals) using the incubators (GXZ380, China). The incubated samples were placed in the incubators in order of irradiance from low to high and incubated for 24 h (12 h light and 12 h dark) under steady conditions of temperature 25°C and salinity 30.
For the nutrient stoichiometry experiments, a total of 8 phytoplankton cultures were prepared with varying DIN:DIP ratios (16, 32, 48, 64, 96, 128, 160, and 192) (Table 1). The cultures were grown at 25°C in flasks containing media and kept in the incubator at a light:dark cycle of 12:12 h (Memmert, Germany). For illumination, white cool light with a PAR of 800 μmol/m2⋅s was used.
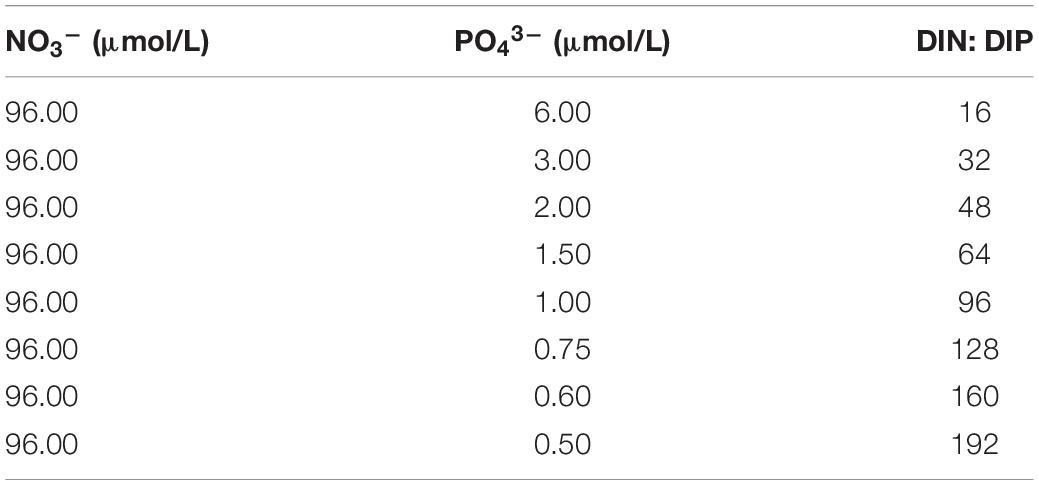
Table 1. Initial nutrient concentrations in the different size-fractionated phytoplankton cultures used for the experiments.
For the size-fractionated phytoplankton experiments, six phytoplankton (Alexandrium pacificum 35∼45 μm, C. curvisetus 25∼35 μm, S. costatum 15–25 μm, Phaeocystis pouchetii 5–15 μm, Synechococcus sp. 1.5–5 μm, and Picochlorum oculatum 1–2 μm) were selected to assess the effect of different species on PDOC due to their high-ranking abundance in their phylum (Figure 2) and significant differences in cell size. To inoculate the experimental cultures, cells from cultures grown in the corresponding medium were taken in the exponential growth phase (Myklestad, 1977) and re-inoculated together with 10 ml of 0.8 μm filtered natural bacterial consortia collected from the Qinzhou Bay. All media were in artificial seawater (Parsons et al., 1984). When the cultured algae were grown in the exponential phase, 370 kBq of NaH14CO3 tracer was added separately. The incubator (Memmert, Germany) was subjected to uniform condition settings. The standard for this experiment was a temperature of 25°C, a salinity of 30, and a light of 1,000 μmol/m2⋅s for 24 h (12 h light and 12 h dark).
Statistical analysis of the environmental parameters among the stations along with the seasonal and spatial variations was conducted by the method of two-way ANOVA (Table 2). To determine the interrelationship between PER and environmental parameters (biological and non-biological) (Tables 3, 4), Pearson correlation coefficients were derived. The log-log regression analysis (ordinary least square [OLS]) and reduced major axis analysis (RMA) were performed on PPOC and PDOC in order to attain normality and homoscedasticity (Baines and Pace, 1991; Kanuri et al., 2013). Stepwise multiple regression analysis was performed to reveal the relative importance of different parameters over the PER, by considering PER being the dependent variable and geochemical parameters the independent variable. All the above statistical analyses were carried out by using the statistical software SPSS 17 (IBM, Armonk, NY, United States).
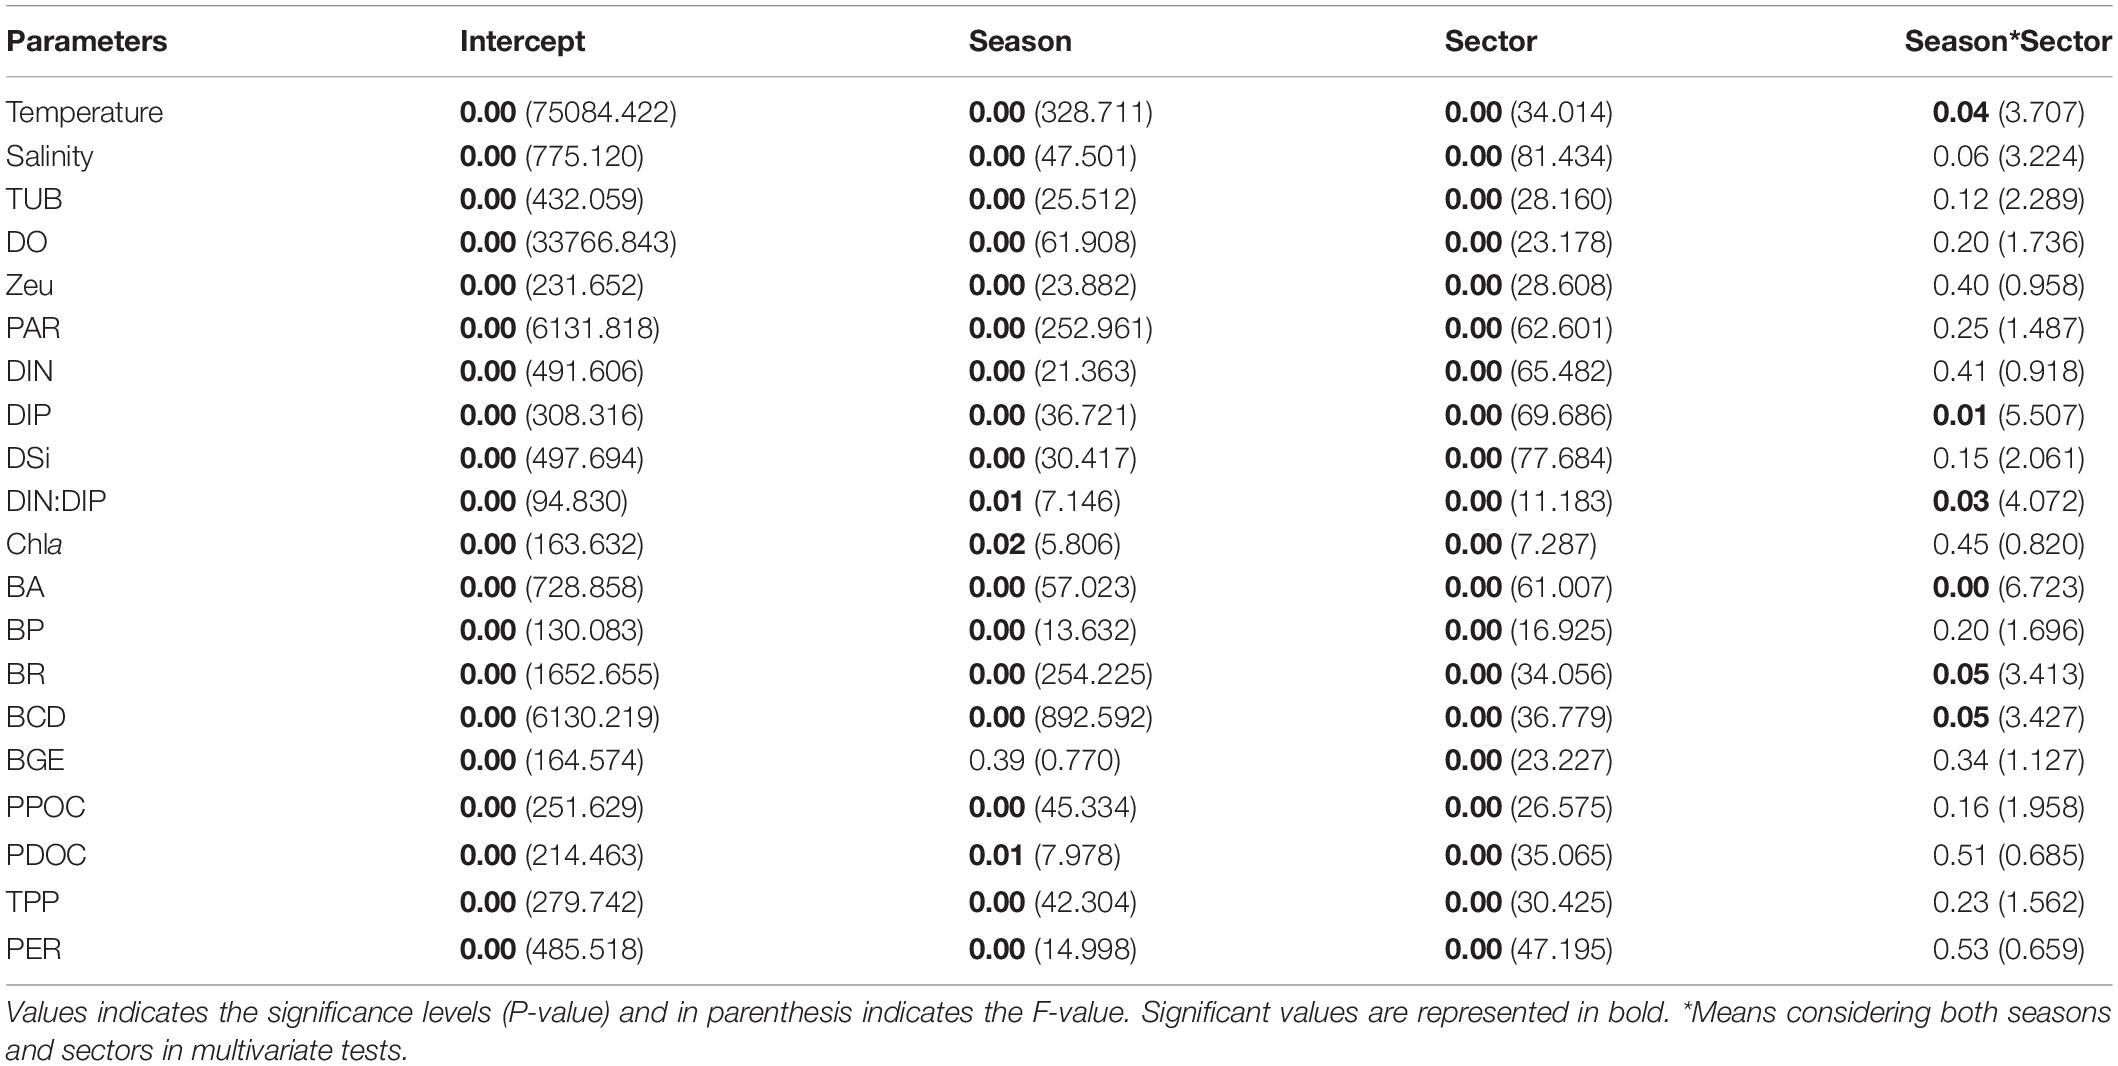
Table 2. Two-way ANOVA and F-test for selected specific biogeochemical parameters.
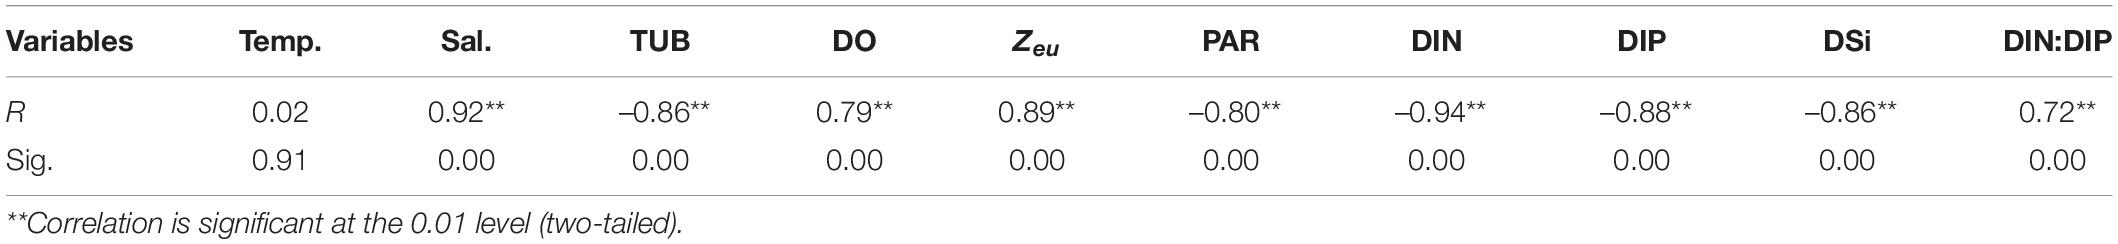
Table 3. Pearson correlation between PER and environmental variables.
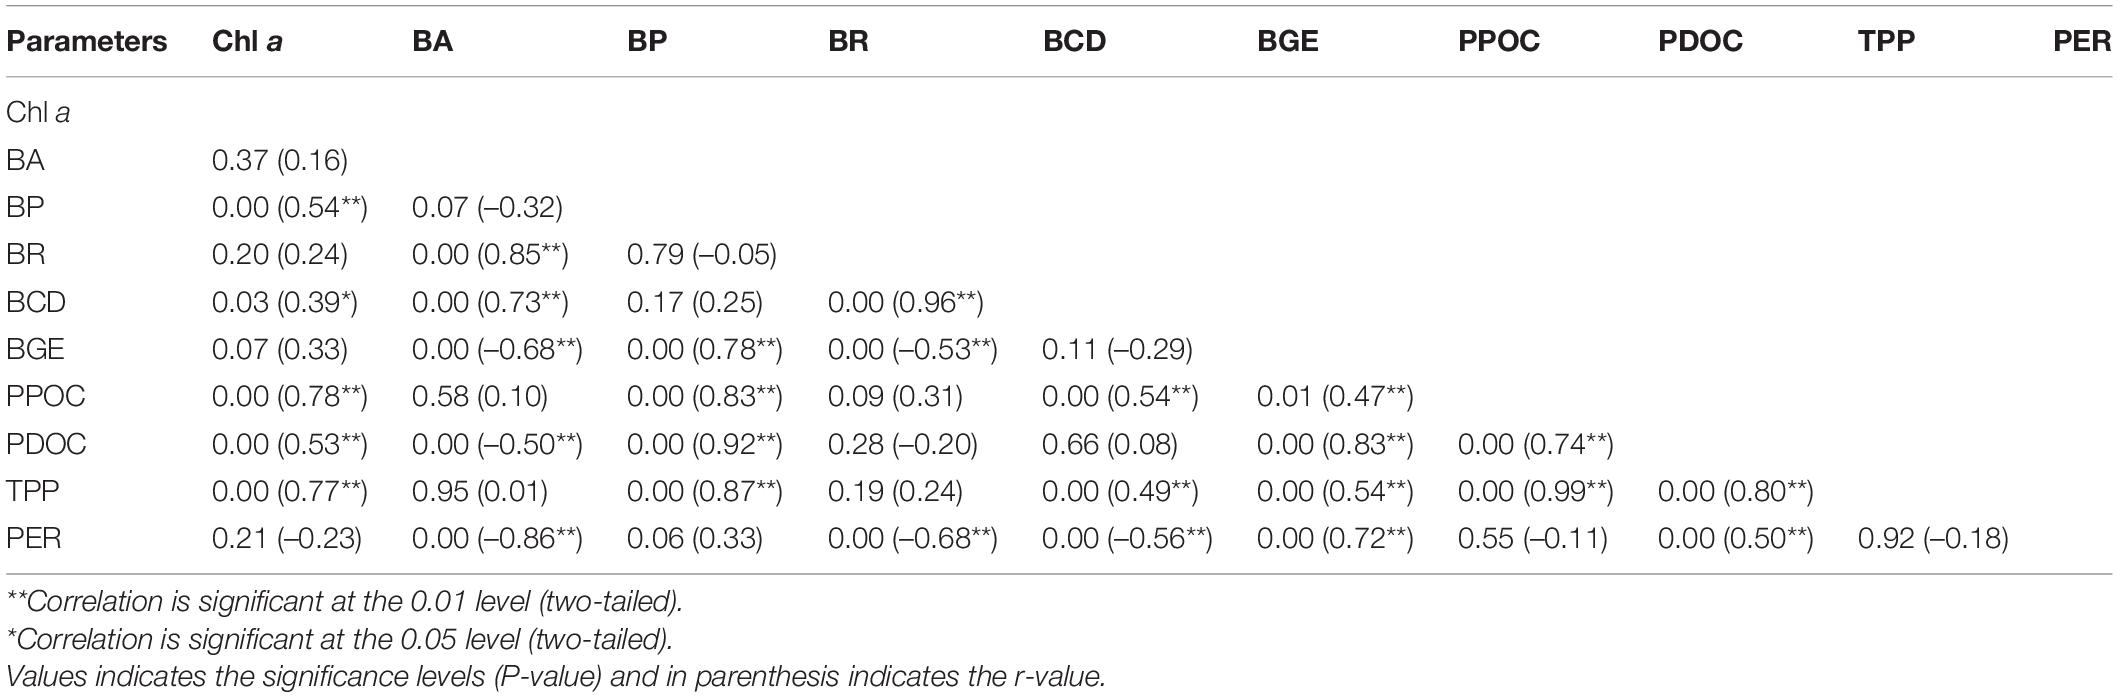
Table 4. Pearson correlation coefficients between biological and non-biological parameters.
The integral mean value within the Zeu of biogeochemical parameters during SW and NE monsoon in the Qinzhou Bay is presented in Figure 3. A two-way ANOVA test was performed considering the season and sector as independent factors, and the biogeochemical parameters (temperature, salinity, Zeu, DO, DIN, DIP, DSi, DIN:DIP, Chl a, PPOC, PDOC, TPP, BR, BP, BA, BCD, and BGE) as dependent factors. The results showed significant spatial and temporal variability in all parameters within the monitored area (All p < 0.05, Table 2).
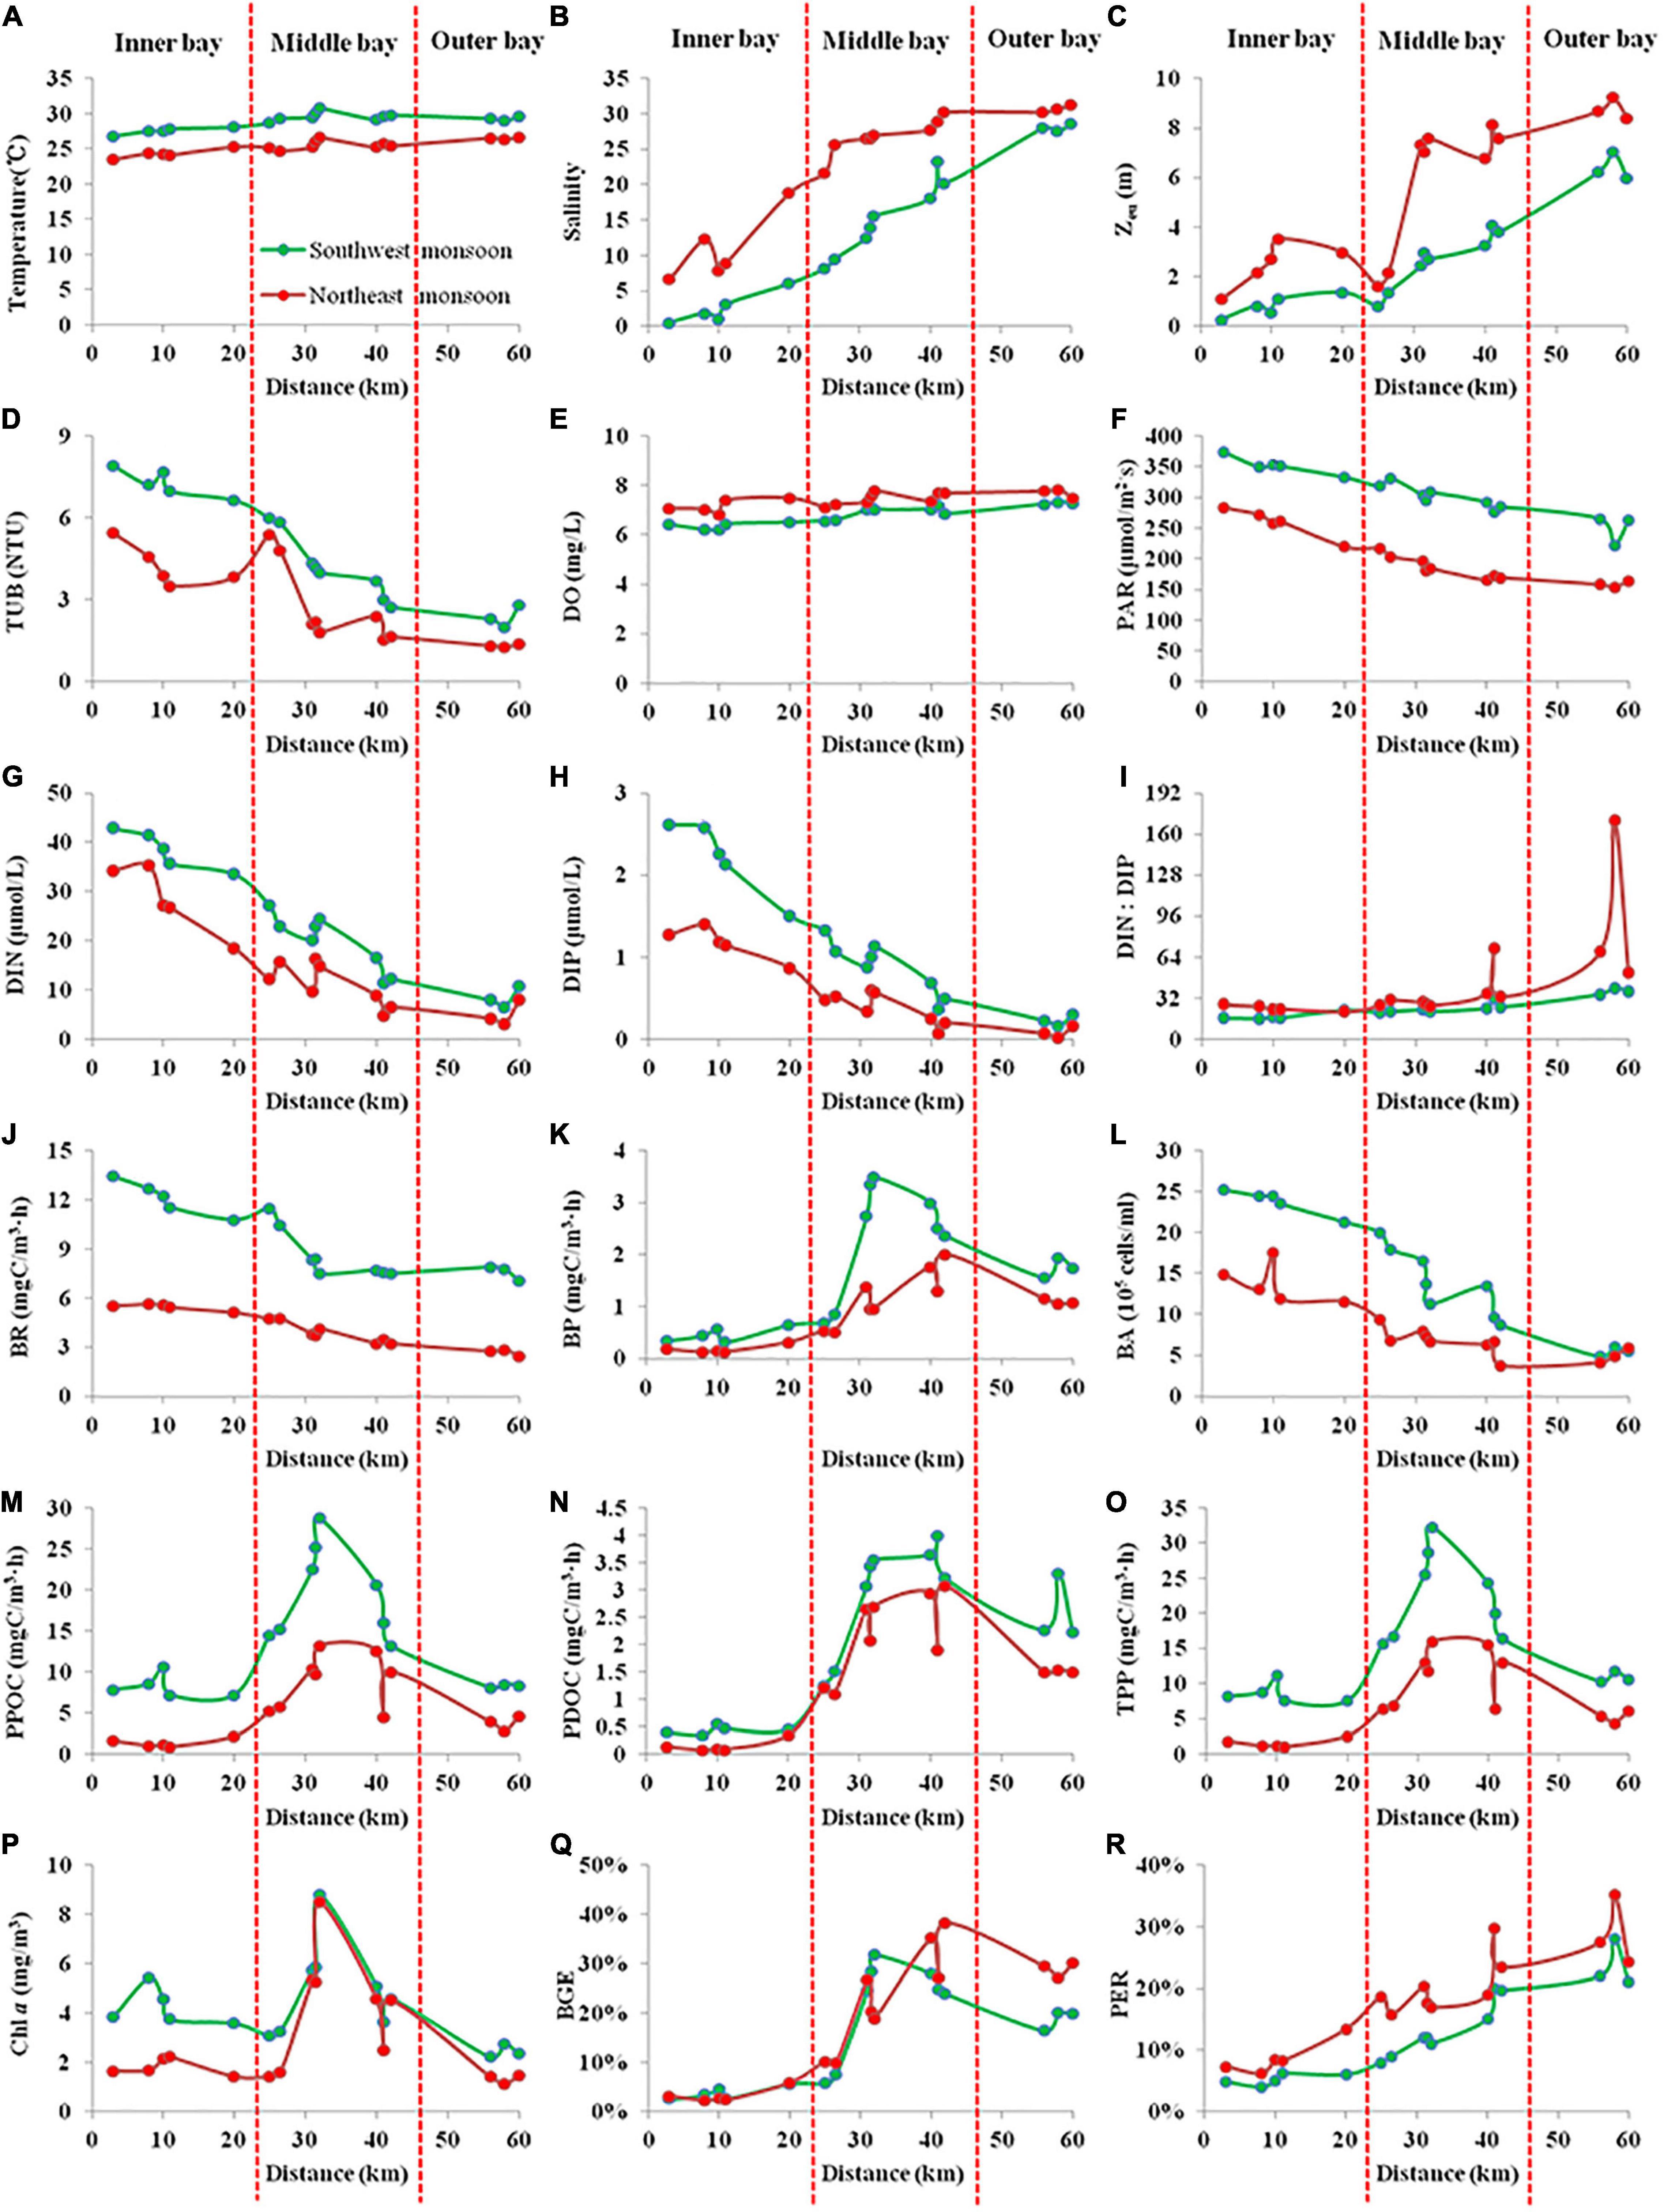
Figure 3. The integral mean value within the euphotic depth (Zeu) of biogeochemical parameters [(A) Temperature, (B) Salinity, (C) Zeu, (D) TUB, (E) DO, (F) PAR, (G) DIN, (H) DIP, (I) DIN:DIP, (J) BR, (K) BP, (L) BA, (M) PPOC, (N) PDOC, (O) TPP, (P) Chl a, (Q) BGE, and (R) PER] during SW and NE monsoon in the Qinzhou Bay (The X-axis refers to the distance of the site from the mouth of the western branch of Qinjiang river).
The mean bay temperature during SW monsoon (28.96 ± 1.08°C) remained relatively higher compared to the NE monsoon (25.32 ± 0.96°C). The seasonal salinity fluctuation was in accordance with the Qin river discharge with a fairly low salinity level in the SW monsoon (13.61 ± 9.9) followed by a dramatic increase to 22.57 ± 8.82 during the NE monsoon. The effect of freshwater laden with particulate matters was represented by a sharp increase in the Zeu from SW monsoon (2.79 ± 2.15 m) to NE monsoon (5.44 ± 2.94 m). Variation in Zeu was associated with the distribution of TUB (r = –0.932, p < 0.01) in the bay with lower values observed during the northeast monsoon (2.95 ± 1.52 NTU) compared to SW monsoon (4.84 ± 2.05 NTU). With inputs from huge river runoff, both DIN and DIP showed an increase in their concentrations during June (SW monsoon) and their respective mean concentration were 23.39 ± 12.18 and 1.17 ± 0.84 μmol/L, respectively. As river runoff decreased and seawater intruded inwards, the concentrations of these two nutrients decreased to 15.32 ± 10.48 and 0.57 ± 0.47 μmol/L, respectively, during November (NE monsoon). Although in SW monsoon the DIN:DIP ratio (24.45 ± 0.84) was found to be lower than those of the NE monsoon (42.94 ± 37.24), overall, the bay showed a limitation of DIP in respect to the redfield ratio. Between the two seasons, relatively lower DO values were recorded in SW monsoon (6.82 ± 0.39 mg/L) compared to NE monsoon (7.43 ± 0.3 mg/L), and neither season exhibited anoxic conditions. PAR (203.99 ± 43.33 μmol/m2⋅s) during the NE monsoon was only 2/3 of that during the SW monsoon. The mean values for all seven biological parameters (Chl a, BR, BP, BA, PPOC, PDOC, and TPP) during the SW monsoon (4.29 ± 1.66 mg/m3, 9.53 ± 2.2 mgC/m3⋅h, 1.66 ± 1.13 mgC/m3⋅h, [15.45 ± 7.26] × 105 cells/ml, 13.91 ± 7.02 mgC/m3⋅h, 2.11 ± 1.38 mgC/m3⋅h, 16.02 ± 8 mgC/m3⋅h) were significantly higher than those during the NE monsoon (2.93 ± 2.1 mg/m3, 4.16 ± 1.12 mgC/m3⋅h, 0.85 ± 0.6 mgC/m3⋅h, [8.69 ± 4.01] × 105 cells/ml, 5.62 ± 4.23 mgC/m3⋅h, 1.43 ± 1.07 mgC/m3⋅h, 7.05 ± 5.23 mgC/m3⋅h), with the largest difference being in PPOC (2.5 times) and the smallest difference being in Chl a and PDOC (both 1.5 times) between the early and late periods. On the other hand, BGE was not strongly influenced by seasonal variation (Table 2, p > 0.05), being only slightly higher in the NE monsoon (18 ± 13%) than in the SW monsoon (16 ± 11%), whereas significant seasonal differences were observed in PER (Table 2, p < 0.01), with the SW monsoon (13 ± 7%) being about 2/3 (18 ± 8%) of the NE monsoon.
The statistical results have clearly shown that the bays differ significantly both seasonally and regionally (Table 2). In the inner bay during NE monsoon, the characteristics of salinity and nutrients showed low saline level (10.89 ± 4.9), high DIN and DIP level (28.36 ± 6.18 and 1.17 ± 0.2 μmol/L respectively), a DIN:DIP (24:1) above the redfield value (16:1), indicating the importance of freshwater supply through rivers. On the other hand, salinity, DIN, and DIP in other regions in the bay ranged between 21.7–31.3, 3.02–16.34, and 0.02–0.6 μmol/L, respectively. However, drastic changes ensued during the SW monsoon when freshwater conditions have prevailed in the inner bay and its effect extended up to the middle sector (salinity = 15.16 ± 5.21, DIN:DIP = 17). Simultaneously, the outer bay continued to remain relatively saline (28.03 ± 0.55) with a marginal difference from NE monsoon salinity (30.78 ± 0.52). Exceptional low Zeu (0.8 m) was recorded in the inner bay during SW monsoon when the freshwater input was maximum. Mean DIN and DIP concentration during SW monsoon in the bay was found to be increased by 53 and 105%, respectively, compared to NE monsoon, as well as with a mean DIN:DIP ratio of 24.45 ± 7.53. During the two seasons, heavy suspended loads brought by rivers resulted in brown turbid waters in the inner stations, whereas the middle and outer stations were relatively free from such effects and displayed deeper Zeu, lower level of nutrients with significant DIP limitation.
Bacterial abundance presented spatial and temporal variability ranging from 3.75 to 25.23 × 10⁵ cells/ml with higher values obtained during SW monsoon. Irrespective of seasons, BP, BR, and BCD recorded the highest levels in the middle sector followed by the outer sector and the lowest in the inner sector. BGE varied between 2.25 and 38.31% during both seasons, with the small average in the inner bay (3.75%), followed by the middle bay (22.61%), and the greatest value in the outer bay (23.89%). TPP in the bay during both SW and NE monsoon followed the similar spatial pattern of BP with the highest values recorded at the middle bay (19.52 ± 5.67 and 8.94 ± 3.35 mgC/m3⋅h, respectively) followed by the outer bay (8.32 ± 0.23 and 3.81 ± 0.92 mgC/m3⋅h, respectively), and inner bay (8.27 ± 1.42 and 1.4 ± 0.53 mgC/m3⋅h, respectively). Spatial and temporal changes in PDOC rates closely resembled the distribution of TPP (Figures 3M,O) in the bay. The highest PDOC production (4 mgC/m3⋅h) was recorded during the SW monsoon at station 11 (middle bay), whereas the lowest (0.07 mgC/m3⋅h) was recorded in NE monsoon at station 3 (inner sector). Sector variation in PER was observed during two seasons. During the SW and NE monsoons, the highest TPP was recorded in the middle bay with 22.49 ± 6.21 and 11.14 ± 4.01 mgC/m3⋅h, respectively, following an average PER of 13 ± 5% and 20 ± 5%. The second-highest TPP occurred in the outer sector with an average of 10.93 ± 0.79 and 5.32 ± 0.89 mgC/m3⋅h, respectively, while the PER was highest with 24 ± 4% and 29 ± 6% in this sector, respectively. The lowest TPP was observed in the inner bay with 8.72 ± 1.46 and 1.54 ± 0.63 mgC/m3⋅h, and carrying PERs of only 5 ± 1% and 9 ± 3%, respectively.
Percentage of extracellular release has been recognized as an important indicator representing the proportion of PDOC to TPP (Nagata, 2000), thus the relationship between PDOC and TPP could be studied to assess the magnitude of PER values besides making correlation analysis (Teira et al., 2001).
Spatial and temporal changes in PDOC resembled the distribution of PPOC and TPP (Figures 3M–O). To examine the relation between TPP and PER, a Log PDOC vs. Log PPOC was plotted for both seasons. The slope for SW monsoon season was not significantly different from 1 (Clarke’s T-test, n = 16, p = 0.337 > 0.05) (Figure 4A). Whereas, the slope of the linear regression was significant at > 1 (Clarke’s T-test, n = 16, p = 0.003 < 0.01) during the NE monsoon season (Figure 4A). As far as temporal (two seasons) variability is concerned, no clear relationship between PER and TPP was observed. This is evidenced from the fact that the slopes (1.07) of the linear regression between the logarithms of integrated PPOC and PDOC production (Clarke’s T-test, n = 32, p = 0.464 > 0.05, Figure 4A) did not vary significantly from 1, which is consistent with the study of Teira et al. (2003) and Marañón et al. (2005) in the Celtic Sea (slope = 0.96) and North Atlantic (slope = 0.91) respectively.
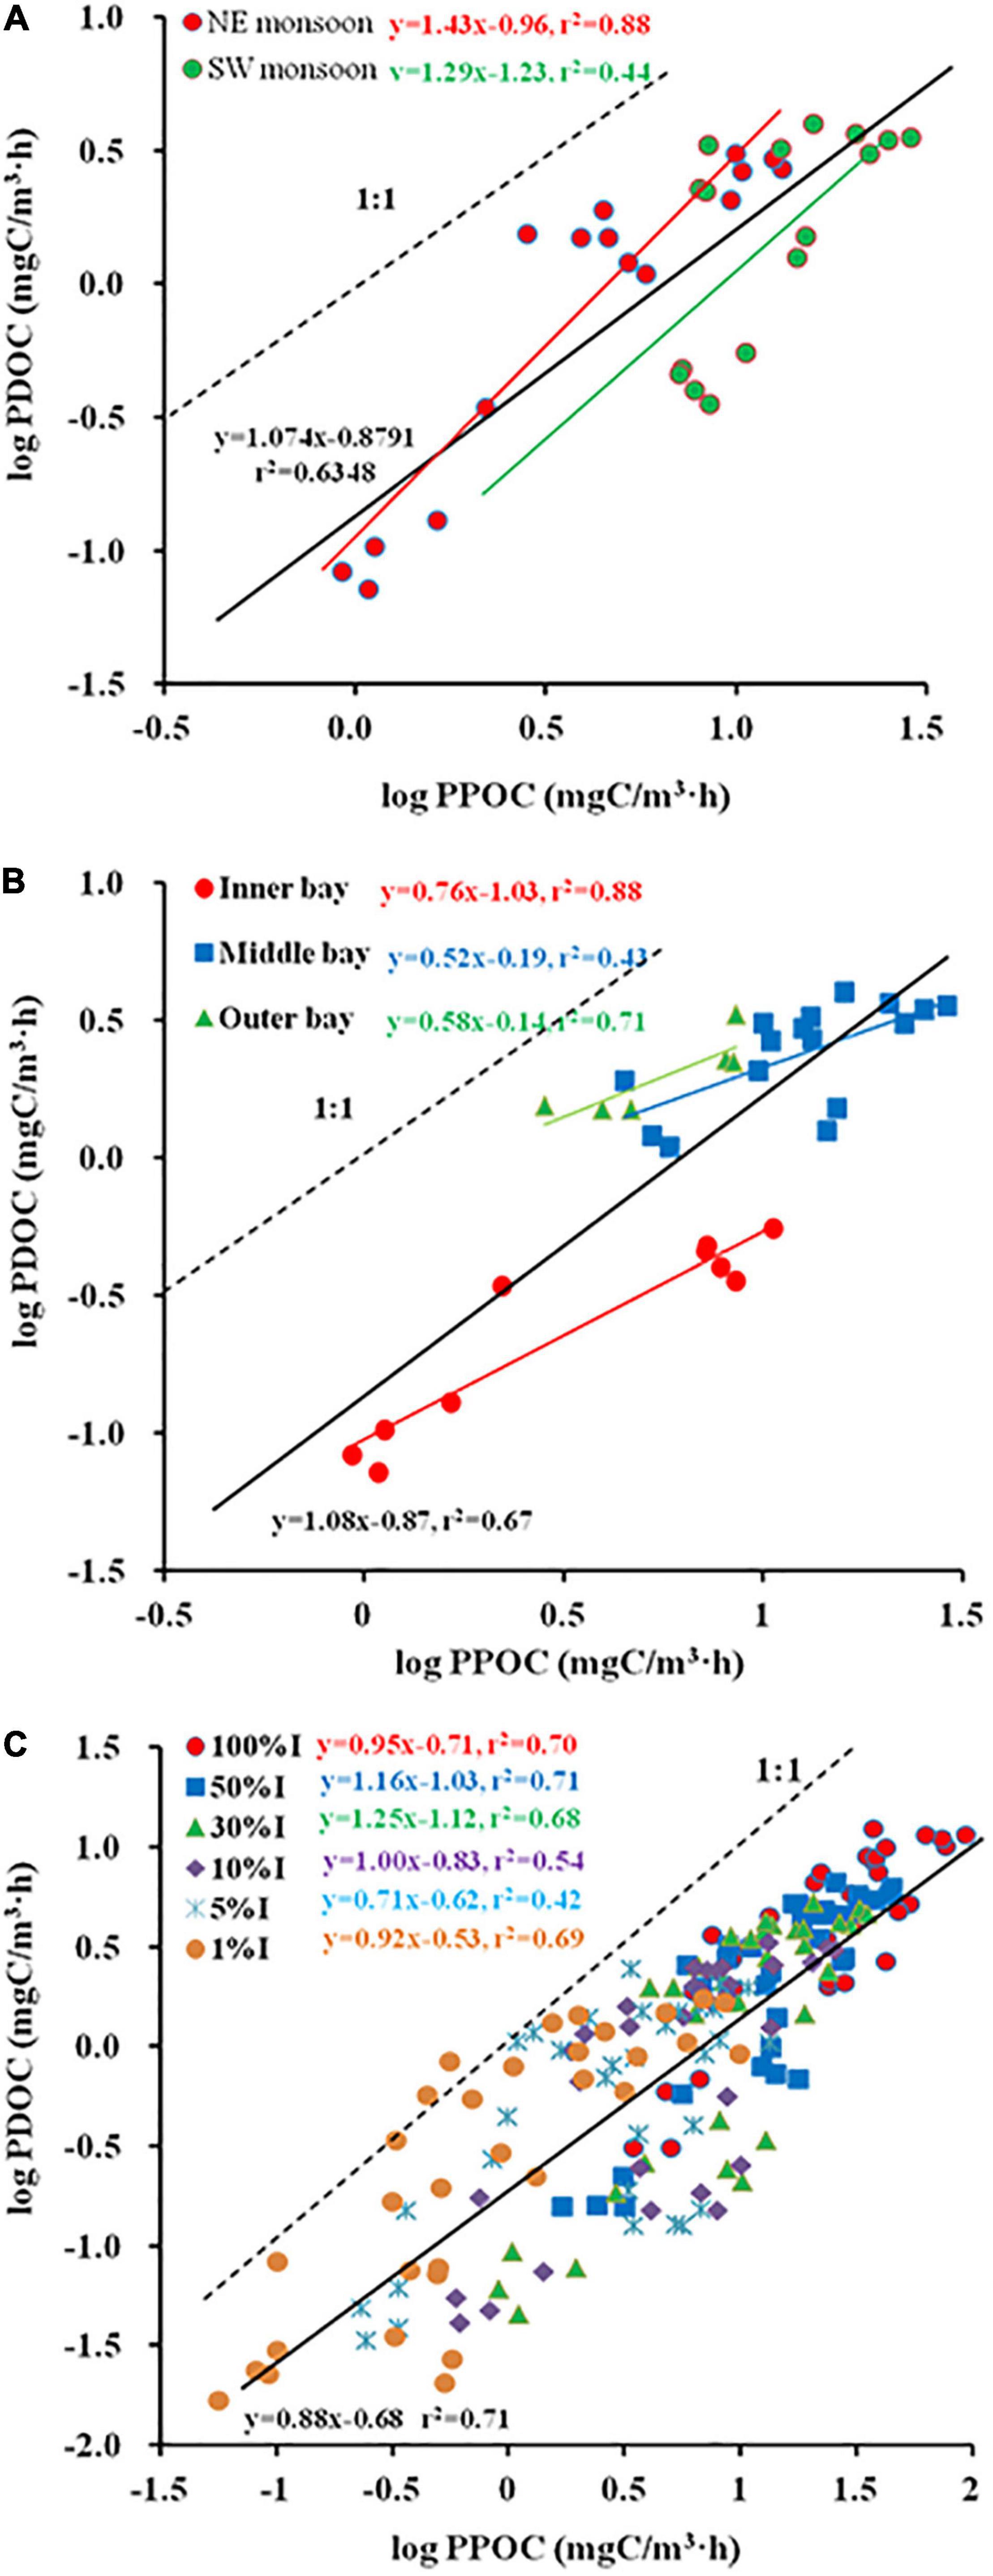
Figure 4. Regression plots of Log (particulate organic carbon (PPOC)) vs. Log (photosynthetic dissolved organic carbon (PDOC)) [(A) season, (B) sector, (C) Zeu].
As far as temporal (horizontal and vertical) variability is concerned, significant differences in slope are shown among the inner, middle, and outer bays. The slope for inner sector was not significantly different from 1 (Clarke’s T-test, n = 10, p = 0.072 > 0.05) (Figure 4B). Whereas, the slope of the linear regression was > 1 both in the middle (Clarke’s T-test, n = 16, p = 0.001 < 0.01) and the outer sectors (Clarke’s T-test, n = 6, p = 0.026 < 0.05) (Figure 4B). When considering the use of all determinations of volumetric POC and DOC production rates, the correlation was found to increase between the logarithms of the two variables (r2 = 0.71, Figure 4C), while the slope of the regression line was < 1 (Clarke’s T-test, n = 192, p = 0.001 < 0.01), implying that the PER was inversely proportional to TPP. When calculated separately for each light intensity depth (100, 50, 30, 10, 5, and 1%I; I refers to surface irradiance), the regression coefficients were all high (r2 varied from 0.42 to 0.71), with the slopes of the linear regressions for the 100%I (Clarke’s T-test, n = 32, p = 0.596 > 0.05), 10%I (Clarke’s T-test, n = 32, p = 0.996 > 0.05), and 1%I (Clarke’s T-test, n = 32, p = 0.369 > 0.05) light intensity depths not significantly different from 1 (0.95, 1, and 0.92), indicating that the PER is relatively constant across the whole range of measured POC production. While at other light intensity depths, i.e., 50%I (Clarke’s T-test, n = 32, p = 0 < 0.01), 30%I (Clarke’s T-test, n = 32, p = 0.042 < 0.05), 5%I (Clarke’s T-test, n = 32, p = 0.023 < 0.05), the slope of linear regression was significantly different from 1 (1.16, 1.25, and 0.71), implying that PER tends to rise or fall with increased TPP.
The ratio of PDOC:BCD was used to assess the quantitative importance of PDOC as a source of carbon for HB. During the two seasons, PDOC:BCD ranged from 0.01 to 0.59, with a mean value of 0.25 (n = 32). A high positive correlation was observed between PDOC:BCD and distance down the estuary (r = 0.725, p < 0.01), with an increasing trend of PDOC:BCD from the inner bay (0.03 ± 0.02) to the outer bay (0.34 ± 0.08) (Figure 5A). The mean PDOC:BCD was lower (0.2 ± 0.14) during the SW monsoon and increased to (0.3 ± 0.22) by about 50% during the NE monsoon. Regionally, the PDOC:BCD was seven times higher in the outer bay (0.28 ± 0.05) than in the inner bay (0.04 ± 0.01) during the SW monsoon, and this multiplier increased to over 13 times during the NE monsoon. These results suggested that HB relies significantly more on PDOC demand in the outer bay than that in the inner bay. No-linear relationship between PDOC and BCD (Figure 5B, r = 0.07, p > 0.05) indicated that PDOC could not completely control the growth of HB, which relies on extracellular release from phytoplankton as well as other important sources.
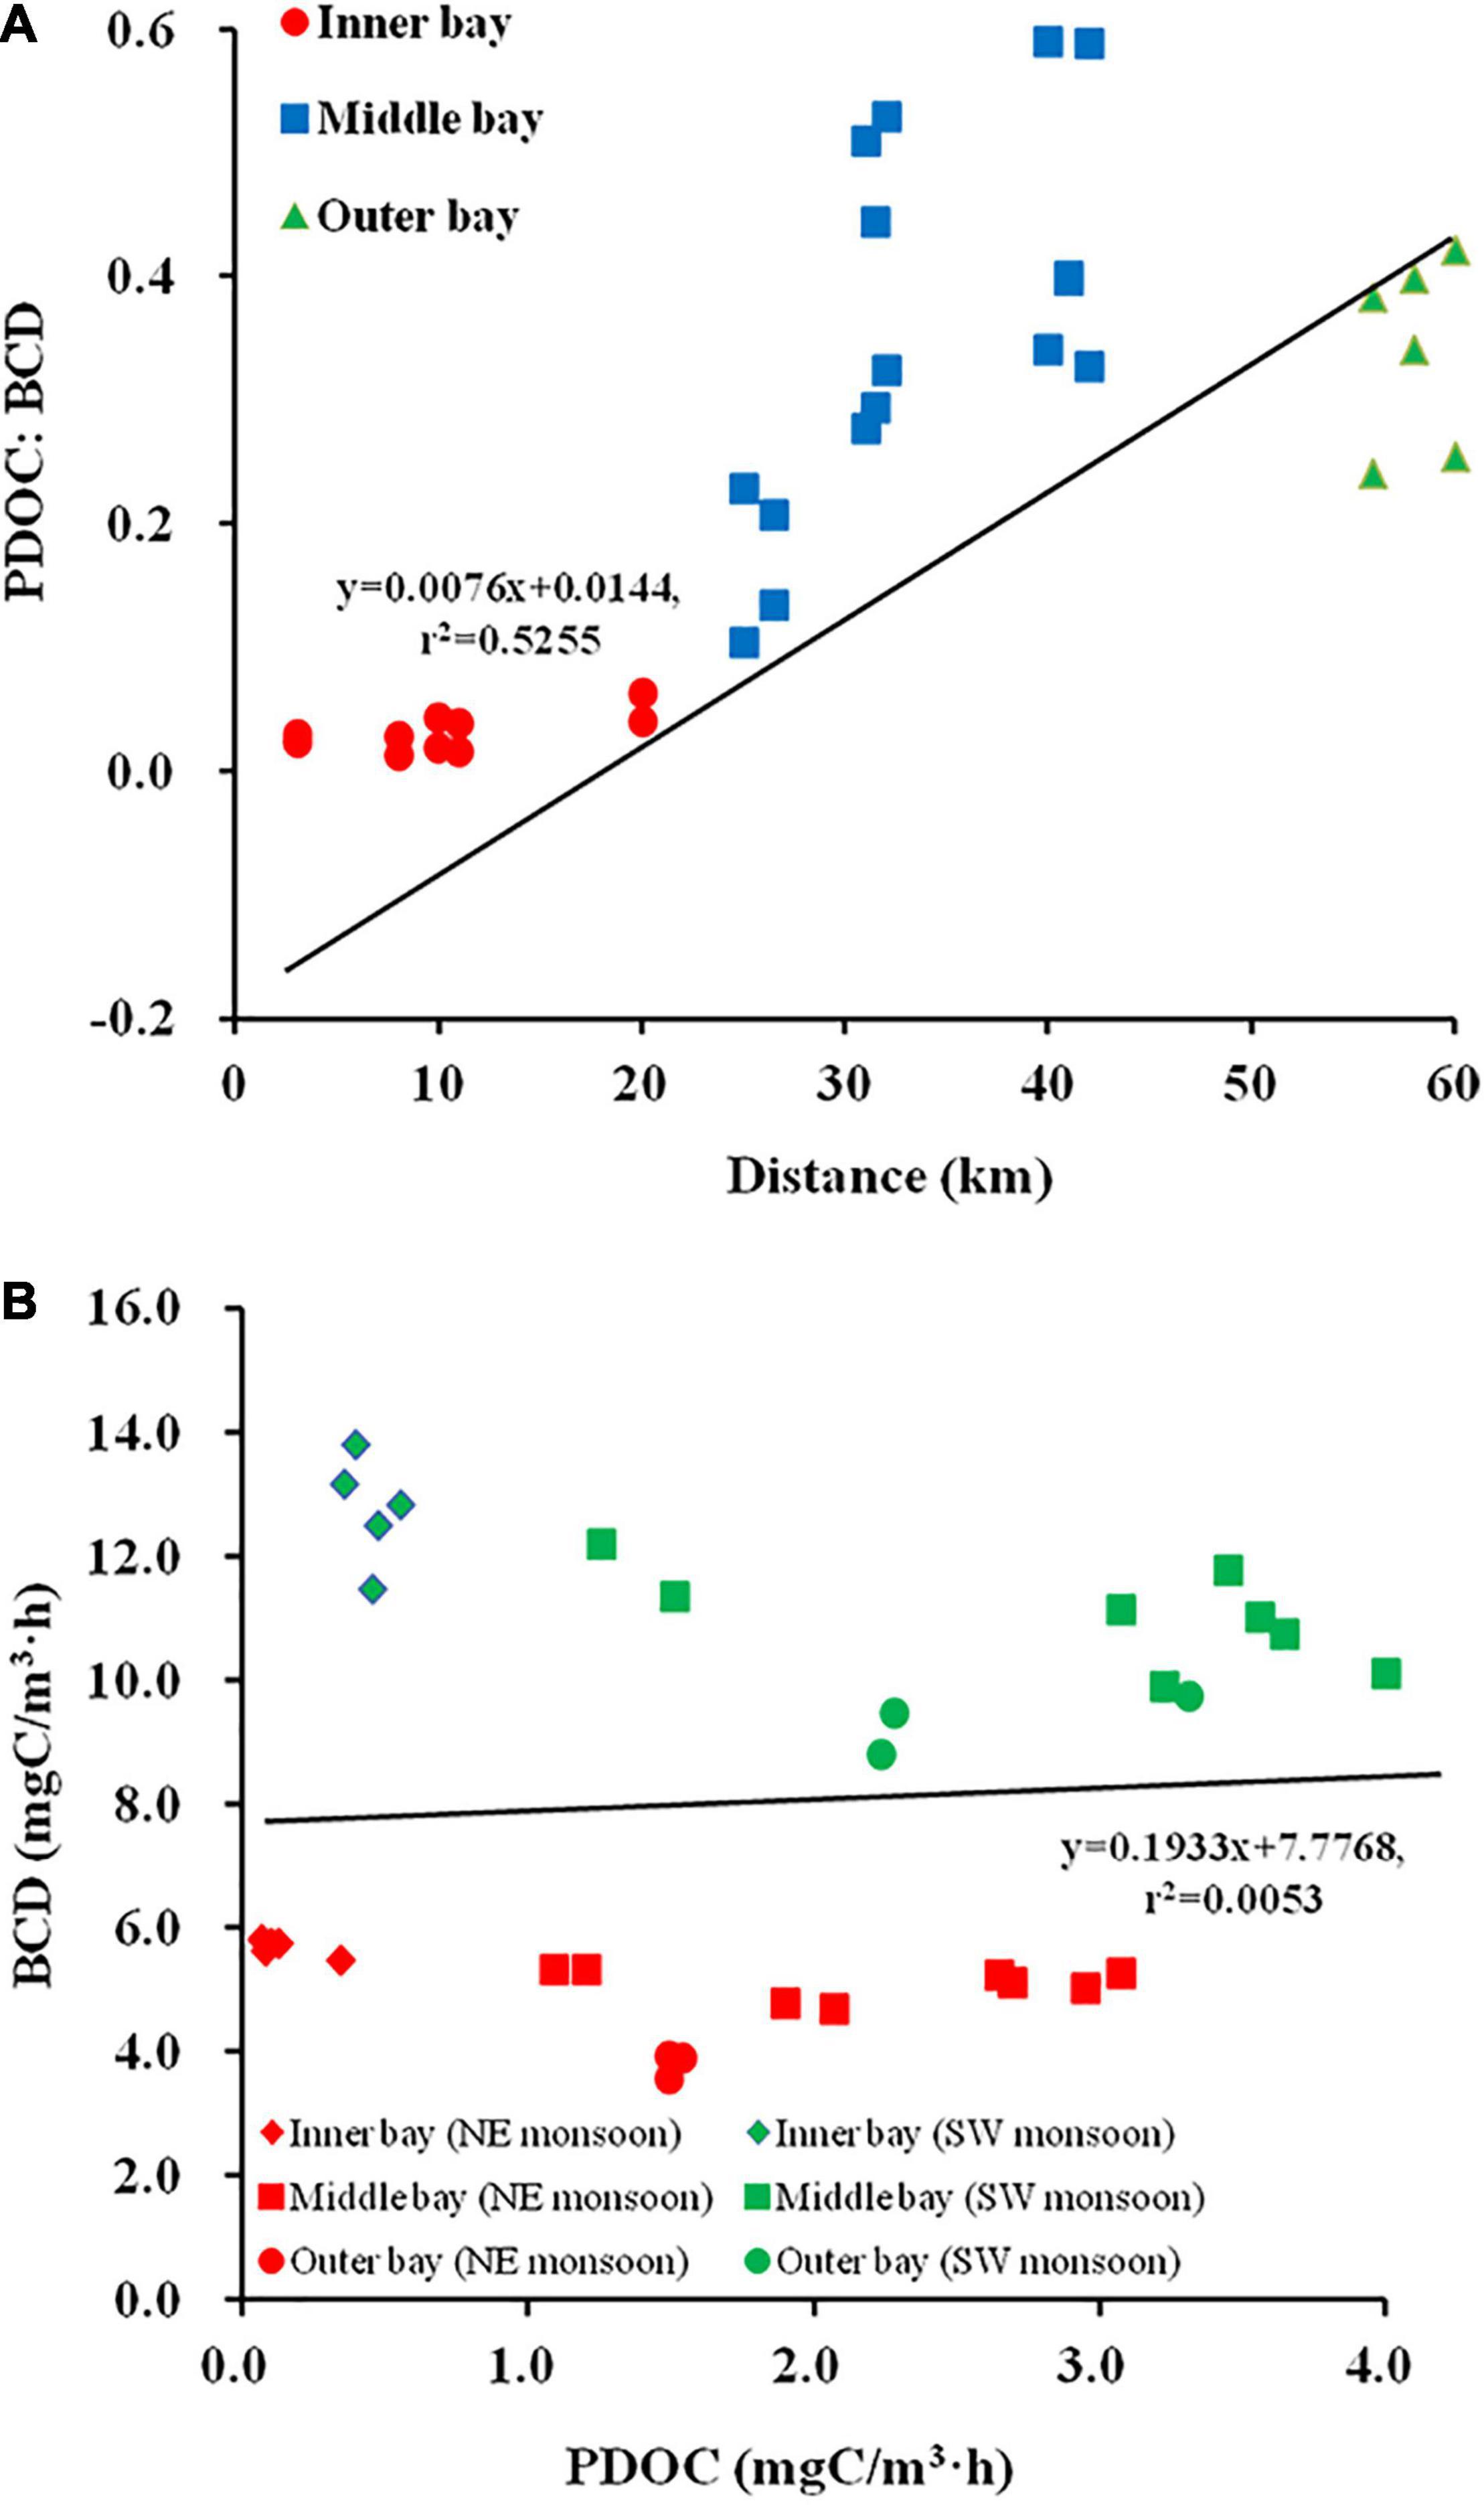
Figure 5. Relationship between PDOC:bacterial carbon demand (BCD) and distance (A), PDOC and BCD (B).
The ratio of BP:TPP represents the ability of HB to recycle dissolved matter within the Zeu (Rich et al., 1997). The study examined the relationship between BP:TPP and distance and the contribution of BP to DOC recycling using log-log linear regression. A positive relationship was indicated between BP:TPP and the distance in the bay (Figure 6A). A small BP:TPP seasonal gap is evident during the SW monsoon (0.1 ± 0.05) and NE monsoon (0.13 ± 0.05). A gradual increasing trend of BP:TPP from nearshore to offshore was observed in the horizontal distribution. BP:TPP in the inner and outer bay was respectively, 0.12 ± 0.01 and 0.21 ± 0.03 during the NE monsoon, followed by BP:TPP of 0.05 ± 0.02 and 0.16 ± 0.01 during the SW monsoon, respectively. The slope (0.9) of the line (Log TPP vs. Log BP) through the points in this study was similar to the slope of regression (0.8) found in the study of Cole et al. (1988), with differences in slope between seasons and among sectors (Figures 6B,C). These results showed the differences in the contribution of HB to the process of DOC cycling within the Zeu among different regions.
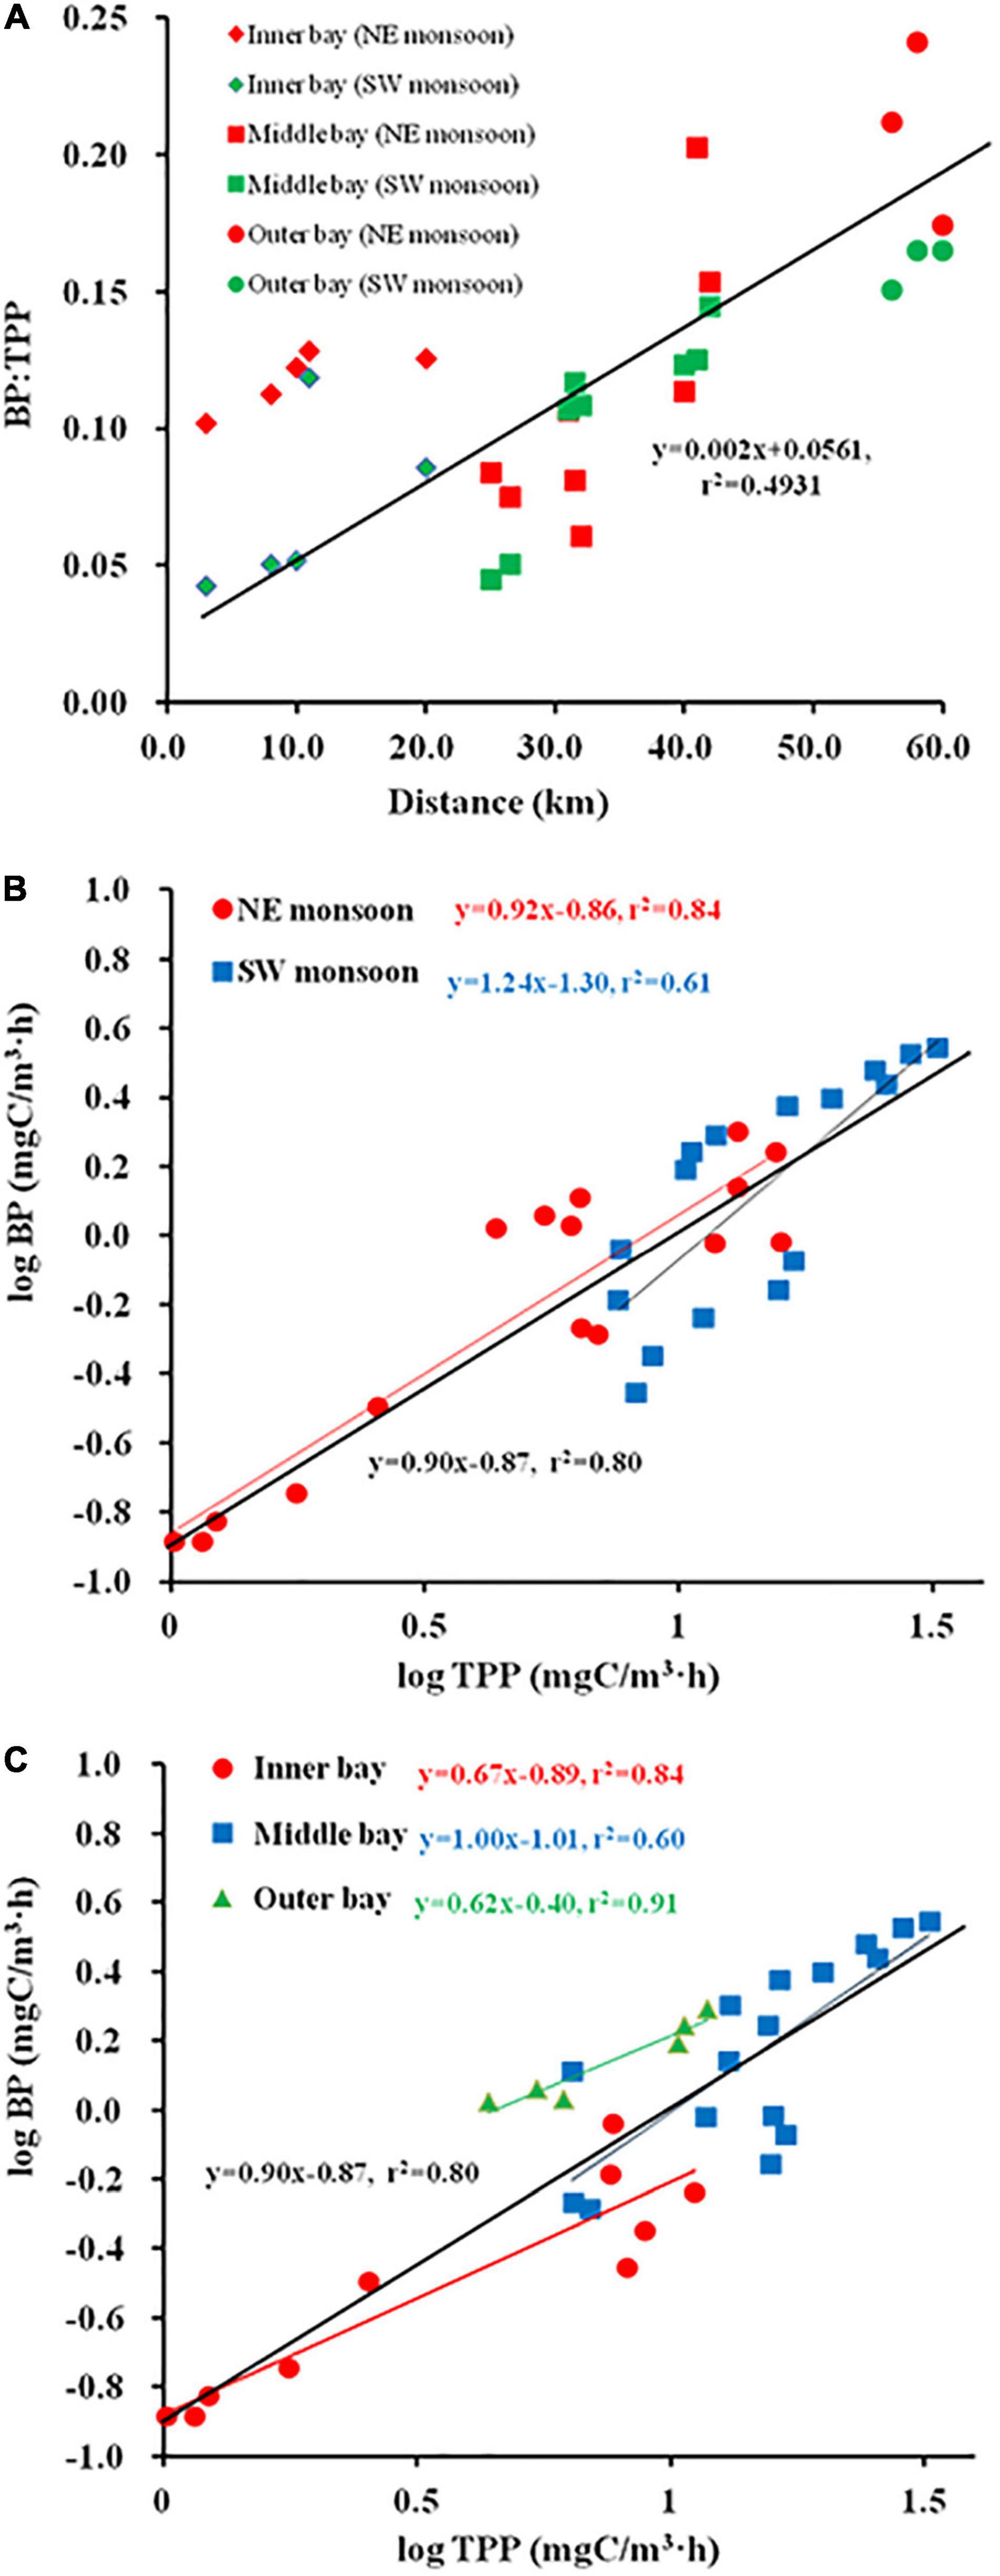
Figure 6. Relationship between BP:total primary productivity (TPP) and distance (A), Regression plots of Log (PPOC) vs. Log (PDOC) [(B) season, (C) sector].
The distribution of size-fractionated Chl a was highly variable both spatially and seasonally. During SW monsoon, >20 μm microphytoplankton cells dominated the inner sector, accounting for 76% of total Chl a. The contribution of 2–20 μm nanophytoplankton (23–71%) and >20 μm microphytoplankton (10–55%) cells alternate in dominance at middle sector stations. In contrast, in outer sectors, the largest contributor to Chl a is picophytoplankton (43%) (Figure 7A). During the NE monsoon, microplankton still dominated the inner sectors with a slightly lower percentage (70% of total Chl a), coinciding with the low salinity water derived from freshwater inputs (Figure 7B). The range of microphytoplankton (33–59%) and nanophytoplankton (13–47%) contribution ratios to total Chl a were enhanced compared to that of SW monsoon. Microphytoplankton is overwhelmingly dominant (68% of total Chl a) in the oligotrophically aggravated outer bay. In general, an increasing trend in Chl a(pico):Chl a(total) and decreasing trend in Chl a(micro):Chl a(total) from the inner bay to the outer bay were presented, while an unclear distribution pattern in Chl a(nano):Chl a(total) was observed (Figures 7A,B).
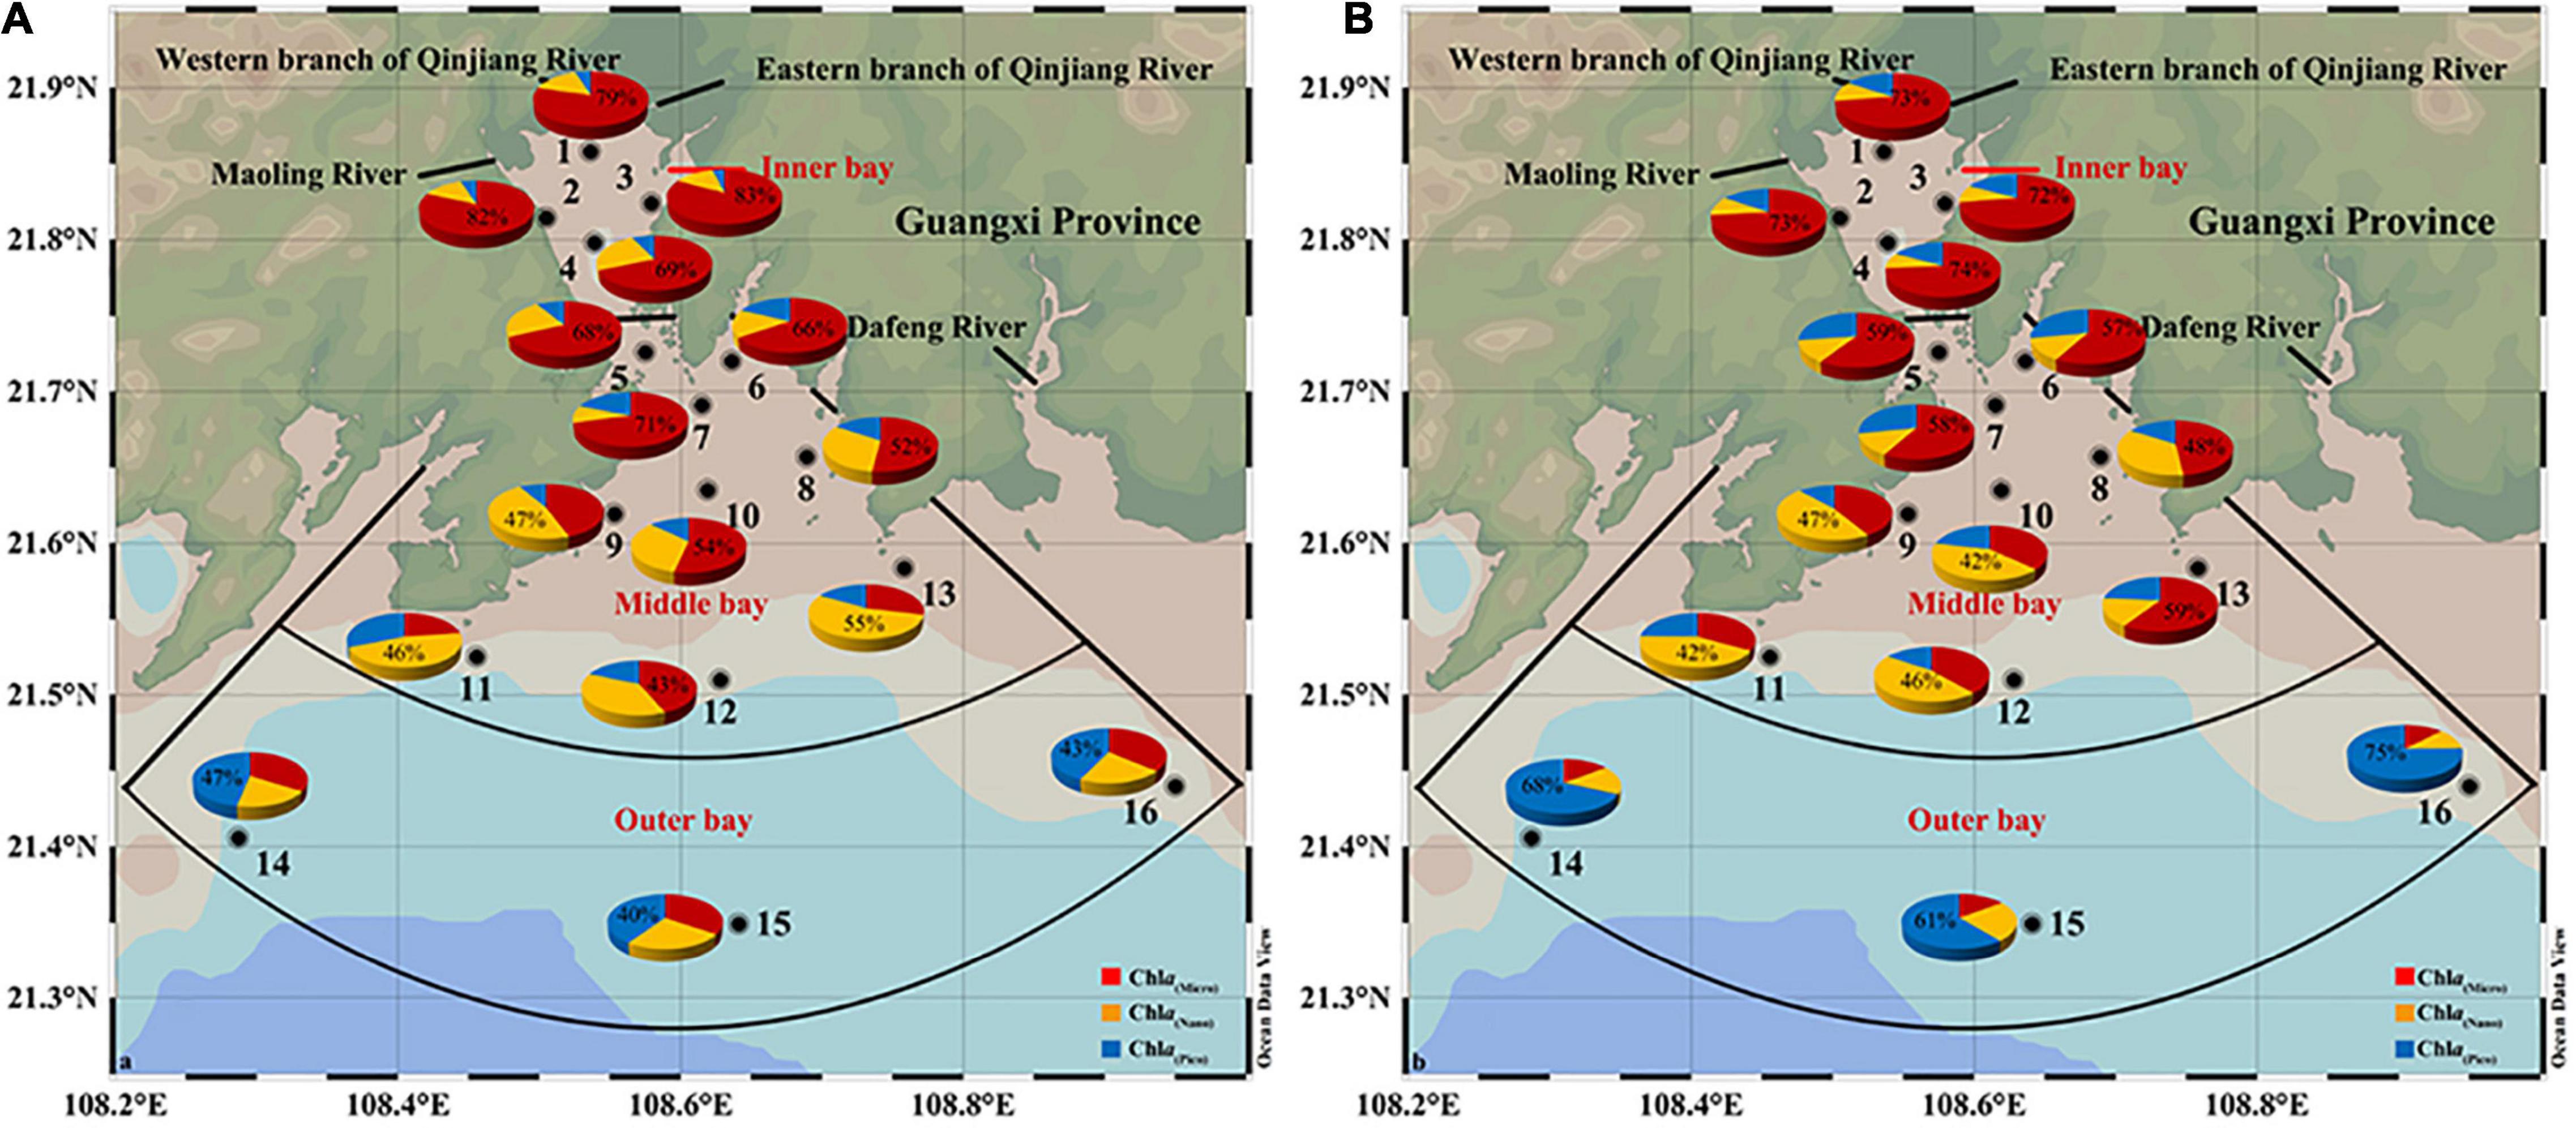
Figure 7. The percentage of size-fractionated chlorophyll a (Chl a) in total Chl a during SW (A) and NE (B) monsoon in the Qinzhou Bay.
The correlation between size-fractionated Chl a and PER during the two seasons is illustrated in Figures 8A–C. The results presented that the Chl a of nanophytoplankton was independent of PER, the Chl a of microphytoplankton was negatively correlated with PER (r = –0.621, p < 0.01), while a positive relationship was indicated between the Chl a of picophytoplankton and PER (r = 0.704, p < 0.01).
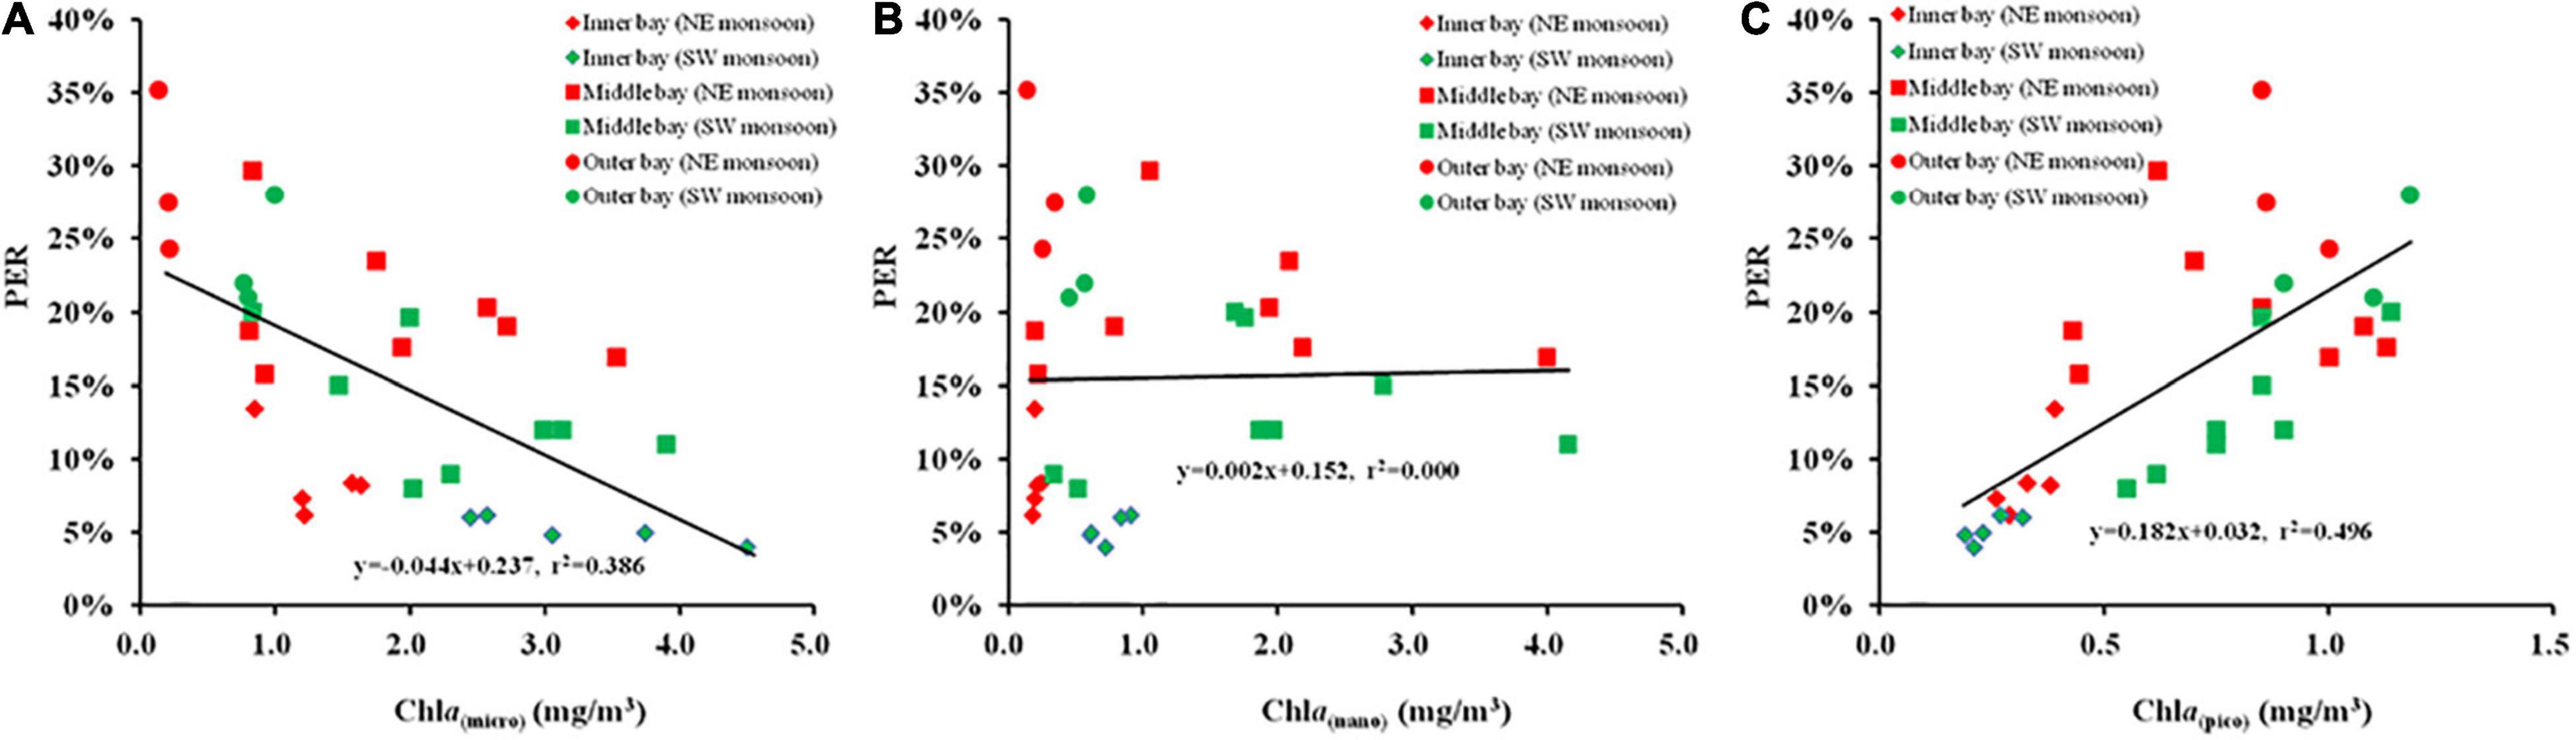
Figure 8. The relationship between size-fractionated Chl a and percentage of extracellular release [(A) Chl a (micro) and PER, (B) Chl a (Nano) and PER, (C) Chl a (Pico), and PER] during SW and NE monsoon in the Qinzhou Bay.
The culture experiment was conducted with six different particle size phytoplankton (A. pacificum 35–45 μm, C. curvisetus 25–35 μm, S. costatum 15–25 μm, P. pouchetii 5–15 μm, Synechococcus sp. 1.5–5 μm, and P. oculatum 1–2 μm) as the main subjects, and the PER was used as the characterization index to comprehensively investigate the effect of different particle size algae on PDOC. The results showed that PER ranged from 3 to 53%, with an average of 24 ± 13% (n = 18). For the six different phytoplankton species, they were ranked in descending order of PER as P. oculatum > Synechococcus sp. > P. pouchetii > S. costatum > C. curvisetus > A. pacificum (Figure 9). The results clearly showed that the PER was higher for smaller phytoplankton and vice versa.
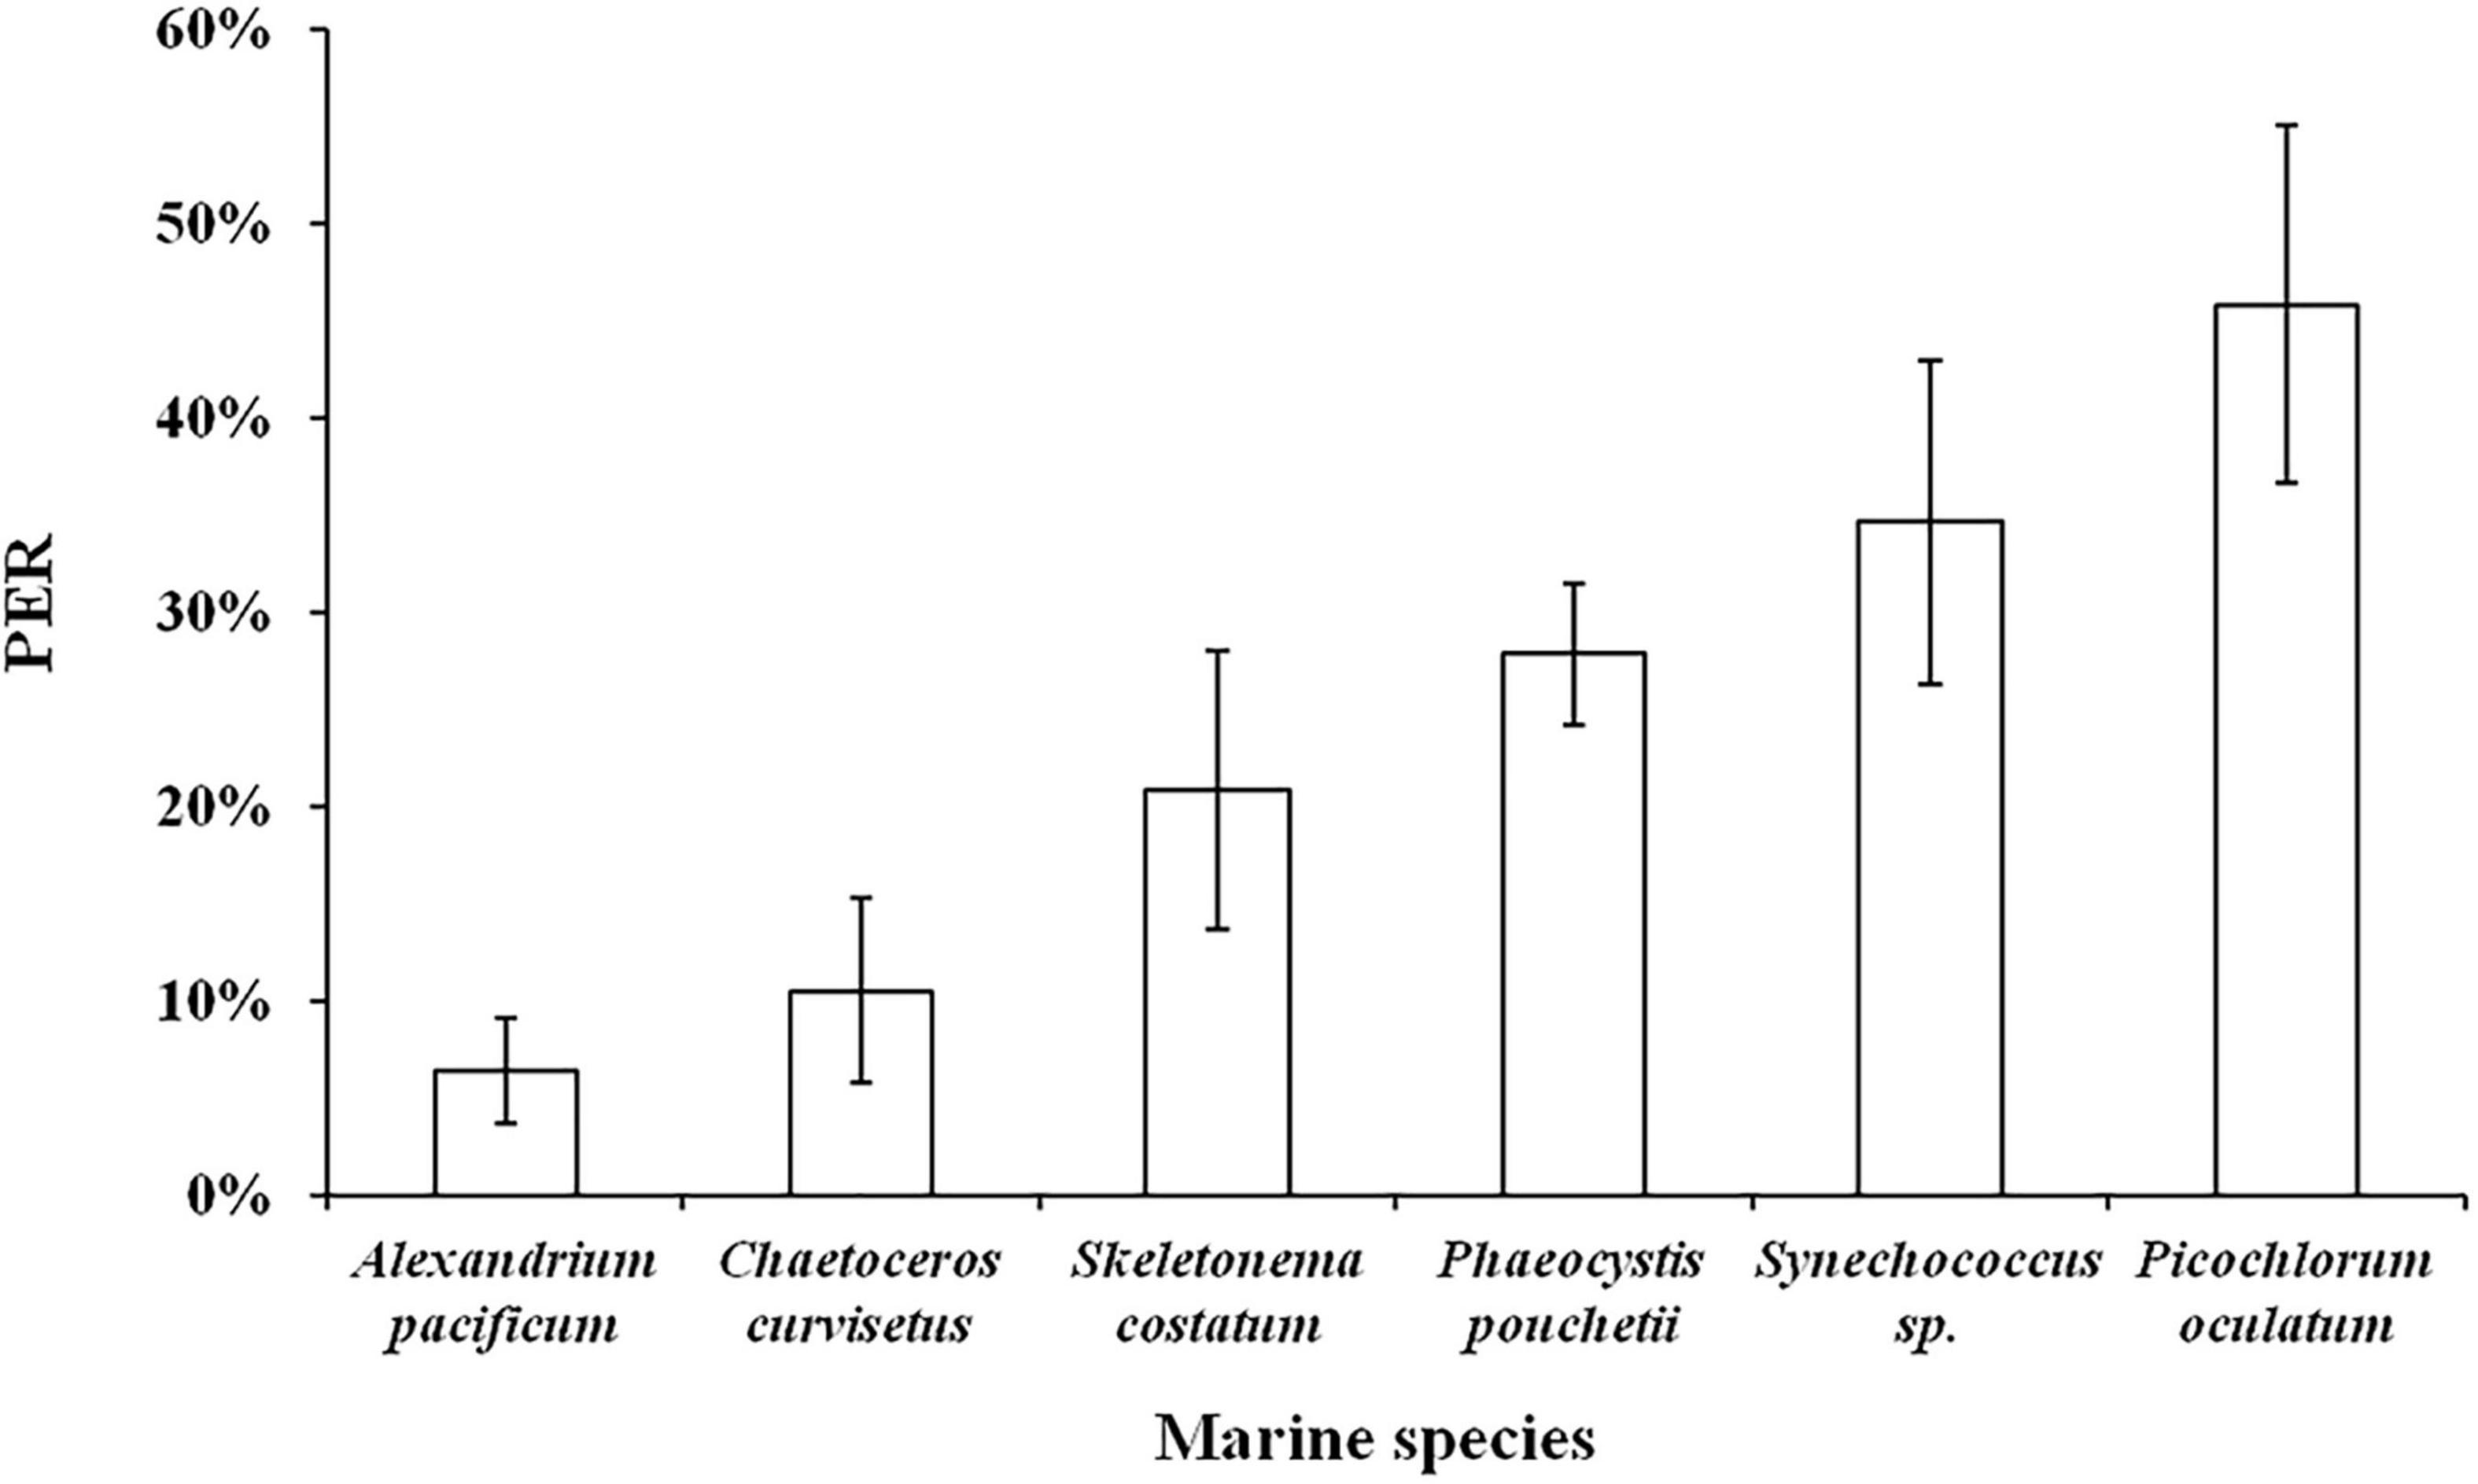
Figure 9. Relationship between phytoplankton with different particle sizes and PER in simulated culture experiments.
Pearson correlation analysis was used to explore the relationship between the PER of phytoplankton and environmental factors in situ. The results showed that PER was positively correlated with salinity, DO, Zeu, and DIN:DIP (all p < 0.01), while negatively correlated with DIN, DIP, DSi, and TUB, PAR (all p < 0.01) (Table 3), indicating that the PER varied with the physicochemical differences between the inner and outer bay waters. Furthermore, to remove variables that are highly colinear with other environmental variables, the stepwise regression analysis between PER and physicochemical parameters has been conducted. The results revealed a 96.7% of PER variability explained by independent factors, altogether excluding the co-linearly apparent DIN (VIF = 23.27) and DIP (VIF = 16.69). All these parameters showed positive feedbacks toward PER variability with the highest contribution of salinity (65.7%) followed by DIN:DIP (30.5%): PER(%) = 1.285 +0.596 Salinity +0.101 (DIN:DIP). Consequently, multiple environmental parameters were important factors explaining the biogeographic variations of PER, whereas salinity and nutrient stoichiometry explained relatively more.
To elucidate the mechanisms by which the marine environment regulates PDOC productivity, C. curvisetus and S. costatum, the dominant species during NE monsoon and SW monsoon in the monitoring field (Figure 2), were selected for culturing and a series of experiments on PER response were conducted under conditions that simulated a range of variations in environmental parameters (temperature, salinity, irradiance, and nutrient stoichiometry) in situ. The results of all experiments are detailed in Figure 10.
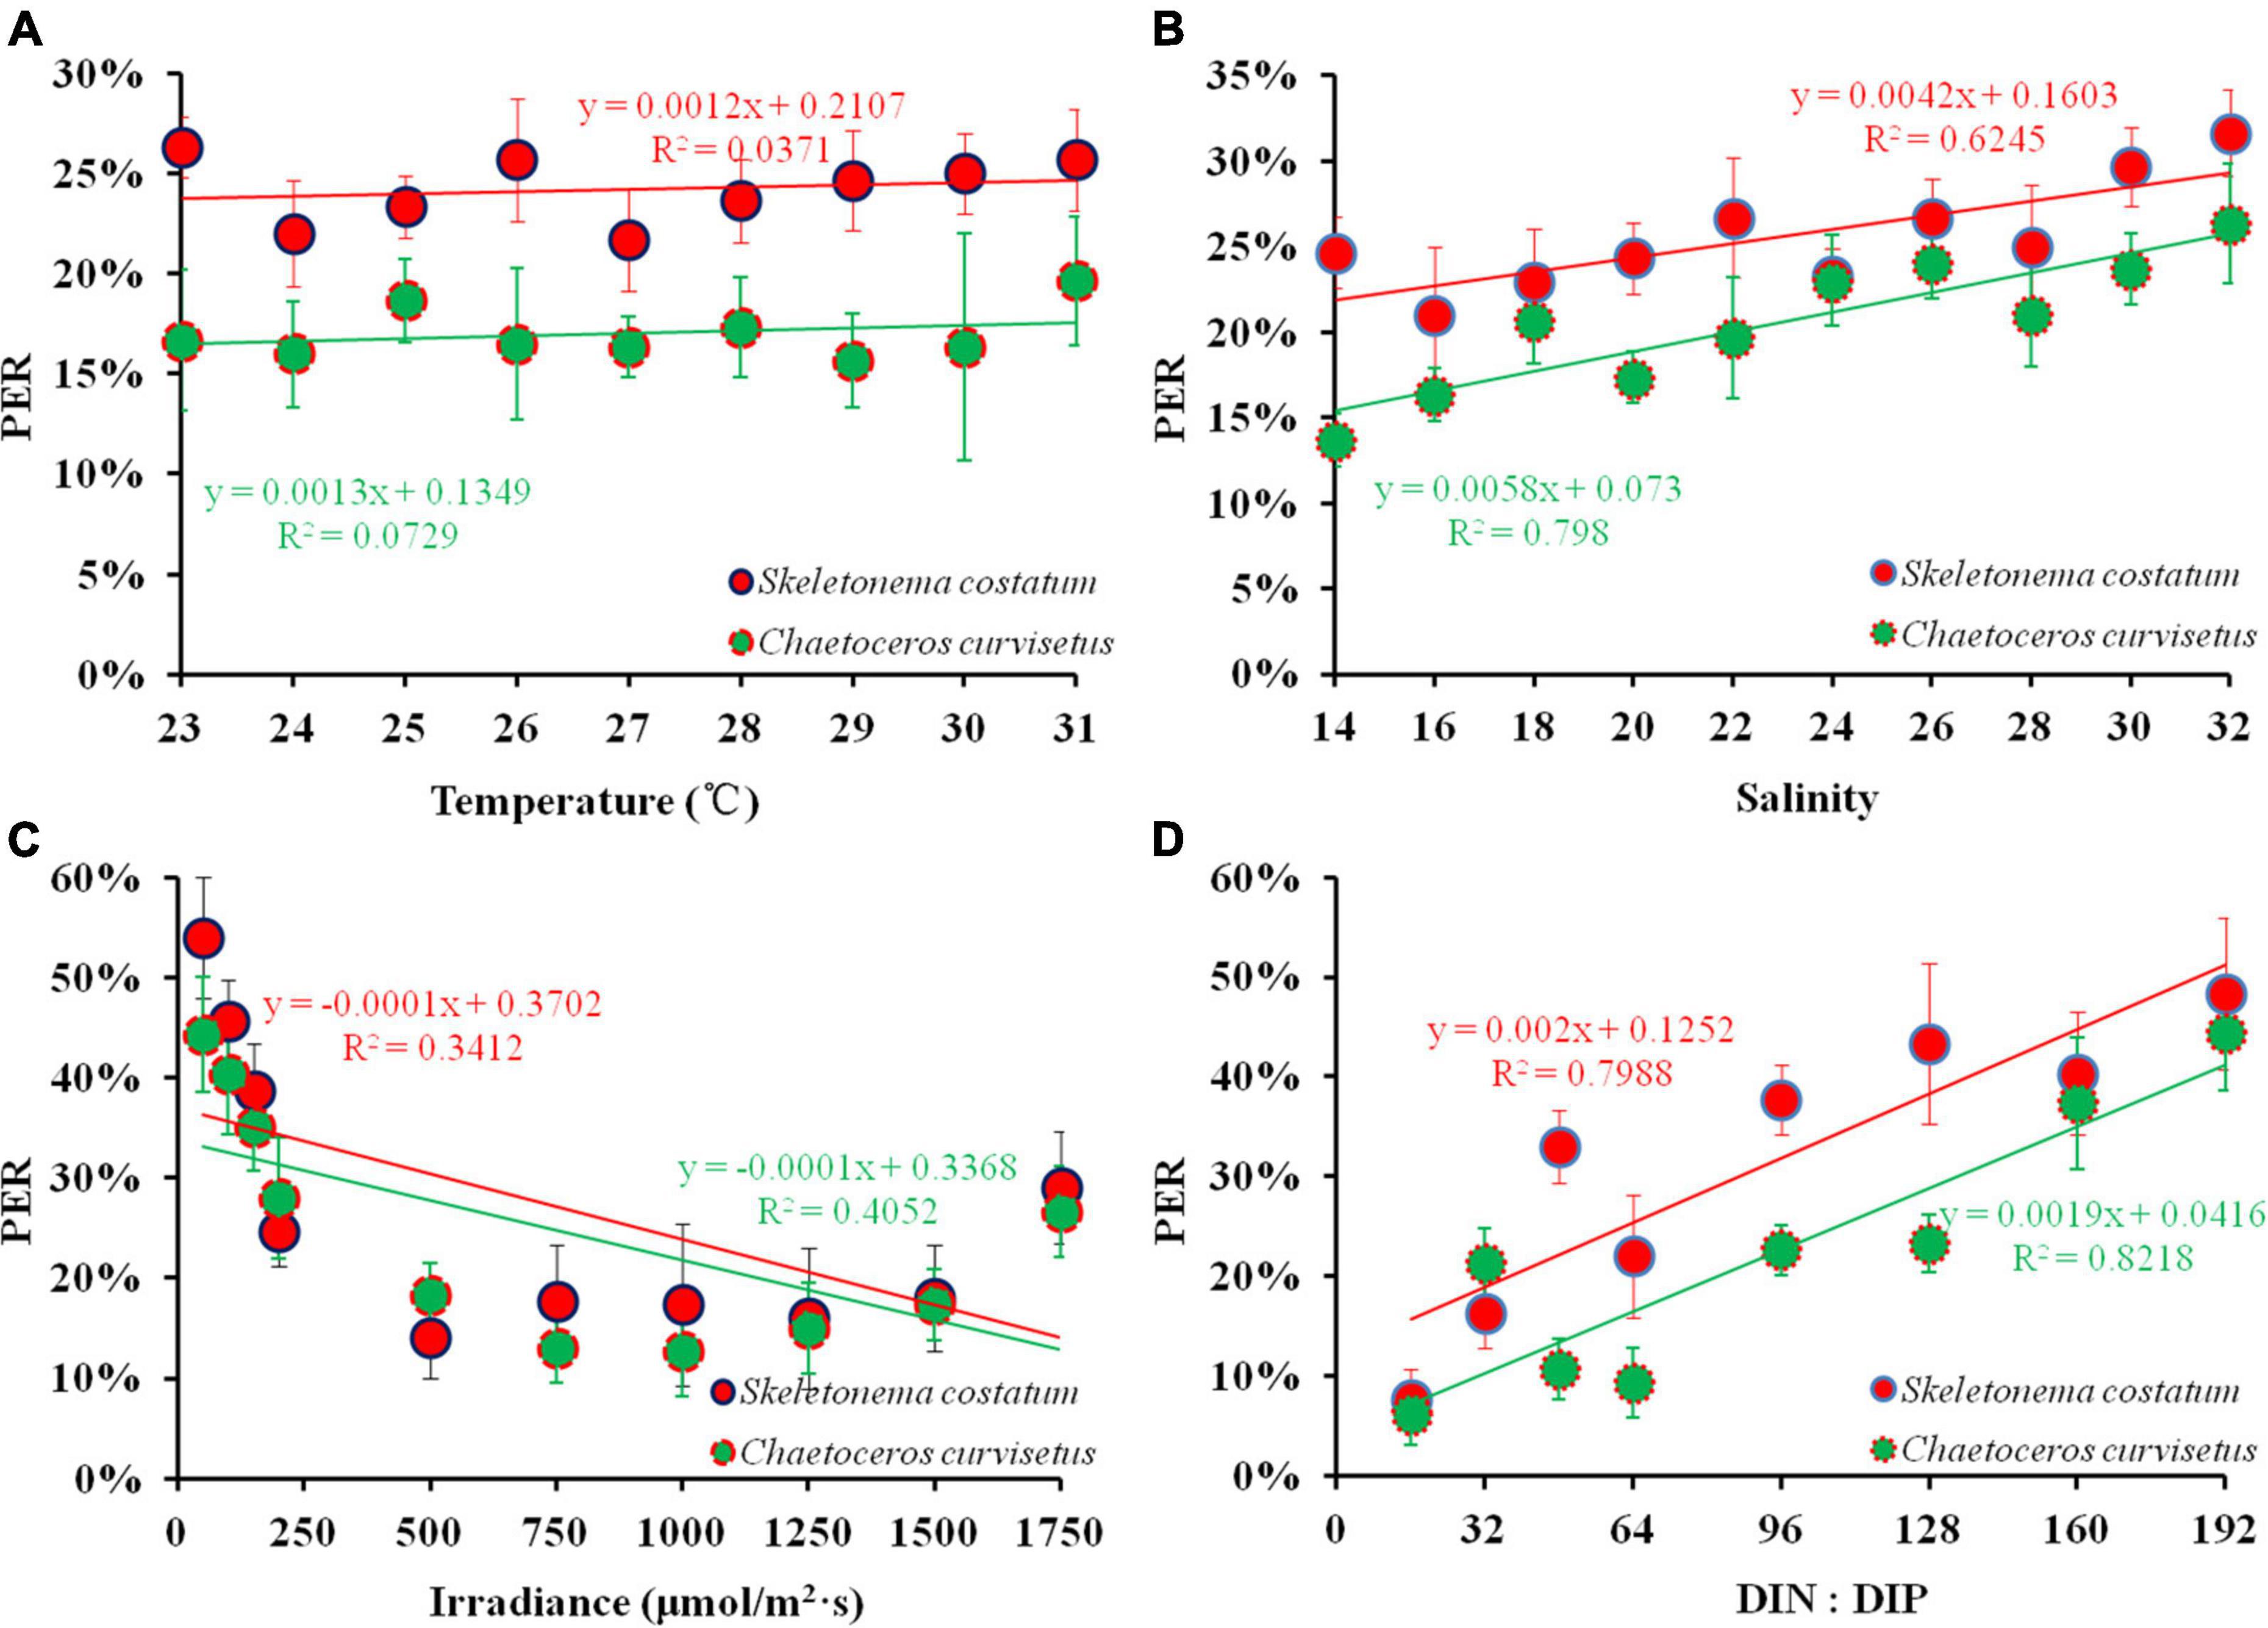
Figure 10. PER under varying environmental factors [(A) temperature; (B) salinity; (C) irradiance; (D) DIN: DIP] in the exponential growth phase of cultured algae.
A slight variation (22–26% and 16–20%) in PER of S. costatum and C. curvisetus respectively were recorded after 24 h of incubation under the temperature 23–31°C. The mean PER (24 ± 2%) of C. curvisetus decreased by 7% compared to S. costatum (17 ± 1%). The PER of both S. costatum (r = 0.303, p > 0.05) and C. curvisetus (r = 0.188, p > 0.05) were independently related to temperature implying that temperature within the experimental range had a very limited effect on the PER of these two species (Figure 10A). S. costatum had a mean PER of 25 ± 3% under 14–32 salinity incubation conditions, whereas C. curvisetus PER was observed to be 20 ± 4%. The range of variation in PER (21–32 and 14–26%, respectively) for both algae was extended compared to the temperature conditions. A significant positive correlation was presented in PER and salinity (r = 0.768, p < 0.01; r = 0.886, p < 0.01) (Figure 10B). Irradiance has a different effect on PDOC. The PER of S. costatum and C. curvisetus varied slightly (14–18 and 13–18%) with the range of natural light 250–1,500 μmol/(m2⋅s), while it sharply increased at irradiance higher than 1500 μmol/(m2⋅s) (18–29% and 17–27%) or lower than 250 μmol/(m2⋅s) (25–54 and 28–44%) (Figure 10C), suggesting that extreme conditions especially low irradiance could have more severe effects on algal PDOC release rates and greatly contributes to the improvement of the PER. The effect of nutrients on phytoplankton PDOC production was modeled using a nutrient gradient enrichment experiment. The results showed that PER was maintained at low levels (6 and 8%) when DIN:DIP was in Redfield ratio (16:1) and at high levels (48 and 44%) when DIN:DIP was severely imbalanced during the culture of both S. costatum and C. curvisetus (Figure 10D). A significant positive correlation was observed between PER and DIN:DIP for these two species (r = 0.89, p < 0.01; r = 0.91, p < 0.01). S. costatum showed varying degrees of PER response to different environmental factors. Temperature, salinity, light, and DIN:DIP decreased by 30, 20, 9, and 29% respectively compared to C. curvisetus. Both salinity and DIN:DIP were significantly correlated with PER, and these experimental findings were consistent with the field results of stepwise regression analysis.
The potential relationship between PER and TPP has been very hotly debated. Most previous studies had concluded that there was a significant negative correlation between PER and TPP (Morán et al., 1999; Liu, 2012), while a few studies had argued that PER was relatively constant and independent of changes in TPP (Marañón et al., 2005; Kanuri et al., 2013). Teira et al. (2001) argued that the relationship between PER and TPP could not be evaluated in a region-independent style. Their results comparing observations from upwelling and oligotrophic zones in Atlantic waters showed that different processes controlled phytoplankton extracellular secretion under these opposing environmental conditions. For example, PER averages 23 ± 4% in oligotrophic waters and 7% ± 1% in upwelling zones, and PER showed different relationships with TPP depending on the zone. This is consistent with our study, and similar results were obtained in the study of Teira et al. (2001). Low TPP (5.13 ± 3.93 mgC/m3⋅h) was accompanied by low PER (7 ± 3%) in the eutrophic inner bay and moderate TPP (8.12 ± 3.17 mgC/m3⋅h) was followed by high PER (26 ± 5%) in the oligotrophic outer bay during the two seasons.
The study of Baines and Pace (1991) proposed a linear model in which the logarithms of PDOC and PPOC were plotted against each other to explore the relationship between POC and DOC production. If the slope of the regression curve is not significantly different from 1, it means that PER value is relatively constant across the observed range of primary production; if the slope is significantly greater or less than 1, it indicates that PER increases or decreases with higher TPP. In the present study, the former condition prevailed during SW monsoon (Figure 4A), in the inner bay and parts of the light intensity layer (100, 10, and 1%I) within the Zeu, while the latter condition prevailed during NE monsoon (Figure 4A), in the middle bay and outer bay, also within the water column of Zeu. This suggests that the release of recent photosynthate in dissolved form is a normal function of phytoplankton populations. Slopes were observed to vary not only seasonally, but even across estuarine sectors (e.g., not significant with 1 in the inner bay, significant < 1 in the middle and outer bays) and vertically in the water column (e.g., 50 and 30%I significant > 1, 5%I significant < 1, and 100, 10, and 1%I not significantly different from 1) (Figure 4C). Previous studies have considered the relationship between PER and TPP to be only unilateral in horizontal space (Teira et al., 2003). Our results showed that this relationship is not only related to spatial distribution but is also closely related to seasonal and vertical space, and it would be biased to judge it in isolation from any single aspect.
One way DOC in seawater is converted to POC after being absorbed by HB in an osmotrophy manner, when it then constitutes the bacteria’s own composition. PDOC is an important source for maintaining the growth of HB in oligotrophic waters (Lasternas and Agustí, 2013). In contrast to DOC immobilized by phytoplankton and converted by various pathways before releasing into seawater, the PDOC released directly by phytoplankton is predominantly carbohydrates, of which glucose, a more readily available component of bacteria (Hellebust, 1974; Biddanda and Benner, 1997; Hama and Yanagi, 2001). As decomposers and secondary producers of marine ecosystems, HB are an extremely important component of the marine biome. Since Azam et al. (1983) introduced the concept of microbial loop, marine biologists have reached an unprecedented level of interest in the biomass and production processes of HB. The importance of HB in the biogeochemical cycling and energy flow in ecosystems has been extensively studied (Shiozaki et al., 2014; Durham et al., 2019; Grossart et al., 2019). Although HB act as decomposers to break down a large amount of organic matter present in the water and release nutrients; on the other hand, they are also able to absorb DOC and convert it into particulate organic matter, which is then returned to the main food chain for secondary production (Jiao et al., 2011). Studies have shown that HBP accounts for 10∼80% of marine primary productivity (Kirchman, 2000), which is sufficient to explain the important role of HB in the carbon cycle of marine ecosystems.
In contrast, DOC released from phytoplankton production provides an important source of nutrients for the growth of HB (Obernosterer and Herndl, 1995; Uchimiya et al., 2020). Carbon flow models estimate that algal secretion contributes to 73% of the nutrients required for bacterial metabolism, and this figure includes organic matter released by algal blooms (Peterson, 1984). DOM released directly by phytoplankton is dominated by carbohydrates, which are more readily taken up and utilized by bacteria than DOC immobilized by phytoplankton and converted by various pathways before releasing into the waters. The amount of PDOC measured in the water is smaller than the amount actually released by phytoplankton because microbes metabolize PDOC rapidly. Failure to account for microbial utilization could lead to a serious underestimation of gross PDOC during measurements of primary production (Cole et al., 1982).
The ratio of BP to TPP ranged from 0.04 to 0.24 across the monitoring area, although the average of BP:TPP was only 0.11 ± 0.05 (n = 32) among two seasons. This figure is generally consistent with the inshore of China (0.1) (Liu, 2012) and much smaller than previous findings (0.3) across a wide range of marine environments (Cole et al., 1988; del Giorgio and Cole, 1998). BP:TPP increased with distance from the river mouth (Figure 6A), averaging only 0.09 ± 0.03 (n = 10) in the inner bay and up to 0.18 ± 0.03 (n = 6) in the outer bay. Variable BP to TPP ratios are more indicative of different degrees of coupling between the autotrophic and heterotrophic components of the ecosystems (Poulton et al., 2016). Previous studies have shown that bacteria are able to preferentially absorb and assimilate newly produced DOC from phytoplankton before using other heterogeneous sources of background DOC in the water column (Larsson and Hagström, 1982; Bell and Kuparinen, 1984; Morán et al., 2001). Later on, it has been proven that BR and growth are partially supported by PDOC in most cases, but also may be fully supported by PDOC (Liu, 2012), which is an important component of TPP. On a broad scale, BP:TPP can be considered as the key ratio for establishing the coupling between autotrophic and heterotrophic components (Peierls and Paerl, 2011; Poulton et al., 2016).
Overall, a larger intercept on the Log BP vs. Log TPP regression implies more heterotrophic activity (Peierls and Paerl, 2011). The differences in the regressions are revealed between the two seasons and among the three sectors. For example, the intercept is obviously lower in the southwest monsoon (–1.3) than that in the northeast seasonal (–0.86) period (Figure 6B), while the intercept is significantly higher in the outer bay (–0.4) than that in the inner bay (–0.89) (Figure 6C). It is possible that the variation was caused by the differences in the mean trophic status of the surveyed area, although the possibility that the differences in the efficiency of bacterioplankton cannot be ruled out. It has been reported that the recycling of organic matter is more pronounced in oligotrophic waters, where the share of BP in TPP can even be as high as 86.5% (Hagström et al., 1988). Our results also demonstrated that the efficiency of PDOC used by HB can be significantly higher in oligotrophic waters (outer bay) than in eutrophic waters (inner bay) (Figure 6C), resulting in a difference in BP:TPP.
To assess the quantitative importance of PDOC as a carbon source for the bacteria, the rates of bacterial uptake of PDOC should be directly compared with the total bacterial carbon production. The PDOC:BCD > 1 suggests that bacterial metabolism was not limited by carbon availability, PDOC:BCD < 1 indicates that there was insufficient DOC produced by phytoplankton to satisfy the bacterial requirements (Morán et al., 2002; Elena García-Martín et al., 2017). The results of the present study demonstrated that PDOC contribution to total BCD in the inner and outer sector was 0.03 ± 0.02 and 0.34 ± 0.08, respectively, during two seasons, and in the whole study area was 0.2 ± 0.14 and 0.3 ± 0.22 during SW and NE monsoons respectively. Morán et al. (2002) investigated the relationship between BCD and PDOC in different ecosystems (the Antarctic offshore, Antarctic coastal, NE Atlantic, and NW Mediterranean), calculating BCD from BP data collected in situ and concluded that the “BCD would on average always exceed dissolved primary production in the NE Atlantic unless unrealistically high BGEs were used.” Consistent with their conclusion, our BCD values (1–59%) were always higher than the PDOC at a broad range of BGE values (2–38%). BCD clearly exceeded PDOC during both seasons indicating that phytoplankton exudation was not sufficient to sustain bacterial metabolism and there were additional organic carbon sources to support bacterial activity. The generally low contribution of PDOC to BCD may be due to an exceptional rise in BCD in presence of allochthonous dissolved organic carbon containing a significant amount of non-humic organic carbon (liable) (Jiao et al., 2010; Kanuri et al., 2013). Besides, other processes such as terrestrial sources (Kim et al., 2020), sediment release (Otto and Balzer, 1998), cell lysis (Morán et al., 2001), sloppy feeding by the grazers (Johnston et al., 2021), excretion, and degradation by phytoplankton (Boulion, 2021) or oysters (Nagata, 2000) also provide an important source of DOC for bacterial growth. The lack of correlation between BR and PDOC (r = –0.2, p > 0.05), BR and PPOC (r = 0.31, p > 0.05), significant positive relationship (r = 0.83, p < 0.01) between BP and PPOC (Table 4) indicate the importance of allochthonous carbon source to the bacterioplankton metabolism in the bay.
The non-linear relationship between PDOC and BCD (Table 4, r = 0.08, p > 0.05) indicates that the metabolism of bacteria and phytoplankton exudation were weakly coupled at this broad spatial and temporal scale. Although PDOC was insufficient to meet the bacterial demand for carbon and needs the other carbon resources in the whole study areas, the PDOC:BCD ratio still reflected a marked difference in the extent of this demand across the different sectors, with inner bay BP barely dependent on PDOC (0.03 ± 0.02), while the outer bay BP had a much higher degree of PDOC demand (0.34 ± 0.08).
The results in this study clearly indicate that different planktonic community structures, as derived from differences in the size-structure of phytoplankton biomass, are coupled with widely variant PER (Figures 8A,C). A significant positive relationship was observed in our case between PER and the contribution of picoplankton to total Chl a, ranging from 4% at inner stations, where picophytoplankton accounted for only 12% of Chl a, to 35% at outer stations during two seasons, where the contribution of picophytoplankton to total biomass was 56% (Figure 7). In contrast, A strong negative relationship was revealed between PER and the contribution of microplankton to total Chl a, ranging from 4% at inner stations, where microphytoplankton accounted for 73% of Chl a, to 35% at outer stations during two seasons, where the contribution of microphytoplankton to total biomass was 24% (Figure 7). Besides, the results of algal culture experiments in the laboratory also showed that phytoplankton cells with smaller particle sizes tended to have a higher PER (Figure 9).
From a plant physiological point of view, the increased surface-to-volume ratio of small cells should favor the passive diffusion across the membrane of low-molecular-weight metabolites (Poulton et al., 2016). The potential relationship between cell size and DOC production was first studied theoretically (Bjornsen, 1988), and then put into practice by scientists who found that this relationship was caused by the trophic state through a comprehensive analysis of the results of several cruises in the Atlantic Ocean. They concluded that the Atlantic basin, being an oligotrophic sea, leads to a long-term dominance of picophytoplankton with higher DOC release rates, culminating in a significant positive correlation between the contribution of microphytoplankton productivity to TPP and PER (Teira et al., 2001). Chinese scientists have also found that the PER in the southern Taiwan Strait under oligotrophic conditions was significantly higher than that in the northern Taiwan Strait under eutrophic conditions. They attribute this to the fact that microphytoplankton or nanophytoplankton are generally predominant under eutrophic status, whereas picophytoplankton is predominant under oligotrophic status (Huang et al., 1999). In contrast, in the coastal eutrophic ecosystem, the rate of PDOC release was uncorrelated with the size structure of phytoplankton biomass and productivity (Marañón et al., 2004). Malinsky-Rushansky and Legrand (1996) performed culture experiments on three phytoplankton species with different sizes and compared their results with those of other researchers, which showed higher PER values for picophytoplankton (<2 μm) but no significant difference between microphytoplankton and nanophytoplankton. Thus, to test the hypothesis that cell size affects the relative rate of DOC production, a series of experiments are required in which it is necessary to ensure that not only there is a gradient of variation in the cell size of the phytoplankton, but also that the nutrient concentration is maintained at a level that limits primary production. Comparing previous results (Poulton et al., 2016) with this study, we emphasized the role of trophic mechanisms in explaining the relatively high DOC release rates measured in oligotrophic picophytoplankton-dominated waters. As we shall discuss below (see section “Nutrient”), all of the available evidence indicates that, at least in our estuary-bay system, trophic mechanisms are also involved in the release of recent photosynthate, as determined with the 14C uptake technique. The positive or negative relationship between PER and size-structure (picophytoplankton and microphytoplankton) in our results would be fully consistent with this view.
In our situ cases, the temperature ranged from 23.5 to 30.8°C with a cruise average of 27.1°C and PER varied from 4 to 35% with a mean value of 15%. We have no evidence of any effect of temperature on the relative rate of DOC production in either field monitoring (Table 3, r = 0.02, p > 0.05) or lab experiments (Figure 10A, r = 0.014, p > 0.05), despite the fact that there are both physiological and ecological reasons to expect such effect. From a physiological point of view, high temperatures enhance the fluidity of cell membrane molecules, which directly leads to an increase in the rate of material transport across the membrane. If the temperature rises to a certain level, the cell membrane will completely rupture and the dissolved organic matter inside the cell will be completely released (Verity, 1981). There is evidence from mesocosm experiments that natural phytoplankton grown at high temperatures increase DOC release (Engel et al., 2011). Morán et al. (2006) conducted a short-term warming experiment of the phytoplankton community in the Southern Ocean and showed that an increase in ambient temperature from the range of (–1.4 to 0.4°C) to 2°C would result in an increase in phytoplankton PER from 35 to 54%. The common view in all of these studies is that PER is increased when extreme temperatures inhibit photosynthesis. Having these results in mind, it is likely that we did not find a relationship between temperature and PER because we did not encounter extreme temperature conditions in the field, such as those deliberate designs carried out inside the laboratory or normally observed in polar regions. It thus seems that testing rigorously the hypothesis that temperature has a physiological effect on PER in natural phytoplankton populations will remain a difficult task.
There are relatively few studies on the effects of salinity on PDOC. Salinity represents the extent to which the surveyed area is affected by freshwater and seawater. The results of the field survey showed salinity ranging from 0.5 to 31.33 with a mean value of 18.09, presenting a typical estuarine-bay character. PER was positively correlated with salinity both in the field (Table 3, r = 0.92, p < 0.01) and in laboratory simulations (Figure 10B, r = 0.89, p < 0.01), indicating that high salinity seawater was more favorable for PDOC release. The stepwise regression analysis identified that salinity had the greatest positive contribution (65.7%) to the change in PER. A former study by Fogg (1983) observed that the proportion of PDOC to TPP increased from 5 to 40% during the transition from low-salt to high-salt waters, and a similar pattern was found in later studies (Nagata, 2000; Teira et al., 2001). Liu (2012), after a comprehensive survey of PDOC in the China Sea, found that the most significant characteristics of its distribution were the gradual increase in the percentage of PER within Zeu from low-salt nearshore to high-salt offshore, with the Yellow China Sea ranging from 11.5 to 36.4%, the East China Sea from 7.6 to 39.3%, and the South China Sea from 12.5 to 32.4%. The two-way ANOVA analysis showed that there were significant differences in spatial and temporal variations in both salinity and PER, which are also well coupled (Table 2). All the evidence pointed to salinity as a major control factor in the formation of geographic variation in PER.
In estuarine (Liu, 2012), coastal transition zone (Huang et al., 1999), and open waters (Viviani et al., 2015), patterns of increasing PER with depth are frequently observed, although in all of these studies, there are also cases where PER remains constant or even decreases with depth, high PER values appear mostly at the bottom of the Zeu (Liu, 2012). In this study, we found that the PAR decreases while the PER increases as the water depth gradually deepens from the sea surface to the bottom (Figure 11). In addition, it has been shown that PER also increases with depth when temperature, nutrient, and species composition are uniform throughout the Zeu under vertical mixing conditions (Teira et al., 2001). This suggests that the main factors affecting the vertical gradient of PER may be light irradiance rather than temperature and nutrients. Under low irradiance, the rate of synthesis of macromolecular compounds decreases, while carbon is more synthesized into small molecule metabolites that are more readily released (Zlotnik and Dubinsky, 1989).
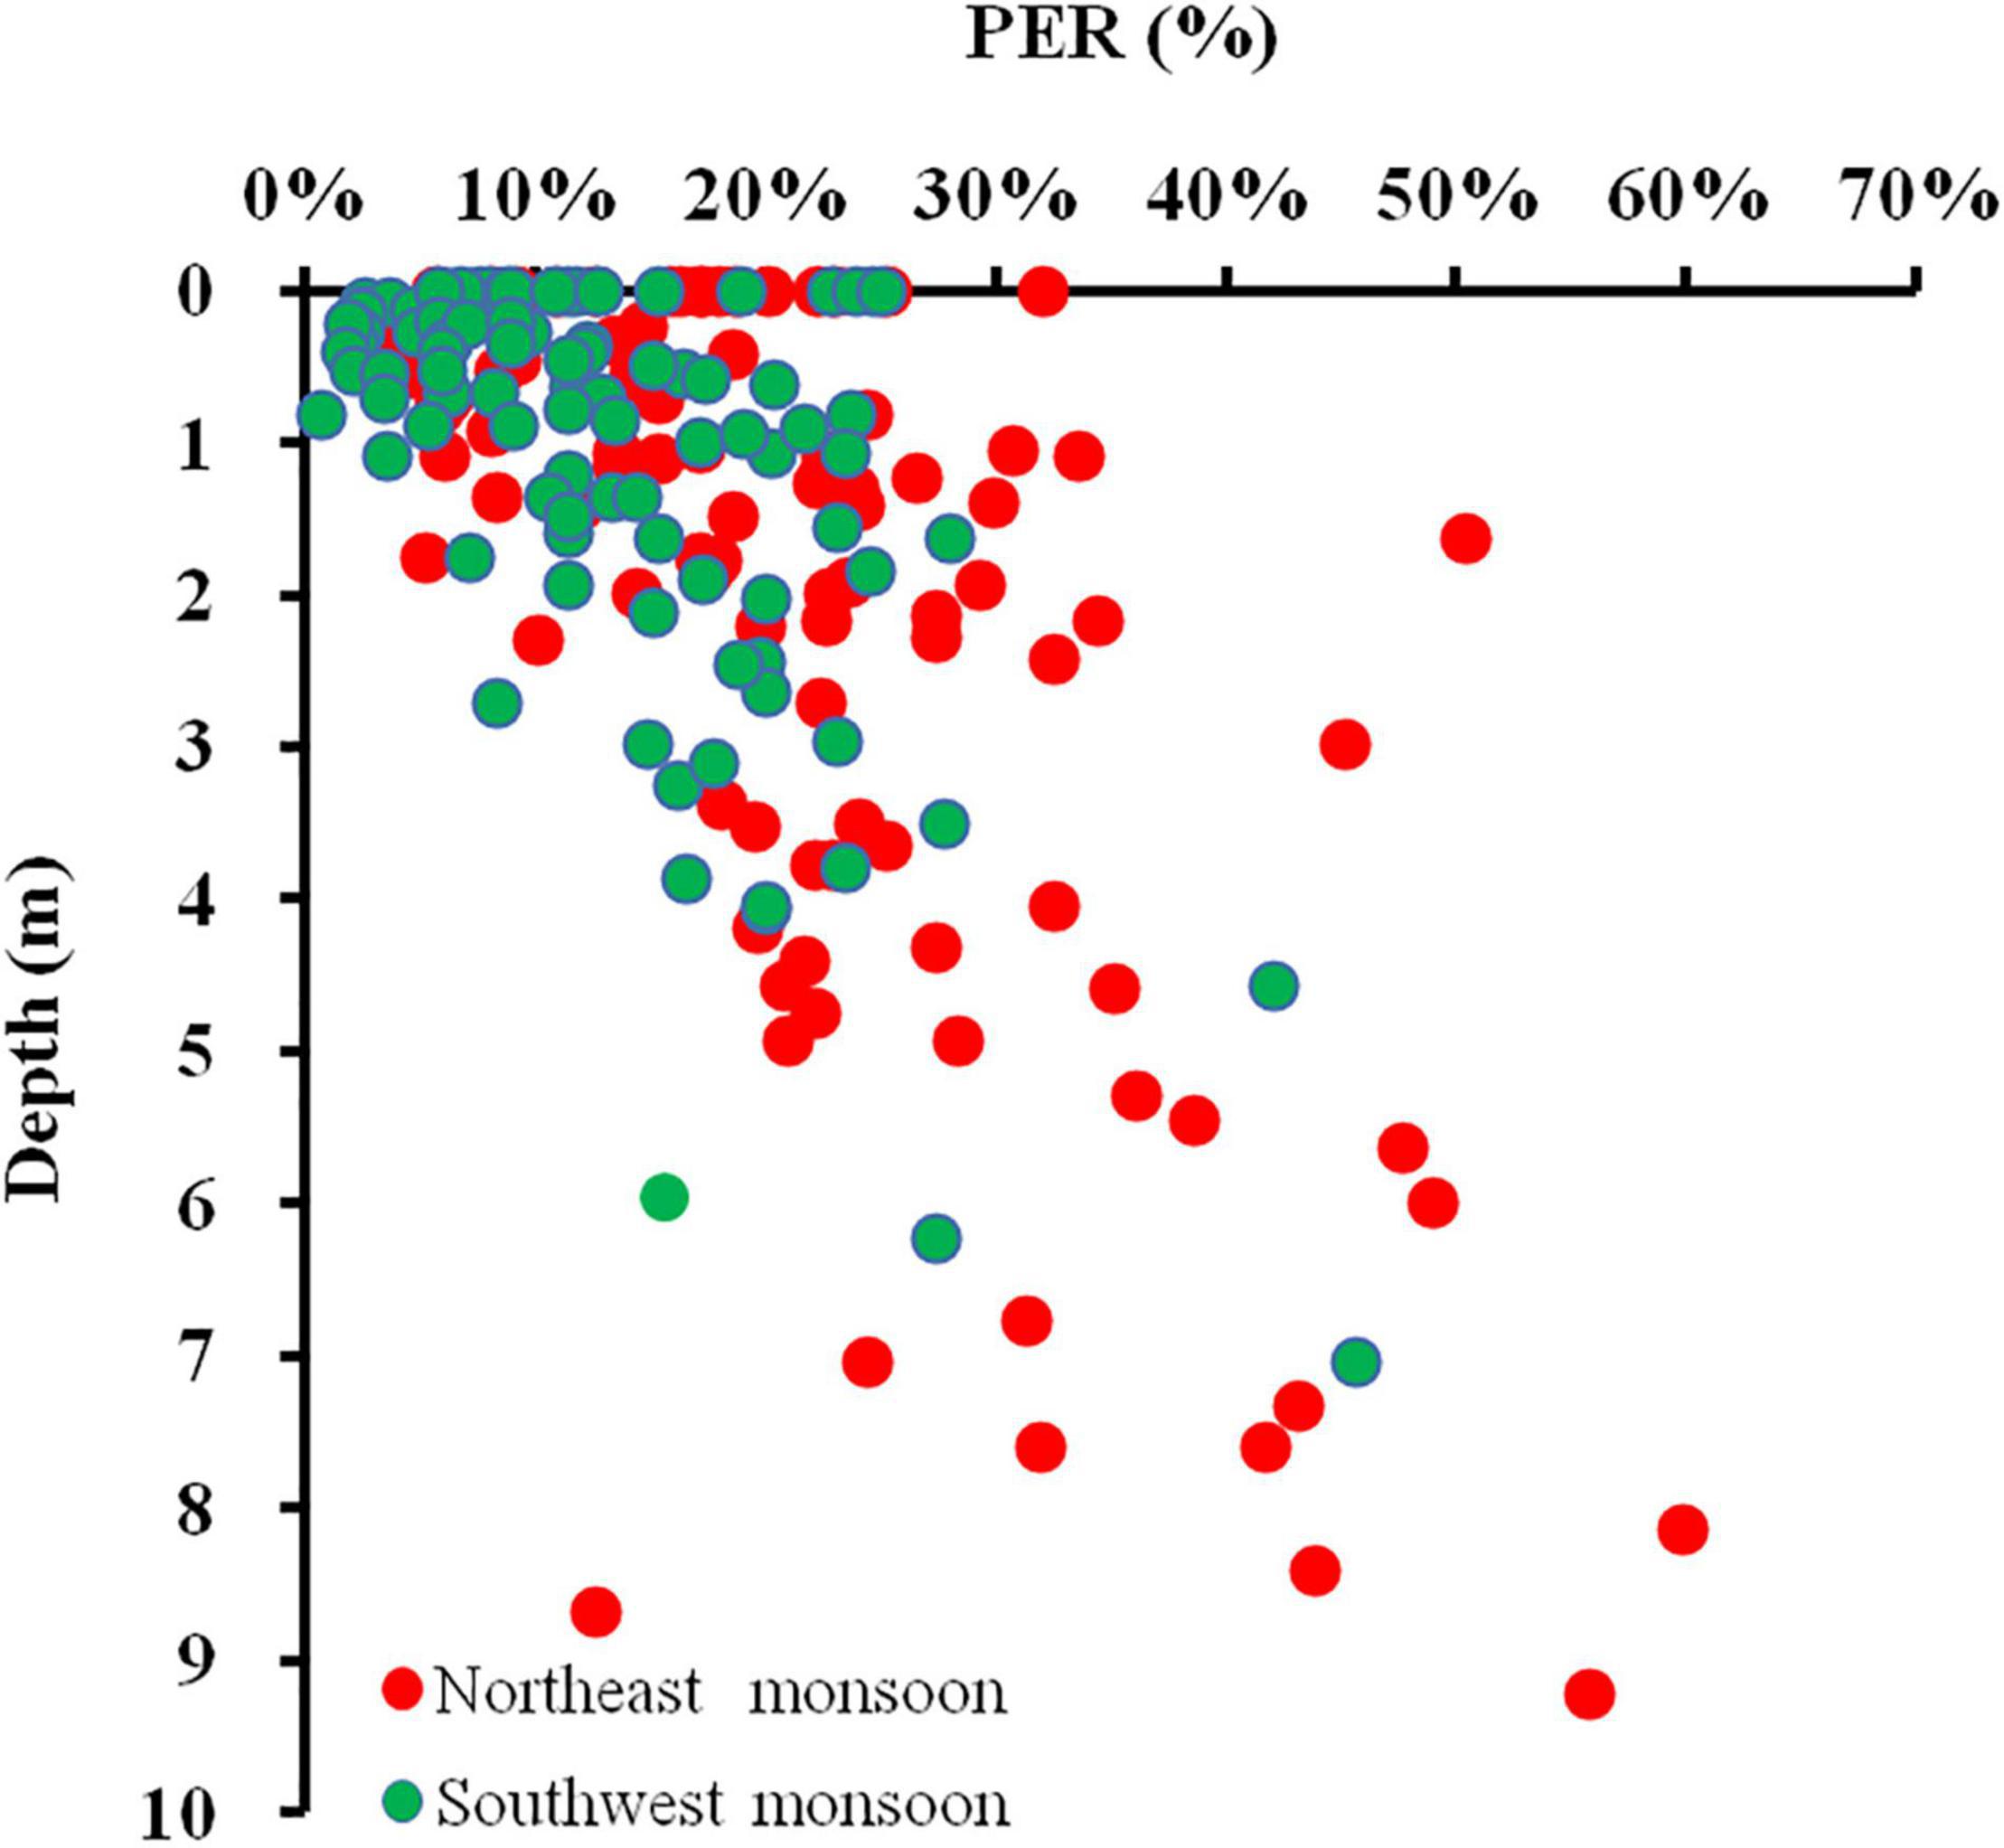
Figure 11. Relationship between in-depth and volumetric PER for all DOC production experiments conducted in the Qinzhou Bay.
In fact, not only does low light irradiance induce an increase in PER, but PER will also increase significantly under conditions of high irradiance that produce photoinhibition, as a result of a combination of the decreased photosynthetic rates and the increased PDOC release. It has been shown that the photorespiratory effect may increase the release of ethanolic acid under the combined conditions of high light intensity and low CO2:O2 ratio (Harris et al., 1980), and this effect not only reduces the potential damage to the photosynthetic apparatus caused by high oxygen concentrations but also promotes an increase in PDOC release. 14C radiotracer studies demonstrate short-term increases in DO14C in response to variability in irradiance, and subsequent bacterial uptake (Cherrier et al., 2015).
Pearson correlation analysis of the field data indicated that PER was positive with Zeu (r = 0.89, p < 0.01) and negative with TUB (r = –0.86, p < 0.01) (Table 3), reflecting that good lighting conditions could lead to an increase in PDOC release. However, the results of the culture experiments showed that high PER was present not only in the high irradiance but also in the low irradiance (Figure 10C). In fact, except in the case of extremely strong or weak light, PER remained relatively constant over a wide range of light intensities (250–1,500 μmol/m2⋅s), with only small fluctuations in the absolute amount of PDOC released as the light intensity increased, which is consistent with most previous studies (Marañón et al., 2005). From the above completely contradictory results, we could not completely separate the influence of irradiance from the effect of other environmental factors such as temperature, salinity, nutrients differences in situ experiments, not to mention that depth also affects the distribution characteristics of the spectrum, which may have an important effect on DOC secretion.
The field results of this study showed a significant positive correlation between PER and DIN:DIP (r = 0.72, p < 0.01) and a significant negative correlation with DIN (r = –0.94, p < 0.01) or DIP. (r = –0.88, p < 0.01) (Table 3). Besides, significantly positive relationship (S. costatum: r = 0.893, p < 0.01; C. curvisetus: r = 0.906, p < 0.01) were also observed between PER and DIN:DIP in the lab experiments (Figure 10D). It has been indicated that the effect of nutrients on PDOC production is reflected in both the concentration and stoichiometry of available nutrients.
Under extreme DIN and DIP limitation, some specific marine algae use extracellular polysaccharide production as a major component of photosynthetic productivity (Myklestad, 1977), contributing to the forced increase in extracellular DOC production (Myklestad et al., 1972). DIN and DIP were much lower in the outer bay than in the inner bay, especially phosphate, which are easily absorbed by phytoplankton, were near the detection limit (Figure 3H). Significant decreases in cell growth and photosynthetic rates have been observed under conditions of nutrient depletion and cessation of cellular protein synthesis, and even under these conditions, phytoplanktons are still able to release DOC with high C:N ratios for a considerable period of time as long as the photosynthetic organelles are able to maintain operation (Hellebust, 1965). Our results have shown that the absolute PDOC release in the inner bay decreases in low nutrient conditions compared to the middle bay (Figure 3N), but still presents a relatively high PER (Figure 3R). In addition, PER was positively correlated with DIN:DIP (Table 3) indicating that the oligotrophic outer bay presented a higher PER compared to the eutrophic Maowei Sea (inner bay).
Some studies have shown that the higher PER was not only produced under conditions where DIN:DIP was much higher than the Redfield value, but also occurred when N:P was much lower than the Redfield value (Obernosterer and Herndl, 1995; Liu, 2012). In this study, the algal culture experiments were not designed to take into account the DIN limit since the DIN:DIP in the field monitoring area was not below the redfield ratio (16:1) in either season. Therefore, we were unable to confirm whether DIN:DIP below 16 promoted an increase in PER, but what we could confirm was that when the DIN:DIP in the inner bay is close to the Redfield ratio, the PER could remain relatively constant (6 ± 1%) during SW monsoon (Figure 3R). Compared to phytoplankton grown under equilibrium conditions (DIN:DIP = 16) in the lab experiments, phytoplankton with severe P limitation (DIN:DIP = 192) had a 6∼7-fold higher PER during phases in culture with two algae species. This stark contrast is also reflected in the monitoring area, where both DIN:DIP and PER were higher in the picophytoplankton-dominated outer bay (SW monsoon: DIN:DIP = 37.19 ± 2.54, PER = 29 ± 6%; NE monsoon: DIN:DIP = 96.58 ± 64.34, PER = 2% ± 4%) than that in the microphytoplankton-dominated inner bay (SW monsoon: DIN:DIP = 17.74 ± 2.62, PER = 5 ± 1%; NE monsoon: DIN:DIP = 24 ± 2.14, PER = 9 ± 3%), regardless of the season.
These results indicated that the trophic mechanism plays an important role in the release of PDOC, especially in areas with strong contrasting eutrophication and oligotrophication. Obernosterer and Herndl (1995) studied the North Adriatic Sea and found that non-parasitic phytoplankton obtained relatively high PER rates (80%) in the presence of an imbalance in the DIN:DIP ratio, while exhibiting much lower PER rates (30%) in the presence of a more balanced DIN:DIP ratio (DIN:DIP = 13) in the inorganic nutrient pool (Bochdansky and Herndl, 1992). Our experimental results coincide with the above view. As discussed above, an important factor influencing PDOC production includes DIN:DIP, which was also shown to contribute to the stepwise regression analysis.
The mean PDOC for the entire Qinzhou bay was found to be 1.77 mgC/m3⋅h. On an annual basis, the average PDOC was 15% of TPP, which satisfies about 25% of the carbon requirement by heterotopic bacteria in the bay. Spatial and temporal changes in PDOC production rates closely resembled the distribution of total primary production. Multiple environmental parameters were important factors explaining the biogeographic variations of PER, whereas salinity and nutrient stoichiometry explained relatively more, and both our in situ and lab experiments provided support to this view. The non-linear relationship between PDOC and BCD found in this study and others (e.g., Morán et al., 2001, 2002; López-Sandoval et al., 2011), potentially indicates weak coupling between phytoplankton exudation and bacterial metabolism. This weak coupling implies that, in the Qinzhou bay, other DOC sources e.g., terrestrial sources (Kim et al., 2020), sloppy feeding (Johnston et al., 2021), and so on, are required to support bacterial respiratory requirements, which has even been concluded from coastal sites in the Arctic (Poulton et al., 2016) and Antarctic (Morán et al., 2002).
There is still a non-uniform conclusion on the relationship between PER and TPP, either temporally or spatially, as in the case of earlier studies (Teira et al., 2001; Marañón et al., 2005). To objectively evaluate the relationship between TPP and PER, we need more data from a large number of areas with large gradients of primary productivity, comparisons between eutrophic and oligotrophic waters and Spatio-temporal distributions, and not to be limited to nearshore waters and horizontal gradients, but also to open waters and profiles. Besides, the results in situ and experiments in the laboratory both indicated that phytoplankton cells with smaller particle sizes tended to be released relatively more DOC. Many scholars attribute this to the increased surface area to volume ratio of small cells (Teira et al., 2001; Poulton et al., 2016), as this property is favorable for the passive diffusion across the membrane of low-molecular-weight metabolites. Our study emphasized the role of trophic mechanisms in explaining the relatively high DOC release rates measured in oligotrophic picophytoplankton-dominated waters.
The raw data supporting the conclusions of this article will be made available by the authors, without undue reservation.
JK: conceptualization, data curation, investigation, cultured experiment, methodology, writing–original draft, funding acquisition, and project administration. ZL: conceptualization, funding acquisition, supervision, and validation. HM: writing–review and editing. YL: investigation and formal analysis. SH: data curation and cultured experiment. YW: data analysis, writing–original draft, and visualization. WL: conceptualization, investigation, and methodology. All authors contributed to the article and approved the submitted version.
This work was funded by the Scientific Research Foundation of Third Institute of Oceanography, MNR (Nos. 2015005 and 2020017), the National Natural Science Foundation of China (Nos. 41506136 and 41806154), the National Key Research and Development Program of China (2019YFE0124700), and the Open Research Fund Program of Guangxi Key Lab of Mangrove Conservation and Utilization (No. GKLMC-201901).
The authors declare that the research was conducted in the absence of any commercial or financial relationships that could be construed as a potential conflict of interest.
All claims expressed in this article are solely those of the authors and do not necessarily represent those of their affiliated organizations, or those of the publisher, the editors and the reviewers. Any product that may be evaluated in this article, or claim that may be made by its manufacturer, is not guaranteed or endorsed by the publisher.
We sincerely appreciate the constructive comments and suggestions of the reviewers.
Azam, F., Fenchel, T., Field, J. G., Gray, J. S., Meyer-Reil, L. A., and Thingstad, F. (1983). The ecological role of water-column microbes in the sea. Mar. Ecol. Prog. Ser. 10, 257–263. doi: 10.1126/science.1175309
Baines, S. B., and Pace, M. L. (1991). The production of dissolved organic matter by phytoplankton and its importance to bacteria: patterns across marine and freshwater systems. Limnol. Oceanogr. 36, 1078–1090. doi: 10.2307/2837458
Bell, R. T., and Kuparinen, J. (1984). Assessing phytoplankton and bacterioplankton production during early spring in Lake Erken, Sweden. Appl. Environ. Microbiol. 48, 1221–1230. doi: 10.1128/aem.48.6.1221-1230.1984
Berman, T., and Holm-Hansen, O. (1974). Release of photoassimilated carbon as dissolved organic matter by marine phytoplankton. Mar. Biol. 28, 305–310. doi: 10.1007/BF00388498
Biddanda, B., and Benner, R. (1997). Carbon, nitrogen, and carbohydrate fluxes during the production of particulate and dissolved organic matter by marine phytoplankton. Limnol. Oceanogr. 42, 506–518. doi: 10.4319/lo.1997.42.3.0506
Biddanda, B., Opsahl, S., and Benner, R. (1994). Plankton respiration and carbon flux through bacterioplankton on the Louisiana shelf. Limnol. Oceanogr. 39, 1259–1275. doi: 10.4319/lo.1994.39.6.1259
Bjornsen, P. K. (1988). Phytoplankton exudation of organic matter: why do healthy cells do it? Limnol. Oceanogr. 33, 151–154. doi: 10.4319/lo.1988.33.1.0151
Bochdansky, A. B., and Herndl, G. J. (1992). Ecology of amorphous aggregations (marine snow) in the northern adriatic sea. v. role of fecal pellets in marine snow. Mar. Ecol. Prog. Ser. 89, 297–303. doi: 10.3354/meps089297
Boulion, V. V. (2021). Extracellular phytoplankton production and its importance for heterotrophic activity of bacteria. Biol. Bull. 48, 358–366. doi: 10.1134/s1062359021030043
Carlson, C. A., and Hansell, D. A. (2015). “DOM sources, sinks, reactivity and budgets,” in Biogeochemistry of Marine Dissolved Organic Matter, 2nd Edn, eds D. A. Hansell and C. A. Carlson (Amsterdam: Academic Press), 65–126. doi: 10.1016/B978-0-12-405940-5.00003-0
Carritt, D. E., and Carpenter, J. H. (1966). Comparison and evaluation of currently employed modifications of the Winkler method for determining dissolved oxygen in seawater; a NASCO Report. J. Mar. Res. 24, 286–319.
Chen, T. Y., Lai, C. C., Shiah, F. K., and Gong, G. C. (2020). Dissolved and particulate primary production and subsequent bacterial C consumption in the southern East China Sea. Front. Mar. Sci. 7:713. doi: 10.3389/fmars.2020.00713
Cherrier, J., Valentine, S., Hamill, B., Jeffrey, W. H., and Marra, J. F. (2015). Light-mediated release of dissolved organic carbon by phytoplankton. J. Mar. Syst. 147, 45–51. doi: 10.1016/j.jmarsys.2014.02.008
Cole, J. J., Findlay, S., and Pace, M. L. (1988). Bacterial production in fresh and saltwater ecosystems: a cross-system overview. Mar. Ecol. Prog. Ser. 43, 1–10. doi: 10.3354/meps043001
Cole, J. J., Likens, G. E., and Strayer, D. L. (1982). Photosynthetically produced dissolved organic-carbon and important carbon source for planktonic bacteria. Limnol. Oceanogr. 27, 1080–1090. doi: 10.4319/lo.1982.27.6.1080
del Giorgio, P. A., and Cole, J. J. (1998). Bacterial growth efficiency in natural aquatic systems. Annu. Rev. Ecol. Syst. 29, 503–541. doi: 10.1146/annurev.ecolsys.29.1.503
Durham, B. P., Boysen, A. K., Carlson, L. T., Groussman, R. D., Heal, K. R., Cain, K. R., et al. (2019). Sulfonate-based networks between eukaryotic phytoplankton and heterotrophic bacteria in the surface ocean. Nat. Microbiol. 4, 1706–1715. doi: 10.1038/s41564-019-0507-5
Edler, L., and Elbrächter, M. (2010). “The Utermöhl method for quantitative phytoplankton analysis,” in Microscopic and Molecular Methods for Quantitative Phytoplankton Analysis, eds B. Karlson, C. Cusack, and E. Bresnan (Paris: UNESCO), 13–20.
Elena García-Martín, E., Daniels, C. J., Davidson, K., Davis, C. E., Mahaffey, C., Mayers, K. M. J., et al. (2017). Seasonal changes in plankton respiration and bacterial metabolism in a temperate Shelf Sea. Prog. Oceanogr. 177:101884. doi: 10.1016/j.pocean.2017.12.002
Engel, A., Händel, N., Wohlers, J., Lunau, M., Grossart, H. P., Sommer, U., et al. (2011). Effects of sea surface warming on the production and composition of dissolved organic matter during phytoplankton blooms: results from a mesocosm study. J. Plankton Res. 33, 357–372. doi: 10.1093/plankt/fbq122
Erin, E. L., Brando, V., Campbell, G., Dekker, A., and Malthus, T. (2015). The relationship between dissolved organic matter absorption and dissolved organic carbon in reservoirs along a temperate to tropical gradient. Remote Sens. Environ. 156, 395–402. doi: 10.1016/j.rse.2014.09.022
Fogg, G. E. (1983). The ecological significance of extracellular products of phytoplankton photosynthesis. Bot. Mar. 26, 3–14. doi: 10.1515/botm.1983.26.1.3
Fogg, G. E., Nalewajko, C., and Watt, W. D. (1965). Extracellular products of phytoplankton photosynthe sis. Proc. R. Soc. Lond. Ser. B Biol. Sci. 162, 517–534. doi: 10.1098/rspb.1965.0054
Fogg, G. E., and Watt, W. D. (2020). “The kinetics of release of extracellular products of photosynthesis by phytoplankton,” in Primary Productivity in Aquatic Environments, ed. C. R. Goldman (Berkeley, CA: University of California Press), 165–174. doi: 10.1525/9780520318182-013
Garcia, H. E., and Gordon, L. I. (1992). Oxygen solubility in seawater: better fitting equations. Limnol. Oceanogr. 37, 1307–1312. doi: 10.2307/2837876
Grande, K. D., Williams, P. J. L., Marra, J., Purdie, D. A., Heinemann, K., Eppley, R. W., et al. (1989). Primary production in the North Pacific gyre: a comparison of rates determined by the 14C, O2 concentration and 18O methods. Deep Sea. Res. A 36, 1621–1634. doi: 10.1016/0198-0149(89)90063-0
Grasshoff, K., Kremling, K., and Ehrhardt, M. (2009). Methods of Seawater Analysis, 3rd Edn. Cambridge: Wiley-VCH, 1–632.
Grossart, H., Massana, R., McMahon, K. D., and Walsh, D. A. (2019). Linking metagenomics to aquatic microbial ecology and biogeochemical cycles. Limnol. Oceanogr. 65, S2–S20. doi: 10.1002/lno.11382
Guillard, R. R. L., and Ryther, J. H. (1962). Studies of marine planktonic diatoms. I. Cyclotella nana Hustedt, and Detonula confervacea Gran. Can. J. Microbiol. 8, 229–239. doi: 10.1016/0011-7471(62)90036-0
Hagström, A., Azam, F., Andersson, A., Wikner, J., and Rassoulzadegan, F. (1988). Microbial loop in an oligotrophic pelagic marine ecosystem: possible roles of cyanobacteria and nanoflagellates in the organic fluxes. Mar. Ecol. Prog. Ser. 49, 171–178. doi: 10.3354/meps049171
Hama, T., and Yanagi, K. (2001). Production and neutral aldose composition of dissolved carbohydrates excreted by natural marine phytoplankton populations. Limnol. Oceanogr. 46, 1945–1955. doi: 10.4319/lo.2001.46.8.1945
Hansell, D. A. (2002). “DOC in the global ocean carbon cycle,” in Biogeochemistry of Marine Dissolved Organic Matter, eds D. A. Hansell and C. A. Carlson (San Diego, CA: Academic Press Inc), 685–715. doi: 10.1016/B978-012323841-2/50017-8
Harris, S., Balaban, R., and Mandel, L. (1980). Oxygen consumption and cellular ion transport: evidence for adenosine triphosphate to O2 ratio near 6 in intact cell. Science 208, 1148–1150. doi: 10.1126/science.6246581
Hasle, G. R., Syvertsen, E. E., Steidinger, K. A., and Tangen, K. (1996). Identiflying Marine Diatoms and Dinoflagellates. New York, NY: Academic Press.
Hellebust, J. A. (1965). Excretion of some organic compounds by marine phytoplankton. Limnol. Oceanogr. 10, 192–206. doi: 10.2307/2833124
Hellebust, J. A. (1974). “Extracellular products,” in Algal Physiology and Biochemistry, Vol. 10, ed. W. D. P. Stewart (Oxford: Blackwell Scientific Publications), 838–863.
Hobbie, J. E., Daley, R. J., and Jasper, S. (1977). Use of nuclepore filters for counting bacteria by fluorescent microscopy. Appl. Environ. Microbiol. 33, 1225–1228. doi: 10.1128/aem.33.5.1225-1228.1977
Horner, R. A. (2002). A Taxonomic Guide to Some Common Marine Phytoplankton. Bristol: Biopress Ltd, 1–189.
Huang, B. Q., Hong, H. S., and Wang, H. L. (1999). Size-fractionated primary productivity and the phytoplankton-bacteria relationship in the Taiwan Strait. Mar. Ecol. Prog. Ser. 183, 29–38. doi: 10.1007/s10872-013-0187-3
Jiao, N. Z., Herndl, G. J., Hansell, D. A., Benner, R., Kattner, G., Wilhelm, S. W., et al. (2010). Microbial production of recalcitrant dissolved organic matter: long-term carbon storage in the global ocean. Nat. Rev. Microbiol. 8, 593–599. doi: 10.1038/nrmicro2386
Jiao, N. Z., Tang, K., Cai, H. Y., and Mao, Y. J. (2011). Increasing the microbial carbon sink in the sea by reducing chemical fertilization on the land. Nat. Rev. Microbiol. 9, 75–75. doi: 10.1038/nrmicro2386-c2
Johnston, S. E., Finlay, K., Spencer, R. G., Butman, D. E., Metz, M., Striegl, R., et al. (2021). Zooplankton release complex dissolved organic matter to aquatic environments. Biogeochemistry 157, 313–325. doi: 10.1111/1462-2920.13944
Kang, J. H., Lin, Y. L., Wang, Y., and Lan, W. L. (2020). Assessment of the eutrophication level of the marine environment and its effect on phytoplankton chlorophyll a in Qinzhou Bay (in chinese). Ocean Dev. Manag. 11, 67–74.
Kanuri, V. V., Muduli, P. R., Robin, R. S., Kumar, B. C., Lovaraju, A., Ganguly, D., et al. (2013). Plankton metabolic processes and its significance on dissolved organic carbon pool in a tropical brackish water lagoon. Cont. Shelf Res. 61, 52–61. doi: 10.1016/j.csr.2013.04.006
Karl, D. M., Hebel, D. V., Bjorkman, K., and Letelier, R. M. (1998). The role of dissolved organic matter release in the productivity of the oligotrophic North Pacific Ocean. Limnol. Oceanogr. 43, 1270–1286. doi: 10.2307/2838976
Kim, B., An, S. U., Kim, T. H., and Hyun, J. H. (2020). Uncoupling between heterotrophic bacteria and phytoplankton and changes in trophic balance associated with warming of seawater in Gyeonggi Bay, Yellow Sea. Estuaries Coast. 43, 535–546. doi: 10.1007/s12237-019-00606-1
Kirchman, D. L. (2000). “Uptake and regeneration of inorganic nutrients by marine heterotrophic bacteria,” in Microbial Ecology of the Oceans, ed. D. L. Kirchman (New York, NY: Wiley-Liss), 1–27.
Kirchman, D. L., Keel, R. G., Simon, M., and Welschmeyer, N. A. (1993). Biomass and production of heterotrophic bacterioplankton in the oceanic subarctic Pacific. Deep Sea Res. 1 Oceanogr. Res. Pap. 40, 967–988. doi: 10.1016/0967-0637(93)90084-G
Lai, J. X., Jiang, F. J., Ke, K., Xu, M. B., Lei, F., and Chen, B. (2014). Nutrients distribution and trophic status assessment in the northern Beibu Gulf, China. Chin. J. Oceanol. Limnol. 32, 1128–1144. doi: 10.1007/s00343-014-3199-y
Larsson, U., and Hagström, Å (1982). Fractionated phytoplankton primary production, exudate release and bacterial production in a Baltic eutrophication gradient. Mar. Biol. 67, 57–70. doi: 10.1007/bf00397095
Lasternas, S., and Agustí, S. (2013). Bacterial survival governed by organic carbon release from senescent oceanic phytoplankton. Biogeosci. Discuss 10, 16973–16999.
Lee, Z., Weidemann, A., Kindle, J., Arnone, R., Carder, K. L., and Davis, C. (2007). Euphotic zone depth: its derivation and implication to ocean-color remote sensing. J. Geophys. Res. 112, C03009. doi: 10.1029/2006JC003802
Liu, C. G. (2012). Photosynthetically Produced Dissolved Organic Carbon Released of Marine Phytoplankton in China Coastal Seas (in Chinese). Qingdao: Ocean University of China, 1–101.
Livanou, E., Lagaria, A., Psarra, S., and Lika, K. (2017). Dissolved organic matter release by phytoplankton in the context of the dynamic energy budget theory. Biogeosci. Discuss. 1–33. doi: 10.5194/bg-2017-426
Livanou, E., Lagaria, A., Psarra, S., and Lika, K. (2019). A DEB-based approach of modeling dissolved organic matter release by phytoplankton. J. Sea Res. 143, 140–151. doi: 10.1016/j.seares.2018.07.016
Longhurst, A., Sathyendrantatll, S., Platt, T., and Caverhill, C. (1995). An estimate of global primary production in the ocean from satellite radiometer data. J. Plankton Res. 17, 1245–1271. doi: 10.1093/plankt/17.6.1245
López-Sandoval, D. C., Fernández, A., and Marañón, E. (2011). Dissolved and particulate primary production along a longitudinal gradients in the Mediterranean Sea. Biogeosciences 8, 815–825. doi: 10.5194/bg-8-815-2011
Mague, T. H., Friberg, E., Hughes, D. J., and Morris, I. (1980). Extracellular release of carbon by marine phytoplankton: a physiological approach. Limnol. Oceanogr. 25, 262–279. doi: 10.4319/lo.1980.25.2.0262
Malinsky-Rushansky, N. Z., and Legrand, C. (1996). Excretion of dissolved organic carbon by phytoplankton of different sizes and subsequent bacterial uptake. Mar. Ecol. Prog. Ser. 132, 249–255. doi: 10.3354/meps132249
Marañón, E., Cerme, O. P., Fernández, E., Rodríguez, J., and Zabala, L. (2004). Significance and mechanisms of photosynthetic production of dissolved organic carbon in a coastal eutrophic ecosystem. Limnol. Oceanogr. 49, 1652–1666. doi: 10.4319/lo.2004.49.5.1652
Marañón, E., Cermeño, P., and Perez, V. (2005). Continuity in the photosynthetic production of dissolved organic carbon from eutrophic to oligotrophic waters. Mar. Ecol. Prog. Ser. 299, 7–17. doi: 10.3354/meps299007
Meador, T. B., and Aluwihare, L. I. (2014). Production of dissolved organic carbon enriched in deoxy sugars representing an additional sink for biological C drawdown in the Amazon River plume. Glob. Biogeochem. Cycles 28, 1149–1161. doi: 10.1002/2013gb004778
Meador, T. B., Gogou, A., Spyres, G., Herndl, G. J., Krasakopoulou, E., Psarra, S., et al. (2010). Biogeochemical relationships between ultrafiltered dissolved organic matter and picoplankton activity in the Eastern Mediterranean Sea. Deep Sea Res. 2 Top. Stud. Oceanogr. 57, 1460–1477. doi: 10.1016/j.dsr2.2010.02.015
Morán, X. A. G., Estrada, M., Gasol, J. M., and Pedrós-Alió, C. (2002). Dissolved primary production and the strength of phytoplankton–bacterioplankton coupling in contrasting marine regions. Microb. Ecol. 44, 217–223. doi: 10.1007/s00248-002-1026-z
Morán, X. A. G., Gasol, J. M., Arin, L., and Estrada, M. (1999). A comparison between glass fiber and membrane filters for the estimation of phytoplankton POC and DOC production. Mar. Ecol. Prog. Ser. 187, 31–41. doi: 10.3354/meps187031
Morán, X. A. G., Gasol, J. M., Pedrós-Alió, C., and Estrada, M. (2001). Dissolved and particulate primary production and bacterial production in offshore Antarctic waters during austral summer: coupled or uncoupled? Mar. Ecol. Prog. Ser. 222, 25–39. doi: 10.3354/meps222025
Morán, X. A. G., Sebastián, M., PedrrÓs-AliÓ, C., and Estrada, M. (2006). Response of Southern Ocean phytoplankton and bacterioplankton production to short-term experimental warming. Limnol. Oceanogr. 51, 1791–1800. doi: 10.4319/lo.2006.51.4.1791
Myklestad, S. M. (1977). Production of carbohydrates by marine planktonic diatoms. II. Influence of the N:P ratio in the growth medium on the assimilation ratio, growth rate, and production of cellular and extracellular carbohydrates by Chaetoceros affinis var. willei (Gran) Hustedt and Skeletonema costatum (Grev.) Cleve. J. Exp. Mar. Biol. Ecol. 29, 161–179. doi: 10.1016/0022-0981(77)90046-6
Myklestad, S. M. (2000). “Dissolved organic carbon from phytoplankton,” in The Handbook of Environmental Chemistry. Volume, Part D: Marine Chemisty, ed. Wangersky (Heidelberg: Springer-Verlag), 111–148. doi: 10.1007/10683826_5
Myklestad, S. M., Haug, A., and Larsen, B. (1972). Production of carbohydrates by the marine diatom chaetoceros affinisvar.willei (gran) hustedt. II. Preliminary investigation of the extracellular polysaccharide. J. Exp. Mar. Biol. Ecol. 9, 137–144. doi: 10.1016/0022-0981(72)90042-1
Myklestad, S. M., Holm-Hansen, O., Varum, K. M., and Volcani, B. E. (1989). Rate of release of extracellular amino acids and carbohydrates from the marine diatom Chaetoceros affinis. J. Plankton Res. 11, 763–773. doi: 10.1093/plankt/11.4.763
Nagata, T. (2000). “Production mechanisms of dissolved organic matter,” in Microbial Ecology of the Oceans, ed. D. L. Kirchman (New York, NY: Wiley-Liss), 121–152.
Obernosterer, I., and Herndl, G. J. (1995). Phytoplankton extracellular release and bacterial growth: dependence on the inorganic N:P ratio. Mar. Ecol. Prog. Ser. 116, 247–257. doi: 10.3354/meps116247
Otto, S., and Balzer, W. (1998). Release of dissolved organic carbon (DOC) from sediments of the NW European Continental Margin (Goban Spur) and its significance for benthic carbon cycling. Prog. Oceanogr. 42, 127–144. doi: 10.1016/S0079-6611(98)00031-7
Parsons, T. R., Maitay, Y., and Lalli, C. M. (1984). A Manual of Chemical and Biological Methods for Seawater Analysis. Oxford: Pergamon Press, 1–184.
Peierls, B. L., and Paerl, H. W. (2011). Longitudinal and depth variation of bacterioplankton productivity and related factors in a temperate estuary. Estuar. Coast. Shelf Sci. 95, 207–215. doi: 10.1016/j.ecss.2011.08.033
Peterson, B. J. (1984). “Synthesis of carbon stocks and flows in the open ocean mixed layer,” in Heterotrophic Activity in the Sea, eds J. E. Hobbie and P. J. Williams (New York, NY: Plenum Press), 547–554. doi: 10.1007/978-1-4684-9010-7_24
Poulton, A. J., Daniels, C. J., Esposito, M., Humphreys, M. P., Mitchell, E., Ribas-Ribas, M., et al. (2016). Production of dissolved organic carbon by Arctic plankton communities: responses to elevated carbon dioxide and the availability of light and nutrients. Deep Sea Res. 2 Top. Stud. Oceanogr. 127, 60–74. doi: 10.1016/j.dsr2.2016.01.002
Qiao, X. D., Wang, B. D., Sun, X., and Liang, S. K. (2013). Numerical simulation of nutrient and phytoplankton dynamics in Guangxi coastal bays, China. J. Ocean Univ. China 13, 338–346. doi: 10.1007/s11802-014-2072-0
Rao, D. N., Chopra, M., Rajula, G. R., Durgadevi, D. S. L., and Sarma, V. V. S. S. (2021). Release of significant fraction of primary production as dissolved organic carbon in the Bay of Bengal. Deep Sea Res. 1 Oceanogr. Res. Pap. 168:103445. doi: 10.1016/j.dsr.2020.103445
Rich, J., Gosselin, M., Sherr, E., Sherr, B., and Kirchman, D. L. (1997). High bacterial production, uptake and concentrations of dissolved organic matter in the Central Arctic Ocean. Deep Sea Res. 2 Top. Stud. Oceanogr. 44, 1645–1663. doi: 10.1016/s0967-0645(97)00058-1
Robinson, C. (2008). “Heterotrophic bacterial respiration,” in Microbial Ecology of the Oceans, 2nd Edn, ed. D. L. Kirchman (Hoboken, NJ: Wiley-Blackwell), 289–325.
Sharp, J. H. (1977). Excretion of organic matter by marine phytoplankton: do healthy cells do it. Limnol. Oceanogr. 22, 381–399. doi: 10.4319/lo.1977.22.3.0381
Sharp, J. H. (1984). “Inputs into microbial food chains,” in Heterotrophic Activity in the Sea, eds J. E. Hobbie and P. J. L. Williams (New York, NY: Plenum Press), 101–120. doi: 10.1007/978-1-4684-9010-7_5
Shiozaki, T., Ijichi, M., Kodama, T., Takeda, S., and Furuya, K. (2014). Heterotrophic bacteria as major nitrogen fixers in the euphotic zone of the Indian Ocean. Glob. Biogeochem. Cycles 28, 1096–1110. doi: 10.1002/2014gb004886
Sieczko, A., Maschek, M., and Peduzzi, P. (2015). Algal extracellular release in river-floodplain dissolved organic matter: response of extracellular enzymatic activity during a post-flood period. Front. Microbiol. 6:80. doi: 10.3389/fmicb.2015.00080
Spilling, K., Fuentes-Lema, A., Quemaliños, D., Klais, R., and Sobrino, C. (2019). Primary production, carbon release, and respiration during spring bloom in the Baltic Sea. Limnol. Oceanogr. 64, 1779–1789. doi: 10.1002/lno.11150
Sukhanova, Z. N. (1978). “Settling without inverted microscope,” in Phytoplankton Manual, ed. A. Sourlna (Paris: UNESCO), 97.
Teira, E., Hernando-Morales, V., Fernández, A., Martínez-García, S., Álvarez-Salgado, X. A., Bode, A., et al. (2015). Local differences in phytoplankton-bacterioplankton coupling in the coastal upwelling off Galicia (NW Spain). Mar. Ecol. Prog. Ser. 528, 53–69. doi: 10.3354/meps11228
Teira, E., Pazó, M. J., and Fernández, E. (2001). Dissolved organic carbon production by microbial populations in the Atlantic ocean. Limnol. Oceanogr. 46, 1370–1377. doi: 10.2307/2670984
Teira, E., Pazó, M. J., Quevedo, M., Fuentes, M. V., and Fernández, E. (2003). Rates of dissolved organic carbon production and bacterial activity in the eastern North Atlantic subtropical gyre during summer. Mar. Ecol. Prog. Ser. 249, 53–67. doi: 10.3354/meps249053
Tomas, C. R. (1997). Identifying Marine Phytoplankton. New York, NY: Academic Press, 1–858. doi: 10.1016/B978-0-12-693018-4.X5000-9
Uchimiya, M., Schroer, W., Olofsson, M., Edison, A. S., and Moran, M. A. (2020). Diel investments in phytoplankton metabolite production influenced by associated heterotrophic bacteria. BioRxiv [Preprint] doi: 10.1101/2020.11.18.388827
Verity, P. G. (1981). Effects of temperature, irradiance, and daylength on the marine diatom Leptocylindrus danicus Cleve. I. Photosynthesis and cellular composition. J. Exp. Mar. Biol. Ecol. 55, 79–91. doi: 10.1016/0022-0981(81)90094-0
Viviani, D. A., Karl, D. M., and Church, M. J. (2015). Variability in photosynthetic production of dissolved and particulate organic carbon in the North Pacific Subtropical Gyre. Front. Mar. Sci. 2:73. doi: 10.3389/fmars.2015.00073
Vollenweider, R. A., and Nauwerck, A. (1961). Some observations on the C-14 method for measuring primary production: with 4 figures and 1 table in the text and on 1 folder. Int. Vereinigung Theoretische Angewandte Limnol. Verhandlungen 14, 134–139. doi: 10.1080/03680770.1959.11899259
Wiebe, W. J., and Smith, D. F. (1977). Direct measurement of dissolved organic carbon release by phytoplankton and incorporation by microheterotrophs. Mar. Biol. 42, 213–223. doi: 10.1007/BF00397745
Wu, W. C., Ren, L. L., Cai, X. D., and Wang, T. (2014). Spatial pattern and ecological risk of heavy metals in sediments from Maowei Sea, Southern China. Res. Environ. Sci. 27, 147–156.
Xu, Y. X., Zhang, T., and Zhou, J. (2019). Historical occurrence of algal blooms in the Northern Beibu Gulf of China and implications for future trends. Front. Microbiol. 10:451. doi: 10.3389/fmicb.2019.00451
Yentsch, C. S., and Menzel, D. W. (1963). A method for the determination of phytoplankton chlorophyll and phaeophytin by fluorescence. Deep Sea Res. Oceanogr. Abstr. 10, 221–231. doi: 10.1016/0011-7471(63)90358-9
Zhu, J. M., Zhang, Q., Huang, Y. N., Jiang, Y. P., Li, J., Michal, J. J., et al. (2021). Long-term trends of microplastics in seawater and farmed oysters in the Maowei Sea, China. Environ. Pollut. 273:116450. doi: 10.1016/j.envpol.2021.116450
Keywords: photosynthetically dissolved organic carbon, percentage of extracellular release, phytoplankton, heterotrophic bacteria, primary productivity
Citation: Kang J, Luo Z, Mohamed HF, Lin Y, Huang S, Wang Y and Lan W (2022) Environmental Regulation of Photosynthetically Produced Dissolved Organic Carbon by Phytoplankton Along a Subtropical Estuarine Bay. Front. Mar. Sci. 9:813401. doi: 10.3389/fmars.2022.813401
Received: 12 November 2021; Accepted: 24 February 2022;
Published: 28 March 2022.
Edited by:
Travis Blake Meador, Biology Centre (ASCR), CzechiaReviewed by:
Alexandria G. Hounshell, Virginia Tech, United StatesCopyright © 2022 Kang, Luo, Mohamed, Lin, Huang, Wang and Lan. This is an open-access article distributed under the terms of the Creative Commons Attribution License (CC BY). The use, distribution or reproduction in other forums is permitted, provided the original author(s) and the copyright owner(s) are credited and that the original publication in this journal is cited, in accordance with accepted academic practice. No use, distribution or reproduction is permitted which does not comply with these terms.
*Correspondence: Yu Wang, d2FuZ3l1QHRpby5vcmcuY24=; Wenlu Lan, ZHIubGFuQDEzOS5jb20=
Disclaimer: All claims expressed in this article are solely those of the authors and do not necessarily represent those of their affiliated organizations, or those of the publisher, the editors and the reviewers. Any product that may be evaluated in this article or claim that may be made by its manufacturer is not guaranteed or endorsed by the publisher.
Research integrity at Frontiers
Learn more about the work of our research integrity team to safeguard the quality of each article we publish.