 Alejandro Trujillo-González1*
 Teng Li2,3
 Joanne Potts4
 Simon Nicol1,4
 Valerie Allain4
 Sam C. Godwin1Elodie Vourey4
 Annie Portal4Brian Kumasi5Thomas Usu5Allen Rodrigo2,3
 Dianne Gleeson1
- 1Institute for Applied Ecology, Centre for Conservation Ecology and Genomics, University of Canberra, Canberra, ACT, Australia
- 2Research School of Biology, Australian National University, Canberra, ACT, Australia
- 3School of Biological Sciences, University of Auckland, Auckland, New Zealand
- 4Oceanic Fisheries Programme, Pacific Community, Noumea, New Caledonia
- 5Fisheries Management Business Unit, National Fisheries Authority, Port Moresby, Papua New Guinea
This preliminary study used DNA metabarcoding to test whether the stomach content and gut microbiome of tuna could be a viable near real-time monitoring tool for detecting composition and change in oceanic ecosystems. The gut content of skipjack (Katsuwonus pelamis, n=55) and yellowfin tuna (Thunnus albacares, n=46) captured in the Pacific Ocean during El Niño Southern Oscillation events (ENSO) between 2015-2017 were examined by high throughput sequencing and complemented by morphological assessments to identify fishes, crustaceans and cephalopods in the stomach content. Gut microbiome was examined solely by high throughput sequencing. Stomach content and gut microbiome were compared between tuna species, ENSO events and capture location using generalised linear models. The full model (tuna species, capture location and interaction with ENSO) best explained fish prey composition, while capture location and ENSO weakly explained the composition of crustaceans and cephalopods. Skipjack and yellowfin tuna captured near coastal areas (Longitude<170°W) showed a greater diversity of prey compared to fish captured in oceanic regions of the Pacific, while Thunnus albacares showed a much more diverse stomach content than K. pelamis (21 fish, eight cephalopods and six crustaceans). Fish captured during La Niña events showed higher prey diversity compared to fish captured during El Niño. Tuna species best explained differences in gut microbiome to the Phylum level, while no model explained gut microbiome differences to the Order or Family level. This preliminary study shows that capture location and ENSO events explained differences in stomach content of K. pelamis and T. albacares, while tuna species best explained gut microbiome assemblages to the Phylum level.
Introduction
Ocean warming and ecosystem change are serious threats to marine life and the livelihoods that are dependent upon them (García Molinos et al., 2016; Bryndum-Buchholz et al., 2018; Boyce et al., 2020). Developing surveillance tools that are climate responsive and capable of monitoring change in marine ecosystems are increasingly an important component of policies designed to increase the resilience of socio-economic and natural ecosystems to climate and environmental perturbations (Poloczanska et al., 2013; Tittensor et al., 2019). However, monitoring oceanic ecosystems has presented unique challenges due to difficulties inherent in observing these remote systems (Nicol et al., 2013).
The most expansive monitoring of oceanic ecosystems is typically satellite derived with below water processes inferred empirically from scant observation or from model estimates (Evans et al., 2015). Marine top predators have been proposed as an option for both direct and indirect observation of below surface ocean processes (Hazen et al., 2019) and likely to be responsive to climate and environmental change (Sergio et al., 2008; Sydeman et al., 2015; Hazen et al., 2019). The diets of predators can be used to obtain information on the composition of ecosystems (Young et al., 2015) and the chemical signatures stored from the habitats they occupy used to describe the biogeochemical environments of the ecosystem (Lorrain et al., 2019). Similarly, understanding how environmental changes and animal life history events affect the gut microbiomes of marine animals can provide important information to pre-empt and manage animal health and fitness (Egerton et al., 2018). Tuna are top order predators with broadly distributed fisheries (FAO, 2020) and are considered potential candidates as surrogate ecosystem samplers due to their diverse diets and habitat use (Lansdell and Young, 2006; Potier et al., 2007) and potential to harbour sentinel organisms in their gut (Egerton et al., 2018).
Stomach diet analyses have historically been reliant on sufficient material remaining intact in the stomach of sufficient samples to allow taxonomic identification and prey composition (Olson and Boggs, 1986; Lansdell and Young, 2006). In the case of tuna species, diets vary significantly among years, seasons, regions, and life stages (Van Beveren et al., 2017). For example, studies examining the diet composition of Atlantic bluefin tuna (Thunnus thunnus (Linnaeus, 1758)) captured in the Gulf of Lion in the Mediterranean Ocean have shown that most adult specimens had empty stomachs and that the area is an important feeding ground for juvenile T. thunnus (Varela et al., 2013), while other studies suggest that prey composition of adult T. thunnus is diverse but dominated by few species that differ among T. thunnus feeding grounds (Fromentin and Powers, 2005; Van Beveren et al., 2017). Similarly, Bigeye tuna (Thunnus obesus (Lowe, 1839)) have been shown to display opportunistic feeding strategies (Olson et al., 2016), with teleosts, cephalopods, and crustaceans being the three main diet groups consumed, teleosts being consistently reported to account for the highest proportion of the diet (Lin et al., 2020). Indeed, significant research is available on tuna diverse diets based on morphological assessments, however, this type of diet analysis can be affected by difficulties in identifying the digested prey remains (Nielsen et al., 2018).
In the same way, gut microbiomes studies traditionally relied on culture-dependent methods to explore fish intestinal microbiomes (Amann et al., 1995). Early studies explored the “intestinal flora” of commercially important fishes, examining how changes in salinity, diet, proliferation of infections and fish growth affected the abundance and diversity of fish intestinal microbiomes (Egerton et al., 2018), with early reviews suggesting that the bacterial levels in the gut of fish were low and appeared to be derived from the surrounding environment or diet (Cahill, 1990; Ringø et al., 1995), based on research using culture-dependent methods and limited to what bacteria could be isolated and cultured (Egerton et al., 2018).
Research on diet and gut microbiome composition has become more accessible through the advent of High Throughput Sequencing (HTS) technology and novel applications of biotechnology (Tarnecki et al., 2017; Egerton et al., 2018; Traugott et al., 2021; Luna et al., 2022). Stomach analyses using DNA metabarcoding can detect prey diversity in the absence of recognisable morphological remains (Pompanon et al., 2012; Deagle et al., 2013; De Barba et al., 2014) and gut microbiome can be assessed without the limitations of culture-based methods (Egerton et al., 2018). Studies have shown how marine top predators have potential to inform on prey assemblages (Goodwin et al., 2017; Bessey et al., 2019) and significant changes in host–microbiome dynamics have been shown be associated with environmental stressors, prey availability and seasonal changes (Burnett et al., 2007; Gómez and Balcázar, 2008; Llewellyn et al., 2014; Apprill, 2017; Egerton et al., 2018; Butt and Volkoff, 2019; Minich et al., 2020). Such observations have resulted in hypotheses that top predators, their diet, and associated microbiomes may possibly be indicators of ecosystem structure and change (Apprill, 2017; Walter et al., 2019). Temperature anomalies during ENSO events result in major ecosystem perturbations in Pacific Ocean altering the distribution of organisms (Lehodey et al., 2021) and oceanic habitats (Betts et al., 2021; Holbrook et al., 2021; Sprintall et al., 2021), with climate change projected to result in more severe ENSO events and more El Niño consistent environmental conditions (Bell et al., 2013).
This preliminary study documents the stomach microbiomes and stomach content of two tuna species in the Pacific Ocean: skipjack tuna, Katsuwonus pelamis (Linnaeus, 1758) and yellowfin tuna, Thunnus albacares (Bonnaterre, 1788) captured in different locations of the Pacific during El Niño Southern Oscillation (ENSO) events in 2015-2017. We assess whether such data, derived from tuna stomach content, could provide indicators of ecosystem change.
Materials and Methods
Sample Collection for Metabarcoding and Morphological Assessment
Tuna stomach samples of 55 skipjack (Katsuwonus pelamis) (TL ± S.D. = 520 ± 79.53 mm) and 41 yellowfin (Thunnus albacares) (TL ± S.D. = 523 ± 85.37 mm) tuna captured from the Pacific Ocean during 2015-2017 were accessed from the Pacific Marine Specimen Bank (https://www.spc.int/ofp/PacificSpecimenBank). This biobank was established to facilitate research to support the sustainable harvest of tuna in the Pacific Ocean and samples are accessioned into the biobank opportunistically. For this preliminary study samples were selected for analysis based on their associated metadata that document where (latitude and longitude) and when (date and time) specimens were collected during different ENSO events in the Pacific. Tuna specimens were captured using either longline, pole-and-line, purse seine or trolling methods. Longline used defrosted bait (unknown variety of fishes, but normally sardines and anchovies), while pole-and-line used live baits from each fishing area. Purse seine and trolling used no bait. All samples were stored in –20°C freezers and processed one by one in aseptic conditions within facilities of the Pacific Community. Each stomach was taken out of the freezer, defrosted without water at room temperature and cut open using a longitudinal incision using sterilised tools in a sterile enclosed area. Then, undigested carcasses and hard parts were removed, placed aside in a zip plastic bag and frozen at -20°C for later morphological identification. The entire surface area of the stomach lining was then scraped using the unsharpened side of a sterile scalpel, carefully placed inside a sterile 50 mL falcon tube, and then frozen at -20°C. Frozen stomach lining samples were then placed in dry ice and shipped for analysis to the University of Canberra in 2018 and kept at -20°C (Supplementary S1). The stomach lining content of each individual was then subject to DNA metabarcoding analysis to determine the stomach content and gut microbiomes of wild Katsuwonus pelamis and Thunnus albacares.
Partially digested carcasses and hard parts from each specimen were then morphologically identified using conventional methods in laboratory facilities of the Pacific Community to complement high throughput sequencing results. Remains could be identified as bait based on their low state of digestion and based on the fact that they matched the bait species used during the sampled fishing trips. Based on literature, each prey was classified as neritic (when related to coast, lagoon or reef as adults), neritic-oceanic (when using both domains as adults) or oceanic (when related to offshore area as adults). Identifications were undertaken to the lowest taxonomic level possible.
DNA Extraction and Amplification
Stomach lining samples collected from K. pelamis and T. albacares were defrosted and used for DNA extractions. The DNA extraction protocol followed the Qiagen DNeasy Blood & Tissue Kit protocol with minor modifications. Briefly, defrosted samples were centrifuged at 7,000 rpm to pellet all the material. Then, 60 µL Proteinase K and 560 µL buffer ATL were added to each sample and incubated at 56°C for one hour. After digestion, 560 µL of buffer AL was added to the samples after which the manufacturer’s protocol was followed. DNA yield and quality of each DNA extract was examined using a Nanodrop 2000 Spectrophotometer for the presence of inhibiting factors and contaminants.
PCR Amplification and Library Preparation
DNA was amplified using each selected primer pair (Table 1) to prepare libraries for Illumina sequencing. Real‐time PCRs were run with six technical replicates for each sample and each primer pair. Assays contained 13.5 µL Amplitaq Gold® 360 mastermix (1x), 4 µL UltraPure DNase/RNase-Free Distilled Water, 0.5 µL SYBR Green (1/2000), 1 µL of each primer pair (10 µM) and 5 µL of each extracted eDNA sample. Assays were all performed under the following fast cycling conditions (ramp rate = 2.70°C/sec): UDG incubation at 50°C for 2 min, initial denaturation at 95°C for 2 min, 40 cycles of 95°C denaturation for 15 sec then primer-specific annealing for 60 sec (Table 1), and terminal dissociation curve generation (60–95°C at 0.15°C/sec). All PCRs were run using an Applied biosystems Viia7 Real-Time PCR System (ThermoFisher Scientific, Australia). Negative control samples that exhibited positive amplification were included in the library preparation for HTS.
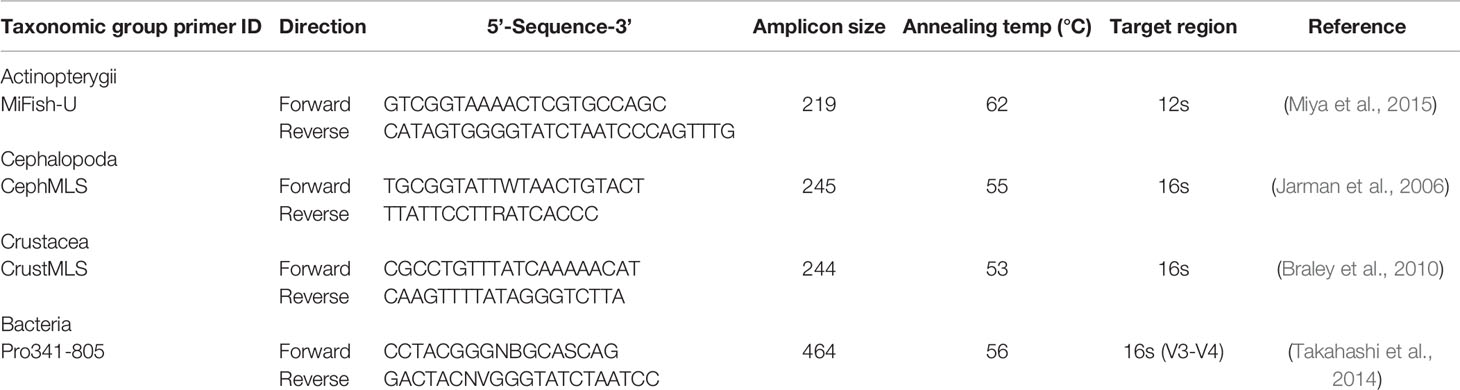
Table 1 Selected DNA metabarcoding primers designed for actinopterygian, cephalopod, crustacean, and bacteria species.
High-throughput sequencing Libraries for Actinopterygii (fish), Crustacea, and Cephalopoda were constructed using a one-step PCR amplification. Fusion tagged primers (FTP) were used to amplify the barcoding sequence and add technical sequences required for HTS in a single step. The forward FTP consisted of the P5 sequencing adaptor, a custom forward sequencing primer, a 7 bp Multiplex Identification (MID-) tag and the forward taxon specific primer (i.e., MiFish-U-F, CephMLS-F and CrustMLS-F). Similarly, the reverse FTP contained the P7 sequencing adaptor, a custom reverse sequencing primer, a 7 bp MID-tag and the reverse taxon specific primer (i.e., MiFish-U-R, CephMLS-R and CrustMLS-R). Unique combinations of forward and reverse MID-tags were used to uniquely label PCR amplicons of each sample. Triplicate PCR reactions were run for each unique primer combination and each sample using the reaction conditions and thermal cycling profile described previously. Amplicon libraries were pooled based on their average Ct-values for each primer pair. The volumes used to construct amplicon pools were determined based on the total number of positive PCR replicates per sample to ensure an equal representation of the amplicons from each sample. Amplicon library pools were cleaned using Agencourt AMPure XP Beads in a 1:2 volume ratio and amplicon concentrations for each pool were determined using a Qubit HS Assay.
Amplicons obtained from the MiFish-U primers were combined into a single library for sequencing, while amplicons obtained using CephMLS and CrustMLS were combined into a single library taking into consideration the numbers of samples for which libraries were constructed, the library concentrations and the expected length of each amplicon library. The HTS library for bacteria species was also prepared using a one-step PCR amplification, while both the forward and reverse amplification primers contained the Illumina adapters and Illumina sequencing primers. For this purpose, 5-base in-line barcodes were used to read the forward sequence and a 6-base indexing barcode was used for a dedicated indexing read. The final three libraries were sent to The Australian Cancer Research Foundation (ACRF) Biomolecular Resource Facility (BRF) at the Australian National University for paired-end sequencing on the MiSeq platform using the V3 2x300bp sequencing kit. All data can be accessed in Supplementary S2.
Bioinformatics Pipeline
Raw FASTQ files for the bacteria library were downloaded from the Illumina Basespace online platform and processed using QIIME2 (Bolyen et al., 2019). Paired-end reads with barcodes in-sequence were demultiplexed and primer sequences were trimmed from the reads using the q2-cutadapt plugin. Raw demultiplexed sequences were quality filtered and denoised with DADA2 in QIIME2 (Callahan et al., 2016), wherein forward and reverse reads were truncated to 260 bp and 200 bp, respectively. Following, MAFFT (Katoh et al., 2002) was employed to align all Amplicon Sequence Variants (ASVs) and the taxonomy was assigned to all ASVs using the q2-feature-classifier against the Naive Bayes classifier (Price et al., 2010), trained on the SILVA (132 release) reference database (Quast et al., 2012) with the trimmed sequences only include the 16S rRNA V3-V4 region sequenced in this study.
Raw FASTQ files obtained for the remaining three libraries (Actinopterygii, Crustacea and Cephalopoda) were downloaded from the Illumina Basespace online platform and processed following the MiFish pipeline (Sato et al., 2018)with modifications. Overall sequence quality was determined using FASTQC and low quality 3’-tails (Phred score < 10) were trimmed as per the MiFish pipeline. Then, sequences were paired following the MiFish pipeline. Reads that merged incorrectly or displayed PCR and sequencing errors were filtered from the analysis (i.e., Phred < 33, mismatched forward and reverse barcodes = PCR & sequencing error filtering). Then, the Cutadapt script was employed to demultiplex the reads with barcodes in-sequence, remove adapter and primer sequences from the paired reads (Martin, 2011), and filter paired sequences with the incorrect length (i.e. minimum length ≥ 190 bp for Actinopterygii, Crustacea and Cephalopoda). Lastly, Species-level taxonomic assignment was performed using UCLUST (Edgar, 2010) to cluster ASVs into Operational Taxonomic Units (OTUs) followed by identification using NCBI BLAST+ (Camacho et al., 2009). Blastn searches of these 3 libraries were conducted against the related reference database of MitoFish (Actinopterygii (Iwasaki et al., 2013), the National Centre for Biotechnology information (Crustacea) and The European Molecular Biology Laboratory (Cephalopoda) using a 98% identity cut-off and an e-value of 10-5 to remove unassigned OTUs from the analysis (i.e. unassigned read filtering). Taxonomic identity for each prey species was curated by checking each species valid name and distribution in the World Register of Marine Species: WoRMS (http://www.marinespecies.org/) and in the FishBase database (https://www.fishbase.se). Operational Taxonomic Units (OTU) with less than 1,000 total reads were excluded from the analysis. Further details can be found in Supplementary S3.
Data Analysis
Differences in stomach content (based on molecular results and morphological examination) and microbiome were compared between predator species, capture location and El Niño Southern Oscillation temperature anomalies (i.e., ENSO) in the Pacific. Molecular and stomach morphological assessment data were analysed within a model-based framework using the ‘manyglm’ function of the ‘mvabund’ package (v. 4.1.12) in R (v. 4.1.0) (R Core Team, 2021; Wang et al., 2012). This function fits a Generalised Linear Model to each response variable whilst correctly accounting for the correlations observed between the response variables (Supplementary S4).
The response variables for each dataset (bacteria, prey identified by metabarcoding, prey identified by morphology) were analysed based on presence/absence of each taxa within each sampled stomach (i.e., a binary logistic regression). Bacteria were analysed to the level of Phylum, Order and Family; while prey identified by metabarcoding were analysed to the level of Family and Species. Prey identified by morphology were analysed to the level of Family as the sometimes advanced state of digestion rarely allows to identify prey species at the genus or species level. Explanatory variables used in the model were predator species, longitude as a proxy of capture location and ENSO temperature anomalies. Temperature anomalies were calculated based on the ONI Oceanic Niño index (https://origin.cpc.ncep.noaa.gov/). Temperature anomalies ranged between -0.7 and 2.6 but was converted to binary, wherein all values less than -0.5 were determined as ‘low’ (La Niña) and all values greater than 0.5 were determined as ‘high’ (El Niño) ENSO temperature anomalies. Seven models were fit to each data type (Table 2) and model selection was based on Akaike Information Criterion (i.e., inference was based upon the model with the lowest AIC (Buckland et al., 1997).
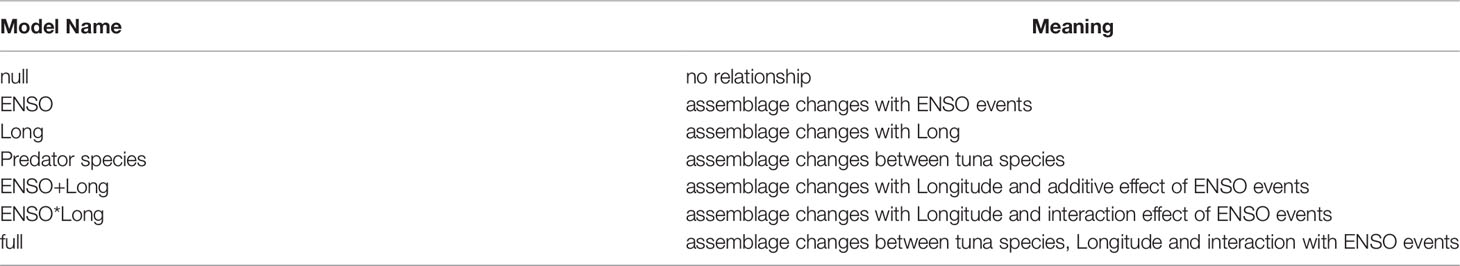
Table 2 Candidate model set used to analyse assemblage changes in gut microbiome (Bacteria) and stomach content (Actinopterygii, Cephalopoda and Crustacea) of tuna species captured in the Pacific during El Niño Southern Oscillation events.
Stomach content composition (i.e. number of unique species detected in the stomach content of each tuna species) was represented between tuna species, ENSO phase using the ‘plotweb’ function to visualize Tuna-prey interactions for each ENSO phase by clustering prey ASVs total reads above 1000 reads into OTUs. In the same way, prey diversity of tuna species and capture location was represented using the ‘ward.cluster’ function for hierarchical clustering of OTU total reads with a Log 10 transformation and mapped in R using latitude-longitude coordinates in decimal format to examine differences in stomach content composition by capture location (positive latitude in the north hemisphere, negative latitude in the south hemisphere and longitude on a 360 scale). High throughput sequencing results were complemented with morphological assessments by making comparisons at the prey Family level, using the number of identified prey families as a diversity index, and the frequency of occurrence of the prey taxa calculated by dividing the number of predator stomachs containing the prey of interest by the total number of non-empty stomachs.
Lastly, consensus phylogenetic trees were used to determine similarities between ASV sequences following curation of the most abundant groups of organisms in the stomach content of captured K. pelamis and T. albacares to assess predator-prey relationships. Sequences for bacteria, actinopterygians, cephalopods and crustaceans were aligned using ClustalW in MEGA (v. 10.1.7) (Kumar et al., 2018) and the best suited evolutionary model was determined in MEGA (Tamura, 1992). Nodal support for each tree was obtained using Bayesian analysis (MrBayes v. 3.2.7 (Ronquist et al., 2012) and Maximum Likelihood (MEGA v. 10.1.7). Trees were curated using the Interactive Tree of Life online phylogenetic software and rooted using closely related outgroup species (iTOL v.5 (Letunic and Bork, 2019). Phylogenetic trees are provided as a supplementary file for this research (Supplementary S5).
Results
Out of 96 collected stomach samples, a total of 88, 90, 25 and 17 fish stomach samples passed quality control and ASV read filtering for bacteria, actinopterygians, crustaceans and cephalopods, respectively. Out of these samples, a total of 14,053,270 (bacteria), 37,668,878 (actinopterygians), 12,903,281 (crustaceans) and 7,942,872 (cephalopods) curated and fully assigned reads were obtained using Illumina MiSeq, with a sequencing depth range of 1,926-404,877 for bacteria, 89,169-705,076 for actinopterygians, 1,802- 894,870 for cephalopods and 5,052-1,198,067 for crustaceans. Out of the 14,364,515 total sequence reads for bacteria, 4,273,304 sequence reads represented uncultured or ambiguous bacteria without taxonomic information. Similarly, out of the 37,642,984 total sequence reads for actinopterygians, 18,706,984 had a 100% similarity with Katsuwonus pelamis (GenBank Accession Number: KM605252) and 12,519,207 had a 100% similarity with Thunnus albacares (GenBank Accession Number: KY400011), indicating the amplification of host DNA. In addition, it was not possible to differentiate ASV detections of bait species commonly used to capture these tuna species from actual prey consumed by each specimen.
Factors Influencing Stomach Content Composition
Fish prey OTUs comprised the largest proportion of positive detections in the stomach content of K. pelamis and T. albacares specimens tested in this study (Figure 1). The full model (i.e, Assemblage changes between tuna species, Longitude and interaction with ENSO events) best explained differences in fish prey families and species detected in the stomach content of K. pelamis and T. albacares, however difference in AIC to the next model (with capture location only) was small and suggests uncertainty in model structure (Table 3). Symphysanodontidae, Pomacanthidae, Apogonidae, Chaetodontidae, Malacanthidae and Myctophidae species detected in K. pelamis and T. albacares decreased in presence probability with increasing longitude. Similarly, a total of 21 fish, eight cephalopods and six crustaceans species detected in the stomach content of T. albacares that were not detected in K. pelamis (Figure 1). Both K. pelamis and T. albacares captured during El Niño events preyed on Encrasicholina punctifer Fowler, 1938 in high abundance, while E. punctifer was not detected in either tuna species during La Niña (Figure 1). Fish captured during La Niña events showed a higher diversity of prey in their stomachs compared to fish captured during El Niño (Figure 1).
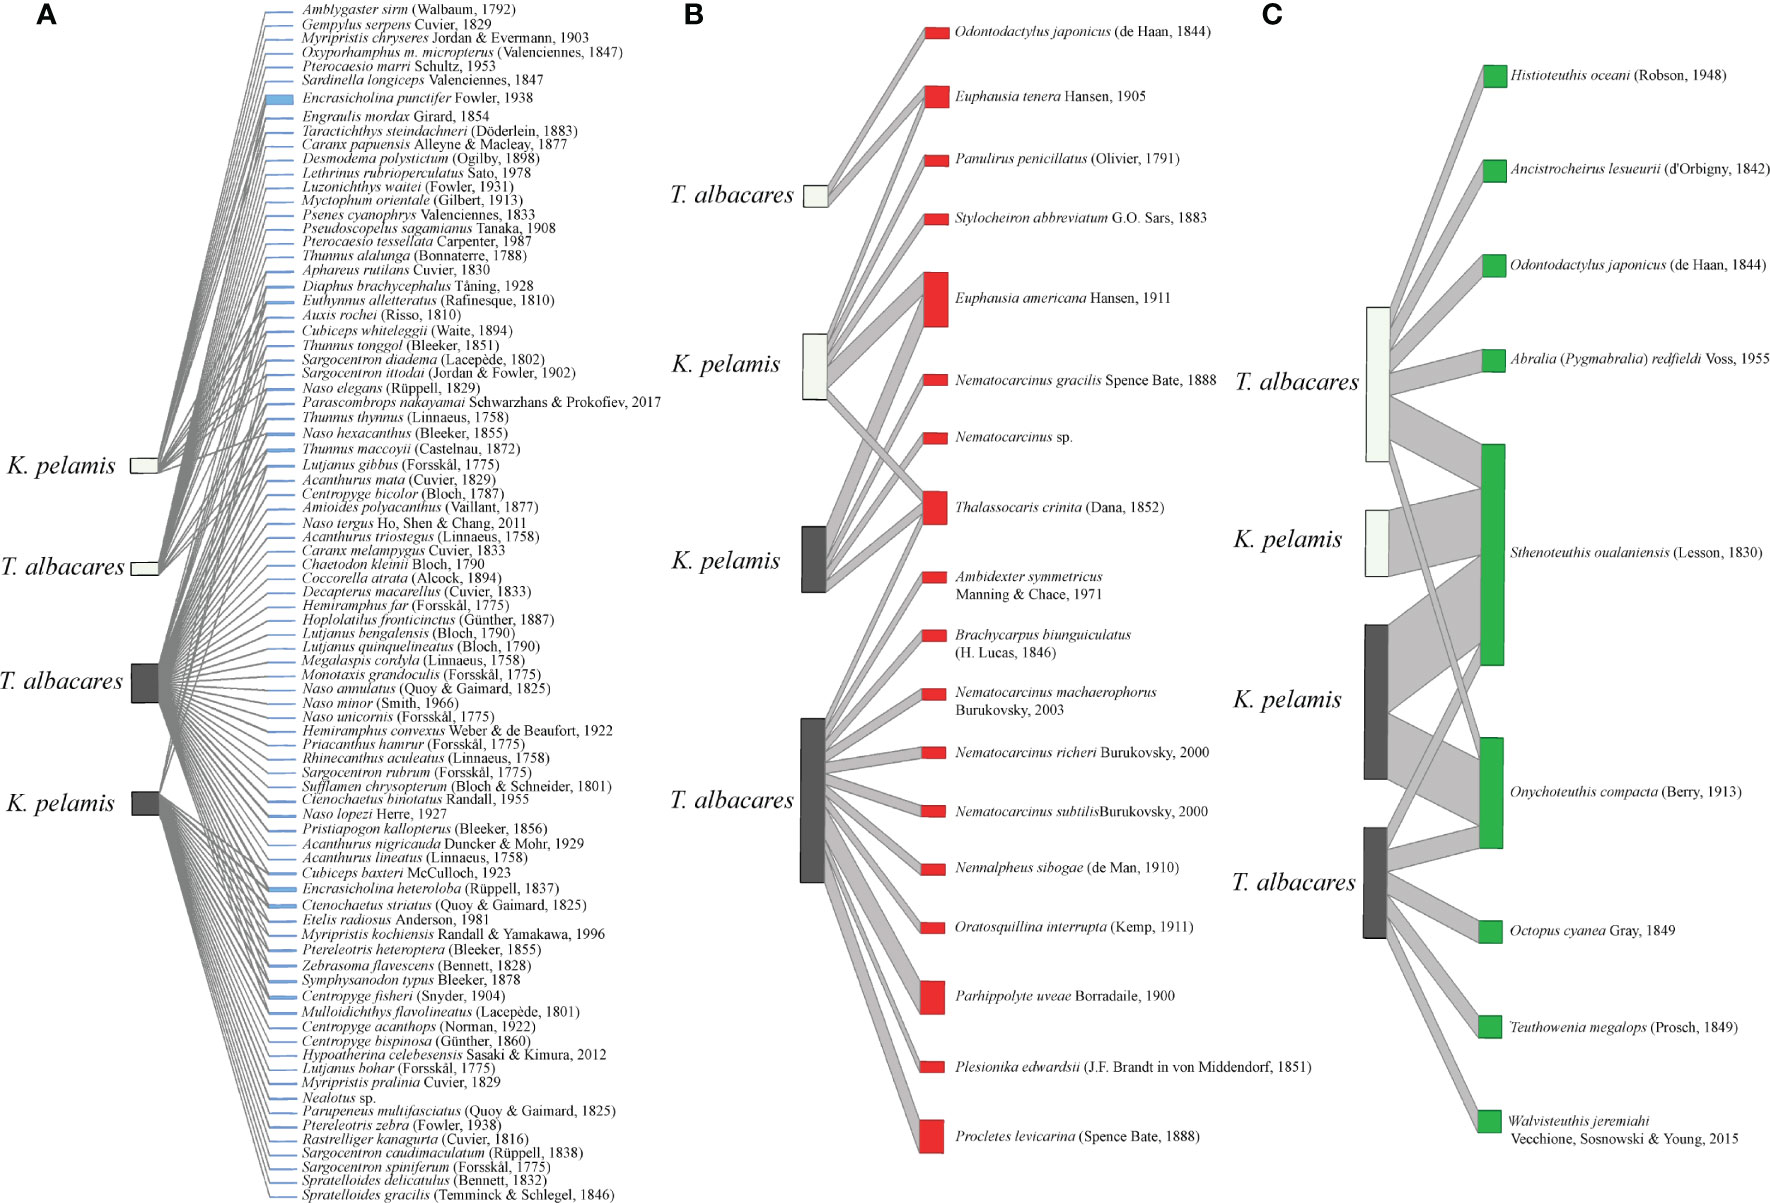
Figure 1 Species-level comparison of Actinopterygii (A), Crustacea (B) and Cephalopoda (C) prey species of Katsuwonus pelamis and Thunnus albacares captured during El Niño (dark grey) and La Niña (light grey) temperature oscillation events in 2015-2017. Operational Taxonomic Units (OTU) with less than 1,000 total reads were excluded from the analysis.
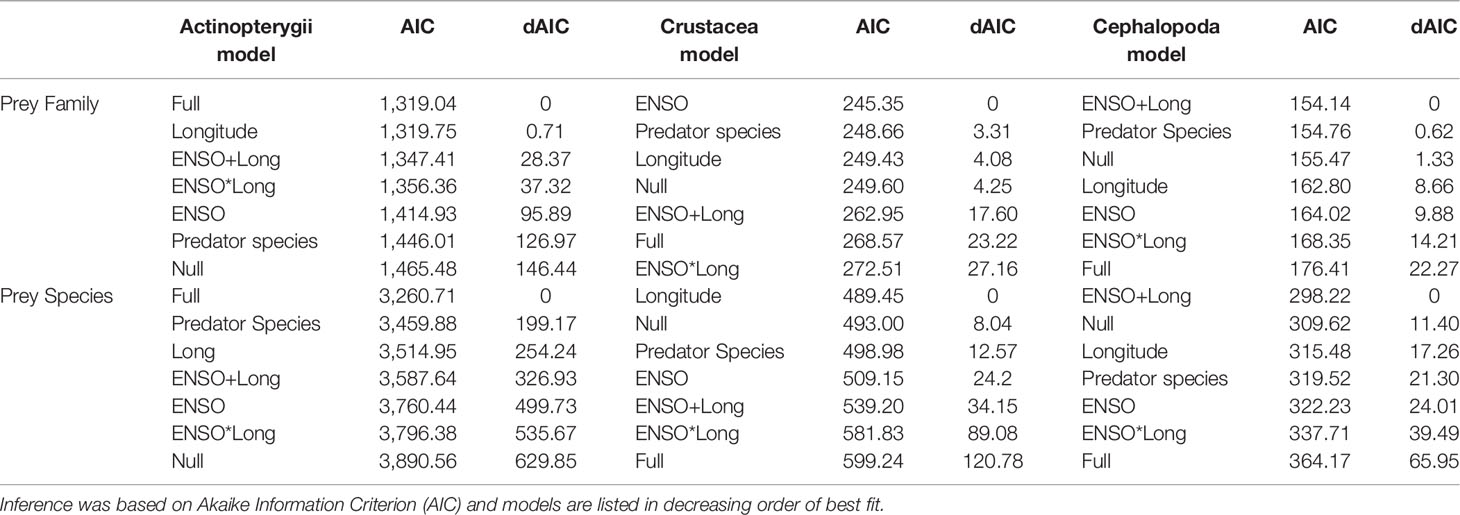
Table 3 Generalised linear model analyses used to explain differences in stomach content based on molecular data (Actinopterygii, Cephalopoda and Crustacea) to the family and species level in Katsuwonus pelamis and Thunnus pelamis captured in the Pacific during El Niño Southern Oscillation events (ENSO).
Both tuna species showed low detections for crustacean OTUs (Figure 1. Crustacean prey family composition were weakly explained by differences in ENSO phases and species composition was weakly explained by capture location (Table 3). Model selection for crustacea only differed by a few AIC points for the top ranked models (<5 AIC points) demonstrating that model structure uncertainty was high. Similar to crustaceans, cephalopod OTUs showed low detections in both tuna species. Cephalopod prey family and species composition were both weakly explained by differences in capture location with additive effects from ENSO (Table 3). Model structure uncertainty was also high for cephalopod.
Katsuwonus pelamis and T. albacares captured in Longitudes below 170°W showed a greater diversity of fishes and crustaceans compared to fish captured in oceanic regions of the Pacific (Figure 2). Three main clusters were found associated to prey composition; Cluster 1 was represented by K. pelamis and T. albacares captured near coastal areas, with a diverse number of fish (range= 9-37 species), crustacean (range= 1-8 species) and cephalopods (range= 0-4 species) (Figure 2). Cluster 2 was represented by 42 K. pelamis and six T. albacares with the lowest diversity, comprised by fish (range= 1-14 species) and crustaceans (range= 1-5 species). Lastly, cluster 3 was represented by two K. pelamis and 32 T. albacares which predominantly showed fish species (range= 4-21 species), crustaceans (range= 0-7 species) and cephalopods (range= 0-10 species) to a small degree (Figure 2).
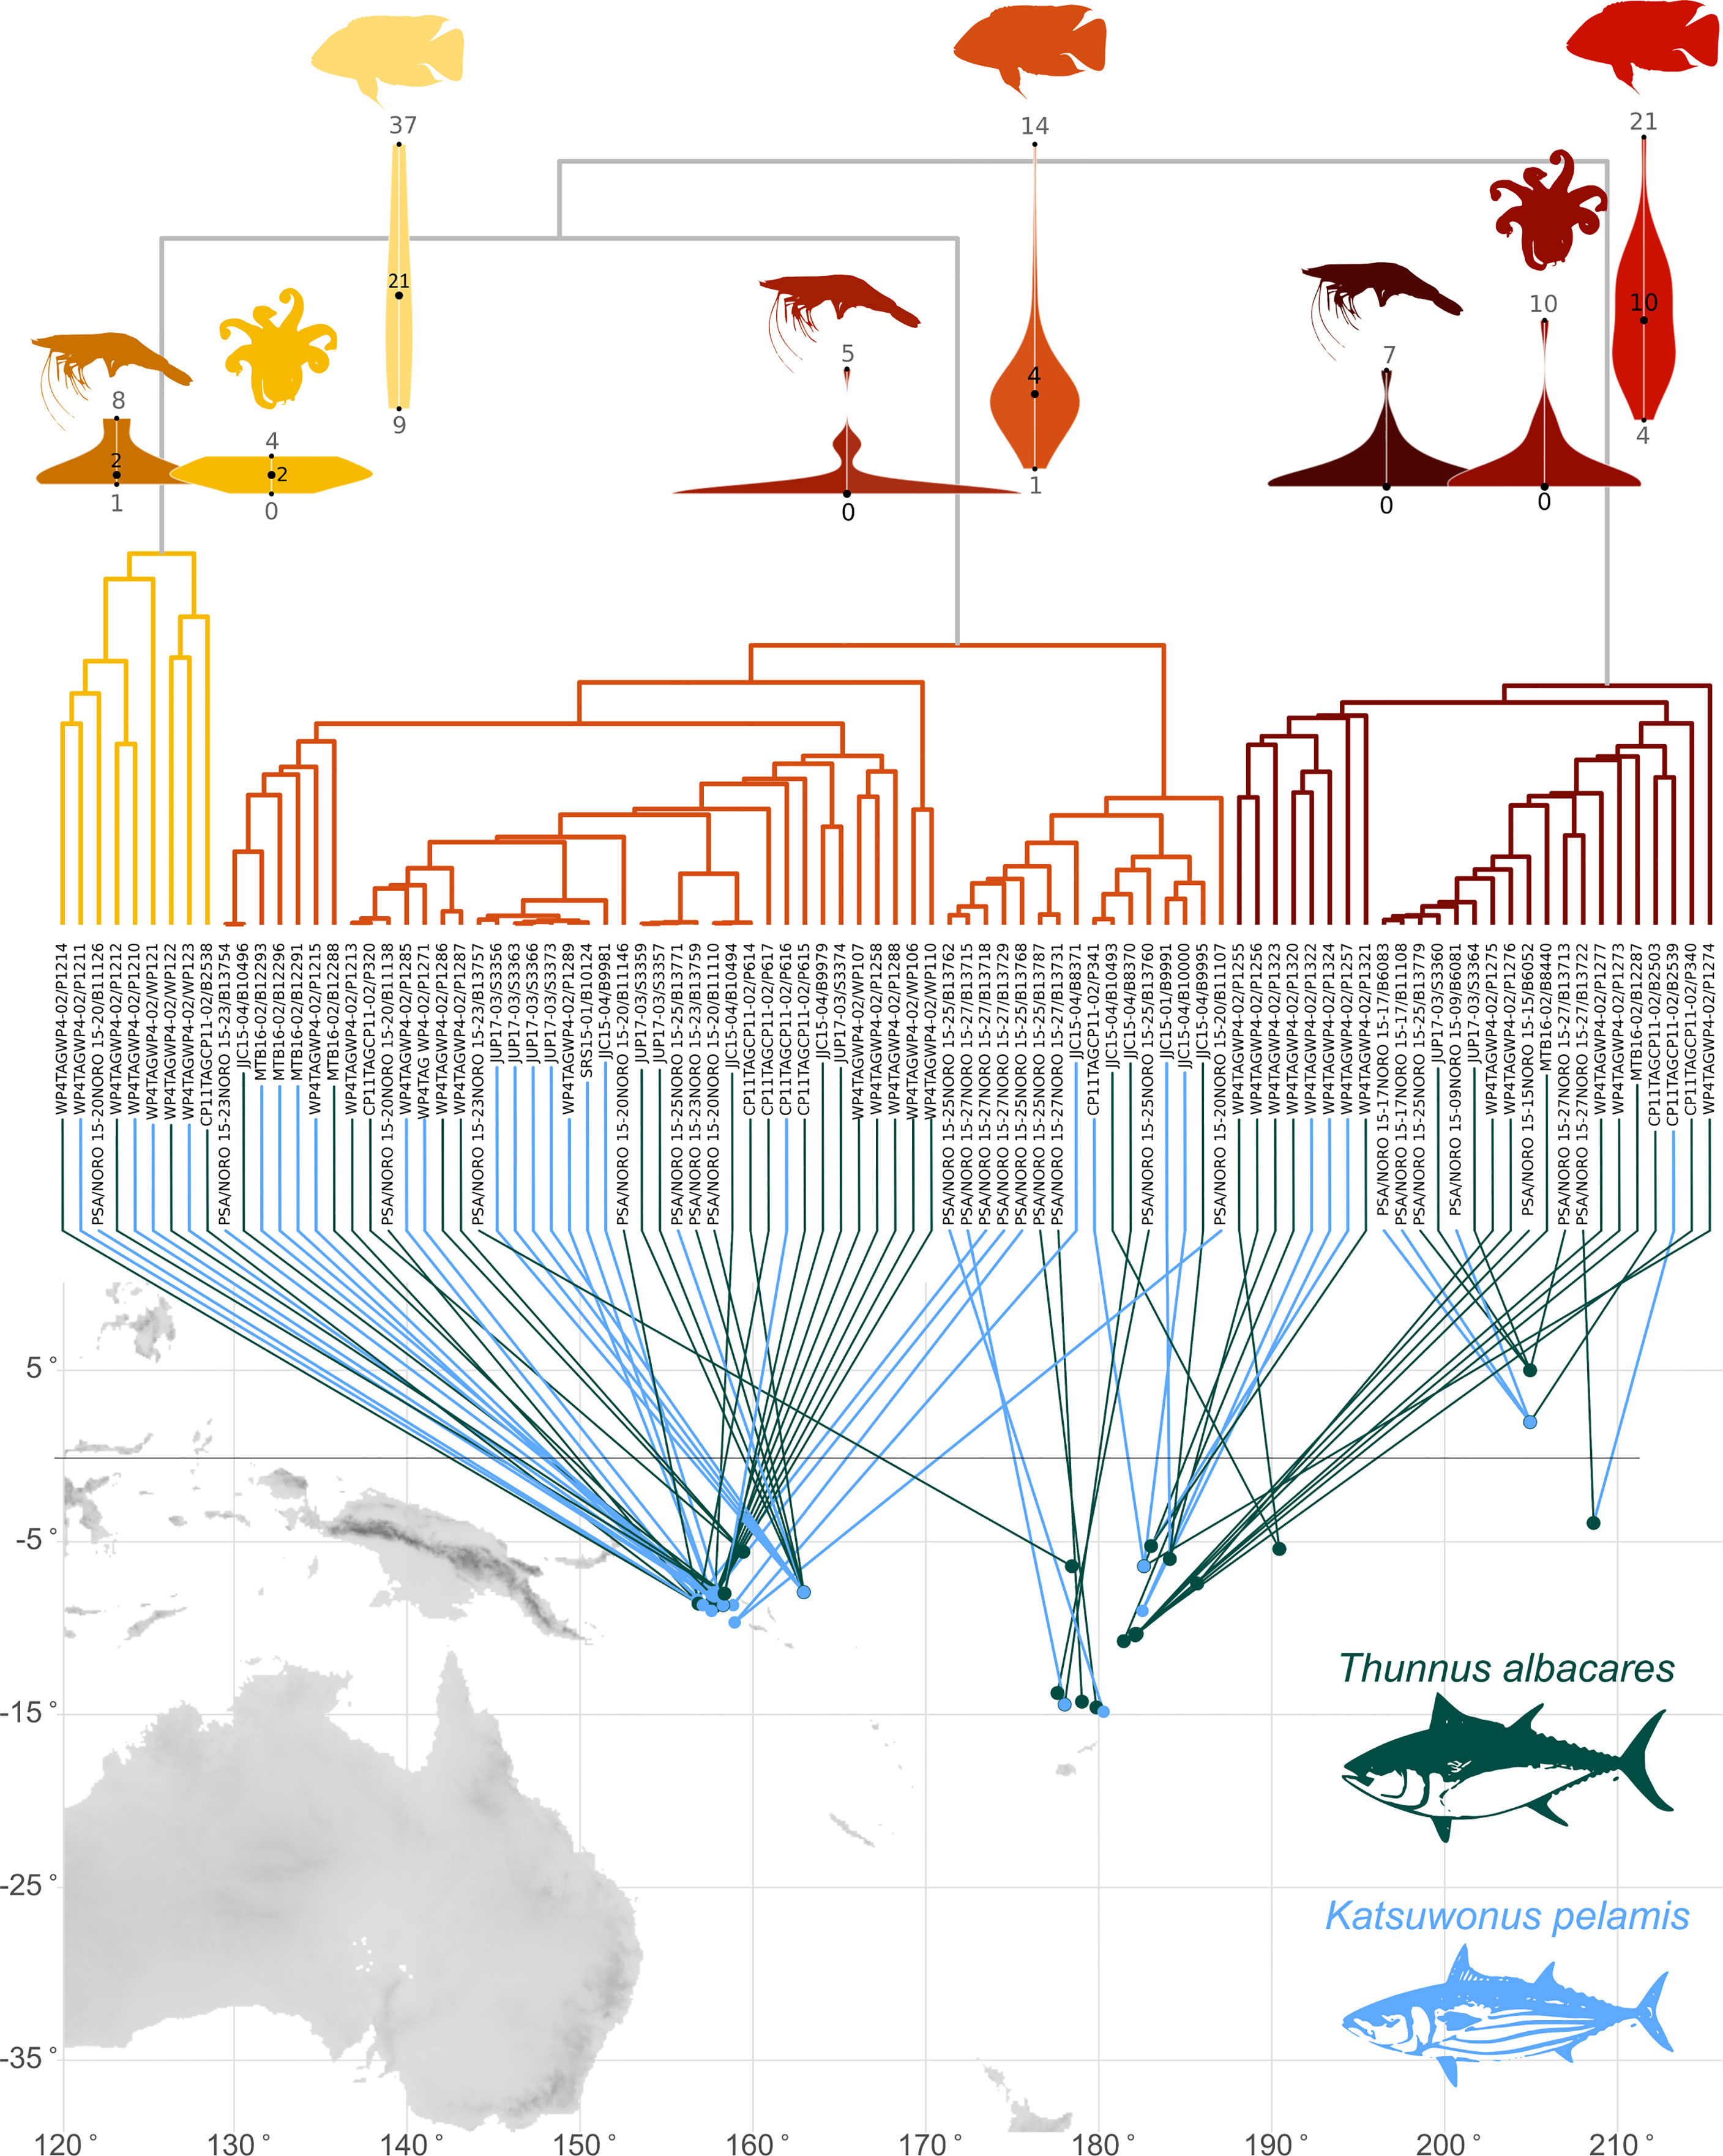
Figure 2 Hierarchical clustering of Katsuwonus pelamis (light blue) and Thunnus albacares (dark green) prey captured across the Pacific during 2015-2017. Three mayor clusters are shown in yellow (Cluster 1), orange (Cluster 2) and red (Cluster 3). Violin plots above each cluster represent the mean number of Actinopterygii, Crustacea and Cephalopoda species present in the stomachs of K. pelamis and T. albacares within the cluster.
Factors Influencing Microbiome Composition
Differences in gut microbiome composition to the Phylum level were best explained by tuna species (Table 4). Katsuwonus pelamis showed a higher diversity of bacteria phyla in their gut microbiome compared to T. albacares (Figure 3). Of note, Bacteria within the Pseudomonadota [previously Proteobacteria (Oren and Garrity, 2021)], Actinomycetota [previously Actinobacteria (Oren and Garrity, 2021)], Bacillota [Previously Firmicutes (Oren and Garrity, 2021)] and Cyanobacteria were phyla were the most common and abundant across all fish (Figure 3). No model best explained differences in the gut microbiome of K. pelamis and T. albacares to the Order or Family level (Table 4).
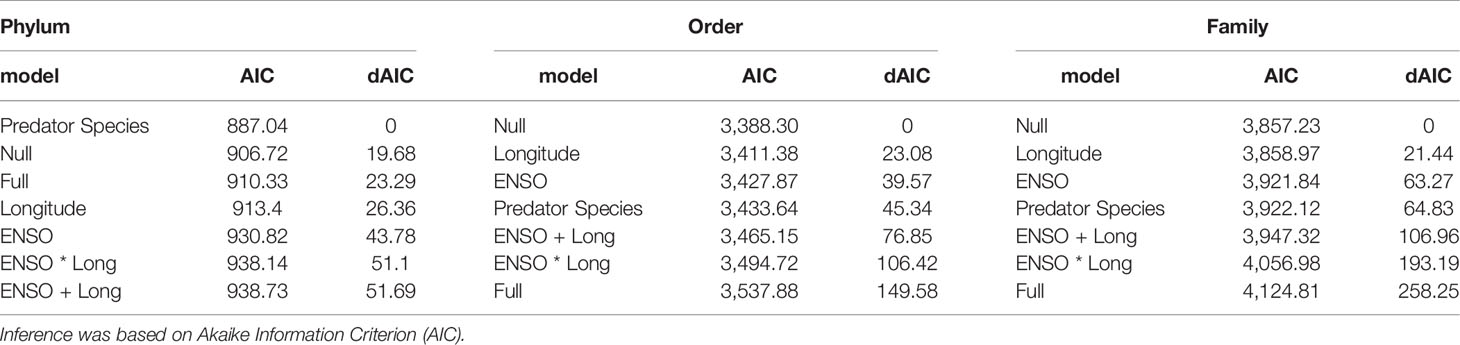
Table 4 Generalised linear model analyses used to explain differences in gut microbiome composition to the Phylum, Order and Family level in Katsuwonus pelamis and Thunnus pelamis captured in the Pacific during El Niño Southern Oscillation events (ENSO).
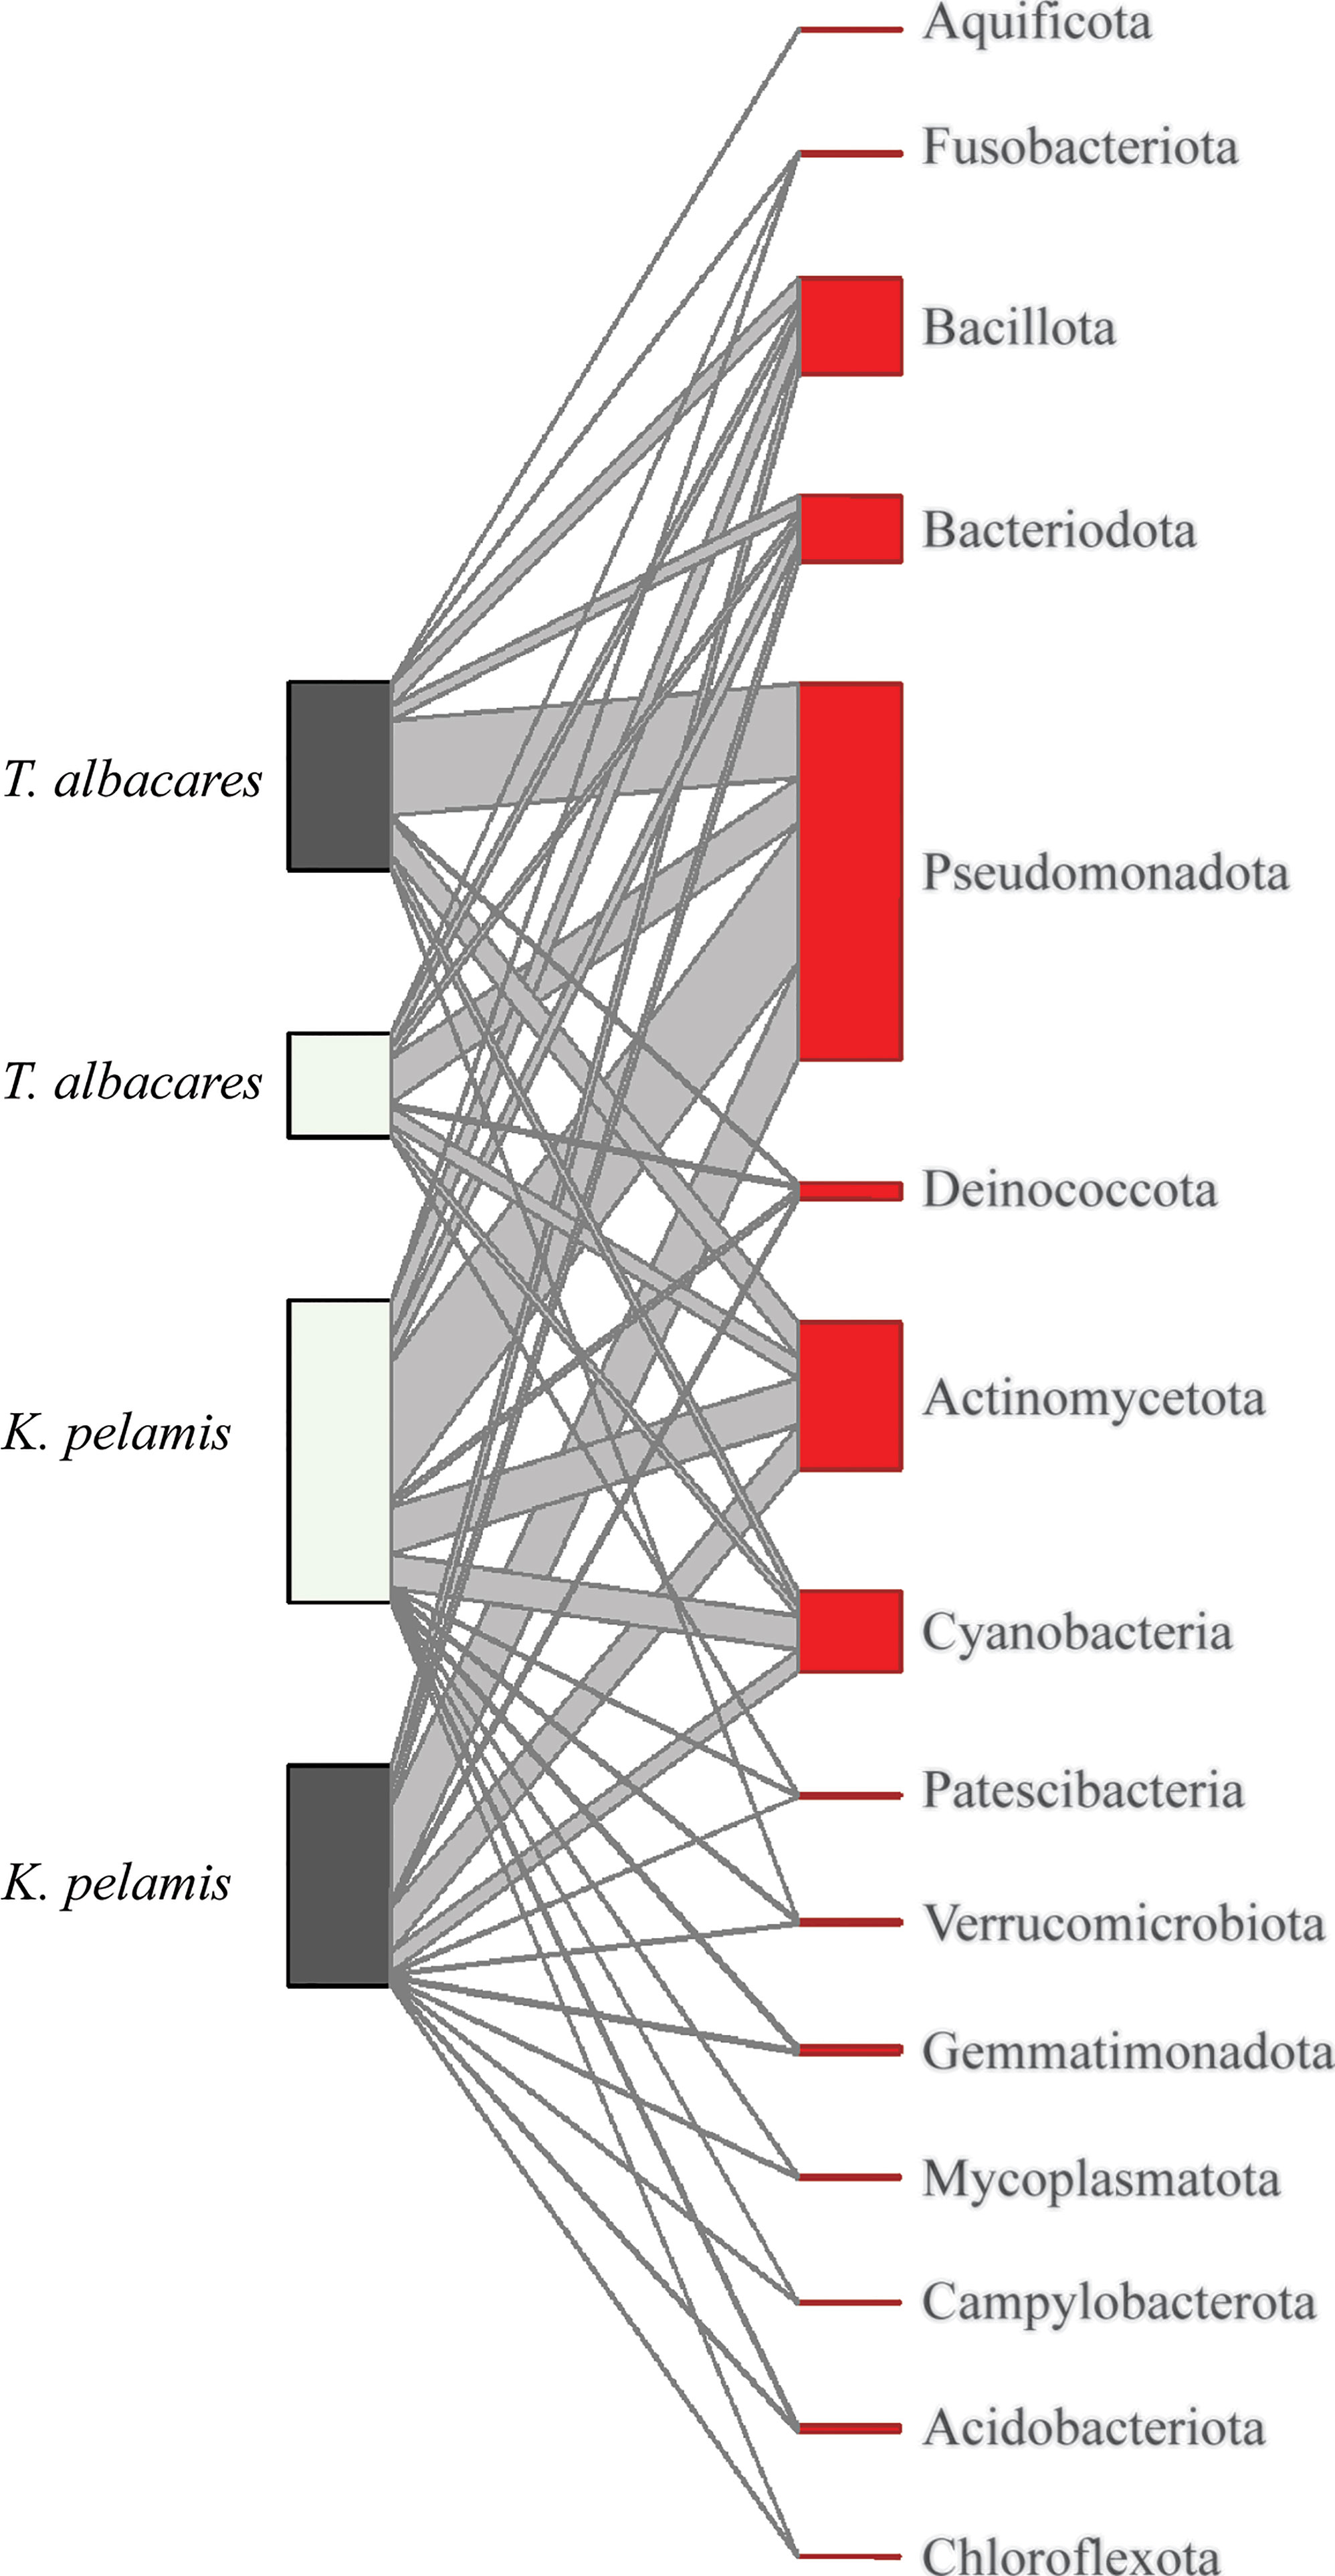
Figure 3 Phylum level comparison of gut microbiome composition in Katsuwonus pelamis and Thunnus albacares captured during El Niño (dark grey) and La Niña (light grey) temperature oscillation events in 2015-2017. Operational Taxonomic Units (OTU) with less than 1,000 total reads were excluded from the analysis. Order and Family level comparisons can be found in Supplementary S5.
Morphological Assessment Analysis
A total of 27 K. pelamis and 14 T. albacares stomachs did not contain natural prey remains (empty stomach or stomach containing presumed bait remains) and were classified empty. The remaining 28 K. pelamis and 27 T. albacares stomachs contained prey remains and were morphologically assessed. Capture location best explained differences in prey families detected in the stomach content of K. pelamis and T. albacares followed by the model that included location and ENSO (Table 5).
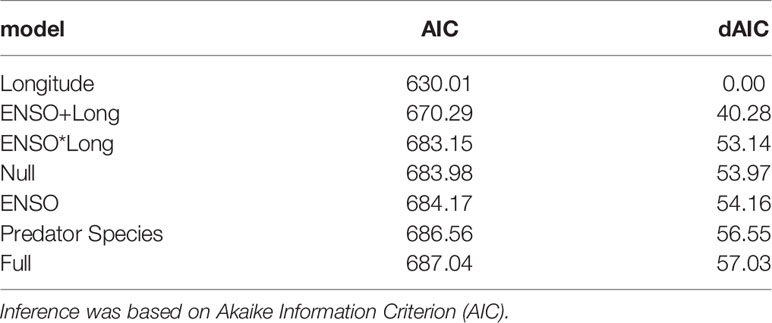
Table 5 Generalised linear model analyses used to explain differences in prey species composition (Family level) identified using conventional morphological assessments from Katsuwonus pelamis and Thunnus pelamis captured in the Pacific during El Niño Southern Oscillation events (ENSO).
A total of 89 prey families were identified by high throughput sequencing and the morphological assessment, including 76 prey families detected by metabarcoding (46 in K. pelamis and 67 in T. albacares) and 30 by morphological examination (21 in K. pelamis and 19 in T. albacares), with a total of 18 families found by both methods (13 in K. pelamis and 9 in T. albacares). At the species level, 241 species were identified, with 236 species detected by high throughput sequencing (128 in K. pelamis and 187 in T. albacares), six by morphological examination (5 in K. pelamis and 3 in T. albacares), and one species found by both methods (the purpleback flying squid Sthenoteuthis oualaniensis) in K. pelamis. Similar trends were observed between molecular and morphological approaches in detecting prey of both tuna species. Fish prey was the most diverse group of prey followed by crustaceans and cephalopods (Figure 4A). According to both metabarcoding and morphological examination, the most frequent prey consumed by K. pelamis, were, in decreasing order, fish in more than 90% of the stomachs, and crustaceans and molluscs in 14 to 46% of the stomachs (Figure 4B). For T. albacares, fish were the most frequent prey according to metabarcoding (100% occurrence) followed by crustaceans (43%) and molluscs (27%), while crustaceans are the most frequent prey according to morphology (78%), followed by fish (63%) and molluscs (44%) (Figure 4B).
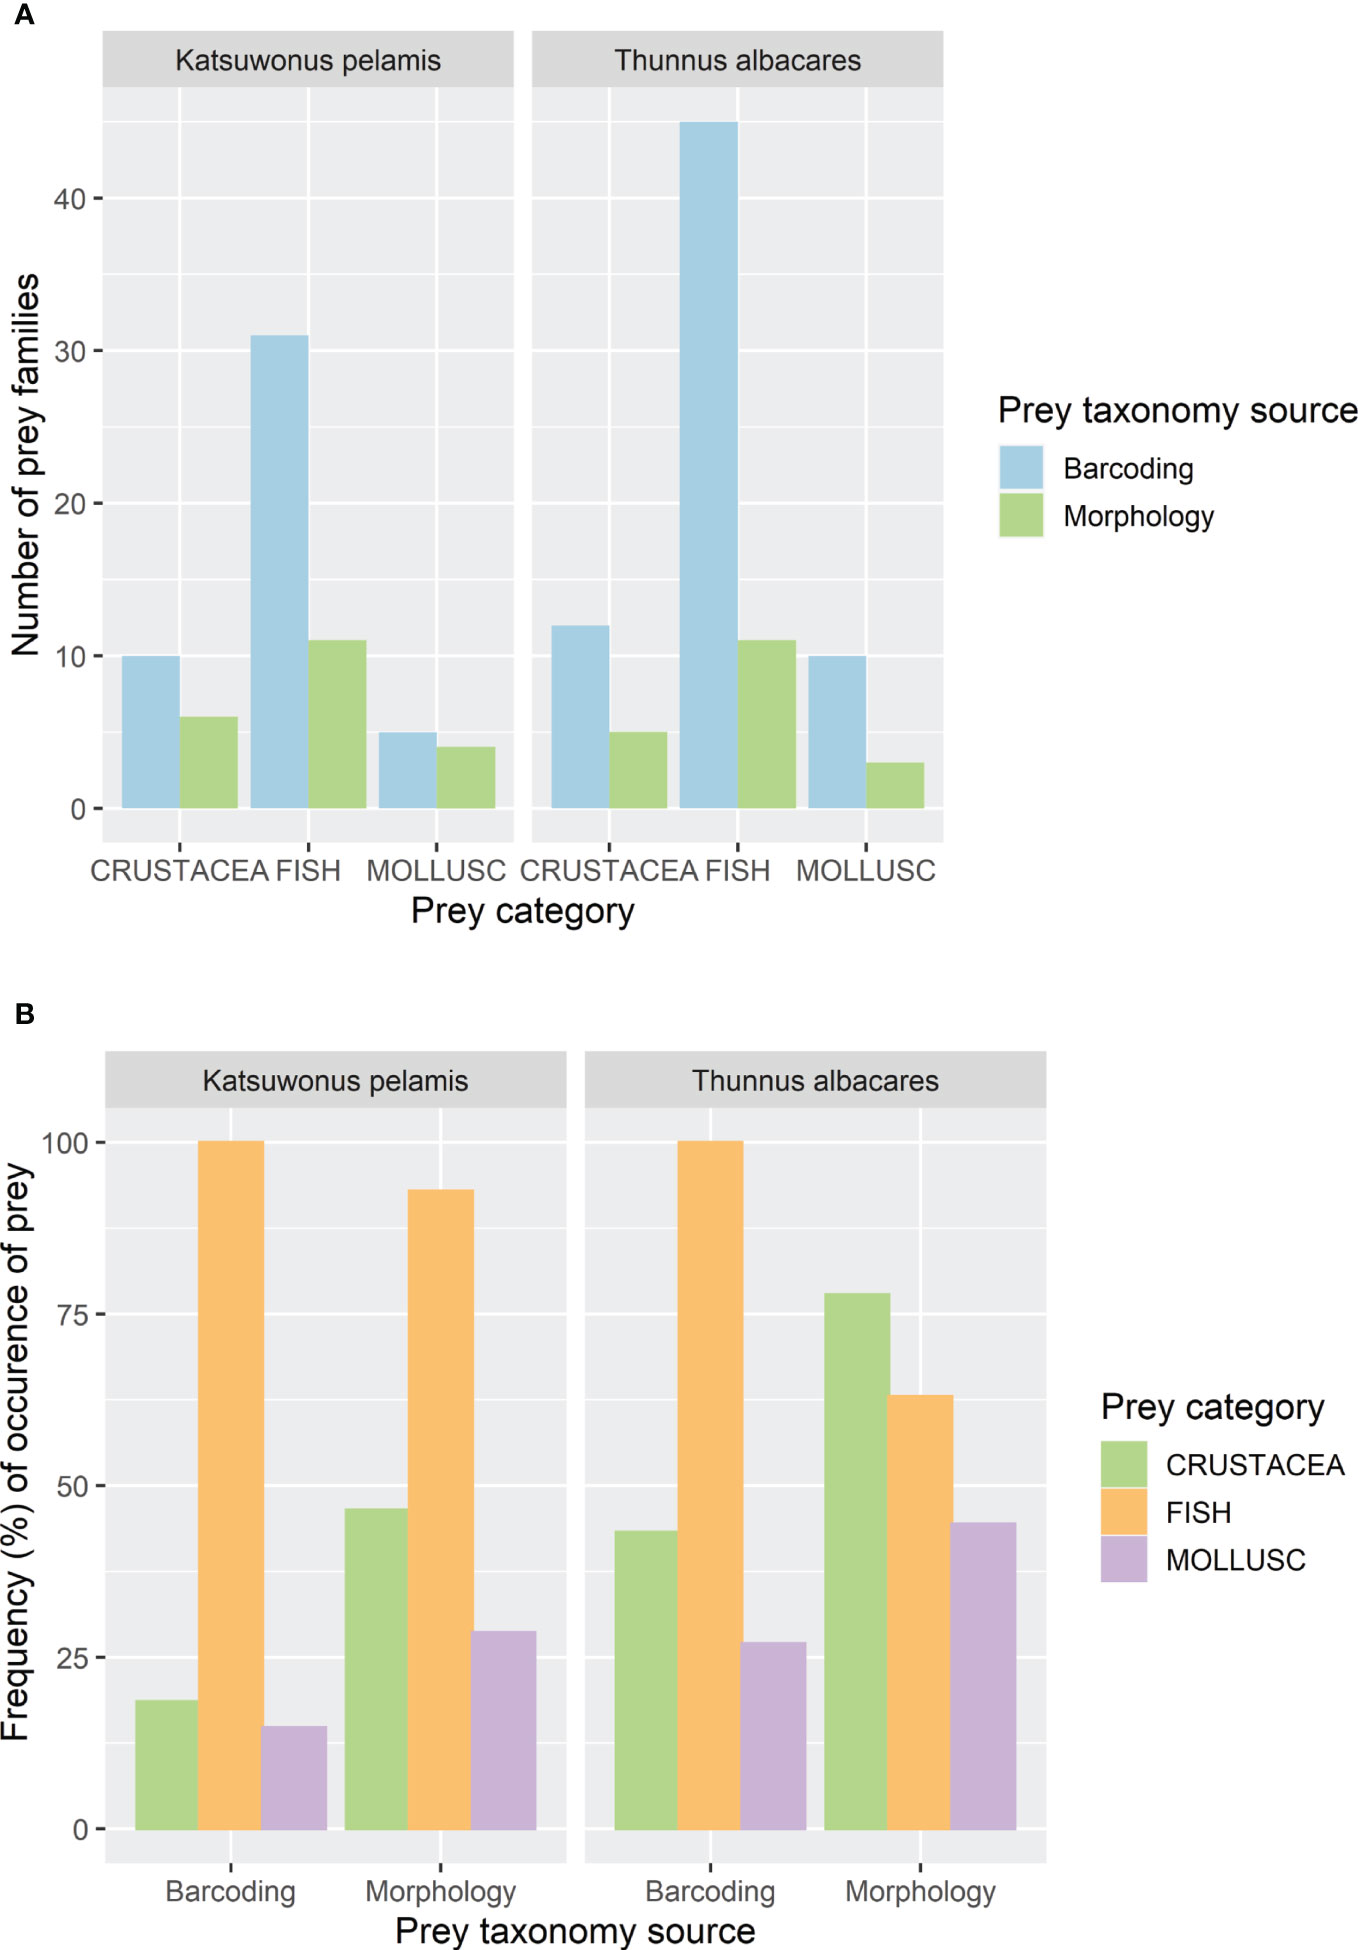
Figure 4 Prey diversity in number of prey families (A) and frequency of occurrence of the prey categorised by main groups (B), identified in stomach contents of Katsuwonus pelamis and Thunnus albacares using high throughput sequencing (Barcoding) and morphological assessments (Morphology).
The most frequent prey families consumed by K. pelamis according to morphological identification of stomach content are surgeonfish (Acanthuridae), squid (Ommastrephidae), anchovies (Engraulidae), angelfish (Pomacanthidae) and amphipods (Phrosinidae) (Supplementary S5). For the same predator, except for anchovies, the most frequent prey determined by metabarcoding are different with mackerel/tuna (Scrombridae), driftfish (Nomeidae), krill (Euphausiidae), squirrelfish (Holocentridae) and lanternfish (Myctophidae). Thunnus albacares most frequently consumed triggerfish (Balistidae), surgeonfish and crustaceans (Phronimidae, Phrosinidae, Thalassocarididae) according to morphological examination, but mackerel/tuna, anchovies, driftfish, angelfish and snapper (Lutjanidae) according to metabarcoding (Supplementary S5).
A number of prey identified in the stomach content of both predators are related to reefs, lagoons or coasts (neritic domain) fo some component of their life cycle. According to the metabarcoding method, neritic-related species are found as frequently in the stomachs as oceanic prey for crustaceans and fish prey, neritic prey are less frequent for molluscs (Supplementary S5) and no differences are observed according to the longitude considered. The same analysis based on morphological examination indicate that neritic prey are less frequent than oceanic prey in the stomachs for the three prey categories, but the occurrence of neritic prey are higher in the western part of the area (150°E-170°E) compared to further east (Supplementary S5).
Discussion
The use of real-time molecular tools to detect impending ecological changes has allowed for efficient and timely implementation of adaptive management strategies (Evans et al., 2015; Pawlowski et al., 2016). Detecting changes in the stomach content and microbiome composition of important Pacific fisheries that are associated with environmental variability has the potential to greatly inform management of marine resources in this region. El Niño Southern Oscillation is a prominent driver of environmental and climate variability, known to affect the ecological patterns of multiple species in the Pacific (Bertrand et al., 2020). The recent discovery that ENSO is far more diverse than previously recognized highlights a pressing need to identify the impact of ENSO on fisheries and aquaculture (Bertrand et al., 2020; Lehodey et al., 2021). Our preliminary data shows there are detectable differences in the stomach content of Katsuwonus pelamis and Thunnus albacares captured in the Pacific associated with capture location and while weak associations were attributed to differing ENSO phases.
Katsuwonus pelamis and T. albacares captured near coastal areas (Longitude<170°W) showed a greater diversity of fishes and crustaceans compared to fish captured in oceanic regions of the Pacific. Capture location, ENSO phase and tuna species had a significant influence on fish prey composition, while crustacean and cephalopod prey composition were weakly explained by differences in capture location and ENSO phases. Similar to our results, the detection of fish, crustaceans and cephalopod species in the stomach content of tuna species has been previously reported for juvenile T. thunnus (Varela et al., 2013) and adult T. obesus (Lin et al., 2020), where fish species dominated the diet of both tuna, with cephalopods and tuna being detected depending on specimen size and habitat (Varela et al., 2013; Lin et al., 2020). Given that T. albacares had a much more diverse stomach content composition than K. pelamis, it is possible that similar to T. obesus, T. albacares displays opportunistic feeding habits. Data also shows that fish captured during La Niña events had a higher diversity of prey in their stomach content compared to fish captured during El Niño, which would corroborate previous research suggesting that high surface sea temperatures and nutrient-poor warm water conditions during El Niño phases of ENSO have historically caused losses of productive habitats (Kim et al., 2021) and prey availability (Öhlund et al., 2015). Repeating this study with a more balanced statistical design and increased sample size is warranted to better determine the influence of ENSO on stomach content composition.
Katsuwonus pelamis showed a higher diversity of bacteria phyla in their gut microbiome compared to T. albacares, while none of the generalised linear models explained composition differences to order or family level. Additionally, this study shows that Pseudomonadota (syn. Proteobacteria), Actinomycetota (syn. Actinobacteria), Bacillota (syn. Firmicutes) (Oren and Garrity, 2021) and Cyanobacteria were the most common and abundant phyla in K. pelamis and T. albacares (Figure 3). It is however important to highlight those differences at the phyla level may provide limited resolution to stablish the utility of top predators as indicator species. Previous research exploring Phylum level gut microbiome compositions has shown that there was a negative association with rearing temperatures and relative abundance of Bacillota bacteria in farmed rainbow trout [Oncorhynchus mykiss (Walbaum, 1792)] (Huyben et al., 2018), but that Bacillota relative abundance does not appear to consistently associated amongst fish species, which typically harbour lower relative abundances of Bacillota and higher relative abundances of Pseudomonadota (Gordon et al., 2008). Similarly, research has shown that increasing temperatures were associated with shifts in the relative abundances of Gammaproteobacteria lineages, with decreases in the relative abundances of Acinetobacter and increases in the relative abundances of Vibrio species known to display pathogenic properties in farmed salmon (Salmo salar Linnaeus, 1758) (Neuman et al., 2016). Similar changes in Gammaproteobacteria were observed in farmed juvenile yellowtail kingfish (Seriola lalandi Valenciennes, 1833) (Soriano et al., 2018). Moreover, compositional changes in the fish gut microbiota in response to temperature variation that have been reported in previous studies have been suggested to be driven by shifts in the relative abundances of Pseudomonadota linages (Sepulveda and Moeller, 2020). Indeed, research on the impact of environmental factors (such as ENSO or habitats) on wild fish gut microbiomes is scant, with only a few studies showing that host habitat is the major determinant of the gut microbiome of approximately 85 wild freshwater and marine fishes captured of the coast and in lakes of South Korea (Kim et al., 2021), and that, as this study, Actinomycetota and Pseudomonadota are commonly the most dominant groups in fish gut microbiota (Hansen and Olafsen, 1999; Rombout et al., 2011). Although this study was limited by sample size, we provide preliminary data documenting K. pelamis and T. albacares gut microbiome at three different levels of taxonomic resolution to complement future research aiming to better explore the influence of ENSO on tuna gut microbiomes.
High throughput sequencing detected a much greater diversity of prey species compared to morphological assessments in this study. In part, this was due to the various levels of taxonomic resolution obtained with each approach. Our morphological data of prey remains only allowed a few instanced of genus-level identification and one identification to the species level (Sthenoteuthis oualaniensis) due to digestion state, but they provided information at the family level for 73% of the weight of fish, crustacean and cephalopods remains. In comparison, molecular data provided family and species level identification for prey species. These results show how sensitive molecular methods can increase the depth of detection for heavily digested or unidentifiable species in stomach contents. This outcome supports what other studies have shown in the past (Berry et al., 2015). However, morphological assessments could differentiate the remains of “bait” species used to capture some of the tuna specimens in this study. Such a differentiation was not achieved by the high throughput sequencing approach. Ideally bait species need to be identified prior to sampling when applying high throughput sequencing methods. This was not possible in this preliminary study as all stomachs had already been collected opportunistically. As such the morphological assessment completed in this study allowed for greater control of false positive prey species detections. Future studies could utilise capture methods that do not require the use of bait, however such an approach would be counterproductive given how efficient and widespread the use of bait is when capturing tuna. Alternatively, bait could be identified prior to sampling as an additional layer of control during bioinformatic assessment.
In conclusion, this preliminary study shows differences in stomach content composition of K. pelamis and T. albacares associated to capture location and ENSO events for fish prey and weakly for crustaceans and cephalopods. Prey species diversity decreased in presence probability with increasing longitude and during El Niño ENSO phases, while T. albacares showed a higher prey diversity of fish crustaceans and cephalopods compared to K. pelamis, providing a preliminary indication that capture location, ENSO phase and tuna species were important interacting factors in stomach content composition. We found no effects of capture location, tuna species or ENSO phase in gut microbiome compositionwas an important factor in the composition of bacteria and fish and to a lesser degree for crustacean and cephalopod species described in this study. Temperature anomalies of ENSO events may cause distinct differences in microbiome composition and these preliminary results warrant a more comprehensive examination of the approach. Indeed, this study showed limitations of using samples collected opportunistically and recommends further collection of tuna specimens from pelagic regions of the Pacific, while identifying bait species used to capture predator species such as K. pelamis and T. albacares. Monitoring how abundant prey and bacteria change in presence overtime using apex predators may be an effective tool to survey change in oceanic ecosystems and further research could indicate the potential to inform management on environmental change.
Data Availability Statement
The datasets presented in this study are accessioned in the National Center for Biotechnology Information[accession: PRJNA680376], https://www.ncbi.nlm.nih.gov/bioproject/PRJNA680376. Data can also be accessed through request to the Pacific Marine Specimen Bank https://www.spc.int/ofp/PacificSpecimenBank.
Ethics Statement
Ethical review and approval were not required for the animal study because all samples examined in this study were requested and provided by the Pacific Marine Specimen Bank (https://www.spc.int/ofp/PacificSpecimenBank). No active sample collection of live specimens was undertaken and all samples were analyzed under strict approval of the Pacific Marine Specimen Bank.
Author Contributions
Conceptualization: DG, AR, and SN; Methodology: VA, AP, BK, SG, EV; Software: TL.; Formal analysis: ATG, SN, JP, and TL; Investigation: ATG and SN; Resources: DG, AR, SN, BK, and TU; Data curation: ATG and TL; Writing—original draft preparation: ATG. Writing—review and editing: ATG, AR, DG, SN, VA; Visualization: ATG. Project administration: DG. Funding acquisition: DG and AR. All authors contributed to the article and approved the submitted version.
Funding
Funding to support molecular analyses and high throughput sequencing was provided by the Centre for Biodiversity Analysis of the Australian National University. Funding to support the collection of samples was provided by the Western and Central Pacific Fisheries Commission (WCPFC Project 35). Funding to support the taxonomic and statistical analyses was provided by the European Union “Pacific-European-Union-Marine-Partnership” Programme (agreement FED/2018/397-941). This publication was produced with the financial support of the European Union and Sweden. Its contents are the sole responsibility of the authors and do not necessarily reflect the views of the European Union and Sweden.
Conflict of Interest
The authors declare that the research was conducted in the absence of any commercial or financial relationships that could be construed as a potential conflict of interest.
Publisher’s Note
All claims expressed in this article are solely those of the authors and do not necessarily represent those of their affiliated organizations, or those of the publisher, the editors and the reviewers. Any product that may be evaluated in this article, or claim that may be made by its manufacturer, is not guaranteed or endorsed by the publisher.
Acknowledgments
We thank the technical specialists who contributed samples to the Western & Central Pacific Fisheries Commission Pacific Marine Specimen Bank. We thank Dr Maria Fernanda Torres Jimenez for her advice and assistance in creating Figure 2 and Emily Stringer for her assistance in creating Figures 1 and 3.
Supplementary Material
The Supplementary Material for this article can be found online at: https://www.frontiersin.org/articles/10.3389/fmars.2022.811532/full#supplementary-material
Supplementary S1 | Samples selected for stomach content and microbiome analysis from the Pacific Marine Specimen Bank.
Supplementary S2 | High-throughput sequencing results Actinopterygii, Crustacea, Cephalopoda and bacteria species. Data is available in NCBI under BioProject ID PRJNA680376 (http://www.ncbi.nlm.nih.gov/bioproject/680376)
Supplementary S3 | Bioinformatics pipeline script. This script is available at https://github.com/tengchn/tuna_microbiome.
Supplementary S4 | Generalised Linear model script. This script is available at https://github.com/PacificCommunity/OFP-FEMA-GutMicrobiome.
Supplementary S5 | Supplementary analyses including filtration of total reads, prey diversity and consensus phylogenetic trees for the most abundant bacterial and prey groups in the stomach microbiome of Katsuwonus pelamis and Thunnus albacares.
References
Amann R. I., Ludwig W., Schleifer K. H. (1995). Phylogenetic Identification and in Situ Detection of Individual Microbial Cells Without Cultivation. Microbiol Rev. 59 (1), 143–169. doi: 10.1128/mr.59.1.143-169.1995
Apprill A. (2017). Marine Animal Microbiomes: Toward Understanding Host–Microbiome Interactions in a Changing Ocean. Front. Marine Sci. 4 (222). doi: 10.3389/fmars.2017.00222
Bell J. D., Ganachaud A., Gehrke P. C., Griffiths S. P., Hobday A. J., Hoegh-Guldberg O., et al. (2013). Mixed Responses of Tropical Pacific Fisheries and Aquaculture to Climate Change. Nat. Climate Change 3 (6), 591–599. doi: 10.1038/nclimate1838
Berry O., Bulman C., Bunce M., Coghlan M., Murray D.C., Ward R.D.. (2015). Comparison of Morphological and DNA Metabarcoding Analyses of Diets in Exploited Marine Fishes. Marine Ecol. Prog. Ser. 540, 167–181. doi: 10.3354/meps11524
Bertrand A., Lengaigne M., Takahashi K., Avadi A., Poulain F., Harrod C. . (2020). “El Niño Southern Oscillation (ENSO) Effects on Fisheries and Aquaculture,” in FAO Fisheries and Aquaculture Technical Paper No. 660 Rome, Italy: FAO.
Bessey C., Jarman S. N., Stat M., Rohner C. A., Bunce M., Koziol A., et al. (2019). DNA Metabarcoding Assays Reveal a Diverse Prey Assemblage for Mobula Rays in the Bohol Sea, Philippines. Ecol. Evol. 9 (5), 2459–2474. doi: 10.1002/ece3.4858
Bessey C., Jarman S. N., Stat M., Rohner C.A., Bunce M., Koziol A., et al. (2021). “ENSO and the Carbon Cycle,” in El Niño Southern Oscillation in a Changing Climate. Eds. McPhaden M. J., Santoso A., Cai W. (New Jersey, United States:Wiley & Sons: Geophysical Monograph 253, American Geophysical Union), 453–471.
Bolyen E., Rideout J.R., Dillon M.R., Bokulich N.A., Abnet C.C., Al–Ghalith G.A., et al. (2019). Reproducible, Interactive, Scalable and Extensible Microbiome Data Science Using QIIME 2. Nat. Biotechnol. 37 (8), 852–857. doi: 10.1038/s41587-019-0209-9
Boyce D.G., Lotze H.K., Tittensor D.P., Carozza D.A., Worm B.. (2020). Future Ocean Biomass Losses may Widen Socioeconomic Equity Gaps. Nat. Commun. 11 (1), 2235–2211. doi: 10.1038/s41467-020-15708-9
Braley M., Goldsworthy S.D., Page B., Steer M., Austin J.J.. (2010). Assessing Morphological and DNA-Based Diet Analysis Techniques in a Generalist Predator, the Arrow Squid Nototodarus Gouldi. Mol. Ecol. Resour. 10 (3), 466–474. doi: 10.1111/j.1755-0998.2009.02767.x
Bryndum–Buchholz A., Tittensor D.P., Blanchard J.L., Cheung W W.L., Coll M., Galbraith E.D., et al. (2018). Twenty-First-Century Climate Change Impacts on Marine Animal Biomass and Ecosystem Structure Across Ocean Basins. Global Change Biol. 25 (2), 459–472. doi: 10.1111/gcb.14512
Buckland S. T., Burnham K. P., Augustin N. H. (1997). Model Selection: An Integral Part of Inference. Biometrics 53 (2), 603–618. doi: 10.2307/2533961
Burnett D.A., Champion P.D., Clayton J.S., Ogden J. . (2007). A System for Investigation of the Temperature Responses of Emergent Aquatic Plants. Aquat. Bot. 86 (2), 187–190. doi: 10.1016/j.aquabot.2006.09.015
Butt R. L., Volkoff H. (2019). Gut Microbiota and Energy Homeostasis in Fish. Front. Endocrinol. 10 (9). doi: 10.3389/fendo.2019.00009
Cahill M. M. (1990). Bacterial Flora of Fishes: A Review. Microb Ecol. 19 (1), 21–41. doi: 10.1007/BF02015051
Callahan B.J., Mcmurdie P.J., Rosen M.J., Han A.W., Johnson A.J.A., Holmes S.P., et al. (2016). DADA2: High-Resolution Sample Inference From Illumina Amplicon Data. Nat. Methods 13 (7), 581–583. doi: 10.1038/nmeth.3869
Camacho C., Coulouris G., Avagyan V., Ma N., Papadopoulos J., Bealer K. , Madden T.L. , et al. (2009). BLAST+: Architecture and Applications. BMC Bioinf. 10 (1), 421–421. doi: 10.1186/1471-2105-10-421
Deagle B.E., Thomas A.C., Shaffer A.K., Trites A.W., Jarman S.N.. (2013). Quantifying Sequence Proportions in a DNA-Based Diet Study Using Ion Torrent Amplicon Sequencing: Which Counts Count? Mol. Ecol. Resour. 13 (4), 620–633. doi: 10.1111/1755-0998.12103
De Barba M., Miquel C., Boyer F., Mercier C., Rioux D., Coissac E., Taberlet P., et al. (2014). DNA Metabarcoding Multiplexing and Validation of Data Accuracy for Diet Assessment: Application to Omnivorous Diet. Mol. Ecol. Resour. 14 (2), 306–323. doi: 10.1111/1755-0998.12188
Edgar R. C. (2010). Search and Clustering Orders of Magnitude Faster Than BLAST. Bioinformatics 26 (19), 2460–2461. doi: 10.1093/bioinformatics/btq461
Egerton S., Culloty S., Whooley J., Stanton C., Ross R.P.. (2018). The Gut Microbiota of Marine Fish. Front. Microbiol. 9, 873. doi: 10.3389/fmicb.2018.00873
Evans K., Brown J.N., Sen Gupta A., Nicol S.J., Hoyle S., Matear R., Arrizabalaga H., et al. (2015). When 1 + 1 can be >2: Uncertainties Compound When Simulating Climate, Fisheries and Marine Ecosystems. Deep-sea Res. Part II Topical Stud. oceanogr 113, 312–322. doi: 10.1016/j.dsr2.2014.04.006
FAO (2020). “The State of World Fisheries and Aquaculture 2020,” in Sustainability in Action. Series: The State of World Fisheries and Aquaculture (SOFIA)(Rome, Italy: FAO). ISBN: 978-92-5-132692-3
Fromentin J.-M., Powers J. E. (2005). Atlantic Bluefin Tuna: Population Dynamics, Ecology, Fisheries and Management. Fish fish (Oxford England) 6 (4), 281–306. doi: 10.1111/j.1467-2979.2005.00197.x
García Molinos J., Halpern B.S., Schoeman D.S., Brown C.J., Kiessling W., Moore P.J., et al. (2016). Climate Velocity and the Future Global Redistribution of Marine Biodiversity. Nat. Climate Change 6 (1), 83–88. doi: 10.1038/nclimate2769
Gómez G. D., Balcázar J. L. (2008). A Review on the Interactions Between Gut Microbiota and Innate Immunity of Fish. FEMS Immunol. Med. Microbiol. 52 (2), 145–154. doi: 10.1111/j.1574-695X.2007.00343.x
Goodwin K. D., Thompson L. R., Duarte B., Kahlke T., Thompson A.R., Marques J.C., Caçador I., et al. (2017). DNA Sequencing as a Tool to Monitor Marine Ecological Status. Front. Marine Sci. 4. doi: 10.3389/fmars.2017.00107
Gordon J. I., Ley R. E., Lozupone C. A., Hamady M. , Knight , R., et al. (2008). Worlds Within Worlds: Evolution of the Vertebrate Gut Microbiota. Nat. Rev. Microbiol. 6 (10), 776–788. doi: 10.1038/nrmicro1978
Hansen G. H., Olafsen J. A. (1999). Bacterial Interactions in Early Life Stages of Marine Cold Water Fish. Microb Ecol. 38 (1), 1–26. doi: 10.1007/s002489900158
Hazen E. L., Abrahms B., Brodie S., Carroll G., Jacox M. G., Savoca M. S., et al. (2019). Marine Top Predators as Climate and Ecosystem Sentinels. Front. Ecol. Environ. 17 (10), 565–574. doi: 10.1002/fee.2125
Holbrook N. J., Claar D. C., Hobday A. J., Mcinnes K. L., Oliver E. C. J., Sen Gupta A., et al. (2021). “ENSO-Driven Ocean Extremes and Their Ecosystem Impacts,” in El Niño Southern Oscillation in a Changing Climate. Eds. McPhaden M. J., Santoso A., Cai W. (New Jersey, United States: Wiley & Sons: Geophysical Monograph 253, American Geophysical Union), 409–428.
Huyben D., Sun L., Moccia R., Kiessling A., Dicksved J., Lundh T., et al. (2018). Dietary Live Yeast and Increased Water Temperature Influence the Gut Microbiota of Rainbow Trout. J. Appl. Microbiol. 124 (6), 1377–1392. doi: 10.1111/jam.13738
Iwasaki W., Fukunaga T., Isagozawa R., Yamada K., Maeda Y., Satoh , T. P., et al. (2013). MitoFish and MitoAnnotator: A Mitochondrial Genome Database of Fish With an Accurate and Automatic Annotation Pipeline. Mol. Biol. Evol. 30 (11), 2531–2540. doi: 10.1093/molbev/mst141
Jarman S. N., Redd K. S., Gales N. J. (2006). Group-Specific Primers for Amplifying DNA Sequences That Identify Amphipoda, Cephalopoda, Echinodermata, Gastropoda, Isopoda, Ostracoda and Thoracica. Mol. Ecol. Notes 6 (1), 268–271. doi: 10.1111/j.1471-8286.2005.01172.x
Katoh K., Misawa K., Kuma K. K., Miyata , T.. (2002). MAFFT: A Novel Method for Rapid Multiple Sequence Alignment Based on Fast Fourier Transform. Nucleic Acids Res. 30 (14), 3059–3066. doi: 10.1093/nar/gkf436
Kim P. S., Shin N. R., Lee J. B., Kim M. S., Whon T. W., Hyun D. W., et al. (2021). Host Habitat is the Major Determinant of the Gut Microbiome of Fish. Microbiome 9 (1), 1–166. doi: 10.1186/s40168-021-01113-x
Kumar S., Stecher G., Li M., Knyaz C., Tamura K.. (2018). MEGA X: Molecular Evolutionary Genetics Analysis Across Computing Platforms. Mol. Biol. Evol. 35 (6), 1547–1549. doi: 10.1093/molbev/msy096
Lansdell M., Young J. (2006). Pelagic Cephalopods From Eastern Australia: Species Composition, Horizontal and Vertical Distribution Determined From the Diets of Pelagic Fishes. Rev. Fish Biol. Fish 17 (2), 125. doi: 10.1007/s11160-006-9024-8
Lehodey P., Bertrand A., Hobday J., Kiyofuji H., Mcclatchie S, Menkès C., Pilling G, et al. (2021). “ENSO Impact on Marine Fisheries and Ecosystems,” in El Niño Southern Oscillation in a Changing Climate. Eds. McPhaden M. J., Santoso A., Cai W. (Wiley & Sons: Geophysical Monograph 253, American Geophysical Union), 429–452.
Letunic I., Bork P. (2019). Interactive Tree Of Life (iTOL) V4: Recent Updates and New Developments. Nucleic Acids Res. 47 (W1), W256–W259. doi: 10.1093/nar/gkz239
Lin C.–H., Lin J.–S., Chen K.–S., Chen M.–H., Chen C.–Y., Chang C.–W., et al. (2020). Feeding Habits of Bigeye Tuna (Thunnus Obesus) in the Western Indian Ocean Reveal a Size-Related Shift in Its Fine-Scale Piscivorous Diet. Front. Marine Sci. 7. doi: 10.3389/fmars.2020.582571
Llewellyn M. S., Boutin` S., Hoseinifar S. H., Derome N.. (2014). Teleost Microbiomes: The State of the Art in Their Characterization, Manipulation and Importance in Aquaculture and Fisheries. Front. Microbiol. 5 (207). doi: 10.3389/fmicb.2014.00207
Lorrain A., Pethybridge H., Cassar N., Receveur A., Allain V., Bodin N.. (2019). Trends in Tuna Carbon Isotopes Suggest Global Changes in Pelagic Phytoplankton Communities. Global Change Biol. 26 (2), 458–470.doi: 10.1111/gcb.14858
Luna G. M., Quero G. M., Kokou F., Kormas K.. (2022). Time to Integrate Biotechnological Approaches Into Fish Gut Microbiome Research. Curr. Opin. Biotechnol. 73, 121–127. doi: 10.1016/j.copbio.2021.07.018
Martin M. (2011). Cutadapt Removes Adapter Sequences From High-Throughput Sequencing Reads, EMBnet.journal 17, (1), 3. doi: 10.14806/ej.17.1.200
Minich J. J., Petrus , S., Michael J. D., Michael T. P., Knight R., Allen E. E.. (2020). Temporal, Environmental, and Biological Drivers of the Mucosal Microbiome in a Wild Marine Fish, ≪Span Class=&Quot;Named-Content Genus-Species&Quot; Id=&Quot;Named-Content-1&Quot;<Scomber Japonicus≪/Span&Gt. mSphere 5 (3), e00401-20. doi: 10.1128/mSphere.00401-20
Miya M., Sato Y., Fukunaga T., Sado T., Poulsen J. Y., Sato K., et al. (2015). MiFish, a Set of Universal PCR Primers for Metabarcoding Environmental DNA From Fishes: Detection of More Than 230 Subtropical Marine Species. R. Soc. Open Sci. 2 (7), 150088–150088. doi: 10.1098/rsos.150088
Neuman C., Hatje E., Zarkasi K. Z., Smullen R., Bowman J. P., Katouli M.. (2016). The Effect of Diet and Environmental Temperature on the Faecal Microbiota of Farmed Tasmanian Atlantic Salmon (Salmo Salar L.). Aquacult Res. 47 (2), 660–672. doi: 10.1111/are.12522
Nicol S. J., Allain V., Pilling G. M., Polovina J., Coll M., Bell J., et al. (2013). An Ocean Observation System for Monitoring the Affects of Climate Change on the Ecology and Sustainability of Pelagic Fisheries in the Pacific Ocean. Climatic Change 119 (1), 131–145. doi: 10.1007/s10584-012-0598-y
Nielsen J. M., Clare E. L., Hayden B., Brett M. T., Kratina P., Gilbert M. T.P.. (2018). Diet Tracing in Ecology: Method Comparison and Selection. Methods Ecol. Evol. 9 (2), 278–291. doi: 10.1111/2041-210X.12869
Öhlund G., et al. (2015). Temperature Dependence of Predation Depends on the Relative Performance of Predators and Prey. Proc. R. Soc. B Biol. Sci. 282 (1799), 20142254–20142254. doi: 10.1098/rspb.2014.2254
Olson R. J., Boggs C. H. (1986). Apex Predation by Yellowfïn Tuna (Thunnus Albacares): Independent Estimates From Gastric Evacuation and Stomach Contents, Bioenergetics, and Cesium Concentrations. Can. J. Fish Aquat. Sci. 43 (9), 1760–1775. doi: 10.1139/f86-220
Olson R. J., Young J. W., Ménard F., Potier M., Allain V., Goñi N., et al. (2016). “Chapter Four - Bioenergetics, Trophic Ecology, and Niche Separation of Tunas,” in Advances in Marine Biology. Ed. Curry B. E. (Massachusetts, United States:Academic Press), 199–344.
Oren A., Garrity G. M. (2021). Valid Publication of the Names of Forty-Two Phyla of Prokaryotes. Int. J. Syst. Evol. Microbiol. 71 (10), 1–7. doi: 10.1099/ijsem.0.005056
Pawlowski J., Lejzerowicz F., Apotheloz-Perret-Gentil L., Visco J., Esling P.. (2016). Protist Metabarcoding and Environmental Biomonitoring: Time for Change. Eur. J. Protistol. 55 (Pt A), 12–25. doi: 10.1016/j.ejop.2016.02.003
Poloczanska E. S., Brown C. J., Sydeman W. J., Kiessling W., Schoeman D. S., Moore P. J., et al. (2013). Global Imprint of Climate Change on Marine Life. Nat. Climate Change 3 (10), 919–925. doi: 10.1038/nclimate1958
Pompanon F., Deagle B. E., Symondson W. O.C., Brown D. S., Jarman S. N., Taberlet P., et al. (2012). Who is Eating What: Diet Assessment Using Next Generation Sequencing: NGS DIET ANALYSIS. Mol. Ecol. 21 (8), 1931–1950. doi: 10.1111/j.1365-294X.2011.05403.x
Potier M., Marsac F., Cherel Y., Lucas V., Sabatié R., Maury O., Ménard F., et al. (2007). Forage Fauna in the Diet of Three Large Pelagic Fishes (Lancetfish, Swordfish and Yellowfin Tuna) in the Western Equatorial Indian Ocean. Fish Res. 83 (1), 60–72. doi: 10.1016/j.fishres.2006.08.020
Price M. N., Dehal P. S., Arkin A. P. (2010). FastTree 2 – Approximately Maximum-Likelihood Trees for Large Alignments. PloS One 5 (3), e9490. doi: 10.1371/journal.pone.0009490
Quast C., Pruesse E., Yilmaz P., Gerken J., Schweer , Yarza T. P., et al. (2012). The SILVA Ribosomal RNA Gene Database Project: Improved Data Processing and Web-Based Tools. Nucleic Acids Res. 41 (D1), D590–D596. doi: 10.1093/nar/gks1219
R Core Team (2018) R: A Language and Environment for Statistical Computing. R Foundation for Statistical Computing, (Vienna, Austria). Available at https://www.R-project.org/
Ringø E., Strøm E., Tabachek J. A. (1995). Intestinal Microflora of Salmonids: A Review. Aquacult Res. 26 (10), 773–789. doi: 10.1111/j.1365-2109.1995.tb00870.x
Rombout J. H.W.M., Abelli L., Picchietti S., Scapigliati G., Kiron V.. (2011). Teleost Intestinal Immunology. Fish Shellfish Immunol. 31 (5), 616–626. doi: 10.1016/j.fsi.2010.09.001
Ronquist F., Teslenko M., Van Der Mark P., Ayres D. L., Darling A., Höhna S., et al. (2012). MrBayes 3.2: Efficient Bayesian Phylogenetic Inference and Model Choice Across a Large Model Space. Syst Biol. 61 (3), 539–542. doi: 10.1093/sysbio/sys029
Sato Y., Miya M., Fukunaga T., Sado T., Iwasaki W.. (2018). MitoFish and MiFish Pipeline: A Mitochondrial Genome Database of Fish With an Analysis Pipeline for Environmental DNA Metabarcoding. Mol. Biol. Evol. 35 (6), 1553–1555. doi: 10.1093/molbev/msy074
Sepulveda J., Moeller A. H. (2020). The Effects of Temperature on Animal Gut Microbiomes. Front. Microbiol. 11, 384–384. doi: 10.3389/fmicb.2020.00384
Sergio F., Caro T., Brown D., Clucas B., Hunter J., Ketchum J., et al. (2008). Top Predators as Conservation Tools: Ecological Rationale, Assumptions, and Efficacy. Annu. Rev. Ecol Evol Syst 39, 1–19. doi: 10.1146/annurev.ecolsys.39.110707.173545
Soriano E. L., Ramírez D. T., Araujo D. R., Gómez-Gil B., Castro L. I., Sánchez C. G.. (2018). Effect of Temperature and Dietary Lipid Proportion on Gut Microbiota in Yellowtail Kingfish Seriola Lalandi Juveniles. Aquaculture 497, 269–277. doi: 10.1016/j.aquaculture.2018.07.065
Sprintall J. J., Cravatte S., Dewitte B., Du , Y., Sen Gupta A.. (2021). “ENSO Oceanic Teleconnections,” in El Niño Southern Oscillation in a Changing Climate. Eds. McPhaden M. J., Santoso A., Cai W. (New Jersey, United States: Wiley & Sons: Geophysical Monograph 253, American Geophysical Union), 337–360.
Sydeman W. J., Poloczanska E., Reed T. E., Thompson S. A.. (2015). Climate Change and Marine Vertebrates. Sci. (American Assoc. Advancement Sci) 350 (6262), 772–777. doi: 10.1126/science.aac9874
Takahashi S., Tomita J., Nishioka K., Hisada T., Nishijima M.. (2014). Development of a Prokaryotic Universal Primer for Simultaneous Analysis of Bacteria and Archaea Using Next-Generation Sequencing. PloS One 9 (8), e105592–e105592. doi: 10.1371/journal.pone.0105592
Tamura K. (1992). Estimation of the Number of Nucleotide Substitutions When There are Strong Transition-Transversion and G+C-Content Biases. Mol. Biol. Evol. 9 (4), 678. doi: 10.1093/oxfordjournals.molbev.a040752
Tarnecki A. M., Burgos F. A., Ray C. L., Arias C. R.. (2017). Fish Intestinal Microbiome: Diversity and Symbiosis Unravelled by Metagenomics. J. Appl. Microbiol. 123 (1), 2–17. doi: 10.1111/jam.13415
Tittensor D. P., Beger M., Boerder K., Boyce D. G., Cavanagh R. D., Cosandey–Godin A., et al. (2019). Integrating Climate Adaptation and Biodiversity Conservation in the Global Ocean. Sci. Adv. 5 (11), eaay9969. doi: 10.1126/sciadv.aay9969
Traugott M., Thalinger B., Wallinger C., Sint D.. (2021). Fish as Predators and Prey: DNA-Based Assessment of Their Role in Food Webs. J. Fish Biol. 98 (2), 367–382. doi: 10.1111/jfb.14400
Van Beveren E., Fromentin J.–M., Bonhommeau S., Nieblas A.–E., Metral L., Brisset B., et al. (2017). Predator–prey Interactions in the Face of Management Regulations: Changes in Mediterranean Small Pelagic Species are Not Due to Increased Tuna Predation. Can. J. Fish Aquat. Sci. 74 (9), 1422–1430. doi: 10.1139/cjfas-2016-0152
Varela J. L., Rodríguez-Marín E., Medina A. (2013). Estimating Diets of Pre-Spawning Atlantic Bluefin Tuna From Stomach Content and Stable Isotope Analyses. J. Sea Res. 76, 187–192. doi: 10.1016/j.seares.2012.09.002
Walter J. M., Bagi A., Pampanin D. M. (2019). Insights Into the Potential of the Atlantic Cod Gut Microbiome as Biomarker of Oil Contamination in the Marine Environment. Microorganisms (Basel) 7 (7), 209. doi: 10.3390/microorganisms7070209
Wang Y., Naumann U., Wright S. T., Warton D. I.. (2012). Mvabund– an R Package for Model-Based Analysis of Multivariate Abundance Data. Methods Ecol. Evol. 3 (3), 471–474. doi: 10.1111/j.2041-210X.2012.00190.x
Keywords: climate change, global warming, metabarcoding, fisheries, microbiome, Katsuwonus pelamis, Thunnus albacares
Citation: Trujillo-González A, Li T, Potts J, Nicol S, Allain V, Godwin SC, Vourey E, Portal A, Kumasi B, Usu T, Rodrigo A and Gleeson D (2022) Can Stomach Content and Microbiomes of Tuna Provide Near Real-Time Detection of Ecosystem Composition in the Pacific Ocean? Front. Mar. Sci. 9:811532. doi: 10.3389/fmars.2022.811532
Received: 08 November 2021; Accepted: 30 March 2022;
Published: 06 May 2022.
Edited by:
Felipe Galván-Magaña, Centro Interdisciplinario de Ciencias Marinas (IPN), MexicoReviewed by:
Sharon Z. Herzka, Center for Scientific Research and Higher Education in Ensenada (CICESE), MexicoArturo Tripp, Instituto Politécnico Nacional (IPN), Mexico
Copyright © 2022 Trujillo-González, Li, Potts, Nicol, Allain, Godwin, Vourey, Portal, Kumasi, Usu, Rodrigo and Gleeson. This is an open-access article distributed under the terms of the Creative Commons Attribution License (CC BY). The use, distribution or reproduction in other forums is permitted, provided the original author(s) and the copyright owner(s) are credited and that the original publication in this journal is cited, in accordance with accepted academic practice. No use, distribution or reproduction is permitted which does not comply with these terms.
*Correspondence: Alejandro Trujillo-González, YWxlamFuZHJvLnRydWppbGxvZ29uemFsZXpAY2FuYmVycmEuZWR1LmF1