 Lyndon E. Llewellyn
- Australian Institute of Marine Science, Townsville, QLD, Australia
Blue economies are measured by mining national statistics or economic modeling, requiring substantial capability and quality data, both of which are not universally available. The lack of harmonized methods hampers international comparisons and results are usually only attributable at the national scale. An alternative method is described here that leverages an open computing environment and data to quantify blue economies using marine night light producing measurements that are intercomparable and scalable from national to regional to global.
Introduction
Interest in blue economies (Park and Kildow, 2014) is escalating as evidenced by the establishment of the High Level Panel for a Sustainable Ocean Economy, a multinational effort including countries ranging from small island developing states to G20 nations (Stuchtey et al., 2020). A key recommendation of this Panel is to improve and harmonize national accounts to better enable sustainable blue economic policy development (Fenichel et al., 2020). However, this approach requires substantial data gathering and statistical capability and can only happen after compiling broader national datasets.
Remote sensing of night light has long been explored as a proxy for economic statistics (Chen and Nordhaus, 2011; Henderson et al., 2012; Mellander et al., 2015) but not marine economics. Primarily daytime activities will not be detected, but it can measure light from key components of blue economies including offshore oil and gas operations, construction and maintenance of marine infrastructure, shipping and ports, dense fishing grounds, offshore aquaculture and intensity of coastal development (Zhao et al., 2018). In 2010, Google™ released an open access innovation (Google Earth Engine, GEE) separate from their better known Google Earth visualization tool. GEE is a coding environment which includes substantial global remote sensing data more amenable to bespoke data products (Gorelick et al., 2017; Kumar and Mutanga, 2018). This includes the Day/Night band of the Visible Infrared Imaging Radiometer Suite on the Suomi National Polar-Orbiting Partnership satellite (Liao et al., 2013) which has delivered absolute measures of night light intensity since April 2012 (Jing et al., 2016). Importantly, GEE also enables data masking allowing spatial subsetting of data enabling light from land-based sources to be hidden and focusing only on night light beyond coastlines. This can enable comparisons between marine only and total night light within spatially defined regions. For nations, this can be further resolved by restricting analyses to within exclusive economic zones (EEZ) boundaries. Data can also be integrated across different time scales to create time series. This study developed a protocol to measure night light from marine only sources and related it to standard, but varied, measures of economic activity because a unified definition of blue or marine economies has not yet been resolved (Lee et al., 2020). It also explored its utility and validity at a range of scales, from national, to continental, regional and global scales.
Methods
This approach used night-time light data (Visible Infrared Imaging Radiometer Suite Day/Night Band), housed within the Google Earth Engine (GEE) along with GEE’s coding capability to extract, filter and summarize data over spatially defined regions. This night light dataset is from a single observing instrument on a satellite that measures all of the globe’s coasts and oceans and is aggregated at the monthly level and excludes light from natural sources. This approach was developed and validated using time series data for the marine industrial economy of Australia (Anonymous, 2020), a growing time series of marine and maritime economic data mined from various national datasets prior to application to other countries and geographies.
Datasets
Night-time light data was from the Visible Infrared Imaging Radiometer Suite (VIIRS) Day/Night Band (DNB), which became operational in 2012, and is made freely available by the Earth Observation Group, NOAA National Geophysical Data Center. The version of this data available on Google Earth Engine (Anonymous, 2021) are monthly composites processed to exclude data near the edges of the swath. Importantly, it does not filter out lights from aurora, fires, boats, and other temporal lights but does remove lightning, moon and cloud-cover effects. Details about data filtering and quality controls can be found in Elvidge et al. (2017). It does not circumvent non-detection of illegal activities obscured by perpetrators eliminating emitted light. However, such activities would also not be quantified when assessing economies using national accounts and other statistical methods.
To eliminate night-time light emanating from land sources from subsequent analyses, a MODIS derived dataset (MOD44W.006 Terra Land Water Mask Derived from MODIS and SRTM Yearly Global 250 m) (Carroll et al., 2017) was used to mask data pixels over land. This product is derived using a decision tree classifier trained with historical data with a series of masks applied to remove effects of terrain shadow, burn scars, cloudiness, or ice cover in oceans. However, this mask does not exclude inland water bodies which may be surrounded by significant shore-based communities or host on water infrastructure (dams and the like). Light from these sources was eliminated as described below.
When required, EEZ boundaries were extracted from the global EEZ dataset provided by the Flanders Marine Institute (2019) as shapefiles and converted to XY coordinates using QGIS (Quantum GIS, version 3.1.4, 2020). Shared or disputed EEZ’s were excluded from analysis. Country borders were obtained from the Database of Global Administrative Areas (version 3.4)1 and converted to XY coordinates as per EEZ boundaries. This same source also provides a dataset that depicts EEZ boundaries joined with national borders allowing the same calculations to be made for non-island nations.
Data Extraction and Summary Statistic Calculation
The coding detail is available upon request but in short, the following steps were taken:
1. Monthly data within each calendar years was called and scaled to 250 m2 pixels for national data and 1,000 m2 pixels for regional and global data. These values were chosen by trial and error and were the highest resolution that would routinely not overwhelm the computational power of GEE and cause it to timeout.
2. The median value for each pixel within each calendar year was extracted. It has previously been shown that using the median within a 12 month window removes high and low radiance outliers (Elvidge et al., 2021).
3. Noise was further reduced by eliminating values < 1 followed by log10 transformation.
4. To eliminate night-time light originating land sources from analyses, a MODIS dataset (MOD44W.006 Terra Land Water Mask Derived from MODIS and SRTM Yearly Global 250 m) was used to mask data pixels over land. This mask does not exclude inland water bodies which may be surrounded by significant shore-based communities or host on-water infrastructure (dams and the like). Light from these sources was eliminated by drawing manual polygons that coarsely followed the coastline but some ten’s of kilometers from the coast. This additional polygon excluded large urban areas within deltas on the assumption they would include ports, marinas, maritime industry, fishing fleets. However, light from upstream of these deltaic urban areas was eliminated on the assumption they were likely to be riverine not marine. Measurement of night light was then measured across the defined region and after masking land mass from within these same datasets and then subtracting the nightlight remaining from inland water bodies after masking.
5. Retained data was then summed over the area analyzed.
6. When national blue economies were assessed, the area analyzed was defined by constructing polygons based on the EEZ boundaries only for island nations or for non-island nations, polygons were created by merging EEZ boundaries with country borders with the coastline between the EEZ and land mass eliminated (see Figure 1 for an example). Measurement of night light was then measured across the EEZ (or EEZ + land mass) and after masking land mass from within these same datasets.
7. For the analysis done at continental scale (Africa), a shapefile was created in QGIS by merging the most oceanward edge of each nation’s EEZ boundary into a single shapefile.
8. For analyses at regional and global scales, polygons were drawn manually within GEE to match the extent of the regions being analyzed.
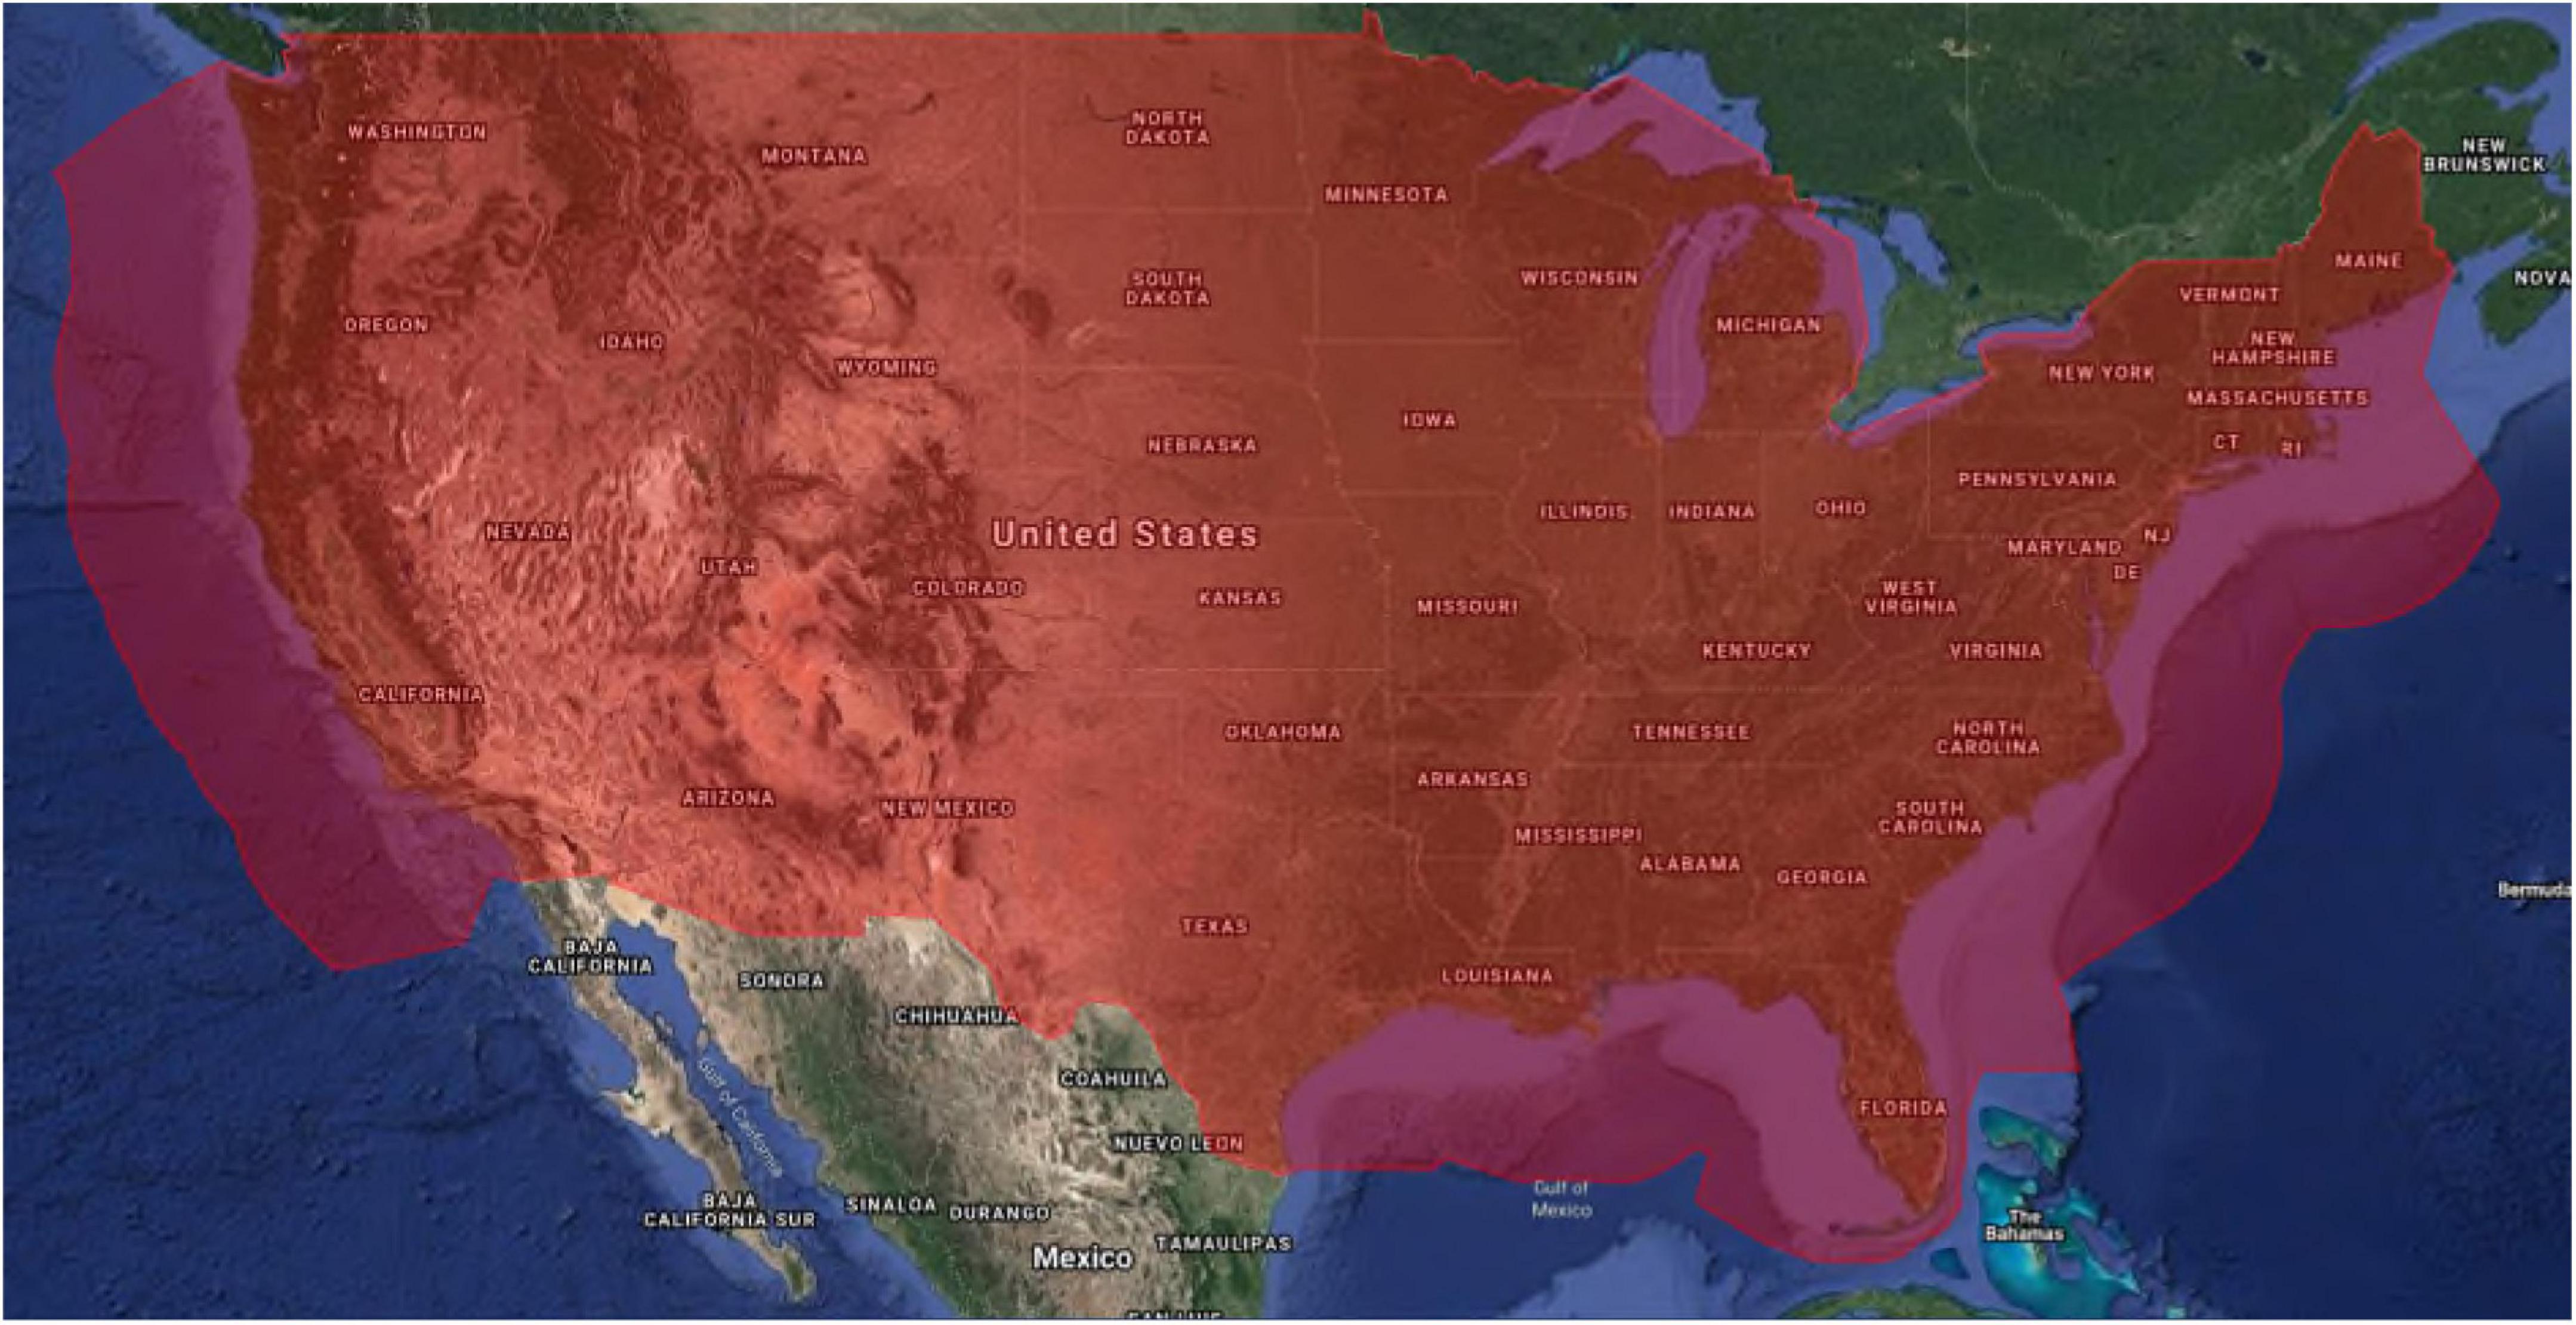
Figure 1. Example showing a spatial polygon that combines both EEZ boundaries and country borders.
Results
Protocol Refinement
The preferred selection of variables was guided by reference to the Australian Marine Industry Index (Anonymous, 2020) which includes many of the industries detected by night light emission with some examples shown in Figures 2A–D. Figure 2E shows a close correlation between summed night light data across Australia and its EEZ and GDP from the Australian Bureau of Statistics (5206.0—Australian National Accounts: National Income, Expenditure and Product, Jun 2020, Series ID A2304334J). Night light from the coastline out to the EEZ was ∼5% of the total night light across the continent and EEZ each year from 2012 to 2018, increasing to 6.9% in 2019 (Figures 2F, 3A) due to the start-up of two major offshore oil and gas facilities including a floating liquefied natural gas facility off the north-west Australian coast. The Australian Marine Industry Index has shown that maritime and marine industries comprise 4–5% of the Australia’s GDP, up until 2017/18 (noting Australia’s financial year runs July–June). These proportions can then be used to derive a blue economy value from the Australian GDP that can be compared to the Australian Marine Industry Index (Anonymous, 2020) and shows close agreement between the night light measured economy and the more traditional method using national statistics (Figure 2F). These two datasets are not directly comparable because while night light measurement will detect offshore oil and gas activities, fishing, aquaculture, shipping including anchorages and associated port activities, it will not measure activities such as onshore aquaculture of marine species or much of the tourism sector which includes onshore accommodation and services as well as daytime tourist trips to marine locations. Night light also detects light spill from coastal development, often included in total economic value assessments as an amenity value (Mehvar et al., 2018).
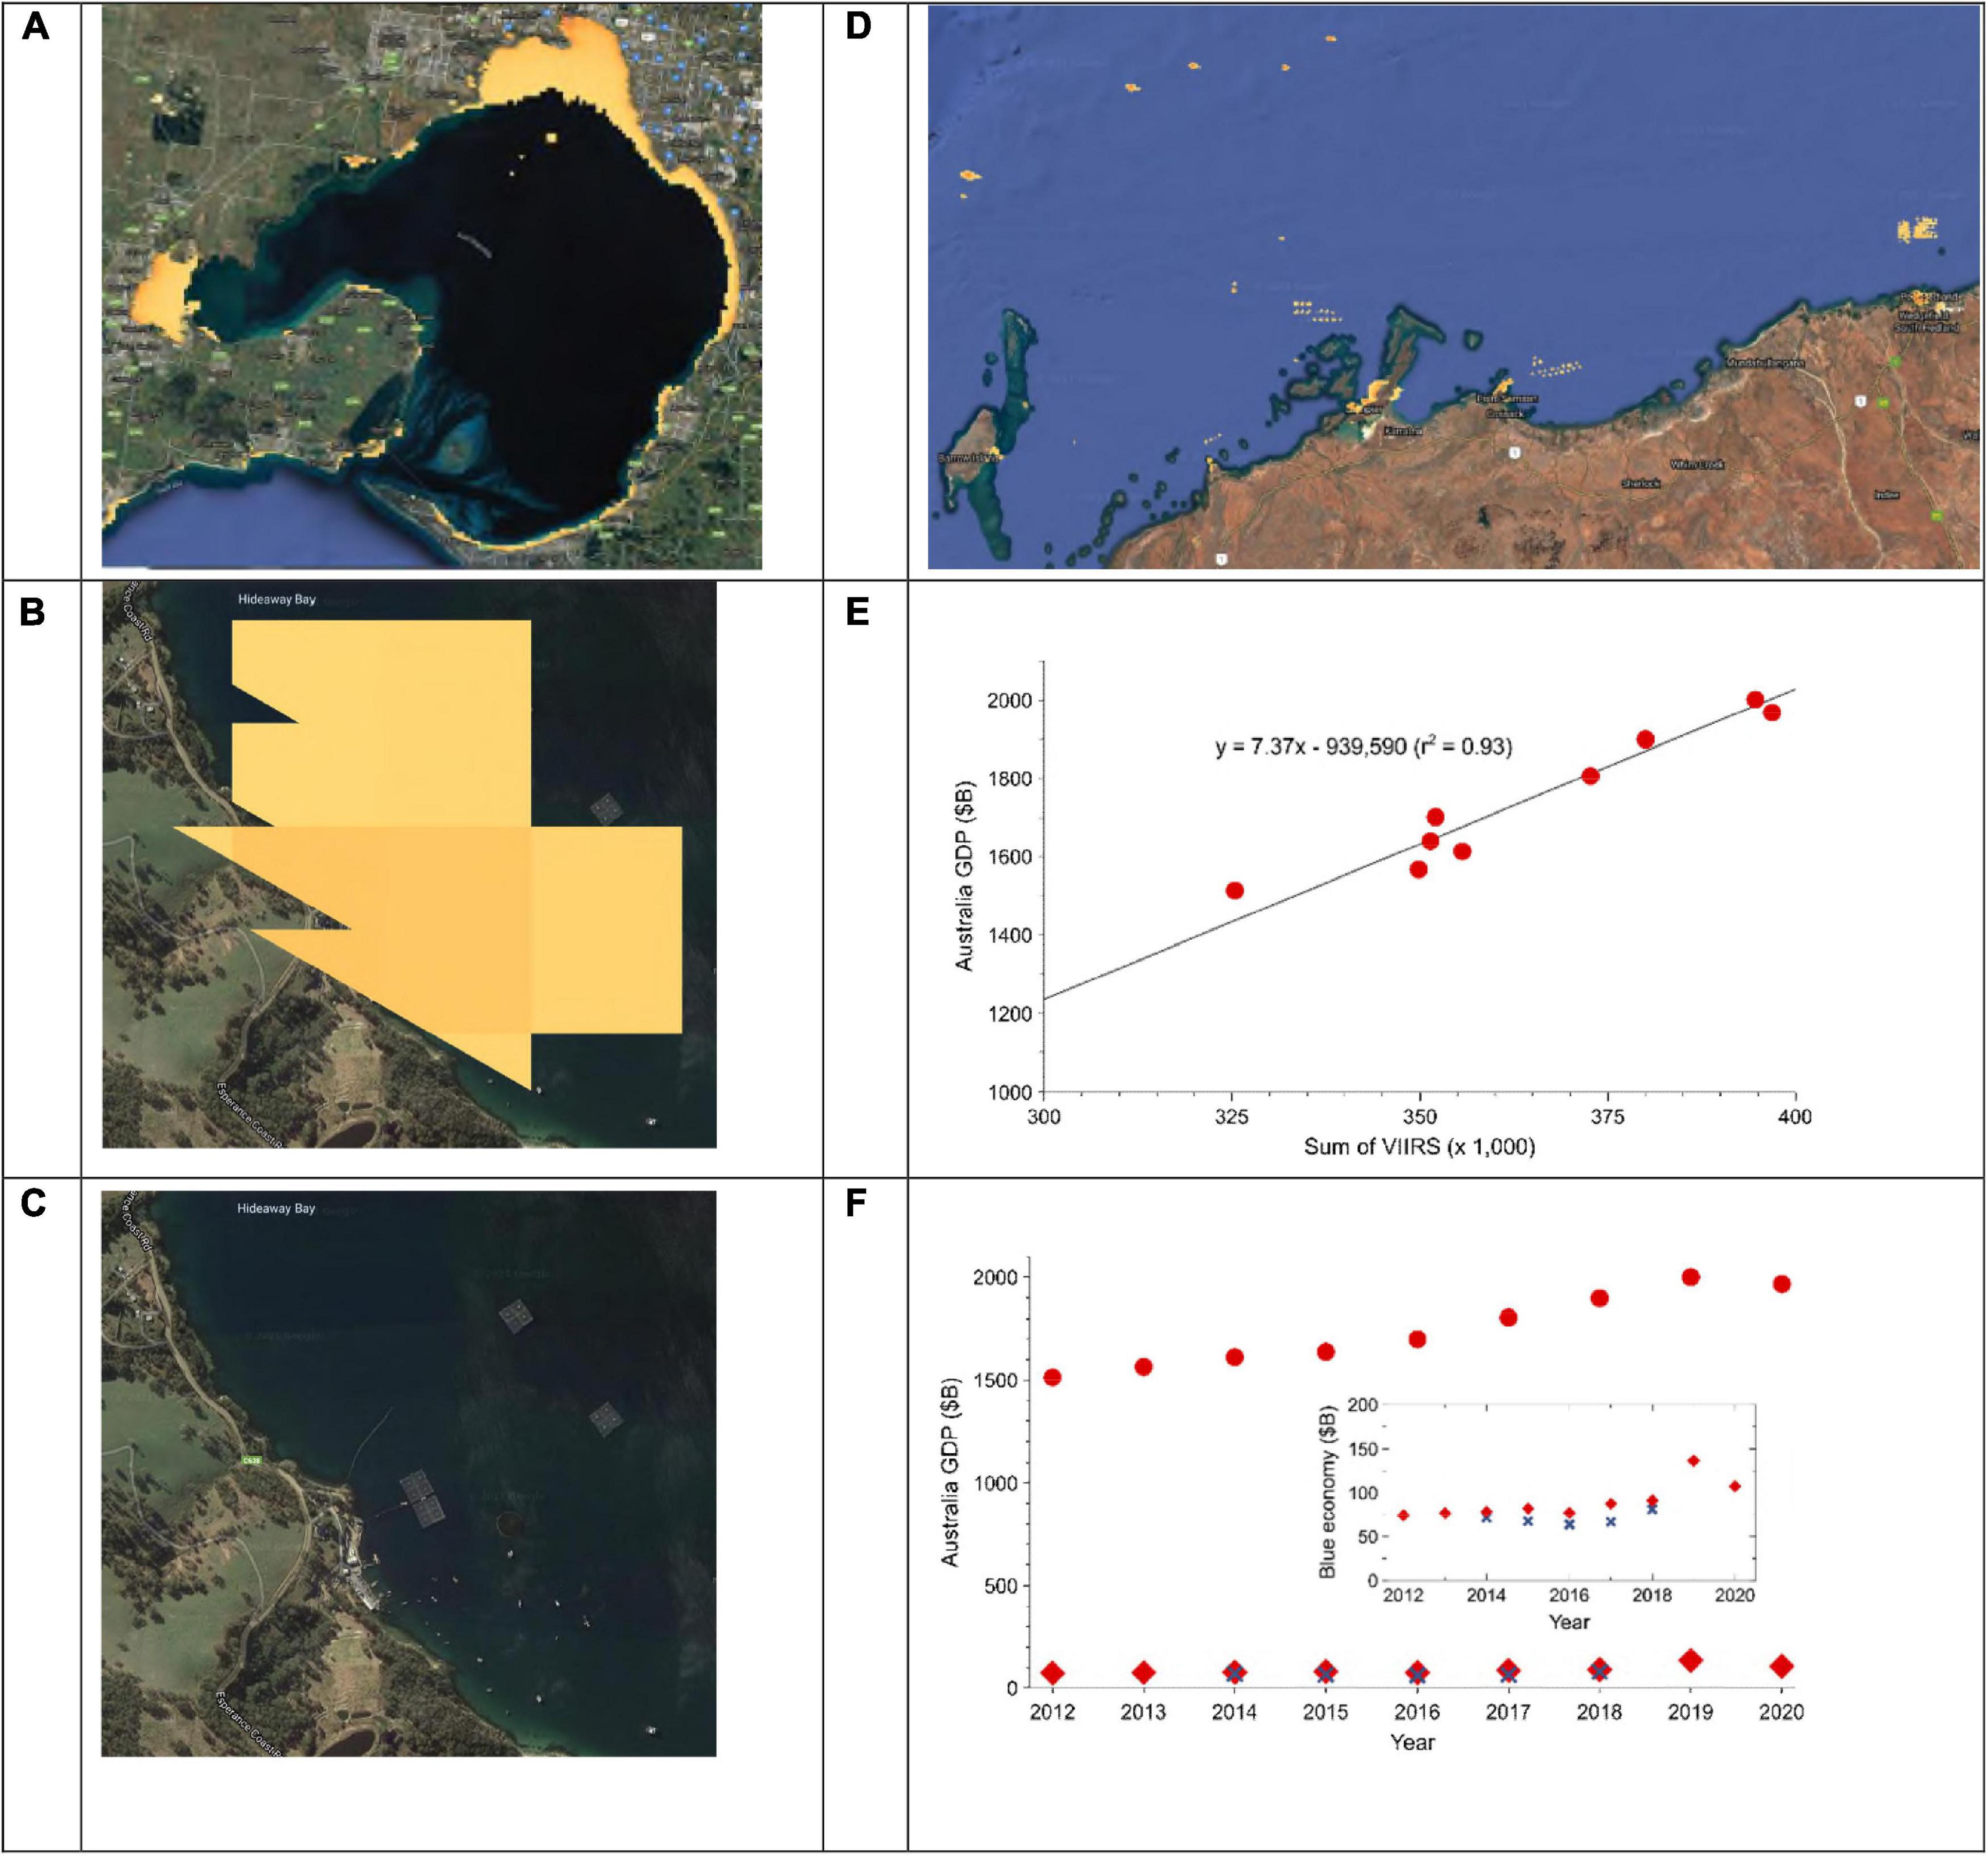
Figure 2. Variable refinement and validation. (A–D) Give examples of Australian marine economic activity revealed by night lights from the pilot study with all examples relating to 2019. (A) Port Philip Bay adjacent to the City of Melbourne (B,C) offshore aquaculture in southern Tasmania with night light layer off and on; (B) an area off the north west coast of Australia with offshore oil and gas facilities and large ports and associated ship anchorages for iron ore export (area depicted is approximately 300 km east to west); (E) relationship between VIIRS night light across the whole of Australia’s territory and Australian nominal GDP using data from the Australian Bureaus of Statistics (5206.0—Australian National Accounts: National Income, Expenditure and Product, Jun 2020, Series ID A2304334J) with the regression line equation and quality of fit depicted (F) Australian nominal GDP for the depicted years using data from the Australian Bureau of Statistics ( ) and the derived blue economy using the proportion of night light method described here (
 ). The blue crosses depict the size of the Australian marine industry estimated using national account data (Anonymous, 2020).
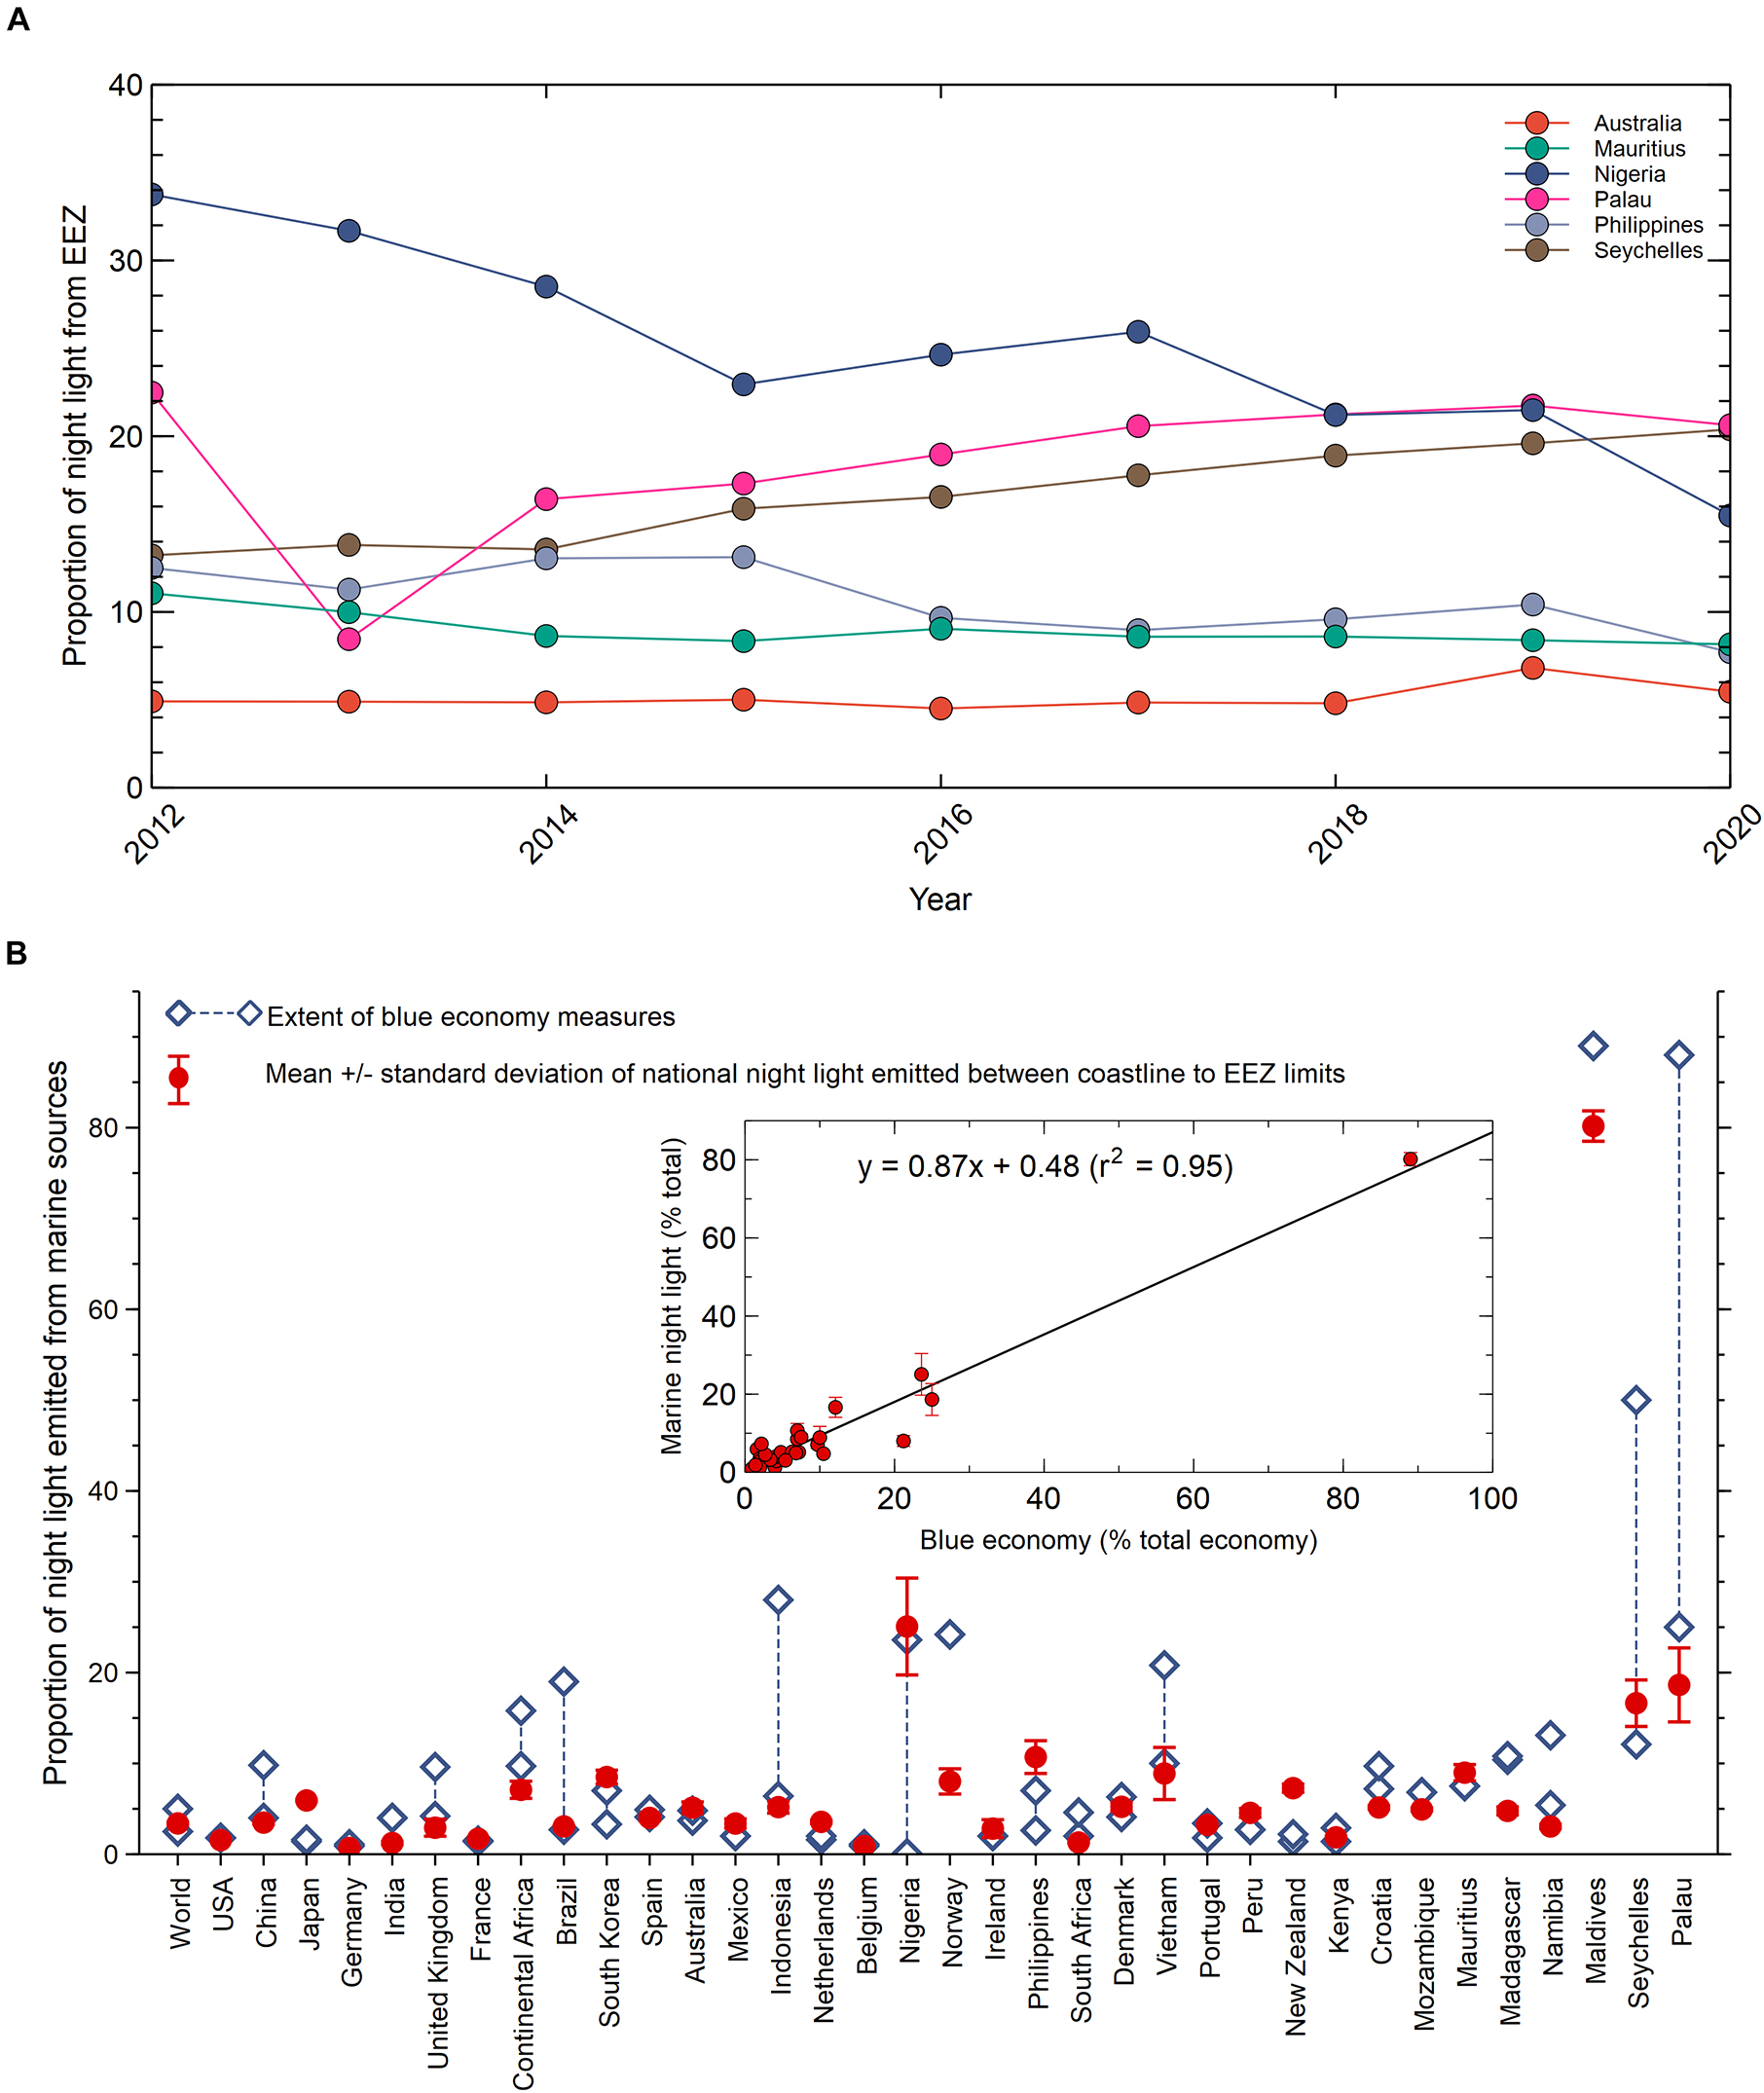
Figure 3. Proportion of night light emitted from the ocean for the world, continental Africa and the EEZ’s of a range of countries. (A) Mean and standard deviation over the years 2012–2020; countries are ordered from left to right based on size of national GDP in 2020 as reported by the United Nations Statistics Division, National Accounts Section. The inset shows the linear regression between the values shown in the main figure with the nearest traditional measure of that countries’ blue economy (B) time series for selected countries exhibiting notable events or trends in night light within their EEZ and beyond the coastline.
Blue Economy Measures From Other Nations and at Other Scales
This study developed a method to derive the proportion of night light producing activity emitted beyond the coastline. This could be further sub-divided into nocturnal light from within EEZ boundaries for attribution to national economies. To determine how comparable this measure is to traditional national economic measures, a variety of blue (marine or coastal) economy measures, in terms of proportionality, were surveyed from the gray and primary literature and media announcements. Countries selected for assessing the reliability of this approach reflected a variety of development status, different geographies like small to large island nations and coastal nations from large continents whose night light would overlap with neighboring nations. Figures were sought that were within or near the years covered by this analysis (2012–2020). This review of traditional measures of blue economies is detailed in Supplementary Material.
There was close agreement between estimates of the size of a blue economy using night light relative to the traditional accounting approach (Figure 3B). This included estimates of national blue economies as well as continental (African Union–Inter-African Bureau for Animal Resources [AU-IBAR], 2019) and the global blue economy (OECD, 2016). In many instances, the night light measure was near or within the range of other blue economy measures with the linear regression between night-light and the closest of the traditional blue economy measures (Figure 3B inset) approaching unity and being highly significant (p < 0.05). In many cases, the proportionate contribution to a nation’s night light from sources beyond its coastline did not vary much between years as indicated by the small standard deviations in Figure 3B. However, in some cases, there was considerable variation through time with the most notable examples depicted in Figure 3A.
Discussion
The code was written to extract night light and annual medians followed by integration within spatial polygons, calling upon land masks when required. Protocol refinement and variable selection was achieved by comparison to the Australian Marine Industry Index (Anonymous, 2020) time series. After satisfactory agreement was achieved, utility of this method to other jurisdictions was tested by assessing against blue economy measures from a variety of countries possessing diverse EEZ sizes, geographies (e.g., island vs. non-island) and economic development. Figure 3B shows the average of annual measures of coast to EEZ night light relative to more traditional blue economy estimates from selected nations and reviewed in Supplementary Material. In many cases, there is not a single measure of the blue economy for a nation and the different estimates can vary substantially (e.g., see Indonesia, Nigeria and the Seychelles, Figure 3B). Given the absence of a single method or value for many countries or geographies, to evaluate the performance of this method relative to more traditional techniques, a regression was drawn using the conventional economic measure closest to that obtained using the night light method described here (inset, Figure 3B). Agreement was high (r2 = 0.95) but the slope of the regression line was 0.87, suggesting a trend toward underestimating contribution to GDP and may reflect the fact that this method will only detect offshore sectors of the blue economy. Outliers may be influential upon the quality of regression coefficients (Cook, 1977) and this may be the case in Figure 3B where the values for the Maldives are several-fold higher than the bulk of the measurements. Removal of the Maldives reduces the regression coefficient to 0.71, which remains statistically significant (p < 0.05) but increases the slope of the line to 0.98.
The method can also be applied to measuring blue economies beyond national scales. It returned an identical value to the global value of the blue economy in 2010 estimated using more traditional methods (OECD, 2016), and changed little between 2012 and 2020 as evidenced by the obscuring the standard deviation bars by the data point in Figure 3B. However, it underestimated the estimates of the continental Africa blue economy (African Union–Inter-African Bureau for Animal Resources [AU-IBAR], 2019) by approximately 5% (7.1% vs. 12.6%, see Supplementary Material). While there have been no estimates of blue economies at scales between continental and global, as another example, spatial polygons were created covering northern and southern extratropical regions as well as the tropics. Marine night light in the tropics contributed 6.3 ± 0.7% of all night light within the tropics, declining from 7.4% in 2012 down to 5.1% in 2020. The contribution in the northern and southern non-tropical regions were stable from 2012 to 2020, being 2.7 ± 0.1 and 2.9 ± 0.1, respectively. As a proportion of global marine night light, the tropics contributed 2.1 ± 0.1 of global marine night light and 1.2 ± 0.1 and 0.2 ± 0.01 for the northern and southern extratropical regions, respectively, with relatively little change between the years. No measure of tropical or non-tropical blue economies has been undertaken to validate these measures but the preponderance of light in the tropics may reflect that it is home to just over 43% of the world’s population (State of the Tropics, 2020) with 1.3 billion people living within 100 km of the coast (in 2010) and heavily dependent on the oceans for food and livelihoods (Sale et al., 2014).
Marine night light time series also reveal events and trends, with several shown in Figure 3A. Nigeria, whose marine economy and offshore night light intensity is heavily influenced by the offshore oil and gas sector shows a long-term downward trend from 2012 to 2020 dipping in 2015, the same year the Nigerian oil and gas sector was disrupted by civil unrest, and again in 2020 when production slowed due to depressed demand triggered by the COVID-19 pandemic. Palau experienced a 50% dip in offshore night light in 2013, the year it was hit by Super Typhoon Haiyan suffering extensive damage to coastal infrastructure and dampening fishing and tourism. Likewise, the Philippines experienced three typhoons in 2016 and its marine night light substantially decreased that year followed by a gradual return to pre-2016 levels. Australian marine night light jumped in 2019 mostly due to the operational start of a new offshore technology in the form of a very large floating liquefied natural gas plant. It will take time for national accounts to mature to determine whether this increase is reflected in national economic data. Night light decreased in 2020 after an unplanned shutdown of this facility compounded by the COVID-19 pandemic reducing gas demand. The two island nations of the Seychelles and Mauritius have explicit blue economy government policies but differing marine night light trends, increasing 54% from 2012 to 2020 in the Seychelles but dropping several per cent in Mauritius which may indicate differential effectiveness of their policies.
Disparities can be attributed to the portfolio detected by night light analysis differing from sectors included in accounting-based approaches, which can be highly variable because there is no standardized approach to measuring blue economies (Fenichel et al., 2020). For example, New Zealand’s blue economy index is likely an underestimate because it does not include tourism or government expenditure (Stats NZ Tatauranga Aotearoa, 2019). The underestimate of the Chinese blue economy relative to official blue economy statistics (The State Oceanic Administration of China, 2018) may be partially explained by their inclusion of blue economic activity beyond the EEZ like fishing in international waters. Night light can also radiate across EEZ boundaries and be included in the measurement of a neighboring nations marine night light, like that which comes into the Indonesia EEZ from maritime traffic transiting the Singapore Strait.
This approach provides a spatial tool for analyzing marine economic activity which can be integrated with other spatial data and model outputs like environmental quality or ecosystem services, to monitor sustainability of blue economic development. It may be further improved by calibration of the emitted night light to a specific economic activity for which reliable financial and economic data is available. For example, offshore oil and gas is often aggregated within the same location and so monitoring using this method can be tailored to a basin like the Ku-Malook-Zaap oil and gas field off the coast of the Mexican state of Campeche (Figure 4A). Other large-scale activities such as major fishing grounds (see Figure 4B for an example) may also be monitored and related to other factors that may impact upon this form of economic activity. This method used the same settings developed for the Australian blue economy for all other measures and these may need fine tuning to each country or geographic scale targeted but this initial test demonstrates its promise as a rapid method to monitor marine economic scale and variation.
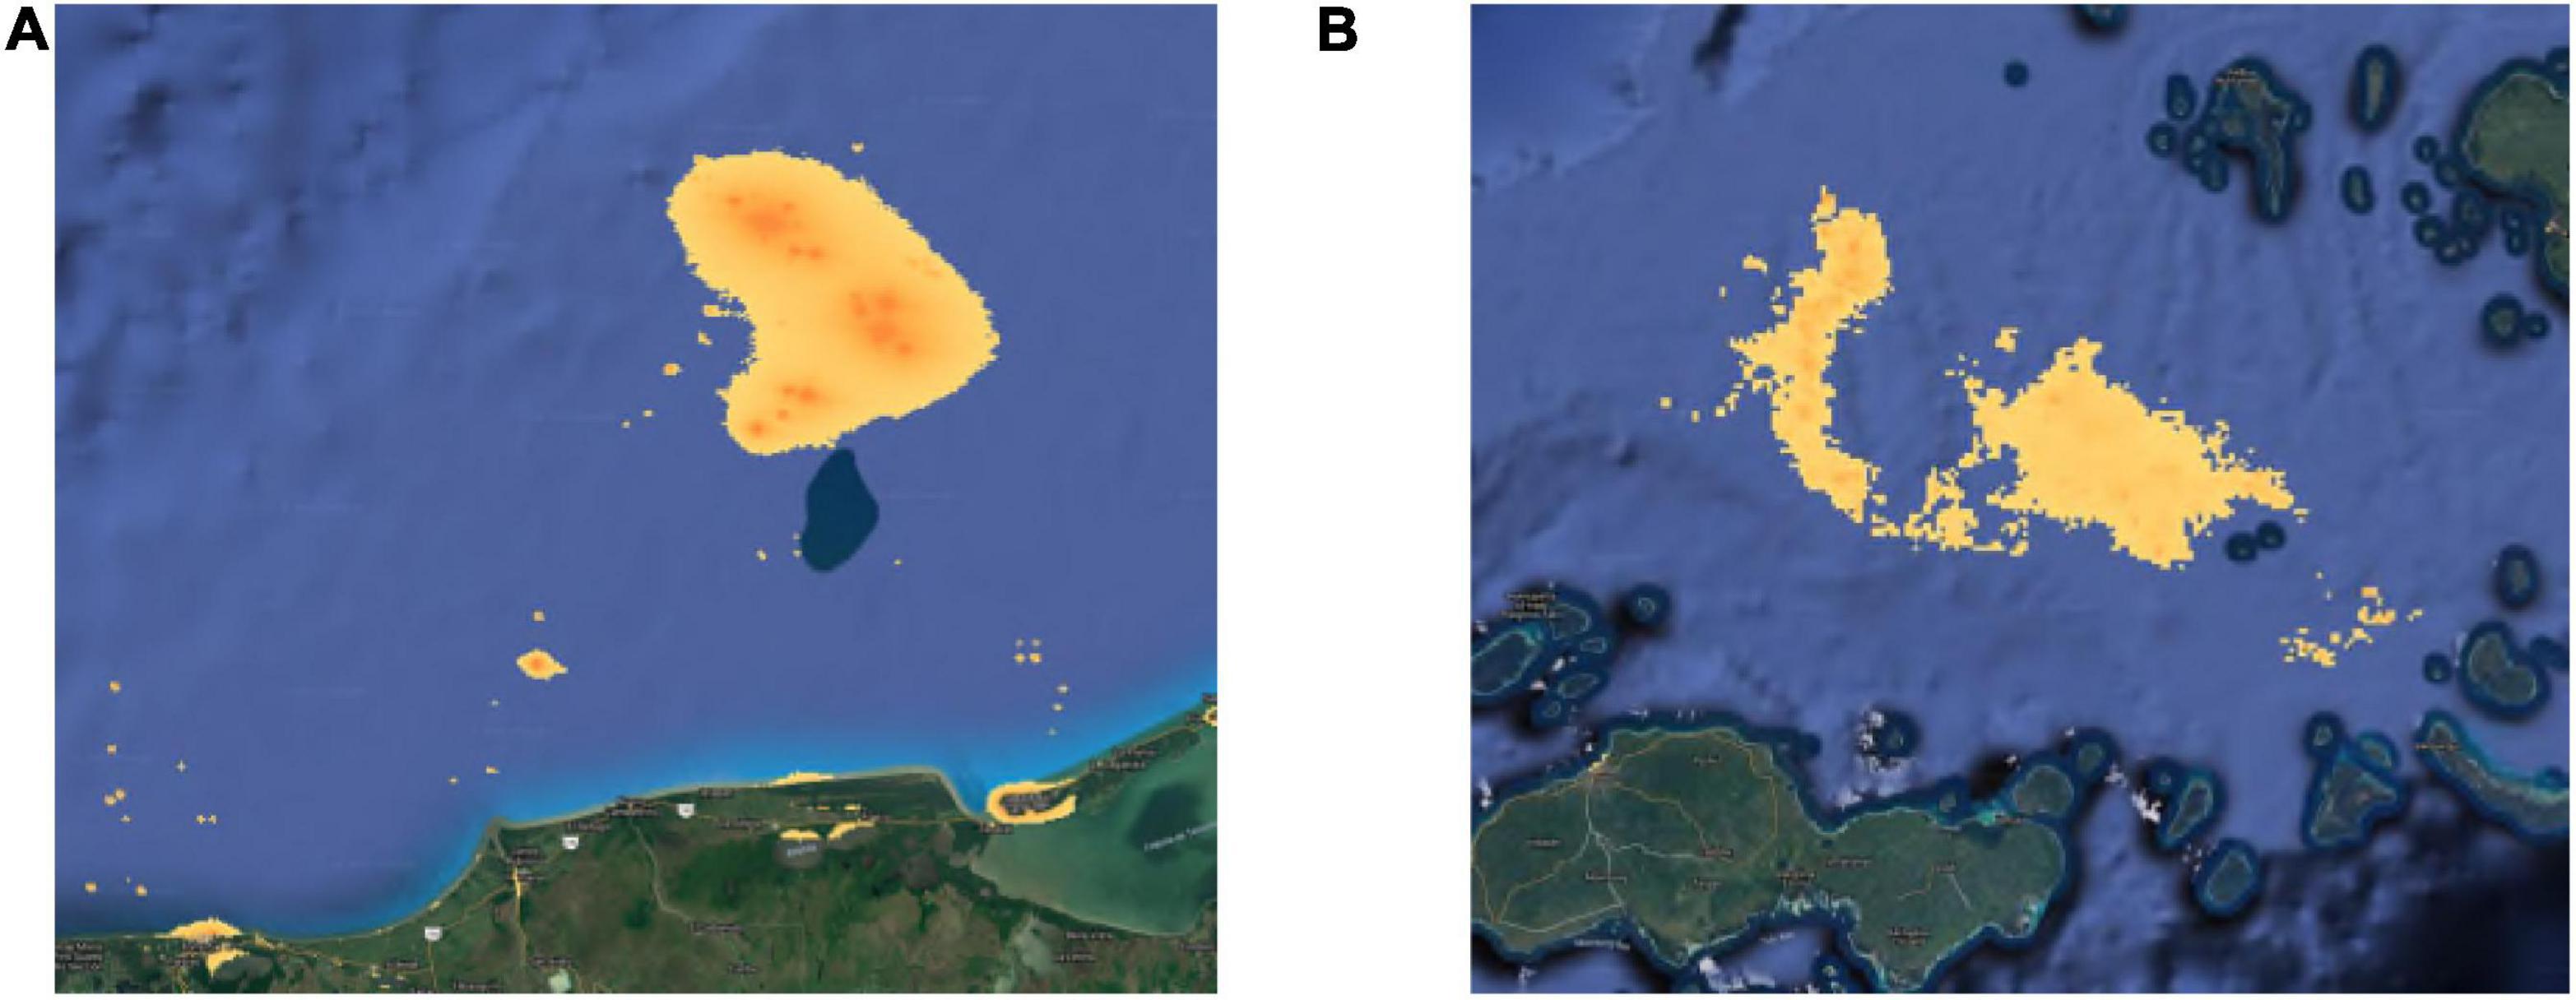
Figure 4. Examples of clustered blue economic activity detected using night light. (A) The Ku-Malook-Zaap oil and gas field off the coast of the Mexican state of Campeche (shown area is approximately 220 km east to west); (B) a large fishing ground north of Jolo Island in the central Philippines (area shown approximately 140 km east to west).
Conclusion
This method independently measures much, but not all, of a blue economy and can allow like-with-like comparisons. Regiospecific or sector specific policy development is also enabled because it can be scaled geographically including upon areas where industries may cluster like within oil and gas basins. It also circumvents data quality issues arising from inadequate national accounts or even data manipulation for political purposes. However, it measures activity, not capital generation (e.g., commodity prices impact GDP not just production levels) and only detects sea surface activity, except when it reflects deep water resources (e.g., fishing, offshore oil, and gas). While not able to replace national accounts it provides a useful complementary tool and one that can be up- and down-scaled to different geographies and used to create time series. Finally, it is universally accessible, including nations without the necessary national account infrastructure, and calculable as soon as night light data is released enabling faster policy responses to ensure sustainability of blue economic growth.
Data Availability Statement
Publicly available datasets were analyzed in this study. All data used is in the public domain and accessible via Google Earth Engine. All polygons, including shapefiles ingested into GEE as assets, and the code used in this study is available from the corresponding author upon reasonable request.
Author Contributions
LL conceived the approach and wrote the code and manuscript.
Funding
Funding from this study came from Australian government funding to the Australian Institute of Marine Science.
Conflict of Interest
The author declares that the research was conducted in the absence of any commercial or financial relationships that could be construed as a potential conflict of interest.
Publisher’s Note
All claims expressed in this article are solely those of the authors and do not necessarily represent those of their affiliated organizations, or those of the publisher, the editors and the reviewers. Any product that may be evaluated in this article, or claim that may be made by its manufacturer, is not guaranteed or endorsed by the publisher.
Acknowledgments
I am grateful to Google Inc. for its Earth Engine capability and the various organizations cited within the manuscript that make their data freely available.
Supplementary Material
The Supplementary Material for this article can be found online at: https://www.frontiersin.org/articles/10.3389/fmars.2022.810498/full#supplementary-material
Footnotes
References
African Union–Inter-African Bureau for Animal Resources [AU-IBAR] (2019). Africa Blue Economy Strategy. Kenya: African Union – Inter-African Bureau for Animal Resources (AU-IBAR).
Anonymous (2020). The AIMS Index of Marine Industry 2020. Townsville: Australian Institute of Marine Science.
Anonymous (2021). VIIRS Nighttime Day/Night Band Composites Version 1 [Online]. Earth Observation Group, Payne Institute for Public Policy, Colorado School of Mines via Google Earth Engine. Available online at: https://developers.google.com/earth-engine/datasets/catalog/NOAA_VIIRS_DNB_MONTHLY_V1_VCMCFG#description (Accessed August 22, 2021 2021).
Carroll, M., Dimiceli, C., Wooten, M., Hubbard, A., Sohlberg, R., and Townshend, J. (2017). MOD44W MODIS/Terra land water mask derived from MODIS and SRTM L3 Global 250m SIN Grid V006. Sioux City, SD: NASA EOSDIS Land Processes DAAC.
Chen, X., and Nordhaus, W. D. (2011). Using luminosity data as a proxy for economic statistics. Proc. Natl. Acad. Sci. U. S. A. 108, 8589–8594. doi: 10.1073/pnas.1017031108
Cook, R. D. (1977). Detection of Influential Observation in Linear Regression. Technometrics 19, 15–18.
Elvidge, C.D., Baugh, K., Zhizhin, M., Hsu, F. C., and Ghosh, T. (2017) VIIRS night-time lights, Int. J. Remote Sens. 38, 5860–5879.
Elvidge, C. D., Zhizhin, M., Ghosh, T., Hsu, F.-C., and Taneja, J. (2021). Annual Time Series of Global VIIRS Nighttime Lights Derived from Monthly Averages: 2012 to 2019. Remote Sens. 13:922. doi: 10.3390/rs13050922
Fenichel, E. P., Addicott, E. T., Grimsrud, K. M., Lange, G.-M., Porras, I., and Milligan, B. (2020). Modifying national accounts for sustainable ocean development. Nat. Sustain. 3, 889–895. doi: 10.1038/s41893-020-0592-8
Flanders Marine Institute (2019). Maritime Boundaries Geodatabase: Maritime Boundaries and Exclusive Economic Zones (200NM), version 11. Ostend: Flanders Marine Institute.
Gorelick, N., Hancher, M., Dixon, M., Ilyushchenko, S., Thau, D., and Moore, R. (2017). Google Earth Engine: planetary-scale geospatial analysis for everyone. Remote Sens. Environ. 202, 18–27. doi: 10.1016/j.rse.2017.06.031
Henderson, J. V., Storeygard, A., and Weil, D. N. (2012). Measuring economic growth from outer space. Am. Econ. Rev. 102, 994–1028. doi: 10.1257/aer.102.2.994
Jing, X., Shao, X., Cao, C., Fu, X., and Yan, L. (2016). Comparison between the Suomi-NPP day-night band and DMSP-OLS for correlating socio-economic variables at the provincial level in China. Remote Sens. 8:17. doi: 10.3390/rs8010017
Kumar, L., and Mutanga, O. (2018). Google Earth Engine applications since inception: usage, trends, and potential. Remote Sens. 10:1509. doi: 10.3390/rs10101509
Lee, K-H., Noh, J., and Khim, J. S. (2020) The Blue Economy and the United Nations’ sustainable development goals: Challenges and opportunities. Environ. Int., 137, 105528.
Liao, L. B., Weiss, S., Mills, S., and Hauss, B. (2013). Suomi NPP VIIRS day-night band on-orbit performance. J. Geophys. Res. 118, 12705–12718.
Mehvar, S., Filatova, T., Dastgheib, A., De Ruyter Van Steveninck, E., and Ranasinghe, R. (2018). Quantifying Economic Value of Coastal Ecosystem Services: a Review. J. Mar. Sci. Eng. 6:5. doi: 10.3390/jmse6010005
Mellander, C., Lobo, J., Stolarick, K., and Matheson, Z. (2015). Night-time light data: a good proxy measure for economic activity? PLoS One 10:e0139779. doi: 10.1371/journal.pone.0139779
Park, D. K. S., and Kildow, D. J. T. (2014). Rebuilding the classification system of the ocean economy. J. Ocean Coast. Econ. 2014, 1–23.
Sale, P. F., Agardy, T., Ainsworth, C. H., Feist, B. E., Bell, J. D., Christie, P., et al. (2014). Transforming management of tropical coastal seas to cope with challenges of the 21st century. Mar Pollut. Bull. 85, 8–23. doi: 10.1016/j.marpolbul.2014.06.005
Stats NZ Tatauranga Aotearoa (2019). Environmental-economic accounts: 2019 (data to 2017). Wellington: Stats NZ Tatauranga Aotearoa.
Stuchtey, M. R., Vincent, A., Merkl, M., and Bucher, M. (2020). Ocean solutions that benefit people, nature and the economy. Washington: World Resources Institute.
The State Oceanic Administration of China (2018). Statistical Yearbook of China Maritime Economy (Various Issues). Beijing: The State Oceanic Administration of China.
Keywords: blue economy, remote sensing, Google Earth Engine, VIIRS, marine economy, night light
Citation: Llewellyn LE (2022) An Open and Scalable Method for Spatial Measurement of Blue Economies. Front. Mar. Sci. 9:810498. doi: 10.3389/fmars.2022.810498
Received: 07 November 2021; Accepted: 07 January 2022;
Published: 04 March 2022.
Edited by:
Kum Fai Yuen, Nanyang Technological University, SingaporeReviewed by:
Li Tang, Iowa State University, United StatesCarsten Weerth, FOM University of Applied Sciences for Economics and Management, Germany
Copyright © 2022 Llewellyn. This is an open-access article distributed under the terms of the Creative Commons Attribution License (CC BY). The use, distribution or reproduction in other forums is permitted, provided the original author(s) and the copyright owner(s) are credited and that the original publication in this journal is cited, in accordance with accepted academic practice. No use, distribution or reproduction is permitted which does not comply with these terms.
*Correspondence: Lyndon E. Llewellyn, TC5MbGV3ZWxseW5AYWltcy5nb3YuYXU=