
95% of researchers rate our articles as excellent or good
Learn more about the work of our research integrity team to safeguard the quality of each article we publish.
Find out more
ORIGINAL RESEARCH article
Front. Mar. Sci. , 16 June 2022
Sec. Marine Fisheries, Aquaculture and Living Resources
Volume 9 - 2022 | https://doi.org/10.3389/fmars.2022.809636
 Jun Zhang1,2,3,4*
 Kui Zhang1,2,3
 Yan-e Jiang1,3
 Yuan-jie Li1
 Jiang-tao Fan1,3
 Wen-ming Yu1,3
 Zuo-zhi Chen1,2,3,4*
Three bottom trawl surveys over the northern continental slope in the South China Sea (18°50′–20°40′N, 112°50′–115°10′E) were carried out, in June 2015, March 2017 and September 2018, to investigate species composition, biodiversity and community structure of demersal fish. Surveys in 2015, 2017 and 2018 captured 97 fish species (representing 77 genera, 52 families, 26 orders), 108 fish species (representing 84 genera, 61 families, 19 orders) and 126 fish species (representing 105 genera, 74 families, 25 orders), respectively. Three surveys captured a total of 252 fish species, representing 164 genera, 97 families, 30 orders. Perciformes dominated. Species richness in station linking shallow continental shelf with deep slope was the lowest among stations. In three surveys, 16 species occurred in the catches of three surveys, accounting for 6.35% of all species. Species replacement rate between stations showed a significant linear relationship with the depth difference and latitude difference. Margalef’s species richness index (D), Shannon–Weiner diversity index (H’) and Pielou’s evenness index (J’) among stations ranged 2.65–6.74, 1.02–4.15 and 0.28–1.14, respectively. Differences of D, H’ and J’ were insignificant among seasons. There were significant positive linear relations between H’ and J’ and latitude. D, H’ and J’ decreased with increasing sampling depth, however the relations were not significant. Based on multivariate statistical analysis, fish community at species level was divided into five groups with average dissimilarities of 95.69%–99.96%. In terms of genus and family, average dissimilarities among groups were more than 88.11% and 82.69%. There were significant differences in species composition between depths, but no significant differences between seasons and temperatures, as well as in genus and family composition.
Species composition and structure of fish community on continental slopes in different geographic areas are generally determined by spatial differences in environmental factors and characteristics of the habitat (Haedrich and Krefft, 1978; Sardà et al., 1994; Moranta et al., 1998; Kallianiotis et al., 2000; Ajmal et al., 2016). The northern continental slope of South China Sea (NCSSCS) refers to the area from the Xisha Trough in the northwest to the southern continental-shelf turning of Taiwan Island, and its topography presents alternately steep and gentle slopes, descending in the manner of a stairway from northwest to southeast. Here, at the NCSSCS, the northern margin of the continental shelf is directly affected by coastal currents and runoff from the Pearl River and Hanjiang River, forming an important fishing ground with high primary productivity; the southern margin is a deep-sea basin, with depths of 3–4 km; and the eastern portion is influenced by a branch of the north-flowing, warm Kuroshio Current (Su and Yuan, 2005; Wang et al., 2019). Complex oceanographic conditions and unique habitats of the NCSSCS contribute to abundant and diverse living resources, and the NCSSCS is also an important hunting, spawning and breeding ground of fish (Qiu et al., 2008). Demersal fish community is an important component of continental slope ecosystem and its available resources. Knowing species composition, biodiversity, and structural state of demersal fish community over the NCSSCS will help us to understand the present condition and functional stability of this ecosystem.
To date, limited scientific surveys of demersal fish over the NCSSCS have been conducted (South China Sea Fisheries Research Institute, 1981; Lee, 1995; Qiu et al., 2008). Those surveys provided many new discoveries, such as hundreds of new records for species of deep-sea fishes, and noted some potential deep-sea demersal fish resources, yet few data from those surveys have ever been published. Since then, expert investigations of demersal fish in particular have been not carried out over the NCSSCS. Lee (1995) reported on the species composition and Shannon–Weiner diversity index of demersal fishes and shrimp over the NCSSCS (19°20′–20°00′N, 113°55′–114°25′E), and found that the diversity index decreased with depth, but the investigators only recorded 57 species, a relatively low number. Thus, scarce information exists on the species diversity and community structure of demersal fish over the NCSSCS. Consequently, systematic investigation and detailed analysis is merited to enhance our understanding of this ecosystem.
This article reports on three surveys of demersal fish carried out using bottom trawl in June 2015, March 2017 and September 2018 over the NCSSCS, and analyzes their species diversity and community pattern.
Demersal fish were collected by bottom trawl over the NCSSCS (18°50′–20°40′N, 112°50′–115°10′E) by the R/V Nan Feng (1,537 t GT; 66.7 m length, 12.4 m width, 5.0 m draught) in June 2015, March 2017 and September 2018 (Figure 1 and Table 1). The trawl was a two-piece bagged double-wing bottom trawl and had a total stretched length of 100.22 m, a straightened mouth perimeter of 138 m, a buoyancy headline length of 52.44 m, and a sinking headline length of62.46m. It was made up of two panels, with stretched mesh sizes of 300 mm in the forward section, and 50 mm in the codend. It have doors and tickler chains. During all surveys, demersal seawater temperature were collected and recorded in situ and quasi simultaneously using a Seabird CTD Rosette (Sea Bird Electronics Inc., Bellevue, WA, USA). Depth was measured using a Simrad EK60 scientific echosounder (Kongsberg Maritime Inc., Kongsberg, Norway) with 38 and 120-kHz split-beam transducers mounted on the R/V Nan Feng. In the Table 1, the trawl depth was the average between the start and end depths.
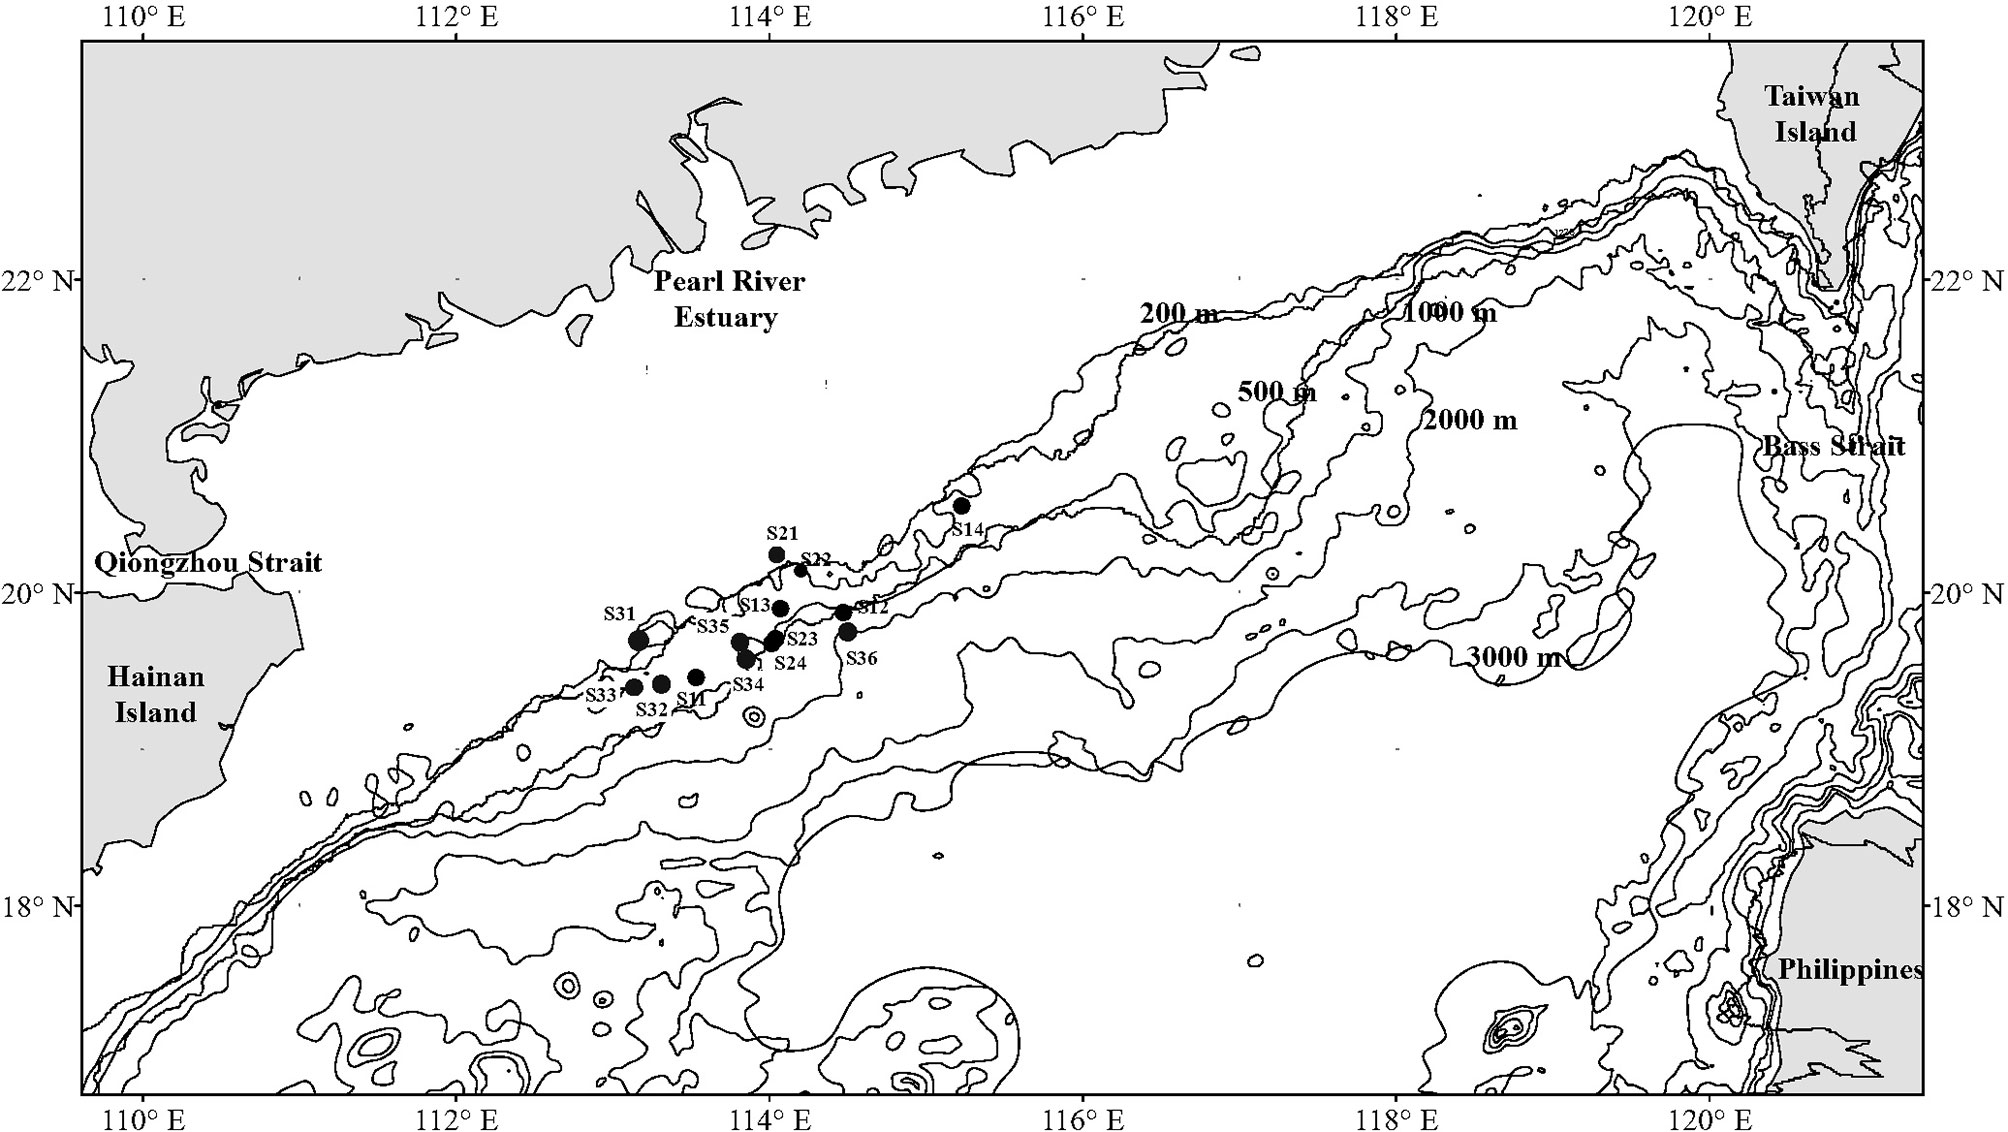
Figure 1 Sampling stations of demersal fish over the NCSSCS. Stations S11–S14 were implemented in June 2015. Stations S21–S24 were implemented in March 2017. Stations S31-S36 were implemented in September 2018.
Fish taxa were identified to the lowest possible taxonomic level, using the references ‘Fishes of Tai Wan’ (Shen, 1993), ‘Fauna Sinica: Osteichthyes’ (Chen, 2002), ‘Checklist of Marine Biota of China Seas’ (Liu, 2008), and ‘Review of Fishes of South China Sea’ (Sun and Chen, 2013).
Upon retrieval, the trawl was emptied on deck and the catches were picked clean; thereafter, the catches were moved to an on-board laboratory for preprocessing. All specimens in catches of < 30 kg were identified, counted, measured, and recorded onboard. Large and rare species were picked out of catches of > 30 kg, and the other remaining specimens were sampled in proportion according to the weight of the catches.
After preprocessing, all selected specimens were immersed in seawater and immediately frozen at −40°C, and then brought to a shore-based laboratory for obtaining accurate measurements, such as wet body mass (0.1 g) and standard length (mm). Before analyzing any specimens, the catches of each station were standardized as biomass density (kg h-1) and abundance density (individuals h-1).
The replacement rate of a species (R) was used to analyze variation of species composition among sampling stations (Zhao and Zhou, 1984). R was calculated as:
where m is the number of different species among stations, and M is the number of all species among stations.
The index of relative importance (IRI) was used to evaluate the degree of dominance of a species (Pinkas et al., 1971). The IRI was calculated as:
where N% is the percentage of individuals of a species accounting for the total individuals of all species in all samples, W% is the percentage of wet weight of the species accounting for the total wet weight of all species in all samples, and F% is the percentage of stations with the species accounting for the total number of stations in all samples.
Here, based on the IRI value of the species, we define them as a dominant species (IRI > 500), important species (500 > IRI ≥ 100), common species (100 > IRI ≥ 10), general species (10 > IRI ≥ 1), or rare species (1 > IRI).
Margalef’s species richness index (D) (Margalef, 1958), Shannon–Weiner diversity index (H’) (Wilhm, 1968), and Pielou’s evenness index (J’) (Pielou, 1975) were used to analyze biodiversity of fish community. These indices were respectively calculated as:
where N is the total individuals of fish at a station, S is the species richness, w is the total biomass, and wi is the biomass of ith species.
One-way analysis of variance (ANOVA) was used to inspect seasonal differences in fish diversity indices. Pearson correlation analysis and linear regression analysis were used to detect the spatio-temporal differences of diversity indices (significance = 0.05). Data calculation and statistical analysis was done with Microsoft Excel 2016 and SigmaPlot14.0.
Group average cluster and non-metric multi-dimensional scaling (NMDS) were used to analyze the structure of fish community, where coefficients < 0.2, 0.1 and 0.05 indicated acceptable representation, good ranking and good representation of ranking, respectively (Clarke and Ainsworth, 1993). Data of fish biomass density was logarithmically transformed by log(x+1) and Bray–Curtis similarity coefficient matrix was calculated (Bray and Curtis, 1957; Zhou and Zhang, 2003). Analysis of similarities (ANOSIM) was used to analyze the differences in species composition in different seasons, depths and temperatures. In our analysis, season factor included 3 levels, namely June 2015, March 2017 and September 2018. Depth factor was determined as 3 levels, namely depth < 200 m, 200 m ≤ depth < 400 m and 400 m ≤ depth. Temperature factor was determined as 3 levels, namely 7°C ≤ Temperature < 9°C, 9°C ≤ Temperature < 12°C, 12°C ≤ Temperature.
Similarity percentage (SIMPER) was used to investigate which species is/are the most responsible for the observed spatial or temporal differences. The above multivariate statistical analysis was completed with PRIMER v5 (Clarke and Gorley, 2001).
Cruises in June 2015 captured a total of 97 fish species, representing 76 genera, 53 families, 26 orders (Figure 2). Perciformes dominated, with 21 species in 12 families accounting for 21.65% of all species, followed by Myctophiformes (13 species), Stomiiformes (9 species), Gadiformes (8 species) and Scorpaeniformes (7 species). Dominant species were Diaphus watasei with IRI of 2330, Acropoma hanedai with IRI of 837 and Hydrolagus mitsukurii with of 771. There were 10 important species, 41 common species, 29 general species and 14 rare species.
Cruises in March 2017 captured a total of 108 fish species, representing 84 genera, 59 families, 19 orders (Figure 2). Perciformes dominated, with 23 species in 15 families accounting for 21.30% of all species, followed by Scorpaeniformes (17 species), Gadiformes (10 species), Aulopiformes (7 species), and Anguilliformes (6 species). Dominant species were Rexea prometheoides with IRI of 3143 and Synagrops japonicas with IRI of 1072. There were 10 important species, 45 common species, 42 general species and 9 rare species.
Cruises in September 2018 captured a total of 126 fish species, representing 105 genera, 75 families, 25 orders (Figure 2). Perciformes dominated, with 30 species in 20 families accounting for 23.81% of all species, followed by Scorpaeniformes (14 species), Gadiformes (12 species), Aulopiformes (8 species), and Pleuronectiformes (7 species). Dominant species were Cubiceps squamicephaloides with IRI of 2660, Urotrygon daviesi with IRI of 869 and Bathyclupea argentea with IRI of 713. There were 9 important species, 29 common species, 60 general species and 25 rare species.
Three cruises captured a total of 252 fish species, representing 169 genera, 98 families, 30 orders. Perciformes dominated, with 54 species in 25 families accounting for 21.60% of all species, followed by Scorpaeniformes (29 species), Gadiformes (26 species), Myctophiformes (15 species), and Anguilliformes (14 species).
Species richness at station S21 (157 m) linking the shallow continental shelf with the deep slope was the lowest among stations (Figure 3).
Cruises in June 2015 and March 2017 captured a total of 181 fish species, and 24 species occurred in catches two surveys, and the replacement rate was 0.867. Cruises in March 2017 and September 2018 captured a total of 192 fish species, and 42 species occurred in catches two surveys, and the replacement rate was 0.781. Cruises in in June 2015 and September 2018 captured a total of 194 fish species, and 29 species occurred in catches two surveys, and the replacement rate was 0.851. 16 species occurred in the catches of three surveys, accounting for 6.35% of all species. There was obvious species replacement among seasons.
Pearson analysis showed that species replacement rate between stations was significantly correlated with the depth difference and latitude difference between stations (correlation coefficient = 0.669, r < 0.001; correlation coefficient = 0.323, r < 0.001), but not with the linear spatial distance between stations (correlation coefficient = 0.125, r > 0.05). Species replacement rate between stations showed a significant linear relationship with the depth difference (y = 0.0004x + 0.8576, p < 0.001) and latitude difference (y = 0.0903x + 0.8987, p < 0.001) (Figure 4), but there was no obvious linear relationship with the linear spatial distance (y = 0.0002x + 0.9131, p > 0.05).
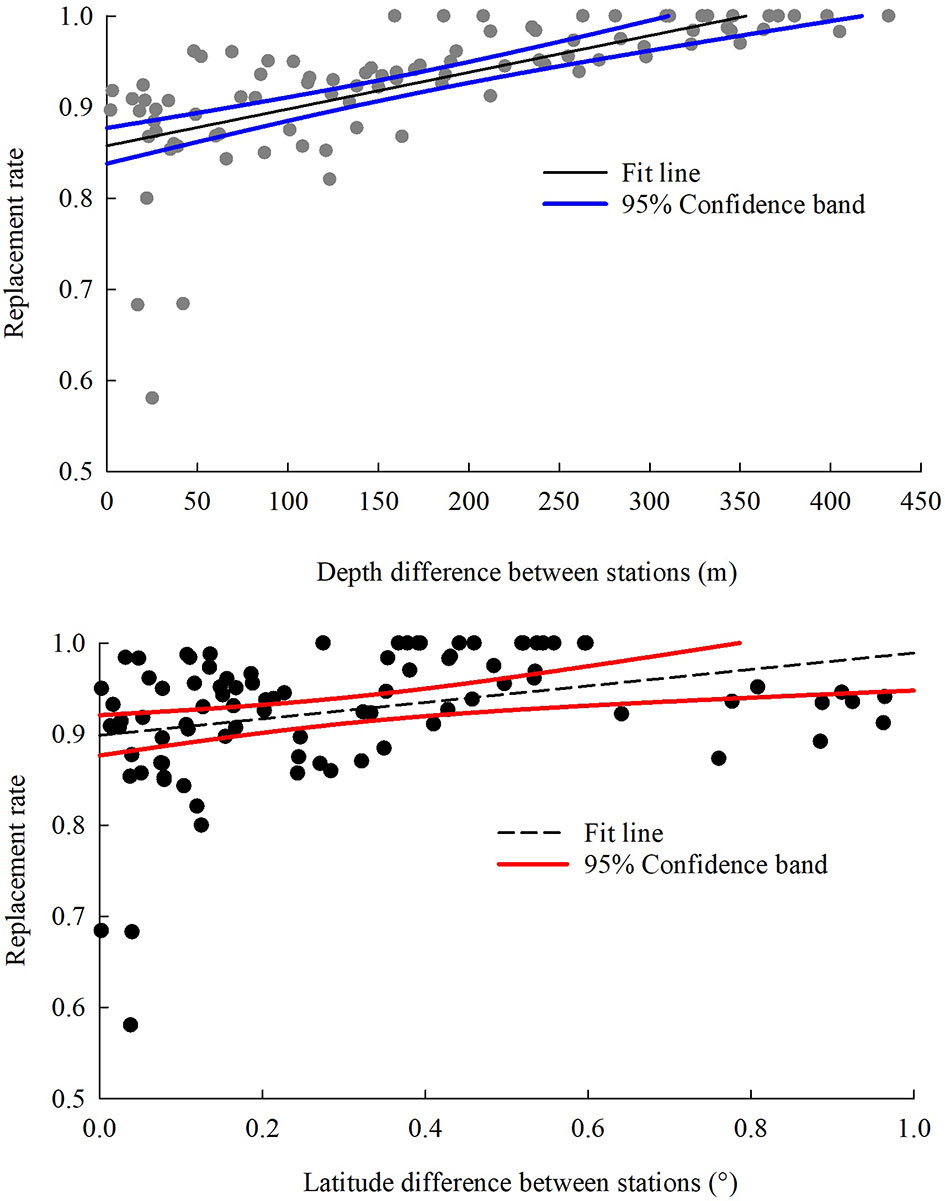
Figure 4 Depth and latitude-related trends in replacement rate of demersal fish species over the NCSSCS.
D, H’ and J’ among stations ranged 2.65–6.74 (4.79 ± 1.17), 1.02–4.15 (2.69 ± 0.95) and 0.28–1.14 (0.79 ± 0.24), respectively (Figure 5). In terms of seasons, highest and lowest D values appeared both in March 2017. H’ and J’ were both highest in June 2015 and lowest in September 2018, respectively. Mean H’ in March 2017 was highest. Mean D and J’ in June 2015 was highest. Differences of D, H’ and J’ were insignificant among seasons (ANOVA, p > 0.05).
Correlation analysis and regression analysis showed that there were significant positive linear relations between H’ and J’ and latitude (p < 0.01). D, H’ and J’ decreased with increasing sampling depth, however the relations between three diversity indices and depth were not significant (correlation analysis, p > 0.05; regression analysis, p > 0.05).
In terms of species level, fish communities could be divided into five groups by 10% similarity (Figure 6). Stress coefficient of NMDS was less than 0.2, which indicated that the graphs had interpretative meaning. Group I consisted of seven stations with depth of 285–524 m. Among stations with depth greater than 200 m, station S14 (Group II) with a maximum depth and station S22 (Group IV) at the boundary between the shelf and the slope were different from other stations. Group III consisted of two stations with a depth of less than 200 m (S21 and S31). Group V consisted of S24, S32 and S33. Differences in community among groups were significant (ANOSIM, R = 0.813, p < 0.01). SIMPER analysis showed that intra-group average similarity of fish composition in Group I, Group III and Group V were 18.07%, 15.95% and 13.07%. None of top five contributing species in the above three groups co-occurred (Table 2). Average dissimilarities of Group I & IV and Groups I & III were lowest (95.69%) and highest (99.96%), respectively. Top five contributing species of dissimilarities among groups were presented in the Table 3. There were significant differences in species composition between depths (ANOSIM, R = 0.475, p < 0.01), but no significant differences between seasons and temperatures (ANOSIM, R = 0.167, p > 0.05; R = 0.144, p > 0.05).
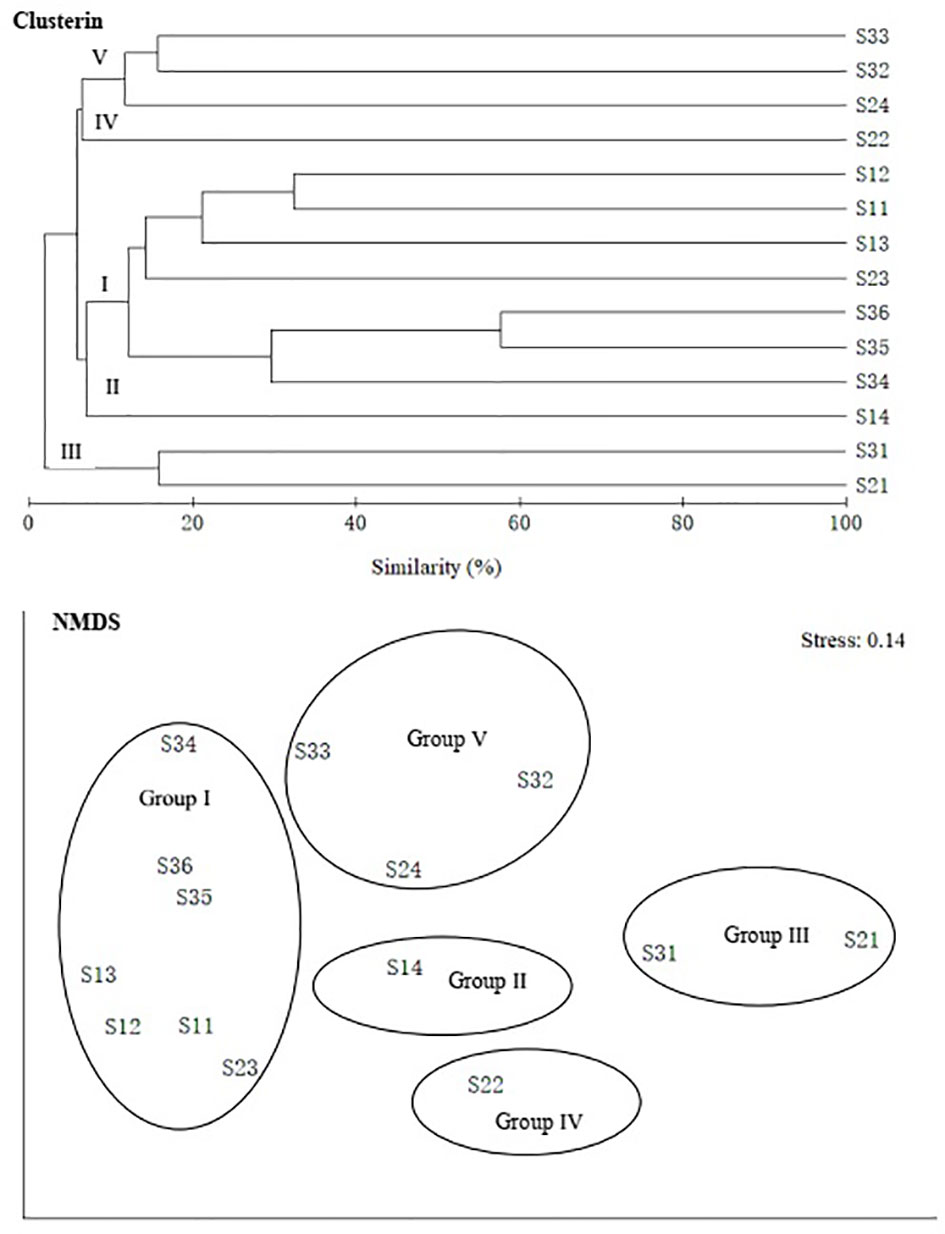
Figure 6 Group average clustering and non-metric multi-dimensional scaling (NMDS) among species of demersal fish over the NCSSCS.

Table 2 Intra-group average similarity of fish composition and top five contributing species over the NCSSCS.
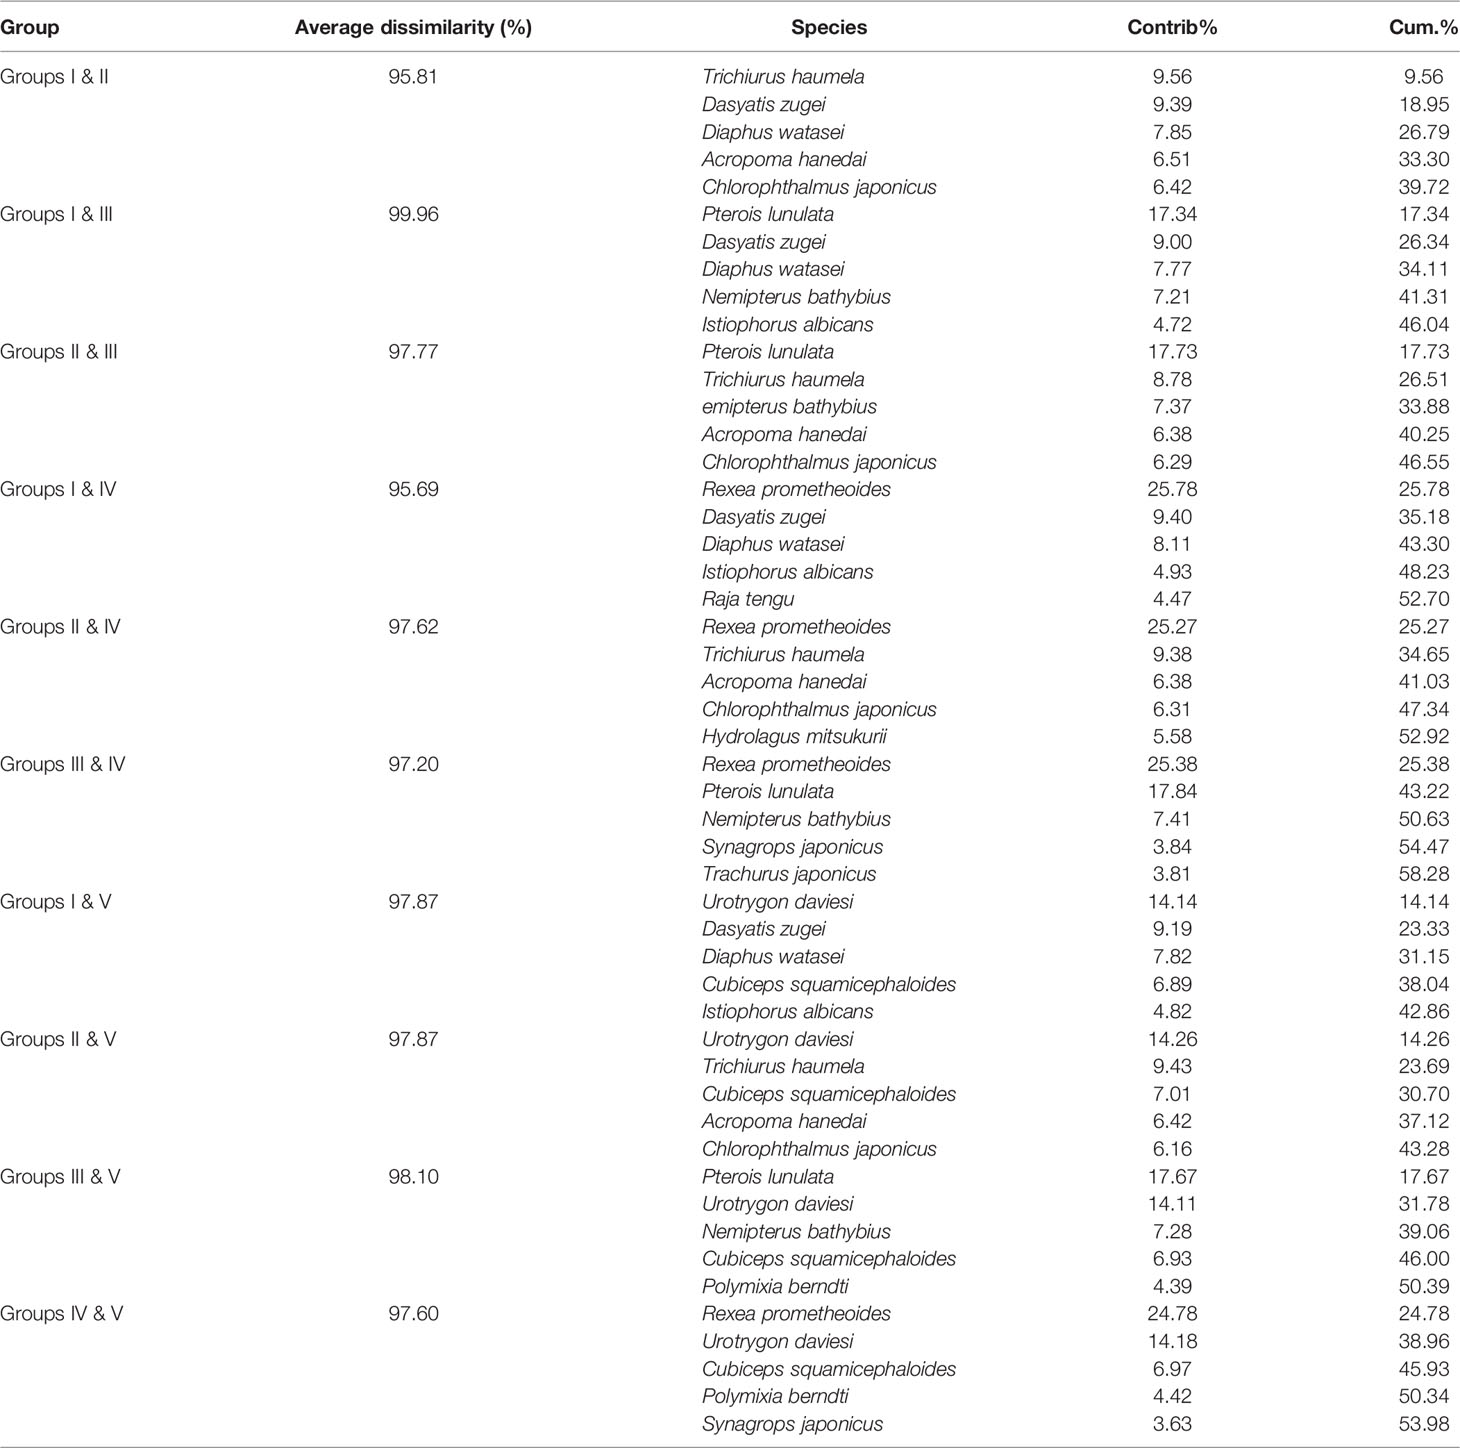
Table 3 Average dissimilarity and top five discriminating species among group I, II, III, IV and V over the NCSSCS.
In terms of genus level, fish communities could be divided into four groups by 20% similarity (Figure 7). NMDS stress coefficient was < 0.2. Group I consisted of seven stations with depth of 285–524 m. Group II consisted of four stations with a depth greater than 200 m, including S14 station. Group III only included S21. Group IV consisted of two stations with depth of about 500 m. Differences in communities among groups were significant (ANOSIM, R = 0.837, p < 0.01). Intra-group average similarity of genus composition and top five contributing genera of similarity was given in the Table 4. Inter-group average dissimilarities and top five contributing genera of dissimilarities were given in the Table 5. There were significant differences in species composition between depths (ANOSIM, R = 0.415, p < 0.01), but no significant differences between seasons and temperatures (ANOSIM, R = 0.100, p > 0.05; ANOSIM, R = 0.153, p > 0.05).
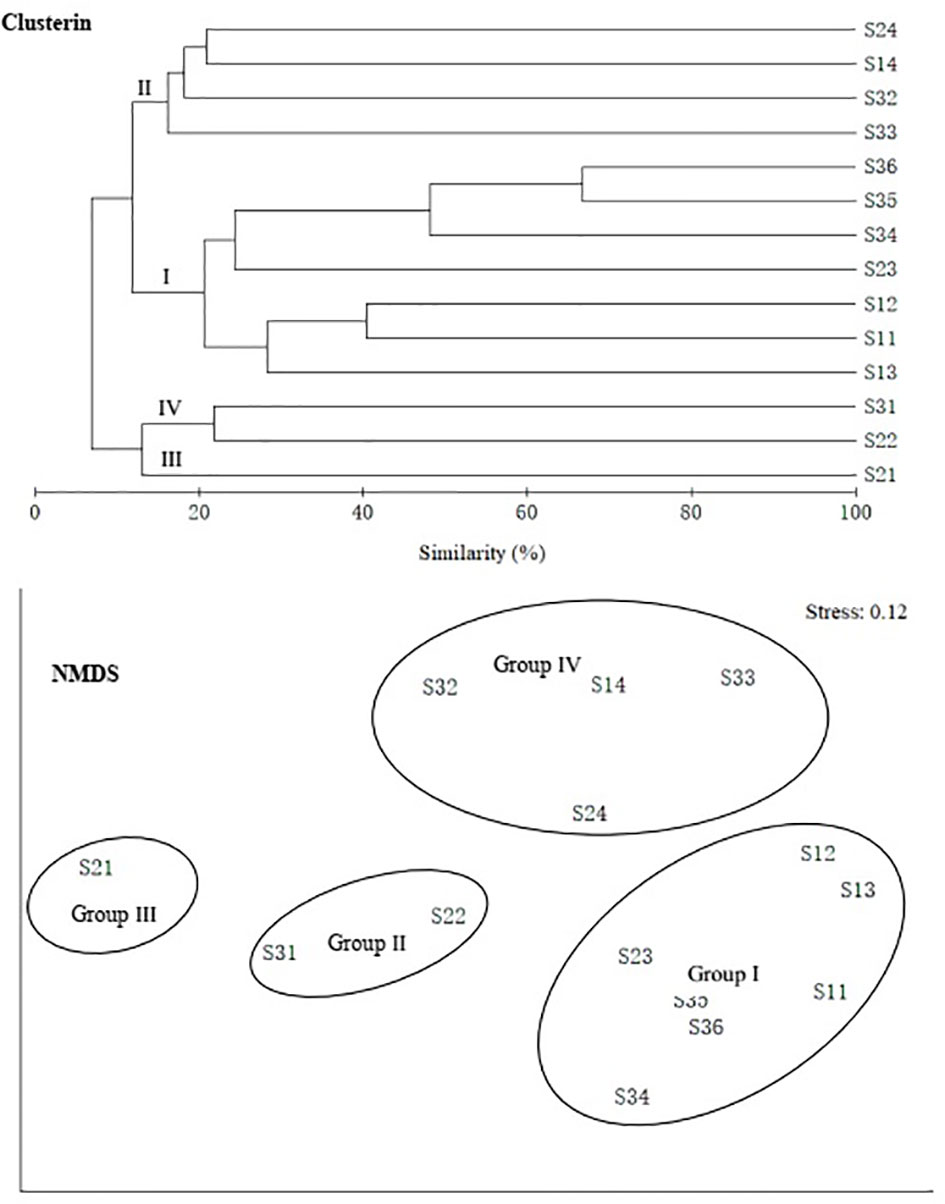
Figure 7 Group average clustering and non-metric multi-dimensional scaling (NMDS) among genus of demersal fish over the NCSSCS.

Table 4 Intra-group average similarity of genus composition and top five contributing genera over the NCSSCS.
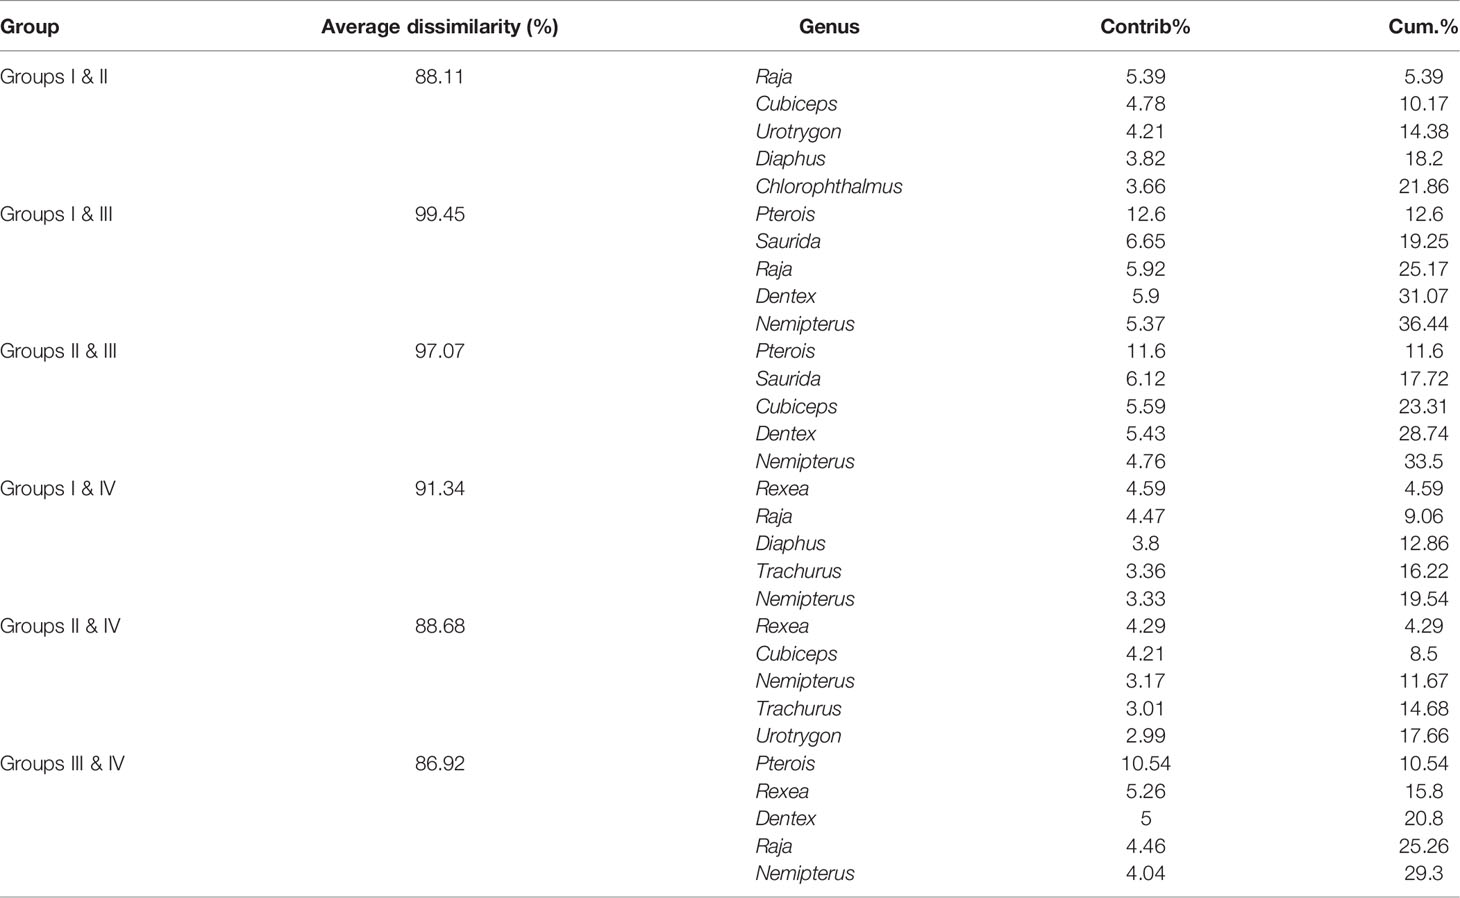
Table 5 Average dissimilarity and top five discriminating genera among group I, II, III, and IV over the NCSSCS.
In terms of family level, fish communities could be divided into four groups by 20% similarity (Figure 8). NMDS stress coefficient was < 0.2. Group I consisted of eight stations with depth of 285–560 m. Group II consisted of three shallow stations with depth of 121–209 m. Group III consisted of S32 and S24. Group IV only included S33. Differences in communities among groups were significant (ANOSIM, R = 0.908, p < 0.01). Intra-group average similarity of family composition and top five contributing families of similarity was given in the Table 6. Inter-group average dissimilarities and top five contributing families of dissimilarities were given in the Table 7. There were significant differences in species composition between depths (ANOSIM, R = 0.424, p < 0.01), but no significant differences between seasons and temperatures (ANOSIM, R = 0.156, p > 0.05; ANOSIM, R = 0.162, p > 0.05).
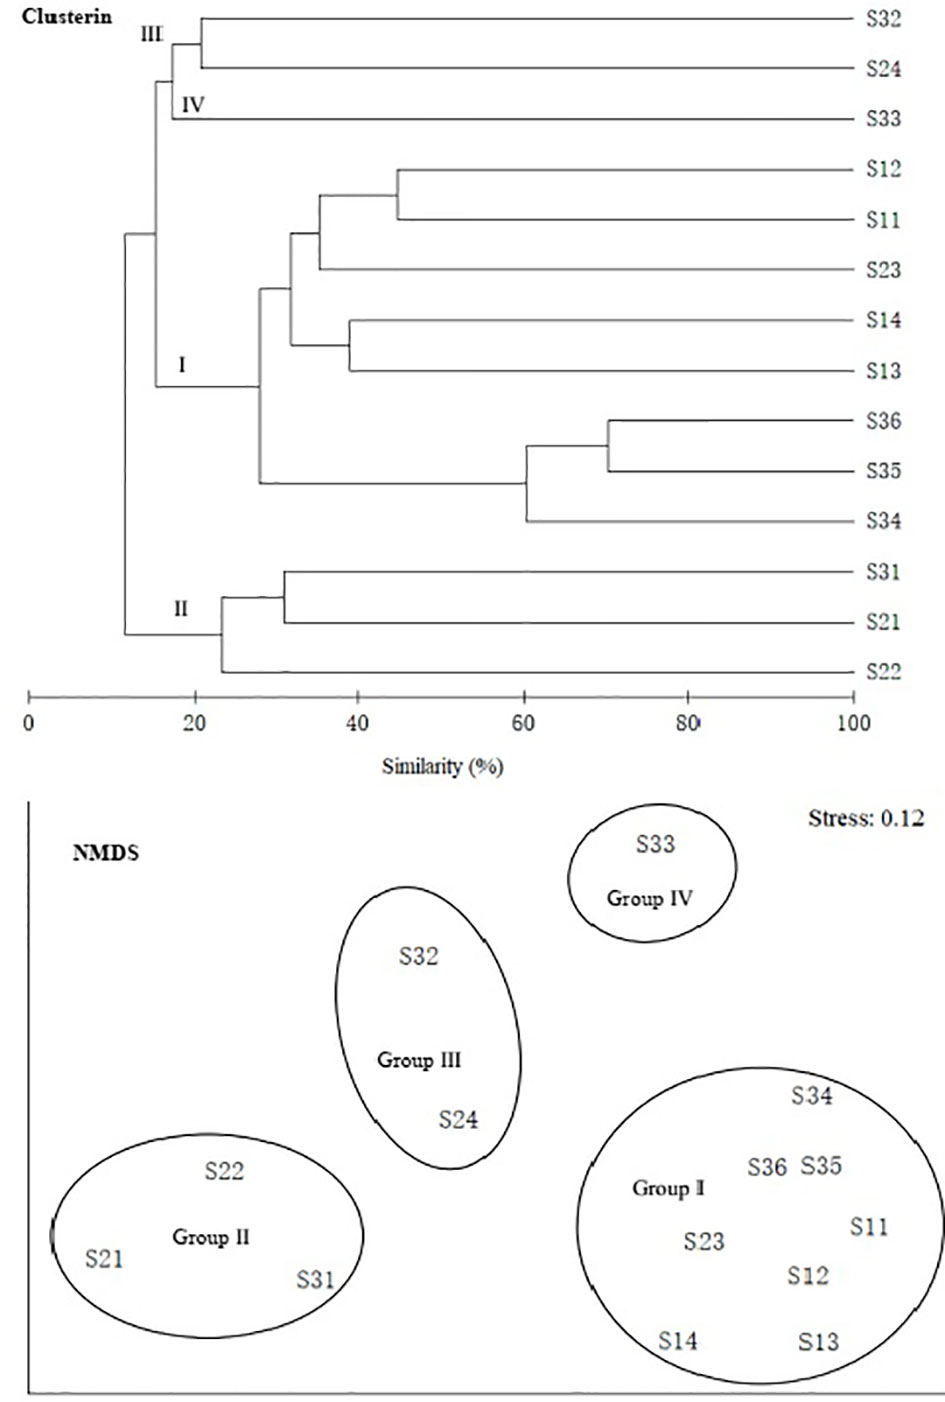
Figure 8 Group average clustering and non-metric multi-dimensional scaling (NMDS) among family of demeral fish over the NCSSCS.

Table 6 Intra-group average similarity of family composition and top five contributing families over the NCSSCS.
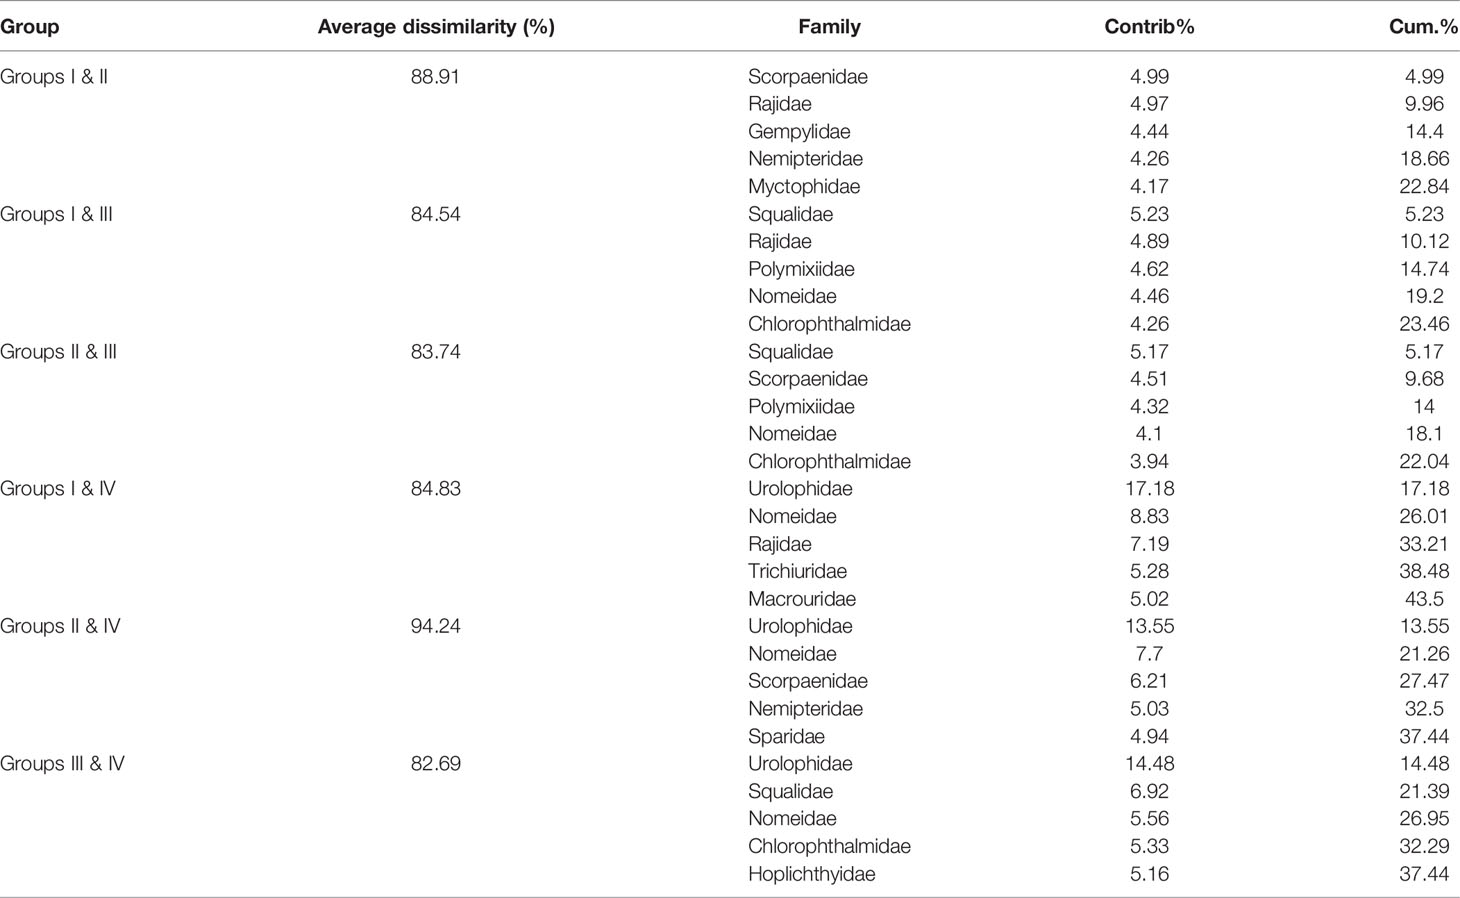
Table 7 Average dissimilarity and top five discriminating families among group I, II, III, and IV over the NCSSCS.
In our study, 14 stations captured a total of 252 demersal fish. Thus, study area has a high species richness. Perciformes fish species occupied a very stable proportion among seasons, about average 22.25% of all species. Deep-sea demersal fish dominated absolutely. In the offshore northern South China Sea (< 200 m), Perciformes fish species occupied a very higher proportion of fish community, about accounting for 51.17% of all species (Cai et al., 2018).
Depth and latitude had important influences on species composition of demersal fish over the NCSSCS. Sampling area links different parts of continental shelf and slope ecosystem. As depth increased, relationship extent of fish with shelf weakened, with deep-sea demersal fish captured on the slope lacking much of a relationship with continental shelf. For example, in station S22 with depth of 205 m, connecting the shelf and slope, species captured (i.e. Priacanthus macracanthus, Trachurus japonicas, Ariomma indica, Priacanthus blochii, Antigonia capros, Antigonia rubescens, Ratabulus megacephalus, Aulopus japonicas), were all defined as common species in the offshore shelf of South China Sea. However, only P. macracanthus and A. capros occurred in the catches at the deeper station S11. Moreover, as latitude decreased and geographical distance away from coastline increased, none of above offshore species captured at station S22 occurred in the catches at other deeper stations. These depth-related distribution patterns of fish species agree with available data for other continental slopes as well as with previous data collected over the NCSSCS (i.e. Shen and Chen, 1987; Qiu, 1988; Qiu, 1990; Stefanescu et al., 1993; Campbell et al., 2011).
Although deep-sea demersal fish dominated absolutely over the NCSSCS, there were some shallow-sea coastal species (i.e. P. macracanthus, T. japonicas, A. indica), pelagic species (i.e. Istiophorus albicans, Thyrsitoides marleyi, Brama japonica) and mesopelagic species (i.e. Myctophum asperum, Stomias affinis, Polymetme illustris) captured, which also indicated that NCSSCS was an important complex habitat for a variety of fish. The distribution of above coastal and pelagic species are more likely to change with seasons, causing species replacement of demersal fish composition on the NSCCSC (Cai et al., 2018; Zhang et al., 2018). Our results showed that depth and latitude differences had significant effects on fish replacement and distribution among stations over the NCSSCS, while spatial distance did not. We concluded that this reflected the depth dependence of fish distribution. In the north-south direction, as latitude decreases, the depth of NSCCSC increases. Linear spatial distance combines differences in latitude (north-south direction) and longitude (east-west direction) among stations. Since sampling area is not particularly broad, linear spatial distance had no significant effect on fish replacement among stations (Moranta et al., 1998; Kim, 2001).
From 1979 to 1980, South China Sea Fisheries Research Institute (1981) carried out a series of fisheries surveys over the NCSSCS (18°50′–22°00′N, 112°00′–117°30′E), capturing 203 fish species (representing 81 families and 25 orders) with mainly 12 dominant deep-sea demersal fish present: Dosyatis bennettii, Squalus mitsukurii, Ariomma lurida, Hime japonicus, Doederleinia berycoides, Psenes whiteleggii, Malakichthys griseus, Chlorophthalmus albatrossis, Diretmus argenteus, Hoplostethus mediterraneus, Setarches guntheri and Coelorhynchus. Compared with surveys in the 1980s, in our study, Squalus, Malakichthys, Chlorophthalmus, Diretmus, Hoplostethus and Coelorhynchus are still very important taxa, but other taxa have become less common, namely in terms of species richness, dominant species, and proportions of the individual species. There are various possible explanations for these discrepancies, such as changes in the fish community structure caused by fishing, sampling nets with different selectivity, and depth-gradient differences in the sampling stations (cf. Jennings and Kaiser, 1998; Clark et al., 2000; Sala et al., 2008; Garcíaruiz et al., 2015; Farré et al., 2016).
Fish composition at each station is closely related with geographical position of station, with different habitats present on the NCSSCS. Especially, the sampling areas in our study present complex marine environment and dramatically vary in their bottom slope (Shen and Chen, 1987; Williams et al., 2001; Golovan et al., 2013; Leo et al., 2017). Correspondingly, biodiversity of demersal fish community differed at the stations. Margalef’s species richness index D of fish community was highest at S24; however, diversity index H’ and evenness index J’ were both lower.
At station S24, despite high species richness (41 fish species), Istiophorus albicans accounted for 66.09% of total biomass, resulting in an uneven distribution of fish. A similar situation occurred at station S33 (41 fish species), Urotrygon daviesi accounted for 83.02% of total biomass. Thus, H’ and J’ were both lowest at station S33 among stations. At station S21, D was very low due to extremely low species richness (8 fish species). At station S11 and S31, species richness were both high (42 and 39 fish species) and there were no extremely dominant species, so H’ and J’ were very high. In terms of time and space, latitude and depth had significantly greater effects on diversity indices than season.
Based on data of fisheries catches from 1997 to 2000, Qiu et al. (2008) reported that H’ values of demersal fish community for spring and summer in the outer continental shelf of South China Sea (at a depth of 200–260 m) were 3.12 and 2.30, respectively, and the corresponding J’ value were 0.63 and 0.54, respectively; finally, in the offshore sea of continental shelf the H’ values for spring and summer were 2.84 and 2.66, respectively. In our study, the range and average of H’ for demersal fish community in June 2015 were 2.59–4.16 and 3.25 ± 0.66, respectively, and the corresponding J’ were 0.74–1.14 and 0.96 ± 0.17, respectively. In March 2017, the range and average of H’ were 1.67–3.35 and 2.72 ± 0.81, respectively, and the corresponding J’ were 0.59–1.00 and 0.82 ± 0.15, respectively. Thus, the average H’ and J’ of demersal fish community over the NCSSCS were higher than that in the outer sea, and also were higher than that in the offshore continental shelf (Jiang et al., 2009).
Fish species composition showed some spatial and temporal heterogeneity, which is very closely related to complex physicochemical factors and seafloor geomorphology (Taiga and Katsunori, 2021). Multivariate statistical analysis showed that it was more effective to divide demersal fish community over the NCSSCS by depth than by season. At species level, groups of demersal fish communities obtained by cluster and NMDS analysis could be better explained from the depth factor. For example, among stations with depth greater than 200 m, station S14 with a maximum depth and station S22 at the boundary between shelf and slope were different from other stations, and were classified as unique groups, respectively. Two stations with a depth of less than 200 m were grouped together. Due to high species richness, the maximum intra-group average similarity of fish composition at species level was less than 20.00%. At the same time, due to high species replacement rate between stations, average dissimilarities between groups were very high, and the minimum value was higher than 95.00%. At genus and family level, after clustering, the intra-group average similarity of fish composition improved, but the maximum value did not exceed 35.00%; the minimum average dissimilarities between groups was higher than 82.00%. Whether at the species level or at the genus and family level, influence of depth factor on fish community pattern was significantly greater than that of season and temperature. This influence was also reflected in the species compositions, replacement rate and biodiversity (Shen and Chen, 1987; May and Blaber, 1989; Moranta et al., 1998; Li et al., 2007; Ajmal et al., 2016). Therefore, the influence of geomorphology on fish communities was greater than that of season and temperature over the NCSSCS.
The original contributions presented in the study are included in the article/Supplementary Material. Further inquiries can be directed to the corresponding authors.
The animal study was reviewed and approved by South China Sea Fisheries Research Institute Animal welfare committee.
JZ wrote the first draft. JZ, KZ, Y-eJ, Y-jL, J-tF, WY and ZC performed the data analyses. Z-zC modified the manuscript. All authors contributed to the article and approved the submitted version.
This work was supported by the Fundamental and Applied Fundamental Research Major Program of Guangdong Province (2019B030302004), the Key Special Project for Introduced Talents Team of Southern Marine Science and Engineering Guangdong Laboratory (Guangzhou) (GML2019ZD0605), the Central Public-Interest Scientific Institution Basal Research Fund (2020TD05 and 2021SD01), and the Financial Fund of the Ministry of Agriculture (NFZX2021).
The authors declare that the research was conducted in the absence of any commercial or financial relationships that could be construed as a potential conflict of interest.
All claims expressed in this article are solely those of the authors and do not necessarily represent those of their affiliated organizations, or those of the publisher, the editors and the reviewers. Any product that may be evaluated in this article, or claim that may be made by its manufacturer, is not guaranteed or endorsed by the publisher.
We thank the crew of the R/V NanFeng for their support. We thank Cynthia Kulongowski (MSc), with the Edanz Group (www.edanzediting.com/ac), for editing a draft of this manuscript.
The Supplementary Material for this article can be found online at: https://www.frontiersin.org/articles/10.3389/fmars.2022.809636/full#supplementary-material
Ajmal K., Seerangan M., Somasundharanair L. (2016). Changes in Macrobenthic Community Structure From Estuary to Continental Slope in the South-East Coast of India. J. Mar. Biol. Assoc. Uk. 97 (1), 161–180. doi: 10.1017/S0025315416000229
Bray J. R., Curtis J. T. (1957). An Ordination of the Upland Forest Communities of Southern Wisconsin. Ecol. Monogr. 27 (4), 326–349. doi: 10.2307/1942268
Cai Y., Xu S., Chen Z., Xu Y., Jiang Y., Yang C. (2018). Current Status of Community Structure and Diversity of Fishery Resources in Offshore Northern South China Sea. South China Fish. Sci. 14 (2), 10–18. doi: 10.3969/j.issn.2095-0780.2018.02.002
Campbell N., Neat F., Burns F., Kunzlik P. (2011). Species Richness, Taxonomic Diversity, and Taxonomic Distinctness of the Deep-Water Demersal Fish Community on the Northeast Atlantic Continental Slope (ICES Subdivision Vla). ICES. J. Mar. Sci. 68 (2), 365–376. doi: 10.1093/icesjms/fsq070
Chen S. (2002). FAUNA SINICA: OSTICHTHYES (Myctophiformmes, Cetomimiformes and Osteoglossiformes) (Beijing: Science Press), 1–304.
Clark M. R., Anderson O. F., Francis R. I., Tracey D. M. (2000). The Effects of Commercial Exploitation on Orange Roughy (Hoplostethus Atlanticus) From the Continental Slope of the Chatham Rise, New Zealand, From 1979 to 1997. Fish. Res. 45 (3), 217–238. doi: 10.1016/S0165-7836(99)00121-6
Clarke K., Ainsworth M. (1993). A Method of Linking Multivariate Community Structure to Environmental Variables. Mar. Ecol. Prog. 92 (3), 205–219. doi: 10.3354/meps092205
Clarke K. R., Gorley R. N. (2001). Primer V5: User Manual/Tutorial (Plymouth: PRIMER-E Ltd), pp.1–p173.
Farré M., Tuset V. M., Cartes J. E., Massutí E., Lombarte A. (2016). Depth-Related Trends in Morphological and Functional Diversity of Demersal Fish Assemblages in the Western Mediterranean Sea. Prog. Oceanog. 147, 22–37. doi: 10.1016/j.pocean.2016.07.006
Garcíaruiz C., Lloris D., Rueda J. L., Garcíamartínez M. C., Sola L. G. D. (2015). Spatial Distribution of Ichthyofauna in the Northern Alboran Sea (Western Mediterranean). J. Natural History. 49 (19-20), 1191–1224. doi: 10.1080/00222933.2014.1001457
Golovan O. A., Błażewicz-Paszkowycz M., Brandt A., Budnikova L. L., Elsner N. O., Ivin V. V., et al. (2013). Diversity and Distribution of Peracarid Crustaceans (Malacostraca) From the Continental Slope and the Deep-Sea Basin of the Sea of Japan. Deep. Sea. Res. Part II. Top. Stud. Oceanog. 86–87 (1), 66–78. doi: 10.1016/j.dsr2.2012.08.002
Haedrich R. L., Krefft G. (1978). Distribution of Bottom Fishes in the Denmark Strait and Irminger Sea. Deep. Sea. Res. 25 (8), 705–720. doi: 10.1016/0146-6291(78)90625-2
Jennings S., Kaiser M. J. (1998). The Effects of Fishing on Marine Ecosystems. Adv. Mar. Biol. 34 (34), 201–212. doi: 10.1016/S0065-2881(08)60212-6
Jiang Y., Lin Z., Huang Z. (2009). Biodiversity of Fishery Resources in the Continental Shelf of Northern South China Sea. South China Fish. Sci. 5 (5), 32–37. doi: 10.3969/j.issn.1673-2227.2009.05.006
Kallianiotis A., Sophronidis K., Vidoris P., Tselepides A. (2000). Demersal Fish and Megafaunal Assemblages on the Cretan Continental Shelf and Slope (NE Mediterranean): Seasonal Variation in Species Density, Biomass and Diversity. Prog. Oceanog. 46 (2–4), 429–455. doi: 10.1016/S0079-6611(00)00028-8
Kim S. T. (2001). Winter Migrations of Shelf Fish to the Continental Slope of the Southwestern Sakhalin. J. Ichthyol. 41 (8), 564.
Lee C. L. (1995). Preliminary Study on Community Structure by Bottom Trawler in the Northern Slope of the South China Sea. J. Taiwan. Fish. Res. 22 (2), 101–111.
Leo F. C. D., Gauthier M., Nephin J., Mihály S., Juniper S. K. (2017). Bottom Trawling and Oxygen Minimum Zone Influences on Continental Slope Benthic Community Structure Off Vancouver Island (NE Pacific). Deep. Sea. Res. Part II. Top. Stud. Oceanog. 137, 404–419. doi: 10.1016/j.dsr2.2016.11.014
Li S., Cheng J., Yan L. (2007). Spatial Structures of Fish Communities on the Continental Shelf of the East China Sea. Acta Ecologica. Sin. 27 (11), 4377–4386. doi: 10.3321/j.issn:1000-0933.2007.11.001
May J. L., Blaber S. J. M. (1989). Benthic and Pelagic Fish Biomass of the Upper Continental Slope Off Eastern Tasmania. Mar. Biol. 101 (1), 11–25. doi: 10.1007/BF00393474
Moranta J., Stefanescu C., Massutí E., Morales-Nin B., Lloris D. (1998). Fish Community Structure and Depth-Related Trends on the Continental Slope of the Balearic Islands (Algerian Basin, Western Mediterranean). Mar. Ecol. Prog. 171 (1), 247–259. doi: 10.3354/meps171247
Pinkas L., Oliphant S., Iverson I. (1971). Food Habits of Albacore, Bluefin Tuna and Bonito in Californian Waters. Fish. Bull. 152, 1–105.
Qiu Y. (1988). The Regional Changes of Fish Community on the Northern Continental Shelf of South China Sea. J. Fish. China 12 (4), 303–313.
Qiu Y. (1990). A Preliminary Analysis of Fish Species Groups on the Northern Continental Shelf of South China Sea. J. Fish. China 14 (4), 267–276.
Qiu Y., Zeng X., Chen T., Wang Y., Yuan W. (2008). Fisheries Resources and Fisheries Management in the South China Sea (Beijing: China Tax Press), 1–255.
Sala A., Lucchetti A., Piccinetti C., Ferretti M. (2008). Size Selection by Diamond- and Square-Mesh Codends in Multi-Species Mediterranean Demersal Trawl Fisheries. Fish. Res. 93 (1), 8–21. doi: 10.1016/j.fishres.2008.02.003
Sardà F., Cartes J. E., Company J. B. (1994). Spatio-Temporal Variations in Megabenthos Abundance in Three Different Habitats of the Catalan Deep-Sea (Western Mediterranean). Mar. Biol. 120 (2), 211–219. doi: 10.1007/BF00349681
Shen J., Chen Y. (1987). A Study on the Deep Sea Demersal Fish Communities and Their Structures in the East China Sea. J. Fish. China 11 (4), 293–306.
South China Sea Fisheries Research Institute (1981). Comprehensive Investigation Report on Fishery Resources in the Northern Continental Slope of the South China Sea (Guangzhou: South China Sea Fisheries Research Institute of State Fisheries Administration), 1–302.
Stefanescu C., Lloris D., Rucabado J. (1993). Deep-Sea Fish Assemblages in the Catalan Sea (Western Mediterranean) Below a Depth of 1000 M. Deep. Sea. Res. Part I Oceanog. Res. Pap. 40 (4), 695–707. doi: 10.1016/0967-0637(93)90066-C
Sun D., Chen Z. (2013). Review of Fishes of South China Sea: Volume One (Beijing: Ocean Press), 1–606.
Taiga K., Katsunori T. (2021). Patterns in Diversity and Species Composition in Soft-Sediment Tidepool Fishes Across Topographical Types: Implications for Conservation With Spatial Nuances. Mar. Environ. Res. 170, 105442. doi: 10.1016/j.marenvres.2021.105442
Wang F., Wu Y., Chen Z., Zhang G., Zhang J., Zheng S., et al. (2019). Trophic Interactions of Mesopelagic Fishes in the South China Sea Illustrated by Stable Isotopes and Fatty Acids. Front. Mar. Sci. 5, 552. doi: 10.3389/fmars.2018.00522
Wilhm J. L. (1968). Use of Biomass Units in Shannon's Formula. Ecology 49 (1), 153–156. doi: 10.2307/1933573
Williams A., Koslow J. A., Last P. R. (2001). Diversity, Density and Community Structure of the Demersal Fish Fauna of the Continental Slope Off Western Australia (20 to 35°s). Mar. Ecol. Prog. 212 (1), 247–263. doi: 10.3354/meps212247
Zhang J., Qiu Y., Chen Z., Zhang P., Zhang K., Fan J., et al. (2018). Advances in Pelagic Fishery Resources Survey and Assessment in Open South China Sea. South China Fish. Sci. 14 (6), 118–127. doi: 10.12131/20180037
Zhao Z., Zhou X. (1984). Introduction to Ecology (Chongqing: Chongqing Branch of Scientific and Technical Documents Publishing House), 1–264.
Keywords: species composition, index of relative importance, replacement rate, non-metric multi-dimensional scaling, analysis of similarities, similarity percentage
Citation: Zhang J, Zhang K, Jiang Y-e, Li Y-j, Fan J-t, Yu W-m and Chen Z-z (2022) Diversity and Structure of Demersal Fish Community Over the Northern Slope in the South China Sea. Front. Mar. Sci. 9:809636. doi: 10.3389/fmars.2022.809636
Received: 05 November 2021; Accepted: 18 May 2022;
Published: 16 June 2022.
Edited by:
Çetin Keskin, Istanbul University, TurkeyReviewed by:
Xinzheng Li, Institute of Oceanology (CAS), ChinaCopyright © 2022 Zhang, Zhang, Jiang, Li, Fan, Yu and Chen. This is an open-access article distributed under the terms of the Creative Commons Attribution License (CC BY). The use, distribution or reproduction in other forums is permitted, provided the original author(s) and the copyright owner(s) are credited and that the original publication in this journal is cited, in accordance with accepted academic practice. No use, distribution or reproduction is permitted which does not comply with these terms.
*Correspondence: Jun Zhang, emhhbmdqdW5Ac2NzZnJpLmFjLmNu; Zuo-zhi Chen, Y2hlbnp1b3poaUBzY3NmcmkuYWMuY24=
Disclaimer: All claims expressed in this article are solely those of the authors and do not necessarily represent those of their affiliated organizations, or those of the publisher, the editors and the reviewers. Any product that may be evaluated in this article or claim that may be made by its manufacturer is not guaranteed or endorsed by the publisher.
Research integrity at Frontiers

Learn more about the work of our research integrity team to safeguard the quality of each article we publish.