 Fahad Al Senafi
94% of researchers rate our articles as excellent or good
Learn more about the work of our research integrity team to safeguard the quality of each article we publish.
Find out more
ORIGINAL RESEARCH article
Front. Mar. Sci. , 24 February 2022
Sec. Physical Oceanography
Volume 9 - 2022 | https://doi.org/10.3389/fmars.2022.809355
This article is part of the Research Topic Advances in Sea State Modeling and Climate Change Impacts View all 19 articles
The Arabian Gulf comprises one of the world's most unique and fragile marine ecosystems; it is susceptible to the adverse effects of climate change due to its shallow depth and its location within an arid region that witnesses frequent severe atmospheric events. To reproduce these effects in numerical models, it is important to obtain a better understanding of the region's sea surface temperature (SST) variability patterns, as SST is a major driver of circulation in shallow environments. To this end, here, empirical orthogonal function (EOF) decomposition analysis was conducted to investigate interannual to multi-decadal SST variability in the Gulf from 1982 to 2020, using daily Level 4 Group for High Resolution SST (GHRSST) data. In this way, three dominant EOF modes were identified to contribute the Gulf's SST variability. Significant spatial and temporal correlations were found suggesting that throughout the 39-year study period, SST variability could be attributed to atmospheric changes driven by the El Nio-Southern Oscillation (ENSO), Atlantic Multi-decadal Oscillation (AMO), and Indian Ocean Dipole (IOD) climate modes. Spatial and temporal analyses of the dataset revealed that the average SST was 26.7°C, and that the warming rate from 1982 to 2020 reached up to 0.59°C/decade. A detailed examination of SST changes associated with heat exchange at the air-sea interface was conducted using surface heat fluxes from fifth generation (ERA5) European Centre for Medium-Range Weather Forecasts (ECMWF). Despite the SST warming trend, the accumulation of heat during the study period is suggesting that there was an overall loss of heat (cooling). This cooling reverted into heating in 2003 and has since been increasing.
Owing to its strategic location and its susceptibility to extremely high temperatures and salinities (Johns et al., 2003; Khan et al., 2021), the Arabian Gulf (hereafter Gulf) is one of the most important, yet fragile, marine ecosystems on Earth. This important region may be susceptible to the adverse effects of climate change. Unfortunately, increasing water temperatures driven by global warming, as well as contaminants (oil spills, waste waters, and industrial waste) (Uddin et al., 2021; Stöfen-OBrien et al., 2022), have severely affected and degraded the Gulf's marine ecosystems, such as its sabkhas, mudflats, mangrove swamps, sea grasses, and coral reefs (Burt et al., 2011; Vaughan et al., 2021). These ecosystems support various endangered marine species, such as dugongs and turtles (Sale et al., 2010). Thus, understanding the driving forces of the Gulf's circulation mechanism is critical to preserving these natural habitats. In relation to the preservation of climate balance in the Gulf, coupled atmosphere-ocean dynamics play a major role in determining regional and global climate conditions. They are characterized by multiple spatial and temporal patterns that can be identified by analyzing trends in sea surface temperature (SST) (Messié and Chavez, 2011). Despite its importance, the coupled atmosphere-ocean dynamics within the Gulf are poorly understood and only few studies exist in the published literature, largely due to the paucity of oceanographic and meteorological measurements. A study by Purkis and Riegl (2005) investigated the effects of the Gulf's water temperatures on coral assemblages, while relating SST anomalies to the El Nio-Southern Oscillation (ENSO). Moradi and Kabiri (2015), meanwhile, analyzed the spatio-temporal variability of SST and chlorophyll-a in the Gulf for a 10-year period, finding no clear SST modes. Another study by Noori et al. (2019), used the daily Optimum Interpolation SST anomaly (OISSTA) generated by the National Oceanic and Atmospheric Administration (NOAA) to examine the Gulf spatio-temporal SST trends from 1982 to 2016 and link these to ENSO and NAO. Most other studies (Arun et al., 2005; Nezlin et al., 2010; Almazroui, 2012; Huang et al., 2021) have focused on the impacts of major climate modes (ENSO, Indian Ocean Dipole [IOD], and North Atlantic Oscillation [NAO]) on the Gulf's air temperature and precipitation. Provided with these contexts, the Gulf's SST modes were analyzed and their relationships to regional and global climate patterns were explored in aim of improving understanding of interannual to multi-decadal SST variability within the Gulf, and to determine its relation to major climate modes. Understanding these patterns will refine the cognizance of current ocean dynamics and predictive capabilities of ocean circulation models, consequently aiding studies into the sustainability of ocean ecosystems globally.
The remainder of this manuscript is organized as follows. Section 2 describes the study area. Section 3 describes the dataset employed in this study and the analytical approach. Section 4 presents the Gulf's SST spatial and temporal variabilities between the years 1982 and 2020. In addition, this section also presents the identification and discussion of the three major SST modes in the Gulf and relates them to the Atlantic Multi-decadal Oscillation (AMO), ENSO, and IOD climate modes. A summary and conclusions are then detailed in Section 5.
The Gulf's basin has an average depth of 36 m, with the maximum depth (100 m) occurring near the Strait of Hormuz (Figure 1). The Gulf is 990 km long and 338 km wide, with an estimated surface area and volume of 239,000 km2 and 8,630 km3, respectively. Tectonic driven subsidence increased the seafloor depths at the shelf break that connects the Strait of Hormuz to the Gulf of Oman and Indian Ocean to become 200–300 m, while localized seafloor depressions generated 70–95 m troughs along the Iranian coastline. It is situated in the subtropical high pressure belt region (25–30°N), within which the Earth's harshest deserts are found (Al Senafi and Anis, 2015). Descending dry air in this region creates arid desert conditions, while the Gulf is exposed to extra-tropical weather systems from the northwest. The most well-known weather phenomena in the Gulf are Shamal wind events (Rao et al., 2001, 2003) and dust storms (Kutiel and Furman, 2003). Shamal (“north” in Arabic) designates strong (up to 20 m/s; Rao et al., 2003) northwesterly winds that blow over the Gulf in summer (June to August; associated with the relative strengths of the Indian and Arabian thermal lows) and in winter (November to March; related to synoptic weather systems to the northwest) (Aboobacker et al., 2011). These meteorological phenomena occur at a rate of 10 events per year and substantially impact the natural environment and human health. They also cause abrupt changes in the Gulf's circulation, mixing intensities, heat-budget, and SST patterns (Al Senafi and Anis, 2015; Li et al., 2020b) similar to the Mistral winds that blow towards the Gulf of Lion in the Mediterranean (Bosse et al., 2021), and the Bora wind events that blow towards the Adriatic Sea (Ferrarin et al., 2019). In addition, SST changes resulting from these meteorological events also likely play a major role in the formation and location of the Gulf Deep Water (GDW). Driven by surface water cooling, GDW flows out of the Gulf close to its bottom, before spilling out into the Indian Ocean via the Strait of Hormuz. GDW is critical in regulating the Gulf's salinity and flushing its contaminants (Swift and Bower, 2003; Yao et al., 2014).
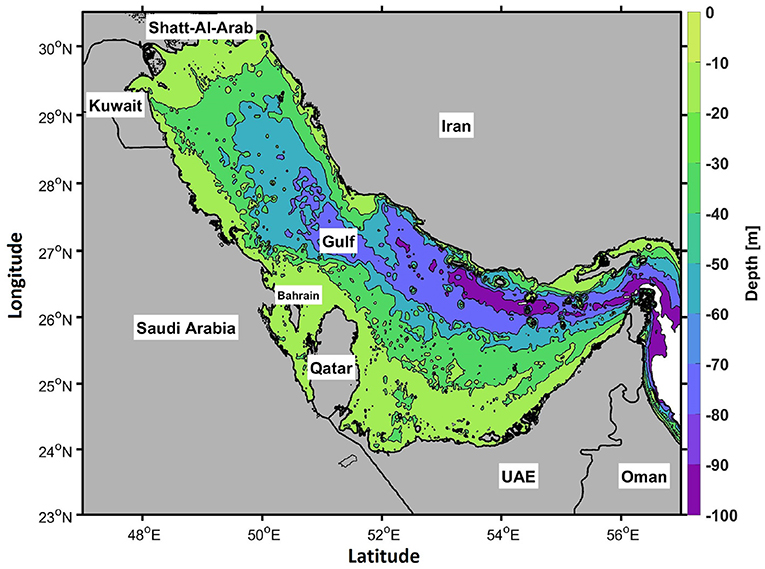
Figure 1. Bathymetry map of the Gulf.
The arid regional meteorological conditions and shallow depths described above produce large variations in sea temperatures, which can range from 11°C in winter to 38°C in summer (Alosairi et al., 2020). Moreover, the excess evaporation over precipitation and river discharge can cause hyper-saline conditions, with salinities up to 70 PSU (Sheppard et al., 2010). The long-term circulation in the Gulf is, as in other semi-enclosed basins (e.g., Mediterranean and Red Sea), is a combined product of wind stress, buoyancy (Al Senafi and Anis, 2020b), freshwater runoff, tides (Al Senafi and Anis, 2020a; Li et al., 2020a), as well as the restricted exchange with the open ocean that results in an inverse estuarine circulation (Thoppil and Hogan, 2010a; Yao and Johns, 2010a,b). Thus, better understanding the region's interannual to multi-decadal SST variability could better reveal the Gulf's surface and deep circulations.
The Gulf's daily SST was studied for the period of January 1982 to December 2020. The dataset employed in this study was obtained using the Level 4 Group for High Resolution Sea Surface Temperature (GHRSST) that is freely available online through NASA's Physical Oceanography Distributed Active Archive Center (PO.DAAC) (https://podaac.jpl.nasa.gov). This product interpolates and extrapolates SST observations from various sources, creating a smoothly gridded database that contains temporally and spatially homogeneous daily SST images at a spatial resolution of 0.25° (Reynolds et al., 2007; National Centers for Environmental Information, 2016). The GHRSST dataset has been assessed by Nesterov et al. (2021) using in-situ measurements in the southern Gulf. Results of this assessment found a good agreement between both datasets with correlation coefficients exceeding 0.99. Furthermore, in-situ measurements at Qarooh Island, Kuwait described in Al Senafi and Anis (2020b) were used to evaluate the accuracy of the GHRSST dataset in the northern Gulf (Figure 2A). Results of this evaluation demonstrate that the GHRSST dataset is well correlated (r = 0.99) with the observations and displayed a Mean Bias Error (MBE) of 0.02°C (Figures 2B,C) capturing seasonal variability and the SST's changes associated with various meteorological events.
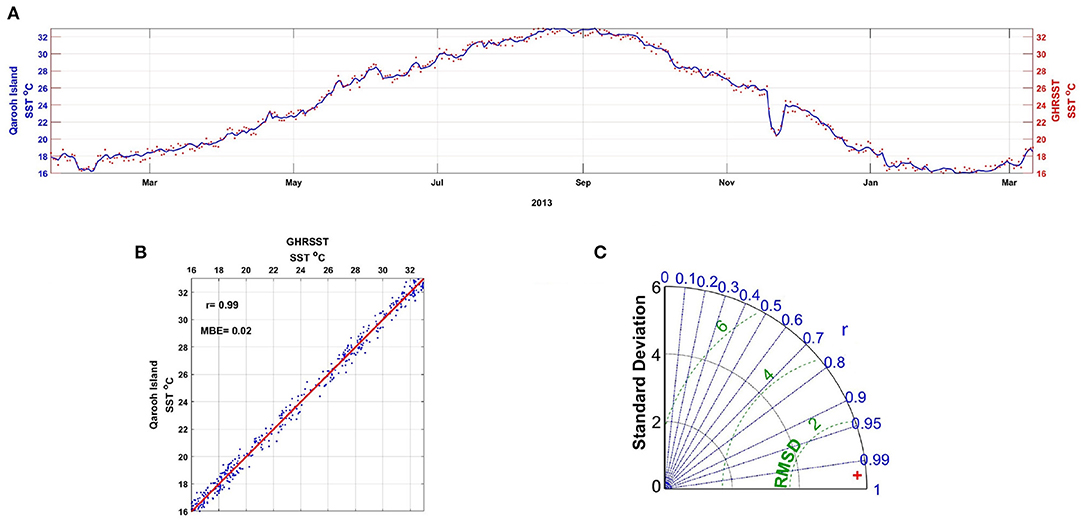
Figure 2. (A) Daily SST observations (January-2013 to March 2014) from GHRSST (red) and Qarooh Island station, Kuwait (blue), (B) comparison of daily SSTs from GHRSST and Qarooh Island observations. A linear fit to the data, using robust regression is represented by the solid red line. (C) Taylor diagram (Taylor, 2001) summarizing results of comparison between GHRSST and Qarooh Island observations from SST.
Using the GHRSST dataset described above, a total number of 14,244 images were retained and organized in an M N matrix, where M and N represent the spatial and temporal elements, respectively. This dataset was used to describe the space (x) and time (t) variability of SST in the Gulf, using statistical measures (average, range, variance, trend, minimum, and maximum) and the traditional Empirical Orthogonal Function (EOF) decomposition. EOF analysis reconstructs a gridded time series of the specified modes from eigenmode maps of variability and a corresponding principal component (PC) time series. In an EOF analysis, the temporally and spatially varying SST, T(x, t), can be expressed in an orthogonal expansion of PCs in the form
where Fn(x) is the spatial loading (EOF) and an(t) is the temporal varying functions (PC). Prior to EOF analysis, it was first necessary to detrend the daily SST images temporally to remove long term trends and emphasize temporal variance,
where T′(x,t) represent the residual SST anomalies. Alternatively, the spatial trend was also removed,
After the dominant SST modes were defined based on spatio-temporal characteristics, their correlations with major climate modes, including AMO, ENSO, and IOD, were investigated. This type of analysis has been widely adopted in studies with unknown modes of variability and their associations with major modes of climate variability globally (e.g., Fauchereau et al., 2003 over the Atlantic and Indian Oceans, Carleton, 2003 over the Southern Ocean, and Wu et al., 2020 over the Pacific Ocean). Other climates modes were excluded from detailed analysis as overall they exhibited insignificant correlations with the Gulf's SST modes. These modes included Arctic Oscillation (AO), North Atlantic Oscillation (NAO), and Pacific decadal oscillation (PDO). Climate mode datasets were obtained from the National Oceanic and Atmospheric Administration (NOAA) Physical Sciences Laboratory website (https://www.psl.noaa.gov/data/climateindices).
The thermal conservation equation was used to approximate the contribution to SST changes associated with heat exchange at the air-sea interface, as follows:
where T is temperature, ρw is the surface density (1024–1030 kg/m3) taken from Reynolds (1993), h is the surface mixed layer depths (5–20 m) taken from Reynolds (1993), Cp is the specific heat capacity constant of seawater, and is the net heat flux.
where is the net shortwave radiation, is the net longwave radiation, is the latent heat flux, and is the sensible heat flux. The four heat flux components were obtained from the fifth generation (ERA5; Hersbach et al., 2018) of the European Centre for Medium-Range Weather Forecasts (ECMWF) atmospheric reanalysis of global climate for the period of 1982 to 2020, at a spatial resolution of 31 km. The ERA5 dataset is freely available online through the Copernicus Climate Change Service (https://climate.copernicus.eu).
In a detailed one year study conducted by Al Senafi et al. (2019), ERA5 heat fluxes were validated and shown to be the most suitable data for the Gulf, with an error of 4.5 W/m2 and a correlation of 0.9. Based on the thermal conservation approximation, the percentage of change in SST that could be explained by air-sea heat exchange was determined from the overall observed SST changes; Al Senafi and Anis (2020b) used a similar approach to study the Gulf's advection processes.
The Gulf daily SST time series for the period of 1982 to 2020 revealed that the spatial period average was 26.7°C (Figure 3A), and that it displayed a latitudinal gradient of cooler temperatures from south to north. The Gulf was shown to be warmer than other semi-enclosed seas such as the Mediterranean Sea, which has an annual average SST of 19.7°C (Shaltout and Omstedt, 2014), but cooler than the Red Sea, which has an annual average SST of 27.1°C (Krokos et al., 2019). However, unlike the Red Sea, which has an average depth of 450 m (Shaked and Genin, 2011), the Gulf is shallower, with an average depth of 36 m (Pous et al., 2012). This results in the Gulf experiencing larger seasonal swings in SST; they can reach up to 25.2°C, with the range being higher in shallower regions (i.e., the northern half and along the western coast) than in deeper areas (the southern half and eastern coast; Figures 1, 3B). The Gulf's maximum SST (36.7°C) was recorded on July 1996 in the vicinity of Makasib Island, which is located between Qatar and the United Arab Emirates (UAE; Figure 3C). The currents here are stagnant and the waters are shallow (<10 m) (Reynolds, 1993; Thoppil and Hogan, 2010b). The Gulf's maximum SST was found to be warmer than that of the Red Sea (maximum of 33°C recorded at Bab-el-Mandab Strait; Chaidez et al., 2017). In addition, various studies in the Gulf have recorded single point measurements of 37.6 and 34.6°C in Kuwaiti waters (Alosairi et al., 2020; Al Senafi and Anis, 2020a). In contrast, the Gulf's minimum SST was 11.7°C (recorded in Kuwaiti waters; Figure 3D), which was cooler than the minimum SST observed in the Mediterranean and Red Seas: 15°C (Criado-Aldeanueva et al., 2008; Shaltout, 2019). This emphasizes the Gulf's large temperature swings.
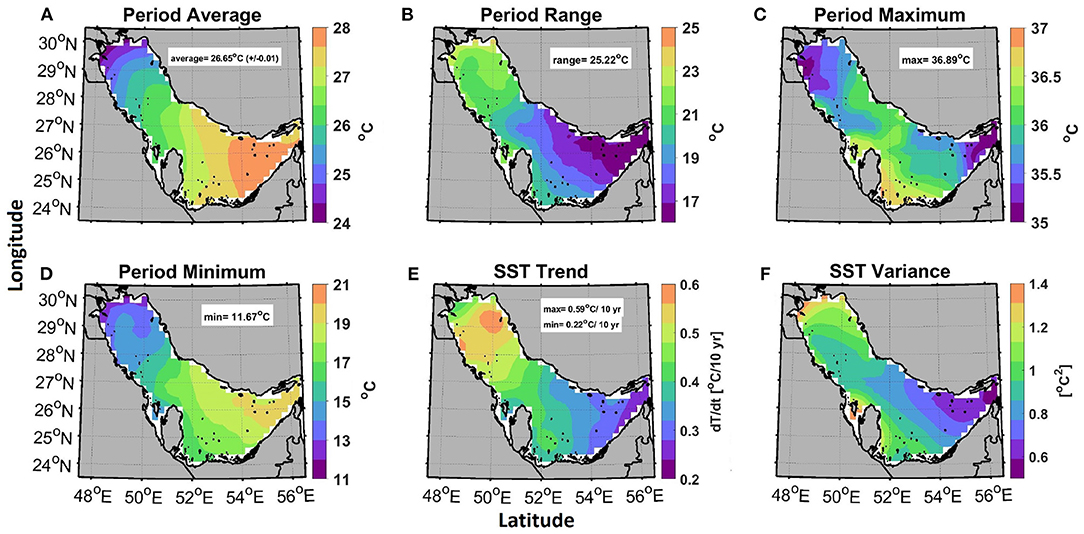
Figure 3. (A) SST average, (B) SST range, (C) SST maximum, (D) SST minimum, (E) SST trend, and (F) SST variance for 1982–2020; SST time series was detrended and deseasoned prior to computing variance. SST: sea surface temperature.
The non-seasonal SST intensity of change was examined by focusing on the SST variance shown in Figure 3F. This approach also emphasized the regions within the Gulf that experienced the highest non-seasonal fluctuations during the 39-year study period; these areas are likely to be relatively susceptible to the influence of climate change. The results presented in Figure 3F distinctively show that variance was stronger in the northern tip, where Shatt-Al-Arab river discharge occurs, and in the waters surrounding Qatar. These two regions also feature the shallowest waters, which may explain their relatively quick response to external forcing (e.g., sea surface heat and mass transfer), compared to other regions in the Gulf (Figure 3B). In addition to their shallow nature, the strong variance observed at the northern tip could also be explained by the variability of the Shatt-Al-Arab river discharge rates; they fluctuated between 8.2 and 46.6 milliards m2/year throughout the study period (Al-Saadi, 2021). After detrending both riverine discharge rates and SST observations at the Gulf's northern tip to remove long-term linear biases, a correlation of 0.65 was found between both datasets, suggesting that an increase in flow was followed by an increase in SST (Figure 4). Whereas, the stagnate currents and shallow nature explain the high variances in the region surrounding Qatar.
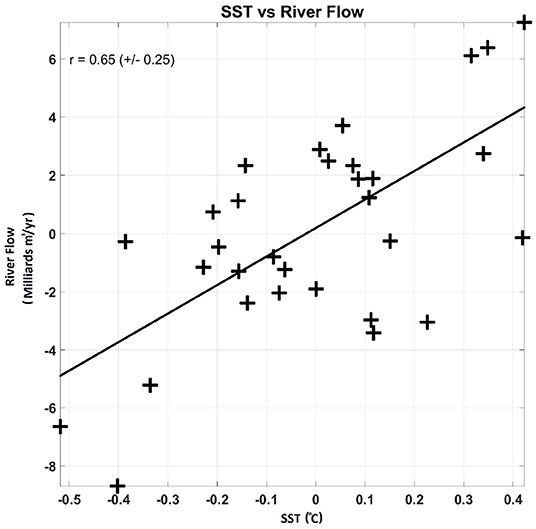
Figure 4. Scatter plot of correlation between detrended annual Shatt-Al-Arab river discharge and detrended annual SST for 1982–2015. SST: sea surface temperature.
Compared to the global and Red Sea SST warming rates of 0.07 and 0.17 (max 0.45)°C/decade (Lough, 2012; Chaidez et al., 2017), respectively, the Gulf's warming rate was found here to be 0.41 (±0.14)°C/decade. Hereher (2020) determined the Gulf's warming trend to be 0.7°C/decade using observations from Moderate Resolution Imaging Spectroradiometer (MODIS) images for the period of 2003 to 2018; this is similar to the observations obtained here for the same time period (0.67°C/decade). In addition, the results obtained here showed that the Gulf's spatial SST warming trend displayed a latitudinal gradient of 0.22 to 0.59°C/decade, with steeper trends from south to north. The only exception to this trend occurred in the northern tip near the Shatt-Al-Arab riverine discharge; here, the warming rate (0.41°C/decade) was slower than that of the surrounding northern water (≥ 0.5°C/decade; Figure 3E). In agreement with the results reported here, Al-Rashidi et al. (2008) concluded that Kuwaiti waters warmed at a rate of 0.6°C/decade for the period of 1985 to 2002.
Analyzing the region's air-sea net heat fluxes revealed that the accumulated air-sea net heat flux during the study period throughout the Gulf was -1.52 W/m2 (Figure 5A). However, since 2003 the Gulf has gained 0.5 W/m2 of heat at the air-sea interface; this trend is likely to continue to increase by 0.3 W/m2 every year, assuming that a similar trend persists.
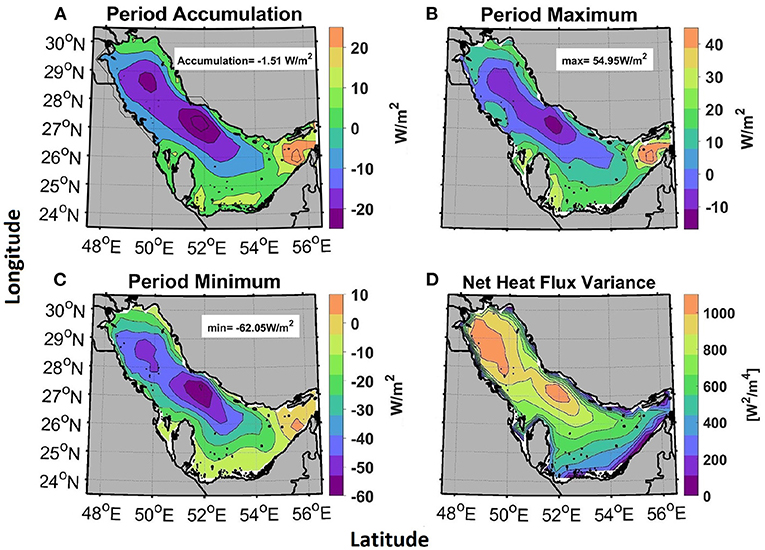
Figure 5. (A) average, (B) minimum, (C) maximum, and (D) variance for 1982–2020; time series was detrended and deseasoned prior to computing variance.
Spatially, the Gulf was found to lose heat at the center during the 39-year study period (<0 W/m2), as indicated by the cooler colors (blue and purple colors) in Figure 5A. The coastal regions and the Strait of Hormuz (to the south) gained heat (> 0 W/m2), as indicated by the green, yellow, and orange colors in Figure 5A. The net heat flux at the Gulf's center exhibited the highest range (up to 51 W/m2); this was double the range in the coastal regions. Despite the high range of the net heat flux at the Gulf's center, the maximum net heat flux continuously remained below zero, indicating that persistent cooling occurred throughout the 39-year study period (Figure 5B); the minimum flux was −62 W/m2 (Figure 5C). These results signify the crucial role of the Gulf's center region in cooling the region's waters; it acts as a regulator in reducing the high net heat flux intake within the coastal waters. Though the Gulf continuously lost heat at its center, the net heat flux trend showed that this cooling decreased at a rate of 7.71 W/m2 per decade. This is critical, as the Gulf's waters are likely to warm faster in the future should this trend continue. This heating trend was observed throughout the Gulf, ranging between 0.64 and 7.71 W/m2 per decade. The strongest heat flux variances were also found in the Gulf's center region, emphasizing that this area exhibited the largest changes (Figure 5D).
As shown in Figure 6, air-sea heat exchange explained up to 70% of SST variance in the Gulf's center and in the Strait of Hormuz (where SST variance was weakest; Figure 3F). The air-sea heat exchange only explained up to 25% of SST variance in the coastal regions, however, where the SST variances were strongest. This suggests that air-sea heat exchange was least pronounced in the shallow and dynamic areas of the Gulf.
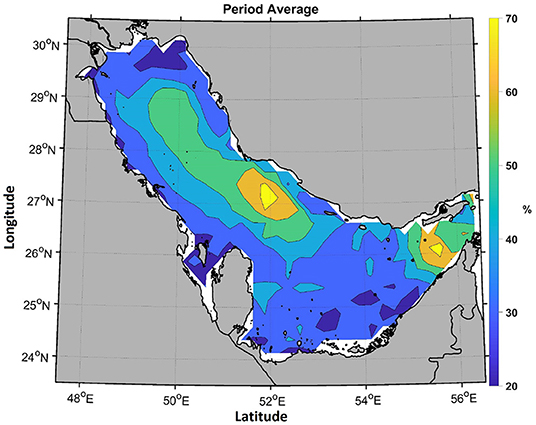
Figure 6. Percentage SST changes associated with heat exchange at air-sea interface. SST: sea surface temperature.
The yearly averaged SST time series showed clear interannual variability at a warming rate of 0.41 (±0.14)°C/decade (Figure 7). The SST in the warmest and coolest years was 27.43°C in 2010 and 25.11°C in 1991, respectively. Furthermore, the last seven years (2014–2020) were all within the top ten warmest years, with an average SST of 27.02°C. Moreover, > 75% of days within those seven years experienced SSTs that were warmer than the 39-year average. Furthermore, the number of warmer days increased at a rate of ~2 % per year (Figure 8). This warming trend displayed seasonal variability; SST warming was slowest in mid-winter (December–January) and mid-summer (July–August) at a rate of <0.3°C/decade. This rate then doubled during the fall (September–October) and spring (March–April). The faster warming trends during the fall and spring periods will likely further energize extreme storm events, which are common during these transitional seasons in the Gulf, should this warming rate continue (Al Senafi and Anis, 2015; Al Senafi et al., 2019).
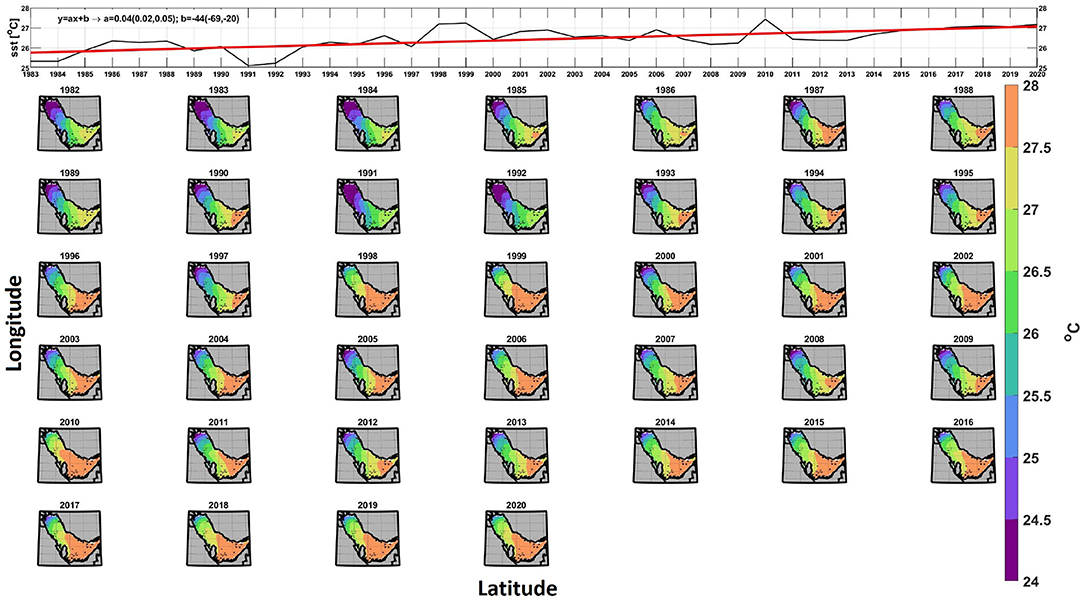
Figure 7. (Top): Time series of yearly averaged SST anomalies for years 1982–2020; (Bottom map) yearly averaged SST anomaly Gulf maps. SST: sea surface temperature.
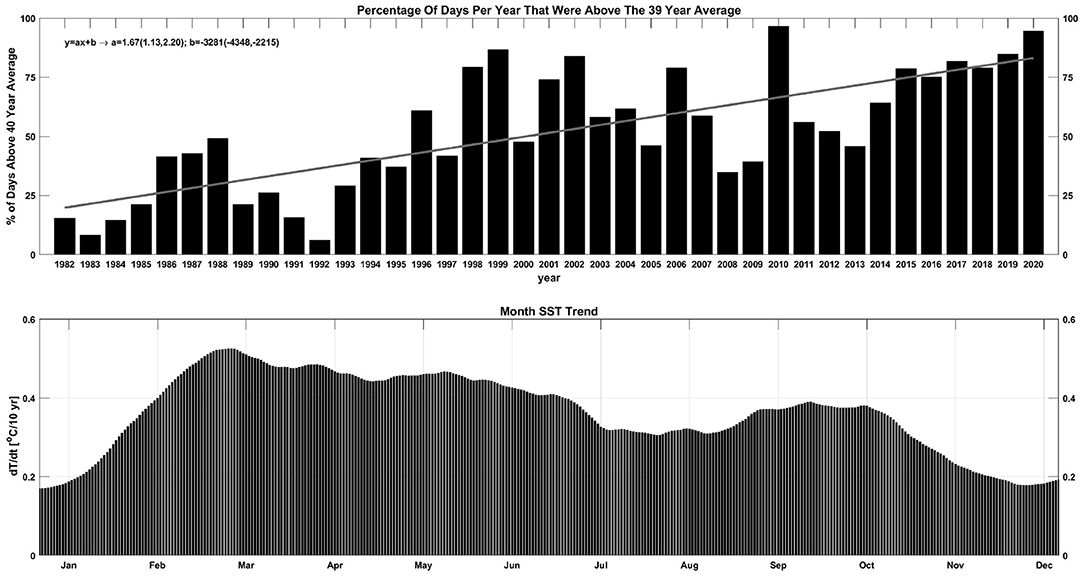
Figure 8. (Top): Time series of percentage of days within each year above 39-year period average for 1982–2020; (Bottom map) rate of warming per decade for each day of year.
In addition to the air-sea cooling at the Gulf's center, as explained in Section 4.3, GDW is another regulator of the Gulf's temperature. Although GDW is poorly understood, various studies (e.g., Thoppil and Hogan, 2010a,b; Li et al., 2020b) have suggested that it is convectively driven by cooling of the sea surface in the northern Gulf, and that it is more pronounced during late winter-spring, when vertical density stratification is weakest (Reynolds, 1993). GDW formation was found to occur within the vicinity of where the Gulf's SST warming rate was fastest (Figure 3E); furthermore it occurred within those months when the warming rate was also fastest (Figure 8). This suggests that the formation of this deep water mass could possibly be disturbed should this warming trend continue.
The SST-standardized anomalies presented in Figure 9 clearly indicate that 1997 was the period's “tipping point,” where SST inverted from being persistently cooler (negative anomalies) to being warmer (positive anomalies), with the exception of 2008 and 2009, within the 39-year baseline. The computation of EOF showed that the first three modes together explained 86% of the variance observed in SST anomalies. The remaining EOF modes explained less than 3% each of the total SST anomaly variances. These remaining EOF modes were excluded from further analysis, as they did not pass the North et al. (1982) criteria, where the difference between the third and fourth eigenvalues are proportional to their sampling error magnitude; thus, the error size is comparable with the EOF themselves.
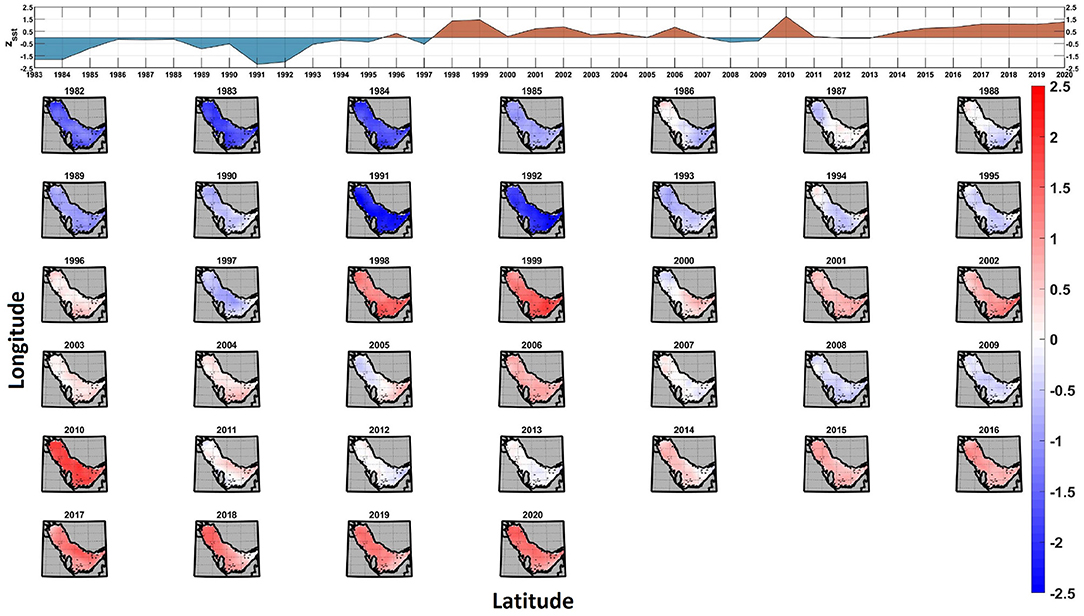
Figure 9. (Top): Time series of yearly averaged SST anomalies for 1982–2020; (Bottom map) yearly averaged SST anomaly Gulf maps. SST: sea surface temperature.
The EOF (spatial patterns) and PC (time series) for first three modes are presented in Figures 10, 11, respectively. The PC time series of the first mode of SST explained 73% of the total variance, displaying clear positive (e.g., 1995, 1998, and 2010) and negative (e.g., 1982, 1984, and 1991) anomaly peaks that were well correlated (0.71) with the AMO index. Further analysis of the lead-lag correlation revealed a 1–3 month lag, where the AMO index was found to lead the PC time series of mode 1 (Figure 11A). The warming of the Gulf's SST in response to the AMO warming peaks was consistent with the findings of Alawad et al. (2020) within the Red Sea; it is likely attributable to changes in the upper troposphere (200 hPa) meridional winds (namely the Circum-Global Teleconnection; Ding and Wang, 2005). These changes impose warm air temperatures (Lu et al., 2002; Hong et al., 2017) across the Eurasian continents. This may explain why the strong mode 1 signatures of > 3.5°C (Figure 10A; yellow-to-red shading) were located in the Gulf's shallowest regions (Figure 1), while the strongest signature > 4°C (Figure 10A; red shading) was located in the shallowest and weakest currents, off the coast of Qatar. The second EOF mode of SST explained 9.9% of the total variance, demonstrating a latitudinal gradient (Figure 10B). The PC time series of this mode displayed positive (e.g., 1982, 1986, and 2015) and negative (e.g., 1983, 1988, and 1999) peaks that were consistent with the ENSO index, with a significant correlation of 0.63 and a lag of 4 months (Figure 11B). The strong latitudinal signature of EOF mode 2 may be attributable to fluctuations in regional precipitation following peak ENSO periods. A detailed 40-year study by Al Senafi and Anis (2015) of the Mesopotamia (Kuwait, Iran, Iraq, Syria, and Turkey) and Gulf regions concluded that peak ENSO periods shifted the tropical convection cells eastwards; this in turn disturbed the moisture-bearing jet stream and increased precipitation. Wetter ENSO periods would increase Shatt-Al-Arab discharge; as described in Section 4.1; this would lead to warming of SSTs in the region's northern waters.
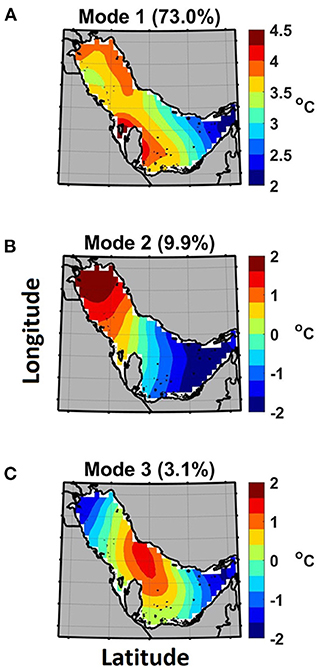
Figure 10. Gulf EOF of first three SST modes for 1982–2020. EOF: empirical orthogonal function.
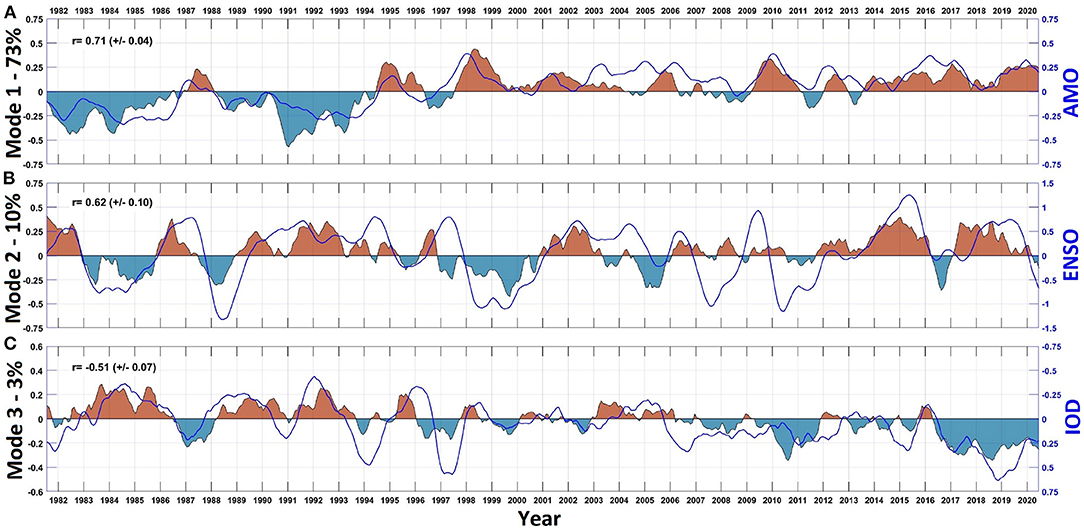
Figure 11. Time series of PC associated with first three modes for 1982–2020 alongside (A) AMO, (B) ENSO, and (C) IOD indices in blue. PC: principal component; AMO: Atlantic Multi-decadal Oscillation; ENSO: El Nio-Southern Oscillation; IOD: Indian Ocean Dipole.
The third EOF mode explained 3.1% of the total SST anomaly variance. The strongest signature of the third EOF was located in the Gulf's center, where the influence of air-sea heat exchange was highest (Figure 6). The PC time series of the third mode displayed positive (e.g., 1983, 1985, and 1992) and negative (e.g., 1987, 2010, and 2018) peaks that were consistent with the IOD index, with a significant correlation of -0.51 and a lag of 5 months. This is similar to the lag period observed by Arun et al. (2005) for the Gulf region (Figure 11C). Further analysis of the air-sea net heat fluxes showed that during IOD peak phases, the heat loss from the Gulf was eight times lower than average. This was mainly attributed to the reduction of latent heat loss, which explained 61% of the net heat flux. This reduction in latent heat flux likely arose from an increase in the moisture influx into the Gulf from Africa, via Saudi Arabia, during positive IOD periods (Arun et al., 2005).
The study focused on the Arabian Gulf's interannual to multi-decadal SST variability over the period of 1982 to 2020, using daily Level 4 GHRSST images. The findings presented here indicate that the average SST of the Gulf over the last 39 years was 26.7°C, and that warming occurred at rates of 0.22 to 0.59°C/decade during this time. The overall warming displayed seasonal variations; warming during the extreme storm transitional periods (fall and spring) occurred at double the rate than in winter and summer. Large swings in seasonal SST were observed, with minimum and maximum recorded SSTs of 11.7°C and 26.7°C, respectively.
The results presented here indicate that despite the observed warming trend, the accumulation of heat during the study period was −1.52 W/m2, suggesting an overall loss of heat (cooling). This cooling is critical in lowering the Gulf's extreme water temperatures, which could otherwise result in coral bleaching and undesired stress to other marine species (Burt et al., 2013; Sheppard, 2016). However, detailed analysis of the air-sea net heat fluxes indicated that a reversal from cooling (negative) to heating (positive) occurred in 2003; this heating rate will continue to rise at a rate of 0.3 W/m2 per year.
EOF analysis was conducted to characterize the multiple spatial and temporal patterns of the Gulf's SST variability. Local trends were subtracted prior to EOF analysis to emphasize interannual to multi-decadal SST variability. In this way, three dominant EOF modes were identified that contributed to 86% of the Gulf's SST variability. The significant spatial and temporal correlations (r > 0.51) suggest that throughout the 39-year study period, the SST variability could be attributed to atmospheric changes imposed by the AMO, ENSO, and IOD climate modes. Nonetheless, the findings of this study have to be seen in light of some limitations that could be addressed in future research. This study uses ERA5 and GHRSST datasets that have been validated only in the northern part of the Gulf and during a 1 year period.
A better understanding of the Gulf's SST modes can help reveal the region's circulation more clearly, within which GDW plays a major role. The formation and circulation of dense GDW have been linked to cooler surface waters (Swift and Bower, 2003; Yao et al., 2014). GDW is critical in regulating salinity and flushing contaminants that are introduced into the Gulf. Thus, it is critical to conduct a detailed observational study to resolve spatial and temporal variations in sea surface heat, momentum, and mass transfer. The influence of spatial and temporal variability in SST, as reported in the present study, should also be investigated regarding GDW.
The raw data supporting the conclusions of this article will be made available by the author, without undue reservation.
The author confirms sole responsibility for the following: study conception and design, data collection, analysis and interpretation of results, and manuscript preparation.
The author declares that the research was conducted in the absence of any commercial or financial relationships that could be construed as a potential conflict of interest.
All claims expressed in this article are solely those of the authors and do not necessarily represent those of their affiliated organizations, or those of the publisher, the editors and the reviewers. Any product that may be evaluated in this article, or claim that may be made by its manufacturer, is not guaranteed or endorsed by the publisher.
I thank NASA (POODAC) for providing the SST data. I also thank ECMWF for providing online access to reanalysis data and NOAA (PSL) for the online teleconnection pattern data. I would like to express my special thanks of gratitude to Dr Hala Al Jassar (Kuwait University) as well as the Kuwait Sat 1 team for inspiring the project idea.
Aboobacker, V. M., Vethamony, P., and Rashmi, R. (2011). Shamal swells in the Arabian Sea and their influence along the west coast of India. Geophys. Res. Lett. 38:L03608. doi: 10.1029/2010GL045736
Al Senafi, F., and Anis, A. (2015). Shamals and climate variability in the Northern Arabian/Persian Gulf from 1973 to 2012. Int. J. Climatol. 35, 4509–4528. doi: 10.1002/joc.4302
Al Senafi, F., and Anis, A. (2020a). Internal waves on the continental shelf of the Northwestern Arabian Gulf. Front. Marine Sci. 6, 1–19. doi: 10.3389/fmars.2019.00805
Al Senafi, F., and Anis, A. (2020b). Wind-driven flow dynamics off the Northwestern Arabian Gulf Coast. Estuarine Coastal Shelf Sci. 233:106511. doi: 10.1016/j.ecss.2019.106511
Al Senafi, F., Anis, A., and Menezes, V. (2019). Surface heat fluxes over the northern Arabian Gulf and the northern red sea: evaluation of ECMWF-ERA5 and NASA-MERRA2 reanalyses. Atmosphere 10, 1–30. doi: 10.3390/atmos10090504
Alawad, K. A., Al-Subhi, A. M., Alsaafani, M. A., and Alraddadi, T. M. (2020). Decadal variability and recent summer warming amplification of the sea surface temperature in the Red Sea. PLoS ONE 15, 1–11. doi: 10.1371/journal.pone.0237436
Almazroui, M. (2012). Temperature variability over Saudi Arabia and its association with global climate indices. J. King Abdulaziz University Meteorol. Environ. Arid Land Agric. Sci. 23, 85–108. doi: 10.4197/Met.23-1.6
Alosairi, Y., Alsulaiman, N., Rashed, A., and Al-Houti, D. (2020). World record extreme sea surface temperatures in the northwestern Arabian/Persian Gulf verified by in situ measurements. Marine Pollut. Bull. 161:111766. doi: 10.1016/j.marpolbul.2020.111766
Al-Rashidi, T. B., El-Gamily, H. I., Amos, C. L., and Rakha, K. a. (2008). Sea surface temperature trends in Kuwait Bay, Arabian Gulf. Nat. Hazards 50, 73–82. doi: 10.1007/s11069-008-9320-9
Al-Saadi, N. (2021). Water resources decrease of river euphrates and its impacts on the environment in iraq. Int. J. Ecol. Environ. Sci. 33, 33–60.
Arun, C., Swadhin, B., Mujumdar, M., Ohba, R., and Yamagata, T. (2005). Diagnosis of tropospheric moisture over Saudi Arabia and influences of IOD and ENSO. Month. Weather Rev. 134, 598–617. doi: 10.1175/MWR3085.1
Bosse, A., Testor, P., Damien, P., Estournel, C., Marsaleix, P., Mortier, L., et al. (2021). Wind-forced submesoscale symmetric instability around deep convection in the northwestern mediterranean sea. Fluids 6, 1–26. doi: 10.3390/fluids6030123
Burt, J., Al-Harthi, S., and Al-Cibahy, A. (2011). Long-term impacts of coral bleaching events on the world's warmest reefs. Marine Environ. Res. 72, 225–229. doi: 10.1016/j.marenvres.2011.08.005
Burt, J. A., Al-Khalifa, K., Khalaf, E., AlShuwaikh, B., and Abdulwahab, A. (2013). The continuing decline of coral reefs in Bahrain. Marine Pollut. Bull. 72, 357–363. doi: 10.1016/j.marpolbul.2012.08.022
Carleton, A. M. (2003). Atmospheric teleconnections involving the Southern Ocean. J. Geophys. Res. Oceans 108:JC000379. doi: 10.1029/2000JC000379
Chaidez, V., Dreano, D., Agusti, S., Duarte, C. M., and Hoteit, I. (2017). Decadal trends in Red Sea maximum surface temperature. Sci. Rep. 7, 1–8. doi: 10.1038/s41598-017-08146-z
Criado-Aldeanueva, F., Del Río Vera, J., and García-Lafuente, J. (2008). Steric and mass-induced Mediterranean sea level trends from 14 years of altimetry data. Glob. Planetary Change 60, 563–575. doi: 10.1016/j.gloplacha.2007.07.003
Ding, Q., and Wang, B. (2005). Circumglobal teleconnection in the Northern Hemisphere summer. J. Clim. 18, 3483–3505. doi: 10.1175/JCLI3473.1
Fauchereau, N., Trzaska, S., Richard, Y., Roucou, P., and Camberlin, P. (2003). Sea-surface temperature co-variability in the southern Atlantic and Indian Oceans and its connections with the atmospheric circulation in the Southern Hemisphere. Int. J. Climatol. 23, 663–677. doi: 10.1002/joc.905
Ferrarin, C., Davolio, S., Bellafiore, D., Ghezzo, M., Maicu, F., Mc Kiver, W., et al. (2019). Cross-scale operational oceanography in the Adriatic Sea. J. Operat. Oceanography 12, 86–103. doi: 10.1080/1755876X.2019.1576275
Hereher, M. E. (2020). Assessment of climate change impacts on sea surface temperatures and sea level rise-The Arabian Gulf. Climate 8, 50. doi: 10.3390/cli8040050
Hersbach, H., Bell, B., Berrisford, P., Biavati, G., Horányi, A., Muñoz Sabater, J., et al. (2018). ERA5 hourly data on single levels from 1979 to present. Copernicus Climate Change Service (C3S) Climate Data Store (CDS). doi: 10.24381/cds.adbb2d47
Hong, X., Lu, R., and Li, S. (2017). Amplified summer warming in Europe-West Asia and Northeast Asia after the mid-1990s. Environ. Res. Lett. 12:094007. doi: 10.1088/1748-9326/aa7909
Huang, Y., Liu, X., Yin, Z. Y., and An, Z. (2021). Global impact of ENSO on dust activities with emphasis on the key region from the Arabian Peninsula to Central Asia. J. Geophys. Res. Atmosph. 126, 1–24. doi: 10.1029/2020JD034068
Johns, W., Yao, F., Olson, D., Josey, S., Grist, J., and Smeed, D. (2003). Observations of seasonal exchange through the Straits of Hormuz and the inferred heat and freshwater budgets of the Persian Gulf. J. Geophys. Res. 108, 3391. doi: 10.1029/2003JC001881
Khan, S., Piao, S., Khan, I. U., Xu, B., Khan, S., Ismail, M. A., et al. (2021). Variability of SST and ILD in the Arabian Sea and Sea of Oman in Association with the Monsoon Cycle. Math. Problems Eng. 2021:9958257. doi: 10.1155/2021/9958257
Krokos, G., Papadopoulos, V. P., Sofianos, S. S., Ombao, H., Dybczak, P., and Hoteit, I. (2019). Natural climate oscillations may counteract red sea warming over the coming decades. Geophys. Res. Lett. 46, 3454–3461. doi: 10.1029/2018gl081397
Kutiel, H., and Furman, H. (2003). Dust storms in the middle east: sources of origin and their temporal characteristics. Indoor Built Environ. 12, 419–426. doi: 10.1177/1420326X03037110
Li, D., Anis, A., and Al Senafi, F. (2020a). Neap-spring variability of tidal dynamics in the Northern Arabian Gulf. Continental Shelf Res. 197:104086. doi: 10.1016/j.csr.2020.104086
Li, D., Anis, A., and Al Senafi, F. (2020b). Physical response of the Northern Arabian Gulf to winter Shamals. J. Marine Syst. 203:103280. doi: 10.1016/j.jmarsys.2019.103280
Lough, J. M. (2012). Small change, big difference: sea surface temperature distributions for tropical coral reef ecosystems, 1950-2011. J. Geophys. Res. Oceans 117, 1950–2011.
Lu, R.-Y., Oh, J.-H., and Kim, B.-J. (2002). A teleconnection pattern in upper-level meridional wind over the North African and Eurasian continent in summer. Tellus Dyn. Meteorol. Oceanography 54, 44–55. doi: 10.3402/tellusa.v54i1.12122
Messié, M., and Chavez, F. (2011). Global modes of sea surface temperature variability in relation to regional climate indices. J. Clim. 24, 4314–4331. doi: 10.1175/2011JCLI3941.1
Moradi, M., and Kabiri, K. (2015). Spatio-temporal variability of SST and Chlorophyll-a from MODIS data in the Persian Gulf. Marine Pollut. Bull. 98, 14–25. doi: 10.1016/j.marpolbul.2015.07.018
National Centers for Environmental Information (2016). Daily L4 Optimally Interpolated SST (OISST) In situ and AVHRR Analysis. Ver. 2.0. PO.DAAC, CA, USA. doi: 10.5067/GHAAO-4BC02
Nesterov, O., Temimi, M., Fonseca, R., Nelli, N. R., Addad, Y., Bosc, E., et al. (2021). Validation and statistical analysis of the group for high resolution sea surface temperature data in the Arabian Gulf. Oceanologia 63, 497–515. doi: 10.1016/j.oceano.2021.07.001
Nezlin, N., Polikarpov, I., Al-Yamani, F., Subba Rao, D., and Ignatov, A. (2010). Satellite monitoring of climatic factors regulating phytoplankton variability in the Arabian (Persian) Gulf. J. Marine Syst. 82, 47–60. doi: 10.1016/j.jmarsys.2010.03.003
Noori, R., Tian, F., Berndtsson, R., Abbasi, M. R., Naseh, M. V., Modabberi, A., et al. (2019). Recent and future trends in sea surface temperature across the persian gulf and gulf of Oman. PLoS ONE 14, 1–19. doi: 10.1371/journal.pone.0212790
North, G. R., Bell, T. L., Cahalan, R. F., and Moeng, F. J. (1982). Sampling Errors in the Estimation of Empirical Orthogonal Functions. Month. Weather Rev. 110, 699–706. doi: 10.1175/1520-0493(1982)110<0699:SEITEO>2.0.CO;2
Pous, S., Carton, X., and Lazure, P. (2012). A process study of the tidal circulation in the persian gulf. Open J. Marine Sci. 2, 131–140. doi: 10.4236/ojms.2012.24016
Purkis, S. J., and Riegl, B. (2005). Spatial and temporal dynamics of Arabian Gulf coral assemblages quantified from remote-sensing and in situ monitoring data. Marine Ecol. Progr. Series 287, 99–113. doi: 10.3354/meps287099
Rao, G., Al-Sulaiti, M., and Al-Mulla, A. (2001). Winter shamals in Qatar, Arabian Gulf. Weather 56, 444–451. doi: 10.1002/J.1477-8696.2001.TB06528.X
Rao, G., Al-Sulaiti, M., and Al-Mulla, A. (2003). Summer shamals over the Arabian Gulf. Weather 58, 471–478.
Reynolds, M. (1993). Physical oceanography of the persian gulf, strait of hormuz, and the gulf of oman results from the mt. mitchell expedition. Marine Pollut. Bull. 27, 35–59.
Reynolds, R. W., Smith, T. M., Liu, C., Chelton, D. B., Casey, K. S., and Schlax, M. G. (2007). Daily high-resolution-blended analyses for sea surface temperature. J. Clim. 20, 5473–5496. doi: 10.1175/2007JCLI1824.1
Sale, P. F., Feary, D. A., Burt, J. A., Bauman, A. G., Cavalcante, G. H., Drouillard, K. G., et al. (2010). The growing need for sustainable ecological management of marine communities of the persian Gulf. Ambio 40, 4–17.
Shaked, Y., and Genin, A. (2011). “Red sea and gulf of Aqaba,” in Encyclopedia of Modern Coral Reefs: Structure, Form and Process, ed D. Hopley (Dordrecht: Springer), 839–843.
Shaltout, M. (2019). Recent sea surface temperature trends and future scenarios for the Red Sea. Oceanologia 61, 484–504. doi: 10.1007/s13280-010-0092-6
Shaltout, M., and Omstedt, A. (2014). Recent sea surface temperature trends and future scenarios for the Mediterranean Sea. Oceanologia 56, 411–443. doi: 10.5697/oc.56-3.411
Sheppard, C. (2016). Coral reefs in the Gulf are mostly dead now, but can we do anything about it? Marine Pollut. Bull. 105, 593–598. doi: 10.1016/j.marpolbul.2015.09.031
Sheppard, C., Al-Husiani, M., Al-Jamali, F., Al-Yamani, F., Baldwin, R., Bishop, J., et al. (2010). The Gulf: a young sea in decline. Marine Pollut. Bull. 60, 13–38. doi: 10.1016/j.marpolbul.2009.10.017
Stöfen-OBrien, A., Naji, A., Brooks, A. L., Jambeck, J. R., and Khan, F. R. (2022). Marine plastic debris in the Arabian/Persian Gulf: challenges, opportunities and recommendations from a transdisciplinary perspective. Marine Policy 136:104909. doi: 10.1016/j.marpol.2021.104909
Swift, S. A., and Bower, A. (2003). Formation and circulation of dense water in the Persian/Arabian Gulf. J. Geophys. Res. 108:3004. doi: 10.1029/2002JC001360
Taylor, K. E. (2001). Summarizing multiple aspects of model performance in a single diagram. J. Geophys. Res. 106, 7183–7192. doi: 10.1029/2000JD900719
Thoppil, P., and Hogan, P. (2010a). Persian Gulf response to a wintertime shamal wind event. Deep Sea Res. Part I Oceanograph. Res. Papers 57, 946–955. doi: 10.1016/j.dsr.2010.03.002
Thoppil, P. G., and Hogan, P. J. (2010b). A modeling study of circulation and eddies in the persian Gulf. J. Phys. Oceanography 40, 2122–2134. doi: 10.1175/2010JPO4227.1x
Uddin, S., Fowler, S. W., Saeed, T., Jupp, B., and Faizuddin, M. (2021). Petroleum hydrocarbon pollution in sediments from the Gulf and Omani waters: status and review. Marine Pollut. Bull. 173:112913. doi: 10.1016/j.marpolbul.2021.112913
Vaughan, G. O., Shiels, H. A., and Burt, J. A. (2021). Seasonal variation in reef fish assemblages in the environmentally extreme southern Persian/Arabian Gulf. Coral Reefs 40, 405–416. doi: 10.1007/s00338-020-02041-2
Wu, Z., Jiang, C., Conde, M., Chen, J., and Deng, B. (2020). The long-term spatiotemporal variability of sea surface temperature in the northwest Pacific and China offshore. Ocean Sci. 16, 83–97. doi: 10.5194/os-16-83-2020
Yao, F., Hoteit, I., Pratt, L. J., Bower, A. S., Zhai, P., Köhl, A., et al. (2014). Seasonal overturning circulation in the Red Sea: 1. model validation and summer circulation. J. Geophys. Res. Oceans 119, 2238–2262. doi: 10.1002/2013JC009004
Yao, F., and Johns, W. (2010a). A HYCOM modeling study of the Persian Gulf: 2. formation and export of Persian Gulf Water. J. Geophys. Res. 115:C11018. doi: 10.1029/2009JC005788
Keywords: sea surface temperature, climate indices, climate change, Arabian Gulf, Persian Gulf
Citation: Al Senafi F (2022) Atmosphere-Ocean Coupled Variability in the Arabian/Persian Gulf. Front. Mar. Sci. 9:809355. doi: 10.3389/fmars.2022.809355
Received: 04 November 2021; Accepted: 31 January 2022;
Published: 24 February 2022.
Edited by:
Adem Akpinar, Uludağ University, TurkeyReviewed by:
Prasad Bhaskaran, Indian Institute of Technology Kharagpur, IndiaCopyright © 2022 Al Senafi. This is an open-access article distributed under the terms of the Creative Commons Attribution License (CC BY). The use, distribution or reproduction in other forums is permitted, provided the original author(s) and the copyright owner(s) are credited and that the original publication in this journal is cited, in accordance with accepted academic practice. No use, distribution or reproduction is permitted which does not comply with these terms.
*Correspondence: Fahad Al Senafi, ZmFoYWQuYWxzZW5hZmlAa3UuZWR1Lmt3
Disclaimer: All claims expressed in this article are solely those of the authors and do not necessarily represent those of their affiliated organizations, or those of the publisher, the editors and the reviewers. Any product that may be evaluated in this article or claim that may be made by its manufacturer is not guaranteed or endorsed by the publisher.
Research integrity at Frontiers
Learn more about the work of our research integrity team to safeguard the quality of each article we publish.