 Farrah T. Chan
 Dawson Ogilvie
 Francisco Sylvester
 Sarah A. Bailey
- 1Great Lakes Laboratory for Fisheries and Aquatic Sciences, Fisheries and Oceans Canada, Burlington, ON, Canada
- 2Facultad de Ciencias Naturales, Instituto para el Estudio de la Biodiversidad de Invertebrados (IEBI), Universidad Nacional de Salta, Salta, Argentina
- 3Consejo Nacional de Investigaciones Científicas y Técnicas, CCT CONICET Salta-Jujuy, Salta, Argentina
Ship biofouling is a major vector for the introduction and spread of harmful marine species globally; however, its importance in Arctic coastal ecosystems is understudied. The objective of this study was to provide insight regarding the extent of biofouling (i.e., percent cover, abundance, and species richness) on commercial ships operating in the Canadian Arctic. A questionnaire was used to collect information on travel history, antifouling practices, and self-reported estimates of biofouling extent from ships operating in the region during 2015–2016. Twenty-five percent of ships operating in the region during the study period completed the questionnaire (n = 50). Regression trees were developed to infer the percent cover of biofouling, total abundance of fouling invertebrates, and fouling species richness on respondent ships based on previous underwater wetted surface assessments of commercial ships in Canada. Age of antifouling coating system was the only significant predictor of percent cover and total abundance of biofouling invertebrates, while the number of biogeographic realms previously visited and port residence time were significant predictors for fouling species richness. Comparison of relevant travel history features reported through the questionnaire to the regression tree models revealed that 41.9% of 43 respondent ships had antifouling coating systems older than 630 days and are therefore inferred to have relatively high (> 9.3%) biofouling percent cover. More than half of respondent ships (62.8%) had antifouling coating systems older than 354 days and are therefore inferred to have a relatively high total abundance (over 6,500 individuals) of fouling invertebrates. Nearly half of respondent ships (45.9% of 37 ships) had visited at least three biogeographic realms during their last 10 ports-of-call and are therefore inferred to have relatively high fouling species richness (mean 42 taxa). Self-reported estimates of biofouling cover were unreliable, being much lower than model inferences. Although the regression tree models have relatively low predictive power, explaining only 15–33% of the variance in biofouling extent, this study indicates that commercial ships are an active pathway for the transportation of non-indigenous aquatic species to Canadian Arctic coastal ecosystems via biofouling.
Introduction
Fouling by aquatic organisms on wetted surfaces of ships is an important means of transferring species to new regions, especially in marine and coastal ecosystems (Hewitt et al., 2009; Bailey et al., 2020). Such attached organisms can fragment, escape, become dislodged, or reproduce while ships are in port and, if they become established in new locations, could be detrimental to the environment, human health, property, and resources (Bailey et al., 2020). Ship biofouling is typically managed using antifouling systems, which includes applying antifouling coating systems (e.g., biocidal coatings and/or fouling-release coatings) and operating marine growth prevention systems to exposed wetted surfaces (IMO, 2011; Arndt et al., 2021). Biocidal coatings are the most common type of antifouling coating used, which prevent organisms from accumulating on surfaces through low-level continuous release of a biocidal agent that kills or deters settling organisms (Dafforn et al., 2011). Conversely, fouling-release coatings reduce the adherence of organisms to wetted surfaces so that they more easily detach while ships are underway (Dafforn et al., 2011).
Biofouling on ships is typically concentrated in niche areas (e.g., sea chests, water cooling systems, and propellers), rather than on flat exterior surfaces on the main hull (Coutts and Dodgshun, 2007; Davidson et al., 2009; Chan et al., 2015). This is because fouling on the hull is typically well managed by ship owners, since fouling can increase drag and, in turn, increase the fuel consumption of a ship (Schultz et al., 2010; Hakim et al., 2019). Furthermore, antifouling coating systems are generally more effective on the hull when exposed to higher water velocities experienced during sailing (Coutts and Taylor, 2004). Conversely, niche areas tend to become more heavily fouled with organisms since the antifouling coating systems cannot be applied (e.g., sacrificial anodes) or they are typically less effective in these physically complex areas (Coutts and Taylor, 2004; Davidson et al., 2009; Frey et al., 2014). Marine growth prevention systems (e.g., anodic copper dosing and electrolysis) deliver antifouling agents to reduce fouling in recessed or internal niche areas, such as sea chests and water cooling systems (Coutts and Dodgshun, 2007; Grandison et al., 2011).
Several variables related to the size and operational profile of ships have been used to estimate biofouling in the absence of direct measurements of biofouling assemblages on ships. For example, it has been hypothesized that larger ships have a higher likelihood of non-indigenous species introduction than smaller ships as they have more wetted surface area to accumulate a larger number of fouling organisms (Lo et al., 2012; Moser et al., 2016; Miller et al., 2018). However, the wetted surface area of a ship may not directly indicate the abundance of fouling organisms, since fouling organisms are typically concentrated in niche areas, which make up between 7 and 27% of a ship’s total wetted surface area and do not normally increase proportionally with wetted surface area (Frey et al., 2014; Chan et al., 2015; Moser et al., 2017). The operational profile of a ship includes time between dry-docking visits, sailing speed, residence time in ports, and travel history. Time since the last dry-docking typically indicates the age of the antifouling coating system as coatings are applied when the ship is in dry-dock for maintenance or repairs. Antifouling coating systems generally become less effective with age, such that ships with older antifouling coatings tend to accumulate more fouling organisms than those with newer coatings (Davidson et al., 2009; Sylvester et al., 2011). The typical sailing speed of a ship may influence biofouling extent since fouling organisms are more likely to dislodge from ship hulls (and other unprotected wetted surfaces) at higher sailing speeds (Coutts et al., 2010; Davidson et al., 2020). The residence time of a ship at previous ports may serve as an indicator of biofouling extent since longer port stays increase the exposure time to propagules in the port environment and antifouling coating systems may be less effective while stationary due to low flow conditions (Davidson et al., 2009, 2020; Sylvester and MacIsaac, 2010). Travel history has been used as an indicator of the diversity and abundance of fouling communities on ships, since fouling organisms accumulate over time and ships that visit more regions are likely to be exposed to a greater variety of species (Sylvester et al., 2011). Furthermore, ships operating at lower latitudes may be exposed to a larger number of fouling organisms, given that the productivity of biological communities is typically greater in warmer climates (Sylvester et al., 2011).
The introduction and establishment of non-indigenous marine species in the Arctic are predicted to increase with the growing demand for shipping in support of resource development, tourism, and fisheries (Miller and Ruiz, 2014; Ware et al., 2014; Ricciardi et al., 2017; Goldsmit et al., 2020). Furthermore, the decline in sea ice cover due to climate warming is lengthening the Arctic shipping season and increasing the viability of northern shipping routes (e.g., the Northwest Passage and the Northeast Passage; Melia et al., 2016; Pizzolato et al., 2016). Increased shipping activity will result in a greater abundance of non-indigenous species transported to the Arctic by ships. Although many non-indigenous species are expected to have low survivorship in Arctic ecosystems, some may survive and become established in recipient ports (Chan et al., 2016, 2019; Goldsmit et al., 2019).
Globally, shipping is the main vector of marine non-indigenous species translocations through the biofouling and ballast water pathways (Bailey et al., 2020). It has been reported that a greater diversity and abundance of non-indigenous organisms may be transported to the Canadian Arctic via biofouling compared to ballast water (Chan et al., 2015); however, the introduction of non-indigenous species by biofouling to this region remains understudied. The objective of this study was to provide insight regarding the extent of biofouling (i.e., percent cover, abundance, and species richness) on commercial ships operating in the Canadian Arctic. A questionnaire survey was conducted to collect data on variables related to biofouling from a sample of ships operating in the Canadian Arctic. Then, regression trees were developed for predicting the extent of biofouling using the best available data (i.e., direct measures of fouling on wetted surfaces of—mainly international—ships in Canada from previous studies). Finally, the results of the regression tree models were compared to the questionnaire survey data to infer the extent of biofouling on the sampled population of ships operating in Canadian Arctic coastal ecosystems.
Materials and Methods
Ship Biofouling Questionnaire Survey
A questionnaire survey was conducted to characterize the operational profile and antifouling practices of ships operating in the Canadian Arctic during the summers of 2015 and 2016 (Supplementary Material 1). The questionnaire was distributed electronically to all commercial ships entering the Northern Canada Vessel Traffic Services zone by the Canadian Coast Guard as part of the standard entry clearance communications, though participation in the survey was voluntary. The questionnaire was developed based on the voluntary ship biofouling management plan detailed in the International Maritime Organization’s Guidelines for the Control and Management of Ships’ Biofouling to Minimize the Transfer of Invasive Aquatic Species (IMO, 2011).
Information was collected on ships’ operational profile (travel history, typical sailing speed, port residence time, and time at sea), information on antifouling systems installed, general characteristics (ship type, year built, gross tonnage, length, and wetted surface area), and self-reported estimates of percent cover of biofouling. The travel history of ships was requested for the last 10 ports-of-call preceding arrival at a Canadian Arctic port as well as the planned stops in the Arctic. Survey data were supplemented with information collected through mandatory ballast water reporting forms, where necessary. The last 10 ports-of-call were categorized into biogeographic realms following the largest spatial units in the Marine Ecoregions of the World (MEOW) system (Spalding et al., 2007); the Laurentian Great Lakes was included as an additional biogeographic realm.
Self-reported estimates of percent cover of biofouling were obtained to determine if it is feasible to consider these as alternatives to direct measurements of biofouling in lieu of scientific underwater biofouling assessments, which are costly (particularly for remote Arctic ports) and are therefore usually limited by small sample size. Self-reported estimates of percent cover of biofouling were based on the Captains’ general knowledge of the ship (i.e., best guess) and results from the latest underwater inspection. The term “inspection” is used here to refer to opportunistic observations on biofouling from the most recent underwater inspection as part of regular cleaning, repair, and/or maintenance of the hull conducted by ship owners. While there is additional information that may provide insight into the extent of biofouling on ships (e.g., travel history beyond the last 10 ports-of-call and details of antifouling systems onboard), only those cited in scientific literature as predictors of biofouling and readily available to ship crews were requested to keep the questionnaire to a reasonable length.
Regression Tree Analyses
Since previous quantitative underwater assessments of biofouling on commercial ships operating in the Canadian Arctic are very limited, the biofouling extent models were developed using data from underwater assessments conducted across Canadian marine temperate and Arctic ports. The dataset includes underwater biofouling assessments from 53 commercial ships arriving at Halifax, Nova Scotia (20 international ships), Vancouver, British Columbia (20 international ships) during 2007–2009, and Churchill, Manitoba (11 international and 2 domestic ships) in 2010–2011. The data were collected and analyzed using comparable methodologies, and the methods for sample collection, enumeration, and taxonomic identification are detailed in Sylvester et al. (2011) and Chan et al. (2015). It is possible that there have been changes in shipping patterns (e.g., changes in dominant trade routes or hull maintenance activities) during the 4–9-year gap between the underwater biofouling assessments and the questionnaire survey that may alter the observed trends in biofouling; however, these data are considered best-available to support the present study as there have been no more recent biofouling studies in Canada.
A series of regression tree analyses were performed on ship variables to identify predictors of: (i) percent cover of biofouling (algae and invertebrates), (ii) total abundance of fouling invertebrates, and (iii) richness of fouling species (invertebrates). Percent cover of biofouling was determined using underwater video footage. Percent cover for the entire ship was determined by calculating the weighted average of percent cover of biofouling of wetted surface sections (e.g., bulbous bow, hull, sea-chest gratings, stern tube, rope guard, propeller, and rudders), based on their contribution to the total wetted surface area (Sylvester and MacIsaac, 2010; Chan et al., 2015). The total abundance of invertebrates on each ship was estimated by summing abundance estimates for each wetted surface section based on biological quadrat sampling, percent cover information, and surface area of each location (Sylvester et al., 2011); the total abundance values were log10(x + 1) transformed before analysis to meet assumptions of normality. The richness of fouling species represents the Chao-2 species richness estimates based on the total number of fouling invertebrate species identified in biological samples obtained from each ship (Chan et al., 2015). The ship variables assessed included ship size (maximum length, wetted surface area, and gross tonnage), operational profile (typical sailing speed, port residence time, and age of antifouling coating system), and travel history (number of biogeographic realms visited and average, minimum, and maximum port latitude; Table 1). Variables related to travel history were based on the last 10 ports-of-call visited by each ship.
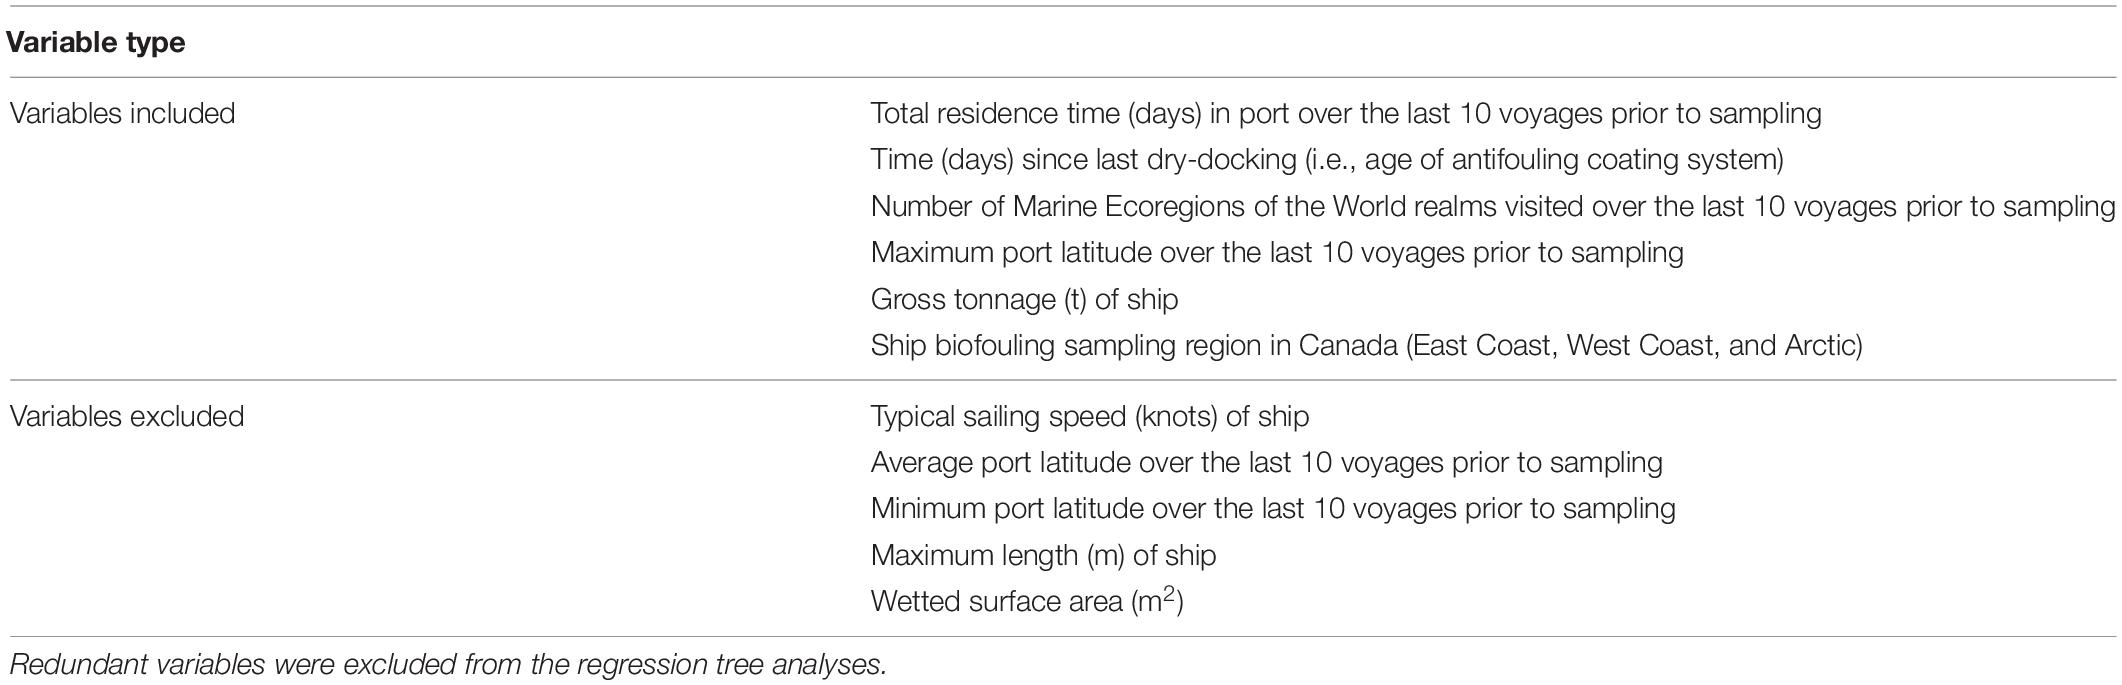
Table 1. Variables assessed in the regression tree analyses to develop tree-based models for predicting biofouling extent on ships.
The data exploration protocol of Zuur et al. (2010) was used to detect multicollinearity in the dataset. As variables related to travel history (i.e., the number of biogeographic realms visited and average, minimum, and maximum port latitude) were correlated with each other, only the number of biogeographic realms visited and maximum port latitude were used in the regression tree analyses. These variables were selected because they are expected to account for the potential diversity of source locations of biofouling organisms. Variables related to ship size (maximum length, wetted surface area, and gross tonnage) and typical sailing speed were also correlated with each other, therefore, only gross tonnage was used in the analyses.
Regression trees were constructed using the number of biogeographic realms visited, maximum port latitude, gross tonnage, port residence time, and age of the antifouling coating system (Table 1). A “region” variable was also included in the analyses to account for the potential effects of the sampling region (East Coast, West Coast, and Arctic) on biofouling extent on ships. For each analysis, the most parsimonious regression tree was selected by pruning the tree to the size where the optimal complexity parameter minimized the cross-validation error. The data were partitioned into a training set (70%) and a test set (30%). A 10-fold cross-validation procedure was used to train and validate the models. In addition, the percent variation (R2) explained by each regression tree was calculated using the following equation, R2 = 1–relative error (Sharma et al., 2012). The mean absolute error and root-mean-square error were calculated to measure the prediction error of the models. The data were also analyzed using random forest and boosted tree models, but since the predictions were no better than the simpler method, only the results of the regression tree analysis are presented. All regression trees were developed using the “rpart” package in R (Therneau et al., 2019).
The validated tree-based models were compared to the questionnaire survey data to infer the biofouling extent on respondent ships that visited the Canadian Arctic during 2015 and 2016. Agresti-Coull binomial confidence intervals (CIs, 95%) were calculated for these inferences, assuming the regression tree models were true. As ships often made multiple trips to the Arctic and, in some cases, made multiple stops in the Arctic during a single trip, only data from each unique ship’s first visit to the Canadian Arctic during the study period were used in the analysis to avoid bias. Finally, the self-reported percent cover of biofouling estimates was compared to the inferred values generated by the model to determine the reliability of these estimates.
Results
Ship Biofouling Questionnaire Survey
A total of 86 questionnaire surveys were returned by 50 unique ships, a response rate of ∼25% of ships operating in the Canadian Arctic during 2015 and 2016 (J. P. Lehnert, Canadian Coast Guard, personal communication). More than one survey was returned by 15 ships that made multiple trips to the Canadian Arctic. Thirty-two ships submitted incomplete surveys, primarily missing information for the same survey questions (i.e., wetted surface area of the ship and remaining service life of antifouling systems installed). Bulk carriers (36%) were the most common respondent ship type, followed by general cargo ships (26%), tankers (18%), passenger ships (8%), tugs and supply ships (8%), and other ship types (4%), which roughly corresponds to the breakdown of ship types in the greater population of ships operating in the Canadian Arctic (Chan et al., 2012; Dawson et al., 2018). Gross tonnage of ships ranged from 119 to 68,870 tons (mean 20,178 tons; SD 16,459 tons), wetted surface area was between 380 and 25,000 m2 (mean 6,840 m2; SD 5,189 m2), and typical sailing speed ranged from 6 to 15 knots (mean 12 knots; SD 2 knots). The newest ship was 1 year old, whereas the oldest ship was 47 years old (mean 15 years; SD 13 years). The age of the antifouling coating system ranged from 17 to 2,014 days (mean 614 days; SD 516 days). Ships spent between 54 and 335 days (mean 218 days; SD 72 days) per year at sea and between 30 and 277 days (mean 133 days; SD 65 days) per year at port.
Of the 46 ships that provided information on their antifouling systems, 18 had both antifouling coatings and marine growth prevention systems installed. All 38 ships with antifouling coatings used biocidal coatings, with two of these ships using biocidal coatings in combination with fouling-release coatings. Twenty-seven ships were fitted with marine growth prevention systems. Four ships did not have any antifouling systems installed.
Thirty-two ships provided self-reported estimates of percent cover of biofouling (mean 2% cover; SD 6%). While the majority (63%) of these ships claimed to have no biofouling (0% cover), one ship estimated 30% biofouling cover. The time since the last inspection ranged from 0 to 24 months (median four months) based on 14 ships that provided the date of their most recent inspection.
The 50 ships surveyed made 462 arrivals at 73 Canadian Artic ports during 2015 and 2016 (Figure 1); 32 ships made numerous stops during a single trip to the Arctic. Deception Bay, Québec, was the most visited port (30 visits per year), followed by Milne Inlet, Nunavut (21 visits per year), and Edward’s Cove, Newfoundland and Labrador (10 visits per year). Ports of departure (most recent port-of-call) were concentrated in the Arctic and Temperate Northern Atlantic (Eastern North America and Western Europe; Supplementary Figure 1). The Canadian Arctic is connected by ship voyages to the Great Lakes and at least 9 of the 12 MEOW biogeographic realms (Arctic, Temperate Northern Atlantic, Tropical Atlantic, Temperate Northern Pacific, Tropical Eastern Pacific, Temperate South America, Temperate Southern Africa, Western Indo-Pacific, and Central Indo-Pacific) when considering the full list of the last 10 ports-of-call preceding arrival at a Canadian Arctic port (Figure 2).
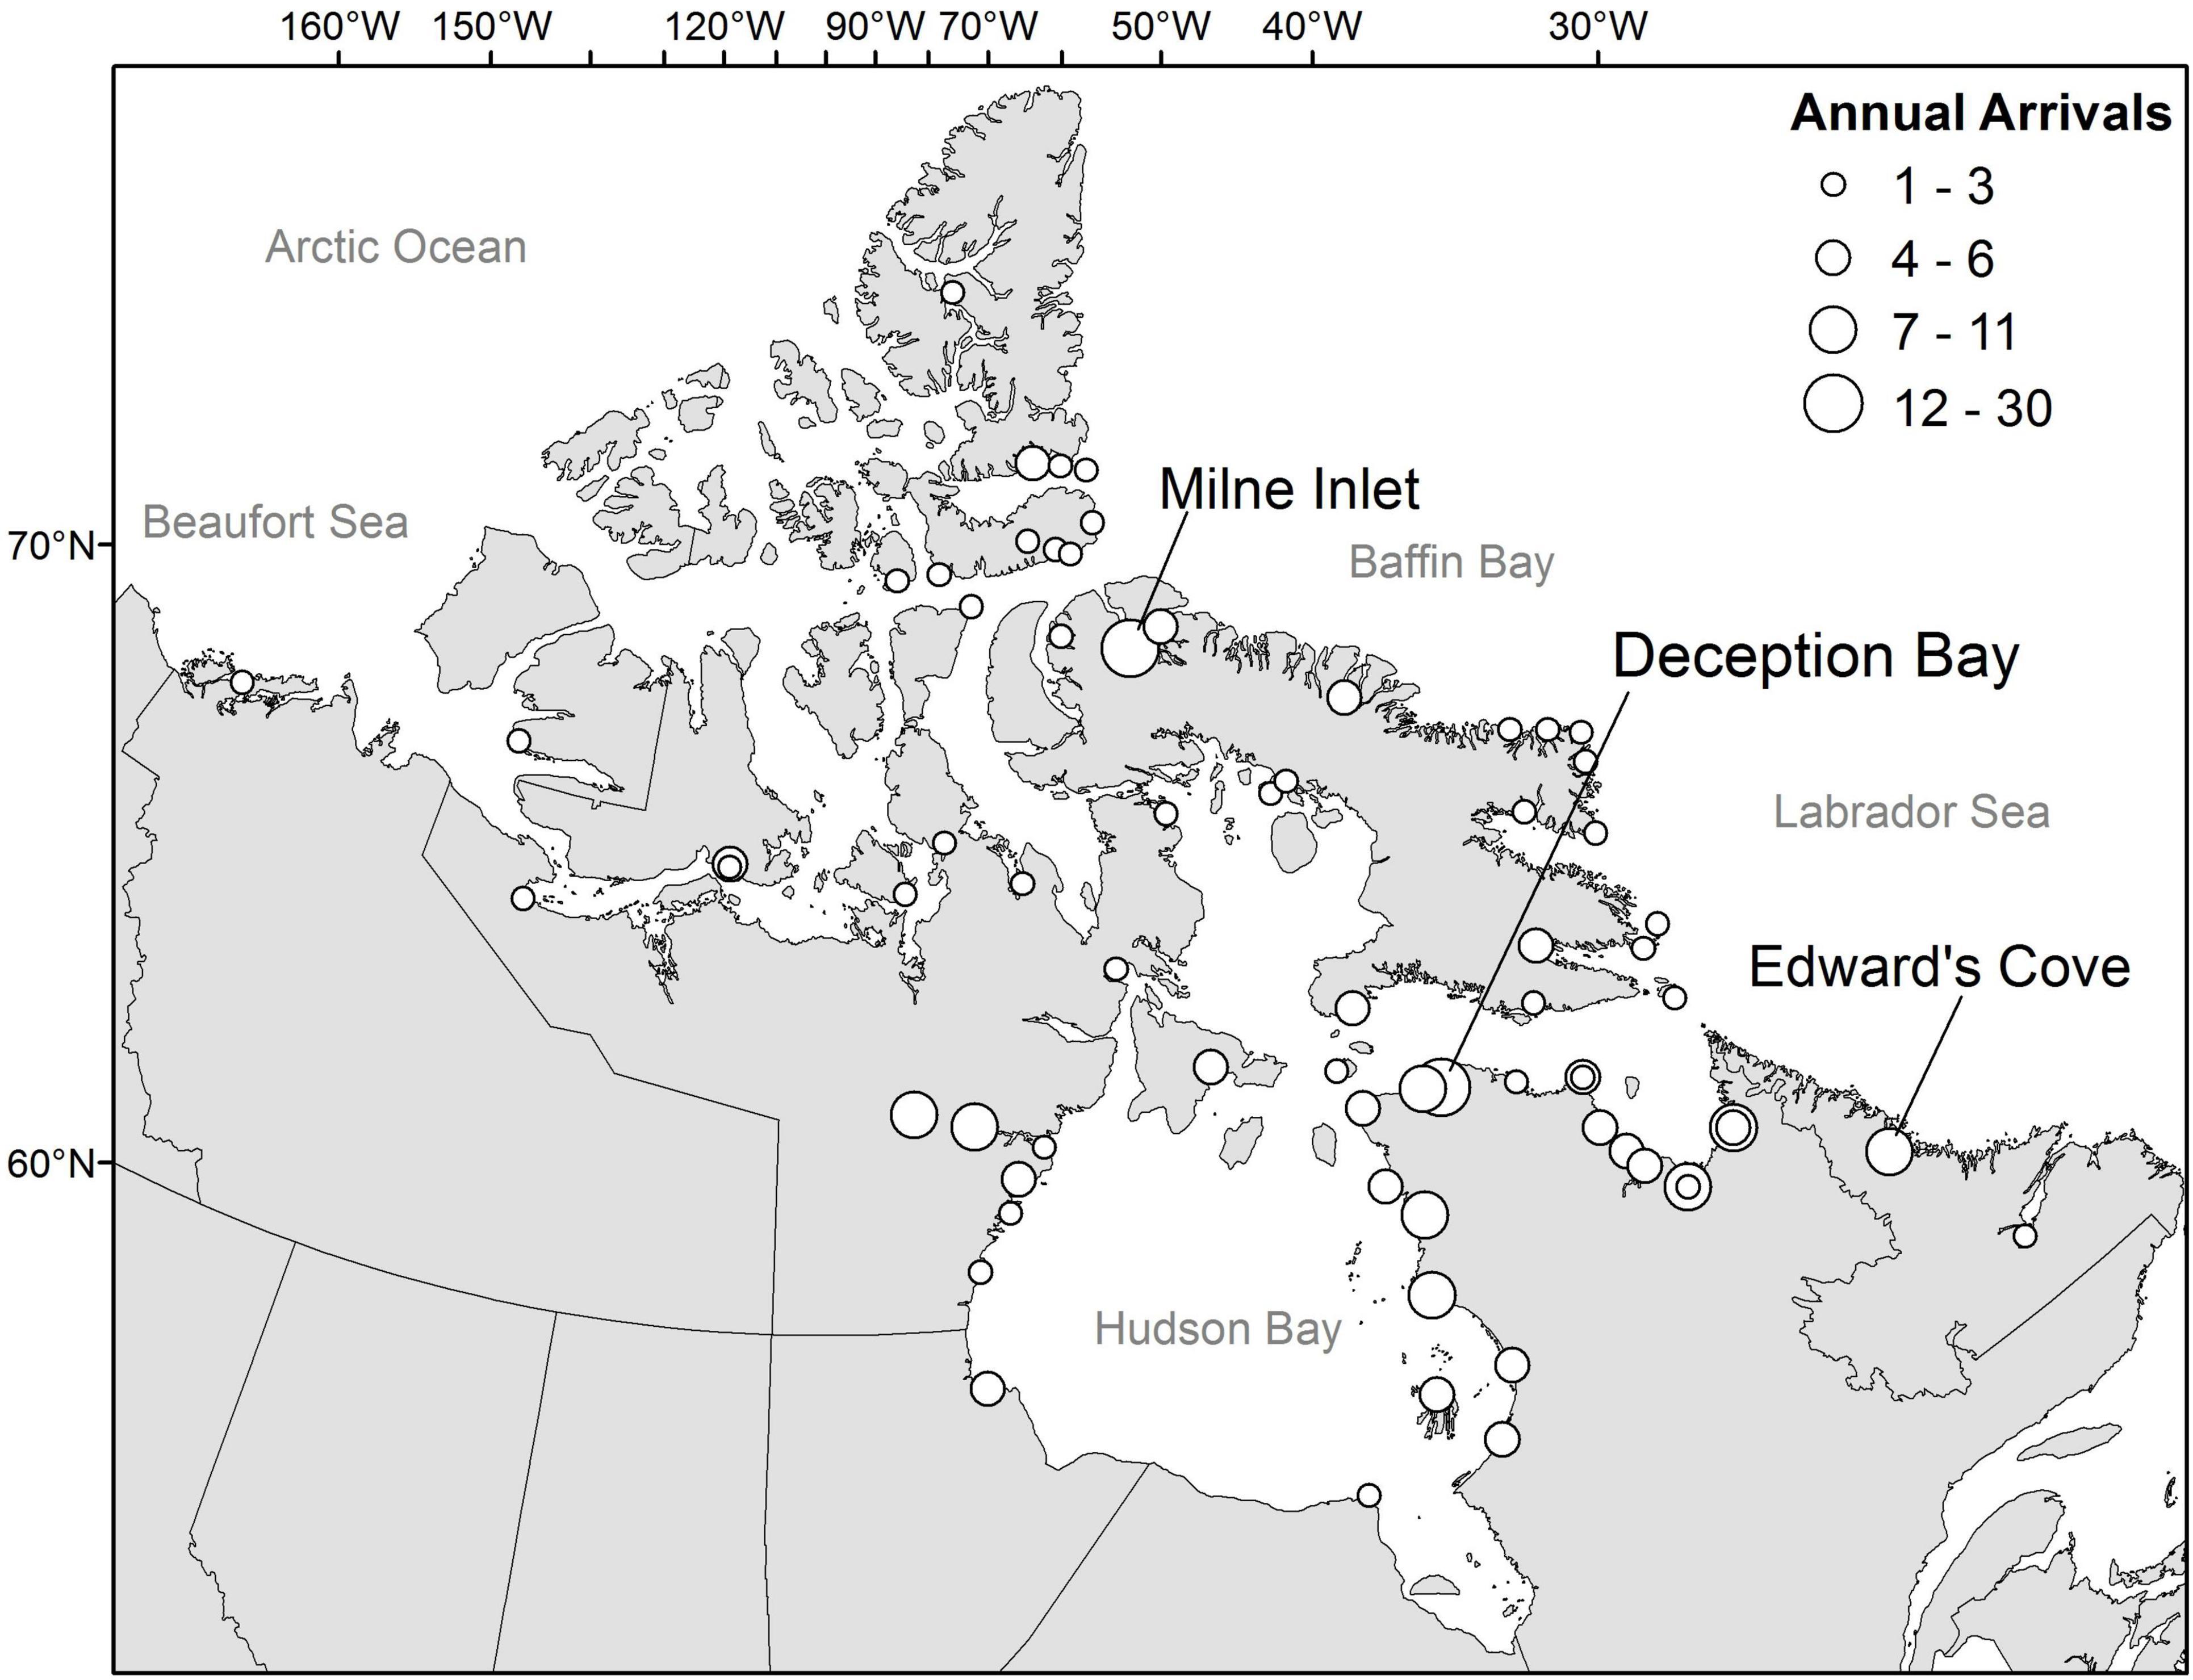
Figure 1. Number of annual arrivals at 73 Canadian Arctic ports during 2015–2016, based on data collected from the questionnaire survey. The three most visited ports by respondent ships were Deception Bay, QC, Milne Inlet, NU, and Edward’s Cove, NL.
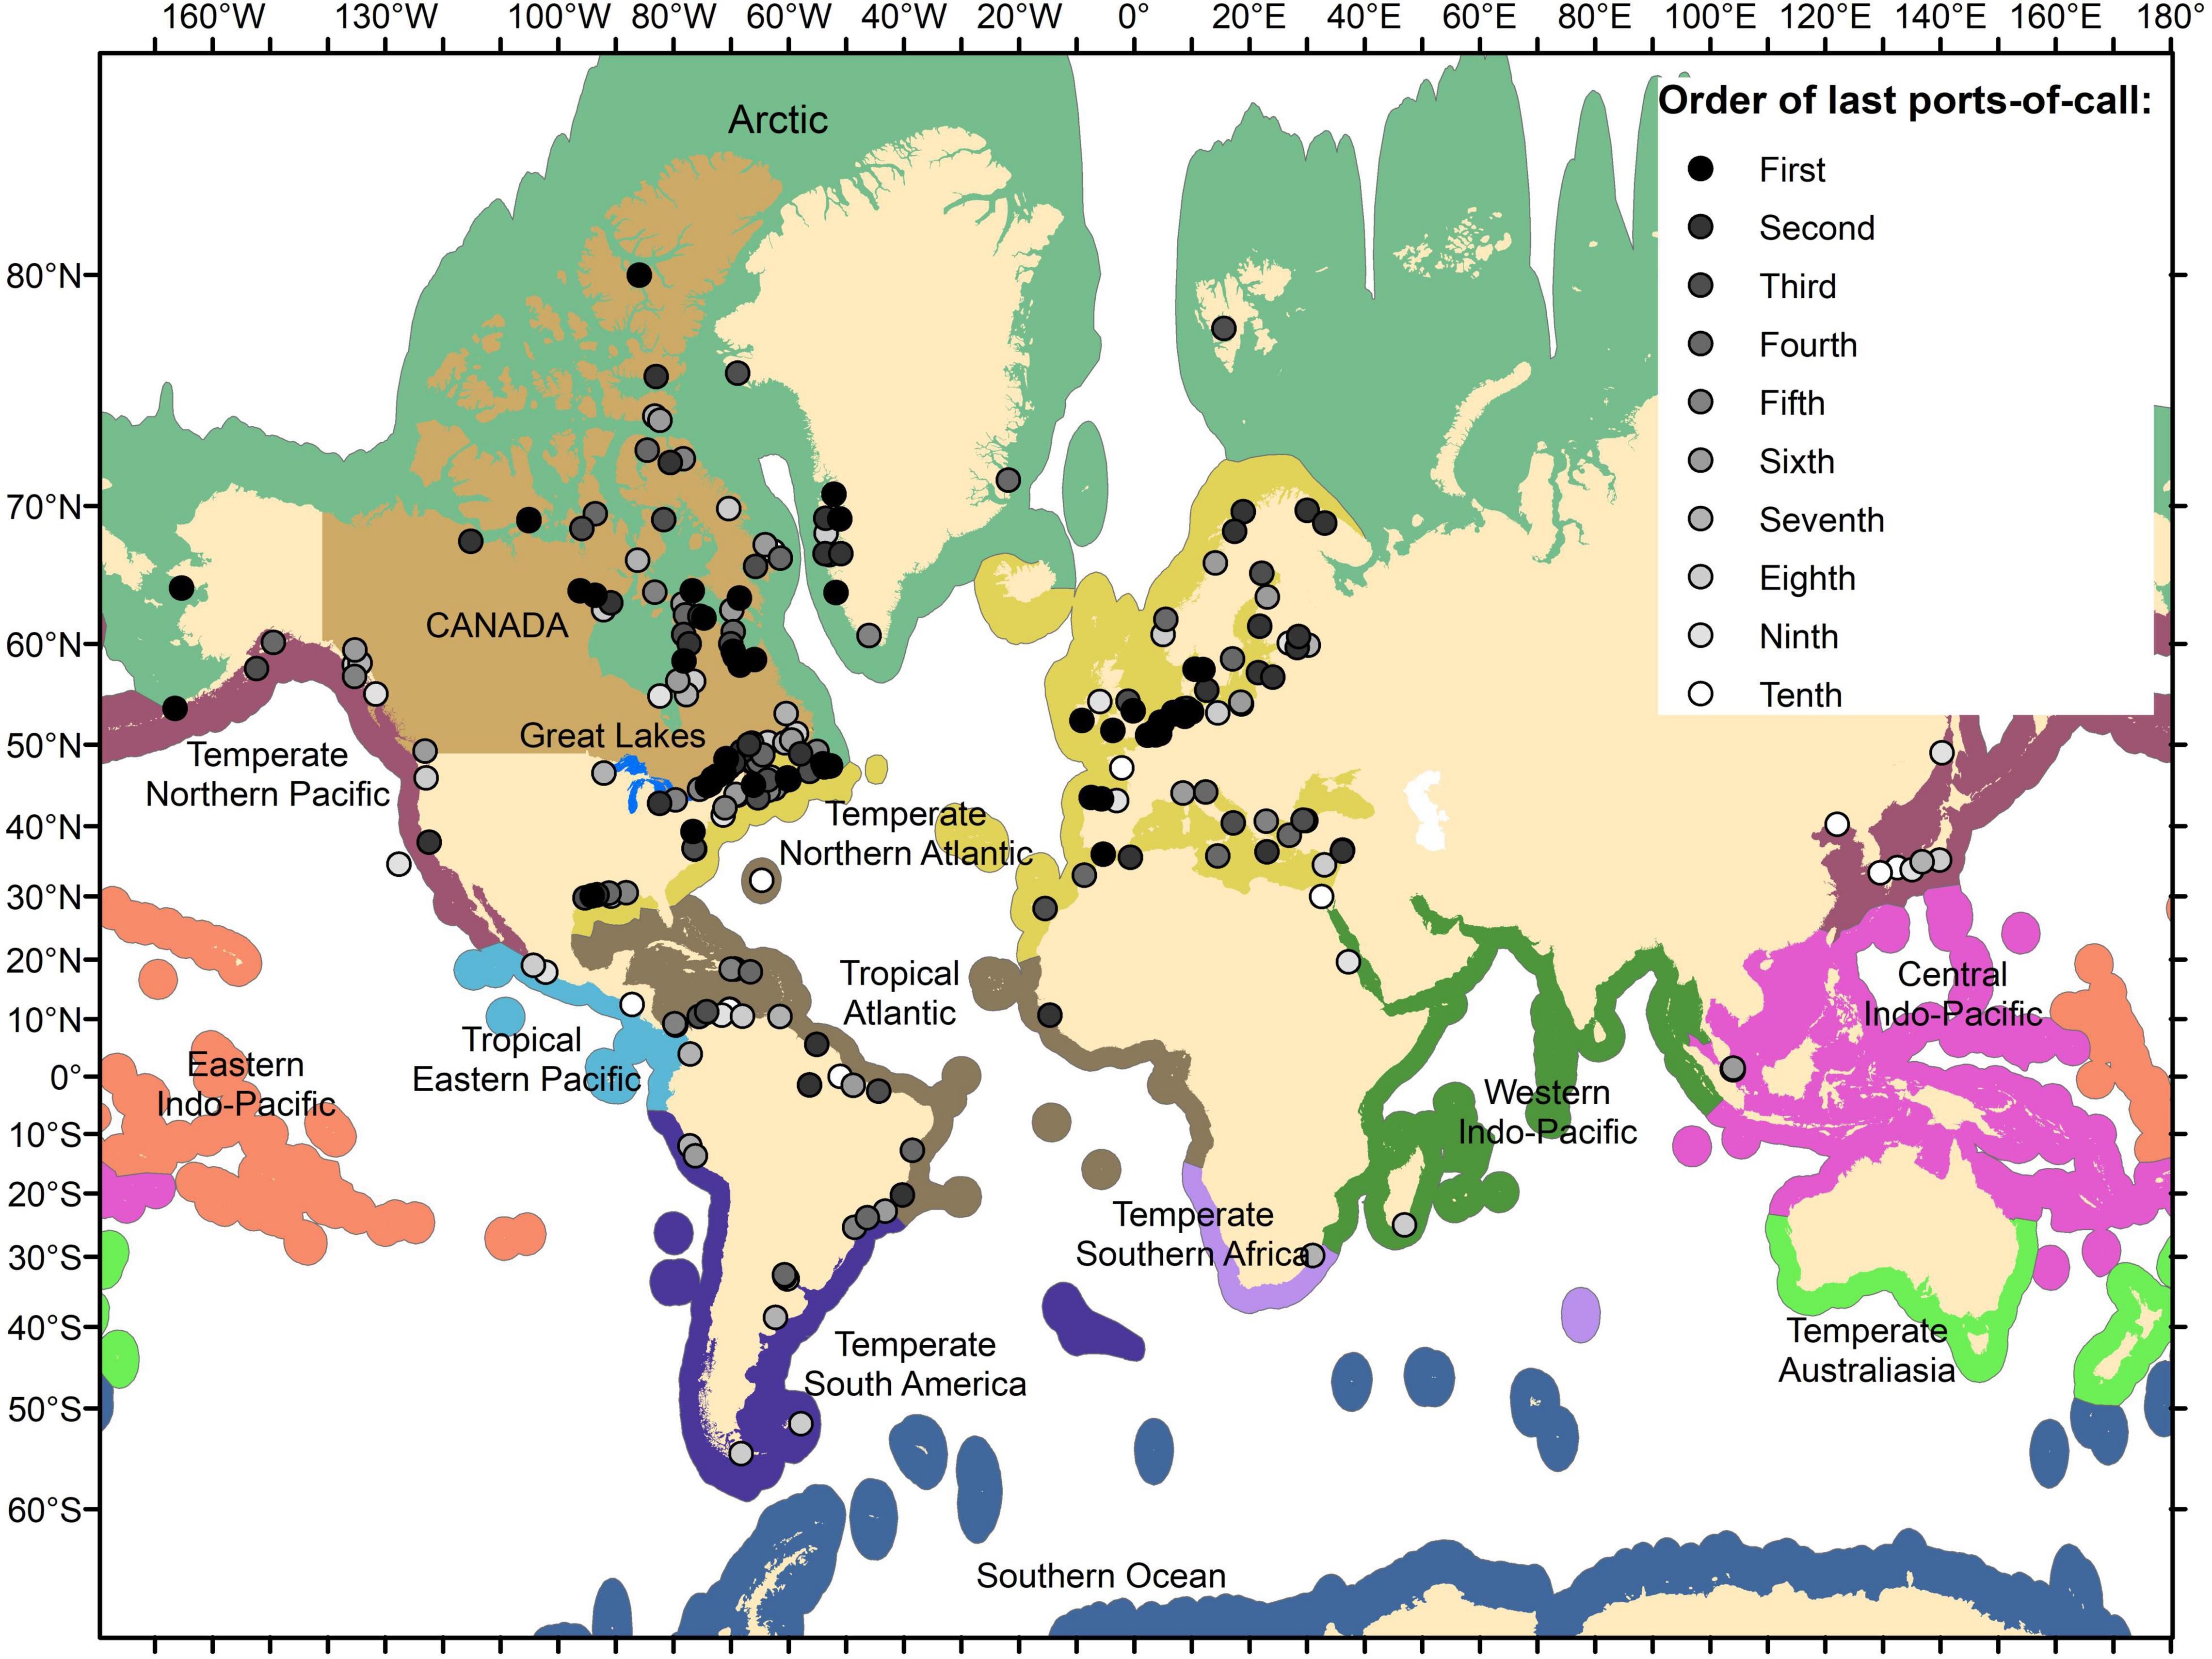
Figure 2. Ports-of-call visited by respondent ships during the last 10 voyages preceding arrival at a Canadian Arctic port during 2015 and 2016, based on data collected from the questionnaire survey. The shade of the circle markers indicates the sequence of stops made by ships from the first - (most recent) last ports to the tenth-last ports. The Marine Ecoregions of the World biogeographic realms (and Laurentian Great Lakes) are shown as different colors in the map.
Regression Tree Analyses
Regression tree analysis indicates that the age of the antifouling coating system was the only measured predictor for percent cover of biofouling on commercial ships in Canada (R2 = 33.0%). Ships tended to have a higher percent cover of biofouling (mean 9.3% cover) when the antifouling coating system was older than 630 days (hereafter referred to as the percent cover model; Figure 3A). The mean absolute error and root mean square error for the percent cover model were 5.4 and 6.6, respectively. Age of antifouling coating system was also the only measured predictor for the total abundance of fouling invertebrates (R2 = 19.1%). Ships were more likely to have a higher total abundance of fouling invertebrates (mean 103.8256 -1 or 6,692 individuals) when the antifouling coating system was older than 354 days (hereafter referred to as the abundance model; Figure 3B). For the abundance model, the mean absolute error was 1.8 and the root-mean-square error was 2.3 (note that these values are logarithmically transformed). The number of biogeographic realms visited and port residence time were predictors for the richness of fouling species on ships (R2 = 15.5%). Ships that visited at least three biogeographic realms or had port residence times ≥ 20 days tended to have higher fouling species richness (mean 42 taxa and mean 30 taxa, respectively; hereafter referred to as the species richness model; Figure 3C). The mean absolute error and root mean square error for the species richness model were 28.8 and 36.2, respectively.
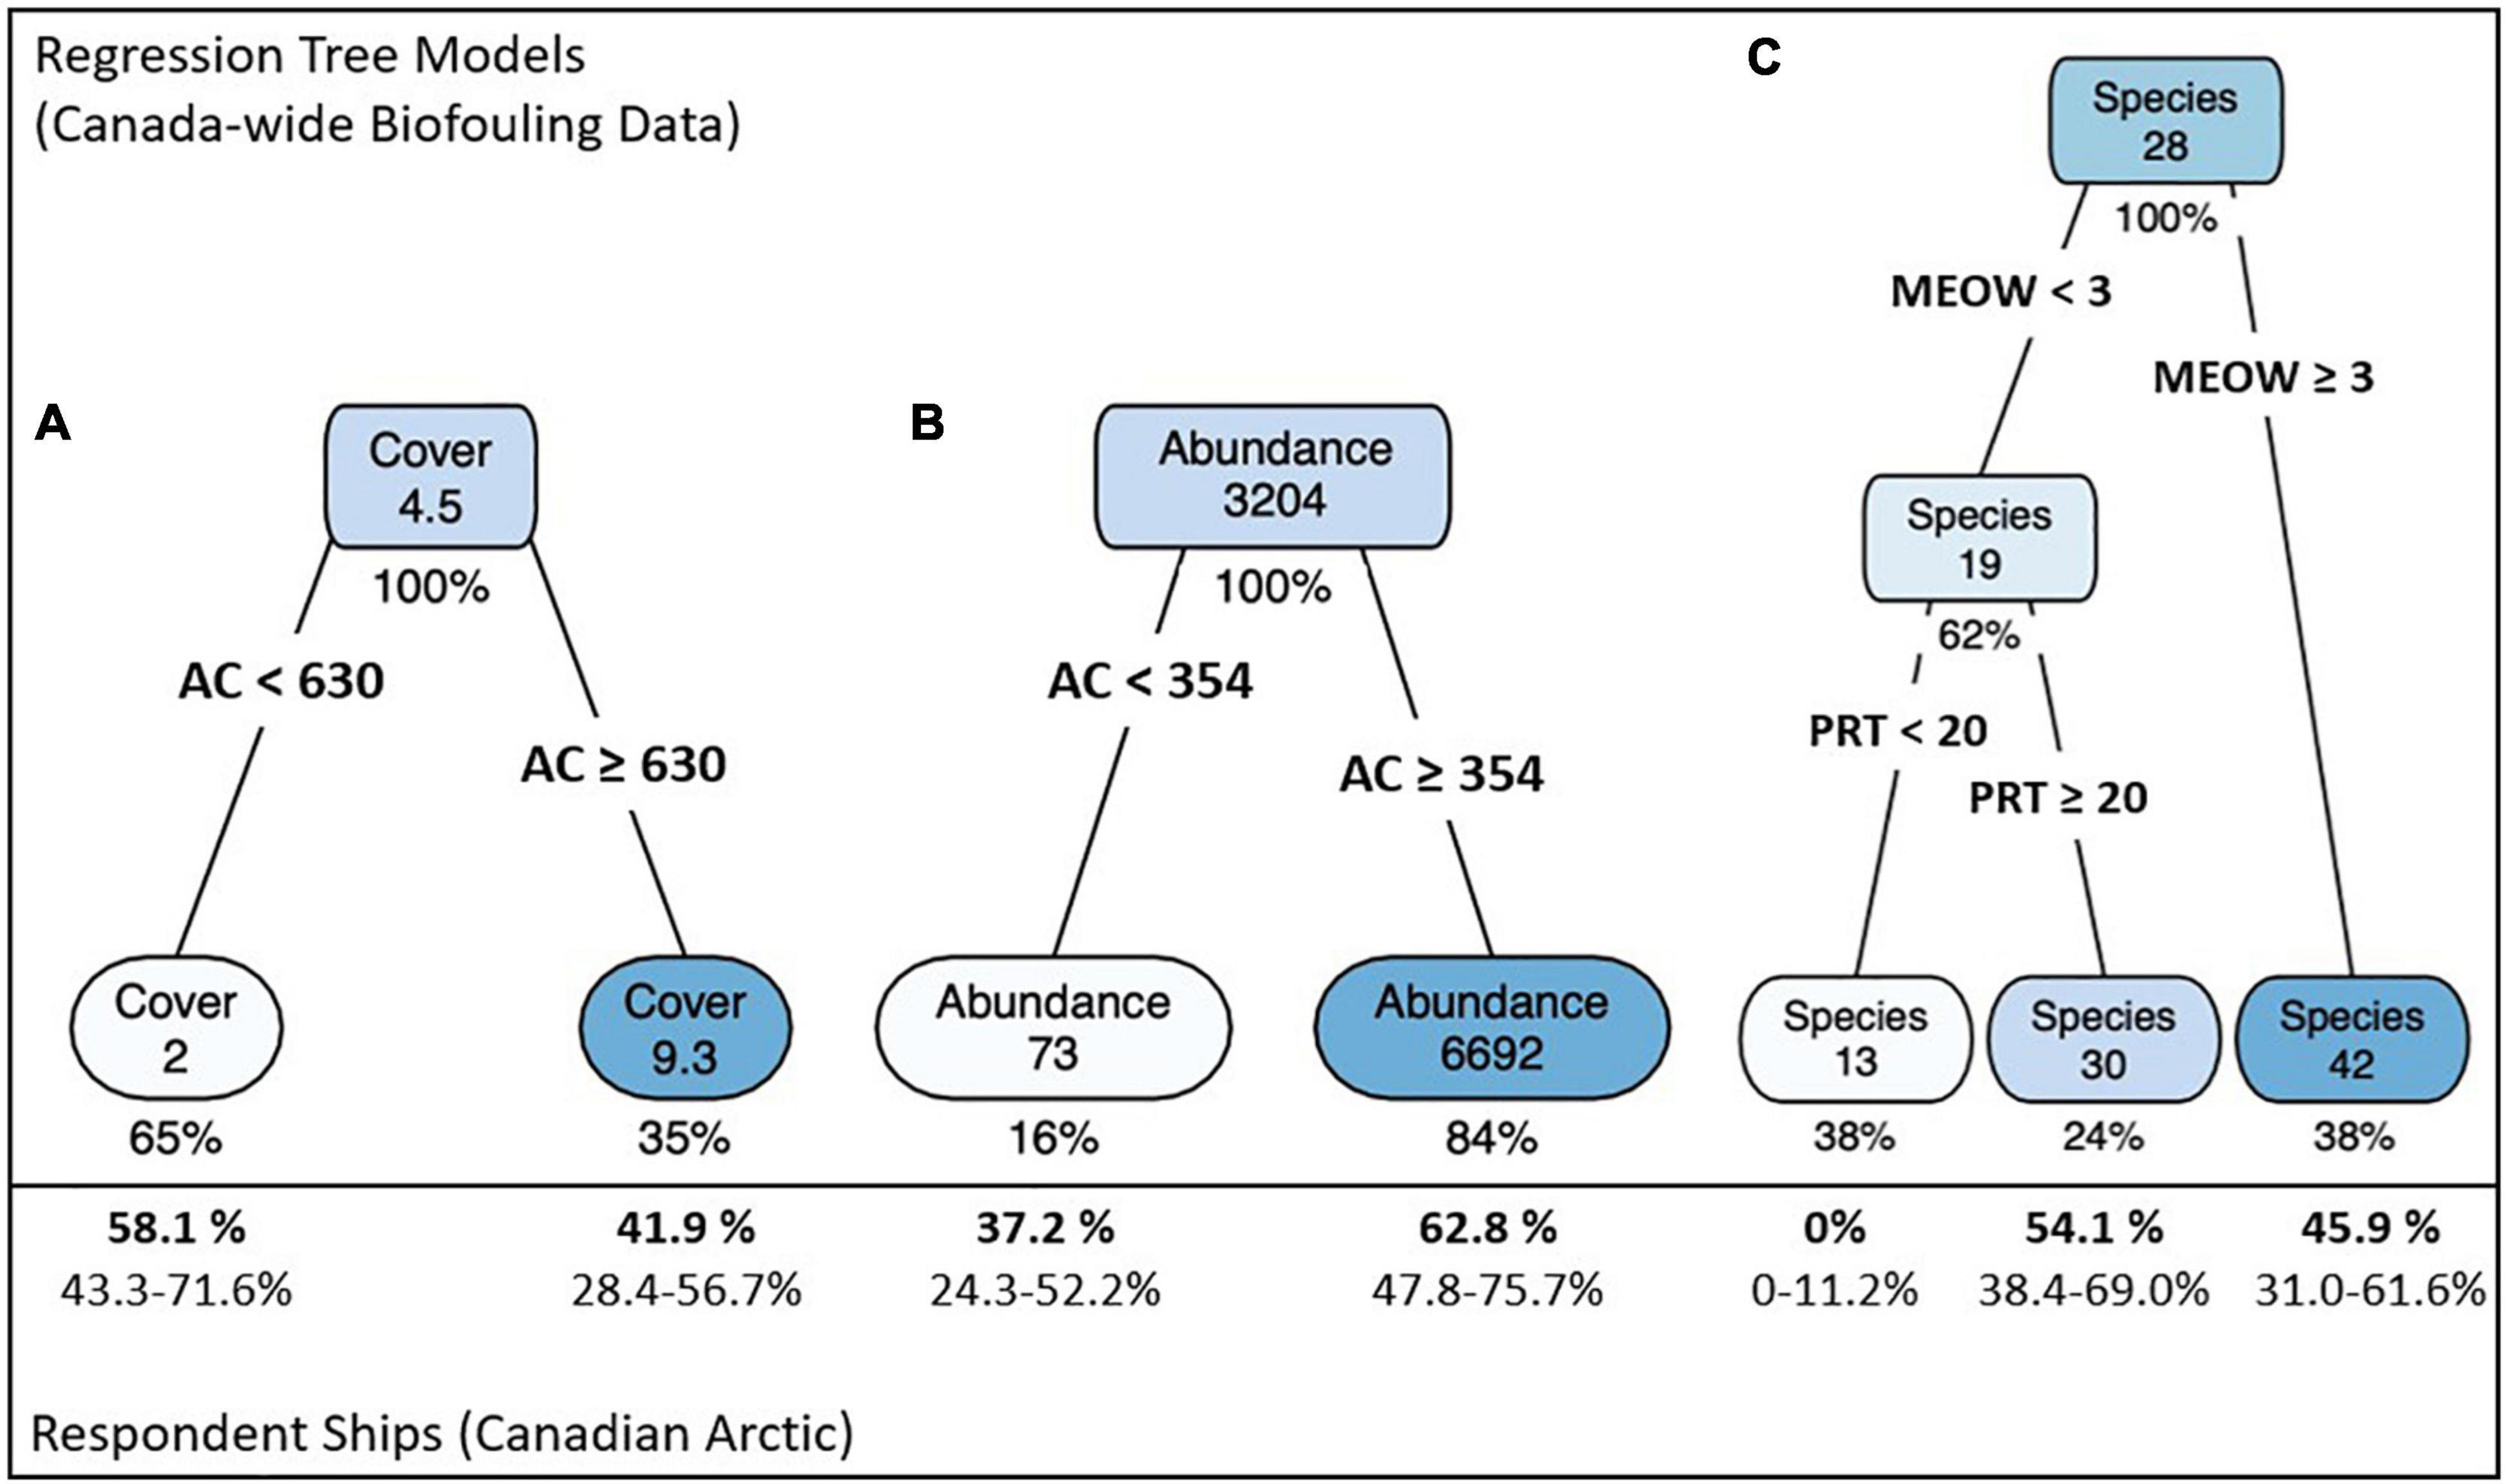
Figure 3. Regression trees for predicting the percent cover of biofouling (A), total abundance of fouling invertebrates [log 10 (x + 1) transformed] (B), and fouling species richness (C) on commercial ships, based on 53 commercial ships arriving at Halifax, NS, Vancouver, BC, and Churchill, MB. The measured predictors of biofouling extent were age (days) of antifouling coating system (AC), total port residence time over the last 10 ports-of-call (PRT), and number of Marine Ecoregions of the World biogeographic realms (MEOW) visited over the last 10 ports-of-call. The proportion of respondent Canadian Arctic ships that fall under each terminal node of the regression tree models, based on questionnaire data, are shown in the lower box in bold, with 95% Agresti-Coull binomial confidence intervals.
Comparison of the relevant travel history features reported by ships via the questionnaire to the regression tree models provides insight on the biofouling extent of ships visiting the Canadian Arctic during 2015 and 2016. A large proportion of respondent ships (41.9% of 43 ships) had antifouling coating systems older than 630 days and are therefore inferred to have relatively high (> 9.3%) percent cover of biofouling according to the percent cover model (95% CIs: 28.4–56.7% of ships; Figure 3A). In contrast, self-reported estimates of percent cover of biofouling from 32 ships indicated that only 6.3% of them had > 9.3% biofouling cover. More than half of respondent ships (62.8% of 43 ships) had antifouling coating systems older than 354 days and are therefore inferred to have a relatively high total abundance of fouling invertebrates (> 6,692 individuals) according to the abundance model (95% CIs: 47.8–75.7% of ships; Figure 3B). Nearly half of respondent ships (45.9% of 37 ships) had visited at least three biogeographic realms during their last 10 ports-of-call, and are therefore inferred to have relatively high fouling species richness (mean 42 taxa) according to the species richness model (95% CIs: 31.0–61.6% of ships), while the remaining respondent ships had port residence times longer than 20 days and are inferred to have medium fouling species richness (mean 30 taxa; 95% CIs: 38.4–69.0% of ships; Figure 3C).
Discussion
Our tree-based models of biofouling extent (coverage, abundance, and richness) suggest that ships are an active vector for the transportation of non-indigenous aquatic species to Canadian Arctic coastal ecosystems via biofouling. The probability of introducing non-indigenous species to the Canadian Arctic via biofouling is expected to be higher at ports that receive greater numbers of ship arrivals, such as Milne Inlet, Deception Bay, and Edward’s Cove (see also Chan et al., 2013; Goldsmit et al., 2019).
Mapping of the last 10 ports-of-call prior to visiting the Canadian Arctic reveals that the region is highly connected to the rest of the world via shipping activity. As fouling species accumulate on ship wetted surfaces over time, any of these ports (and ports beyond the last 10 ports-of-call) could be sources of fouling species if they survive transit to the Arctic. Repeated measures of fouling communities on ships traveling to and from the Canadian Arctic have demonstrated the potential for fouling species to survive transits from temperate to Arctic ports (Chan et al., 2016). Additionally, Canadian Arctic ports are connected to numerous ports in regions (e.g., Arctic, Temperate Northern Atlantic, and Temperate Northern Pacific) that have similar environmental conditions (Chan et al., 2012). Biofouling organisms originating from these ports would have higher probability of survival if introduced to Canadian Arctic ports, especially for Arctic ports that have relatively milder environmental conditions, such as those in Hudson Bay (Chan et al., 2012; Goldsmit et al., 2020, 2021).
The questionnaire also provided insight into the antifouling practices of ships operating in the Canadian Arctic. At least four respondent ships did not have any antifouling system installed; this value may be an underestimation as some respondent ships did not provide information on their antifouling systems, and those that did may not be representative of the population of vessels (i.e., those willing to respond to a voluntary questionnaire may exhibit different management behaviors than those that did not respond). While the questionnaire survey was an inexpensive method to collect general data from a relatively large number of ships, this study demonstrates that self-reported estimates of percent cover of biofouling are unreliable since they were typically much lower in comparison to the regression tree analysis. Therefore, self-reported estimates should not be considered as reliable proxies for direct measurements of biofouling. Furthermore, even for the collection of factual data on operational profile and antifouling management practices, many ships submitted incomplete surveys, and some ships that submitted multiple surveys provided different information on each survey. The reliability and degree of questionnaire survey completion could be improved if ships used a vessel-specific biofouling management plan and biofouling record book to standardize and organize information on biofouling management measures undertaken on the ship (IMO, 2011; Scianni et al., 2021). In addition, the level of biofouling could be more accurately estimated with regular underwater inspections specific to this purpose (e.g., Georgiades and Kluza, 2020).
The tree-based models indicate that age of antifouling coating system, among a suite of variables known to influence biofouling extent on ships, was the only significant predictor of percent cover of biofouling and total abundance of invertebrates on commercial ships operating in Canada (i.e., including any additional variables did not improve the model). For richness of fouling species on ships, the number of biogeographic realms visited and port residence time were identified as significant predictors. Other variables known to influence biofouling, such as sailing speed (Coutts et al., 2010; Arndt et al., 2021), were not significant predictors of biofouling in the present study. However, caution must be taken when interpreting these model results since they have relatively low predictive power, explaining only 15–33% of the variance in biofouling extent. This indicates that the sample size was too low to elucidate relationships among the numerous variables known to influence biofouling or that there could be additional variables, not measured here, that are important determinants of biofouling extent. For example, the quality of the application of antifouling coating systems varies based on price, experience, and condition of shipyards (e.g., preparation of hull surface), potentially affecting the performance of antifouling coating systems at preventing the accumulation of fouling organisms (Swain et al., 2007). Furthermore, the optimal antifouling coating system varies among ships based on their operational conditions (e.g., sailing speed, time at sea/port, and water conditions; Yebra et al., 2004; Swain et al., 2007). Thus, there is the potential to install sub-optimal antifouling coating systems on ships, which would reduce their efficacy (Swain et al., 2007). In addition, the number, size, and configuration of niche areas on ships can influence the accumulation of fouling organisms (Arndt et al., 2021), but these were not examined in the present study.
This study demonstrates that commercial ships are arriving to the Canadian Arctic after visiting a diverse array of global ports. As a relatively large proportion of these ships also have antifouling coating systems at least 630 days old (or none at all), the potential risk for the introduction of non-indigenous species is evident. Determining the actual introduction probability attributed to biofouling would require understanding the number of propagules released from ships’ wetted surfaces, their survivorship in recipient Arctic environments, and the relationship between propagule pressure and probability of establishment. Despite being costly and resource-intensive, additional underwater biofouling assessments are warranted to better understand changes in trade patterns, developments in antifouling technologies, and other biofouling management practices. Larger, region-specific biofouling datasets, combined with paired survey information (i.e., operational profile and antifouling practices), are essential to improve training, testing, and ground-truthing of predictive models such as those used in this study.
Data Availability Statement
The original contributions presented in this study are publicly available at https://doi.org/10.5061/dryad.5x69p8d4q and https://doi.org/10.5061/dryad.hdr7sqvkb.
Ethics Statement
Ethical review and approval were not required for the questionnaire portion of this study in accordance with local legislation and institutional requirements, as the individuals responding to the questionnaire were not themselves the focus of the research.
Author Contributions
FTC designed the study and led data collection and analysis under the direction of SAB. DO and SAB led the drafting and revision of the manuscript. All authors contributed to writing the manuscript and approved the final version.
Funding
This study was funded by Fisheries and Oceans Canada and Transport Canada (Climate Change Adaptation and Planning). The NSERC Canadian Aquatic Invasive Species Network supported the initial collection of biofouling data used in this study.
Conflict of Interest
The authors declare that the research was conducted in the absence of any commercial or financial relationships that could be construed as a potential conflict of interest.
Publisher’s Note
All claims expressed in this article are solely those of the authors and do not necessarily represent those of their affiliated organizations, or those of the publisher, the editors and the reviewers. Any product that may be evaluated in this article, or claim that may be made by its manufacturer, is not guaranteed or endorsed by the publisher.
Acknowledgments
We thank Jean Pierre Lehnert (Canadian Coast Guard), Tim Keane (FedNav Arctic Operations), Daniel Côté (Transport Desgagnés), and the Shipping Federation of Canada for assistance with the design and distribution of the questionnaire survey and the shipping companies and crews that participated in this research. We also thank the reviewers and the handling editor for their valuable comments on the manuscript.
Supplementary Material
The Supplementary Material for this article can be found online at: https://www.frontiersin.org/articles/10.3389/fmars.2022.808055/full#supplementary-material
References
Arndt, E., Robinson, A., and Hester, S. (2021). Factors That Influence Vessel Biofouling and its Prevention and Management. Final Report for CEBRA Project 190803. Melbourne, VIC: Centre of Excellence for Biosecurity Risk Analysis (CEBRA), vii + 98.
Bailey, S. A., Brown, L., Campbell, M. L., Canning-Clode, J., Carlton, J. T., Castro, N., et al. (2020). Trends in the detection of aquatic nonindigenous species across global marine, estuarine and freshwater ecosystems: a 50-year perspective. Divers. Distrib. 26, 1780–1797.
Chan, F. T., Bailey, S. A., Wiley, C. J., and MacIsaac, H. J. (2013). Relative risk assessment for ballast-mediated invasions at Canadian Arctic ports. Biol. Invasions 15, 295–308. doi: 10.1007/s10530-012-0284-z
Chan, F. T., Bronnenhuber, J. E., Bradie, J. N., Howland, K., Simard, N., and Bailey, S. A. (2012). Risk Assessment for Ship-Mediated Introductions of Aquatic Non-Indigenous Species to the Canadian Arctic. DFO Can. Sci. Advis. Sec. Res. Doc. 2011/105. Burlington, ON: Fisheries and Oceans Canada, vi + 93.
Chan, F. T., MacIsaac, H. J., and Bailey, S. A. (2015). Relative importance of vessel hull fouling and ballast water as transport vectors of nonindigenous species to the Canadian Arctic. Can. J. Fish. Aquat. Sci. 72, 1230–1242.
Chan, F. T., MacIsaac, H. J., and Bailey, S. A. (2016). Survival of ship biofouling assemblages during and after voyages to the Canadian Arctic. Mar. Biol. 163:250. doi: 10.1007/s00227-016-3029-1
Chan, F. T., Stanislawczyk, K., Sneekes, A. C., Dvoretsky, A., Gollasch, S., Minchin, D., et al. (2019). Climate change opens new frontiers for marine species in the Arctic: current trends and future invasion risks. Glob. Change Biol. 25, 25–38. doi: 10.1111/gcb.14469
Coutts, A. D. M., and Dodgshun, T. J. (2007). The nature and extent of organisms in vessel sea chests: a protected mechanism for marine bioinvasions. Mar. Pollut. Bull. 54, 875–886. doi: 10.1016/j.marpolbul.2007.03.011
Coutts, A. D. M., and Taylor, M. D. (2004). A preliminary investigation of biosecurity risks associated with biofouling on merchant vessels in New Zealand. N. Z. J. Mar. Freshw. Res. 38, 215–229.
Coutts, A. D. M., Piola, R. F., Hewitt, C. L., Connell, S. D., and Gardner, J. P. (2010). Effect of vessel voyage speed on survival of biofouling organisms: implications for translocation of nonindigenous marine species. Biofouling 26, 1–13. doi: 10.1080/08927010903174599
Dafforn, K. A., Lewis, J. A., and Johnston, E. L. (2011). Antifouling strategies: history and regulation, ecological impacts and mitigation. Mar. Pollut. Bull. 62, 453–465. doi: 10.1016/j.marpolbul.2011.01.012
Davidson, I. C., Brown, C. W., Sytsma, M. D., and Ruiz, G. M. (2009). The role of containerships as transfer mechanisms of marine biofouling species. Biofouling 25, 645–655. doi: 10.1080/08927010903046268
Davidson, I. C., Smith, G., Ashton, G. V., Ruiz, G. M., and Scianni, C. (2020). An experimental test of stationary lay-up periods and simulated transit on biofouling accumulation and transfer on ships. Biofouling 36, 455–466. doi: 10.1080/08927014.2020.1769612
Dawson, J., Pizzolato, L., Howell, S. E., Copland, L., and Johnston, M. E. (2018). Temporal and spatial patterns of ship traffic in the Canadian Arctic from 1990 to 2015. Arctic 71, 15–26.
Frey, M., Simard, N., Robichaud, D., Martin, J., and Therriault, T. (2014). Fouling around: vessel sea chests as a vector for the introduction and spread of aquatic invasive species. Manag. Biol. Invasions 5, 21–30. doi: 10.3391/mbi.2014.5.1.02
Georgiades, E., and Kluza, D. (2020). Conduct of In-Water Biofouling Surveys for Domestic Vessels. Biosecurity New Zealand Technical Paper No: 2020/04. Wellington: Ministry for Primary Industries of New Zealand, i + 38.
Goldsmit, J., Mckindsey, C. W., Archambault, P., and Howland, K. L. (2019). Ecological risk assessment of predicted marine invasions in the Canadian Arctic. PLoS One 14:e0211815. doi: 10.1371/journal.pone.0211815
Goldsmit, J., Mckindsey, C. W., Schlegel, R. W., Stewart, D. B., Archambault, P., and Howland, K. L. (2020). What and where? Predicting invasion hotspots in the Arctic marine realm. Glob. Change Biol. 26, 4752–4771. doi: 10.1111/gcb.15159
Goldsmit, J., McKindsey, C. W., Stewart, D. B., and Howland, K. L. (2021). Screening for high-risk marine invaders in the Hudson Bay region, Canadian Arctic. Front. Ecol. Evol. 9:627497. doi: 10.3389/fevo.2021.627497
Grandison, C., Piola, R., and Fletcher, L. (2011). A Review of Marine Growth Protection System Options for the Royal Australian Navy. Australian Government, Department of Defence, Defence Science and Technology Organization: Melbourne, VIC, 1–28.
Hakim, M. L., Nugroho, B., Nurrohman, M. N., Suastika, I. K., and Utama, I. K. (2019). Investigation of fuel consumption on an operating ship due to biofouling growth and quality of antifouling coating. IOP Conf. Ser. Earth Environ. Sci. 339:012037. doi: 10.1088/1755-1315/339/1/012037
Hewitt, C. L., Gollasch, S., and Minchin, D. (2009). “The vessel as a vector – biofouling, ballast water and sediments,” in Biological Invasions in Marine Ecosystems Ecological, Management, and Geographic Perspectives, eds G. Rilov and J. A. Crooks (Berlin: Springer-Verlag), 117–131.
IMO (2011). 2011 Guidelines for the Control and Management of Ships’ Biofouling to Minimize the Transfer of Invasive Aquatic Species. MEPC 62/24/1. London: International Maritime Organization (IMO), Marine Environment Protection Committee.
Lo, V. B., Levings, C. D., and Chan, K. M. (2012). Quantifying potential propagule pressure of aquatic invasive species from the commercial shipping industry in Canada. Mar. Pollut. Bull. 64, 295–302. doi: 10.1016/j.marpolbul.2011.11.016
Melia, N., Haines, K., and Hawkins, E. (2016). Sea ice decline and 21st century trans-Arctic shipping routes. Geophys. Res. Lett. 43, 9720–9728. doi: 10.1002/2016gl069315
Miller, A. W., and Ruiz, G. M. (2014). Arctic shipping and marine invaders. Nat. Clim. Change 4, 413–416.
Miller, A. W., Davidson, I. C., Minton, M. S., Steves, B., Moser, C. S., Drake, L. A., et al. (2018). Evaluation of wetted surface area of commercial ships as biofouling habitat flux to the United States. Biol. Invasions 20, 1977–1990.
Moser, C. S., Wier, T. P., First, M. R., Grant, J. F., Riley, S. C., Robbins-Wamsley, S. H., et al. (2017). Quantifying the extent of niche areas in the global fleet of commercial ships: the potential for “super-hot spots” of biofouling. Biol. Invasions 19, 1745–1759. doi: 10.1007/s10530-017-1386-4
Moser, C. S., Wier, T. P., Grant, J. F., First, M. R., Tamburri, M. N., Ruiz, G. M., et al. (2016). Quantifying the total wetted surface area of the world fleet: a first step in determining the potential extent of ships’ biofouling. Biol. Invasions 18, 265–277. doi: 10.1007/s10530-015-1007-z
Pizzolato, L., Howell, S. E., Dawson, J., Laliberté, F., and Copland, L. (2016). The influence of declining sea ice on shipping activity in the Canadian Arctic. Geophys. Res. Lett. 43, 12146–12154.
Ricciardi, A., Blackburn, T. M., Carlton, J. T., Dick, J. T. A., Hulme, P. E., Iacarella, J. C., et al. (2017). Invasion science: a horizon scan of emerging challenges and opportunities. Trends Ecol. Evol. 32, 464–474. doi: 10.1016/j.tree.2017.03.007
Schultz, M. P., Bendick, J. A., Holm, E. R., and Hertel, W. M. (2010). Economic impact of biofouling on a naval surface ship. Biofouling 27, 87–98. doi: 10.1080/08927014.2010.542809
Scianni, C., Lubarsky, K., Ceballos-Osuna, L., and Bates, T. (2021). Yes, we CANZ: initial compliance and lessons learned from regulating vessel biofouling management in California and New Zealand. Manag. Biol. Invasions 12, 727–746. doi: 10.3391/mbi.2021.12.3.14
Sharma, S., Legendre, P., Boisclair, D., and Gauthier, S. (2012). Effects of spatial scale and choice of statistical model (linear versus tree-based) on determining species-habitat relationships. Can. J. Fish. Aquat. Sci. 69, 2095–2111.
Spalding, M. D., Fox, H. E., Allen, G. R., Davidson, N., Ferdaña, Z. A., Finlayson, M., et al. (2007). Marine ecoregions of the world: a bioregionalization of coastal and shelf areas. BioScience 57, 573–583. doi: 10.1111/cla.12453
Swain, G. W., Kovach, B., Touzot, A., Casse, F., and Kavanagh, C. J. (2007). Measuring the performance of today’s antifouling coatings. J. Ship Prod. Des. 23, 164–170.
Sylvester, F., and MacIsaac, H. J. (2010). Is vessel hull fouling an invasion threat to the Great Lakes? Divers. Distrib. 16, 132–143. doi: 10.1111/j.1472-4642.2009.00622.x
Sylvester, F., Kalaci, O., Leung, B., Lacoursière-Roussel, A., Murray, C. C., Choi, F. M., et al. (2011). Hull fouling as an invasion vector: can simple models explain a complex problem? J. Appl. Ecol. 48, 415–423. doi: 10.1111/j.1365-2664.2011.01957.x
Therneau, T., Atkinson, B., and Ripley, B. (2019). Recursive Partitioning and Regression Trees. R Package Version 4.1-15.
Ware, C., Berge, J., Sundet, J. H., Kirkpatrick, J. B., Coutts, A. D. M., Jelmert, A., et al. (2014). Climate change, nonindigenous species and shipping: assessing the risk of species introduction to a high-Arctic archipelago. Divers. Distrib. 20, 10–19.
Yebra, D. M., Kiil, S., and Dam-Johansen, K. (2004). Antifouling technology — past, present and future steps towards efficient and environmentally friendly antifouling coatings. Prog. Org. Coat. 50, 75–104. doi: 10.1016/j.porgcoat.2003.06.001
Keywords: Arctic, biofouling, biological invasions, hull fouling, invasive species, non-indigenous species, regression trees, shipping
Citation: Chan FT, Ogilvie D, Sylvester F and Bailey SA (2022) Ship Biofouling as a Vector for Non-indigenous Aquatic Species to Canadian Arctic Coastal Ecosystems: A Survey and Modeling-Based Assessment. Front. Mar. Sci. 9:808055. doi: 10.3389/fmars.2022.808055
Received: 02 November 2021; Accepted: 18 January 2022;
Published: 24 February 2022.
Edited by:
Eugene Georgiades, Ministry for Primary Industries, New ZealandReviewed by:
Christopher Scianni, California State Lands Commission, United StatesAndrew Robinson, The University of Melbourne, Australia
Daniel Kluza, Ministry for Primary Industries, New Zealand
Copyright © 2022 Chan, Ogilvie, Sylvester and Bailey. This is an open-access article distributed under the terms of the Creative Commons Attribution License (CC BY). The use, distribution or reproduction in other forums is permitted, provided the original author(s) and the copyright owner(s) are credited and that the original publication in this journal is cited, in accordance with accepted academic practice. No use, distribution or reproduction is permitted which does not comply with these terms.
*Correspondence: Sarah A. Bailey, c2FyYWguYmFpbGV5QGRmby1tcG8uZ2MuY2E=