 Kerrylee Rogers
 Atun Zawadzki2
 Neil Saintilan
94% of researchers rate our articles as excellent or good
Learn more about the work of our research integrity team to safeguard the quality of each article we publish.
Find out more
ORIGINAL RESEARCH article
Front. Mar. Sci. , 15 March 2022
Sec. Coastal Ocean Processes
Volume 9 - 2022 | https://doi.org/10.3389/fmars.2022.807588
This article is part of the Research Topic Coastal Biogeomorphology View all 20 articles
The fate of mangroves and saltmarshes under conditions of accelerating sea-level rise is dependent upon sedimentation and surface elevation gain that is sufficient to maintain substrate positions within a shifting tidal frame. This study focuses on coastal wetlands fringing Westernport Bay, a large tidal embayment of southeastern Australia where mangroves occupy lower tidal positions than saltmarshes. Estimates of vertical accretion, surface elevation change, and autocompaction derived from a 20-year record of observations were integrated with estimates of sedimentation at the decadal to century time-scale derived from 210Pb chronology to model the relationship between surface elevation gain and accommodation space at timescales relevant to management and decision-making. This model was validated against records of shoreline changes extracted from time-series aerial photography. Sedimentation and surface elevation gain vary spatially on the basis of available accommodation space and sediment supply, which are influenced by hydrodynamic conditions within the bay. Since sea-level rise increases available accommodation space, these relationships provided the means to project the outcome of accelerating sea-level rise on equilibrium accommodation space of mangroves and saltmarshes. Sea-level rise will generally deepen substrate positions within the tidal frame, creating conditions favorable for mangrove forests. Where sediment supply is high, maintenance (and some progradation) of mangrove shorelines may occur under projected low rates of sea-level rise; these conditions are limited to shorelines near sedimentary basins and where there is considerable lateral accommodation space. The same fate is not likely under a high sea-level rise scenario where shoreline retreat is projected in all settings. Given the limited accommodation space within saltmarshes at Westernport Bay, sedimentation will not be sufficient to maintain tidal positions and landward retreat will be critical for maintenance of saltmarsh biodiversity. This will require planning decisions to facilitate tidal incursions and conserve retreat pathways.
Saline coastal wetlands dominated by mangrove and saltmarsh occupy the intertidal zone and their lateral distribution is generally delimited by the landward extent of tidal inundation. Accumulation of mineral and organic material within substrates is facilitated by the low energy conditions that promote sediment deposition and the growth of halophytic vegetation; this material provides an important vertical subsidy when coastlines are exposed to relative sea-level rise (RSLR) (Woodroffe et al., 2016). Observational data indicates that coastal wetlands may be able to increase surface elevations under low to moderate rates of RSLR (Kirwan et al., 2016). However, there remains ongoing debate about the ability of coastal wetlands to adjust to the high rates of RSLR that are anticipated as eustatic SLR accelerates toward the end of the 21st century (Oppenheimer et al., 2019). Large spatial-scale analyses of paleoecological data indicate that mangroves can adapt to rates of RSLR of less than 7 mm year–1 (Saintilan et al., 2020). Similarly, saltmarshes in the United Kingdom have been found to adapt when rates of RSLR does not exceed 7 mm year–1 (Horton et al., 2018). Process based modeling indicates higher tolerance thresholds for saltmarshes, sometimes in excess of 10 mm year–1 when suspended sediment concentrations are high (Kirwan et al., 2016). These analyses of tolerance thresholds typically rely upon meta-data analyses of reported rates of vertical adjustment to improve confidence in estimates and, in doing so, treat site-scale measurements as data points that contribute to understanding of coastal wetland resilience at larger spatial scales. Local-scale data remains crucial for improving confidence in global- and regional-scale analyses. However, global-scale models are insufficient at the landscape scale where management and decision making require both accuracy and precision. Local-scale information is therefore a crucial data need that will improve both large-scale analyses and models, and local-scale management and decision-making.
At the landscape scale, there is general consensus that sedimentation of tidally-borne material is related to tidal inundation frequency and duration, with positions lower in the tidal frame accumulating sediment at a higher rate than locations higher in the tidal frame (Allen, 2000; Woodroffe et al., 2016). This spatial variation in sedimentation has a significant control on the long-term evolution of coastal wetlands. Under stable sea-level conditions, sedimentation is delimited by maximum tidal extents and is proportional to the depth below maximum tide level whilst surface elevations asymptote toward the height of maximum tide level (Rogers, 2021). RSLR alters the elevation of tidal planes over time; however, as sedimentation is proportional to tidal inundation (Rogers et al., 2005a) and position in the tidal frame, an incremental increase in sea level may result in a proportional increase in elevation adjustment, providing mineral sediment supply is not limited and organic matter addition to substrates is sufficient. This negative feedback, first described by Pethick (1981), leads to self-organization of surface elevations with the outcome being the development of broad floodplains at elevations that asymptote toward a depth below maximum tide level where surface elevation gain matches the rate of RSLR.
Based on these negative feedbacks, mathematical simulations indicate that the depth of this asymptote below maximum tide level is dependent upon the proportion of substrate volume adjustment to the degree of RSLR (Fagherazzi et al., 2012). Where the proportion of elevation adjustment to RSLR is high, achieved through the accumulation of mineral and organic material within substrates, coastal wetland surfaces will asymptote at a higher elevation in the tidal frame. Where sediment supply and/or organic matter addition becomes increasingly limited, surface elevations asymptote at lower elevations in the tidal frame. When rates of mineral and organic matter addition to substrates are very low, substrates may asymptote at elevations too low to support vegetation, negative feedbacks breakdown, and the system can shift toward a chaotic state where erosional processes may dominate. Hence, rates of surface elevation adjustment with respect to RSLR is critical information needed to gauge whether wetland substrates will maintain their position within the tidal frame, shift toward a lower elevation in the tidal frame, or undergo existential breakdown.
The timescale over which data should be collected to establish relationships between sedimentation and RSLR has been debated. Breithaupt et al. (2018) propose that short-term measurements at inter-annual increments, particularly those derived from observations of surface elevation change using techniques such as surface elevation tables and marker horizons (SET-MH), may indicate rates of surface elevation change that are highly influenced by perturbations operating over the observational period. This has been confirmed with trajectories of surface elevation change being related to droughts (Rogers et al., 2005b,2006), cyclones and hurricanes (Whelan et al., 2009; Osland et al., 2020; Yeates et al., 2020), groundwater availability (Rogers et al., 2005a; Whelan et al., 2005), and nutrient availability (Anisfeld and Hill, 2012; Reef et al., 2017). Irrespectively, analyses over shorter timescales provide useful information about processes influencing surface elevations, and, when collected over sufficient time, may provide reliable trajectories of surface elevation change and indicate processes influencing these trajectories (Rogers and Saintilan, 2021).
Radiometric techniques that focus on processes operating over longer interdecadal timescales tend to produce time averaged indications of sedimentation and the influence of short-term perturbations on trajectories is moderated (Nolte et al., 2013). A range of techniques can be used which are dependent upon the capacity to detect isotopes that undergo decay over time. Accordingly, different techniques can be selected to characterize sedimentation over a range of timescales. Measurements of unsupported 210Pb, which has a half-life of 22.3 years, has been effectively used to ascribe chronology over the past 100–150 years for coastal wetland sediments (Swales et al., 2015; Ruiz-Fernández et al., 2016; Arias-Ortiz et al., 2018; Rogers et al., 2019; Marx et al., 2020; FitzGerald et al., 2021). This timescale is particularly useful for developing relationships between sedimentation and RSLR as it corresponds to (i) the most intensive period of industrialization when global sea levels have been increasing; and (ii) the timescale at which projections of the response of coastal wetlands are most relevant for planning and decision making (Woodroffe and Murray-Wallace, 2012). Recent advances in models for ascribing a 210Pb chronology now accommodate a range of 210Pb supply conditions and composition of sediments (i.e., the degree of mineral and organic material) (FitzGerald et al., 2021; Iurian et al., 2021). As these factors vary over time, the length of time that sedimentation is averaged is diminished, and variation in sedimentation can be determined over shorter-time periods. This provides the opportunity to characterize changes in sedimentation under varying conditions of RSLR.
This study focuses on establishing relationships between rates of sedimentation, surface elevation gain and SLR relevant to decadal timescales, and specifically addresses two knowledge gaps. First, it provides comprehensive empirical data of coastal wetland sedimentation and elevation adjustment in the southern hemisphere, a region for which there is relatively little data at decadal timescales and represents a significant knowledge gap that limits the development of robust regional and global-scale models. Second, it addresses timescale bias by developing relationships between rates of sedimentation and SLR that are relevant at the annual to decadal scale useful for management and decision making. Relationships were validated against both short-term data derived from SET-MH techniques and against geomorphological information of shoreline change at the decadal timescale. Our specific hypothesis was that rates of sedimentation were related to the three-dimensional space available for mineral and organic matter accumulation. Commonly known as accommodation space (Jervey, 1988; Rogers et al., 2019; Rogers, 2021), this space is delimited by the existing surface elevation, the maximum tide level, and hydrodynamic conditions suitable for deposition, and is influenced by SLR. We expected the substrates lower in the tidal frame would have higher rates of sedimentation, the substrates higher in the tidal frame would have lower rates of sedimentation, and that rates of adjustment would change over time on the basis of tidal position. Additionally, we assessed the resilience of coastal wetlands by standardizing rates of sedimentation and surface elevation change relative to accommodation space and comparing surface elevation change to current and projected rates of RSLR. These analyses considered the elevation that substrates would asymptote toward under different SLR scenarios and projected sedimentation rates and surface elevation change at the upper and lower limits of mangrove and saltmarsh vegetation, and the approximate elevation of the transition between mangrove and saltmarsh vegetation. This study focuses on Westernport Bay, Australia; a large tidal embayment that supports mangroves at tidal positions approximately between mean tide level (MTL) and mean high water springs (MHWS), and saltmarsh at positions higher in the tidal frame. We integrate reliable estimates of vertical accretion, surface elevation change and autocompaction derived from a 20-year record of observations (Rogers and Saintilan, 2021), with estimates of sedimentation at the decadal to century scale derived from 210Pb-dating techniques applied to cores extracted from mangrove and saltmarsh zones at each study site. To reconstruct surface elevation, rates of sedimentation were adjusted for autocompaction using a site-specific model developed by Rogers and Saintilan (2021). This manuscript compliments Rogers and Saintilan (2021), which assesses processes influencing surface elevation change over a 20-year timescale from a network of 24 SET-MH. It is anticipated that this study will provide knowledge relevant to management of coastal wetlands at Westernport Bay, and will inform global scale models of the behavior of coastal wetlands to SLR and their resilience.
Westernport Bay (38°21′S, 145°13′E) is a large coastal embayment of ∼680 km2 that drains a catchment area of 3,433 km2 located east of Melbourne Victoria, Australia (Figure 1). The region is prone to drought associated with negative phases of the El Niño Southern Oscillation, and the influence of drought on rainfall has been associated with changes in surface elevations of coastal wetlands around Westernport Bay (Rogers et al., 2005b). The embayment has two entrances to Bass Strait; the constriction of the eastern entrance near San Remo (38°31′S, 145°22′E) causes tides to propagate relatively freely through the western entrance, clockwise around French Island until they converge with anticlockwise tidal movement (Harris et al., 1979). The tidal regime is semi diurnal with a tidal range of up to 3.1 m and significant tidal amplification along the upper Northern Arm of Westernport Bay, near the study sites at French Island and Koweerup (Water Technology, 2014b). Despite its size, the embayment is relatively shallow and tides are reported to comprise approximately 30% of the total volume at high tide (Lee, 2011). Westernport Bay includes extensive intertidal flats (∼270 km2) that support mangrove and saltmarsh communities along its low energy intertidal shorelines, estimated to cover approximately 12.3 and 10.9 km2, respectively (Boon, 2011). These wetlands comprise a lower elevation mangrove zone that supports the cold tolerant mangrove, Avicennia marina, which is near its most latitudinal limit at this location. The upper intertidal zone also supports dense thickets of saltmarsh shrubs of the genus Tecticornia and a landward zone of herbs, grasses and sedges that are regarded to be highly diverse (Boon, 2011).
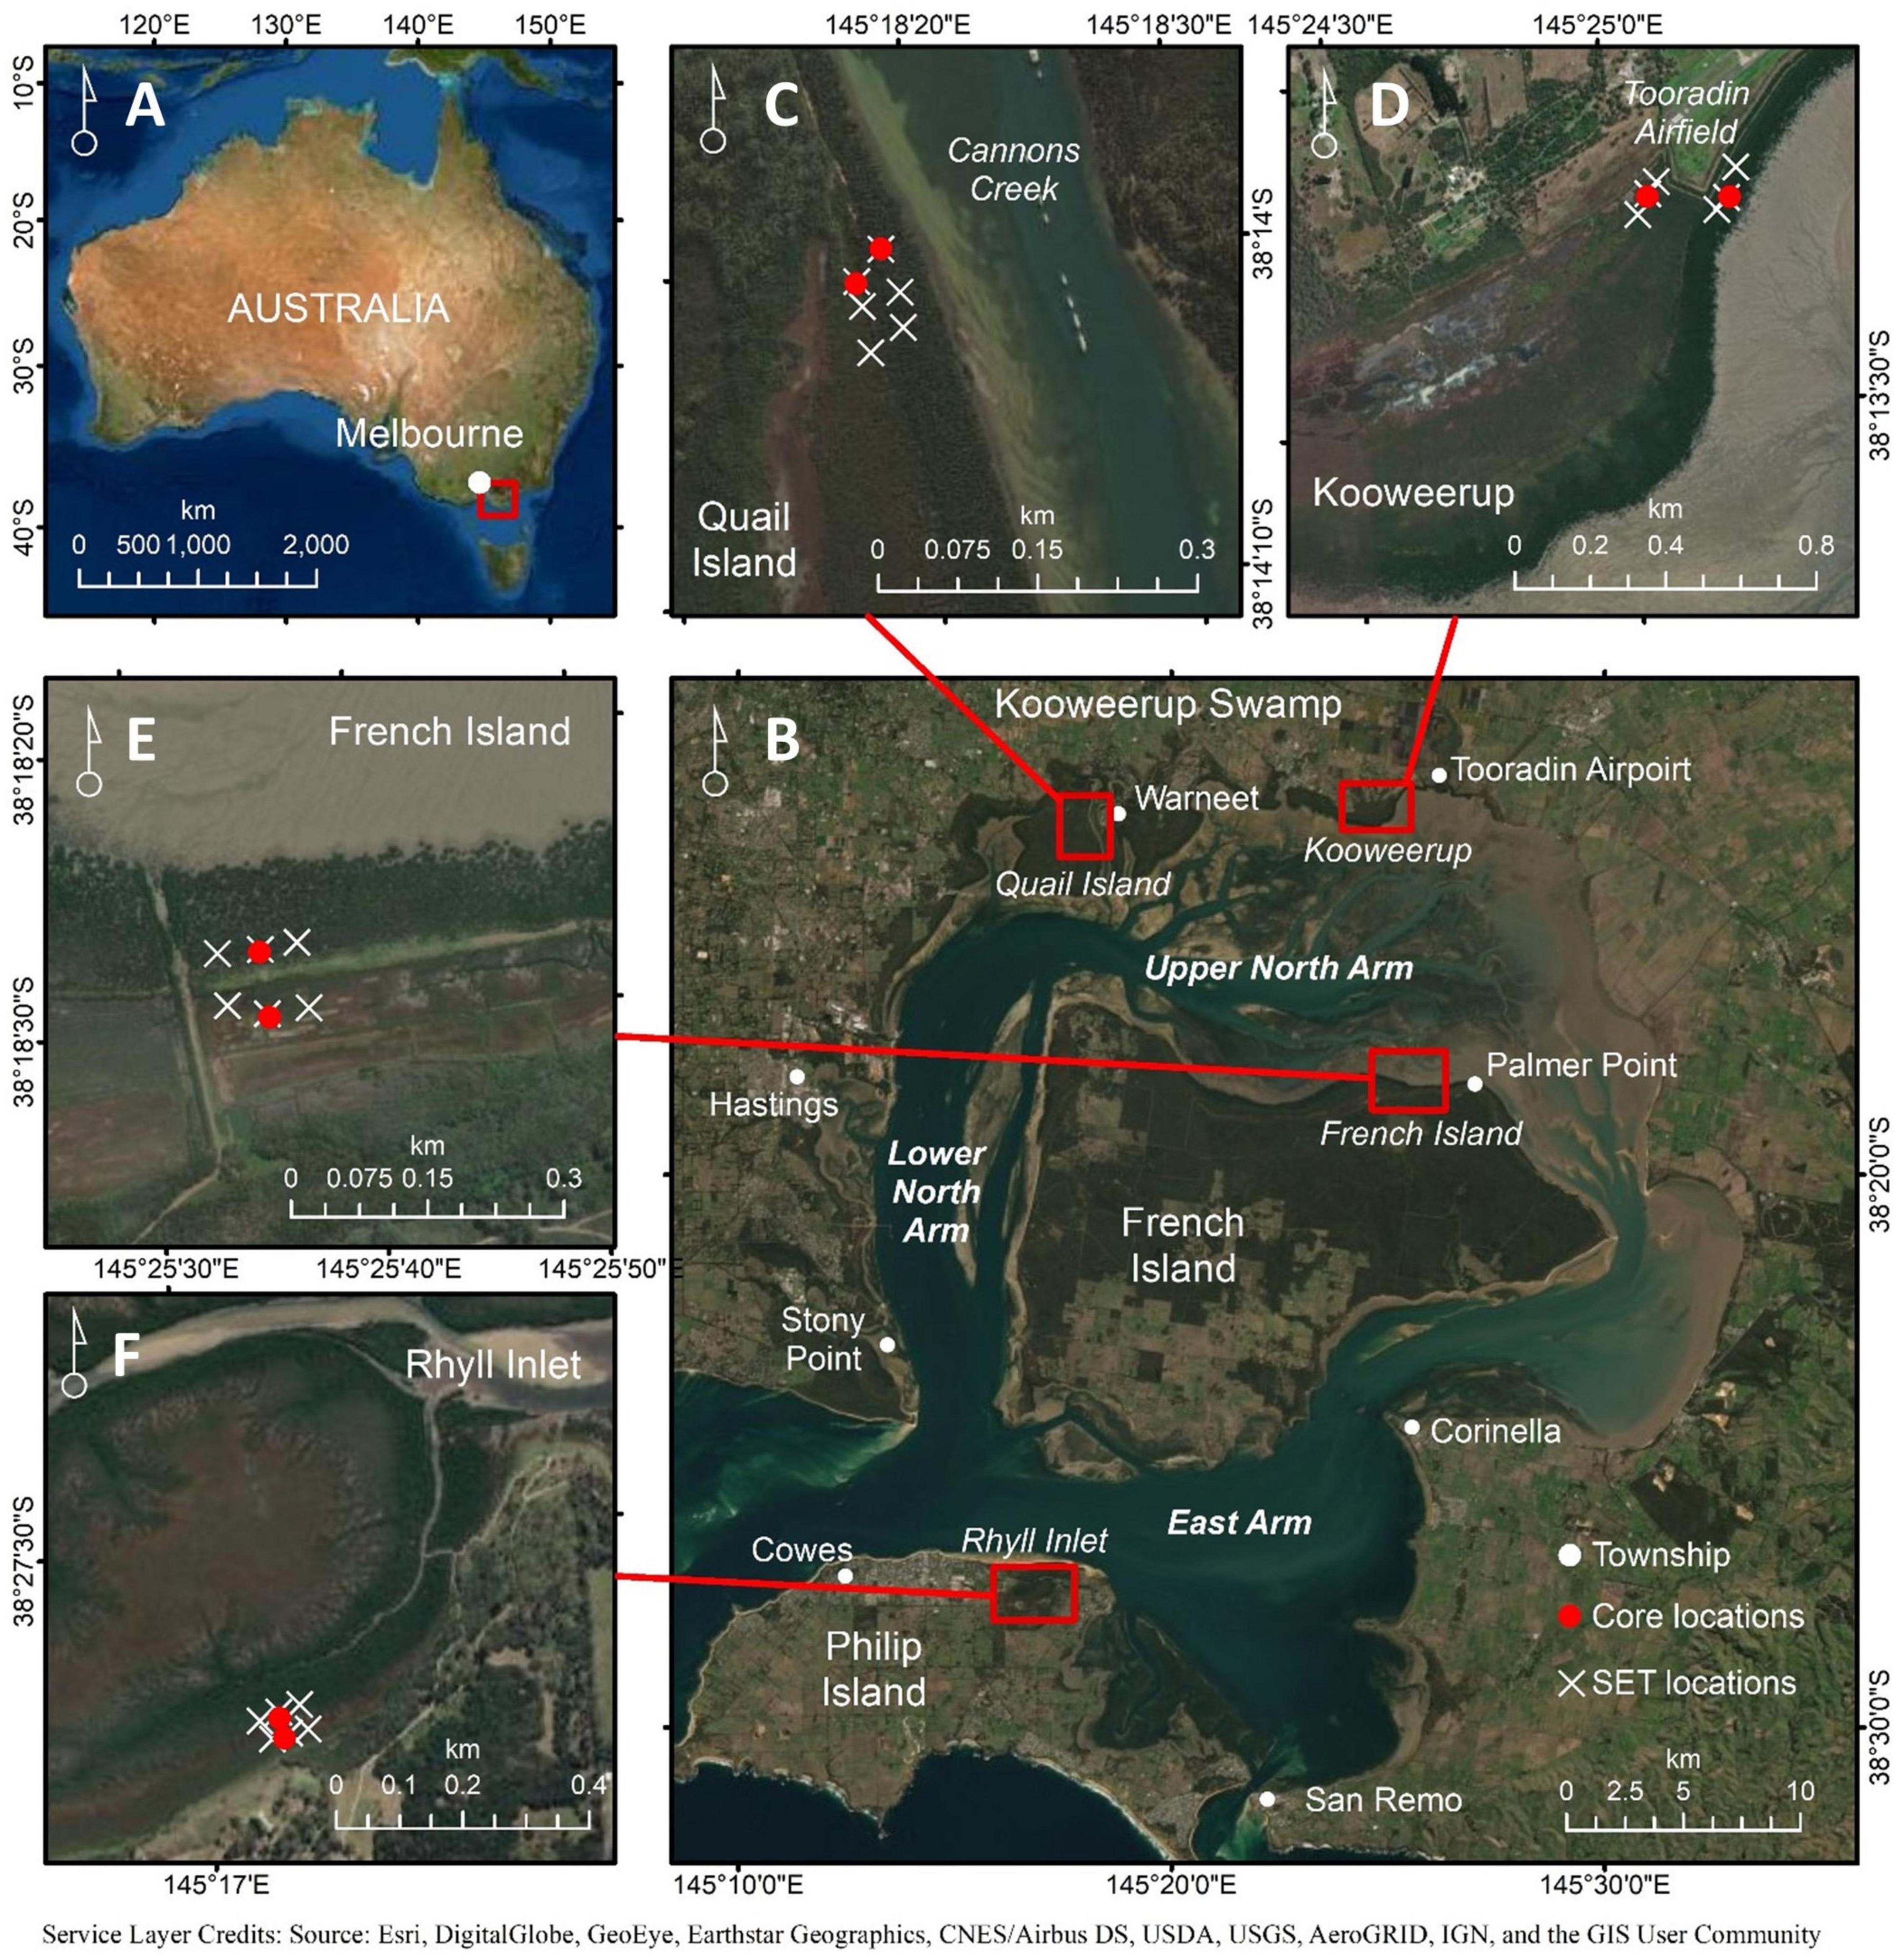
Figure 1. (A) Location of Westernport Bay, Australia, and the (B) focal study sites where cores were extracted from the mangrove and saltmarsh at (C) Quail Island, (D) Kooweerup, (E) French Island, and (F) Rhyll.
This study focuses on four locations where surface elevation table (SET) monitoring stations were established in October 2000 to monitor mangrove and saltmarsh vegetation dynamics and rates of vertical accretion and surface elevation change. These study sites included the northern shoreline of French Island, near abandoned saltworks at Palmer Point (henceforth termed French Island), the northern shoreline of the bay near Tooradin airport which adjoins Kooweerup Swamp (henceforth termed Kooweerup), the eastern shoreline of Quail Island near Warneet (henceforth termed Quail Island), and the upper reaches of Rhyll Inlet on Philip Island (henceforth termed Rhyll).
The original study of Rogers et al. (2005b) commenced in 2000 and provided quantitative information on the dynamics of mangrove and saltmarsh vegetation and changes in rates of vertical accretion and surface elevation within mangrove and saltmarsh of Westernport Bay, with consideration given to varying degrees of catchment development. Rogers et al. (2005b) established a network of version IV SET-MH throughout Westernport Bay. The SET serves as a stable benchmark against which relative changes in surface elevation can be determined. Relative SET measurements can be converted to absolute measurements of surface elevation change by geolocating SET benchmarks using a real time kinematic global positioning system (RTK-GPS). The version IV SET has a reported 95% confidence limit of ±1.4 mm (Cahoon et al., 2002). Marker horizons of feldspar have been co-located with each SET and extraction of mini-cores from each MH at the time of SET measurements allows quantification of surface processes of vertical accretion. By deduction, the difference between the degree of surface elevation change and vertical accretion provides an indication of autocompaction processes operating in the substrate that alter the volume. This network comprised 24 SET-MH stations in a nested design whereby six SETs were co-located at French Island, Kooweerup, Quail Island, and Rhyll. At each location, SETs were positioned in groups of three within structurally similar vegetation: three located in the mangrove zone where the tidal position was lower; and three in the saltmarsh zone where the tidal position was higher. Rogers et al. (2005b) also determined sedimentation rates using 210Pb-dating of sediments and undertook mapping from aerial photographs to determine changes in the distribution of mangrove and saltmarsh over the length of the aerial photographic records for each site. These study sites remain the focus of this research. Since the commencement of the original study, access to spatial information, such as LiDAR point clouds and RTK-GPS technology, and access to low-cost sensors and data loggers has increased. Additional time-series mapping has been undertaken by Whitt et al. (2020) and an update of SET monitoring results is provided by Rogers and Saintilan (2021).
Water-level data from the tide gauge at Stony Point has been collected since 1981 and can be accessed as processed datasets indicating minimum, mean, and maximum monthly water levels (Bureau of Meteorology, 2021). This data was accessed for the full record length and analyzed to characterize RSLR over time. Water-level data underwent preliminary processing to remove any months where data gaps were greater than 10% of the gauging frequency each month. Linear regressions were used to identify the rate of change in minimum, mean, and maximum monthly water levels.
Water-level data from tide gauges can also be used to indicate the vertical position within the tidal frame that mangroves and saltmarshes occupy, and the space available for tidally-borne sedimentation, known as accommodation space. However, they may not be a precise indicator of tidal behavior at locations distal to tide gauges as tides can become amplified or attenuated as they propagate along estuaries and embayments (Kumbier et al., 2021). Tidal analyses have confirmed that tides do amplify along the northern arm of Westernport Bay (Water Technology, 2014a), due to the one quarter wavelength resonance of the lunar semidiurnal tide within Westernport Bay. Accordingly, the upper boundary of accommodation space at study sites along the Northern Arm, namely at French Island, Kooweerup and Quail Island, will likely be higher than indicated by tide gauge data alone.
To establish how much tidal amplification occurs at each study site, daily maximum water-level data from the Stony Point tide gauge was calibrated against water-level data collected using Hobo water-level loggers that were placed within the mangrove and saltmarsh at each study site and co-located with SETs. The position of Hobo water-level loggers was determined using an RTK-GPS, and all values were calibrated against the Australian height datum (AHD). Hobo water-level loggers collected data at 15-min intervals from May 2015 to January 2016 at French Island, and April 2016 to November 2016 at Kooweerup, Quail Island, and Rhyll. These periods of data collection exceeded 6 months, included considerable variation in tidal height and included the high water spring tides that occur approximately every 6 months. Modeled maximum daily tides at each study site were determined by calibrating daily maximum tides from the Stony Point tide gauge against observed water-level data collected using Hobo water level loggers by adding a tidal amplification factor to tide gauge data. The efficacy of calibration was determined using a matched pairs t-test and the deviation of observed values from the modeled values was determined using the coefficient of determination (r2).
The upper boundary of accommodation space at each study site was subsequently modeled at any time step on the basis of the trend in the maximum monthly water-level data plus the tidal amplification factor determined for each study site. The lower boundary of the vegetated intertidal zone was presumed to be the elevation of mean sea level, as indicated on the Stony Point tide gauge.
Sediment cores, eight in total, of approximately 1.5 m length were collected in 2017 adjacent to mangrove and saltmarsh SET monitoring stations at each study site. Cores were extracted in aluminium tubes of 75 mm diameter. The degree of sediment compaction that occurred during core collection was determined and cores were capped to ensure they remained continuous and intact for transport. Cores were placed in cold storage at 4°C until sample preparation was undertaken. The position of each core at the time of extraction was determined using an RTK-GPS with measurements made with respect to the AHD. Cores were split longitudinally and half of the core was subsampled at intervals of 2 cm in the upper strata of 10 cm, every 5 cm to depths of 1 m, and every 10 cm below 1 m for further analysis. These sample depths were adjusted for compaction and the remaining core was placed in storage. Samples were subsequently prepared for analysis of 210Pb activity. Grain size of each sample was determined (μm) using a Malvern Mastersizer 2000 laser diffractometer and the proportion of each fraction determined. To determine dry bulk density (g cm–3), samples were oven dried to constant weight at 60°C. Dry sample weight was determined and bulk density (BD) was estimated as the ratio of dry sample mass to wet sample volume. Dry bulk density was subsequently used to model sedimentation rates and quantify 210Pb activity.
Lead-210 is a naturally occurring radionuclide with a half-life of 22.3 years. Analysis of unsupported 210Pb derived from the atmosphere facilitates the determination of sediment age at time of deposition. As sediments accumulate, 210Pb decays according to its half-life, thus the rate of decline in unsupported 210Pb with sediment depth allows the determination of sediment chronology and mass accumulation rates. Grain size can affect the adsorption of 210Pb onto the sediment materials. Finer sediments with larger surface area adsorb 210Pb more effectively than coarser grain size sediments with smaller surface area. To facilitate the detection of low level 210Pb activities, samples from various core depths were sieved to concentrate the <63 μm fraction. Sieved samples were then provided to the Australian Nuclear Science and Technology Organisation (ANSTO) for 210Pb dating by alpha particle spectrometry. Preliminary analysis was undertaken on five samples per core to determine whether unsupported 210Pb activity decreased with core depth. Subsequent sample analyses were used to develop a more reliable chronology. Sample age was determined using both the constant rate of supply (CRS) (Appleby and Oldfield, 1978) and constant flux-constant rate of supply (CFCS) (Krishnaswamy et al., 1971) models. However, the CRS model has exhibited superior performance when dating sediment matrices comprised of significant organic matter in the sediment composite (Iurian et al., 2021). Accordingly, it was anticipated that the CRS model, which accounts for irregularities in unsupported 210Pb activity would provide a more reliable chronology.
Independent validation of chronology is recommended to ensure high confidence in results (Smith, 2001). Measurements of 137Cs peak activity is commonly used for validation; however, the relatively short-half-life of 137Cs and lower activity within sediments of the southern hemisphere may limit validation using this approach (Arias-Ortiz et al., 2018). Analyses of 137Cs activity did not yield results suitable for validation, hence an alternative approach was undertaken. Measurements of 239+240Pu activity, or bomb-pulse analyses, can also be undertaken, but can be costly and were not undertaken in this study as the results were validated using existing data from SET-MH analyses (Sanders et al., 2016; Marx et al., 2020). Initially, validation was undertaken by comparison with recent measurements of vertical accretion derived from SET-MH stations and reported in Rogers and Saintilan (2021). Validation of expected changes to shorelines was also undertaken using time-series aerial photograph analysis, as described below.
As the CRS model accounts for variation in volume and mass of sediment accumulated over time, it provided the opportunity to assess changes in sedimentation rates over time on the basis of the age and depth of each sediment sample, as per Rogers et al. (2019). Change point detection was applied using JMP statistical software when a change in sedimentation trajectories was evident; peaks in sedimentation were interpreted in the context of available accommodation space.
Reconstructing surface elevations requires information about the elevation of the contemporary substrate surface, compaction associated with core extraction, and post-depositional autocompaction. The elevation of the contemporary substrate surface was determined at the time of core extraction using an RTK-GPS, and compaction associated was core extraction was quantified. To account for post-depositional autocompaction, we adapted the relationship established by Rogers and Saintilan (2021) between autocompaction and vertical accretion at Westernport Bay (see Supplementary Data 1, Supplementary Figure 1, and Supplementary Table 2). Autocompaction was modeled to be linearly related to sedimentation (r2 = 0.82), with approximately 80% of deposited sediment within a year undergoing post-depositional autocompaction, resulting in 20% of annual sedimentation volume contributing to surface elevation gain. This relationship was applied to sedimentation rates at each time step to determine the rate of autocompaction. The rate of surface elevation change was established from the difference between the rates of sedimentation derived from 210Pb analyses and autocompaction. The rate of surface elevation change was time-adjusted to determine the total surface elevation change between each time step, and absolute surface elevations were reconstructed using total surface elevation change between each time step. Mean rates of surface elevation change were determined by applying linear regression analysis to reconstructed surface elevations.
The upper boundary of accommodation space at the time of core extraction was determined by applying the tidal amplification factor to the modeled trend in maximum monthly water levels at each study site. Available accommodation space was defined as the vertical space between the upper boundary of accommodation space and the surface elevation at the time of core extraction. Mean rates of surface elevation gain within mangrove and saltmarsh cores at each study site were subsequently plotted against available accommodation space. As tidally-borne sedimentation is presumed to be negligible at the upper boundary of accommodation space, surface elevation change was also presumed to be negligible. Whether substrate elevations adjusted across the intertidal zone according to a linear or peak model relationship has received consideration globally and at this location (Kirwan and Megonigal, 2013; Mogensen and Rogers, 2018; Rogers and Saintilan, 2021). Quantifying sedimentation at multiple positions across the intertidal zone using lead-210 activity was not feasible due to the resources required to undertake this across the expanse of Westernport Bay. This limited the capacity to determine the behavior of substrate elevations at each study location and it was subsequently assumed that substrate elevations behaved linearly. On this assumption, linear regression analyses that passed through the origin were applied at each study site. A standardized rate of surface elevation gain per meter of available accommodation space was also determined at each study site. These standardized rates were used to determine whether a change in tidal position and shoreline change had occurred over the observational record when sea level was rising in the order of 3 mm year–1. Under these conditions of SLR, it was expected that surface elevations would asymptote toward a depth below the upper boundary of accommodation space where rates of surface elevation gain correspond to rates of SLR, termed equilibrium accommodation space. At depths below the upper boundary of accommodation space where rates of surface elevation gain exceed rates of SLR, infilling will continue, tidal position should increase and shoreline progradation would occur over extended periods of time. Mangrove and saltmarsh distribution is expected to change accordingly, with seaward expansion of mangroves occurring where rates of surface elevation gain exceeds rates of SLR. Where rates of surface elevation gain do not exceed rates of SLR at any tidal position, even when there is ample available accommodation space, tidal position will decrease and shoreline retreat will eventually occur. Mangrove expansion into the saltmarsh would also occur where surface elevation gain was less than SLR. Standardized rates of surface elevation gain were specifically used to estimate rates of surface elevation gain at MTL and MHWS. These elevations were selected as they approximate the lower boundary of mangrove vegetation and the lower boundary of saltmarsh vegetation. Changes in tidal position were subsequently projected as the difference between the observed rate of surface elevation gain and SLR: a deficit between surface elevation gain and SLR indicates retreat, whilst a surplus indicates progradation.
Comparison of changes in shoreline position from aerial photography provides the capacity to confirm projections of changing tidal position and shoreline change. Observed patterns of vegetation change were delineated at each study site by mapping mangrove and saltmarsh distribution changes from historic and contemporary aerial photography that approximated the period of tide-gauge data collection (i.e., 1981–2017). The best available contemporary imagery was pre-processed orthophotography from 2009 provided by the Victorian Government. The best available historical color aerial photographs were captured at a resolution of 1:15,000 in 1973/4 near the commencement of tide-gauge data collection (Supplementary Table 2). These were scanned at 600 dpi and georectified against the contemporary orthophotography using a projective transformation. Each georectified image was merged into a single mosaic for each study site. This imagery was visually digitized to delineate the lower mangrove boundary (presumed to be near MTL), the boundary between mangrove and saltmarsh vegetation (presumed to be near MHWS), and the landward boundary of intertidal vegetation [presumed to be near highest astronomical tide (HAT)]. Lateral changes in the position of MTL and MHWS were subsequently measured within the vicinity of core extraction sites to establish the direction and extent of vegetation distribution changes. Changes in vegetation distribution that corresponded to projected vegetation changes served to validate standardized rates of surface elevation gain.
Following validation of standardized rates of surface elevation gain against observed changes in vegetation distribution, the resilience of each study site was projected under two different SLR scenarios that represent end-members of future scenarios: (i) the projected median rate of SLR for a low SLR scenario at ∼2100 (i.e., SSP1-2.6 = 5.2 mm year–1 (4.4–6.2 likely range); and (ii) the projected median rate of SLR for a high SLR scenario at ∼2100 (i.e., SSP5-8.5 = 12.2 mm year–1 (8.8–17.7 likely range) (Fox-Kemper et al., 2021). The equilibrium accommodation space was specifically quantified as the accommodation space where the rates of surface elevation gain and SLR corresponded under each SLR scenario. This was also assessed by estimating changes in tidal position on the basis of the difference between surface elevation gain at MTL and MHWS and projected rates of SLR; a deficit was presumed to indicate shoreline retreat, whilst a surplus was presumed to indicate progradation.
Minimum, mean, and maximum monthly tide levels increased at rates of 5.4 ± 0.7, 3.0 ± 0.4, and 2.0 ± 0.8 mm year–1, respectively (Figure 2A) over the period 1981–2017. The observed rise in MTL was later used to consider the resilience of each study site to observed rates of SLR.
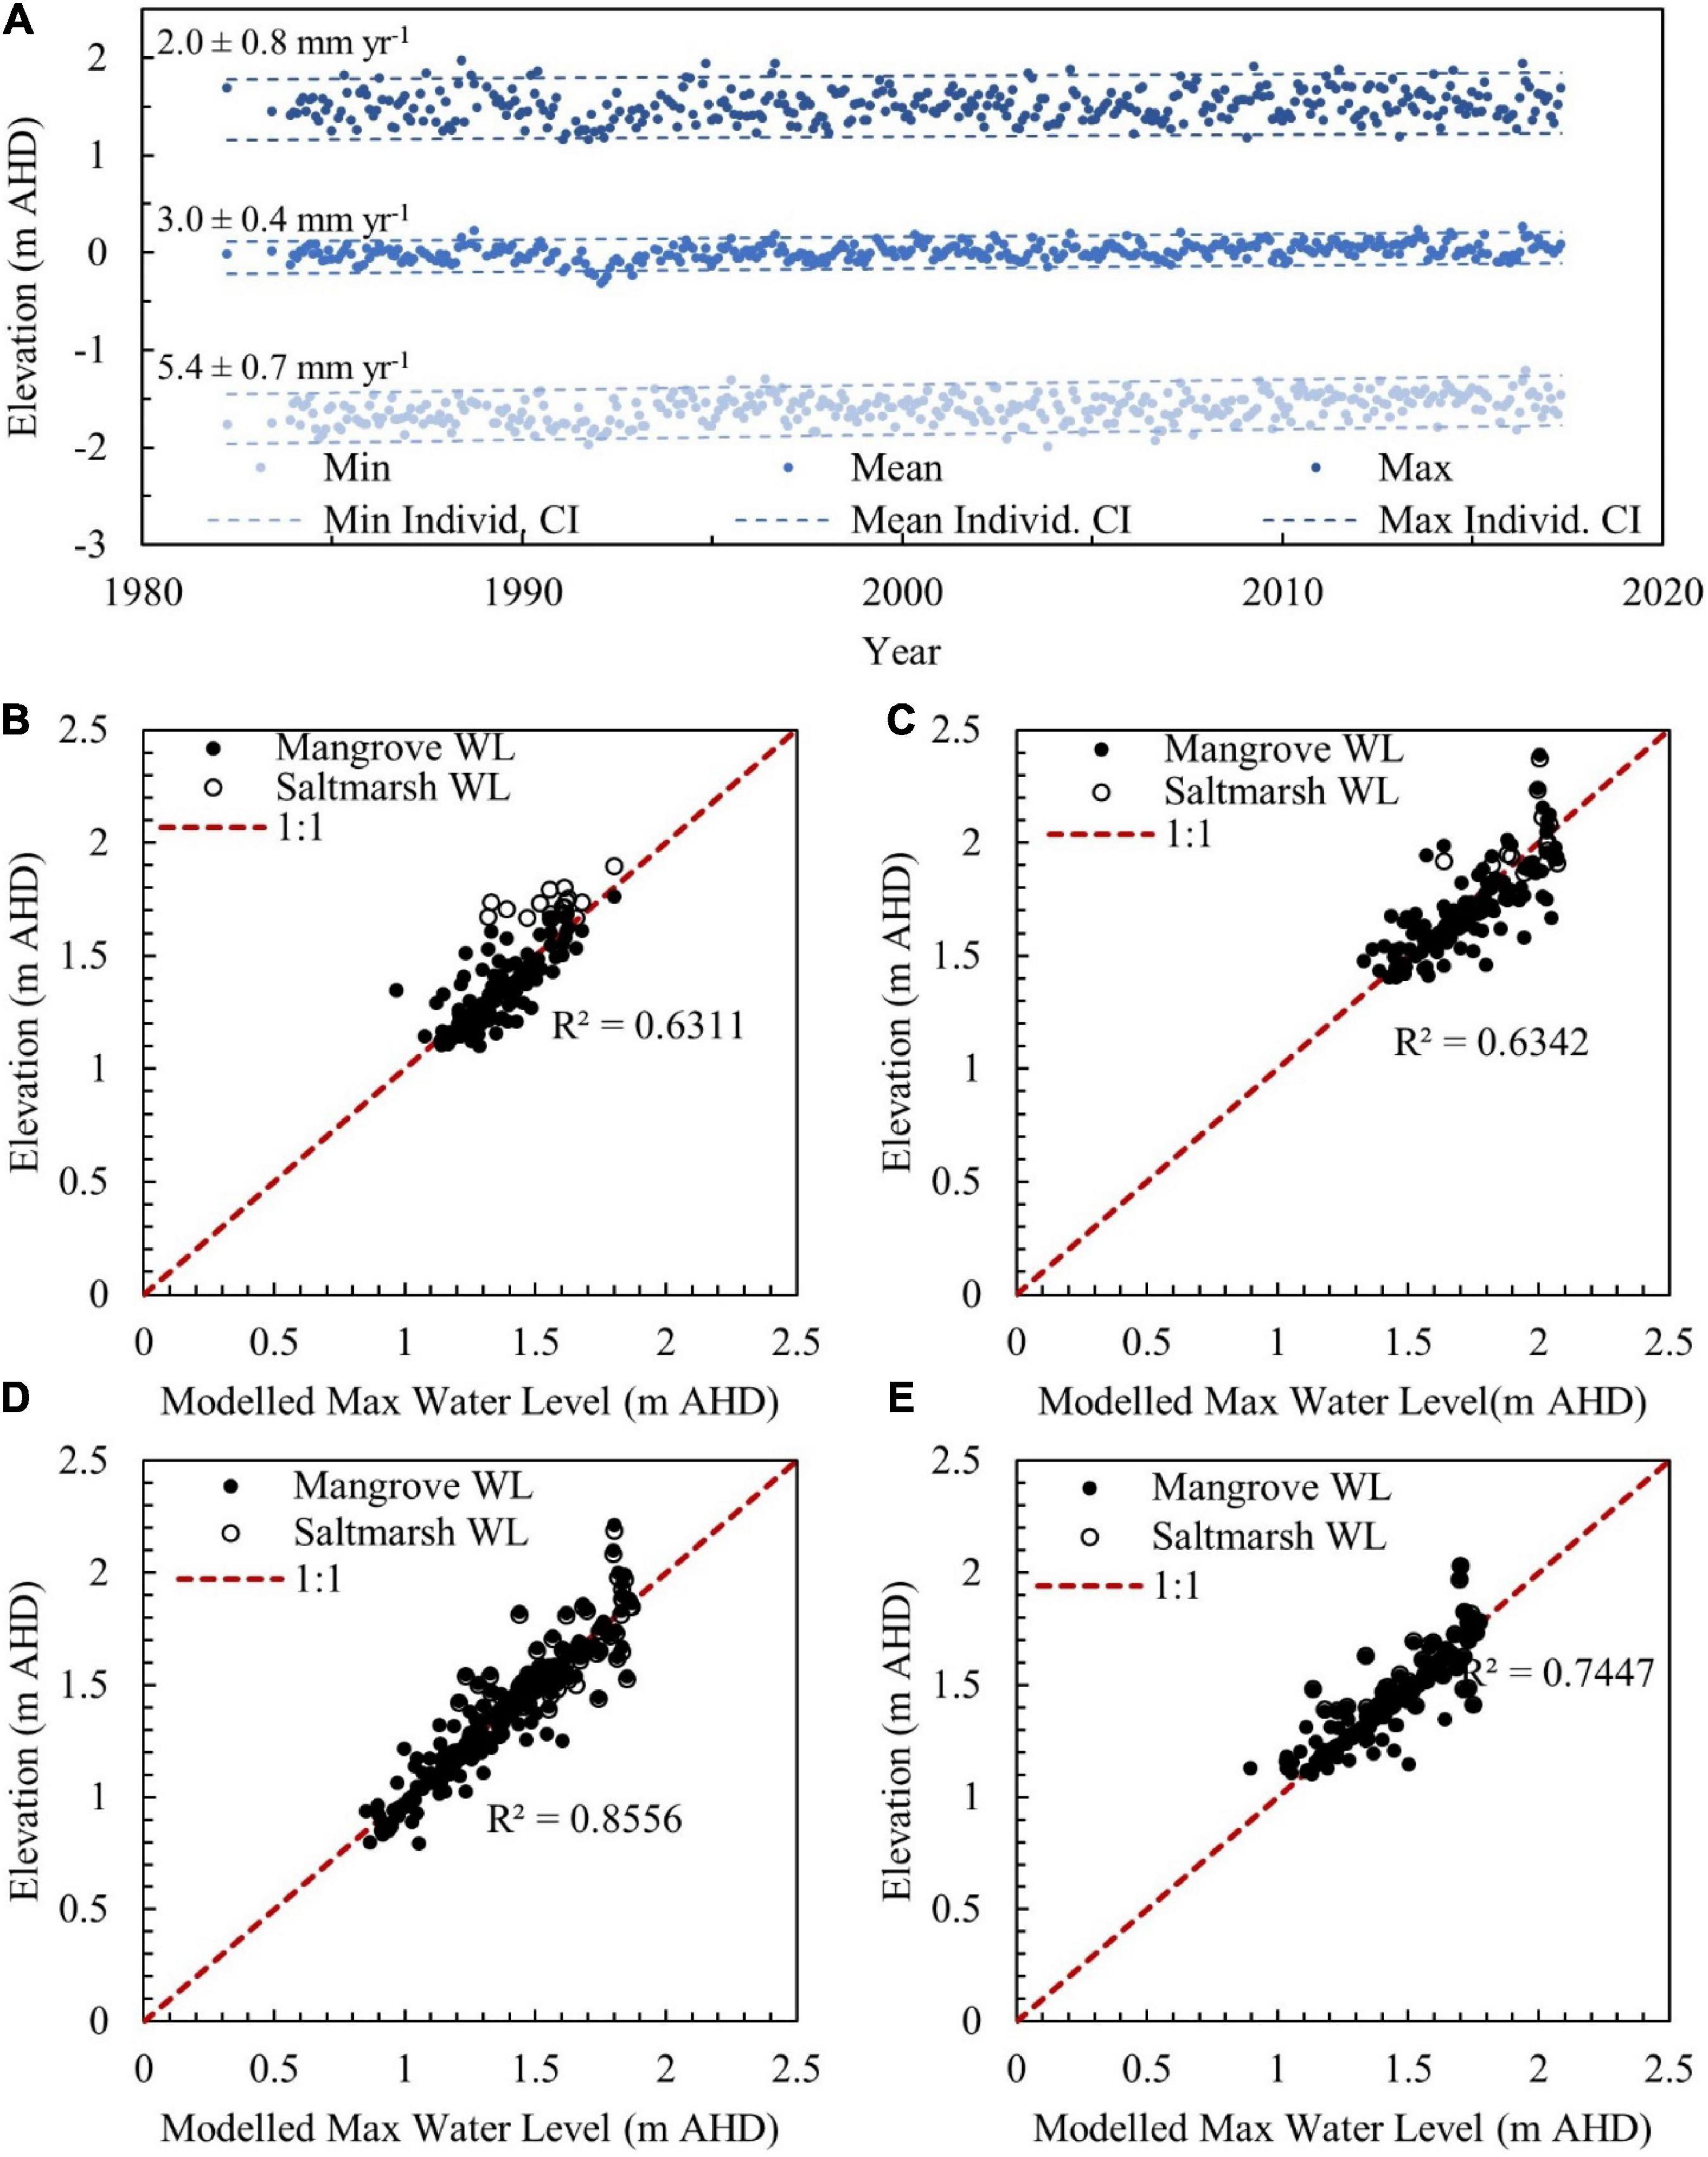
Figure 2. (A) Minimum, mean, and maximum monthly water levels at the Stony Point tide gauge, with 5% and 95% confidence interval for each variable defined by the dashed lines. Relationship between observed daily maximum water levels in the mangrove and saltmarsh zones and modeled maximum water levels at (B) French Island, (C) Kooweerup, (D) Quail Island, and (E) Rhyll.
Observed daily maximum tide level within the mangrove and saltmarsh at each study site calibrated well against maximum water levels at Stony Point when amplification factors were applied (Supplementary Figure 2). Optimal amplification factors were estimated to be 0.2 m at French Island, 0.35 m at Kooweerup, 0.15 m at Quail Island, and 0.05 m at Rhyll. These amplification factors are reasonably consistent with hydrodynamic modeling of tidal amplification around Westernport Bay (Water Technology, 2014b). No significant difference between observed and modeled water levels (Figures 2B–E); however, greater deviation occurred at French Island (p = 0.7144, r2 = 0.6311) and Kooweerup (p = 0.1408, r2 = 0.6342) than Quail Island (p = 0.7796, r2 = 0.8556) and Rhyll (p = 0.4278, r2 = 0.7447). The deviation at French Island is most prominent in the saltmarsh and likely relates to pooling of tides within abandoned ponds previously used for salt production. The upper boundary of accommodation space was subsequently modeled at each study site based on the linear trajectory of daily maximum tide level plus the tidal amplification factor for the relevant site.
Sediment analyses established that sediments comprised of both mineral and organic matter fractions, and confirmed that bulk density varied down core and was synchronous with variation in carbon content (Figure 3). Organic matter fractions were typically highest in the surface strata; however, peaks in carbon were also evident in other strata. Bulk density ranged between 0.32–0.62 g cm–3 with a mean of 0.44 ± 0.10 g cm–3, whilst carbon ranged between 0.1–0.3 g cm–3 with a mean value of 0.02 ± 0.01 g cm–3. Sediments were largely comprised of sand and silt fractions with mean grain sizes ranging between 26 and 96 μm. Mean grain size was higher in the saltmarsh than mangrove zones at Kooweerup and Rhyll, and was consistently high in both zones at Quail Island and French Island. The predominance of sand in some cores confirmed the need to concentrate the mineral fraction of sediments to <63 μm prior to undertaking 210Pb analyses. In addition, sediment variably comprising of mineral and organic fractions supported assumptions that the CRS model, which determines sedimentation rates on the basis of the sediment composite, would improve the accuracy of sedimentation rates.
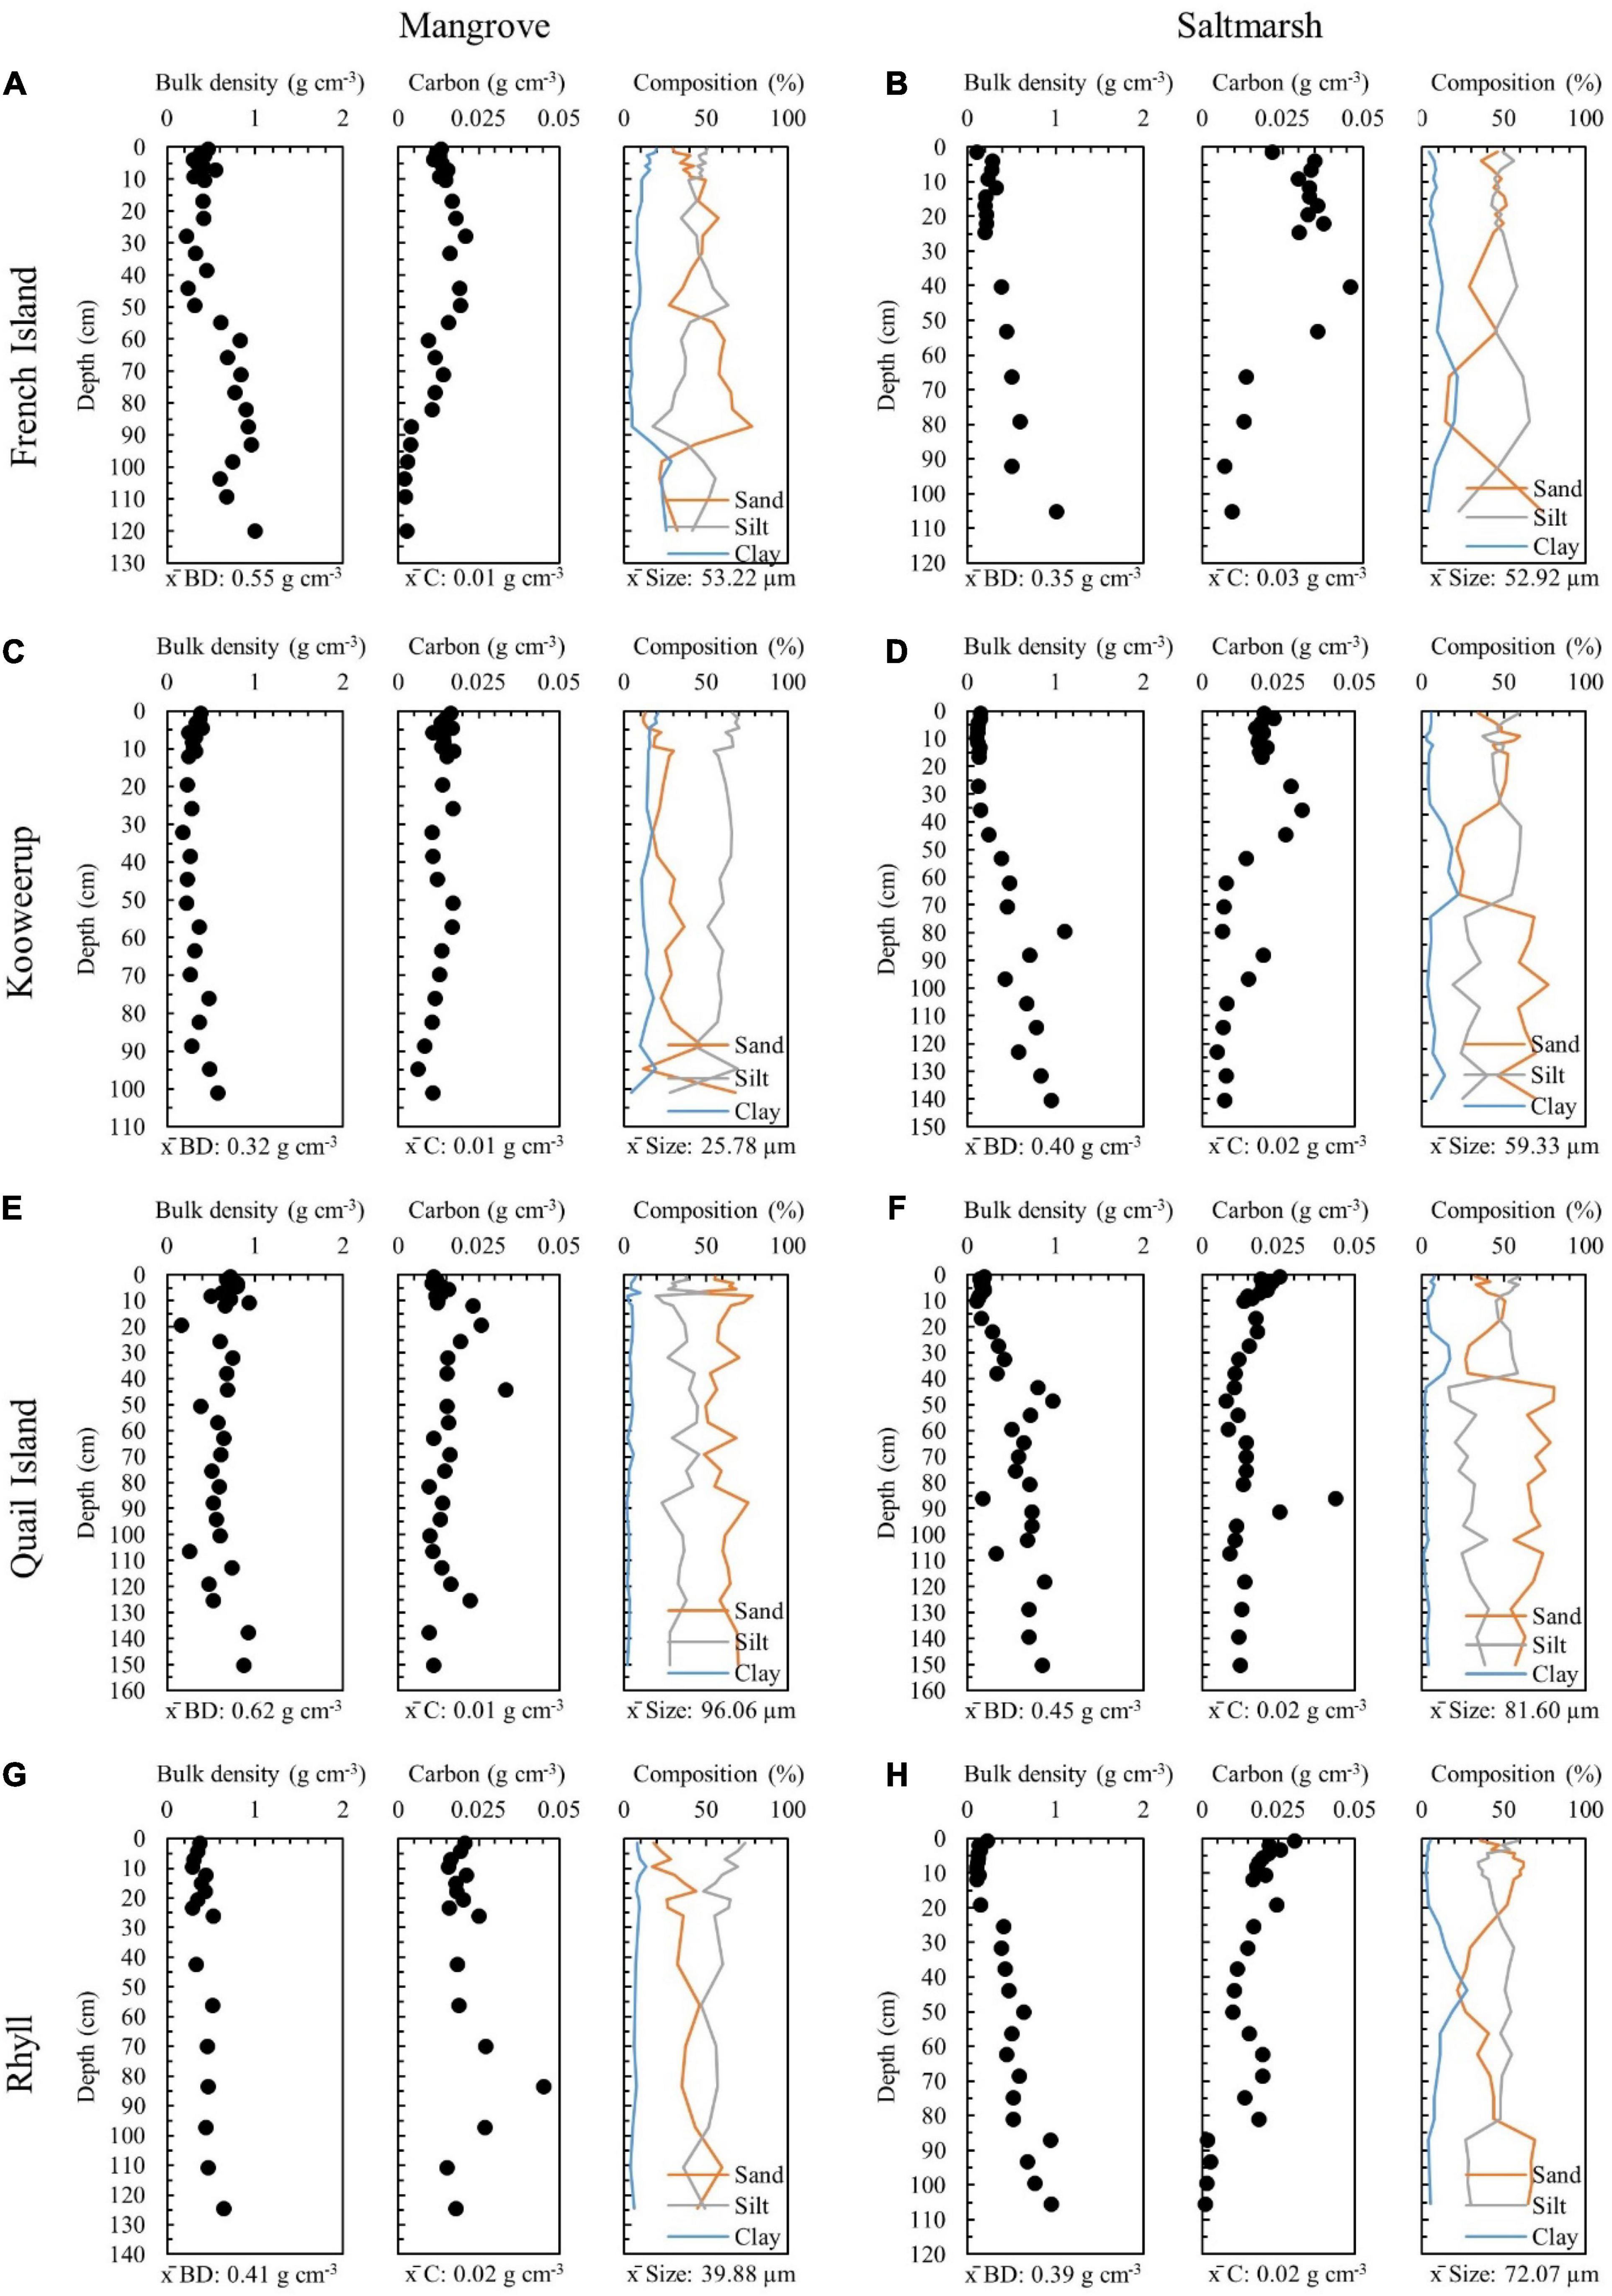
Figure 3. Bulk density, carbon content, and grain size fraction down cores extracted from the mangrove and saltmarsh zones at (A,B) French Island, (C,D) Kooweerup, (E,F) Quail Island, and (G,H) Rhyll.
Lead-210 activity and modeled sediment ages using the CRS and CFCS models confirmed decay of unsupported 210Pb activities against depth, as indicated in Figure 4. Outliers were excluded from age calculations and the three identified outliers were limited to mangrove sediments at Quail Island and Rhyll.
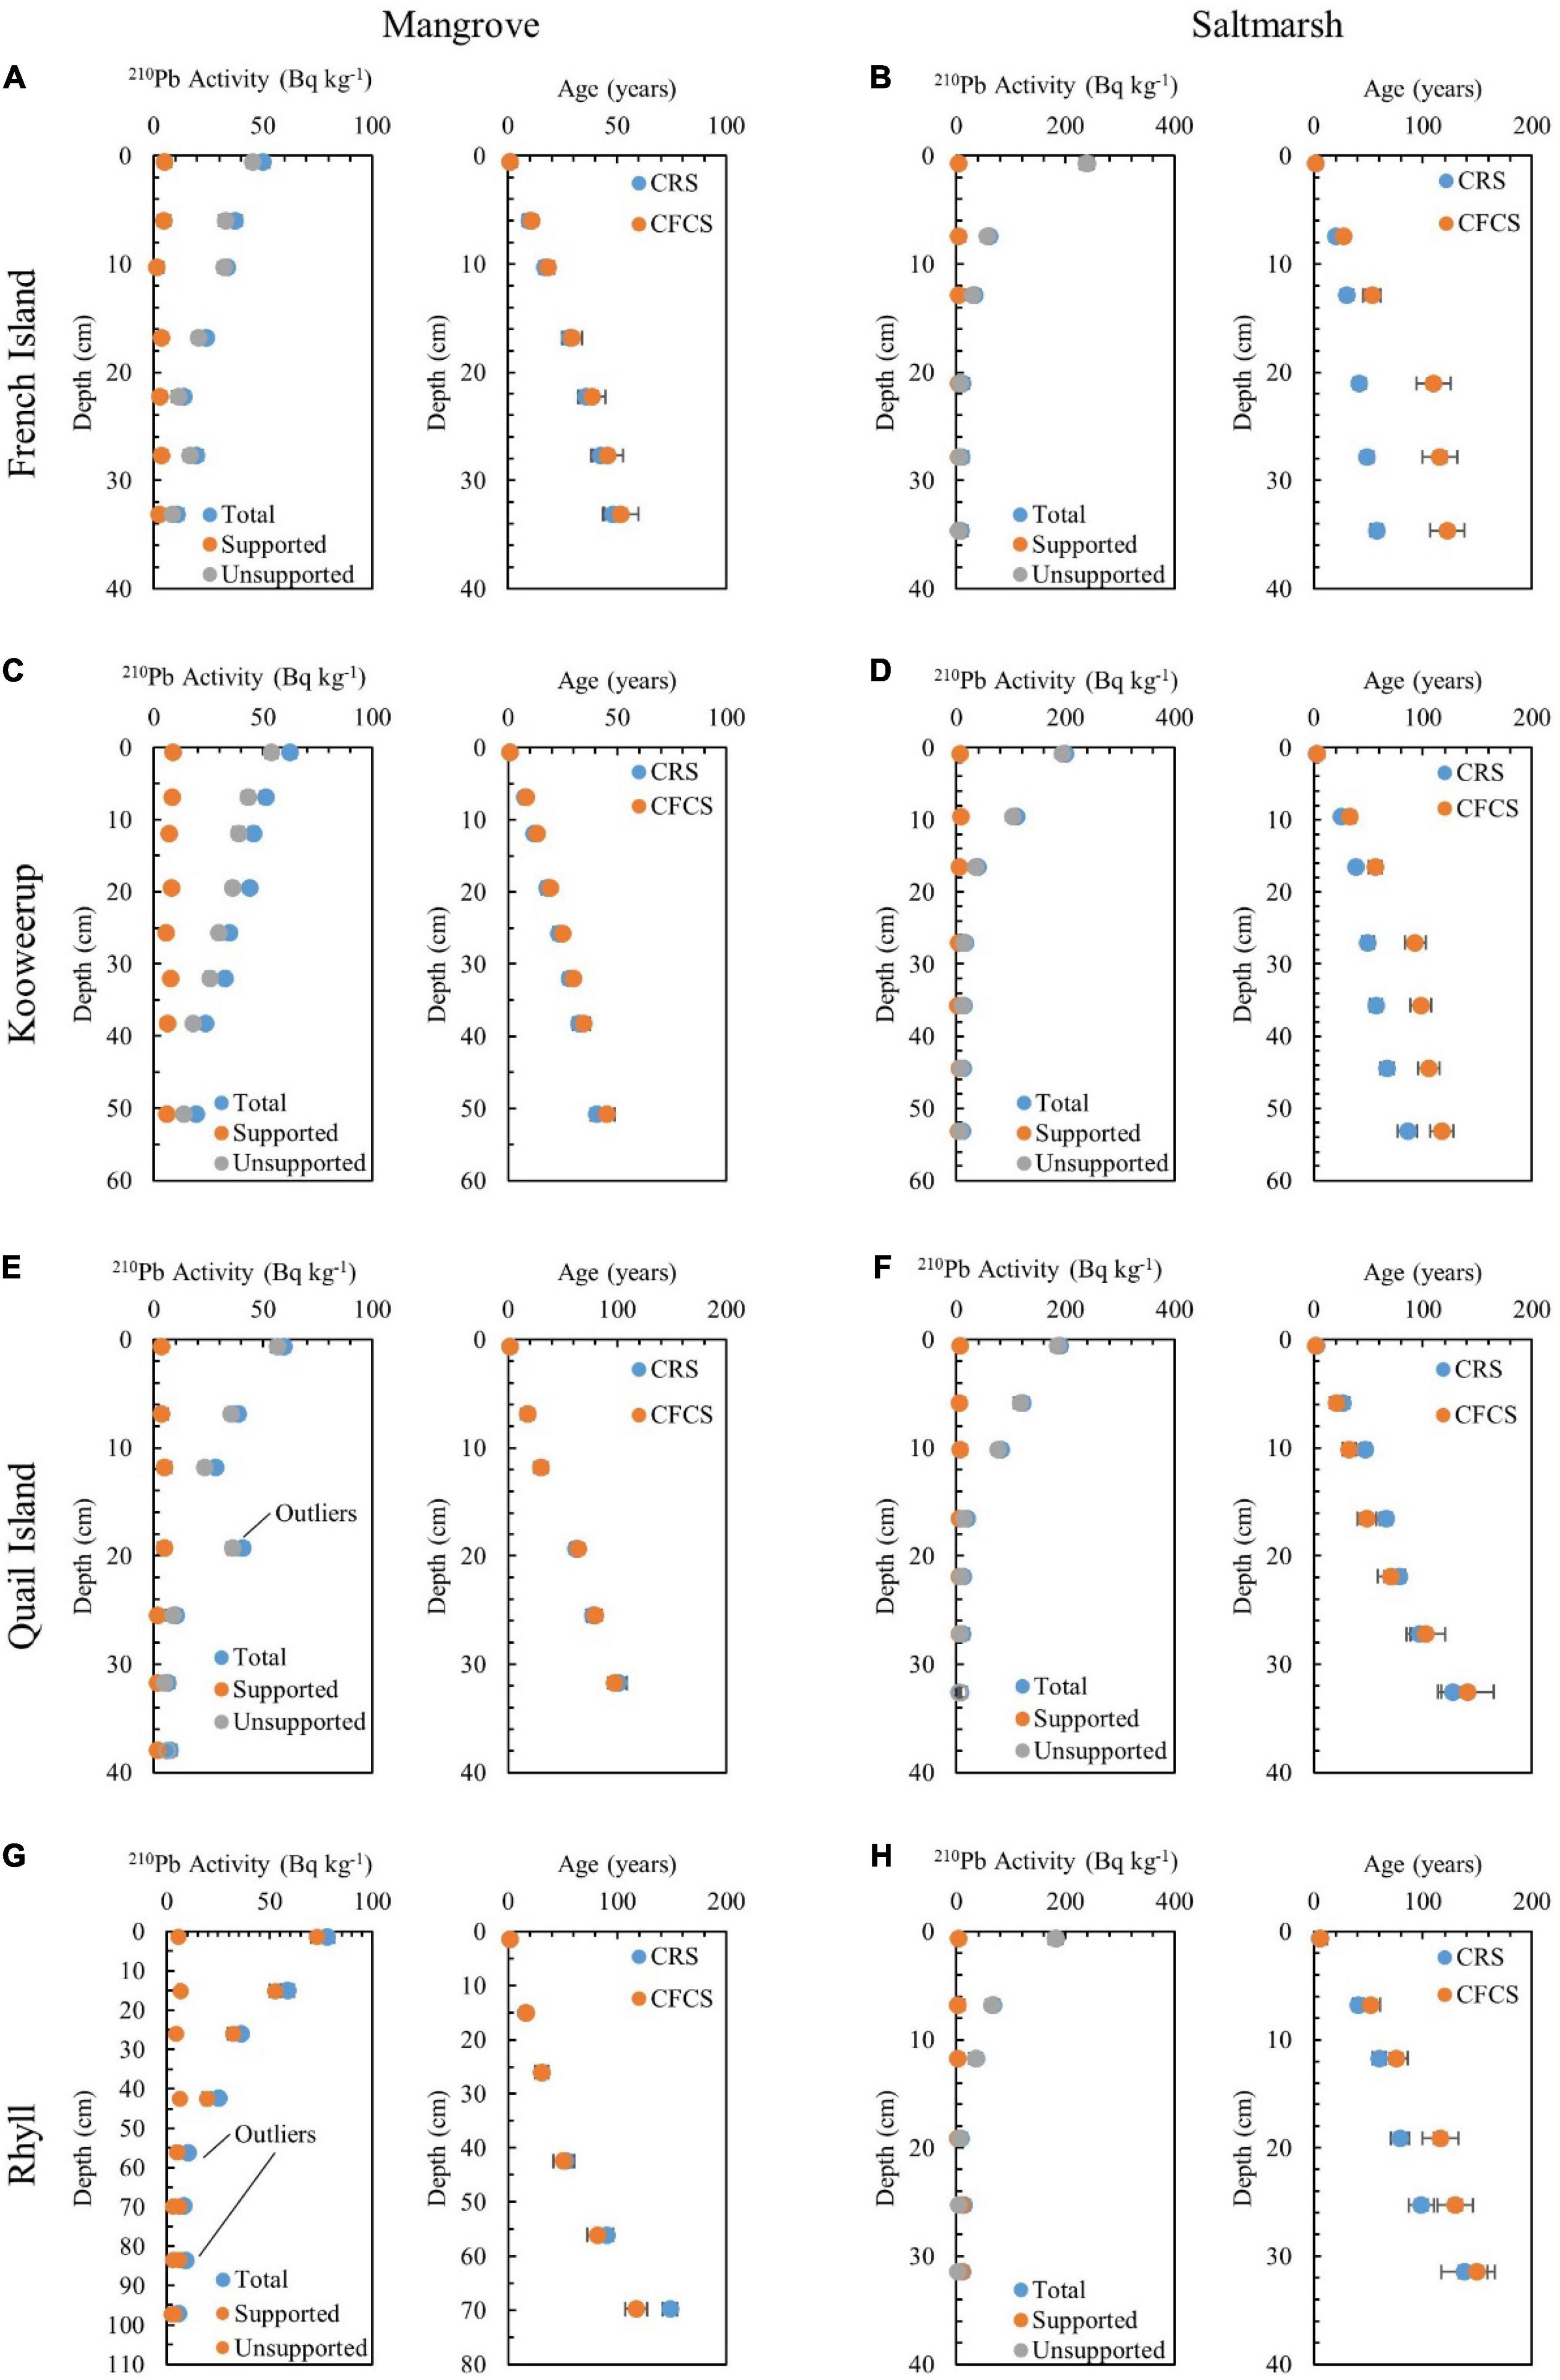
Figure 4. 210Pb activity and geochronological age of sediments at time of deposition down cores extracted from the mangrove and saltmarsh zones at (A,B) French Island, (C,D) Kooweerup, (E,F) Quail Island, and (G,H) Rhyll.
For all cores, except the mangrove cores at Kooweerup and Rhyll, incremental rates of sedimentation derived from 210Pb chronologies corresponded to rates of vertical accretion derived from nearby MH over the same time period (Figure 5). For mangrove cores at both Kooweerup and Rhyll, rates of sedimentation derived from 210Pb chronologies were approximately twice the amount detected using the MH technique; these differences may arise from known limitations associated with determining accretion using MH, which are prone to bioturbation, erosion, and dispersal. General agreement between sedimentation rates derived from 210Pb chronologies and MH data provided confidence in both estimates of vertical accretion derived from MH and sedimentation using 210Pb chronologies.
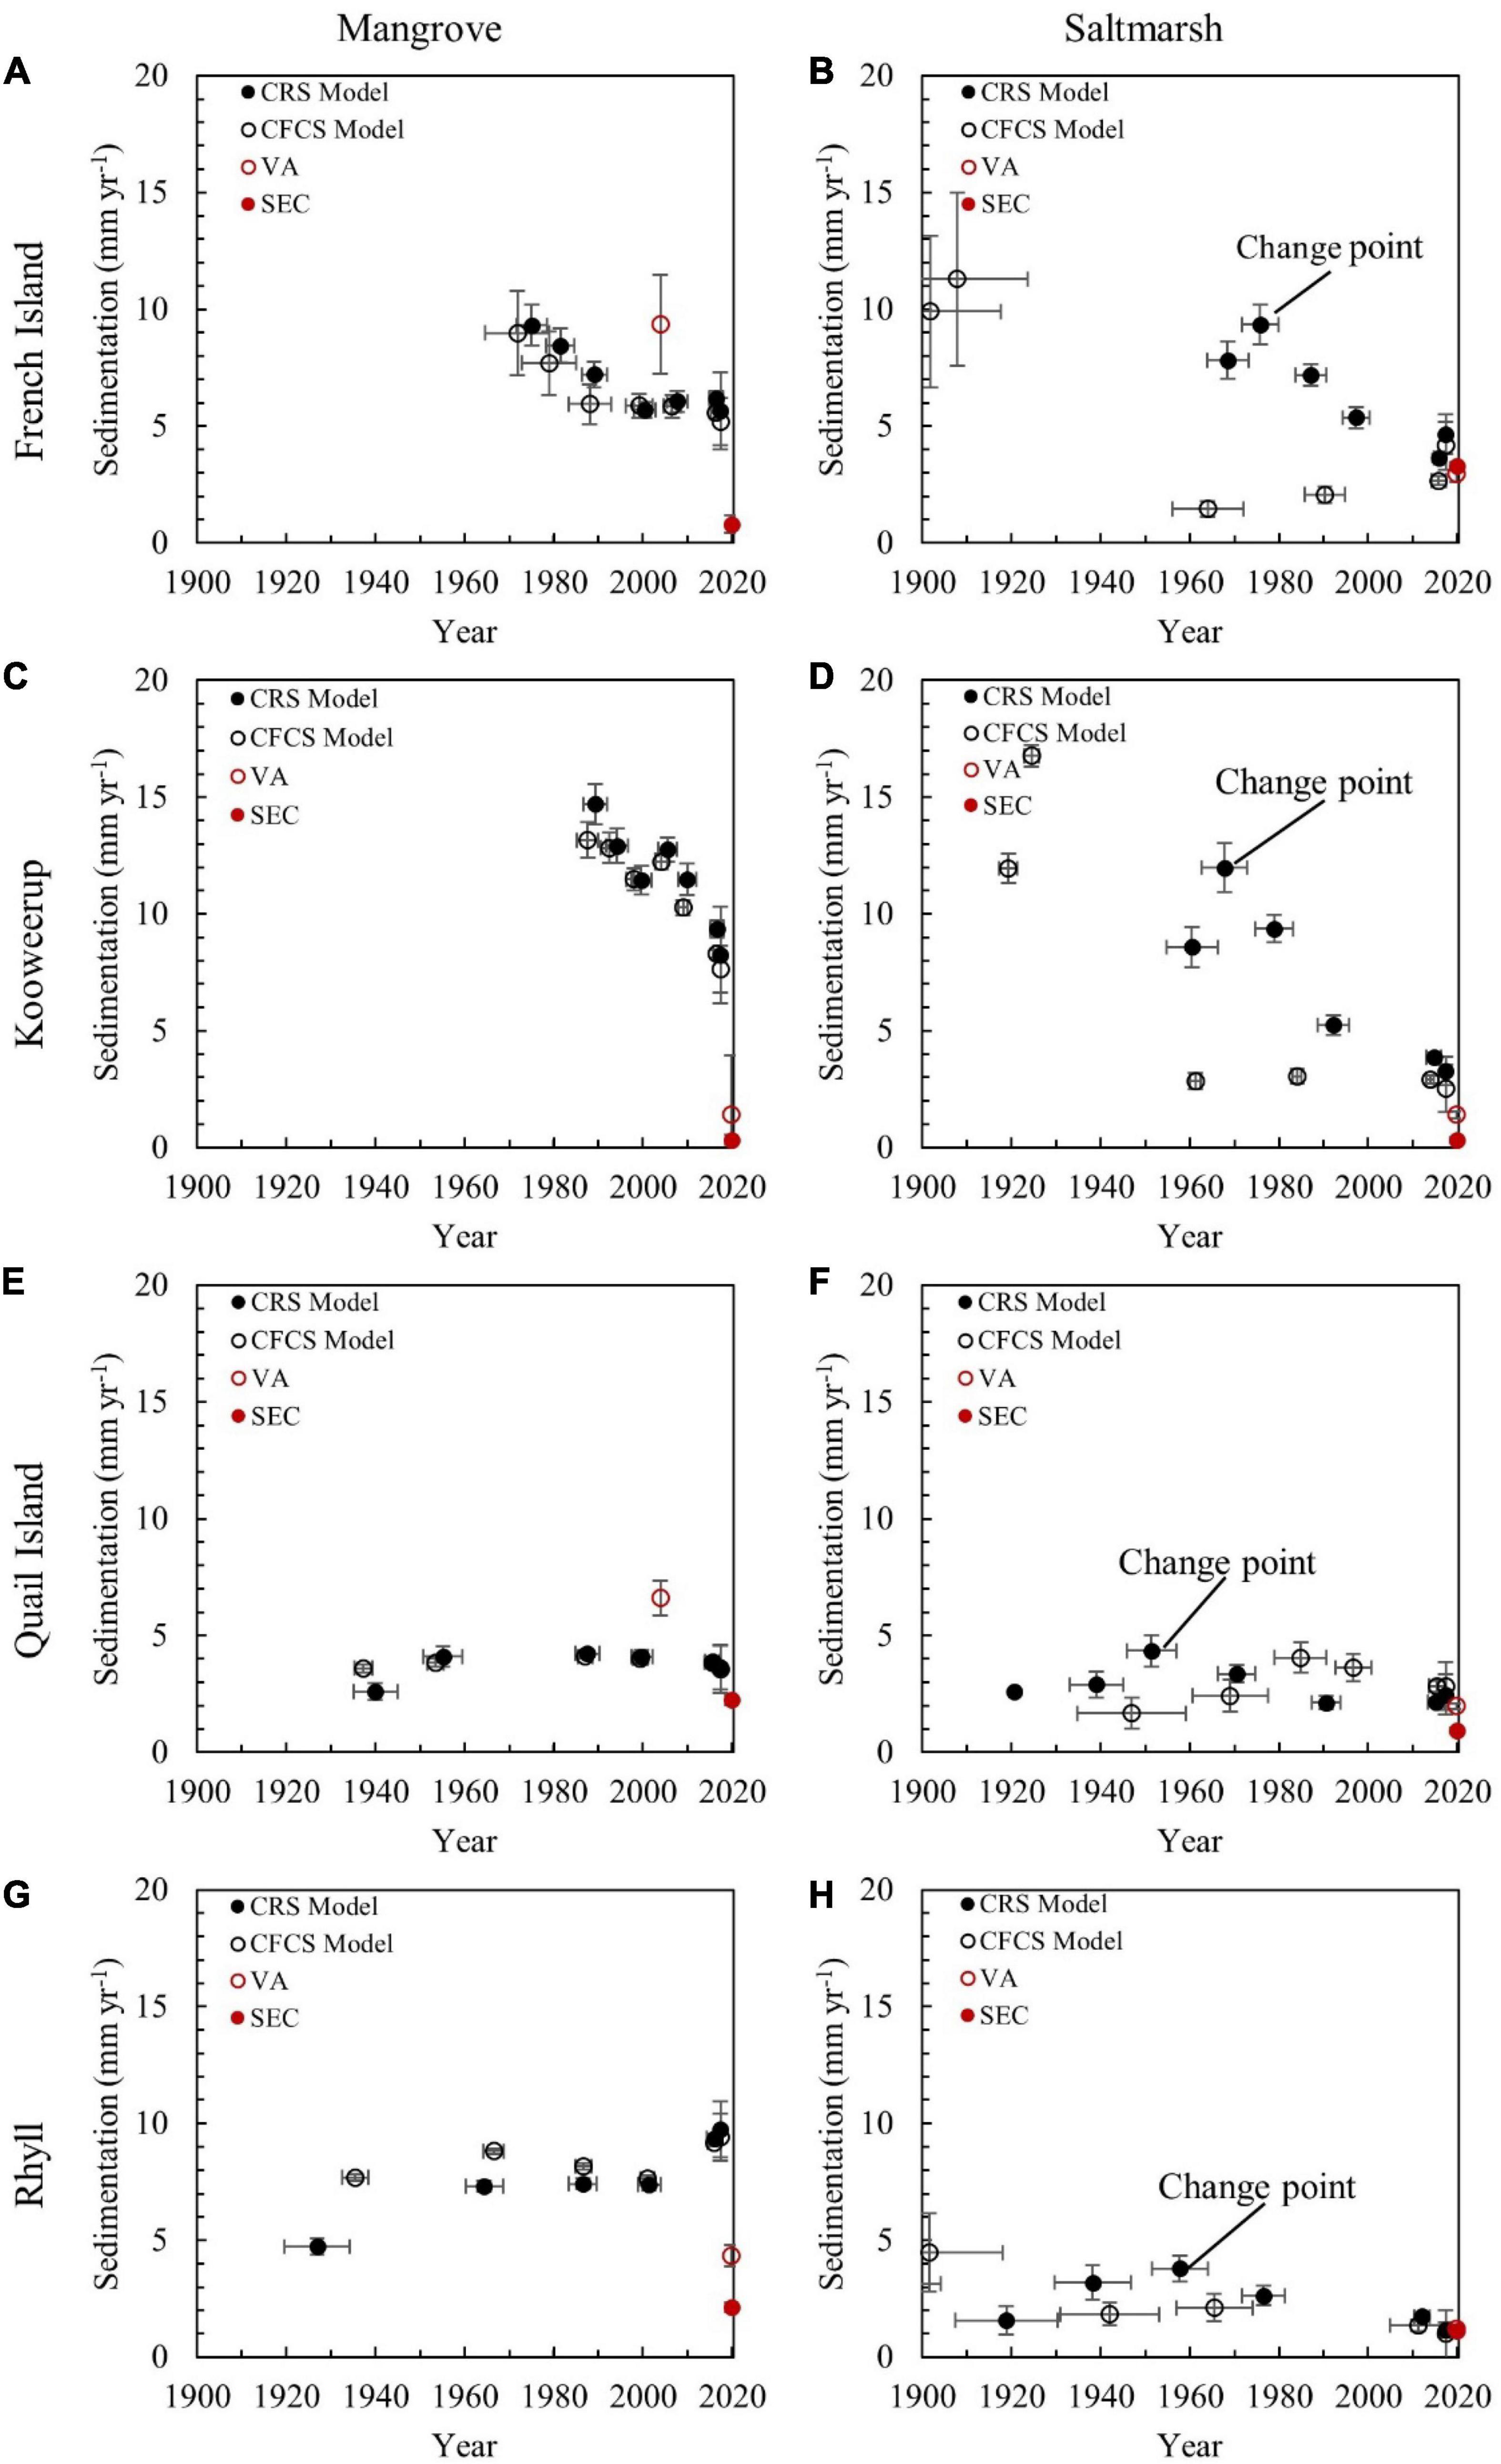
Figure 5. Reconstructed sedimentation rates over time from the mangrove and saltmarsh zones at (A,B) French Island, (C,D) Kooweerup, (E,F) Quail Island, and (G,H) Rhyll. Sedimentation rates were validated against vertical accretion (VA) and surface elevation change (SEC) determined at the adjacent SET-MH monitoring station.
Sedimentation rates ranged between a maximum of 15 ± 0.88 mm year–1 in the mangrove zone at Kooweerup to a minimum of 1.2 ± 0.34 mm year–1 in the saltmarsh zone at Rhyll. Sedimentation rates were typically higher in mangrove cores than saltmarsh cores at each study site but exhibited differences between sites. Deceleration of sedimentation was evident over the past 40–60 years in the mangrove and saltmarsh at French Island and Kooweerup, and the saltmarsh at Quail Island and Rhyll (Figures 5A–D,F,H). In all saltmarsh cores, deceleration followed an initial period of acceleration in sedimentation. Change point detection confirmed this same pattern in sedimentation occurring within all saltmarsh cores. The inflection between phases of acceleration and deceleration in saltmarsh cores occurred in the mid-20th century between 1951 (Quail Island) and 1975 (French Island). Contrasting other cores, acceleration in sedimentation was evident over the past 100 years in the mangrove at Rhyll (Figure 5G), and sedimentation rates remained relatively stable in the mangrove at Quail Island (Figure 5E). Given the considerable temporal variability in sedimentation, mean rates have not been reported as they provide little indication of realistic sedimentation over time.
Reconstruction of surface elevations with respect to accommodation space at each study site provides additional context to the conditions under which patterns of acceleration and deceleration occurred (Figures 6A–D). Deceleration was associated with surface elevations increasing and accommodation space becoming increasingly limited; that is surface elevations were higher in the tidal frame when sedimentation rates decelerated. Surface elevations, particularly in the mangrove and saltmarsh at French Island and Kooweerup (Figures 6A,B), were approaching the maximum elevation of inundation, and sedimentation was likely facilitated by high rates of sediment supply at these locations combined with lower hydrodynamic energy, as indicated in various models (Harris et al., 1979; Water Technology, 2014a). As accommodation space becomes increasingly limited in the saltmarsh, negative feedbacks between sedimentation and inundation, evident by consistent patterns of initial acceleration and subsequent deceleration, may indicate transition toward a dynamic equilibrium of surface elevations with respect to available accommodation space. In contrast, the mangrove at Rhyll has undergone relatively rapid accumulation of sediment as considerable accommodation space remains available and substrates continue to transition to higher intertidal positions (Figure 6D).
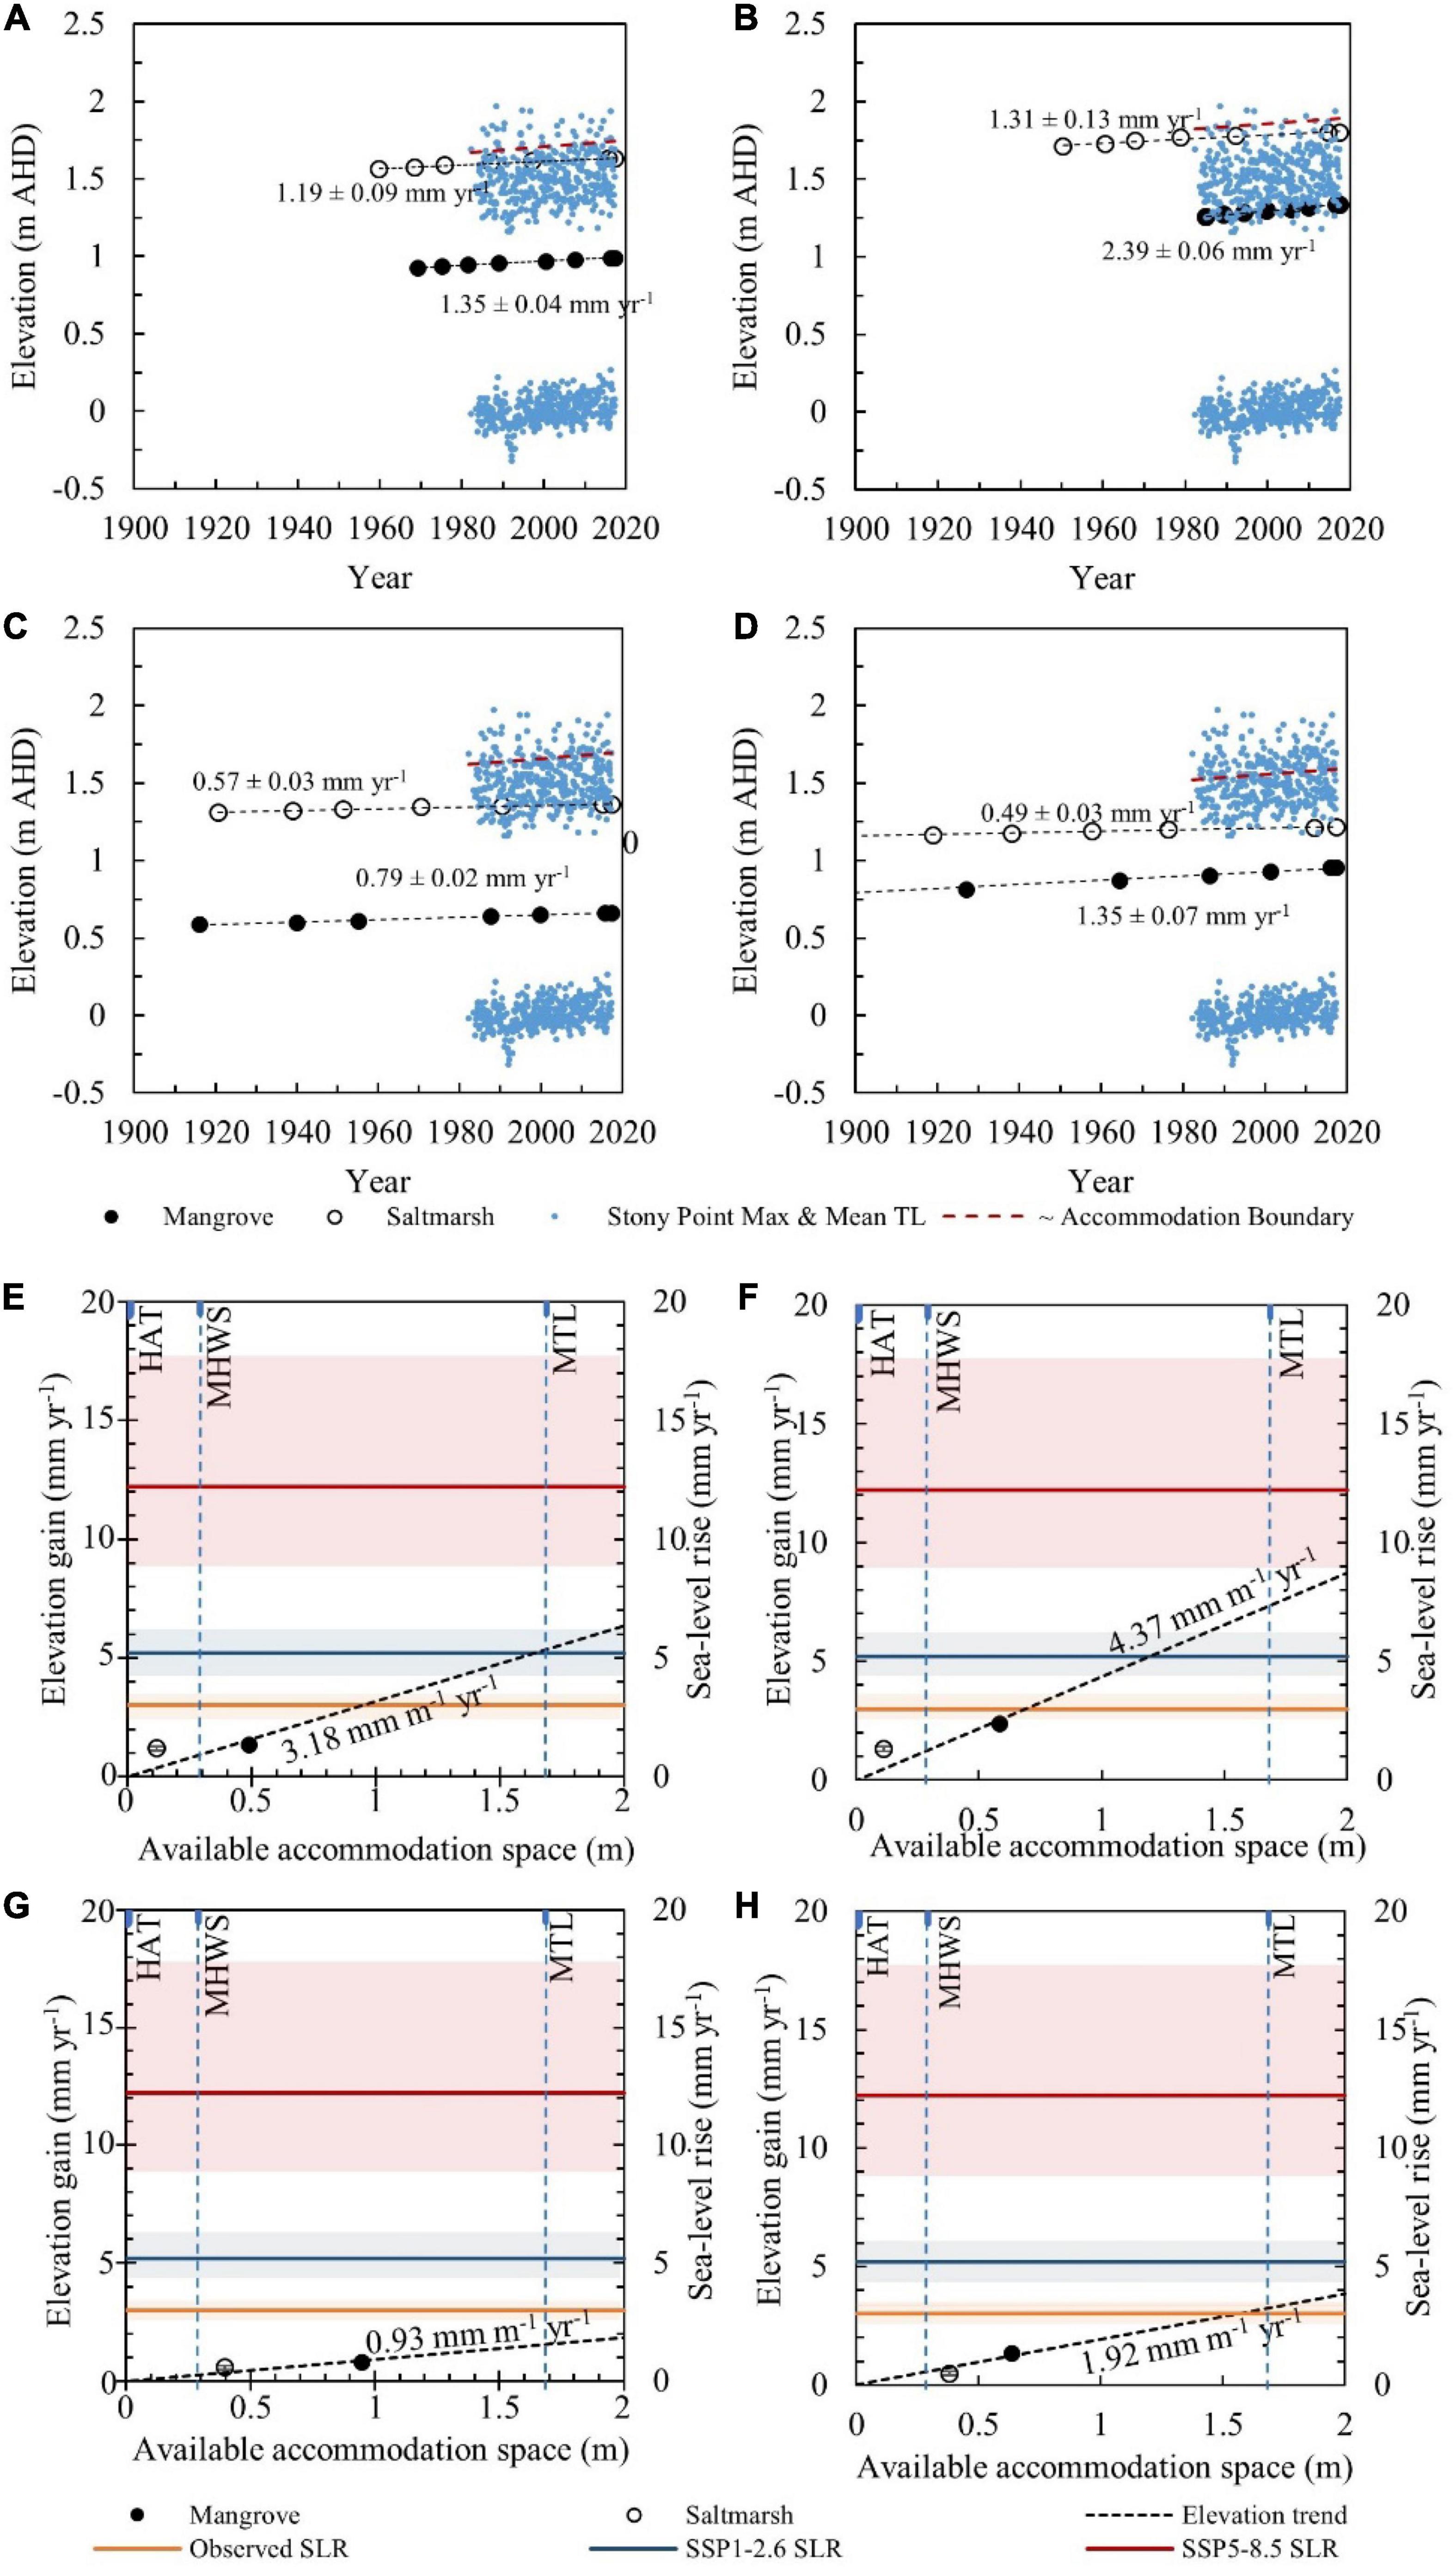
Figure 6. Stony Point water levels, modeled upper boundary of accommodation space (based on amplification factor in Supplementary Figure 2) and reconstructed surface elevations (based on autocompaction relationship in Supplementary Figure 1) within the mangrove and saltmarsh zones at (A) French Island, (B) Kooweerup, (C) Quail Island, and (D) Rhyll; and relationship between surface elevation gain and available accommodation space at (E) French Island, (F) Kooweerup, (G) Quail Island, and (H) Rhyll. Observed rates and projected rates of SLR have been included for comparison of accommodation space dependent sedimentation rates in panels (E–H).
Rates of surface elevation gain per unit of available accommodation space were highest at Kooweerup (4.37 mm m–1 year–1), followed by French Island (3.18 mm m–1 year–1), Rhyll (1.92 mm m–1 year–1), and Quail Island (0.93 mm m–1 year–1) (Figures 6E–H). These rates of surface elevation gain influenced the position at which elevation gain matched SLR; as such, this occurred at a higher position in the tidal frame where there was less available accommodation space at Kooweerup (Figure 6F), whilst there was no location within the vegetated intertidal zone at Quail Island (Figure 6G) where rates of surface elevation gain matched observed or projected SLR scenarios.
Based on current rates of SLR of 3.0 mm year–1, it was estimated that equilibrium occurred where there was 0.7 m of available accommodation space at Kooweerup, 0.9 m at French Island and 1.6 m at Rhyll (Table 1). The depth below the upper boundary at which equilibrium occurred at Quail Island was 3.2 m. It is noted this is below MTL and not within the vegetated intertidal zone. The equilibrium available accommodation space, or depths below the upper boundary where the rate of surface elevation gain matched the rate of SLR, transitioned to lower elevations as the rate of SLR increased. Standardized rates of surface elevation gain were used to estimate rates of surface elevation gain at MTL and subsequently compared to observed rates of SLR to indicate whether shoreline building processes were significant; if so, it was expected that shoreline progradation would be evident within aerial photography.
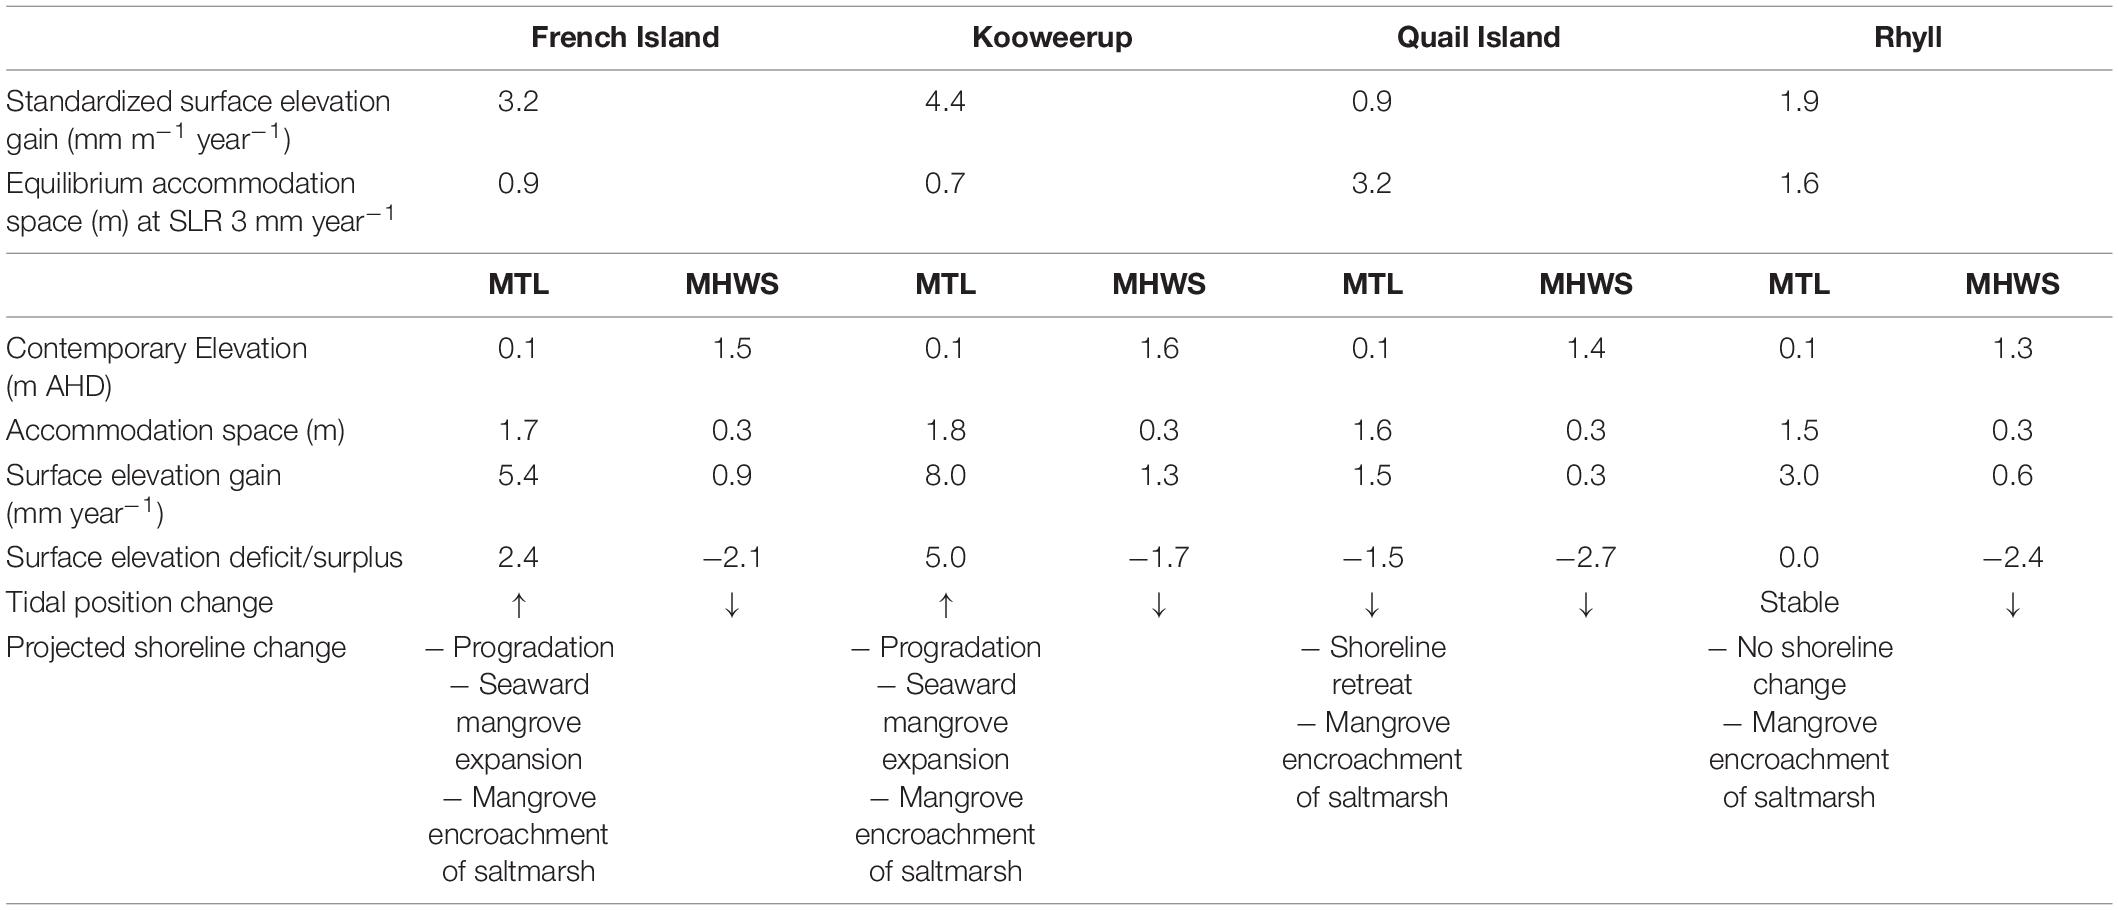
Table 1. Standardized rates of surface elevation gain (mm per meter of available accommodation space per year), derived from linear regression analyses in Figure 6; projected equilibrium available accommodation space where rates of surface elevation gain equal observed rates of sea-level rise (SLR) (3.0 mm year–1), derived from intersection of linear regression and observed SLR in Figure 6; contemporary elevation and estimated available accommodation space at mean tide level (MTL) and mean high water springs (MHWS); projected rate of surface elevation gain, derived from intersection of linear regression and vertical dashed lines in Figure 6 indicating MTL and MHWS; projected elevation deficit/surplus, derived from the difference between rates of surface elevation gain and observed rate of SLR; projected change in tidal position, based on evidence of a surface elevation deficit or surplus; and projected shoreline change at MTL and MHWS at each study site.
Changes to shoreline position, inferred from time-series analysis of vegetation distribution changes, validated projected changes to shoreline position. More specifically, at Kooweerup and French Island, as rates of surface elevation gain at MTL (Table 1) exceeded observed rates of SLR, shoreline progradation was projected, and this corresponded to observations of seaward mangrove expansion between 1973/74 and 2009. Progradation of the seaward mangrove boundary was in the order of ∼20 m quantified immediately seaward of the mangrove core at Kooweerup, and up to 80 m immediately east of the mangrove core (Figure 7B). Similarly, at French Island shoreline retreat was not evident within the immediate proximity of cores and progradation of up to 20 m was evident by seaward expansion of the mangrove canopy (Figure 7A). Infilling of the tidal creek immediately adjacent to the mangrove core at Rhyll may indicate progressive infilling between 1973 and 2009 or may be related to increasing mangrove crown sizes. Infilling would be associated with higher rates of surface elevation gain than was projected using standardized rates of surface elevation gain. As the elevation of MTL coincides with the position of equilibrium accommodation space, stability was projected, and this corresponds to the stability of many of the shorelines at the margins of the inlet (Figure 7D).
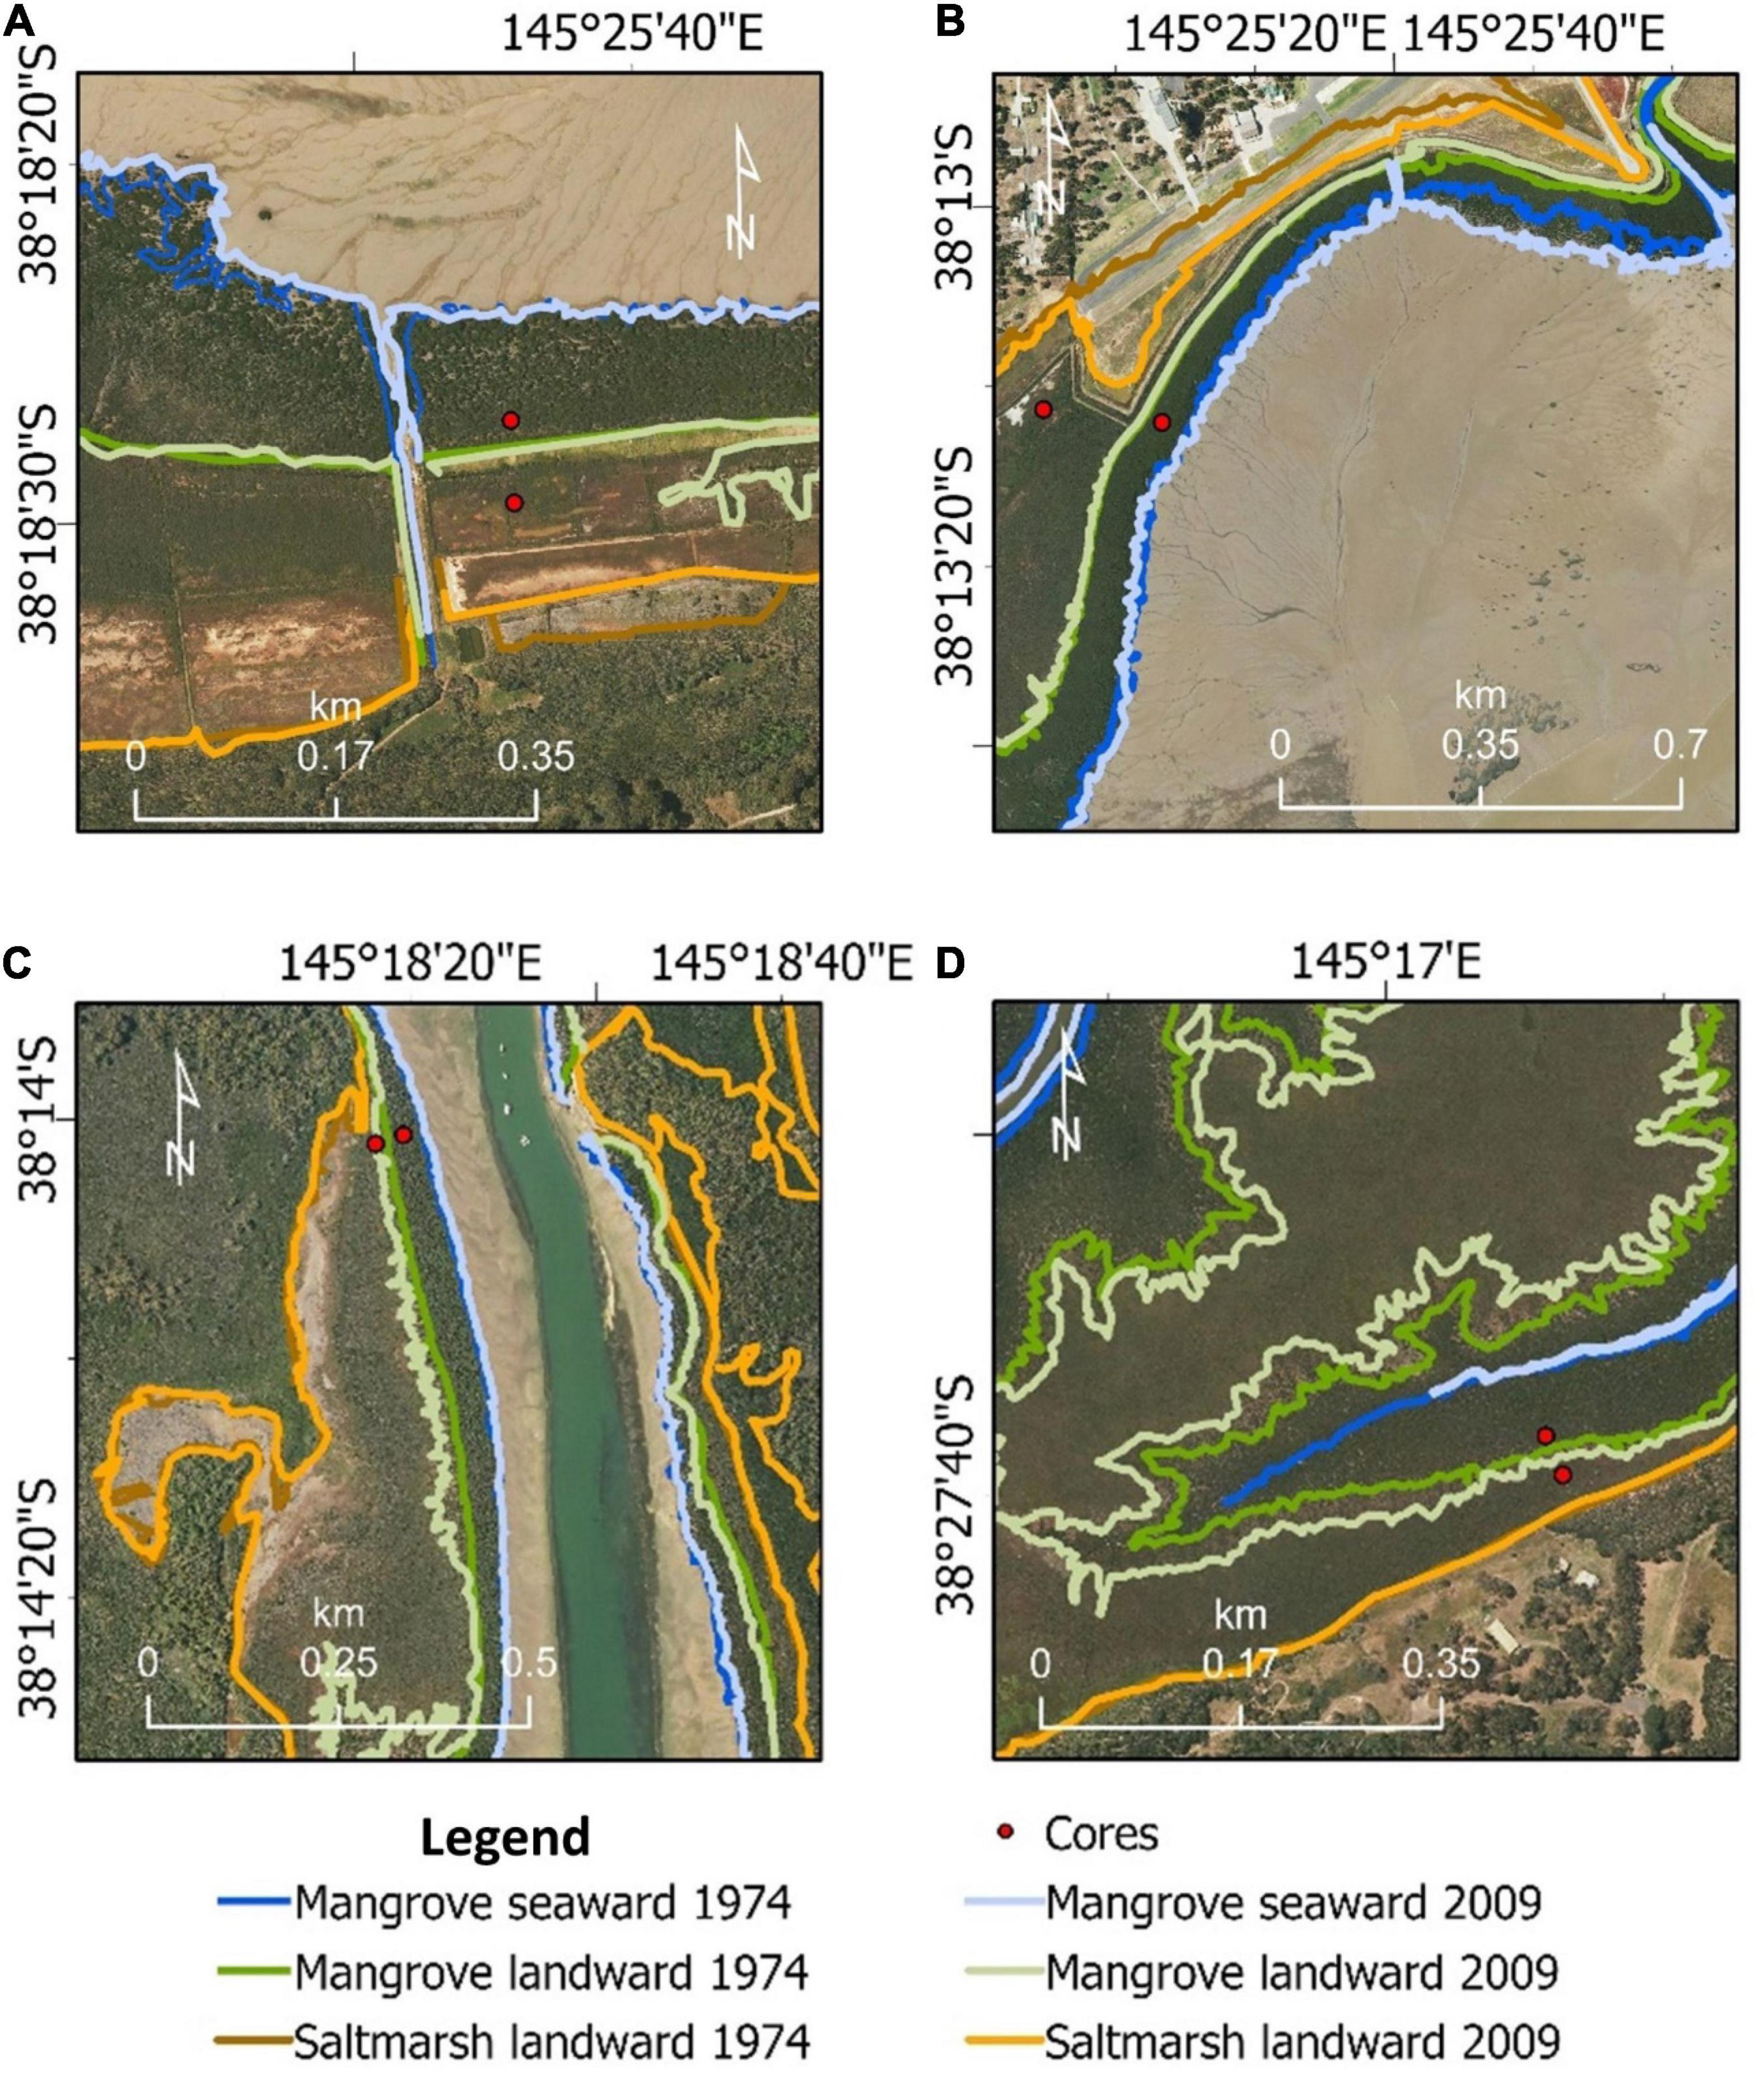
Figure 7. Mangrove seaward and landward limits and saltmarsh landward limits digitized from 1973/74 and 2009 images at (A) French Island, (B) Kooweerup, (C) Quail Island, and (D) Rhyll. Notable shoreline progradation and mangrove expansion into saltmarsh is indicated. See Supplementary Figures 3–6 for time-series maps.
The change in position of the seaward limit of mangrove vegetation at Quail Island, within the vicinity of the mangrove core, was less than 4 m (Figure 7C). This very modest increase likely relates to the increasing crown size as trees matured along the shoreline. Mature crown sizes along the shoreline were evident in 2009 imagery, and there was an absence of juvenile mangroves seaward of the mature trees. Low rates of sedimentation and surface elevation gain at Quail Island indicated that retreat may be expected, but it is probable that this could be delayed given the maturity and resilience of mangrove trees along this shoreline.
As the equilibrium elevation at all locations was projected to be below MHWS, landward encroachment of mangrove into saltmarsh was projected and this was confirmed at all study sites. Whilst the degree of lateral encroachment is dependent upon the slope of the saltmarsh, it remains informative that the degree of lateral encroachment is lower where standardized rates of surface elevation gain were higher (i.e., <5 m lateral encroachment at French Island, 5 m at Kooweerup) and more pronounced where rates were lower (i.e., 12 m at both Quail Island and Rhyll).
Under a low projected SLR scenario, shoreline progradation may continue at Kooweerup and French Island; however, despite high rates of sediment supply and deposition, shoreline resilience will not be maintained under a high SLR scenario (Table 2). At Rhyll and Quail Island, shoreline retreat is anticipated under all projected SLR scenarios. As the rate of surface elevation gain at MHWS is less than median projected rates of SLR at all study sites, mangrove encroachment of saltmarsh is likely, and saltmarsh will become increasingly restricted to elevations beyond their contemporary distribution.
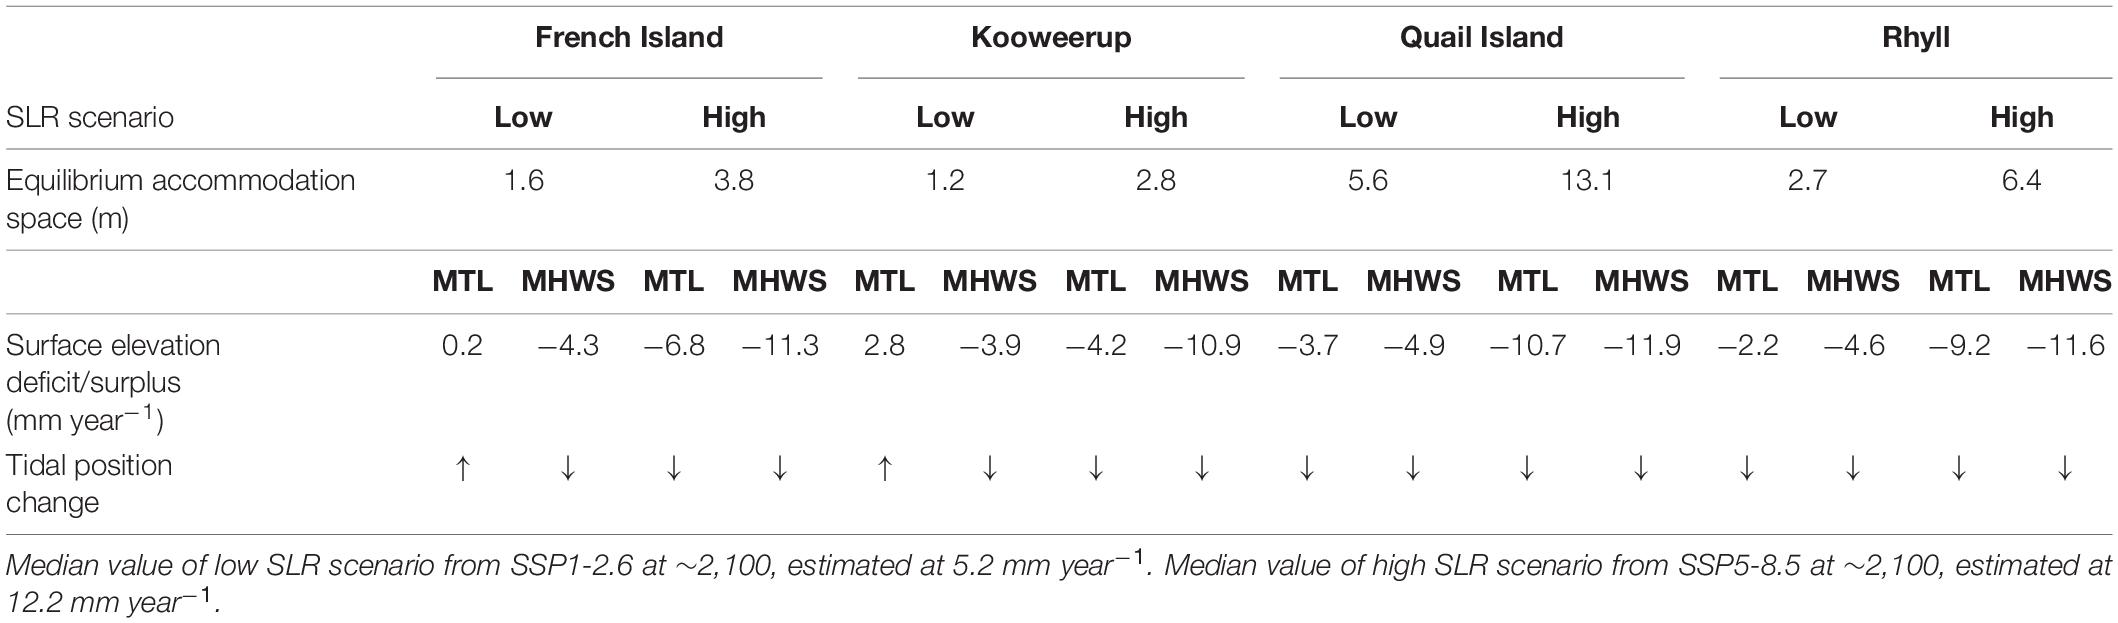
Table 2. Projected equilibrium accommodation space (or depth below the upper boundary of accommodation space) where rates of surface elevation gain equal projected sea-level rise (SLR) based on median values of a low and high SLR scenario, projected surface elevation deficit/surplus, and tidal position change at mean tide level (MTL) and mean high water springs (MHWS).
Sedimentation rates ranged from 1.2 to 15 mm year–1 and at each study site sedimentation rates were typically higher where there was more accommodation space (i.e., in the mangrove zone) than where accommodation space was becoming exhausted (i.e., in the saltmarsh). Acceleration in sedimentation rates at each core location occurred when more vertical accommodation space was available whilst deceleration occurred when surface elevations were high in the tidal frame and accommodation space was becoming limited. High sedimentation rates and acceleration in sedimentation was dependent upon rates of sediment supply and favorable conditions for deposition, with mean deposition rates found to be highest at Kooweerup, followed by French Island, Rhyll, and Quail Island (Table 3). By accounting for autocompaction of sediments, standardized rates of surface elevation gain were established; critically, these rates were different between study sites, indicating significant variation in hydrodynamic energy, sediment supply, sedimentation, and surface elevation gain across Westernport Bay.
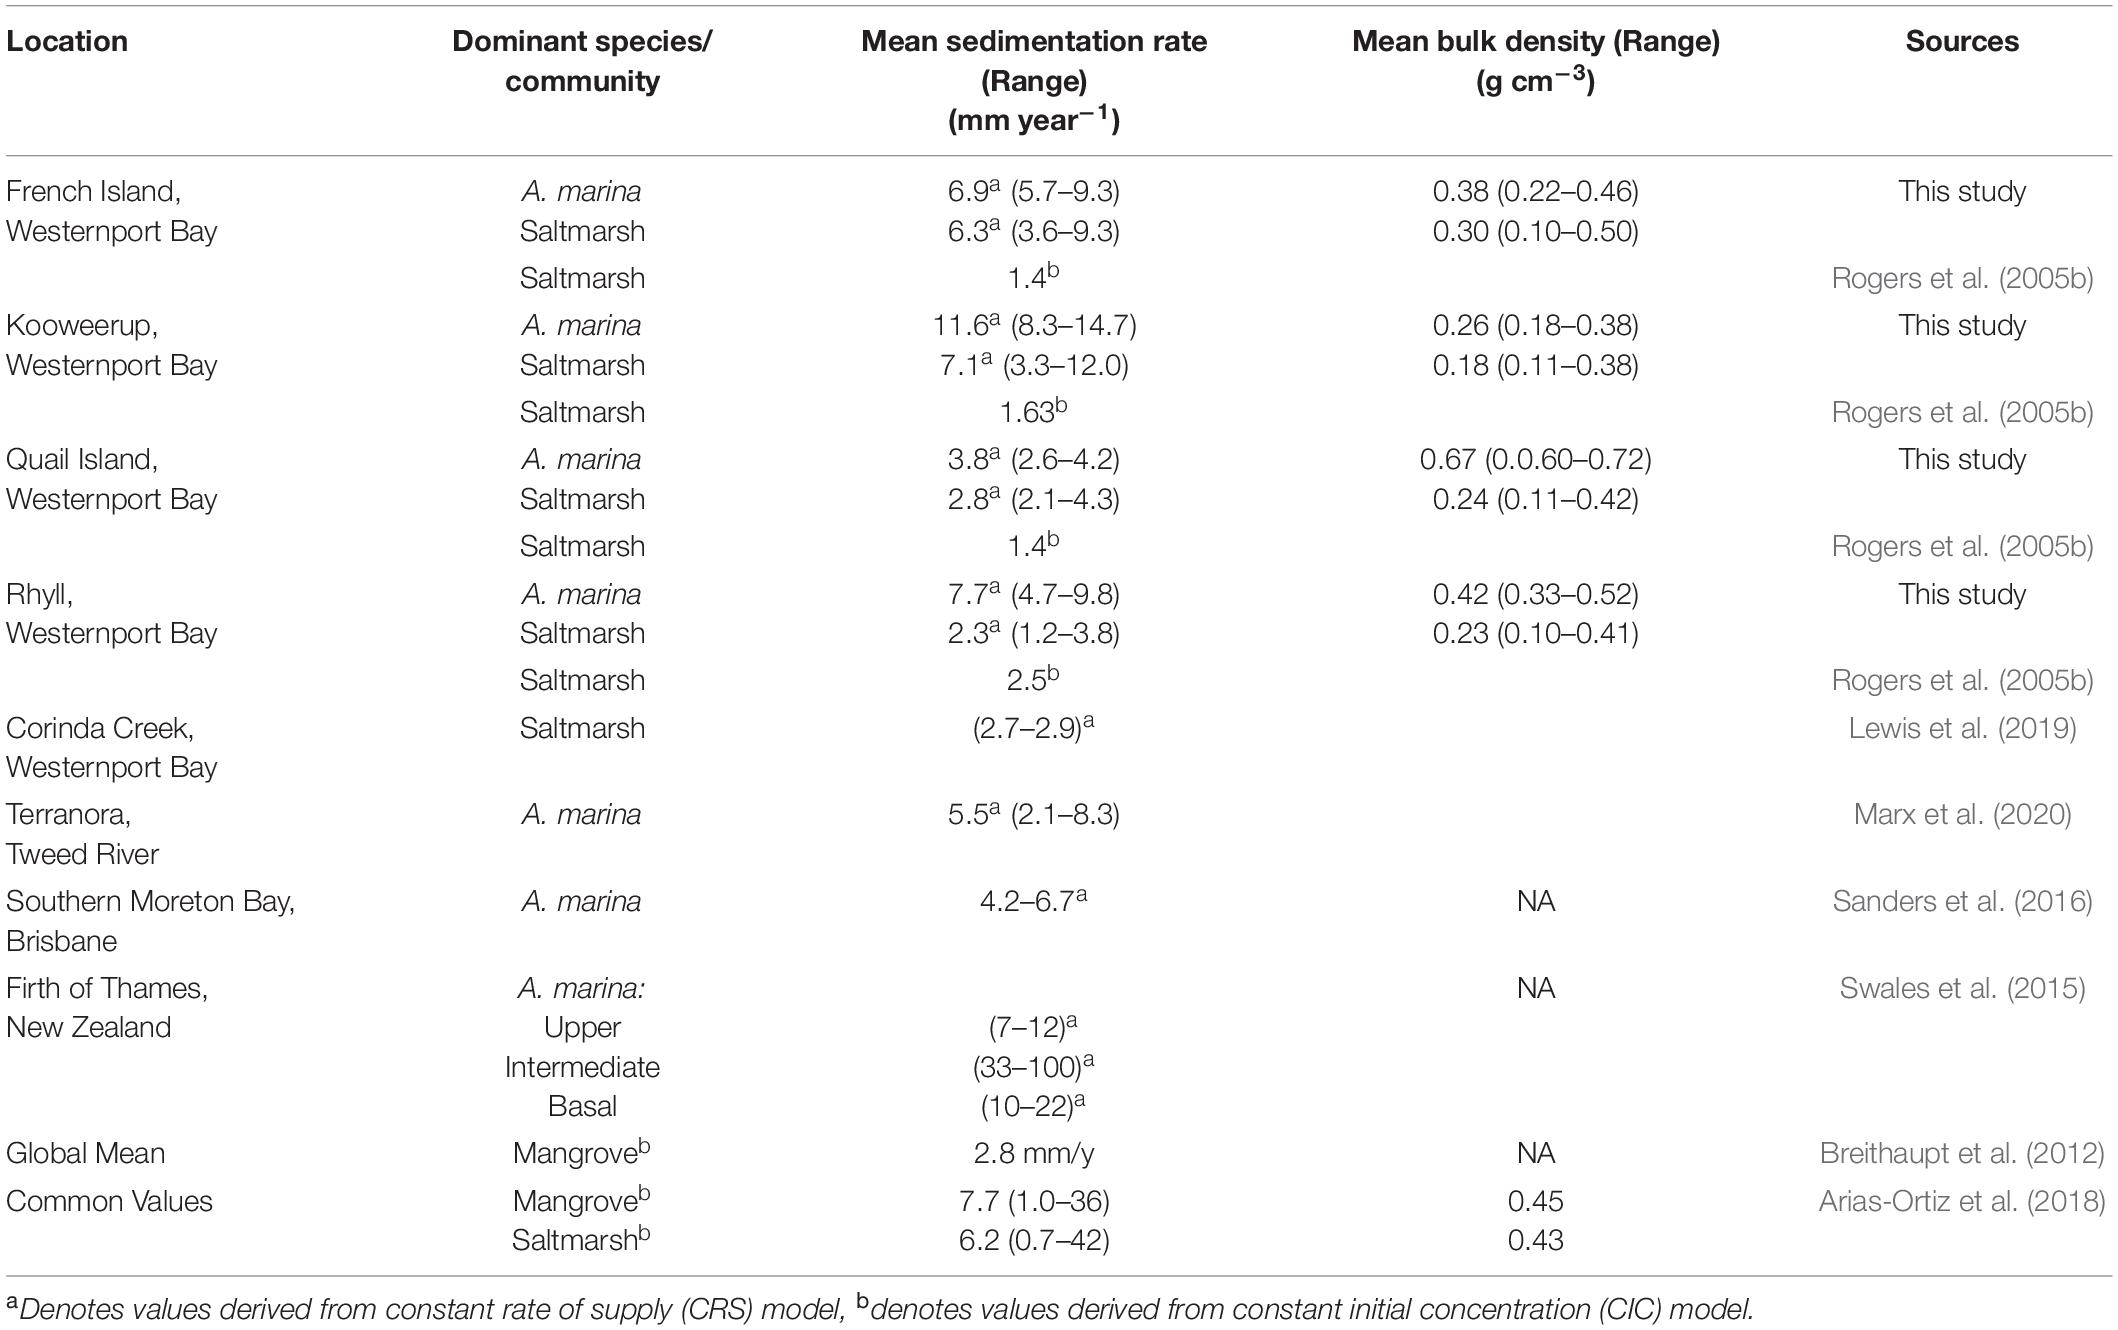
Table 3. Sedimentation rates derived from 210Pb geochronology for similar ecosystems in Australia and New Zealand, and reported global averages and common values.
A range of factors may influence the spatial variation in the observed relationship with sedimentation. Sediment supplied to Westernport Bay largely arises from hillslope, gully, and riverbank erosion occurring in the sub-catchments located on the northeastern shorelines of Westernport Bay (Bunyip River, Cardinia Creek, Lang Lang River, Yallock Creek, and Bass River) and is reportedly in the order of 156 kt year–1 (Hughes et al., 2003). Of this supply, approximately 96 kt year–1 is estimated to be exported from catchments to Westernport Bay for deposition. Suspended sediment and bedload yields have been modeled using the Revised Universal Soil Loss Equation (RUSLE). Sediment yield was reported to be greatest from Lang Lang River (0.47 t ha–1 year–1), Bass River (0.30 t ha–1 year–1) and Bunyip River (0.25 t ha–1 year–1), and least for Yallock Creek (0.21 t ha–1 year–1) and Cardinia Creek (0.15 t ha–1 year–1). Bedload export is reported to be greatest from Bunyip River (0.18 t ha–1 year–1), Lang Lang River (0.14 t ha–1 year–1) and Bass River (0.08 t ha–1 year–1), and least for Yallock Creek (0.07 t ha–1 year–1) and Cardinia Creek (0.05 t ha–1 year–1) (Hughes et al., 2003). The Bunyip River, has the largest sub-catchment area (890 km2) and contributed the greatest bedload yield; however, suspended sediment yield was greatest from the Lang Lang River which has a markedly smaller sub-catchment area (423 km2). These differences may arise from the varying degrees of hillslope, bank, and gully erosion in each of the sub-catchments. Despite high bedload and suspended sediment supply from these tributaries, it is not sufficient to offset the prolonged erosion of peats and shoreline retreat occurring where these tributaries enter Westernport Bay. Fetch-based waves generated by prevailing westerly winds ensure that the northwestern shoreline remains a source of sediment and contributes to subaerial sedimentation. Accordingly, active cliff erosion occurs due to direct exposure to wave action during high tides and storms (Water Technology, 2014b).
Analyses of subaerial sediment redistribution within Westernport Bay confirm movement of sand and mud along the Upper North Arm toward depositional basins within the vicinity of the French Island and Kooweerup study sites (Harris et al., 1979), where deposition is reported to be approximately 55 mm year–1 (Hancock et al., 2001). Sediment supply to Rhyll is limited by the prevailing transport of sediment away from Rhyll and along the Eastern Arm to the depositional basin east of Rhyll Inlet, where deposition is reported to be 50 mm year–1. Bathymetry along the Upper North Arm indicates that lateral accommodation space suitable for shoreline progradation is broad and low gradient mudflats dominate seaward of the latter sites (Figure 8). Indeed, recent imagery confirms active colonization of mudflats at Kooweerup and French Island and provides additional evidence of progradation (Figure 7). Sediment supply to the Quail Island study site is dependent upon the limited supply of sediment from catchments entering the western side of the bay or supply from Cannons Creek. Prior hydrodynamic modeling (Lee, 2011; Water Technology, 2014a,b) indicates conditions that promote sediment transport occur along Cannons Creek, the channel immediately adjacent to the Quail Island study site, whilst low energy hydrodynamic conditions prevail at Kooweerup and French Island. Given these restrictions on sediment supply to the eastern shoreline of Quail Island and high hydrodynamic energy, it is not surprising that observed sedimentation rates were low at this location. However, analyses of shoreline change at Quail Island indicate that progradation has been occurring in the reaches of the Upper Arm where lateral accommodation space remains available and sediment supply is not restricted by higher hydrodynamic energy. Conversely, high sedimentation rates at the remaining sites were facilitated by favorable hydrodynamic conditions and higher rates of sediment supply.
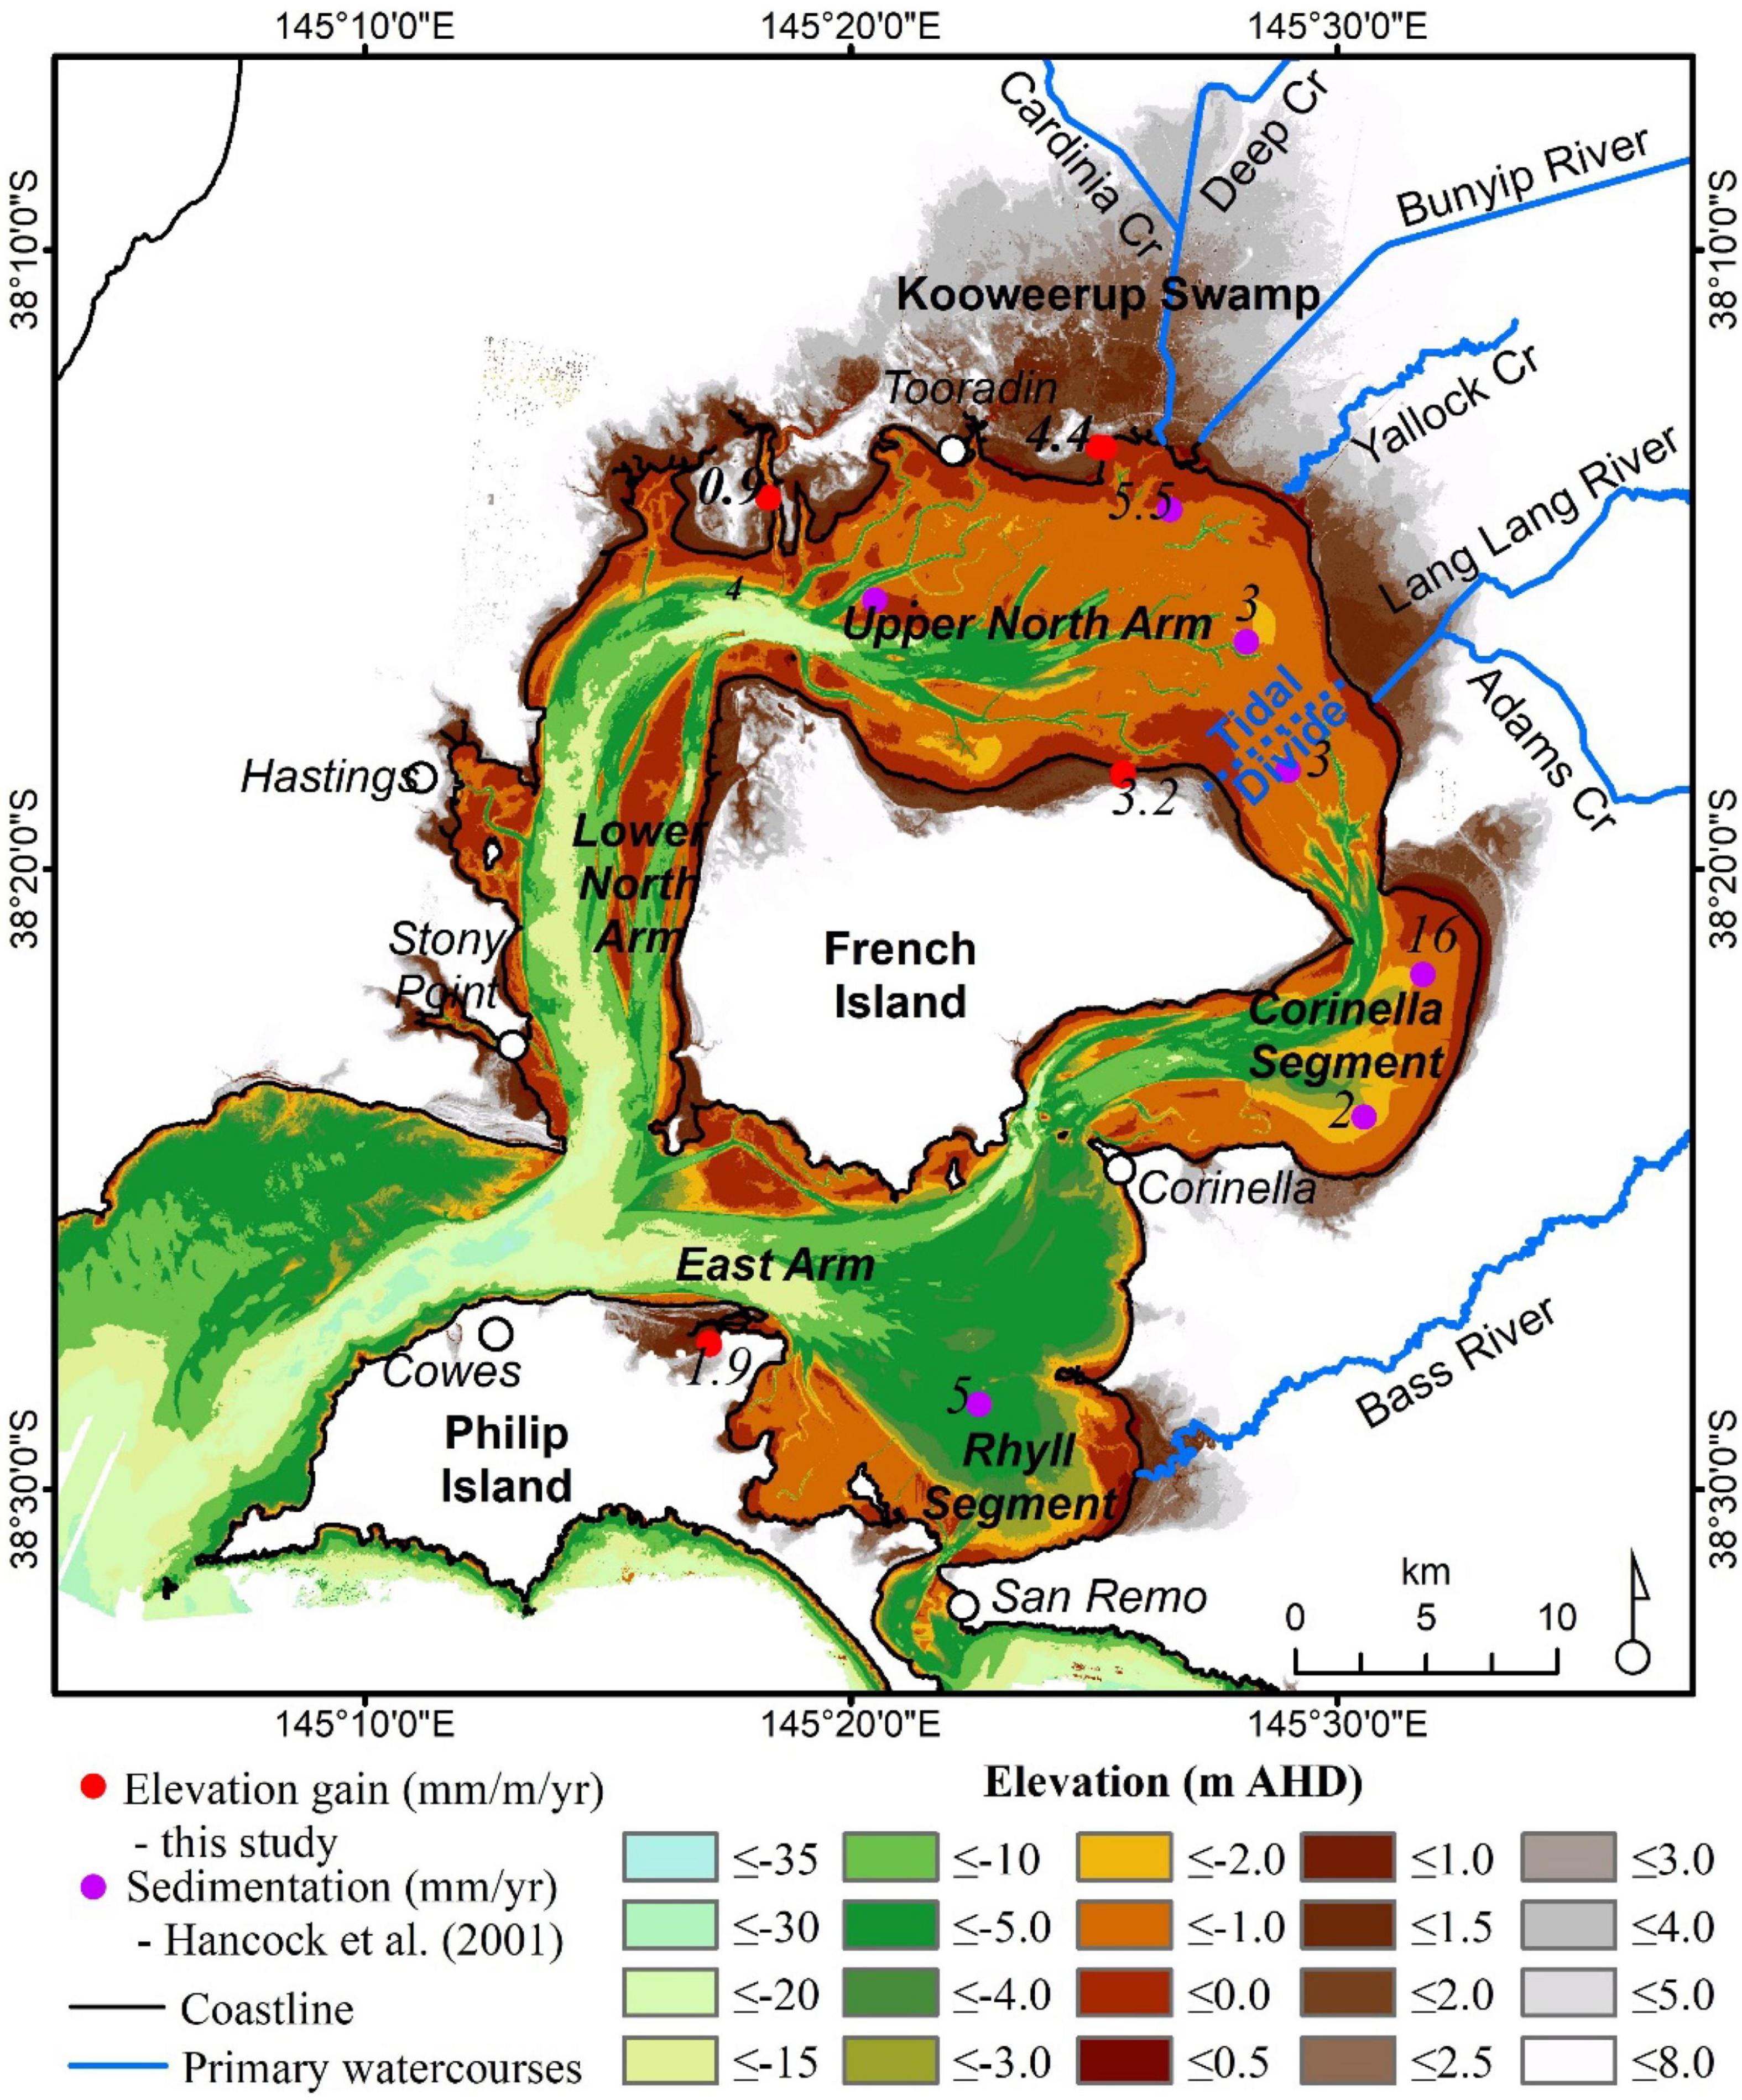
Figure 8. Elevation and bathymetry of Westernport Bay, water circulation, and sedimentary basins in the Upper North Arm, Corinella Segment, and Rhyll Segment. Sedimentation rates detected in this study and within the sedimentary basins by Hancock et al. (2001) also indicated.
Rates of sedimentation reported in this study are reasonably high and, in most cases, well-beyond the average rates reported for mangroves (Breithaupt et al., 2012), but within the range observed elsewhere (Arias-Ortiz et al., 2018) (Table 3). The pattern of acceleration in sedimentation, followed by deceleration is consistent with analyses at Firth of Thames, New Zealand (Swales et al., 2015), where excess sediment facilitated rapid infilling of accommodation space and active mangrove colonization and progradation. Given the established relationship between accommodation space, sediment supply and sedimentation rates, we suggest that comparison of sedimentation rates from one site with another site is meaningless without also controlling for available accommodation space. Whilst comparisons within an ecosystem type (i.e., comparing saltmarsh rates from one location to another) partly recognizes the influence of accommodation space on sedimentation, it may not be sufficient when ecosystems occupy a large proportion of vertical accommodation space. In particular, mangrove forests dominated by A. marina occupy a larger vertical range of available accommodation space than saltmarsh and should exhibit greater variation in sedimentation rates. This was confirmed in this study by higher peaks in sedimentation within mangrove cores than saltmarsh cores.
Despite relatively high rates of sedimentation, particularly at Kooweerup and French Island, we demonstrate that this is likely to have translated to relatively modest rates of surface elevation gain. By converting sedimentation rates into rates of surface elevation gain by adjusting for autocompaction (following Rogers and Saintilan, 2021), we were able to reconstruct surface elevations through time. Comparisons with shoreline change in aerial photography provided some confidence that reconstructions of surface elevation were valid. Validation of 210Pb chronology is typically undertaken against chronologies derived from alternative radiometric approach, such as using 137Cs concentrations; however, given the relatively short half-life and decreasing availability of 137Cs, particularly in the southern hemisphere where concentrations were initially low, efforts have now been directed toward validation using other approaches. 14C bomb-pulse analyses have been successfully applied to validate 210Pb chronology at other locations in southeastern Australia (Sanders et al., 2016; Marx et al., 2020). Given reductions in 137Cs activity, the validation approach undertaken in this study using SET-MH data and shoreline analyses from aerial photography represent reliable alternative validation approaches. This validation provides sufficient confidence to consider the combined implications of SLR and sediment supply for shoreline resilience.
The mid- to late-Holocene sea-level history for this region is one of considerable stability with evidence indicating sea level was near present levels or up to 2 m higher since about 7 ka (Sloss et al., 2007; Lewis et al., 2013; Dougherty et al., 2019). Under these conditions of relatively stable sea levels for a sustained period, surface elevations would increase toward maximum water levels, or may exceed maximum water levels if sea level fell over the previous millennia. Substrates beyond the vertical range of accommodation space would continue to increase elevation with terrigenous sediment being supplied overland and/or facilitated by organic production within substrates, as theorized by Allen (2000). Vertical accommodation space would become increasingly limited and sedimentation would occur laterally, resulting in shoreline progradation. The broad low-lying swamps and fringing marshes of Westernport Bay at elevations less than 8 m, particularly near Kooweerup Swamp, suggest this mode of shoreline evolution (Figure 8).
Recent observed SLR has created new vertical accommodation space, and this study has confirmed that sedimentation was related to accommodation space over the past century. At all locations, sedimentation rates in the saltmarsh, where accommodation space was limited, closely corresponded to observed rates of SLR at the nearest tide gauge for the period 1981–2017, indicating that substrates asymptote toward elevations below maximum tide level that support saltmarsh. Mangrove cores exhibited sedimentation rates, in some cases, well beyond observed rates of SLR, implying ongoing infill of accommodation space and progradation, although this is likely to be at a slower rate than occurred under stable sea-level conditions. Shoreline analyses of the lower and upper limits of intertidal vegetation and the mangrove-saltmarsh transition confirmed sediment supply and ensuing sedimentation were relatively high at Kooweerup, French Island, and Rhyll. However, this pattern of accommodation space infill only remains possible should anticipated rates of SLR by 2100 remain low.
Numerous studies indicate that substrate elevation changes peak at positions across the intertidal zone where both the addition of organic material from vegetation and sediments are high (Morris et al., 2002; Temmerman et al., 2003; Kirwan and Megonigal, 2013); and there is evidence from Westernport Bay that peak models may provide an improved representation of the relationship between rates of surface elevation gain and accommodation space (Rogers and Saintilan, 2021). The ability to quantify the behavior of surface elevation gain across the intertidal zone at each study site was limited due to the resource intensive nature of determining sedimentation rates and rates of surface elevation gain using 210Pb-dating and SET-MH techniques, and analyses were limited to measurements from a single tidal position in the mangrove and saltmarsh at each study site. Accordingly, simple linear regression analyses were applied in this study. The implications of applying a linear model, rather than a peak model is likely to be an over-estimation of the resilience of substrates at higher elevations, that is in the saltmarsh, and potentially an under-estimation of the resilience of lower elevations, that is in the mangrove zone. However, validation of the model against aerial photography provides some confidence that the difference between using linear or peak models may be marginal.
Established linear relationships between sedimentation, surface elevation gain, and accommodation space indicate only positions lower in the tidal frame that are dominated by mangroves (i.e., above MTL and below MHWS) can maintain rates of sedimentation that match or exceed anticipated rates of SLR under a low SLR scenario providing sedimentation remains proportional to accommodation space. Under a high SLR scenario, mangrove shorelines are projected to retreat at all study sites. The outcome of either SLR scenario will be increasing dominance of mangrove as they retreat across substrates that currently support saltmarsh, leading to declines in saltmarsh vegetation extent. The expansion of mangrove into saltmarsh has already been documented along tidal creeks of Westernport Bay (Rogers et al., 2005b; Whitt et al., 2020) and more broadly where mangrove and saltmarsh co-occur in southeastern Australia (Saintilan and Williams, 1999). Should this change in vegetation distribution continue, as our linear relationships between sedimentation, surface elevation gain, and accommodation space imply, the intertidal vegetated platform will develop at an asymptote elevation where rates of surface elevation gain match rates of increase in accommodation space created by SLR. This will result in surface elevations transitioning to elevations that are considerably deeper than current monthly maximum water levels, as proposed by other models (Fagherazzi et al., 2012). Transition of substrates to this asymptote elevation will create conditions suitable for mangrove dominance and considerable landward incursion of tides will eventuate. Decoupling of accretion from inundation has been simulated to occur as a result of mangrove vegetation modulating tidal currents (Xie et al., 2020), and an increase in the dominance of mangrove may hasten this process and further reduce the resilience of higher elevation saltmarshes. As sediment supply and hydrodynamic conditions are variable across Westernport Bay, it is expected that equilibrium elevations will vary with higher asymptote surface elevations developing where sediment budgets are high. Modifications within catchments that alter hydrodynamic conditions and sediment supply will modify relationships between surface elevation gain and accommodation space, and any reductions in sediment deposition will hasten a transition to lower equilibrium elevations.
Sedimentation rates reported in this study are beyond threshold rates derived from paleoecological studies of vertical mangrove growth (Saintilan et al., 2020) and vertical adjustment of United Kingdom saltmarshes (Horton et al., 2018); however, it is not anticipated that an equivalent degree of surface elevation gain will occur due to processes of autocompaction. It remains feasible that established mature mangroves can sustain vertical substrate growth providing mineral and organic matter addition is sufficient. Irrespective of the capacity for mangrove vertical growth at rates matching or exceeding SLR, saltmarsh substrates higher in the tidal frame will not be able to sustain the same rates of surface elevation gain due to lower rates of sedimentation. The resilience of saltmarsh will therefore be dependent upon landward space for saltmarsh retreat. There remains considerable low-elevation land at Kooweerup Swamp for saltmarsh retreat (Figure 8); though, decisions regarding the management of drains, floodgates, and bund walls are required to ensure tidal inundation occurs. Should engineering works (e.g., ring drains, bund walls, flood gates, buildings, elevated roadways, and culverts) and land-use decisions prevent landward tidal incursion, coastal squeeze of saltmarsh will occur (Rogers et al., 2016). In these circumstances, conservation reserves at French Island and Quail Island will become crucial sanctuaries for the highly diverse saltmarsh communities of Westernport Bay. Mangrove forests will have considerable space to encroach upon existing saltmarsh when SLR accelerates; however, planning decisions and management actions to establish setbacks and protect saltmarsh retreat pathways will be necessary to improve conservation outcomes for saltmarsh.
The raw data supporting the conclusions of this article will be made available by the authors, without undue reservation.
KR, AZ, and NS undertook data collection and analysis. LM led the timer-series mapping. KR led the writing. All authors contributed to the article and approved the submitted version.
The Victorian Government provided financial support to establish this research in 2000 and subsequent funding in 2017 to maintain research continuity and deliver knowledge that assist with management of coastal wetlands of Westernport Bay. KR received an Australian Research Council Future Fellowship (FT130100532) that provided financial support for measurements and sediment analyses from 2014 to 2018.
The authors declare that the research was conducted in the absence of any commercial or financial relationships that could be construed as a potential conflict of interest.
All claims expressed in this article are solely those of the authors and do not necessarily represent those of their affiliated organizations, or those of the publisher, the editors and the reviewers. Any product that may be evaluated in this article, or claim that may be made by its manufacturer, is not guaranteed or endorsed by the publisher.
We acknowledge the custodians of the Western Port area, the Bunurong (Boonerwrung) people of the Kulin Nation. We recognize the contribution of field and laboratory assistants in undertaking this work; over 20 years of analysis there are too many to mention but we remember every field trip fondly. Special thanks is given to Lawrance Ferns who has supported this research and the Victorian Government who has provided financial support with the initial establishment and recent measurements.
The Supplementary Material for this article can be found online at: https://www.frontiersin.org/articles/10.3389/fmars.2022.807588/full#supplementary-material
Allen, J. R. L. (2000). Morphodynamics of Holocene salt marshes: a review sketch from the Atlantic and Southern North Sea coasts of Europe. Q. Sci. Rev. 19, 1155–1231. doi: 10.1016/S0277-3791(99)00034-7
Anisfeld, S. C., and Hill, T. D. (2012). Fertilization effects on elevation change and belowground carbon balance in a Long Island Sound tidal marsh. Estu. Coasts 35, 201–211. doi: 10.1007/s12237-011-9440-4
Appleby, P., and Oldfield, F. (1978). The calculation of lead-210 dates assuming a constant rate of supply of unsupported 210Pb to the sediment. Catena 5, 1–8. doi: 10.1016/S0341-8162(78)80002-2
Arias-Ortiz, A., Masqué, P., Garcia-Orellana, J., Serrano, O., Mazarrasa, I., Marbà, N., et al. (2018). Reviews and syntheses: 210Pb-derived sediment and carbon accumulation rates in vegetated coastal ecosystems–setting the record straight. Biogeosciences 15, 6791–6818. doi: 10.5194/bg-15-6791-2018
Boon, P. (2011). “Saltmarshes,” in Understanding the Western Port Environent: A summary of current knowledge and priorities for future research, ed. S. G. O. Victoria (Melbourne: State Government of Victoria, Port Phillips and Westernport CMA, and Melbourne Water).
Breithaupt, J. L., Smoak, J. M., Byrne, R. H., Waters, M. N., Moyer, R. P., and Sanders, C. J. (2018). Avoiding timescale bias in assessments of coastal wetland vertical change. Limnol. Oceanogr. 63, S477–S495. doi: 10.1002/lno.10783
Breithaupt, J. L., Smoak, J. M., Smith, T. J. III, Sanders, C. J., and Hoare, A. (2012). Organic carbon burial rates in mangrove sediments: strengthening the global budget. Glob. Cycles 2012:26. doi: 10.1029/2012GB004375
Bureau of Meteorology. (2021). Monthly sea levels for Stony Point [Online]. Australian Government. Available: http://www.bom.gov.au/ntc/IDO71054/IDO71054SLD.shtml [Accessed 1 september 2021]
Cahoon, D. R., Lynch, J. C., Hensel, P., Boumans, R., Perez, B. C., Segura, B., et al. (2002). High-precision measurements of wetland sediment elevation: I. Recent improvements to the Sedimentation-Erosion Table. J. Sediment. Res. 72, 730–733. doi: 10.1306/020702720730
Dougherty, A. J., Thomas, Z. A., Fogwill, C., Hogg, A., Palmer, J., Rainsley, E., et al. (2019). Redating the earliest evidence of the mid-Holocene relative sea-level highstand in Australia and implications for global sea-level rise. PLoS One 14:e0218430. doi: 10.1371/journal.pone.0218430
Fagherazzi, S., Kirwan, M. L., Mudd, S. M., Guntenspergen, G. R., Temmerman, S., D’Alpaos, A., et al. (2012). Numerical models of salt marsh evolution: ecological, geomorphic, and climatic factors. Rev. Geophys. 50:RG1002. doi: 10.1029/2011RG000359
FitzGerald, D. M., Hein, C. J., Connell, J. E., Hughes, Z. J., Georgiou, I. Y., and Novak, A. B. (2021). Largest marsh in New England near a precipice. Geomorphology 379:107625. doi: 10.1016/j.geomorph.2021.107625
Fox-Kemper, B., Hewitt, H. T., Xiao, C., Aðalgeirsdóttir, G., Drijfhout, S. S., Edwards, T. L., et al. (2021). “Ocean, Cryosphere and Sea Level Change,” in Climate Change 2021: The Physical Science Basis. Contribution of Working Group I to the Sixth Assessment Report of the Intergovernmental Panel on Climate Change, eds V. Masson-Delmotte, P. Zhai, A. Pirani, S. L. Connors, C. Péan, S. Berger, et al. (Cambridge, MA: Cambridge University Press).
Hancock, G. J., Olley, J. M., and Wallbrink, P. (2001). “Sediment transport and accumulation in Western Port: Report on Phase I of a study determining the sources of sediment to Western Port,” in Technical Report 47/01, (Canberra: CSIRO).
Harris, J., Hinwood, J., Marsden, M., and Sternberg, R. (1979). Water movements, sediment transport and deposition, Western Port, Victoria. Mar. Geol. 30, 131–161. doi: 10.1016/0025-3227(79)90010-0
Horton, B. P., Shennan, I., Bradley, S. L., Cahill, N., Kirwan, M., Kopp, R. E., et al. (2018). Predicting marsh vulnerability to sea-level rise using Holocene relative sea-level data. Na. Comm. 9, 1–7. doi: 10.1038/s41467-018-05080-0
Hughes, A., Prosser, I., Wallbrink, P., and Stevenson, J. (2003). “Suspended sediment and bedload budgets for the Western Port Bay Basin,” in CSIRO Land Water Technical Report: Technical reprt 4/03, (Canberra: CSIRO).
Iurian, A., Millward, G., Blake, W., and Hernández, J. A. (2021). Fine-tuning of 210Pb-based methods for dating vegetated saltmarsh sediments. Q. Geochronol. 62:101153. doi: 10.1016/j.quageo.2021.101153
Jervey, M. (1988). Quantitative geological modeling of siliciclastic rock sequences and their seismic expression. SEPM Special Publ. 1988, 47–69. doi: 10.2110/pec.88.01.0047
Kirwan, M. L., and Megonigal, J. P. (2013). Tidal wetland stability in the face of human impacts and sea-level rise. Nature 504, 53–60. doi: 10.1038/nature12856
Kirwan, M. L., Temmerman, S., Skeehan, E. E., Guntenspergen, G. R., and Fagherazzi, S. (2016). Overestimation of marsh vulnerability to sea level rise. Nature Climate Change 6, 253–260. doi: 10.1038/nclimate2909
Krishnaswamy, S., Lal, D., Martin, J. M., and Meybeck, M. (1971). Geochronology of lake sediments. Earth Planet. Sci. Lett. 11, 407–414. doi: 10.1016/0012-821X(71)90202-0
Kumbier, K., Hughes, M. G., Rogers, K., and Woodroffe, C. D. (2021). Inundation characteristics of mangrove and saltmarsh in micro-tidal estuaries. Est. Coast. Shelf Sci. 261:107553. doi: 10.1016/j.ecss.2021.107553
Lee, R. (2011). “Physical and chemical setting,” in Understanding the Western Port Environent: A summary of current knowledge and priorities for future research, ed. S. G. O. Victoria (Melbourne: State Government of Victoria, Port Phillips and Westernport CMA, and Melbourne Water).
Lewis, C. J. E., Baldock, J. A., Hawke, B., Gadd, P. S., Zawadzki, A., Heijnis, H., et al. (2019). Impacts of land reclamation on tidal marsh ‘blue carbon’stocks. Sci. Total Env. 672, 427–437. doi: 10.1016/j.scitotenv.2019.03.345
Lewis, S. E., Sloss, C. R., Murray-Wallace, C. V., Woodroffe, C. D., and Smithers, S. G. (2013). Post-glacial sea-level changes around the Australian margin: a review. Q. Sci. Rev. 74, 115–138. doi: 10.1016/j.quascirev.2012.09.006
Marx, S. K., Knight, J. M., Dwyer, P. G., Child, D. P., Hotchkis, M. A., and Zawadzki, A. (2020). Examining the response of an eastern Australian mangrove forest to changes in hydro-period over the last century. Est. Coast. Shelf Sci. 241:106813. doi: 10.1016/j.ecss.2020.106813
Mogensen, L. A., and Rogers, K. (2018). Validation and Comparison of a Model of the Effect of Sea-Level Rise on Coastal Wetlands. Sci. Rep. 8:1369. doi: 10.1038/s41598-018-19695-2
Morris, J. T., Sundareshwar, P. V., Nietch, C. T., Kjerfve, B., and Cahoon, D. R. (2002). Responses of coastal wetlands to rising sea-levels. Ecology 83, 2869–2877. doi: 10.1890/0012-9658(2002)083[2869:ROCWTR]2.0.CO;2
Nolte, S., Koppenaal, E. C., Esselink, P., Dijkema, K. S., Schuerch, M., Groot, A. V., et al. (2013). Measuring sedimentation in tidal marshes: a review on methods and their applicability in biogeomorphological studies. J. Coast. Conserv. 17, 301–325. doi: 10.1007/s11852-013-0238-3
Oppenheimer, M., Glavovic, B., Hinkel, J., van de Wal, R., Magnan, A. K., Abd-Elgawad, A., et al. (2019). “Chapter 4: Sea level rise and implications for low lying islands, coasts and communities,” in IPCC special report on the ocean and cryosphere in a changing climate, (Intergovenmental Panel on Climate Change).
Osland, M. J., Feher, L. C., Anderson, G. H., Vervaeke, W. C., Krauss, K. W., Whelan, K. R., et al. (2020). A tropical cyclone-induced ecological regime shift: Mangrove forest conversion to mudflat in Everglades National Park (Florida. USA). Wetlands 40, 1445–1458. doi: 10.1007/s13157-020-01291-8
Pethick, J. S. (1981). Long-term accretion rates on tidal salt marshes. J. Sed. Res. 51, 571–577. doi: 10.1306/212F7CDE-2B24-11D7-8648000102C1865D
Reef, R., Spencer, T., Moller, I., Lovelock, C. E., Christie, E. K., McIvor, A. L., et al. (2017). The effects of elevated CO2 and eutrophication on surface elevation gain in a European salt marsh. Glob. Chang. Biol. 23, 881–890. doi: 10.1111/gcb.13396
Rogers, K. (2021). Accommodation space as a framework for assessing the response of mangroves to relative sea-level rise. Sing. J. Tro. Geogr. 42, 163–183. doi: 10.1111/sjtg.12357
Rogers, K., Boon, P. I., Branigan, S., Duke, N. C., Field, C. D., Fitzsimons, J. A., et al. (2016). The state of legislation and policy protecting Australia’s mangrove and salt marsh and their ecosystem services. Mar. Pol. 72, 139–155. doi: 10.1016/j.marpol.2016.06.025
Rogers, K., Kelleway, J. J., Saintilan, N., Megonigal, J. P., Adams, J. B., Holmquist, J. R., et al. (2019). Wetland carbon storage controlled by millennialscale variation in relative sea-level rise. Nature 567, 91–95. doi: 10.1038/s41586-019-0951-7
Rogers, K., and Saintilan, N. (2021). Processes Influencing Autocompaction Modulate Coastal Wetland Surface Elevation Adjustment With Sea-Level Rise. Front. Mar. Sci. 8:879. doi: 10.3389/fmars.2021.694039
Rogers, K., Saintilan, N., and Cahoon, D. (2005a). Surface Elevation Dynamics in a Regenerating Mangrove Forest at Homebush Bay, Australia. Wetl. Ecol. Manage. 13, 587–598. doi: 10.1007/s11273-004-0003-3
Rogers, K., Saintilan, N., and Heijnis, H. (2005b). Mangrove encroachment of salt marsh in Western Port Bay, Victoria: the role of sedimentation, subsidence and sea level rise. Estuaries 28, 551–559. doi: 10.1007/BF02696066
Rogers, K., Wilton, K. M., and Saintilan, N. (2006). Vegetation change and surface elevation dynamics in estuarine wetlands of southeast Australia. Est. Coast. Shelf Sci. 66, 559–569. doi: 10.1016/j.ecss.2005.11.004
Ruiz-Fernández, A. C., Sanchez-Cabeza, J.-A., Serrato de la Pena, J. L., Perez-Bernal, L. H., Cearreta, A., Flores-Verdugo, F., et al. (2016). Accretion rates in coastal wetlands of the southeastern Gulf of California and their relationship with sea-level rise. Holocene 26, 1126–1137. doi: 10.1177/0959683616632882
Saintilan, N., Khan, N., Ashe, E., Kelleway, J., Rogers, K., Woodroffe, C. D., et al. (2020). Thresholds of mangrove survival under rapid sea level rise. Science 368, 1118–1121. doi: 10.1126/science.aba2656
Saintilan, N., and Williams, R. J. (1999). Mangrove Transgression into Saltmarsh Environments in South-East Australia. Glob. Ecol. Biogeogr. 8, 117–124. doi: 10.1046/j.1365-2699.1999.00133.x
Sanders, C. J., Santos, I. R., Maher, D. T., Breithaupt, J. L., Smoak, J. M., Ketterer, M., et al. (2016). Examining 239+ 240Pu, 210Pb and historical events to determine carbon, nitrogen and phosphorus burial in mangrove sediments of Moreton Bay, Australia. J. Env. Radioact. 151, 623–629. doi: 10.1016/j.jenvrad.2015.04.018
Sloss, C. R., Murray-Wallace, C. V., and Jones, B. G. (2007). Holocene sea-level change on the southeast coast of Australia: a review. Holocene 17, 999–1014. doi: 10.1177/0959683607082415
Smith, J. N. J. J. O. E. R. (2001). Why should we believe 210Pb sediment geochronologies? J. Environ. Radioact. 55, 121–123. doi: 10.1016/S0265-931X(00)00152-1
Swales, A., Bentley, S. J., and Lovelock, C. E. (2015). Mangrove-forest evolution in a sediment-rich estuarine system: opportunists or agents of geomorphic change? Earth Surf. Proc. Landf. 40, 1672–1687. doi: 10.1002/esp.3759
Temmerman, S., Govers, G., Wartel, S., and Meire, P. (2003). Spatial and temporal factors controlling short-term sedimentation in a salt and freshwater tidal marsh, Scheldt estuary, Belgium, SW Netherlands. Earth Surf. Proc. Landf. 28, 739–755. doi: 10.1002/esp.495
Water Technology (2014a). Western Port Local Coastal Hazard Assessment: Report 04 (R04) – Inundation Hazards. Melbourne: Melbourne Water.
Water Technology (2014b). Western Port Local Coastal Hazard Assessment: Report 05 (R05) – Erosion Hazards. Melbourne: Melbourne Water.
Whelan, K., Smith, T., Cahoon, D., Lynch, J., and Anderson, G. (2005). Groundwater control of mangrove surface elevation: Shrink and swell varies with soil depth. Est. Coasts 28, 833–843. doi: 10.1007/BF02696013
Whelan, K. R. T., Smith, T. J., Anderson, G. H., and Ouellette, M. L. (2009). Hurricane Wilma’s Impact on Overall Soil Elevation and Zones Within the Soil Profile in a Mangrove Forest. Wetlands 29, 16–23. doi: 10.1672/08-125.1
Whitt, A. A., Coleman, R., Lovelock, C. E., Gillies, C., Ierodiaconou, D., Liyanapathirana, M., et al. (2020). March of the mangroves: drivers of encroachment into southern temperate saltmarsh. Est. Coast. Shelf Sci. 240:106776. doi: 10.1016/j.ecss.2020.106776
Woodroffe, C. D., and Murray-Wallace, C. V. (2012). Sea-level rise and coastal change: the past as a guide to the future. Quat. Rev. 54, 4–11. doi: 10.1016/j.quascirev.2012.05.009
Woodroffe, C. D., Rogers, K., McKee, K. L., Lovelock, C. E., Mendelssohn, I., and Saintilan, N. (2016). Mangrove sedimentation and response to relative sea-level rise. Annu. Rev. Mar. Sci. 8, 243–266. doi: 10.1146/annurev-marine-122414-034025
Xie, D., Schwarz, C., Brückner, M. Z., Kleinhans, M. G., Urrego, D. H., Zhou, Z., et al. (2020). Mangrove diversity loss under sea-level rise triggered by bio-morphodynamic feedbacks and anthropogenic pressures. Env. Res. Lett. 15:114033. doi: 10.1088/1748-9326/abc122
Keywords: mangrove, saltmarsh, 210Pb geochronology, sediment supply, autocompaction, equilibrium elevation
Citation: Rogers K, Zawadzki A, Mogensen LA and Saintilan N (2022) Coastal Wetland Surface Elevation Change Is Dynamically Related to Accommodation Space and Influenced by Sedimentation and Sea-Level Rise Over Decadal Timescales. Front. Mar. Sci. 9:807588. doi: 10.3389/fmars.2022.807588
Received: 02 November 2021; Accepted: 11 February 2022;
Published: 15 March 2022.
Edited by:
Zhan Hu, Sun Yat-sen University, ChinaReviewed by:
Ya Ping Wang, Nanjing University, ChinaCopyright © 2022 Rogers, Zawadzki, Mogensen and Saintilan. This is an open-access article distributed under the terms of the Creative Commons Attribution License (CC BY). The use, distribution or reproduction in other forums is permitted, provided the original author(s) and the copyright owner(s) are credited and that the original publication in this journal is cited, in accordance with accepted academic practice. No use, distribution or reproduction is permitted which does not comply with these terms.
*Correspondence: Kerrylee Rogers, a2VycnlsZWVAdW93LmVkdS5hdQ==
Disclaimer: All claims expressed in this article are solely those of the authors and do not necessarily represent those of their affiliated organizations, or those of the publisher, the editors and the reviewers. Any product that may be evaluated in this article or claim that may be made by its manufacturer is not guaranteed or endorsed by the publisher.
Research integrity at Frontiers
Learn more about the work of our research integrity team to safeguard the quality of each article we publish.