 Eydna í Homrum
- 1Faroe Marine Research Institute, Tórshavn, Faroe Islands
- 2Marine and Freshwater Research Institute, Hafnafjörður, Iceland
- 3Institute of Marine Research, Bergen, Norway
Norwegian spring spawning herring (Clupea harengus) migrate from spawning areas on the Norwegian shelf in February-March to feeding areas in the Norwegian Sea in April-August, returning to wintering areas in northern Norwegian waters from September onwards when feeding ceases. After around 2005 the Norwegian Sea has become warmer and here we address recent changes in migration, somatic condition and gonad development of herring related to these changes. Analyses were based on combined Norwegian, Icelandic and Faroese data on fishery (~81% of total commercial catch) and biological parameters from an extensive material of individual fish (n = 310749) during the period 1994-2019. Fishery data demonstrated large-scale changes in herring distribution over the study period. This was further supported by spatiotemporal modelling of body growth, somatic condition, gonad development and concurrent centre of gravity changes of the sampled fish. After 2005 the population showed a clear tendency of being distributed farther south-westwards in the Norwegian Sea during feeding and returning to wintering areas later in the year. This tendency increased with age, and with body length and somatic condition within age groups. Moreover, the somatic condition increased for all age groups from the early 2000s towards stable high levels after 2005, mainly due to extra weight gained from extended feeding into the autumn. Length at age decreased continuously during 2003-2010 for all age groups, suggesting impact of density dependent limiting factors but also that the environmental shift may have led to immediate poorer feeding conditions early in the year. Hence, extra energy from extended autumn feeding was rather invested into gonad weights tending to increase over the study period. Mechanisms behind the observed changes are likely linked to spatial and seasonal changes in zooplankton abundance. Overall, zooplankton production possibilities along the frontal areas in the south-western part of the Norwegian Sea have likely increased after the general environmental shift. This also includes a change towards increased probabilities of an additional second generation of some copepods developing in warmer waters, facilitating a prolonged feeding period for herring.
Introduction
The migratory Norwegian spring spawning herring (Clupea harengus) (hereafter herring) is the world’s largest herring stock (Hay et al., 2001) with high economical value for several countries (Bjørndal et al., 2004). Over the last century the stock has shown large fluctuations related to variable recruitment (Figure 1A) (Devold, 1963; Ottersen et al., 2013). This, combined with overexploitation resulted in a full stock collapse in the late 1960s and a rebuilding period following strict management regimes (Toresen and Østvedt, 2000). After the recruitment of the strong 1983 year-class (Røttingen, 1990) the stock has stabilized again at high levels and is currently sustaining one of the largest fisheries in the North East Atlantic (Figure 1A).
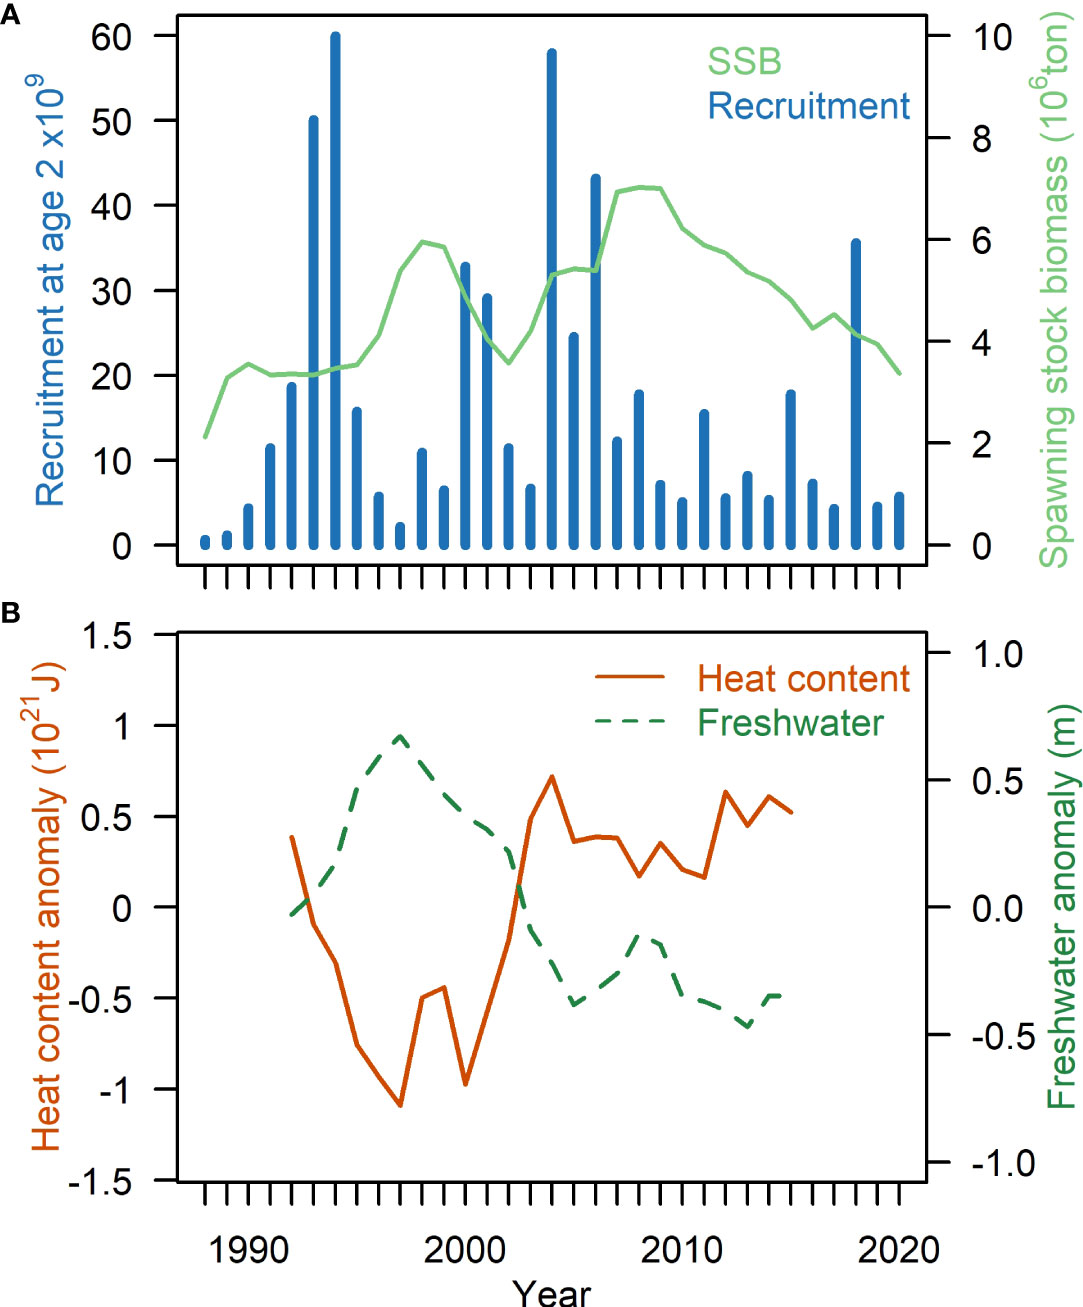
Figure 1 (A) Spawning stock biomass (SSB) and recruitment at age 2 of Norwegian spring-spawning herring (source: ICES advice 2021). (B) Heat content anomaly (brown solid) and freshwater anomaly (green stippled) in the Norwegian Sea from surface to 400m depth 1992-2015. Redrawn with permission and data from Asbjørnsen et al., 2019 based on ECCOv4 data.
The herring have a triangular migration pattern between spawning areas on the Norwegian shelf (Figure 2) in February-March, feeding in the Norwegian Sea in April-August and a returning to oceanic or coastal wintering in Norwegian waters from September onwards (Devold, 1963; Dragesund et al., 1997; Holst et al., 2002). The exact position and timing – particularly for the wintering areas – varies periodically.
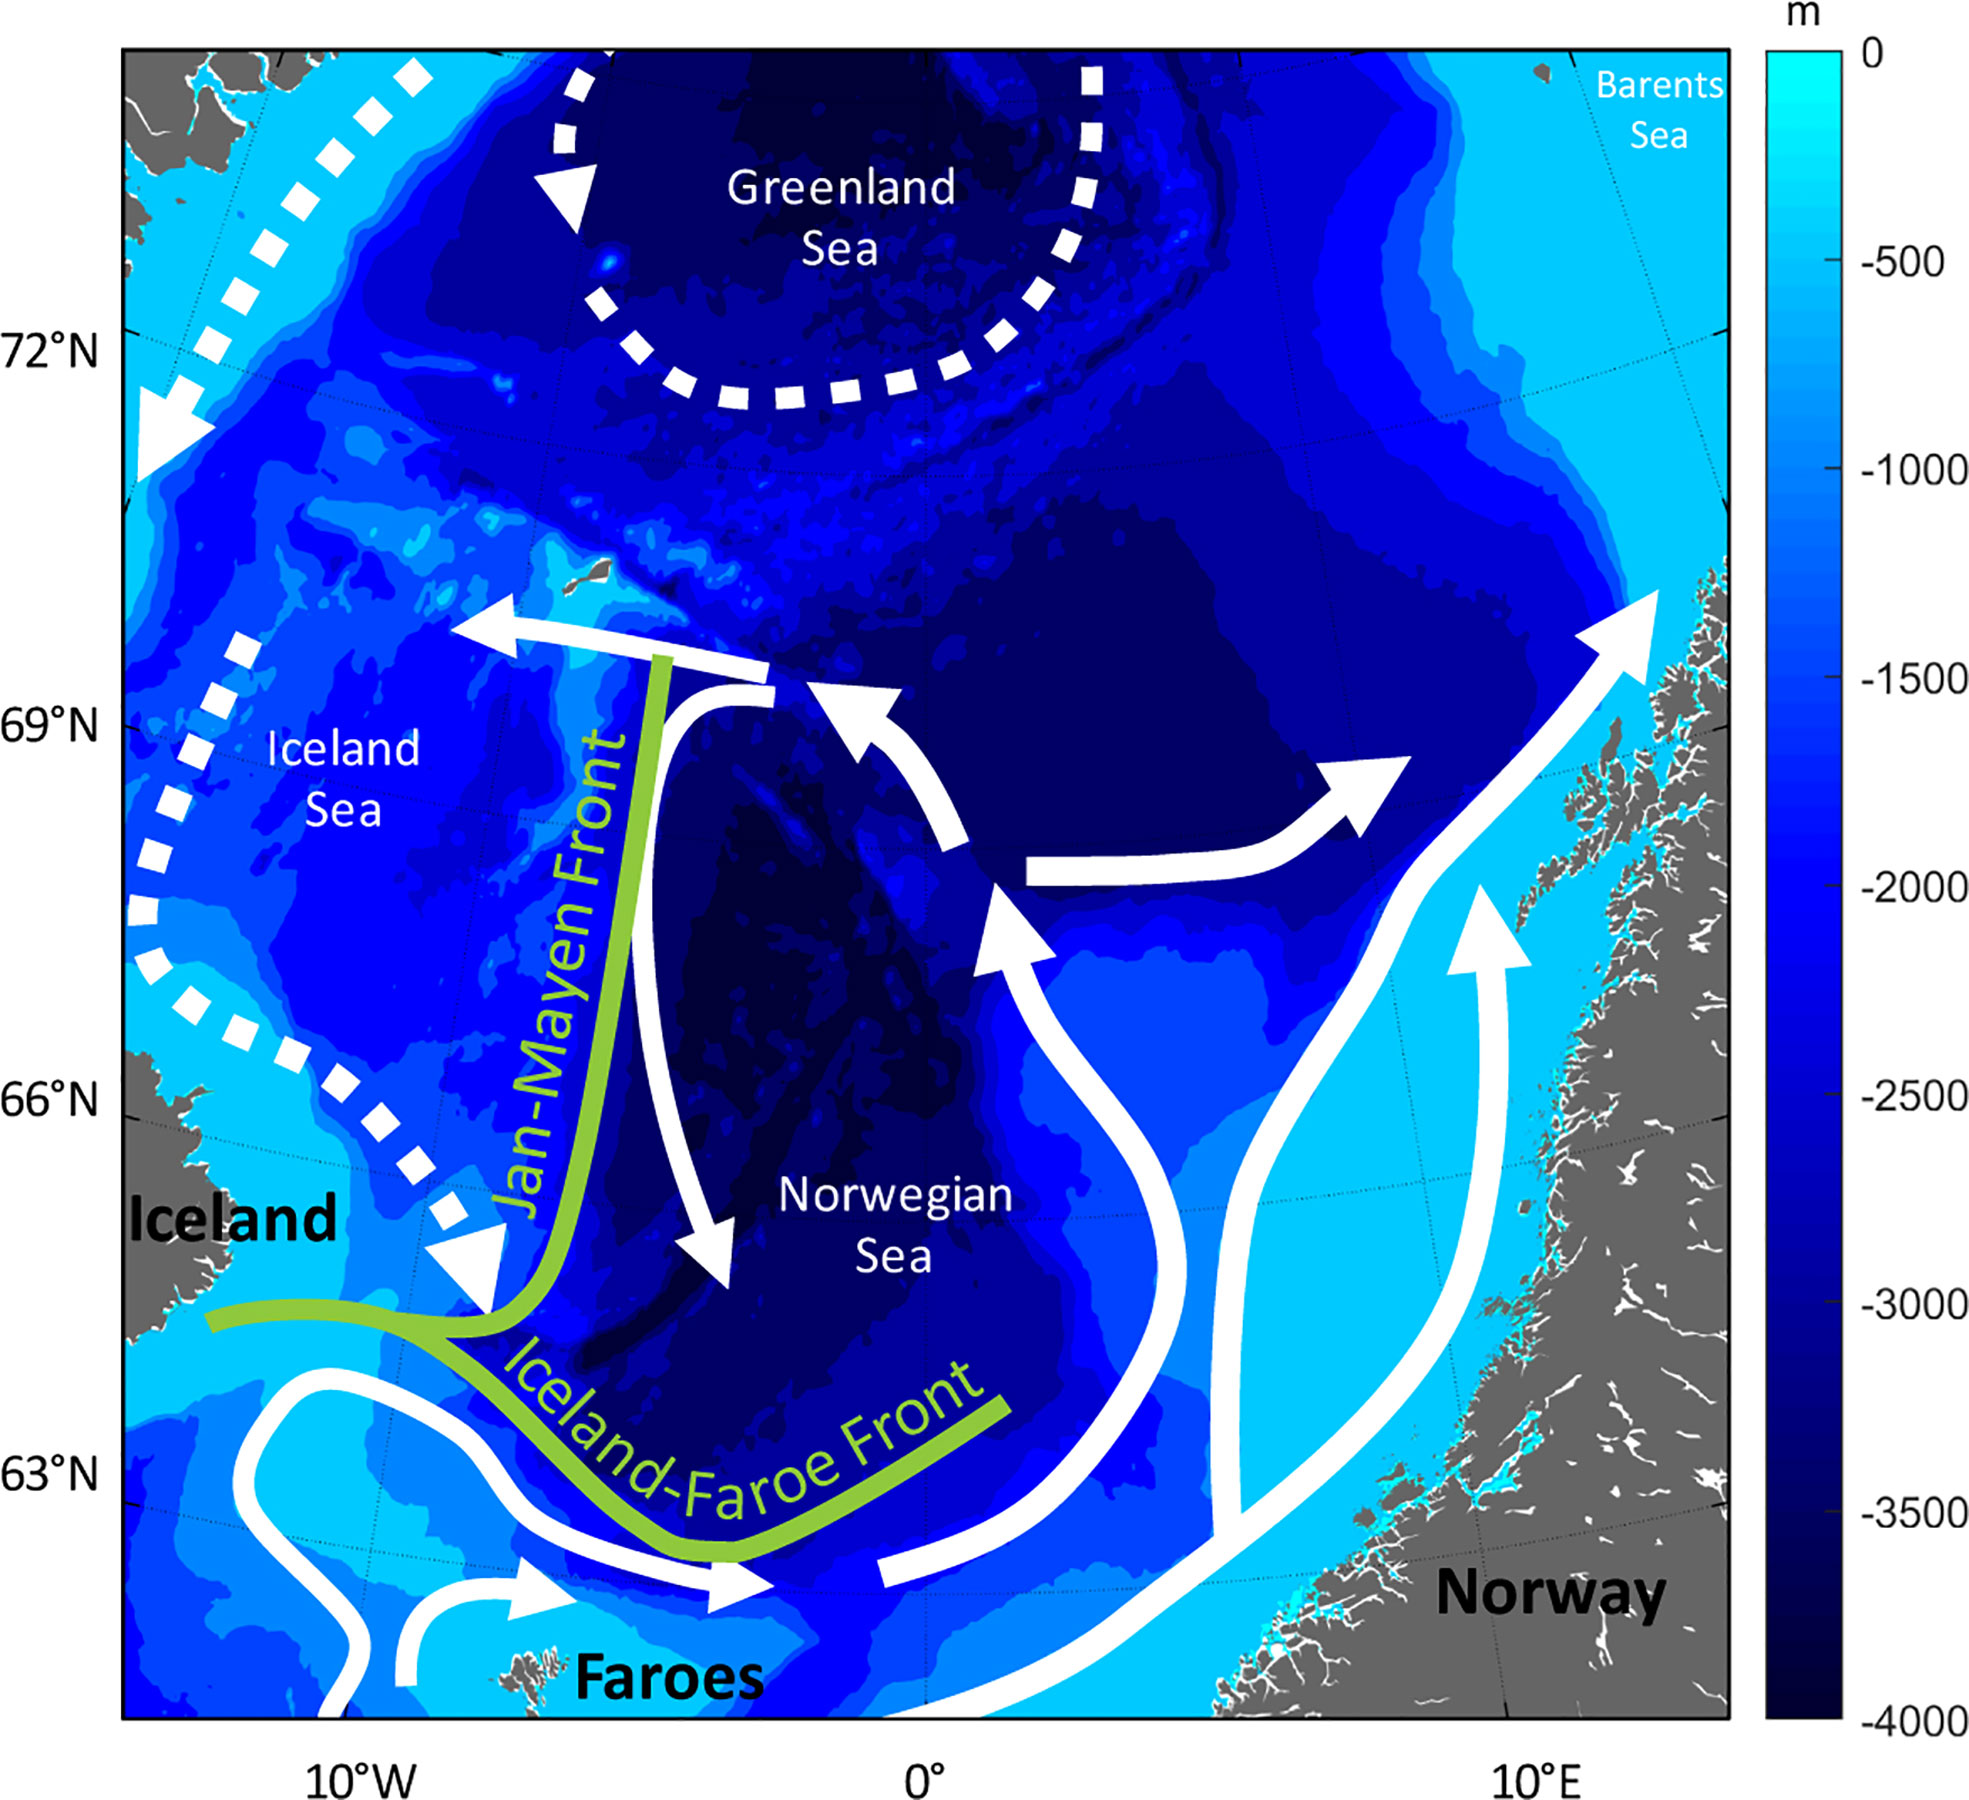
Figure 2 Map of the Norwegian Sea and surrounding waters. Map overlaid with bottom depth and main currents (white arrows, dotted currents are cold water masses) and main fronts (green colour).
The main feeding area in the Norwegian Sea and adjacent areas is composed of several water masses and ocean currents (Figure 2). The central Norwegian Sea is dominated by relatively warm Atlantic water (Hansen and Østerhus, 2000). The Norwegian Sea has become warmer since the mid-1990s, stabilizing at high heat content after 2005 (Figure 1B). This recent warm state is a result of increased temperatures in the Atlantic inflow from the north-eastern Atlantic and reduced heat losses to the atmosphere over this region (Hátún et al., 2005; Asbjørnsen et al., 2019; Mork et al., 2019). The Norwegian Sea Gyre (NSG) is a system of counter-clockwise currents; to the south the NSG is bordered by the Faroe Current and to the east by the colder East Icelandic Current. Contrasting periods with strong and weak NSG have also revealed oceanographic changes in the feeding area, which are likely to affect the ecosystem (Hátún et al., 2021) and higher trophic levels, such as herring.
Mechanisms behind the spatiotemporal dynamics in herring distribution are far from fully understood, but one important factor is the size of the stock. Density dependent effects are typically important during the feeding season, with the tendency to utilize larger areas in the Norwegian Sea at high stock levels (Holst et al., 2002; Eliasen et al., 2021). Another important factor affecting spatial distribution is the age structure in the stock. Shifts in wintering areas generally occur when large incoming year classes are recruiting to the spawning stock in the Norwegian Sea from their nursery areas in the Barents Sea (Huse et al., 2010).
Migration distance is observed to be size dependent both during feeding (Nøttestad et al., 1999; Eliasen et al., 2021) and spawning migration (Slotte, 1999b; Slotte and Fiksen, 2000) where the largest herring migrate farthest. The migration of a year class may, therefore, change over times as it grows, and in general be extended when the stock is dominated by old fish. For shifts in feeding areas, however, Eliasen et al. (2021) demonstrated that during the period 1999-2004, herring of all ages simultaneously shifted the feeding area northwards, indicating that this shift as well as the subsequent southward shift was governed by the environment rather than incoming year classes.
During the feeding season, the largest and oldest, experienced fish tend to migrate towards the productive areas along the cold Jan Mayen front, between the Iceland Sea and the Norwegian sea (Misund et al., 1997; Nøttestad et al., 2007; Melle et al., 2020; Eliasen et al., 2021). This pattern was also evident prior to the stock collapse (Jakobsson, 1968; Dragesund et al., 1997; Holst et al., 2002).
The Jan Mayen front has been identified as an important transitional zone in both zooplankton biomass, abundance and diversity, changing significantly across the front (Melle et al., 2020). Both prey abundance and stomach content of herring was higher on the western, colder side of the front (Melle et al., 2020; Kristiansen et al., 2022), where Calanus hyperboreus was important part of the diet. On the Atlantic side, the herring mainly fed on overwintering stages of Calanus finmarchicus, i.e. before the development of the new generation of the year, and the phenology of C. finmarchicus appears to be an important driver of the herring feeding migration (Broms et al., 2012; Melle et al., 2020).
The warming of the Norwegian Sea would in general be expected to be positive for individual growth of a species like herring, which is at the northerly distributional range (Rose, 2005). Herring exhibits temperature dependent growth (Husebø et al., 2007; Brunel and Collas, 2010; Hunter et al., 2019), given that the feeding conditions and competition for prey also are favourable. Herring growth is suggested to be linked to the biomass of zooplankton in the Norwegian Sea in May (Huse et al., 2012; dos Santos Schmidt et al., 2020), and the most recent updated ecosystem review (ICES, 2021a) reports a general increase in zooplankton biomass in the area both during spring and summer since 2010.
Recent research has, however, demonstrated a clear change in the timing and seasonality of zooplankton production in this ecosystem (Kristiansen et al., 2016; Strand et al., 2020; Skjoldal et al., 2021). While previously there was thought to be only one generation of C. finmarchicus, Strand et al. (2020) found two generations of C. finmarchicus across the central Norwegian Sea 2008-2016, where the second generation was observed in September-October. Around 2003 a sudden shift was observed north of the Iceland – Faroe front, after which two generations of C. finmarchicus were produced (Kristiansen et al., 2016). This change in phenology was linked to changes in water mass distribution (Kristiansen et al., 2019) where colder water masses retracted westward, which in turn lead to an increase of individuals from the Norwegian Basin. Consequently, an earlier reproduction enabled the species to produce two generations after 2003 leading to increased abundance in September. Similar shifts have been observed at the western entrance to the Barents Sea (Skjoldal et al., 2021). There the warming resulted in a shifted phenology after 2005 with evidence for a second generation leading to increased summer abundance of C. finmarchicus. Also on the western side of the Atlantic peak abundance of Pseudocalnaus sp. has shifted from spring to summer, thus becoming available as prey to herring in the autumn months since the mid 2000s (Wilson et al., 2018).
These changes in phenology of C. finmarchicus may be of significant importance for herring that potentially could experience high prey availability in the Norwegian Sea in autumn. At that time of the year, herring were historically already settled at wintering grounds with empty stomachs using stored energy to develop gonads (Slotte, 1999a).
Herring growth has been linked to density dependent effects (slowest growth at highest abundance) as well as environmental factors (Husebø et al., 2007; Brunel and Collas, 2010; dos Santos Schmidt et al., 2020). dos Santos Schmidt et al. (2020) found that weight at age tended to decrease from 1994 to lowest levels in 1997, increasing again and stabilizing at high levels in 2005-2014. It was noteworthy that growth in terms of total body length at age tended to cease, whereas both the total body weight and gonad weight at length remained at high levels after 2005. They concluded that growth in terms of body length likely decreased in warmer waters in the Norwegian Sea ecosystem under stiff prey intra- and inter-specific competition to support increased condition and investment into reproduction, yielding higher fecundity. dos Santos Schmidt et al. (2020) focused on early overwintering (October – November) and pre-spawning (February), and therefore lacked spatio-temporal information – particularly during the feeding period.
Herring feeding starts already in April, and it remains unsolved where and when herring gains the weight over the feeding season before they arrive at the wintering grounds in autumn. It also remains unsolved how the herring actually allocates energy between body growth (in terms of length), somatic weight, and gonad weight over the feeding season. Especially the gonad development is a process that could influence body growth. Body growth ceases quickly in herring following first maturation (Engelhard and Heino, 2004a; Engelhard and Heino, 2004b), but it is also likely that maturation processes of adult herring may affect body growth directly, as has been demonstrated for other teleost species (Bhatta et al., 2012). For herring, depending heavily on energy reserves for gonad development (Slotte, 1999a), it is therefore likely that body growth of the herring may cease when the onset of maturation and gonad building starts in July (dos Santos Schmidt et al., 2017). To summarize, growth in length is hypothesized to be related to feeding opportunities in early summer, before maturation of gonads sets on. Somatic weight and gonad weight, on the other hand, are hypothesized to be related to feeding opportunities throughout the feeding season, also after onset of gonad maturation.
Given the recent evidence of increased abundance of a second generation of C. finmarchicus well into the autumn, this provides opportunity for herring to extend their feeding period and gain more energy to invest into gonad development even after onset of maturation and increase the migration potential during the spawning season (Slotte, 1999a). In fact, the international fisheries in recent years have demonstrated that herring are distributed all the way from Iceland across the Norwegian Sea to Norwegian coastal waters into late November (ICES, 2021b), clearly indicating a delayed migration eastwards to the wintering areas.
The main objective of the current study was to explore whether spatiotemporal dynamics in distribution of the herring stock and concurrent length at age, somatic condition levels and gonad development changed when the Norwegian Sea had warmed around 2005 and C. finmarchicus became available as prey during autumn. Explicitly, we test the hypothesis that warming of the Norwegian Sea with extended zooplankton reproduction season and more generations of C. finmarchicus, has prolonged the herring feeding period. Furthermore, that the extended feeding period has led to improved gonadal conditions and increased spawning migration potential rather than body growth in terms of length.
Data and methods
The data used are national official landings statistics and biological parameters of adult herring sampled from both commercial landings and surveys from Norway, Faroes and Iceland. Temporally, the data span from 1994 to 2019 and all months of the year (Figure S1). The underlying data material is believed to cover the adult herring stock (generally, ages 4 and older) well in terms of describing potential spatiotemporal changes.
Landings statistics and biological samples from the commercial fleet
Two sources of fisheries dependent data have been used. Firstly, official landings statistics, which have been used to describe the seasonal and spatial development of the fisheries in the study period. Secondly, biological samples of individual fish from commercial landings.
The data from the commercial fleet do not reflect the entire distribution area of herring (Figure 3), but they provide the necessary information for the spatial aspects of the research questions. Norway, Faroes and Iceland have taken on average 81% of the herring catches since 1994 with a relatively constant proportion over these years. This further supports the significance of these data.
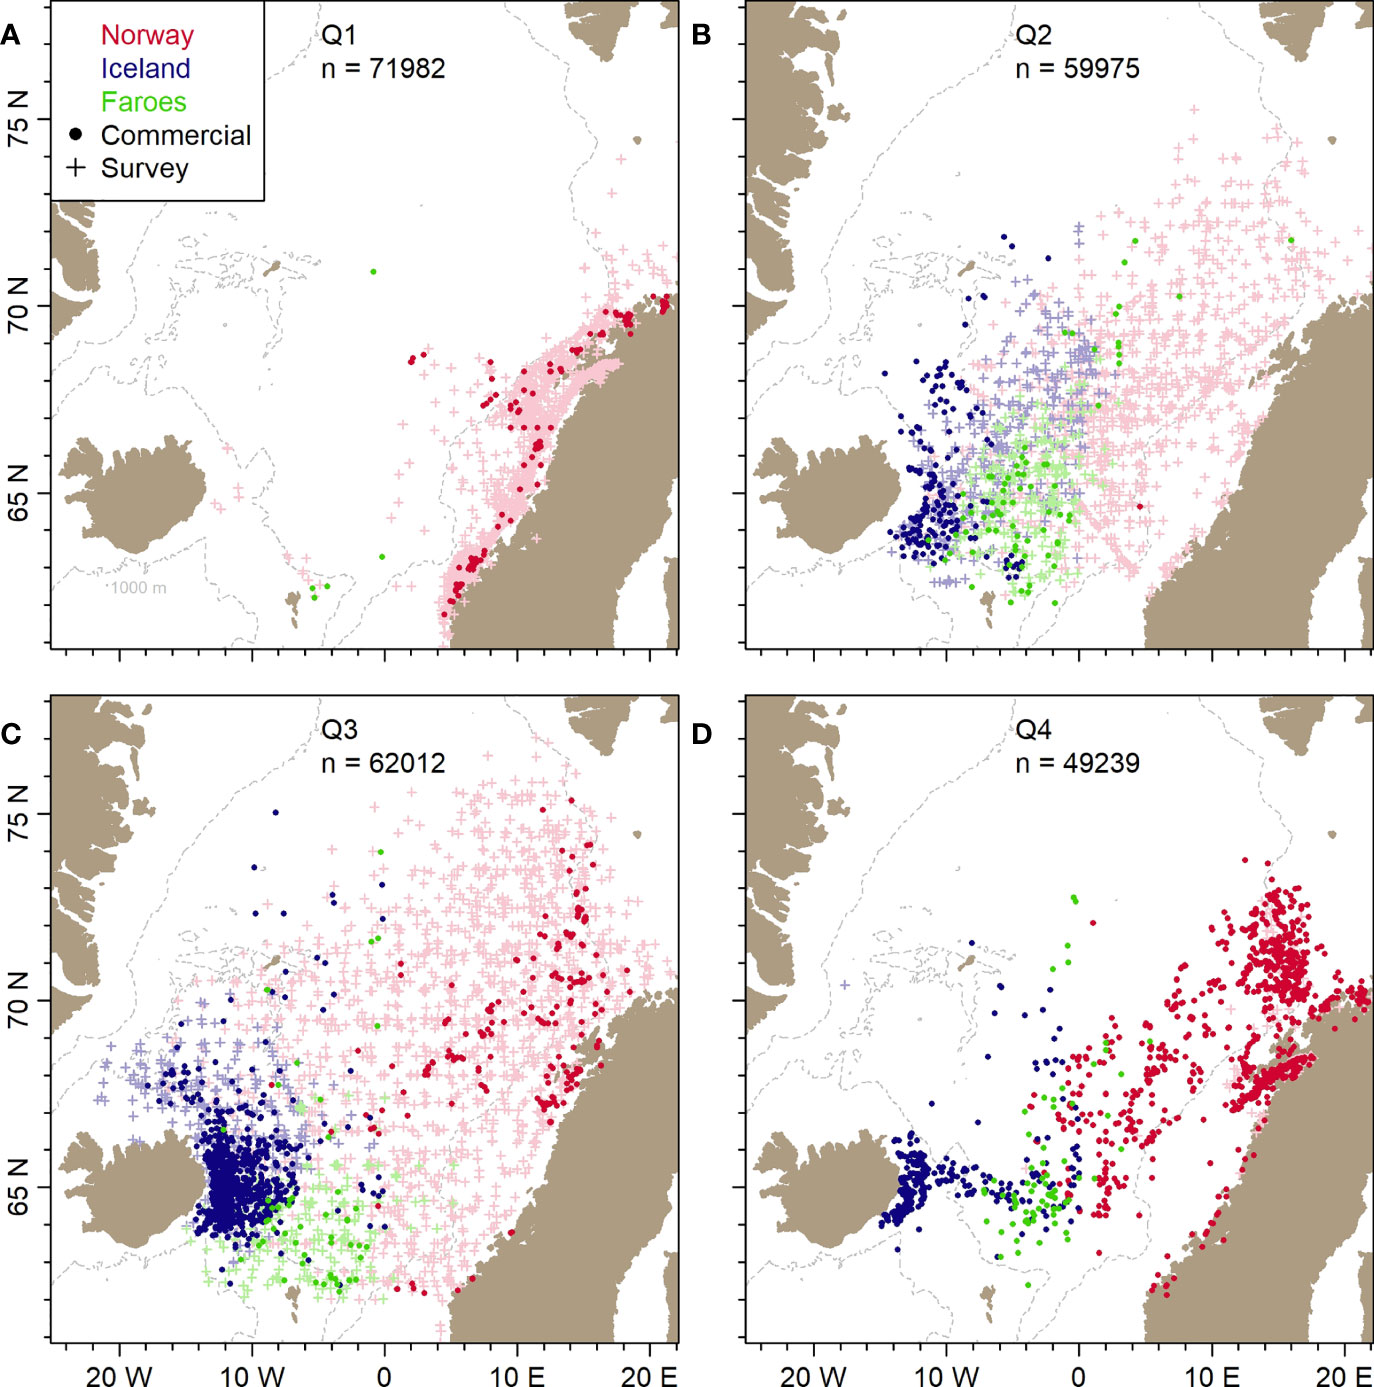
Figure 3 Study area. Positions of all Norwegian (red), Icelandic (blue) and Faroese (green) samples of herring from scientific surveys (+) and commercial catches (•) included in the present study for the period 1994-2019. The panels (A–D) represent annual Quarters 1-4.
The landings statistics used in this study are the Norwegian, Faroese and Icelandic official landings of herring from 1994 to 2019. The landings have been aggregated in 5-year periods (except the first period, which covers six years), annual quarter and statistical rectangle (0.5° latitude, 1° longitude). These aggregations have been made to describe the seasonal and interannual development of the spatial patterns of the herring fisheries in one Figure (4 by 5 panels).
Samples from commercial catches were either frozen at sea and sent to the research institutes or collected at the landing sites; in both cases, the samples were analysed at the national research institutes. The sampling strategy for individual fish was simple random sampling. Sample size was generally 25-50 fish. Commercial samples were mainly taken by purse seine or pelagic trawl.
Biological samples from survey catches
The survey data used were biological samples of individual fish.
Spatially, the survey data cover the distribution area of adult herring (Figure 3). The spawning survey is confined to the spawning area of herring along the Norwegian coast, whereas the internationally coordinated ecosystem surveys in the Nordic Seas (ICES, 2021b) cover the entire adult feeding area in the Nordic Seas.
Biological samples from survey catches were taken randomly on board pelagic trawl vessels. Samples generally consisted of 25-100 fish or as many as the catch allowed. Samples were analysed immediately after being caught. Age was sometimes determined on the vessel and sometimes once back on land.
Biological parameters
The biological material analysed in the present study was collected from survey samples and samples from commercial landings. The biological parameters recorded were total length (cut to the nearest cm below), whole body weight (including guts), sex, sexual maturity (stage 1-8; 1-2 = immature, 3-5 = maturing, 6 = spawning, 7 = spent, 8 = resting), gonad weights (note that Norwegian gonad weights were available for all years, whereas Icelandic and Faroese only from 2005 onwards), stomach content (only the Norwegian data; the information used here is stomach empty or non-empty) and age determination, which was based on either scales (Norwegian and Icelandic) or otoliths (Faroese – and to some extent Norwegian and Icelandic).
The focus of the study was the main habitat of the adult stock in the Norwegian Sea. Therefore, samples west of 22°E were used, excluding the main nursery area of the Barents Sea. Moreover, only herring at ages 3 and older were used in the study, some of which were still immature herring having left the nursery areas 1-2 years prior to first spawning. For statistical modelling all fish aged 10 and older were merged into a 10+ group. In total, 310749 age determined herring fulfilled these criteria (Table 1) and after filtering for the relevant seasons, nlength = 167430 and nweight = 166340 remained (Table 2). Herring containing information on stomach fullness were nstomach = 211548. For analyses of gonad weight (ngonad = 62216; Table 2) some extra filtering was conducted to remove fish, which may have been mis-staged as immature fish during the subjective gonad staging, as the point here was to focus only on maturing fish. Firstly, only herring aged 4-10+ in maturation stages 3-5 were included. Secondly, for fish in maturation stage 3 (early maturing) those with gonadosomatic index (GSI)< 1.25% (GSI=gonad weight/total weight*100) were excluded. Thirdly, for fish in maturation stages 4-5 (late maturing) those with GSI< 2.5% were excluded. The thresholds 1.25% and 2.5% GSI were chosen because fish with lower GSI did not realistically reflect fish in maturity stages 3 and 4-5 respectively; this assessment was based on visual inspection of scatter plots of gonad weight against fish weight (not shown).
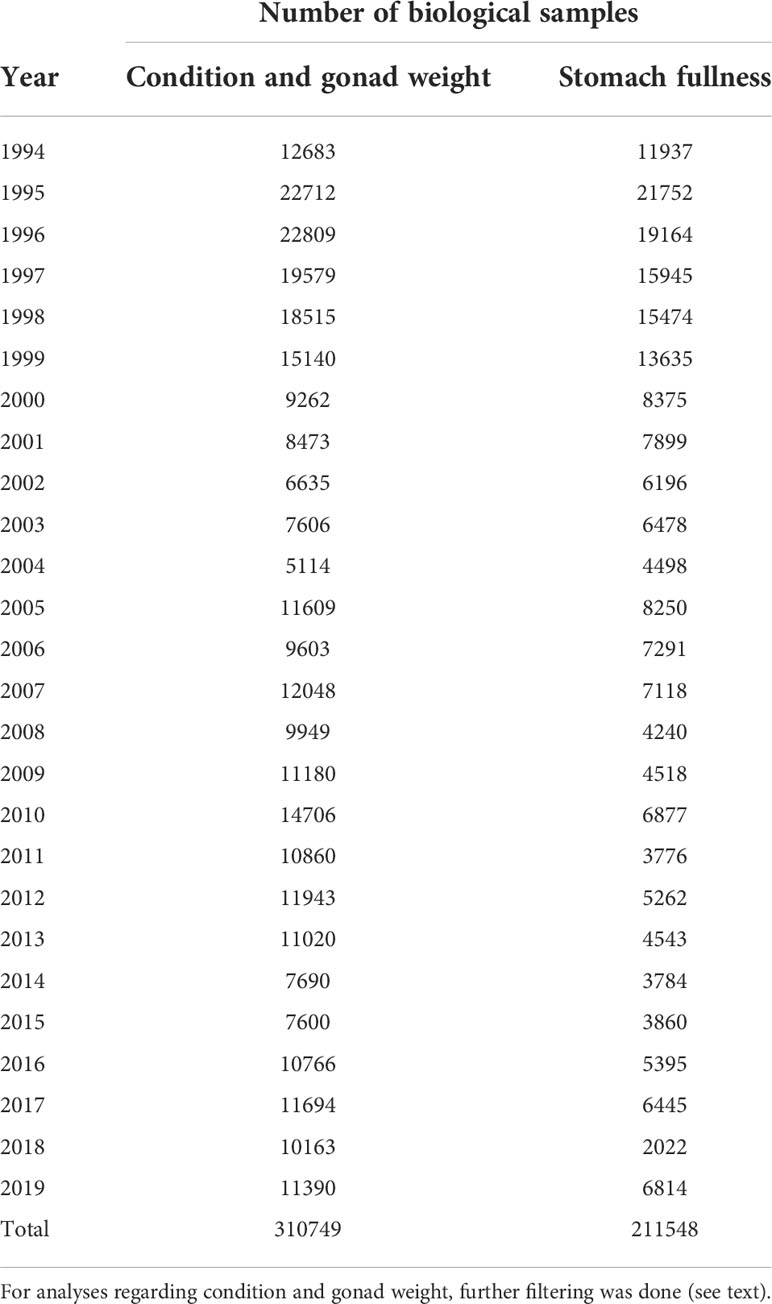
Table 1 Number of biological samples by year, with information on age, older than 2 year and west of 22°E.
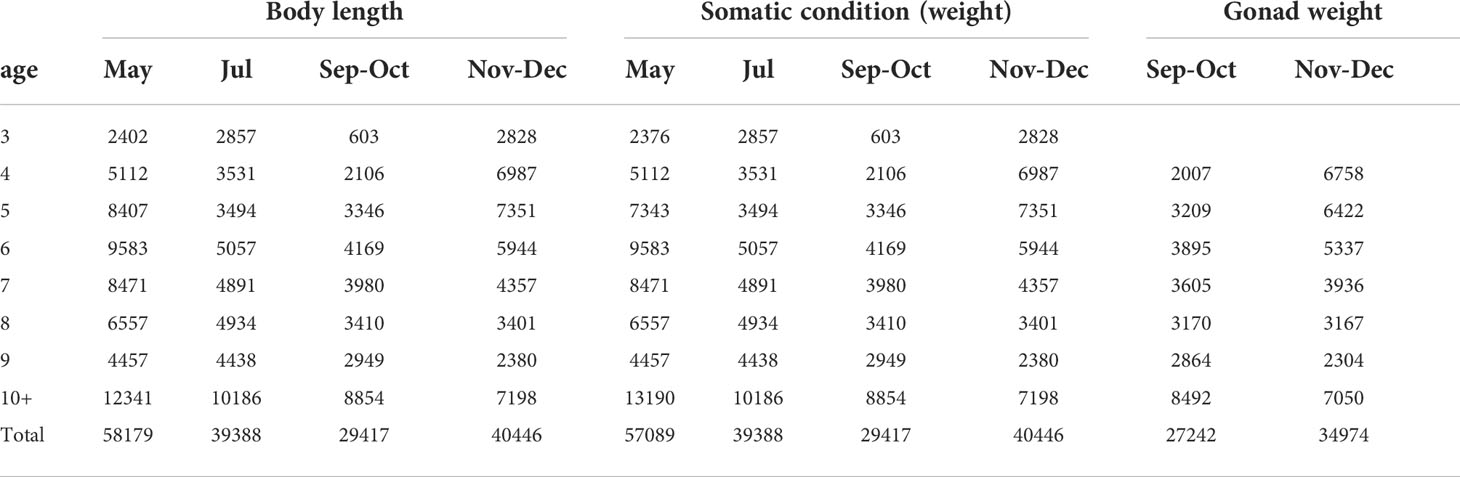
Table 2 Number of fish in each combination of age and season for body length, somatic condition (weight) and gonad weight modelling.
Model description
In order to track herring distribution as well as temporal and seasonal changes in age-based body size, weight, and gonad weight in the Norwegian Sea, we fitted spatiotemporal distribution models for each response variable (body size, weight, and gonad weight) separately for each age group 3-10+ and season (May, July, Sep-Oct and Nov-Dec) for the period 1994-2019. Coordinates in latitude and longitude were transformed to the EPSG:32630 coordinate system before the analysis in order to preserve distances as much as possible (though, no single projection system will be able to preserve distance perfectly with such a large geographical extent).
A total of five covariates were explored in the analysis depending on the response variable analysed (Table 3): the year, total body length, sex, Fulton K (K=100 x weight in g/(length in cm)3), and day of the year;
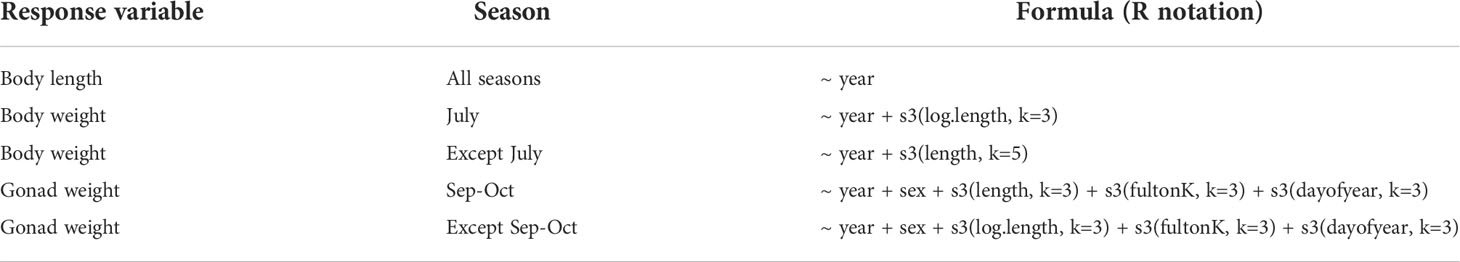
Table 3 List of covariates included in the final models.
where μa(i) is the expected response (body size, weight, and gonad weight) for individual i (total of na observations) of age-season group a (total of A age-season groups). Xa is the design matrix of covariates included in the model for age-season group a, β is the matrix of covariate effects to be estimated. The index j is an indicator of the covariate number and goes from 1 to p. εa(si,ti) is the spatio-temporal random effect value for location si, time ti, and age-season group a that follows a multivariate normal distribution (MVN) with a Matérn covariance structure Σt approximated by the stochastic partial differential equation (spde) approach of Lindgren et al. (2011). The covariance structure Σt is the same for all years. The generic function f is the chosen probability density function to model the response variable Ya with the corresponding dispersion parameter σa and distribution specific parameter θa. This f is selected individually for each age-season group, and response variable, based on model selection and chosen among normal, log-normal, skewed-normal, gamma, tweedie, and student-t distributions (Table S.01). All models were fitted using R (R Core Team, 2021) (code available at https://github.com/holleland/spatiotemporalDynamicsNSSH) and TMB (Kristensen et al., 2016).
For each combination of age-season group, initial selection of covariates was based on visual exploration of the relationship between the five covariates and the response variable (Zuur et al., 2010). All continuous variables were included in the model using thin-plate regression splines as implemented by default in GAM (Wood, 2003; Wood, 2011). From the above model, further adjustments (choice of likelihood function and covariates) were made via residual diagnostics (Q-Q plot as in Hartig (2020) and plot of residuals vs. covariates) until the model showed a reasonable fit (i.e. no signs of under/overdispersion, multimodality, etc) (Supplementary zip). The model configuration was built step-by-step based on best fit for each combination of age and season. Therefore, there was not a predefined list of alternate models, on which for example an AIC-selection could be based on. AIC is otherwise a commonly used criterion for selecting models. Gear effects were not included in the models; when plotted against different gear types (3 general categories), final model residuals did not show any major pattern (Supplementary zip), supporting our approach.
As expected, fish weight and gonad weight increased with increasing fish length (Figure S2 and S3) and this topic was not further explored in this paper. We presented the effect of covariates on the response variable by plotting their marginal effect i.e. the effect of a variable based on the median values for all other covariates included in the final models (Table 3). Therefore, variation in length within age groups could be interpreted as length at age, whereas variation in weight and gonad weights within age groups could be interpreted as variation in somatic condition and gonad development per sex, respectively. Here on, these terms were used when describing the model results. Note also, that somatic condition and length at age did not differ with sex, and therefore sex was not used as covariate in the model for these parameters (Table 3). However, the gonad development was different between females and males; model predictions were shown for females.
To illustrate spatial variations in body growth, somatic condition and gonad development, we mapped the modelled spatiotemporal random effect of herring for each age, season and year (see example for age 7 herring in Figure S4–S6) across the prediction area. The prediction area was delimited by the convex hull of the data points used in each model. For the autumn months the prediction area boundaries were manually adjusted based on the distribution of the fisheries. The spatiotemporal effect can be interpreted as the deviation in the modelled response due to geographical location from an average fish with median values for all covariates. To summarize these maps, we calculated a weighted centre of gravity (CG) for positive (above average) and negative (below average) spatiotemporal deviations by season, age and year, weighted by the magnitude of the effect. The calculations of CG for below- and above-average spots are detailed below for each year t, where loni and lati are the longitude and latitude associated with predicted grid cell i out of totally narea cells and da,ti is 1 if εa(si,t) > 0 and 0 otherwise.
To easier spot trends, we averaged across adjacent age groups and smoothed the temporal trajectories of the CGs across years by a 3-year moving average.
Raw data summaries on weight and length
Raw data summaries on body weight, gonad weights and length were used to supplement the model outputs with regards to marginal effects of the covariate year. There were two main motives to do so. Firstly, it was done to describe the seasonal development in all months and secondly, to highlight the overall differences between the periods [1994-2004] and [2005-2019]. In order to allow comparing weights among seasons and years, the body weight and gonad weight material was standardised to only include fish of length 33 cm, which was the modal value for length in the full dataset. Length, which is more affected by density dependence, was standardised to average length of age 6 per year. Only years with data for at least 8 months were used to produce 3-month running averages before taking averages over the periods [1994-2004] and [2005-2019]. Herring at 33 cm and six years old are representative for sexually mature herring.
Feeding activity and fisheries’ location in August-September
Subjective data on stomach fullness were analysed to give a simple description of the relationship between proportion of non-feeding herring (empty stomachs) and how southerly the targeted herring fishery was in August-September. The season August-September was chosen, because in these months in the early years in the study period the entire stock had already migrated to the wintering areas. In the latest years there has been no fishery in the traditional northern wintering areas in August-September. The latitudinal location of the herring fisheries was used as proxy for a position on a south-western – north-eastern axis. A more southerly position indicated herring still being in the south-western feeding areas. The relationship was tested by linear regression.
Note, that information on stomach fullness was only available for the Norwegian material, which rarely are obtained from the western part of the study area off Iceland. Therefore, stomach fullness data are not representative for the whole stock throughout the year, but they are used here as an indication of feeding activity in the stock in August-September. Landings were, however, represented by the combined Faroese, Icelandic and Norwegian catches, because in later years the Norwegian catches have been very low in August-September, and therefore the catch area was not estimated to be representative of a targeted herring fishery.
All figures and analyses for this paper were produced using R (R Core Team, 2021), except Figure 2, which was produced using MatLab.
Results
Large scale changes in fishery
Over the period 1994-2019 large-scale changes in the herring fishery in the Norwegian Sea were observed with a shift in both timing and distribution showing a main tendency to occur progressively later in the year and further to the southwest (Figure 4).
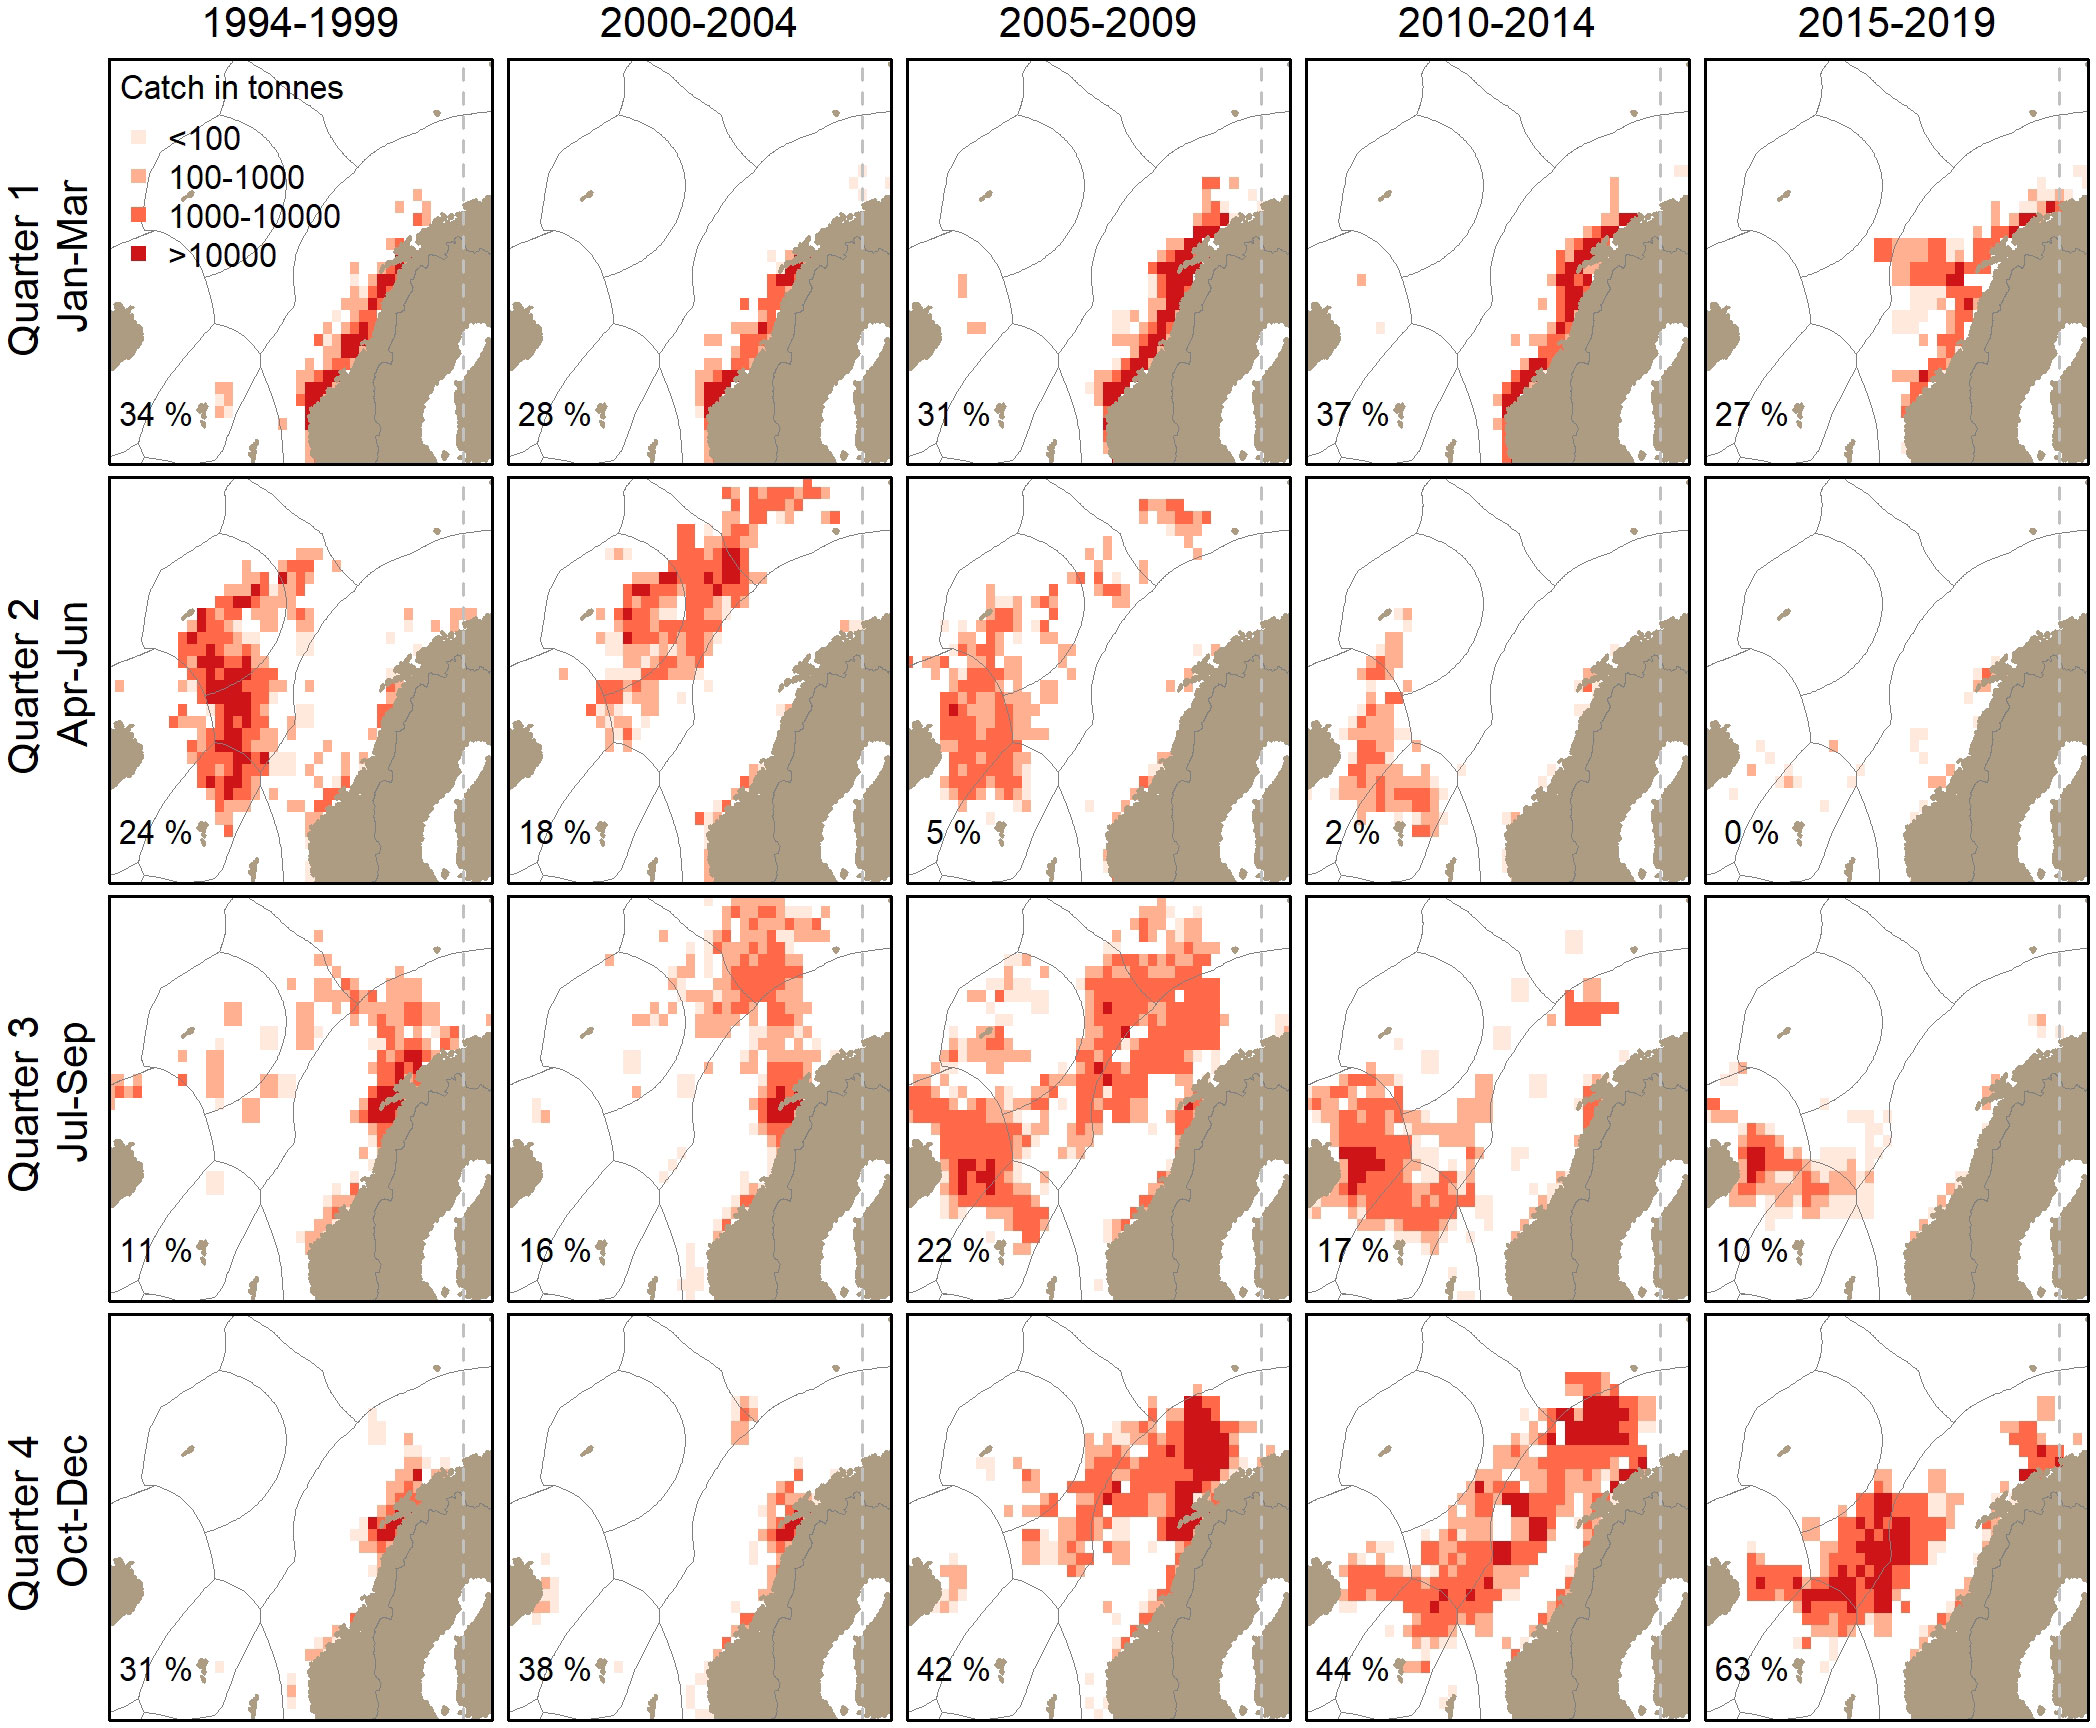
Figure 4 The Norwegian spring-spawning herring fisheries of the Norwegian, Icelandic and Faroese fleets by quarter of the year in five-year intervals over the study period 1994-2019. Data are shown as sum of landings within a statistical rectangle (0.5° latitude, 1° longitude). Grey lines indicate national exclusive economic zones. In bottom left corner is given the percentage of the quarterly catch in relation to all year in the given period.
The fishery in the main spawning period in first quarter has been quite stable and consistently conducted along the Norwegian coast since 1994 constituting between 27% and 37% of the total annual herring fishery.
Early in the feeding season in second quarter there has been large variability in the herring fishery. The first years, there was a significant (24%) fishery in the central Norwegian Sea extending towards the Iceland-Faroe ridge. In the period 2000-2004 there was still a large fishery, but the fishery had moved farther north in the Norwegian Sea. Since around 2005, the fishery again was closer to the Iceland-Faroe ridge, but only small quantities were taken and in the latest years it was less than 1% of the annual catches.
In third quarter the fishery constituted between 10% and 22% of the total annual landings, with highest percentages in the period 2005-2014. In the earlier years the vast majority of the catches were taken in northern Norway, but gradually over the years the main fishery in the third quarter moved first to the Norwegian Sea and then southwest to the Icelandic shelf edge from around 2005.
In the fourth quarter the relative catches increased persistently from 31% in the mid-1990s to 63% in the latest years. Further, the fisheries in fourth quarter started shifting westward from around 2005, i.e. from the Norwegian coast to also be in the oceanic waters off the Norwegian shelf, then into the central Norwegian Sea and the Icelandic shelf edge in later years.
Changes in modelled somatic condition
In the early part of the time-series, herring generally reached maximum somatic condition (weight at age) in July or September-October and then weight decreased over the autumn months (Figures 5D–F). This pattern changed around 2005, after which herring continued to add weight into the autumn months.
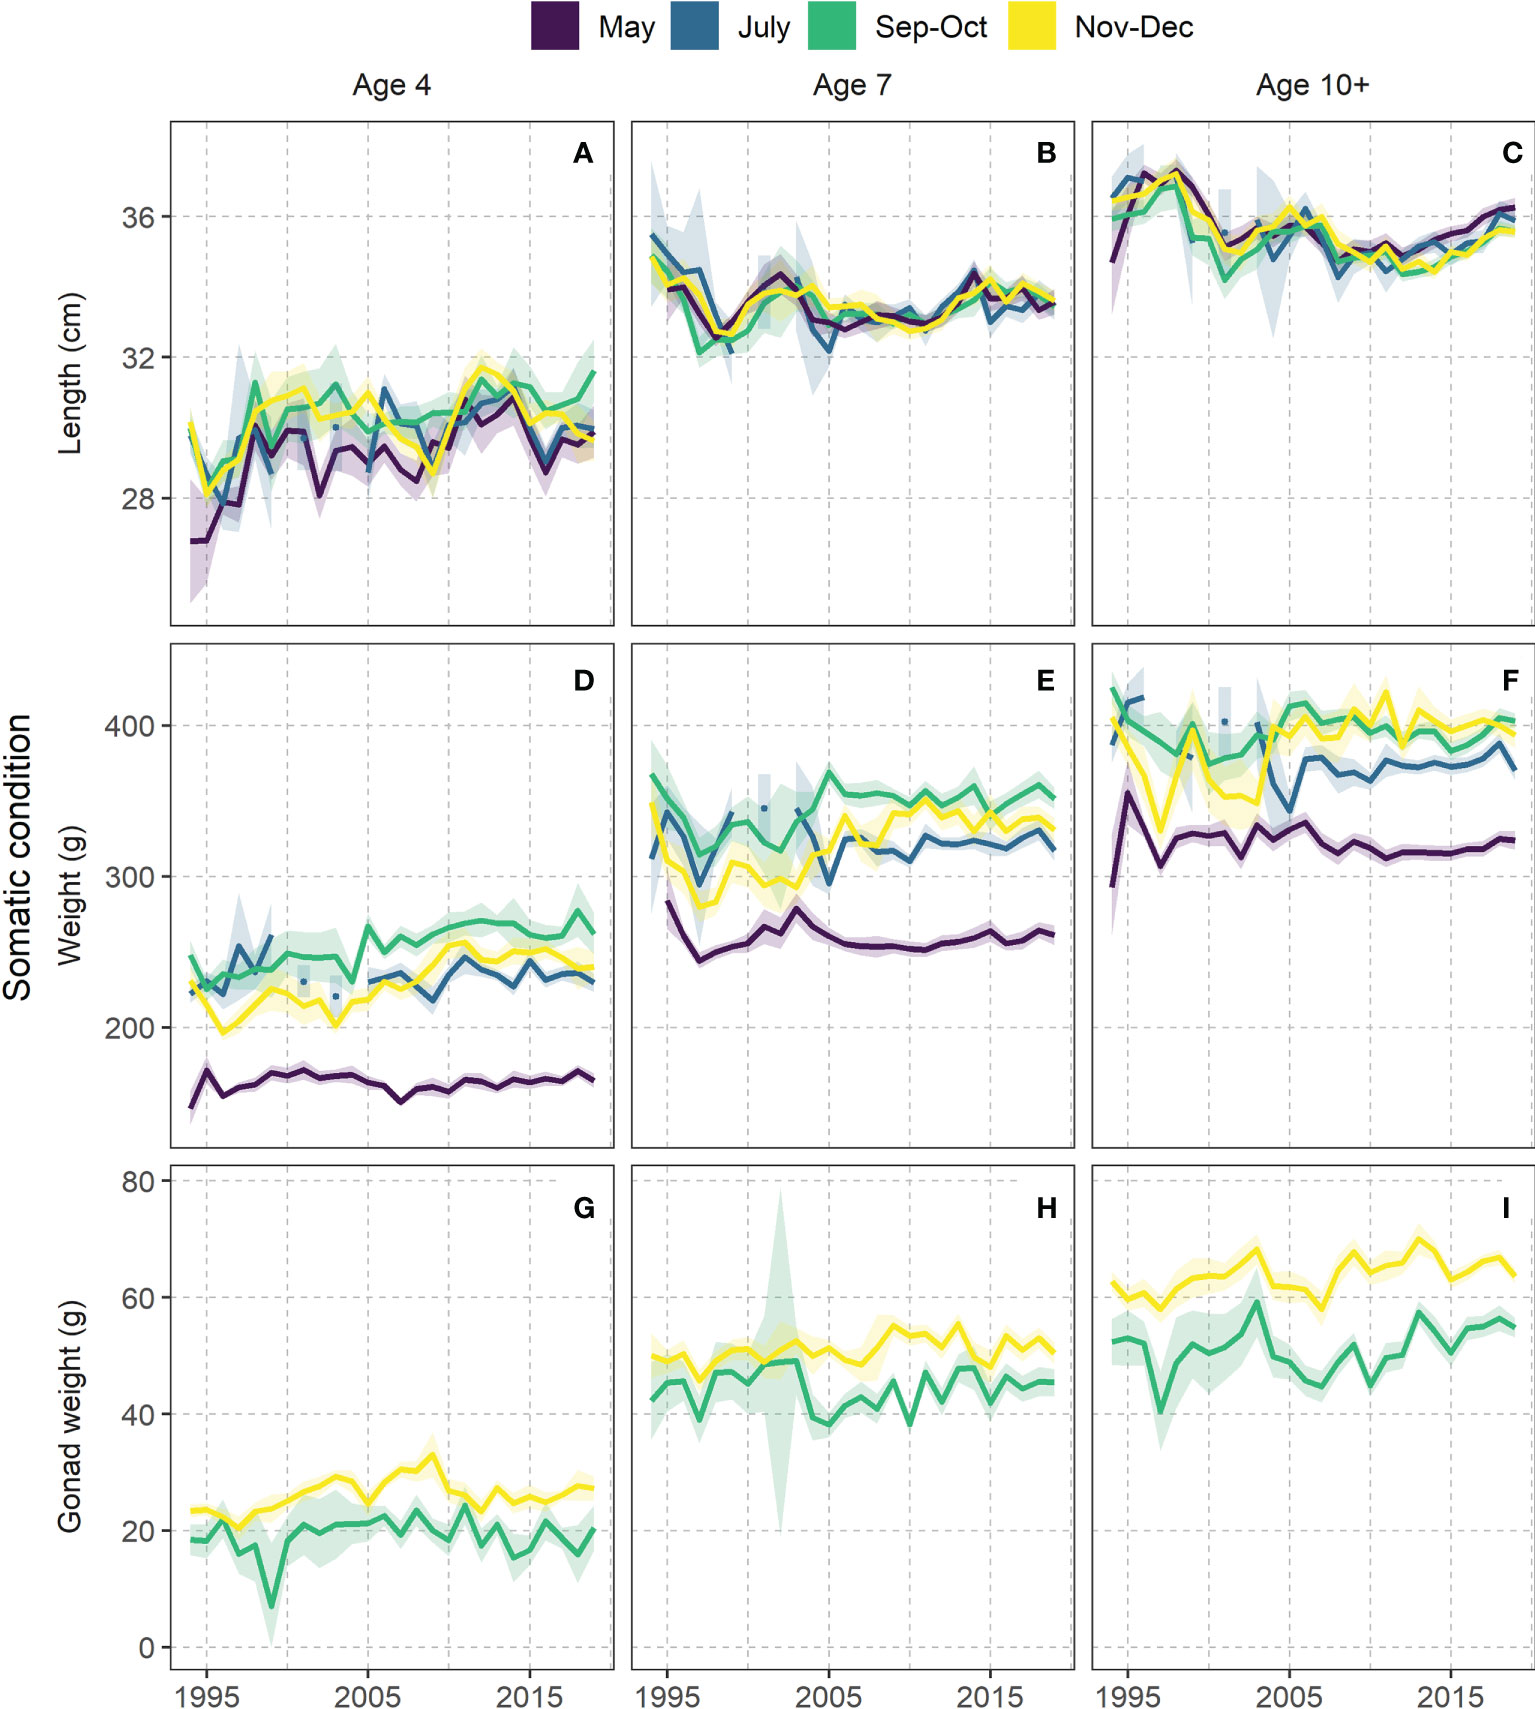
Figure 5 Marginal effects of sampling year and season on length at age (A–C), somatic condition (D–F) and gonad development (G–I) from the spatiotemporal model. Presented for ages 4, 7 and 10+ (age 10 and older). All covariates except year were fixed at their median observed values and spatial effect set to zero. For detailed depictions including all ages, see Figure S6A-C.
The modelled somatic condition varied much interannually during the first ten years of the study period, which started with a decline in weight in September-October of all age groups from 1994 to 1997. This was followed by a general but variable increase until around 2005, after which the September-October weights were both higher and more stable than before 2005.
The weight addition after 2005 in September-October was seen across all age groups, but for the oldest herring the maximum weight was even maintained into November-December (Figure 5F). This was a gradual shift where the older the fish got the higher the November-December weights tended to be (Figures 5D–F, S7 middle row).
The difference in somatic condition between May and December was generally higher after 2005 than in earlier years. The raw data summaries of body weight at 33 cm supported the model results (Figure 6A). In both periods, herring started after spawning with the same initial weight, but it developed differently over the rest of the season clearly being higher from September onwards in the period after 2005 and was maintained until spawning.
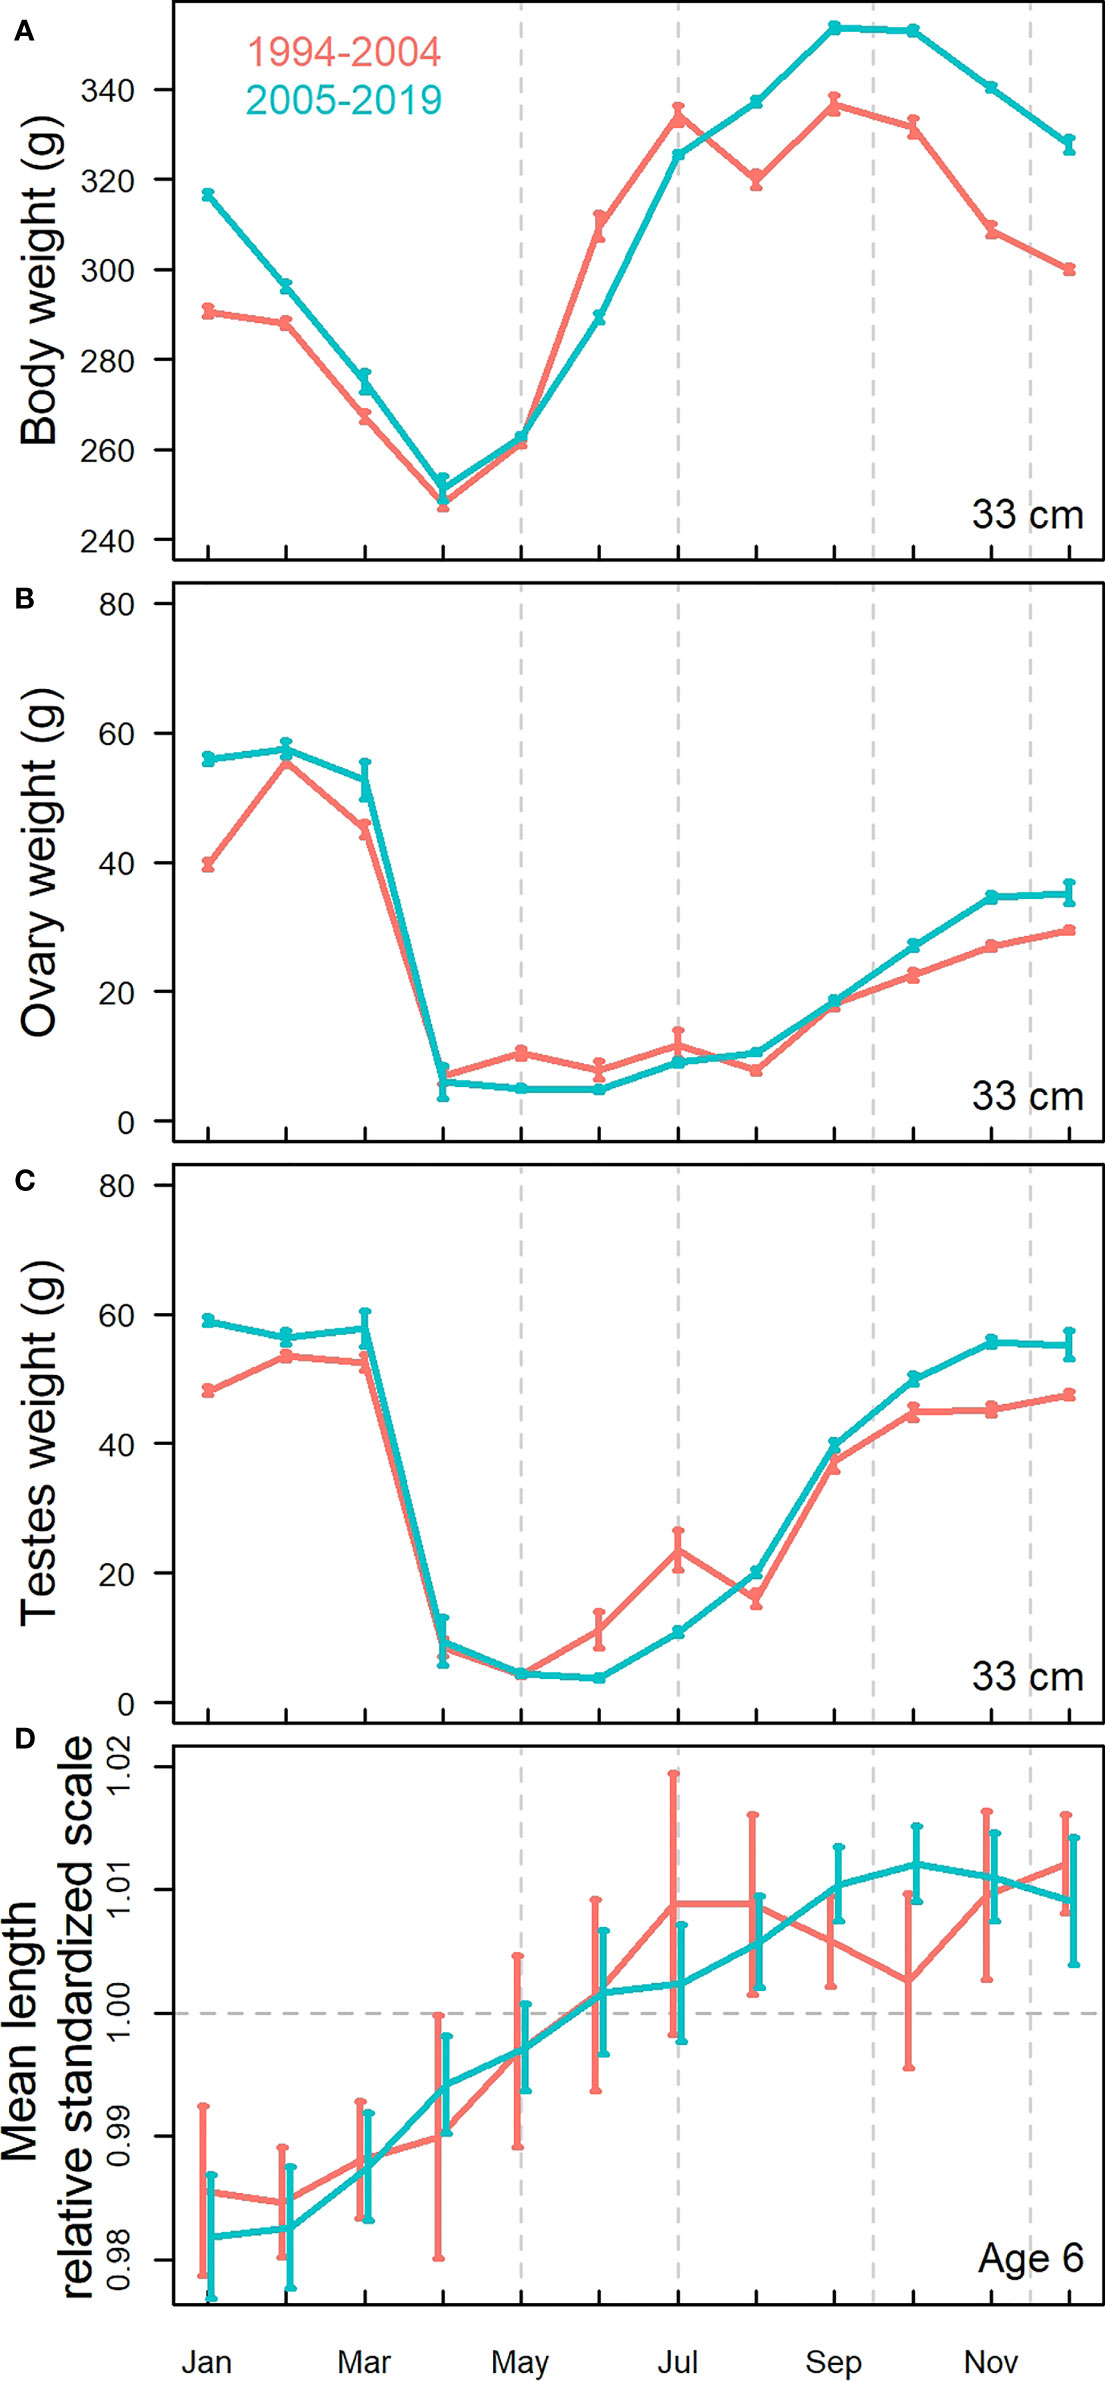
Figure 6 Seasonal variation based on raw data summaries showing monthly development in (A) weight (standardized at 33cm length) and gonad weight (standardized at 33 cm length) for (B) females (ovaries) and (C) males (testes) and (D) standardized mean length compared between the periods before (red) and after (green) 2005. The error bars indicate 95% confidence intervals of the means.
Changes in modelled gonad development of females
Modelled gonad weight in September-October was generally more variable in the earlier part of the study period than in the latest years (Figures 5G–I). The weight addition from September-October to November-December was larger after 2005. This pattern was increasing with age (Figures 5G–I, and S7 bottom row).
The highest gonad weights in November-December were reached when the somatic condition in the same months was high (Figures 5F, I). The male gonads (testes) had also added more weight in winter in the recent years as compared to the earlier period (Figure 6C). The autumn/winter weights were higher for males than for females (Figures 6B, C).
The gonad weights of maturing herring of both sexes were also clearly higher in the period 2005 and later than in the earlier period (Figures 6B, C), and the difference between the two periods was evident over all months October-January, from early maturing until the pre-spawning stages.
Changes in modelled length at age
The temporal trend in modelled length at age showed large variability in the earlier part of the study period (Figures 5A–C). For lengths of older fish, the large variability ceased around 2005, after which there were some years with generally small lengths. There was, however, a year-class effect, where minimum length occurred first for the younger fish and then gradually later for the older ages. These minima in lengths some years after 2005 concurred with stable high weights after 2005.
The youngest fish grew most in length from May to July (Figures 5A and S7 top row) and in some years until September-October. With increasing age, the length addition over the feeding period was not discernible with our modelling approach. The raw data summaries (Figure 6D) supplemented with the results that six year old herring, which were largely sexually mature, had on average added most of the length before July. There was no significant difference between the periods [1994-2004] and [2005-2019], but in the period after 2005 there were indications that length was added further into autumn as compared to the period before 2005.
Modelled centre of gravity
The centre of gravity of the sampled herring showed that the whole population tended to move in the south-western direction after 2005 for all seasons analysed, regardless of whether the body length, weight and gonad weight was above or below average (Figure 7, Figures S8-10).
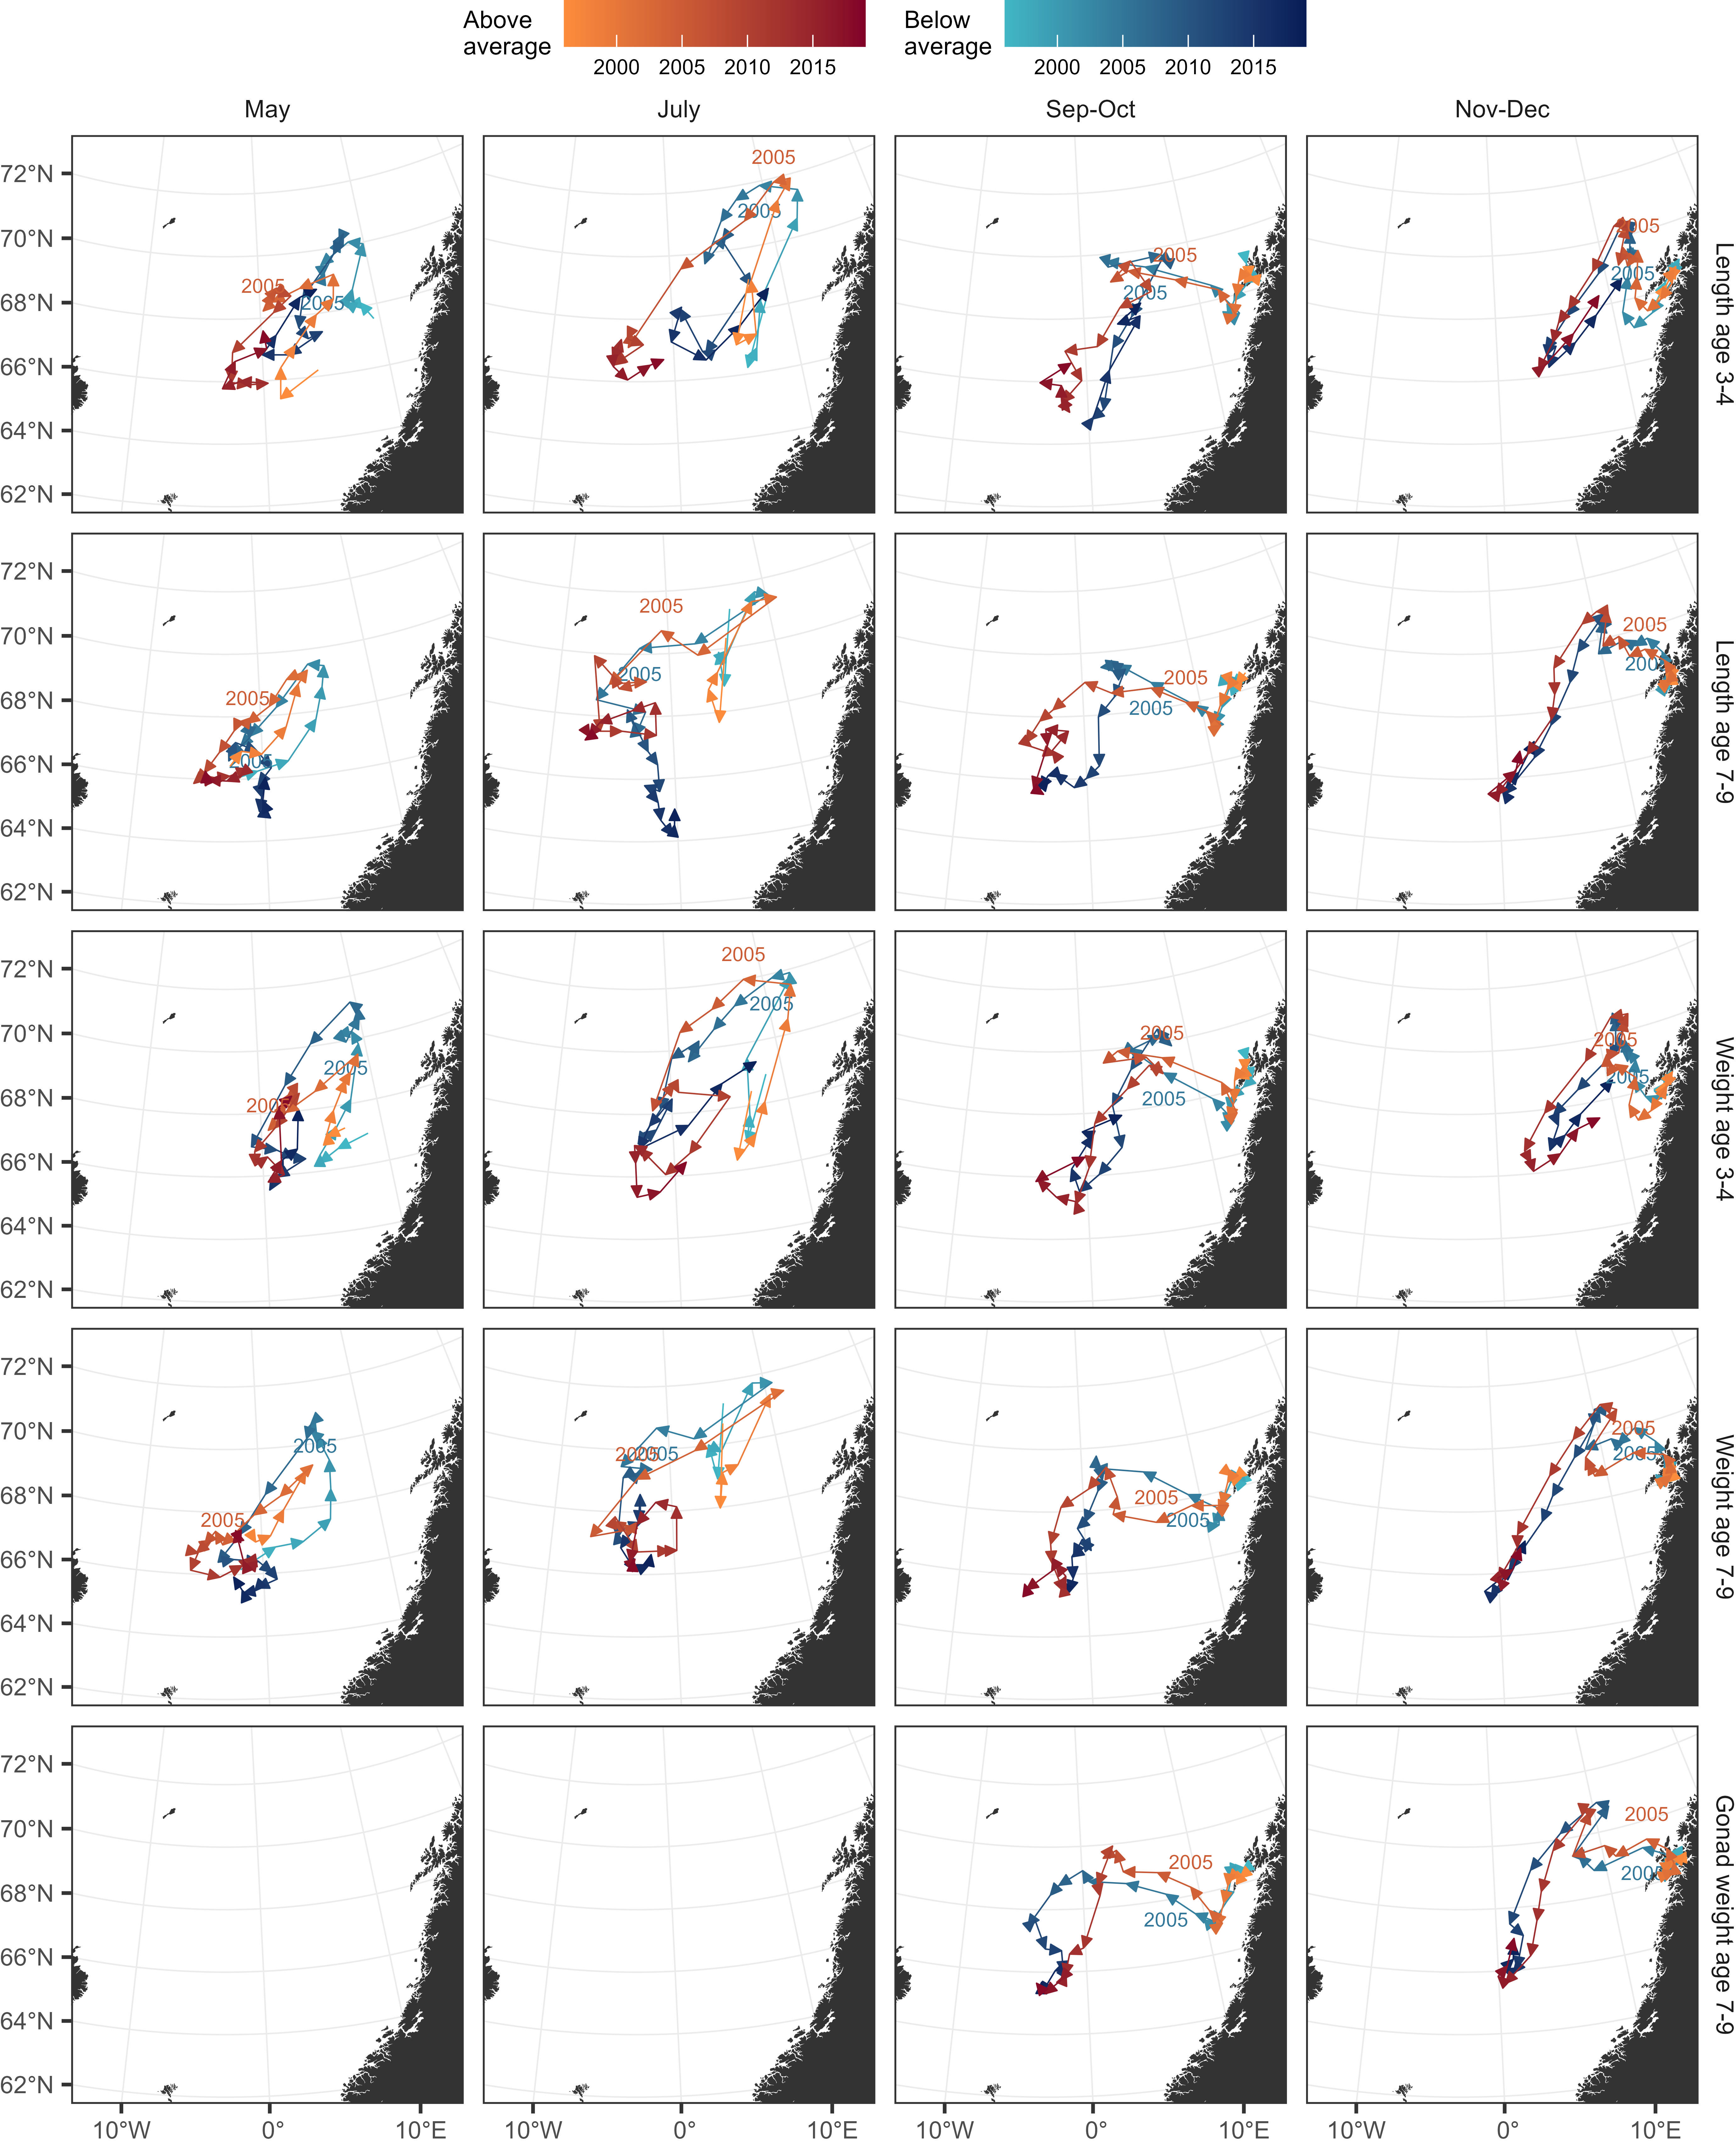
Figure 7 Modelled spatiotemporal changes in centre of gravity (CG) for ages 3-4 and 7-9 for length, weight and gonad weight (horizontally) and season (vertically). The variations in CG are shown split between two groups of herring having body length, fish weight and gonad weight either above (red) or below (blue) average. For detailed depictions including all ages, see Figures S8A-C.
The tendency of being distributed to the south-western area increased with age and for body length and somatic condition within ages for all seasons. In July, an exception was older herring below average length and somatic condition, which in later years were shifted in a south-eastward direction; this was possibly an artefact of North Sea herring being sampled.
Contrastingly to the general pattern of length and somatic condition, the herring with above average gonad weights in September-October were found farther east than those with below average gonad weight (Figure 7, bottom row).
In November-December there were no apparent differences between below and above locations in any of the investigated parameters.
There were also indications that in the latest years of the study period, the above and below average fish were distributed in the same area. This pattern was clearest for older fish in September-October.
During the period 1997-2005, there was an opposite tendency in the population, towards moving in the north-eastern direction in May and July. This was linked with the much more eastern distribution in autumn (September-October, November-December) during this period.
Feeding activity and fisheries’ location in August-September
There was a significant linear relationship (R2 = 0.44; p = 0.0004) between the proportion of non-feeding herring in August-September, based on Norwegian samples, and the latitudinal centre of gravity of the commercial herring fishery of the combined fleets of Norway, Iceland and Faroes (Figure 8). The proportion of non-feeding herring (empty stomachs) was lowest when the fishery was most southerly (and in reality south-westerly (Figure 4, Jul-Sep)). The development over time showed that there was a shift around 2010, after which the fisheries were more southerly and lower proportions of non-feeding herring.
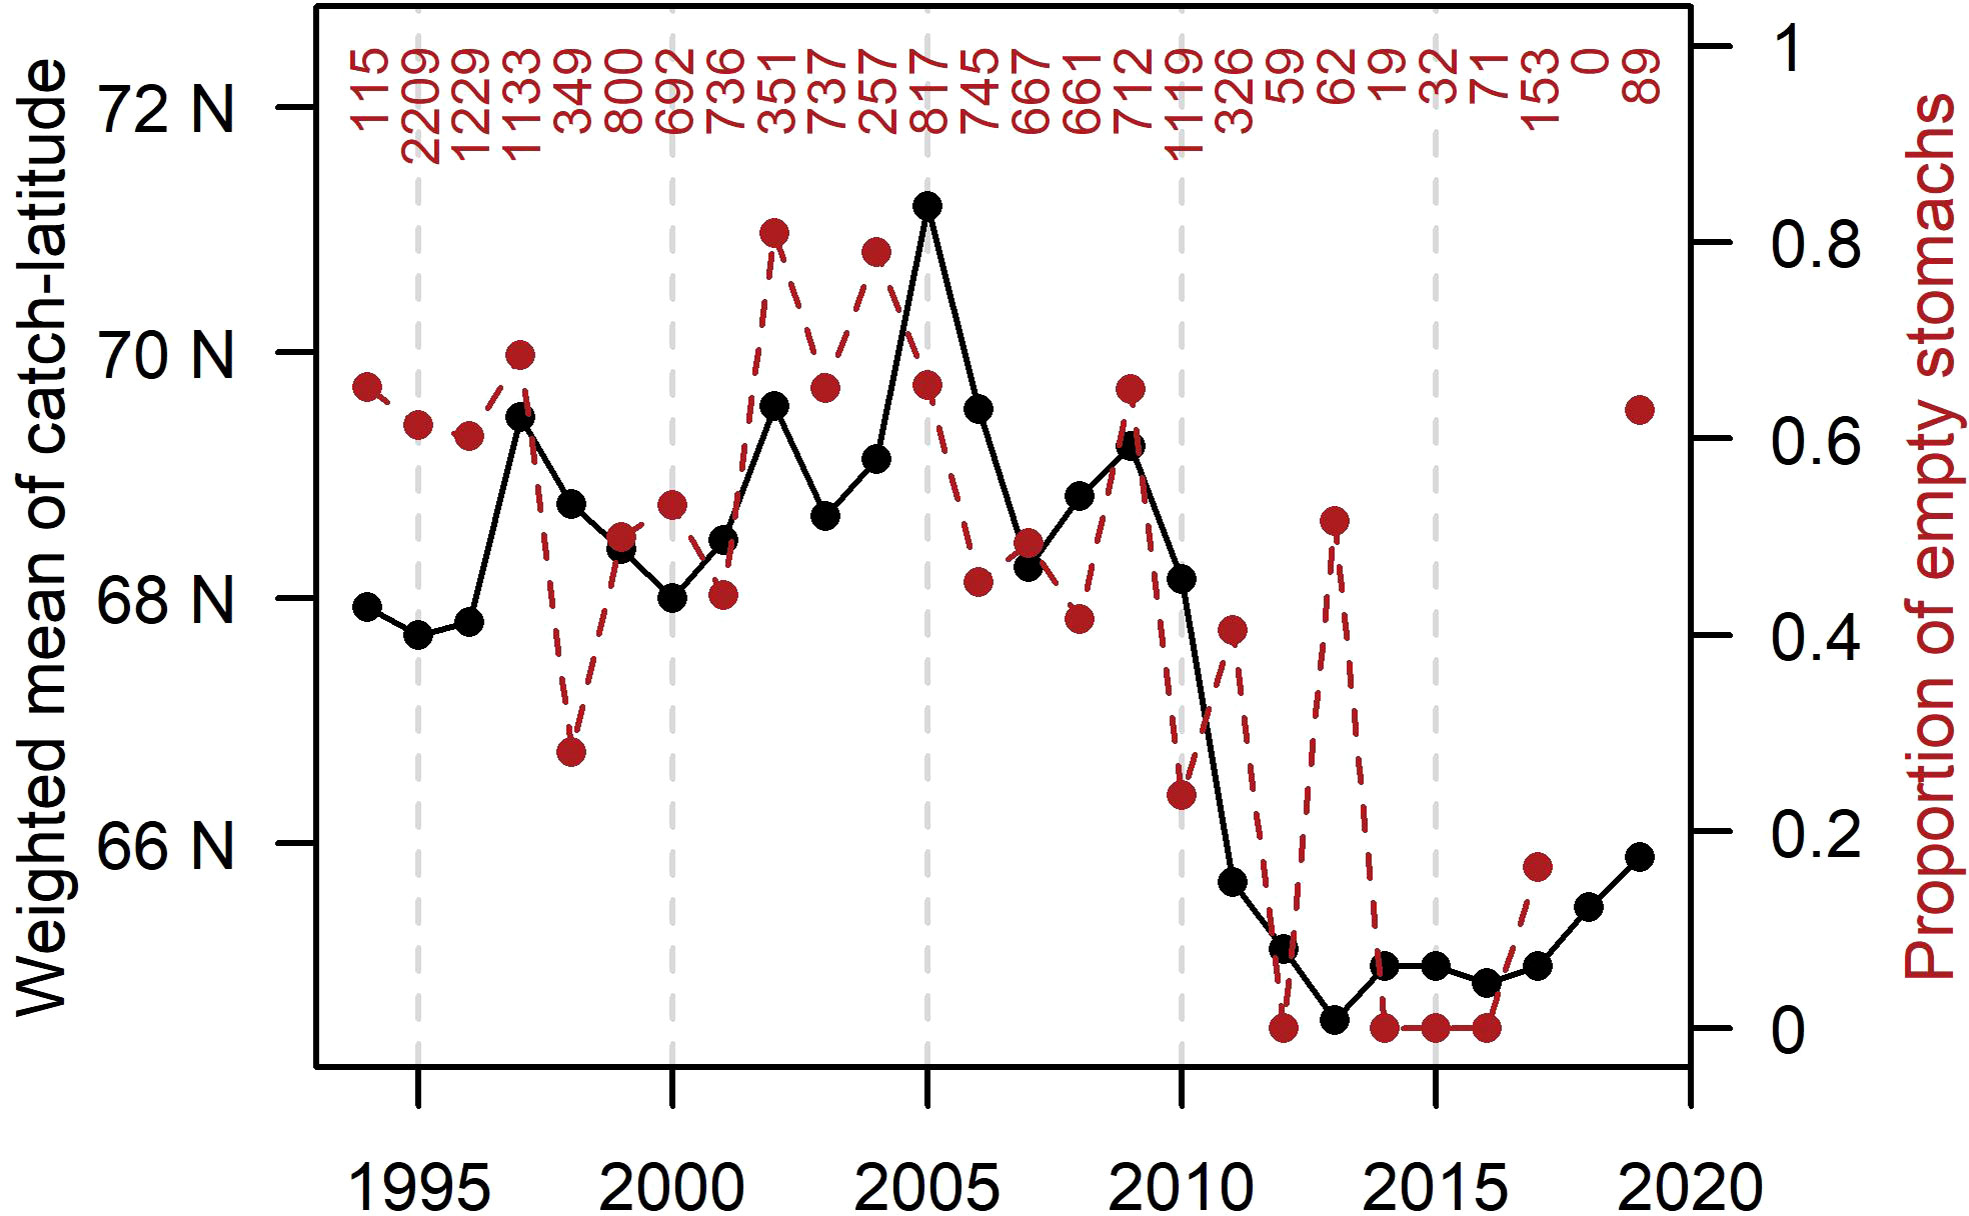
Figure 8 Interannual development of weighted average catch latitude (from combined Norwegian, Faroese and Icelandic fleets) and proportion of empty stomachs (based on Norwegian samples) in August-September. Number of fish analysed for stomach fullness per year is indicated at the top.
Discussion
Over the study period the herring population showed a clear tendency of being distributed progressively farther in the south-western part of the Nordic Seas during the feeding period. This tendency increased with age, and length and somatic condition within age groups. Herring also had an increasingly delayed return to wintering areas farther east in Norwegian coastal and offshore waters. Furthermore, there was a clear change in somatic condition towards stable high levels after 2005 as well as increased gonad investment. Herring length at age also stabilized around 2005, but at relatively small sizes. The identified changes were most notable for the oldest fish (10 years and older). The described changes in the biological parameters of herring were concurrent with marked oceanographic changes and with a phenological shift in the zooplankton community.
Extended feeding period
Our hypothesis, that herring had extended their feeding period into autumn, was supported by spatiotemporal modelling. After 2005, the weight gain between July and September-October was higher than before 2005. The additional full-year data added that herring started after spawning with the same initial weight both before and after 2005, but the weight addition was larger after 2005, particularly from September onwards and the somatic weight remained high until spawning.
The feeding activity investigations also supported the prolonged feeding hypothesis, but here in terms of a spatial relationship. When the fishery in August – September was in a south-westerly position the proportion of empty stomachs was low. That is, when the herring was distributed towards southwest it was most likely still feeding during early autumn.
South-westward shift in distribution
The change towards a more south-westward feeding distribution of herring after 2005 is likely linked to both spatial differences in prey distribution and prolonged prey availability. History has shown that herring migrations after spawning at the Norwegian coast typically has been in the western direction towards areas north of Faroes and further west into north-east Icelandic waters (Dragesund et al., 1997; Eliasen et al., 2021). The current south-western distribution of herring in the feeding season (Eliasen et al., 2021) is similar to the feeding distribution prior to the stock-collapse in the 1960s (Dragesund et al., 1997).
The south-western areas are in general very productive with high prey availability for herring (Kristiansen et al., 2016; Kristiansen et al., 2019; Melle et al., 2020; Kristiansen et al., 2021). The high stomach fullness west of the Jan Mayen front (Melle et al., 2020) illustrates the importance of these frontal areas in the annual migrations of herring. Further, the south-western autumn fisheries have in the latest years congregated near the East-Icelandic shelf edge, indicating that productivity has been high in this area also late in autumn. The observed fishing patterns for herring can to some extent reflect behaviour of the fishing fleets caused by e.g. fisheries management and changes in agreements among the fishing parties to this stock. Such artefacts are, however, not explaining sufficiently the observed south-westward changes in the fishing pattern after 2005, because all nations - also those not hampered by regulations - changed the fishing pattern in the south western direction.
The shift in distribution towards the southwest after 2005 was seen over all months studied, which indicates that prey availabilities may have been higher near Iceland, compared to other parts of the Nordic Seas during the entire feeding period. The analyses of centre of gravity showed a more south-westward distribution of herring with above average somatic condition in May and July. However, herring with above as well as below average somatic condition followed the same change in migration pattern. They basically all tended to shift distribution in same south-western direction over the study period, likely a result of aggregating more in the productive frontal areas in southwest. This tendency of shifting distribution towards southwest increased with increasing age, and length within age groups in accordance with the size dependent migration hypothesis (Nøttestad et al., 1999; Eliasen et al., 2021). The size dependent migration hypothesis provides an alternative explanation to the superior somatic condition observed in the southwestern region, which may apply particularly early in the feeding season.
It is, however, to be noted that the migration patterns have shifted quite suddenly in the opposite direction as well. A detailed study on the acoustic abundance of herring in May showed that during the period 1999-2004 the herring feeding area was shifted northwards (Eliasen et al., 2021). This northward shift was also evident in the centre of gravity in the biological samples and in the fisheries dynamics during spring and summer 2000-2004 demonstrated in the present study.
This northward shift in the feeding area happened after a period with rapid declining somatic condition during 1994-1997 to lowest levels over the time series in the present study, which also influenced the reproductive potential through atresia in the herring with poorest condition (Óskarsson et al., 2002). Hence, this major drop in somatic condition in 1997 and the following north eastward shift in feeding distribution suggest that the areas along the fronts in the south-western part of the Norwegian Sea were less productive or otherwise inhabitable in the late 1990s, as discussed by Eliasen et al. (2021).
Somatic condition and gonad development
The spatiotemporal modelling demonstrated that the extra energy gained from improved feeding conditions in combination with extended feeding period was reflected in the gonad investment of the herring, with gonad weights being higher after 2005. The main indication of the increased gonad investment after 2005 was the increase in gonad weight between the early (September-October) and late (November-December) autumn, which was tightly linked to somatic condition and age. The oldest fish were able to maintain high somatic condition until late autumn and had the largest increase in gonad weights from early to late autumn. This is again likely linked to the fact that the oldest herring with the highest migration potential, in accordance with the size dependent migration hypothesis (Nøttestad et al., 1999; Eliasen et al., 2021), in fact were the ones migrating farthest west and gaining most from the extended period with available prey.
Both the change towards better somatic condition and higher gonad weights supported the previous results from dos Santos Schmidt et al. (2020). They further noted different trends for condition and body growth in terms of length. They specifically linked the differences in allocation of energy to condition and gonad investment versus body growth, to the warming of the Norwegian Sea, herring stock size and inter-specific competition from mackerel (Scomber scombrus).
Mackerel has large diet overlap with herring (Prokopchuk and Sentyabov, 2006; Langøy et al., 2012; Bachiller et al., 2016; Óskarsson et al., 2016). In addition to diet overlap, dos Santos Schmidt et al. (2020) argued that the mackerel became more widely distributed in the Nordic Seas after the turn of the century (Olafsdottir et al., 2019), which lead to herring and mackerel occupying overlapping habitats as well (Huse et al., 2012; Utne and Huse, 2012). Similarly, herring abundance has been shown to affect growth of North East Atlantic mackerel (Ólafsdóttir et al., 2016). Our results suggested that, overall, the somatic condition and reproductive investment of herring did not decrease during this period of inter-species overlap with mackerel. This suggests that herring has adapted to the changed conditions, both oceanographic changes and inter-specific competition by utilizing the available resources further into the autumn months.
The finding, that reduced herring body growth in terms of length was concurrent with increasing somatic condition and investment into fecundity (dos Santos Schmidt et al., 2020) may in fact be linked with this postponed timing in energy gain over the growth season. Our study demonstrated that, on average, body growth in terms of length of sexually mature herring ceased during summer around July when onset of maturation normally is occurring (dos Santos Schmidt et al., 2017). Under such conditions where energy is gained late in the season and maturation processes already have started, allocation to body length may be prevented by the internal hormonal control, leaving more as reserves for spawning migration and gonad building. This has been shown for other teleost species (Bhatta et al., 2012). Whereas the final allocation into fecundity appears to be related to available energy, the onset of maturation does not appear to have changed throughout the study period. This is consistent with the onset of maturation being governed by other factors such as genetics and photoperiod (Han et al., 2020; dos Santos Schmidt et al., 2022).
Possible links to oceanography and lower trophic levels
In the early 1990s the central Norwegian Sea was cooling with minimum heat content around the turn of the century (Asbjørnsen et al., 2019). After the mid-1990s, the north Atlantic subpolar gyre declined markedly, resulting in much increased temperatures and salinities in the Atlantic inflows from the north eastern Atlantic into the Nordic Seas (Hátún et al., 2005). Advective time lags of these hydrographic anomalies, in addition to reduced regional ocean heat losses to the atmosphere led to a marked warming in the central Norwegian Sea after 2002 (Asbjørnsen et al., 2019; Mork et al., 2019). Around the turn of the century, the dynamics of the Norwegian Sea Gyre also exhibited large variations (Hátún et al., 2021) first towards a strong gyre in 1999-2000 and then towards a weak gyre in 2002-2003. Such shifts in oceanographic conditions may in turn affect herring.
The warmer environment after 2005 may have improved the herring growth potential as it has been shown to increase with temperature (Brunel and Collas, 2010; Hunter et al., 2019), given high availability of prey.
The herring feeding migration is to large degree governed by the production of its preferred prey C. finmarchicus, which has a seasonal development linked to dynamics in the phytoplankton blooms (Broms and Melle, 2007). The interannual variability in the primary production in the Norwegian Sea is mainly driven by the transport of nutrients into the area from neighbouring waters. This is a possible mechanism for how climate can be an important driver for the availability of biological material in the food web (Skogen et al., 2007; Skagseth et al., 2022). In their updated ecosystem review, ICES (2021a) state that annual primary production in the Norwegian Sea has ended later in the year and been higher during the period 2013-2019 compared to 2005-2012, likely caused by increased inflow of cold and fresh water that has higher nutrient concentrations.
The variability in the Norwegian Sea Gyre is linked to the input of colder East Icelandic water into the Norwegian Sea. This, in turn, governs the relative contribution of both C. hyperboreus and large overwingering stages of C. finmarchicus, which are both important as prey to herring early in the feeding season (Kristiansen et al., 2019; Kristiansen et al., 2022). The influx of subarctic waters from the Iceland Sea is also a key nutrient source for the Norwegian Sea (Skagseth et al., 2022).
The meso-zooplankton biomass, as observed during the international ecosystem survey in the Norwegian Sea (IESNS) from late April to early June, is frequently used as a biomass index of lower trophic levels. Zooplankton biomass based on this index has also been suggested to explain growth conditions for herring (Huse et al., 2012; dos Santos Schmidt et al., 2020).
After being at relatively stable high levels 1995-2003 the zooplankton biomass index showed a dramatic drop during years 2003-2010, followed by a slow increasing trend until today, when levels again are comparable to the period prior to 2003 (ICES, 2021a). The observed trend is similar in all regions with some years lag in the colder areas off northeast Iceland and the Jan Mayen Front.
The observed changes in both body growth and somatic condition of herring in May tended to follow the same trend as the zooplankton biomass index, both of which were based on data overlapping in time and space. However, despite this apparent match between zooplankton abundance in May and the concurrent body growth and somatic condition, one may conclude from the present results that poor feeding conditions early in the feeding period are not necessarily detrimental for the herring’s potential to gain weight over the feeding period.
Our results support a prolonged feeding period after 2005. It remains, however, unsolved what type of prey the herring fed on to be able to gain condition in autumn. A second generation of C. finmarchicus developing in late summer-autumn (Kristiansen et al., 2016; Strand et al., 2020; Skjoldal et al., 2021), which could sustain prolonged feeding opportunities for herring far into the autumn, is a reasonable explanation. But it cannot be excluded that other types of prey have been even more important.
Previous studies of herring diet have shown that they may shift to bigger prey like amphipods and euphausiids in July-August (Dalpadado et al., 2000; Bachiller et al., 2016; Óskarsson et al., 2016), especially in the western areas in more Arctic waters. These taxa may, however, also be important predators of C. finmarchicus copepodites (Melle et al., 2004; Skjoldal et al., 2004) taking advantage of a second generation of prey in autumn themselves.
Conclusion and outlook
Here we have demonstrated that the Norwegian spring-spawning herring have extended the feeding period in the south western part of the feeding area in the Nordic Seas. By doing so, they have managed to gain weight into the autumn months and thereby also enhance allocation of energy into gonads. Our results indicate that the somatic condition and available energy for gonad development and migrations is likely of higher importance for herring than length at age. Our results demonstrate that there are processes in the ecosystem in the Nordic Seas from May to late autumn that enhance the pre-spawning condition and reproductive investment of this stock, even though it has less effect on body growth in terms of length. The good pre-spawning condition and reproductive investment in later years has, however, not manifested itself in generally improved recruitment to the herring stock (Figure 1).
The timing of both primary production (Skogen et al., 2007; ICES, 2021a) and zooplankton production (Kristiansen et al., 2016; Strand et al., 2020; Skjoldal et al., 2021) may shift to such a degree that an index measured at the same time every year may not fully grasp actual fluctuations in the production. The Norwegian Sea is clearly a dynamic region affected by varying oceanographic features linked to climatic changes (Asbjørnsen et al., 2019; Mork et al., 2019; Hátún et al., 2021) that can alter such important seasonal processes. We have only briefly touched on the potential effects that climate variability may have on important seasonal dynamics in the ecosystem and resources therein. Future monitoring and studies should therefore also focus on processes happening later in the year. Specifically, we encourage studies on zooplankton and further diet investigations of herring and other main predators on zooplankton in the Norwegian Sea in the autumn months.
Data availability statement
Inquiries regarding data availability can be directed to the corresponding author.
Ethics statement
Ethical review and approval was not required for the animal study because samples were taken from commercial catches and from scientific research trips. No specific ethical review and approval were needed for this monitoring.
Author contributions
EH, AS, and GÓ developed the main ideas. All authors structured the framework for the modelling and analyses. KO was the main responsible for model analyses of condition and gonad development and wrote the corresponding sections in the article with contributions from SH. EH compiled all data and analysed data with regards to fisheries dynamics and feeding. EH and AS wrote the manuscript, with feed-back from GÓ, KO, and SH. All authors contributed to the article and approved the submitted version.
Funding
This study was partly funded by the project “Sustainable multi-species harvest from the Norwegian Sea and adjacent ecosystems” the Research Council of Norway (project number 299554).
Acknowledgments
Thanks to four reviewers for input to improve the manuscript.
Conflict of interest
The authors declare that the research was conducted in the absence of any commercial or financial relationships that could be construed as a potential conflict of interest.
Publisher’s note
All claims expressed in this article are solely those of the authors and do not necessarily represent those of their affiliated organizations, or those of the publisher, the editors and the reviewers. Any product that may be evaluated in this article, or claim that may be made by its manufacturer, is not guaranteed or endorsed by the publisher.
Supplementary material
The Supplementary Material for this article can be found online at: https://www.frontiersin.org/articles/10.3389/fmars.2022.803171/full#supplementary-material
Supplementary Figure 1 | Positions of all Norwegian, Icelandic and Faroese samples of herring included in the present study for the period 1994-2019 presented by month. The colour of the points indicates year of sampling as shown in legend.
Supplementary Figure 2 | Marginal effects of fish length and season on weight at age. All covariates (sampling year, Fulton K, sex and day-of-year) except fish length were fixed at their median observed values and spatial effect was set to zero. Box plot of fish lengths by age and season shown on the top for each age.
Supplementary Figure 3 | Marginal effect of fish length and season on gonad weight at age. All covariates (sampling year, Fulton K, sex and day-of-year) except fish length were fixed at their median observed values and spatial effect was set to zero. Box plot of fish lengths by age and season shown on the top for each age.
Supplementary Figure 4 | Example of mapped modelled below average spots (blue) and above average spots (red) of length at age of herring for age 7, for selected years in May, July, September-October and November-December.
Supplementary Figure 5 | Example of mapped modelled below average spots (blue) and above average (red) of somatic condition of herring for age 7, for selected years in May, July, September-October and November-December.
Supplementary Figure 6 | Example of mapped modelled below average spots (blue) and above average (red) of gonad development of herring for age 7, for selected years in September-October and November-December.
Supplementary Figure 7 | Marginal effects of sampling year and season on length at age, somatic condition and gonad development for all age groups 3-10+. All covariates (sampling year, Fulton K, sex and day-of-year) except year were fixed at their median observed values and spatial effect was set to zero. Box plot of fish lengths by age and season shown on the top for each age.
Supplementary Figure 8 | Modelled spatiotemporal changes in centre of gravity (CG) of length at age for all ages 3-10+ (vertically) and season (horizontally). The variations in CG are shown split between two groups of herring having body length, fish weight and gonad weight either above (red) or below (blue) average.
Supplementary Figure 9 | Modelled spatiotemporal changes in centre of gravity (CG) of somatic condition for all ages 3-10+ (vertically) and season (horizontally). The variations in CG are shown split between two groups of herring having body length, fish weight and gonad weight either above (red) or below (blue) average.
Supplementary Figure 10 | Modelled spatiotemporal changes in centre of gravity (CG) of gonad development for all ages 3-10+ (vertically) and season (horizontally). The variations in CG are shown split between two groups of herring having body length, fish weight and gonad weight either above (red) or below (blue) average.
| Supplementary zip-file with figures showing residual checks for fish weight and gonad weight modelling and gear (three general groups).
References
Asbjørnsen H., Årthun M., Skagseth Ø, Eldevik T. (2019). Mechanisms of ocean heat anomalies in the Norwegian Sea. J. Geophys. Res. Ocean 124, 2908–2923. doi: 10.1029/2018JC014649
Bachiller E., Skaret G., Nøttestad L., Slotte A. (2016). Feeding ecology of northeast Atlantic mackerel, Norwegian spring-spawning herring and blue whiting in the Norwegian Sea. PloS One 11, 1–25. doi: 10.1371/journal.pone.0149238
Bhatta S., Iwai T., Miura C., Higuchi M., Shimizu-Yamaguchi S., Fukada H., et al. (2012). Gonads directly regulate growth in teleosts. Proc. Natl. Acad. Sci. U. S. A. 109, 11408–11412. doi: 10.1073/pnas.1118704109
Bjørndal T., Gordon D. V., Kaitala V., Lindroos M. (2004). International management strategies for a straddling fish stock: A bio-economic simulation model of the Norwegian spring-spawning herring fishery. Environ. Resour. Econ. 29, 435–457. doi: 10.1007/s10640-004-1045-y
Broms C., Melle W. (2007). Seasonal development of calanus finmarchicus in relation to phytoplankton bloom dynamics in the Norwegian Sea. Deep Res. Part II Top. Stud. Oceanogr. 54, 2760–2775. doi: 10.1016/j.dsr2.2007.08.021
Broms C., Melle W., Horne J. K. (2012). Navigation mechanisms of herring during feeding migration: The role of ecological gradients on an oceanic scale. Mar. Biol. Res. 8, 461–474. doi: 10.1080/17451000.2011.640689
Brunel T., Collas M. D. (2010). Effects of temperature and population density on von bertalanffy growth parameters in Atlantic herring: A macro-ecological analysis. Mar. Ecol. Prog. Ser. 405, 15–28. doi: 10.3354/meps08491
Dalpadado P., Ellertsen B., Melle W., Dommasnes A. (2000). Food and feeding conditions of Norwegian spring-spawning herring (Clupea harengus) through its feeding migrations. ICES J. Mar. Sci. 57, 843–857. doi: 10.1006/jmsc.2000.0573
Devold F. (1963). The life history of the atlanto-scandian herring. rapp. proc.-verb. des reun. Cons. Int. Explor. Mer. 154, 98–108.
dos Santos Schmidt T. C., Berg F., Folkvord A., Pires A. M. A., Komyakova V., Tiedemann M., et al. (2022). Is it possible to photoperiod manipulate spawning time in planktivorous fish? A long-term experiment on Atlantic herring. J. Exp. Mar. Bio. Ecol. 552, 1–10. doi: 10.1016/j.jembe.2022.151737
dos Santos Schmidt T. C., Devine J. A., Slotte A., Claireaux M., Johannessen A., Enberg K., et al. (2020). Environmental stressors may cause unpredicted, notably lagged life-history responses in adults of the planktivorous Atlantic herring. Prog. Oceanogr. 181, 14. doi: 10.1016/j.pocean.2019.102257
dos Santos Schmidt T. C., Slotte A., Kennedy J., Sundby S., Johannessen A., Óskarsson G. J., et al. (2017). Oogenesis and reproductive investment of Atlantic herring are functions of not only present but long-ago environmental influences as well. Proc. Natl. Acad. Sci. 114, 2634–2639. doi: 10.1073/pnas.1700349114
Dragesund O., Johannessen A., Ulltang Ø. (1997). Variation in migration and abundace of Norwegian spring spawning herring (Clupea harengus l.). Sarsia 82, 97–105. doi: 10.1080/00364827.1997.10413643
Eliasen S. K., Homrum E., Jacobsen J. A., Kristiansen I., Óskarsson G. J., Salthaug A., et al. (2021). Spatial distribution of different age groups of herring in Norwegian Sea, may 1996–2020. Front. Mar. Sci. 8. doi: 10.3389/fmars.2021.778725
Engelhard G. H., Heino M. (2004a). Maturity changes in Norwegian spring-spawning herring before, during, and after a major population collapse. Fish. Res. 66, 299–310. doi: 10.1016/S0165-7836(03)00195-4
Engelhard G. H., Heino M. (2004b). Maturity changes in Norwegian spring-spawning herring clupea harengus: compensatory or evolutionary responses? Mar. Ecol. Prog. Ser. 272, 245–256. doi: 10.3354/meps272245
Hansen B., Østerhus S. (2000). North Atlantic–Nordic seas exchanges. Prog. Oceanogr. 45, 109–208. doi: 10.1016/S0079-6611(99)00052-X
Hartig F. (2022). DHARMa: Residual diagnostics for hierarchical (Multi-level / mixed) regression models. R package version 0.4.6. Available at: https://CRAN.R-project.org/package=DHARMa.
Hátún H., Chafik L., Larsen K. M. H. (2021). The Norwegian Sea gyre – a regulator of Iceland-Scotland ridge exchanges. Front. Mar. Sci. 8. doi: 10.3389/fmars.2021.694614
Hátún H., Sandø A. B., Drange H., Hansen B., Valdimarsson H. (2005). Influence of the Atlantic subpolar gyre on the thermohaline circulation. Science 309, 1841–1844. doi: 10.1126/science.1114777
Han F., Jamsandekar M., Pettersson M. E., Su L., Fuentes-Pardo A. P., Davis B. W., et al. (2020). Ecological adaptation in atlantic herring is associated with large shifts in allele frequencies at hundreds of LOCI. Elife 9, 1–20. doi: 10.7554/ELIFE.61076
Hay D. E., Toresen R., Stephenson R., Thompson M., Claytor R., Funk F., et al. (2001). “Taking stock: An inventory and review of world herring stocks in 2000,” in Expectations for a new millenium. Ed. Funk F. (Fairbanks: Alaska Sea Grant College Program), 381–454.
Holst J. C., Dragesund O., Hamre J., Misund O. A., Ostvedt O. J. (2002). Fifty years of herring migrations in the Norwegian Sea. ICES Mar. Sci. Symp. 215, 352–360. doi: 10.17895/ices.pub.8874
Hunter A., Speirs D. C., Heath M. R. (2019). Population density and temperature correlate with long-term trends in somatic growth rates and maturation schedules of herring and sprat. PloS One 14, 1–22. doi: 10.1371/journal.pone.0212176
Husebø Å., Slotte A., Stenevik E. K. (2007). Growth of juvenile Norwegian spring-spawning herring in relation to latitudinal and interannual differences in temperature and fish density in their coastal and fjord nursery areas. ICES J. Mar. Sci. 64, 1161–1172. doi: 10.1093/icesjms/fsm081
Huse G., Fernö A., Holst J. C. (2010). Establishment of new wintering areas in herring co-occurs with peaks in the “first time/repeat spawner” ratio. Mar. Ecol. Prog. Ser. 409, 189–198. doi: 10.3354/meps08620
Huse G., Holst J. C., Utne K., Nøttestad L., Melle W., Slotte A., et al. (2012). Effects of interactions between fish populations on ecosystem dynamics in the Norwegian Sea - results of the INFERNO project. Mar. Biol. Res. 8, 37–41. doi: 10.1080/17451000.2011.653372
ICES (2021a). Norwegian Sea ecoregion – Ecosystem overview. in: ICES Advice: Ecosystem Overviews. Report. (Copenhagen: International Council for the Exploration of the Sea). doi: 10.17895/ices.advice.8188
ICES (2021b). Working group on widely distributed stocks (WGWIDE). ICES Sci. Rep. 3, 874. doi: 10.17895/ices.pub.8298
Jakobsson J. (1968). Herring migrations east of Iceland during the summer and autumn 1966 and 1967. Fisk. Skr. Ser. Havundersøgelser 15, 17–22.
Kristensen K., Nielsen A., Berg C. W., Skaug H., Bell B. (2016). TMB: Automatic differentiation and Laplace approximation. J. Stat. Softw. 70, 1–21. doi: 10.18637/jss.v070.i05
Kristiansen I., Gaard E., Hátún H., Jónasdóttir S. H., Ferreira A. S. A. (2016). Persistent shift of calanus spp. in the southwestern Norwegian Sea since 2003, linked to ocean climate. ICES J. Mar. Sci. 73, 1319–1329. doi: 10.1038/278097a0
Kristiansen I., Hátún H., Petursdottir H., Gislason A., Broms C., Melle W., et al. (2019). Decreased influx of calanus spp. into the south-western Norwegian Sea since 2003. Deep Res. Part I. Oceanogr. Res. Pap. 149, 103048. doi: 10.1016/j.dsr.2019.05.008
Kristiansen I., Jónasdóttir S. H., Gaard E., Eliasen S. K., Hátún H. (2021). Seasonal variations in population dynamics of calanus finmarchicus in relation to environmental conditions in the southwestern Norwegian Sea. Deep Res. Part I. Oceanogr. Res. Pap. 171, 1–12. doi: 10.1016/j.dsr.2021.103508
Kristiansen I., Hátún H., Jacobsen J. A., Eliasen S. K., Petursdottir H., Gaard E. (2022). Spatial Variability of the Feeding Conditions for the Norwegian Spring Spawning Herring in May. Front. Mar. Sci. 9, 1–14. doi: 10.3389/fmars.2022.823006
Langøy H., Nøttestad L., Skaret G., Broms C., Fernö A. (2012). Overlap in distribution and diets of Atlantic mackerel ( scomber scombrus ), Norwegian spring- spawning herring ( clupea harengus ) and blue whiting ( micromesistius poutassou ) in the Norwegian Sea during late summer. Mar. Biol. Res. 8, 442–460. doi: 10.1080/17451000.2011.642803
Lindgren F., Rue H., Lindström J. (2011). An explicit link between Gaussian fields and Gaussian Markov random fields: The SPDE approach. J. R. Stat. Soc Ser. B. 73, 423–498. doi: 10.1111/j.1467-9868.2011.00777.x
Melle W., Ellertsen B., Skjoldal H. R. (2004). “Zooplankton: The link to higher trophic levels,” in The Norwegian Sea ecosystem. Ed. Skjoldal H. R. (Trondheim: Tapir Academic), 137–202.
Melle W., Klevjer T., Strand E., Wiebe P. H., Slotte A., Huse G. (2020). Fine-scale observations of physical and biological environment along a herring feeding migration route. Deep Res. Part II Top. Stud. Oceanogr. 180, 1–19. doi: 10.1016/j.dsr2.2020.104845
Misund O. A., Melle W., Fernö A. (1997). Migration behaviour of Norwegian spring spawning herring when entering the cold front in the Norwegian Sea. Sarsia 82, 107–112. doi: 10.1080/00364827.1997.10413644
Mork K. A., Skagseth Ø., Søiland H. (2019). Recent warming and freshening of the Norwegian Sea observed by argo data. J. Clim. 32, 3695–3705. doi: 10.1175/JCLI-D-18-0591.1
Nøttestad L., Giske J., Holst J. C., Huse G. (1999). A length-based hypothesis for feeding migrations in pelagic fish. Can. J. Fish. Aquat. Sci. 56, 26–34. doi: 10.1139/cjfas-56-s1-26
Nøttestad L., Misund O. A., Melle W., Hoddevik Ulvestad B. K., Orvik K. A. (2007). Herring at the Arctic front: Influence of temperature and prey on their spatio-temporal distribution and migration. Mar. Ecol. 28, 123–133. doi: 10.1111/j.1439-0485.2007.00182.x
Olafsdottir A. H., Rong K., Arge J., Jansen T., Óskarsson G. J., Nøttestad L., et al. (2019). Geographical expansion of northeast Atlantic mackerel ( scomber scombrus ) in the Nordic seas from 2007 to 2016 was primarily driven by stock size and constrained by low temperatures. Deep Res. Part II 159, 152–168. doi: 10.1016/j.dsr2.2018.05.023
Ólafsdóttir A. H., Slotte A., Jacobsen J. A., Óskarsson G. J., Utne K. R., Nøttestad L. (2016). Changes in weight-at-length and size-at-age of mature northeast Atlantic mackerel (Scomber scombrus) from 1984 to 2013: effects of mackerel stock size and herring (Clupea harengus) stock size. ICES J. Mar. Sci. 73, 1255–1265. doi: 10.1093/icesjms/fsv142
Óskarsson G. J., Gudmundsdottir A., Sveinbjörnsson S., Sigurðsson Þ. (2016). Feeding ecology of mackerel and dietary overlap with herring in icelandic waters. Mar. Biol. Res. 12, 16–29. doi: 10.1080/17451000.2015.1073327
Óskarsson G. J., Kjesbu O. S., Slotte A. (2002). Predictions of realised fecundity and spawning time in Norwegian spring-spawning herring (Clupea harengus). J. Sea Res. 48, 59–79. doi: 10.1016/S1385-1101(02)00135-1
Ottersen G., Stige L. C., Durant J. M., Chan K. S., Rouyer T., Drinkwater K. F., et al. (2013). Temporal shifts in recruitment dynamics of north Atlantic fish stocks: Effects of spawning stock and temperature. Mar. Ecol. Prog. Ser. 480, 205–225. doi: 10.3354/meps10249
Prokopchuk I., Sentyabov E. (2006). Diets of herring, mackerel, and blue whiting in the Norwegian Sea in relation to calanus finmarchicus distribution and temperature conditions. ICES J. Mar. Sci. 63, 117–127. doi: 10.1016/j.icesjms.2005.08.005
Røttingen I. (1990). “The 1983 year class of Norwegian spring spawning herring as juveniles and recruit spawners,” in Proceedings of fourth soviet-Norwegian symposium. Ed. Monstad T. (Bergen: Institute of Marine Research), 165–203.
R Core Team (2021). R: A language and environment for statistical computing (Vienna, Austria: R Foundation for Statistical Computing). Available at: https://www.R-project.org/.
Rose G. A. (2005). On distributional responses of north Atlantic fish to climate change. ICES J. Mar. Sci. 62, 1360–1374. doi: 10.1016/j.icesjms.2005.05.007
Skagseth Ø., Broms C., Gundersen K., Hátún H., Kristiansen I., Larsen K. M. H. (2022). Arctic and Atlantic Waters in the Norwegian Basin, Between Year Variability and Potential Ecosystem Implications. Front. Mar. Sci. 9, 1–14. doi: 10.3389/fmars.2022.831739
Skjoldal H. R., Aarflot J. M., Bagøien E., Skagseth Ø., Rønning J., Lien V. S. (2021). Seasonal and interannual variability in abundance and population development of calanus finmarchicus at the western entrance to the barents Sea 1995–2019. Prog. Oceanogr. 195, 1–20. doi: 10.1016/j.pocean.2021.102574
Skjoldal H. R., Dalpadado P., Dommasnes A. (2004). “Food webs and trophic interactions,” in The Norwegian Sea ecosystem. Ed. Skjoldal H. R. (Trondheim: Tapir Academic), 447–506.
Skogen M. D., Budgell W. P., Rey F. (2007). Interannual variability in Nordic seas primary production. ICES J. Mar. Sci. 64, 889–898. doi: 10.1093/icesjms/fsm063
Slotte A. (1999a). Differential utilization of energy during wintering and spawning migration in Norwegian spring-spawning herring. J. Fish. Biol. 54, 338–355. doi: 10.1006/jfbi.1998.0868
Slotte A. (1999b). Effects of fish length and condition on spawning migration in Norwegian spring spawning herring (Clupea harengus l. Sarsia 84, 111–127. doi: 10.1080/00364827.1999.10420439
Slotte A., Fiksen Ø (2000). State-dependent spawning migration in Norwegian spring-spawning herring. J. Fish. Biol. 56, 138–162. doi: 10.1006/jfbi.1999.1145
Strand E., Bagøien E., Edwards M., Broms C., Klevjer T. (2020). Spatial distributions and seasonality of four calanus species in the northeast Atlantic. Prog. Oceanogr. 185, 102344. doi: 10.1016/j.pocean.2020.102344
Toresen R., Østvedt O. J. (2000). Variation in abundance of Norwegian spring-spawning herring (Clupea harengus, clupeidae) throughout the 20th century and the influence of climatic fluctuations. Fish. Fish. 1, 231–256. doi: 10.1111/j.1467-2979.2000.00022.x
Utne K. R., Huse G. (2012). Estimating the horizontal and temporal overlap of pelagic fish distribution in the Norwegian Sea using individual-based modelling. Mar. Biol. Res. 8, 548–567. doi: 10.1080/17451000.2011.639781
Wilson C. J., Murphy H. M., Bourne C., Pepin P., Robert D. (2018). Feeding ecology of autumn-spawned Atlantic herring (Clupea harengus) larvae in trinity bay, Newfoundland: Is recruitment linked to main prey availability? J. Plankton Res. 40, 255–268. doi: 10.1093/plankt/fby003
Wood S. N. (2003). Thin plate regression splines. J. R. Stat. Soc Ser. B. Stat. Methodol. 65, 95–114. doi: 10.1111/1467-9868.00374
Wood S. N. (2011). Fast stable restricted maximum likelihood and marginal likelihood estimation of semiparametric generalized linear models. J. R. Stat. Soc Ser. B. Stat. Methodol. 73, 3–36. doi: 10.1111/j.1467-9868.2010.00749.x
Keywords: Norwegian spring spawning herring, Norwegian Sea, somatic condition, gonad development, distribution changes, extended feeding period, body growth
Citation: Homrum Eí, Óskarsson GJ, Ono K, Hølleland S and Slotte A (2022) Changes towards stable good somatic condition and increased gonad investment of Norwegian spring-spawning herring (Clupea harengus) after 2005 are linked to extended feeding period. Front. Mar. Sci. 9:803171. doi: 10.3389/fmars.2022.803171
Received: 27 October 2021; Accepted: 22 September 2022;
Published: 13 October 2022.
Edited by:
Ibon Galparsoro, Technological Centre Expert in Marine and Food Innovation (AZTI), SpainReviewed by:
Dmitry Lajus, Saint Petersburg State University, RussiaPeter Grønkjær, Aarhus University, Denmark
Copyright © 2022 Homrum, Óskarsson, Ono, Hølleland and Slotte. This is an open-access article distributed under the terms of the Creative Commons Attribution License (CC BY). The use, distribution or reproduction in other forums is permitted, provided the original author(s) and the copyright owner(s) are credited and that the original publication in this journal is cited, in accordance with accepted academic practice. No use, distribution or reproduction is permitted which does not comply with these terms.
*Correspondence: Eydna í Homrum, eydnap@hav.fo