 Carolina Camacho-Vite
 Nuria Estrada-Saldívar
 Esmeralda Pérez-Cervantes
 Lorenzo Alvarez-Filip
94% of researchers rate our articles as excellent or good
Learn more about the work of our research integrity team to safeguard the quality of each article we publish.
Find out more
BRIEF RESEARCH REPORT article
Front. Mar. Sci. , 22 July 2022
Sec. Coral Reef Research
Volume 9 - 2022 | https://doi.org/10.3389/fmars.2022.790818
This article is part of the Research Topic Stony Coral Tissue Loss Disease in the Caribbean View all 50 articles
Stony Coral Tissue Loss Disease (SCTLD) impacts are unprecedented concerning the level of devastation they have imposed on Caribbean coral assemblages. Although SCTLD affects nearly 30 different coral species, it has been particularly lethal for Pseudodiploria strigosa. Mortality rates for this species are estimated to be between 60 and 100% in the Caribbean; however, tissue-loss rates have been shown to differ among colonies, which suggests that colony health, environmental conditions, and concurrent transmission events are crucial to the development of the disease at reef scale. To gain insight into the colony-level dynamics of SCTLD, we used a simplified photogrammetry and 3D modeling approach to quantify and compare SCTLD-related tissue-loss rates among 20 colonies of P. strigosa on a shallow back-reef in the Mexican Caribbean. Over a six-month period, SCTLD resulted in the full mortality of 70% of the colonies that were tagged shortly after infection. Although disease progression followed a multifocal-type infection in most cases, tissue-loss rates significantly differed among colonies. Some colonies died within the first 20 days of observation, while others died towards the end of the study period. We found a significant positive effect of colony size on rates of tissue loss disease, as well as evidence suggesting that elongated and vertically compressed colonies have a greater probability of experiencing higher tissue-loss rates than colonies with more spherical shapes. The observed relationship between colony morphology and tissue-loss rates is likely a result of elongated colonies having more flat surface area at the top of the colonies which facilitates accumulation of sediments, which have been shown to be a source of SCTLD transmission.
The impacts of Stony Coral Tissue Loss Disease (SCTLD) are unprecedented concerning the level of devastation imposed on Caribbean coral communities. SCTLD was first observed during the autumn of 2014 off the port of Miami, since then it has spread throughout the northern half of the Caribbean basin and the Bahamas (Precht et al., 2016; Kramer et al., 2019). SCTLD affects nearly 30 different coral species and is highly virulent, spreading rapidly within reef systems and between species. It affects primarily corals of the families Meandrinidae and Faviidae and disease prevalence ranges from >50% in highly susceptible species (e.g., Meandrina meandrites, Dendrogyra cylindrus and Pseudodiploria strigosa) to <10% in less susceptible species, such as Agaricia agaricites (FDEP, 2018; Gintert et al., 2019). SCTLD lesions spread rapidly across an infected individual and can kill large colonies within weeks. In heavily affected reef areas, highly susceptible species can be virtually extirpated (Estrada-Saldívar et al., 2021; Neely et al., 2021).
SCTLD resembles the Caribbean White Plague (WP) diseases, because of the tissue loss they produce in their hosts; however, the progression rate can be several orders of magnitude faster than lesions usually produced by WP (Cróquer et al., 2021). A clearer diagnostic sign of SCTLD is the presence of one or multiple lesions and the presence of a bleaching front between the apparently healthy tissues and the recently exposed coral skeleton (Cróquer et al., 2021). Generally, a band is observed initially showing the white skeleton of the coral, which increases in size over time until the whole colony dies within a few weeks or months. The dead skeleton is then rapidly colonized by turf algae, sediment, and macroalgae (Aeby et al., 2019). Despite the velocity of this emerging threat, little is still known about the drivers and consequences of the disease outbreak. The characterizations of the microbial communities from the lesions, and the responses to antibiotic treatments suggest that SCTLD is associated with bacteria of the Flavobacteriales, Rhodobacterales, and Rhizobiales orders (Aeby et al., 2019; Meyer et al., 2019), although viruses of the algal symbionts have also been reported in recent studies (Work, 2021). In any way, evidence suggests that water currents have transported the causative agent of SCTLD from sediments that were resuspended by dredging operations, in Florida, towards reefs across the Caribbean region (Dobbelaere et al., 2020).
Disease progression differs between species, or colonies of the same species, due to various factors such as morphology, colony condition, duration of infection or geographic location (Walton et al., 2018; Aeby et al., 2019; Landsberg et al., 2020; Combs et al., 2021; Eaton et al., 2021). For example, foliose and massive species can easily accumulate sediment and thus a greater load of pathogens (Jones et al., 2019). In the Caribbean, SCTLD has been devastating for P. strigosa populations, recent estimates indicate that 50–100% of colonies of this species have been lost in Florida and Mexico (Thome et al., 2021; Williams et al., 2021; Alvarez-Filip et al., 2022). Severity and speed of disease progression do not only differ between species, but also among colonies of the same species, which suggests that colony health, environmental conditions, and perhaps a series of independent transmission events played essential roles in the disease progression dynamics at the reef scale (Guzmán-Urieta and Jordán-Dahlgren, 2021).
Different methods have been applied to quantify tissue loss rates associated with coral disease. Early studies used in-situ linear measurements, and during the advent of digital underwater cameras, two-dimensional photo analysis became a standard method. This approach, however, does not consider the three-dimensional structure of corals. Photogrammetry and 3D modeling have greater accuracy when measuring approximately semi-spherical objects with an irregular surface as previous works have shown (Meiling et al., 2020; Combs et al., 2021). To gain insight into the colony-level dynamics of SCTLD, we used a simplified photogrammetry approach to quantify SCTLD-related tissue loss rates for 20 colonies of P. strigosa over a period of six months on Limones reef, in the northern Mexican Caribbean. The goal of the study was to compare tissue-loss rates among colonies as a function of their size and morphological attributes. The results provide insight into our understanding of intra-specific differences in susceptibility, and of the overall impact of this devastating disease on Caribbean coral reefs.
The study was conducted in Limones (20.988452N°, -86.79719E°), a back-reef zone of Puerto Morelos Reef National Park, along the northeastern Yucatán Peninsula. This reef has a mean depth of 2 m and is characterized by a high abundance of elkhorn coral (Acropora palmata; Rodríguez-Martínez et al., 2014), and symmetrical brain coral (P. strigosa) (Figure 1). We first surveyed the site on August 4, 2018, at the onset of the SCTLD outbreak. The only identifiable signs of the disease, at that time, were some colonies of P. strigosa with a rapidly expanding white ring or rings of necrotic tissue, leaving behind the bare white skeleton of the colony, which as time passed, was quickly colonized by turf algae mats (Figure 1B). We proceeded to tag a total of 20 colonies, 18 of which had visible signs of the disease (Appendix; Figure 2A) and colony size ranged between 20–120 cm diameter.
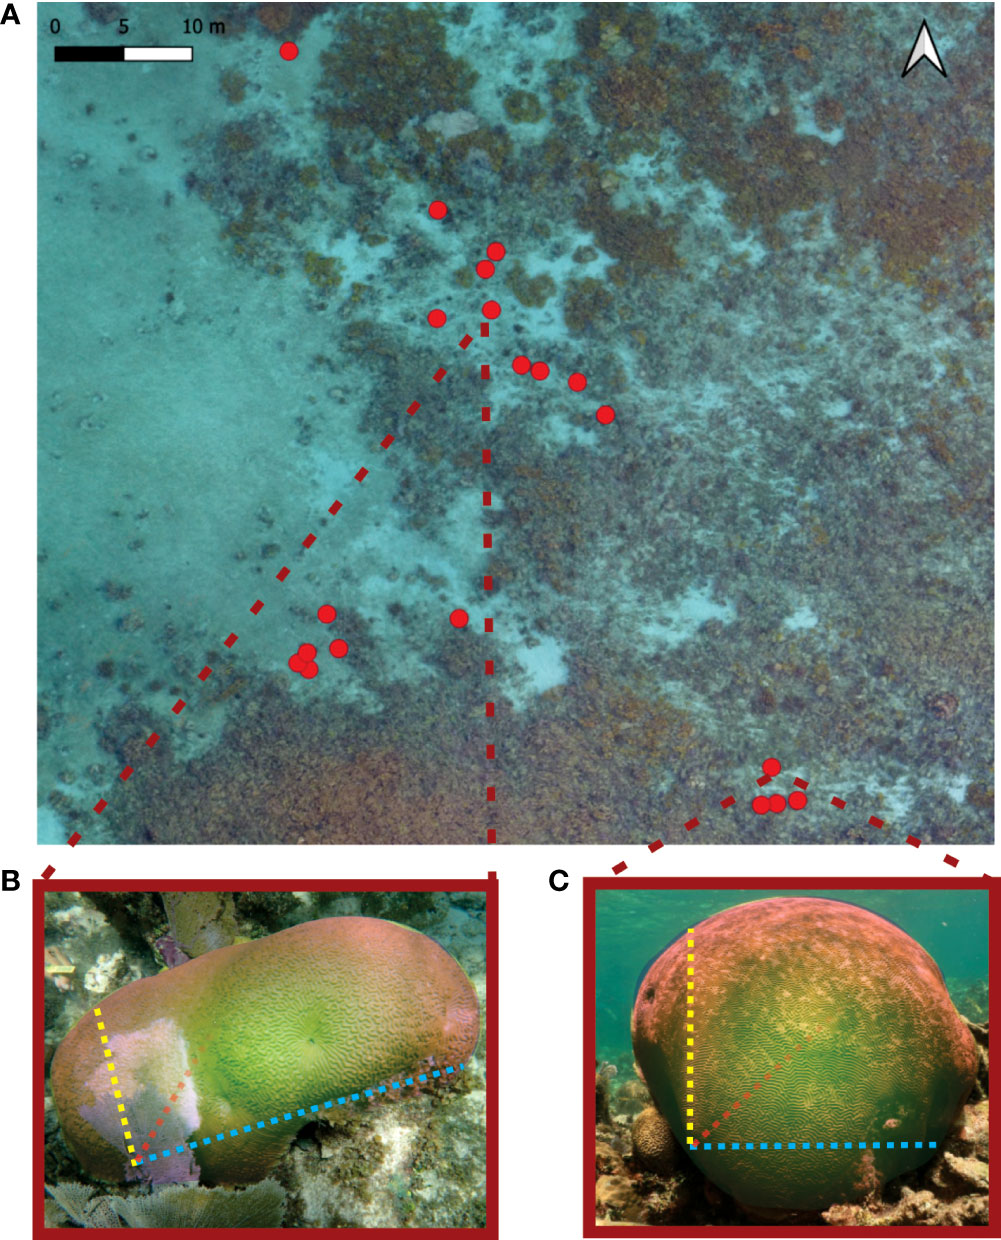
Figure 1 (A) Location of all the surveyed colonies of Pseudodiploria strigosa in Limones reef. Ratio between size metrics (length, width and height) indicates a coral morphology gradient between an (B) elongated and vertically compressed and (C) spherical colonies.
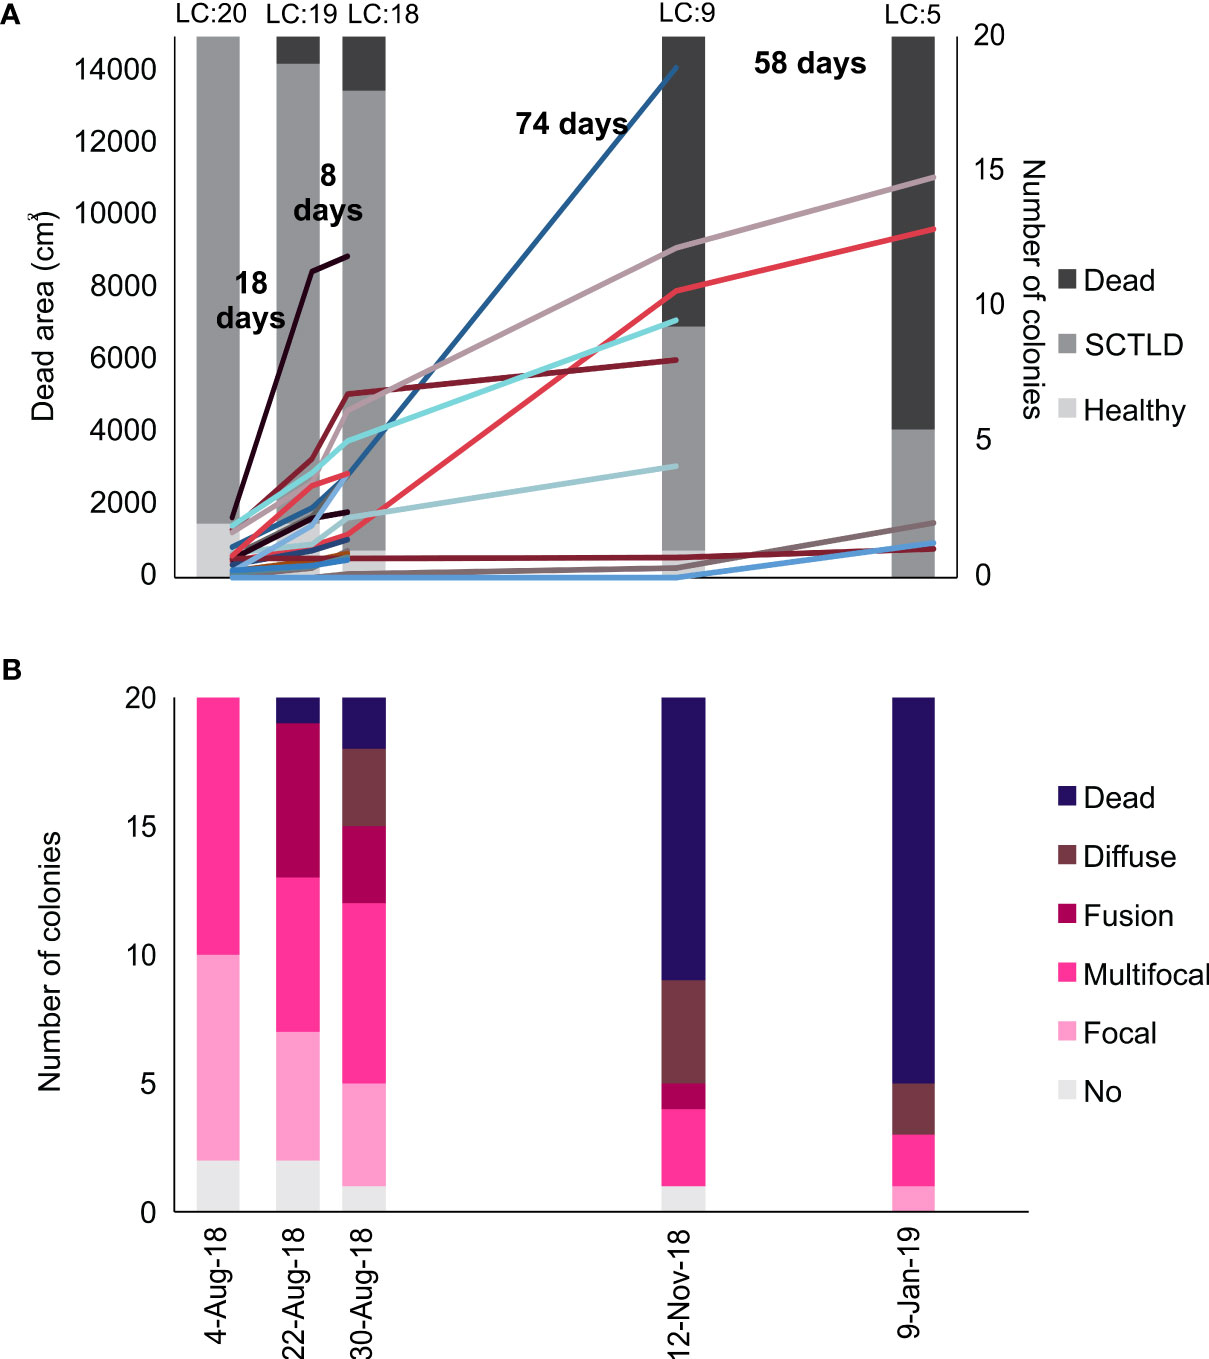
Figure 2 Disease progression in the 20 colonies of P. strigosa tagged in Limones reefs. (A) Number of colonies affected by the Stony Coral Tissue Loss Disease, dead and healthy, and the lesion area per colony. The number between columns represents the number of days between each survey and each of the colored lines represents one of the 20 colonies. (B) Type of lesion present in the colonies. The LC: above de columns represent the number of live colonies for each date.
Each of the 20 colonies were visually assessed and photographed, over a period of six months: August 4, 22 and 30, November 12, 2018, and January 9, 2019. Time intervals between dates depended on logistic restrictions, but we also intended to track the tissue loss progression more frequently during its onset. Each of the colonies was visually assessed by registering height, maximum and minimum diameter, presence of bleaching or diseases, percentage of coral mortality by stage (new, in transition or old), and any present overgrowths (sensu Lang et al., 2012). We also measured the rugosity by dividing contour length by planar length (González-Barrios and Alvarez-Filip, 2018). In addition to these data, we compiled a photographic record to track the tissue loss progression. We obtained images from all sides of the colony, focusing on the visible lesions present, and used a 15 cm graduated ruler as a reference.
The photographs of the colonies were used to generate 3D models, from which we estimated the total live tissue area of each colony (cm2) before the onset of the disease, as well as the area (cm2) and type (focal, multifocal, fusion or diffuse; Bruckner and Woodley, 2009) of the disease lesions. One limitation of our study was the low number of photographs per period, which prevented us from using widely-used 3D modeling software and workflows (e.g., Lange and Perry, 2020). Instead, we used the open source software for 3D creation and animation, Blender 2.80, which allowed us to generate the colony models by manual editing. We selected a group of five photographs from the first survey date that would encompass all sides, including the top view of the colony and included all lesions. We only used photos that captured the whole-colony, including their lesions, and were roughly taken from the same distance.
To create the 3D model, one of the selected photographs was scaled using the 15 cm graduated ruler as reference. Then the scales of the other four photos were adjusted to this first photo. Subsequently, the perimeter of each side of the colony was carefully outlined on each photograph in the Blender software. Once the perimeters were established, we created the 3D model of the colony by modifying the vertices from a three-dimensional sphere until the colony shape represented all colony perimeters as accurately as possible (Figure S1). For the modeling of the lesions, we followed the same procedure. The lesions included the recent mortality (white area) and transitional mortality. First, the photographs of each lesion were uploaded to the program and adjusted to the size of the model. For each date, the perimeter of each lesion was traced and placed onto the whole-colony model from the first survey date. Lastly, all the sections that were not part of the lesion were erased.
Once the models were created, the Blender’s 3D print ToolBox function was used to calculate the surface area of the entire colony (cm2) at the first survey date, and of each lesion at each point in time. If several lesions were present at the same time, the area obtained from each one was added, resulting in the total area of lesions in cm2 (i.e., dead area) for each colony per date. To corroborate the accuracy of the 3D modeling, we used the original photographs of nine random selected colonies and measured the perimeter of the colony, using the Image J program. The 3D model perimeter measurements were very similar to those obtained using the original photographs (4.3% ± 2.03% SE). The advantage of using 3D models over the photographs (2D) to quantify lesion area, is that it allowed us to have an estimate of the total area of the colony using the same scale for all time periods.
The disease progression over time was evaluated both in terms of lesion area increase, and the transition of lesion types based on Bruckner and Woodley (2009). In most cases, infected colonies progressed from a focal lesion (i.e., only one visible lesion) to a multifocal lesion (i.e. two or more visible spaced lesions), then to the fusion of lesions (i.e. when a bridge between them is visible) and finally to a diffuse lesion (i.e. when joined lesions span a large size and do not have a regular shape). The average tissue loss rate of the disease through time was obtained for each colony using a linear regression between the total lesions areas (cm2) at each point in time as a function of the number of days elapsed since the start of the study (Figure S2).
We used a generalized linear model framework to investigate how the average tissue loss rate in each colony was related to colony size, rugosity, and morphology. Total surface area was obtained from the initial 3D models and was selected as indicator of colony size. We defined colony morphology as a continuous gradient derived from the integration of colony’s height, length, and width using the following formula: (width/length) * (width/height). Colonies with a similar measurement in all three axes would approximate a spherical morphology and would have values closer to one, while colonies with a disproportionate relationship between their height, length, or width would be within the spectrum of an elliptical morphology with values less than one (Figures 1B, C). We used the function glm in R, setting the tissue rate loss as the response variable, whilst surface area, rugosity, and morphology were used as predictive variables. All continuous predictive variables were scaled to z-scores with the scale function in R and we determined effect sizes of predictors to investigate statistical significance using p values at 0.05 (R Core Team, 2020). Considering that our continuous response variable presents a right-skewed distribution, we adjust a GLM with a Gamma error distribution and log link function. We also explored the impacts of environmental factors (e.g., depth, reef-zone and the position in field), but no clear effects were observed and thus we decided not to include them into the model as the model performance would be compromised by a high number of predictor variables and low sample size. However, it is not surprising that environmental factors had no detectable effect given that all studied colonies were in the same area under very similar environmental conditions (Figure 1A). Previous studies have also found no effect of environmental conditions within local-scale conditions (Guzmán-Urieta and Jordán-Dahlgren, 2021).
In August 2018, 18 tagged colonies were already afflicted by the disease and presented small focal or multifocal signs of SCTLD lesions, which encompassed an average of 12% ( ± 1.89% SE) of the colonies’ surface area (Figure 2A). The first whole-colony death occurred two weeks after the first survey, in the smallest of all observed colonies (C54, Appendix), and six months later, 70% of the colonies were completely dead with an average of 86% (± 7.22%) of the colonies’ surface being afflicted by SCTLD. Five colonies that remained alive until the end of the study in January 2019, showed signs of active SCTLD, with some severely-afflicted colonies (Appendix) dying soon after we concluded the last survey. By January 2020, only two colonies were still alive, both with approximately 40% of live tissue cover, but with visible disease lesions (C70 and C76; Appendix). These colonies had intermittent lesions since the beginning of the study. C76 was dead by August 2020, and C70 was still alive as of April 2022 with 1% of live tissue left.
Tissue loss rate was generally rapid, but occurred at different rates, including colonies with a fast rate loss of 162.88 cm2/day (C77; Appendix) to really low rates of 1.53 cm2/day (C70; Appendix). The total tissue loss rate average was of 38.87 ± 9.16 cm2 per day. During the first 30 days we observed that lesion area (i.e., recent and transitional mortality) per colony increased from 554.24 ± 114.17 cm2 to 2328.65 ± 502.97 cm2 (mean ± SE), which represents a mean tissue loss of 40.35 ± 7.26% (Figure 2A). Between the third and fourth surveys, half of the colonies were completely dead, and by the fifth survey, only five colonies were alive, in which the disease advanced more slowly.
At the onset of the study, 10 colonies presented multifocal lesions that subsequently merged and became an extended diffuse lesion that resulted in full colony mortality in all cases. In six colonies, the disease started with one lesion, but other lesions appeared later on, indicating a multifocal infection (Figure 2B). Under this situation, four colonies died after the disease rapidly spread and lesions merged, but two colonies remained alive until the end of the study with little increase in the lesions (C76 and C70; Appendix). In four colonies, only one lesion was evident throughout the development of the disease, and in three out of these four colonies, the single lesion increased rapidly, resulting in whole-colony mortality (C93, C85 and C54; Appendix). Only in one colony SCTLD become evident at the last period of the study (C100; Appendix), it was not tracked beyond the end of the study, but whole-colony mortality was observed in April 2019.
The generalized linear model showed a clear significant relationship between tissue loss rate and surface area (Figures 3A, D), indicating that disease tended to spread faster in bigger colonies. We also found a marginal but significant effect of morphology (Figures 3B, D), indicating, that disease tended to spread faster in elongated and vertically compressed colonies. No statistical effect was found with colony rugosity (Figures 3C, D). In Figure 3B, one colony with a low morphology value but high tissue loss rate seems to highly influence the observed relationship between morphology and tissue loss rate. However, when this colony was removed from the analysis, the relationship between tissue loss rate and morphology remained negative and significant, although slightly less evident (Figure S3).
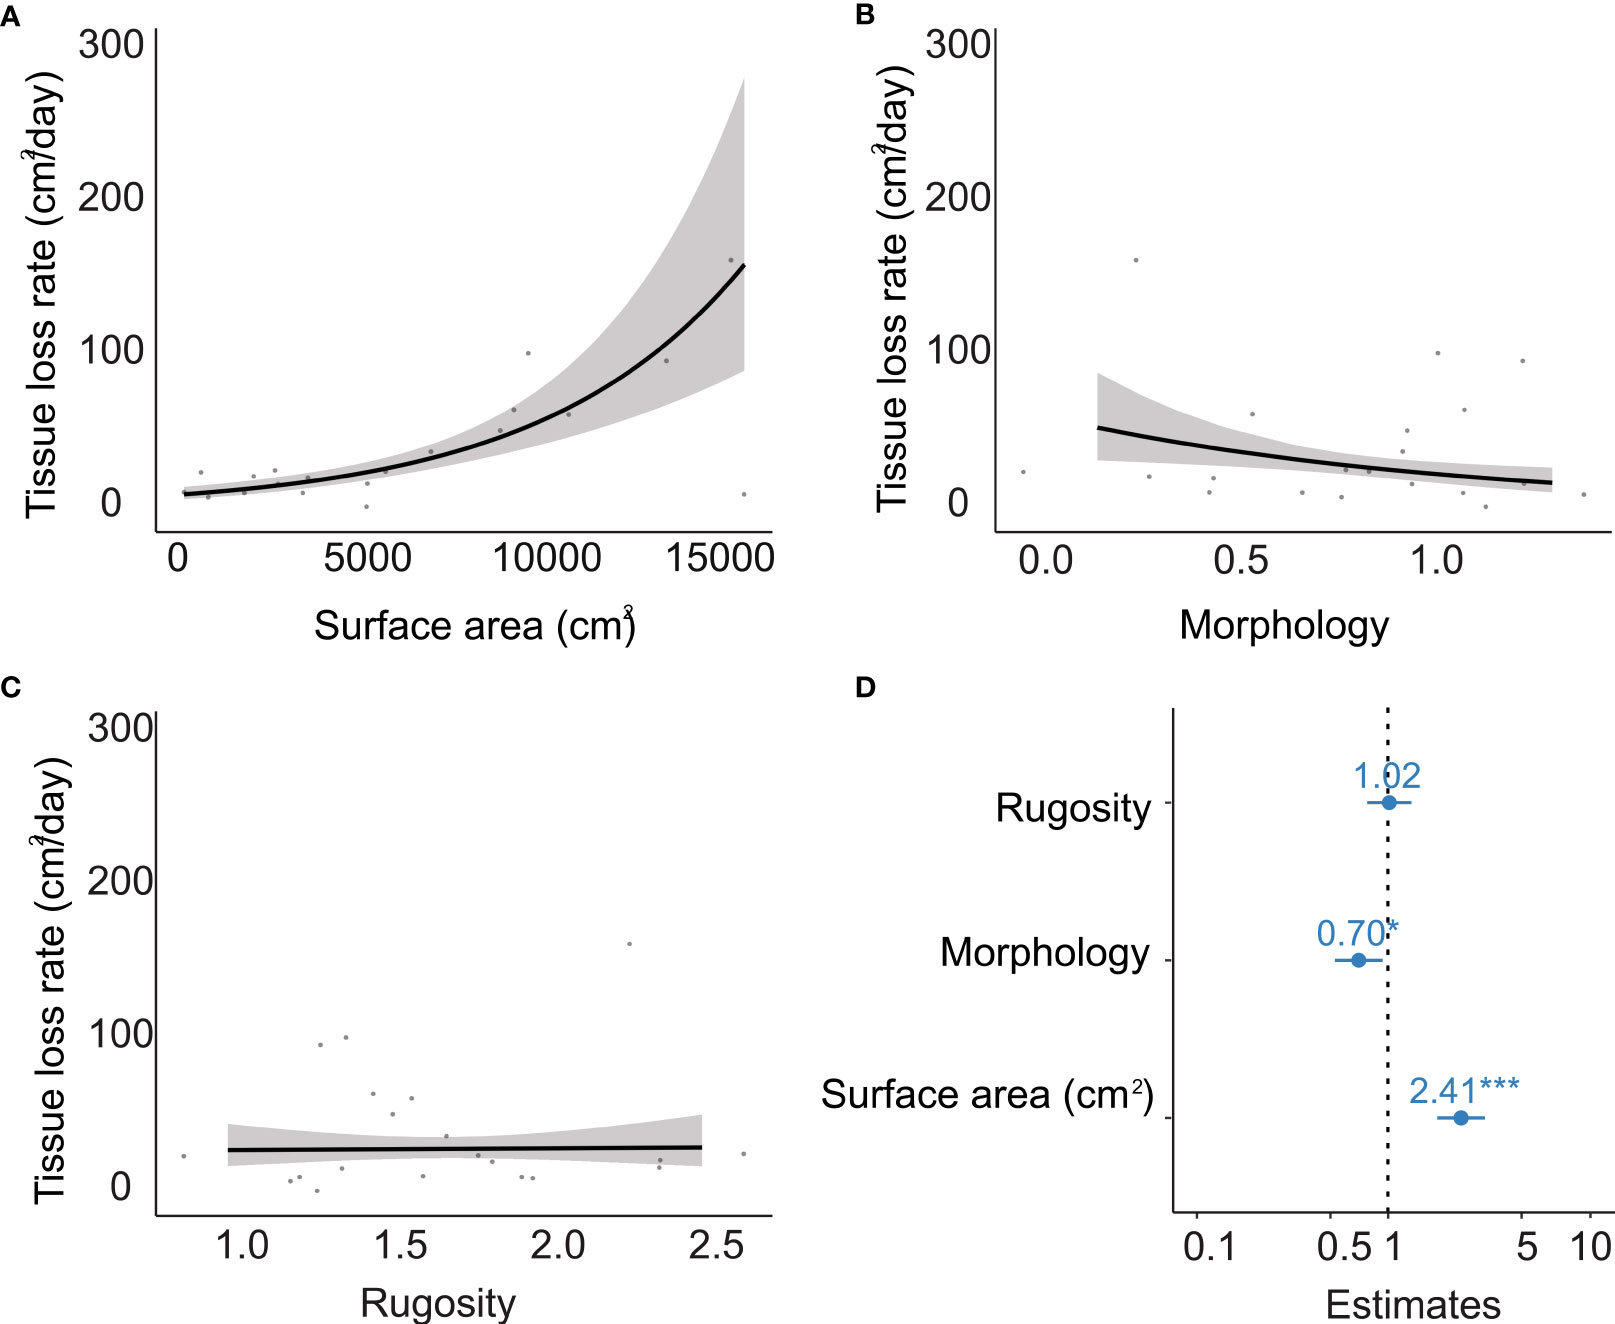
Figure 3 Relationship between colony morphology metrics and tissue loss rates (cm2/day) in Pseudodiploria strigosa in Limones Reef. (A) Surface area in cm2, (B) morphology, which is the integration of colony’s height, length and width using the following formula: (width/length) * (width/height), (C) colony rugosity. (D) Effect sizes of tissue loss rate predictors. Estimates are derived from the generalized linear models with the dots and lines representing the means and 95% confidence intervals, respectively. All continuous predictive variables were scaled to z-scores with the scale function in R.
Over a six-month period, SCTLD killed 70% of the colonies of Pseudodiploria strigosa that were tagged shortly before or after initial infection in Limones reef. Although disease progression followed a multifocal-type infection in most cases, tissue loss rates significantly differed among colonies. Some colonies died within the first 20 days of observation, while others died towards the end of the study period. We found evidence suggesting that larger colonies and vertically compressed flat-headed colonies have a greater probability to undergo higher rates of tissue loss when compared to large spherical colonies.
The observed relationship between surface areas, colony morphology, and tissue loss rates may be explained by a few possible circumstances that are not mutually exclusive. Due to their small surface area, smaller colonies tend to experience faster whole-coral mortality as the disease rapidly progresses. Our results, however, showed that larger colonies have faster tissue loss rates which coincide with what was reported in Florida; where larger corals have a higher risk of contracting SCTLD, which could be due to a higher probability of interacting with the pathogen (Williams et al., 2021). Furthermore, vertically compressed flat-headed coral morphologies tend to have a greater planar surface area, a characteristic that makes these colonies prone to retain and accumulate sediments on their top surface. Similarly, as mortality progresses, space becomes available for the growth of algal turfs that abrade and smother the living coral tissue. These algal turfs along with sediment accumulation, represent a new stress as they approach the edge of the living tissue (Roy, 2004). This is especially relevant for P. strigosa, which is a brain coral with deep grooves where concave areas can facilitate the retention and accumulation of sediments, and thus, potential pathogens, as seen in Meandrina meandrites higher disease prevalence (Duckworth et al., 2017; Aeby et al., 2019). Sediments have an active role as a source of bacterial transmission, as bacteria of the orders Rhodobacterales and Rhizobiales have been associated with SCTLD and have been found in sediment samples (Rosales et al., 2020). Although we did not measure the amount of sediments on the surface of colonies, it has been shown that a greater number of angular (opposed to horizontally-flat) surfaces and steep sides found on spherical colonies facilitate self-cleaning and avoid sediments accumulation (Duckworth et al., 2017). Lastly, we need to consider the possibility of genetics as a factor in determining a colony’s susceptibility to the disease. Morphological plasticity is common among scleractinian corals, and such variations can be caused by genetic differences among individuals (and populations), by the environment, or both (Bruno and Edmunds, 1997). Since the colonies of P. strigosa that were included in this study were situated within a relatively small reef area and exposed to similar environmental conditions (light, depth, water energy and temperature), our results may reflect in part the higher susceptibility of certain genotypes to the disease (e.g., Miller et al., 2019), rather than the proposed phenotypic and hydrodynamic reasons. However, we do not have data on the genetic structure of this population to support or rule out this hypothesis. By incorporating the analysis of genetic population structure, future studies would make a significant contribution that would help to shed light on the etiology and course of SCTLD.
Tissue loss rates observed in this study vary widely between colonies (1.53 to 162.88 cm2/day; Appendix) and, on average (38.87 ± 9.16 SE cm2/day), are higher than rates obtained by other studies, which are generally lower than 10 cm2/day for P. strigosa (Aeby et al., 2019; Meiling et al., 2020; Meiling et al., 2021; Thome et al., 2021; but see Sharp and Maxwell, 2018 that reports slightly higher values). Differences in rates of tissue loss could be influenced by coral resilience, environmental stress, or differences in pathogen virulence (Meiling et al., 2020). Yet, indistinctly of the rates of tissue loss, the percentage of colonies that ended up dying due to the disease in our study is similar to previous reports in our study region (Guzmán-Urieta and Jordán-Dahlgren, 2021; Alvarez-Filip et al., 2022) and elsewhere in the Caribbean (Precht et al., 2016; Costa et al., 2021; Williams et al., 2021). This suggests that despite differences in the rate of tissue loss when the disease reaches a site, a high proportion of the population will eventually die.
We found that only two colonies survived until the end of the study, yet both with evident signs of SCTLD. These two colonies were affected intermittently (i.e., although some lesions apparently stopped, new lesions subsequently appeared in the same colony). While these two colonies did not die during the six months of our study period, one of the colonies was found completely dead in May 2021 (C76; Appendix). In April 2022, the other colony (C70; Appendix) had very little live tissue left with no apparent signs of disease but was highly overgrown by turf algae and covered with sediment. In Florida, the rates of tissue loss from SCTLD have been reported to slow through time, corresponding with the accumulation of thermal stress that led to mass bleaching in 2019 (Meiling et al., 2020). In contrast, the presence of bleaching was very low in our study area, and no relationship between bleaching and disease prevalence or progression rate has been found (Alvarez-Filip et al., 2019; Thome et al., 2021). In addition to external drivers, survival also depends on intrinsic defense mechanisms against pathogens, which vary among and between species (Apprill et al., 2016). For example, the mucus layer of corals is important in disease resistance because it contains antibacterial properties that inhibit the growth of pathogenic organisms (Ritchie, 2006; Shnit-Orland and Kushmaro, 2009). Therefore, it is likely that surviving colonies may have developed some type of defense against the disease (Meiling et al., 2020), as shown in Florida, infected colonies with defensive traits, survived, despite the duration of the infection (Aeby et al., 2019).
Our 3D model facilitated the estimation of rates of tissue loss at the colony level, allowing for a better understanding of the disease progression at fine temporal and spatial scales. However, it is important to highlight that the main disadvantage of our 3D modeling approach is related to the manual effort of the processes and the level of details that can be obtained for some areas of the colony. We used a very limited number of photos (~4-6) compared to standard methodologies that generally use large quantities of methodically obtained photos (~30-60 e.g., Lange and Perry, 2020). Thus, while conventional photogrammetry software uses automatized processes that heavily rely on computational power to construct the models, our approach involved a substantial amount of manual labor that substantially increased the time spent processing the photographs and models (up to several hours per colony for each period). In addition, we had to validate the outputs of the 3D approach by comparing some estimation of colony dimensions using photographs (2D; see methods); and due to the lack of photographs from all angles of the colony, there were some small sections of the colony that could not be incorporated in the analysis, which may represent some inaccuracies in our estimates of the total surface area of the colony. However, this is unlikely to cause a major error in tissue loss rates, as we consistently used the same initial model to estimate the increase in size of the lesions in all time periods. Despite the caveats of our approach, we have shown that it is possible to construct a 3D model of a coral colony with a very limited number of photographs, which might deem useful to reduce monitoring effort and dive time on situations where time spent underwater might be a restriction (e.g. deep coral reefs); more importantly, however, our technique can be implemented with historical photographic records. Likewise, this methodology is based on open-source software that can be run in standard-range computers.
Since 2014, many studies have been conducted to quantify the disease progression in coral colonies; unfortunately, there is still a lack of understanding in the disease progression and transmission, hindering the management efforts that could potentially control/mitigate the spread of SCTLD (Neely et al., 2020). This study provides novel insights of how SCTLD progression in P. strigosa varies according to the morphology of the colony. Further assessments to characterize the effects of SCTLD according to the morphology of different species are essential for the treatment of the disease.
The original contributions presented in the study are included in the article/Supplementary Material. Further inquiries can be directed to the corresponding author.
CC-V and LA-F conceived and wrote the initial draft; NE-S and EP-C collected the data; CC-V, NE-S, and LA-F conducted the data analysis. All authors contributed to the article and approved the submitted version.
This study was supported by the Universidad Nacional Autónoma de México (UNAM-DGAPA-PAPIIT grant number: IN-205019) and the Mexican Council of Science and Technology (CONACyT, grant number: FORDECYT- PRONACES/425888/2020). CC-V was supported with a BSc scholarship from UNAM-DGAPA-PAPIIT (grant number IN-205019).
The authors declare that the research was conducted in the absence of any commercial or financial relationships that could be construed as a potential conflict of interest.
The reviewer IL declared a past co-authorship with one of the authors LA-F to the handling Editor.
All claims expressed in this article are solely those of the authors and do not necessarily represent those of their affiliated organizations, or those of the publisher, the editors and the reviewers. Any product that may be evaluated in this article, or claim that may be made by its manufacturer, is not guaranteed or endorsed by the publisher.
We want to thank María del Carmen García Rivas, Eduardo Navarro Espinoza, Francisco Medellín Maldonado and Sara Melo Merino for greatly assisting with data collection and logistics. We thank Victor Rodríguez Ruano, Alba González-Posada and F. Javier González Barrios for their valuable comments and proofreading the manuscript. The comments of four reviewers helped to improve the manuscript substantially.
The Supplementary Material for this article can be found online at: https://www.frontiersin.org/articles/10.3389/fmars.2022.790818/full#supplementary-material
Aeby G. S., Ushijima B., Campbell J. E., Jones S., Williams G. J., Meyer J. L., et al. (2019). Pathogenesis of a tissue loss disease affecting multiple species of corals along the Florida reef tract. Front. Mar. Sci. 6. doi: 10.3389/fmars.2019.00678
Alvarez-Filip L., Estrada-Saldívar N., Pérez-Cervantes E., Molina-Hernández A., González-Barrios F. J. (2019). A rapid spread of the stony coral tissue loss disease outbreak in the Mexican Caribbean. PeerJ. 7 1–17 doi: 10.7717/peerj.8069
Alvarez-Filip L., González-Barrios F. J., Pérez-Cervantes E., Molina-Hernández A., Estrada-Saldívar N. (2022). Stony coral tissue loss disease decimated Caribbean coral populations and reshaped reef functionality. Commun. Biol. 7 1–17 doi: 10.1038/s42003-022-03398-6
Apprill A., Weber L. G., Santoro A. E. (2016). Distinguishing between microbial habitats unravels ecological complexity in coral microbiomes. mSystems 1., e00143-16 doi: 10.1128/msystems.00143-16
Bruckner A. W., Woodley C. M. (2009). Field guide to Western Atlantic coral diseases. Available at: https://repository.library.noaa.gov/view/noaa/538
Bruno J. F., Edmunds P. J. (1997). Clonal variation for phenotypic plasticity in the coral madracis mirabilis. Ecology 78, 2177. doi: 10.2307/2265954
Combs I. R., Studivan M. S., Eckert R. J., Voss J. D. (2021). Quantifying impacts of stony coral tissue loss disease on corals in southeast Florida through surveys and 3D photogrammetry. PLoS One 16, e0252593. doi: 10.1371/journal.pone.0252593
Costa S. V., Hibberts S. J., Olive D. A., Budd K. A., Long A. E., Meiling S. S., et al. (2021). Diversity and disease: The effects of coral diversity on prevalence and impacts of stony coral tissue loss disease in saint Thomas, U.S. virgin islands. Front. Mar. Sci. 8. doi: 10.3389/fmars.2021.682688
Cróquer A., Weil E. F., Rogers C. (2021). Similarities and differences between two deadly Caribbean coral diseases: White plague and stony coral tissue loss disease. Front. Mar. Sci. 8. doi: 10.3389/fmars.2021.709544
Dobbelaere T., Muller E. M., Gramer L., Holstein D., Hanert E. (2020). coupled epidemio-hydrodynamic modeling to understand the spread of a deadly coral disease in florida. Front. Mar. Sci 7, 1–16. doi: 0.3389/fmars.2020.591881
Duckworth A., Giofre N., Jones R. (2017). Coral morphology and sedimentation. Mar. pollut. Bull. 125, 289–300. doi: 10.1016/j.marpolbul.2017.08.036
Eaton K., Landsberg J. H., Kiryu Y., Peters E. C., Muller E. (2021). Measuring stony coral tissue loss disease transmission and lesion progression within two intermediately susceptible species, montastraea cavernosa and orbicella faveolata. Front. Mar. Sci. 8, 1–16. doi: 10.3389/fmars.2021.717265
Estrada-Saldívar N., Quiroga-García B. A., Pérez-Cervantes E., Rivera-Garibay O. O., Alvarez-Filip L. (2021). Effects of the stony coral tissue loss disease outbreak on coral communities and the benthic composition of cozumel reefs. Front. Mar. Sci. 8, 1–16. doi: 10.3389/fmars.2021.632777
FDEP (2018). Stony coral tissue loss disease case definition (Tallahassee, FL). Available at: https://nmsfloridakeys.blob.core.windows.net/floridakeys-prod/media/docs/20181002-stony-coral-tissue-loss-disease-case-definition.pdf.
Gintert B. E., Precht W. F., Fura R., Rogers K., Rice M., Precht L. L., et al. (2019). Regional coral disease outbreak overwhelms impacts from local dredge project. Environ. Monit. Assess. 191, 1–39. doi: 10.1007/s10661-019-7767-7
González-Barrios F. J., Alvarez-Filip L. (2018). A framework for measuring coral species-specific contribution to reef functioning in the Caribbean. Ecol. Indic. 95, 877–886. doi: 10.1016/j.ecolind.2018.08.038
Guzmán-Urieta E. O., Jordán-Dahlgren E. (2021). Spatial patterns of a lethal white syndrome outbreak in pseudodiploria strigosa. Front. Mar. Sci. 8. doi: 10.3389/fmars.2021.669171
Jones R., Fisher R., Bessell-Browne P. (2019). Sediment deposition and coral smothering. PLoS One 14, 1–24. doi: 10.1371/journal.pone.0216248
Kramer P. R., Roth L., Lang J. (2019). Map of stony coral tissue loss disease outbreak in the Caribbean. Available at: www.agrra.org. ArcGIS Online.
Landsberg J. H., Kiryu Y., Peters E. C., Wilson P. W., Perry N., Waters Y., et al. (2020). Stony coral tissue loss disease in Florida is associated with disruption of host–zooxanthellae physiology. Front. Mar. Sci. 7. doi: 10.3389/fmars.2020.576013
Lange I. D., Perry C. T. (2020). A quick, easy and non-invasive method to quantify coral growth rates using photogrammetry and 3D model comparisons. Methods Ecol. Evol. 11, 714–726. doi: 10.1111/2041-210X.13388
Lang J. C., Marks K. W., Kramer P. R., Kramer P. A. (2012) Protocolos AGRRA. Available at: http://www.healthyreefs.org/cms/wp-content/uploads/2013/07/Protoc.-AGRRA-V5.5-FINAL-Espanol.pdf.
Meiling S. S., Muller E. M., Lasseigne D., Rossin A., Veglia A. J., MacKnight N., et al. (2021). Variable species responses to experimental stony coral tissue loss disease (SCTLD) exposure. Front. Mar. Sci. 8. doi: 10.3389/fmars.2021.670829
Meiling S. S., Muller E. M., Smith T. B., Brandt M. E. (2020). 3D photogrammetry reveals dynamics of stony coral tissue loss disease (SCTLD) lesion progression across a thermal stress event. Front. Mar. Sci. 7. doi: 10.3389/fmars.2020.597643
Meyer J. L., Castellanos-Gell J., Aeby G. S., Häse C., Ushijima B., Paul V. J. (2019). Microbial community shifts associated with the ongoing stony coral tissue loss disease outbreak on the Florida reef tract. Front. Microbiol. 10, 1–12. doi: 10.1101/626408
Miller M. W., Colburn P. J., Pontes E., Williams D. E., Bright A. J., Serrano X. M., et al. (2019). Genotypic variation in disease susceptibility among cultured stocks of elkhorn and staghorn corals. PeerJ 2019, 1–12. doi: 10.7717/peerj.6751
Neely K. L., Macaulay K. A., Hower E., Dobler M.A.. (2020). Effectiveness of topical antibiotics in treating corals affected by Stony Coral Tissue Loss Disease. Peer J, 870402. doi: 10.1101/870402
Neely K. L., Lewis C. L., O’Neil K., Woodley C. M., Moore J., Ransom Z., et al. (2021). Saving the last unicorns: The genetic rescue of florida’s pillar corals. Front. Mar. Sci. 8. doi: 10.3389/fmars.2021.657429
Precht W. F., Gintert B. E., Robbart M. L., Fura R., van Woesik R. (2016). Unprecedented disease-related coral mortality in southeastern Florida. Sci. Rep. 6, 1–11. doi: 10.1038/srep31374
R Core Team (2020). R: A language and environment for statistical computing (Vienna, Austria: R Foundation for Statistical Computing). Available at: https://www.R-project.org/.
Ritchie K. B. (2006). Regulation of microbial populations by coral surface mucus and mucus-associated bacteria. Mar. Ecol. Prog. Ser. 322, 1–14. doi: 10.3354/meps322001
Rodríguez-Martínez R. E., Banaszak A. T., McField M. D., Beltrán-Torres A., Alvarez-Filip L. (2014). Assessment of acropora palmata in the mesoamerican reef system. PLoS One 9, 1–7. doi: 10.1371/journal.pone.0096140
Rosales S. M., Clark A. S., Huebner L. K., Ruzicka R. R., Muller E. M. (2020). Rhodobacterales and rhizobiales are associated with stony coral tissue loss disease and its suspected sources of transmission. Front. Microbiol. 11. doi: 10.3389/fmicb.2020.00681
Roy R. E. (2004). Akumal’s reefs: Stony coral communities along the developing Mexican Caribbean coastline. Rev. Biol. Trop. 52, 869–881.
Sharp W. C., Maxwell K. (2018) Investigating the ongoing coral disease outbreak in the Florida keys: collecting corals to diagnose the etiological agent(s) and establishing sentinel sites to monitor transmission rates and the spatial progression of the disease. Available at: https://floridadep.gov/sites/default/files/FWC-Sentinel-Site-Report-Final.pdf.
Shnit-Orland M., Kushmaro A. (2009). Coral mucus-associated bacteria: A possible first line of defense. FEMS Microbiol. Ecol. 67, 371–380. doi: 10.1111/j.1574-6941.2008.00644.x
Thome P. E., Rivera-Ortega J., Rodríguez-Villalobos J. C., Cerqueda-García D., Guzmán-Urieta E. O., García-Maldonado J. Q., et al. (2021). Local dynamics of a white syndrome outbreak and changes in the microbial community associated with colonies of the scleractinian brain coral pseudodiploria strigosa. PeerJ 9, e10695. doi: 10.7717/peerj.10695
Walton C. J., Hayes N. K., Gilliam D. S. (2018). Impacts of a regional, multi-year, multi-species coral disease outbreak in southeast Florida. Front. Mar. Sci. 5. doi: 10.3389/fmars.2018.00323
Williams S. D., Walter C. S., Muller E. M. (2021). Fine scale temporal and spatial dynamics of the stony coral tissue loss disease outbreak within the lower Florida keys. Front. Mar. Sci. 8, 1–15. doi: 10.3389/fmars.2021.631776
Keywords: SCTLD, disease outbreak, coral mortality, white plague, disease prevalence
Citation: Camacho-Vite C, Estrada-Saldívar N, Pérez-Cervantes E and Alvarez-Filip L (2022) Differences in the progression rate of SCTLD in Pseudodiploria strigosa are related to colony size and morphology. Front. Mar. Sci. 9:790818. doi: 10.3389/fmars.2022.790818
Received: 07 October 2021; Accepted: 28 June 2022;
Published: 22 July 2022.
Edited by:
Aldo Cróquer, The Nature Conservancy, Dominican RepublicReviewed by:
Ines D. Lange, University of Exeter, United KingdomCopyright © 2022 Camacho-Vite, Estrada-Saldívar, Pérez-Cervantes and Alvarez-Filip. This is an open-access article distributed under the terms of the Creative Commons Attribution License (CC BY). The use, distribution or reproduction in other forums is permitted, provided the original author(s) and the copyright owner(s) are credited and that the original publication in this journal is cited, in accordance with accepted academic practice. No use, distribution or reproduction is permitted which does not comply with these terms.
*Correspondence: Nuria Estrada-Saldívar, bnVyaWEuZXN0cmFkYXNhbGRpdmFyQGhvdG1haWwuY29t
†These authors have contributed equally to this work and share first authorship
Disclaimer: All claims expressed in this article are solely those of the authors and do not necessarily represent those of their affiliated organizations, or those of the publisher, the editors and the reviewers. Any product that may be evaluated in this article or claim that may be made by its manufacturer is not guaranteed or endorsed by the publisher.
Research integrity at Frontiers
Learn more about the work of our research integrity team to safeguard the quality of each article we publish.