- 1Industry 4.0 Convergence Bionics Engineering, Pukyong National University, Busan, South Korea
- 2Department of Marine Biology, Pukyong National University, Busan, South Korea
- 3Coastal Water Fisheries Resources Research Division, National Institute of Fisheries Science, Busan, South Korea
- 4Marine Integrated Biomedical Technology Center, The National Key Research Institutes in Universities, Pukyong National University, Busan, South Korea
To estimate the impact of aggregate mining on a marine ecosystem, fish assemblages and phytoplankton communities were analyzed using environmental DNA metabarcoding. Metabarcoding analysis revealed 152 fish amplicon sequence variants (ASVs) (88 in September and 118 in February), which were assigned to 29 orders, 62 families, 104 genera, and 114 species (73 in September and 89 in February). Heatmap analysis showed that the fish assemblages in the mining area clearly differed from those in the surrounding area and that Pagrus major, Lateolabrax japonicus, Zeus faber, and Eopsetta grigorjewi were significantly more abundant there than in the surrounding area. In the phytoplankton community in September, the phyla Cyanobacteria and Haptophyta differed significantly between the mining area and its surroundings. By contrast, no such significant differences were identified in February, presumably due to the low temperature impeding phytoplankton growth. Taking these findings together, mining activities clearly affect fish and phytoplankton communities, but further long-term study is required to assess their impacts on marine ecosystems.
Introduction
To meet increasing demands for either residential or industrial construction, considerable amounts of sand and gravel are currently extracted from the marine continental shelf instead of depleted rivers or estuaries (Kim and Grigalunas, 2009). Mining activities for such aggregates are often accompanied by physical changes at the sites, such as the creation of pits and furrows of various sizes, or environmental changes in the vicinity, such as changes in the sediment composition (Birklund and Wijsman, 2005; Kim and Grigalunas, 2009). Additionally, suspended sediment (SS) containing organic matter, nutrients, or other contaminants (e.g., heavy metals) is also released by mining activities. Such SS can spread up to approximately 20 km away from the mining site, impacting on the neighboring ecosystem (Birklund and Wijsman, 2005; Jones et al., 2016; Won et al., 2017).
Although many studies have been conducted to assess the environmental and ecological impacts of mining activities, information on the magnitude and severity of the potential risks of such activities is still limited and controversial, making it difficult to draw definitive conclusions (Mensah, 1997; Phua et al., 2002; Byrnes et al., 2004; Birklund and Wijsman, 2005). An abundance of research has described the adverse impacts of mining activities on the benthic macrofauna (Desprez, 2000; Newell et al., 2004) and on fish assemblages (Diaz et al., 2004; Son and Han, 2007; Bilkovic, 2011). On the other hand, Newell et al. (2004) reported that less intensive exploitation by trailer dredgers had no impact on the community composition of macrofauna. The discrepant or limited information from previous studies is due to the use of traditional survey methods (e.g., visual surveys and trawling), which are expensive, laborious, and time-consuming, making it difficult to conduct large-scale surveys with statistically meaningful sample sizes.
As one cost effective alternative to these approaches, special attention is now being paid to the environmental DNA (eDNA) metabarcoding technique, in which the biodiversity at each sample site is analyzed through high-throughput sequencing without catching target individuals. eDNA refers to all genetic materials in the environment (e.g., water, soil, or air), which is derived from skin tissue, scales, hair, mucus, and excreta that have separated from organisms (Taberlet et al., 2012; Bohmann et al., 2014). Compared with surveys by the traditional methods, those by eDNA metabarcoding can analyze a biota simply using environmental samples, with higher sensitivity and little environmental destruction during sample collection (Ficetola et al., 2008; Stat et al., 2017; Djurhuus et al., 2018). Besides, owing to the lower cost and less labor-intensiveness than in traditional methods, a much larger sample size can be analyzed by metabarcoding, increasing the likelihood of obtaining statistically meaningful data (Thomsen et al., 2012; Harvey et al., 2017; Stoeckle et al., 2017).
As in many other countries with a rapidly growing economy, demand for sand and gravel for the construction of infrastructure has been increasing in South Korea, depleting their availability from the land. Since 2008, marine aggregates have been extracted from the shelf offshore of the south of the Korean peninsula. In 2017, this was temporarily halted due to conflict with local fishermen, who claimed that it was having adverse impacts on the fisheries. However, the mining activities resumed in 2019 to meet the strong demand for aggregates, increasing tension between developers and fishermen. Thus, there is an urgent need for scientific and objective assessment of the impact of aggregate mining on the marine ecosystem in order to establish reasonable policies to meet the needs of both sides. Besides, it would be extremely difficult and costly to restore damaged marine ecosystems. Unfortunately, few studies about the impacts of aggregate mining activities on the marine ecosystem in Korean waters have been reported. One previous study explored the impact of aggregate mining on the structure and diversity of microbial communities using a molecular biological approach in the Exclusive Economic Zone (EEZ), the southern sea of Korea (Won et al., 2017). However, benthic microbial community structures may not provide useful information about the impacts of marine aggregate mining on fish diversity or primary production, which are among the most valuable factors for understanding disturbances of the marine ecosystem. In this study, we conducted eDNA metabarcoding analyses to assess the impacts of aggregate mining on fish assemblages and phytoplankton communities offshore in the southern sea of Korea.
Materials and Methods
Seawater Sample Collection
Seawater samples were collected in two surveys (September 2019 and February 2020) conducted by the National Institute of Fisheries Science, South Korea (Figure 1). In September 2019, 10 sites were selected for seawater collection: two at an aggregate mining site (3H and 3I), three near that site (4D, 4G, and 5H), and five distantly located from it (N, E, E1, W, and S). In February 2020, water samples were collected from 20 sites to estimate the distance range affected by the aggregate mining. One location at a site of aggregate mining (4G) and four others nearby (3H, 3I, 4D, 5H) were chosen as the mining sites, while 15 sites in the surrounding area (G01 to G15) with the same distance (16.92 km and 14.39 km between sites in longitude, 14.25 km between sites in latitude) were selected as the control sites. Since the East Korea Warm Current (EKWC), a branch of the Tsushima Current, flows from southwest to northeast along the southeastern coast of the Korean peninsula, twice as many sites were located in the northeast region to track the impacts of suspended solids (Figure 1). Water temperature and salinity were measured at each sampling site using SBE 911plus CTD (Sea-Bird Scientific, Bellevue, United States). Two liters of seawater collected at each sample site (1 L from the surface and the other at a depth of 50 m) and one liter of sterile distilled water for a negative control were filtered through a 0.45 μm pore-sized GN-6 membrane filter (Pall Corporation, New York, United States). The filtered membranes were stored at −70°C until used for DNA extraction.
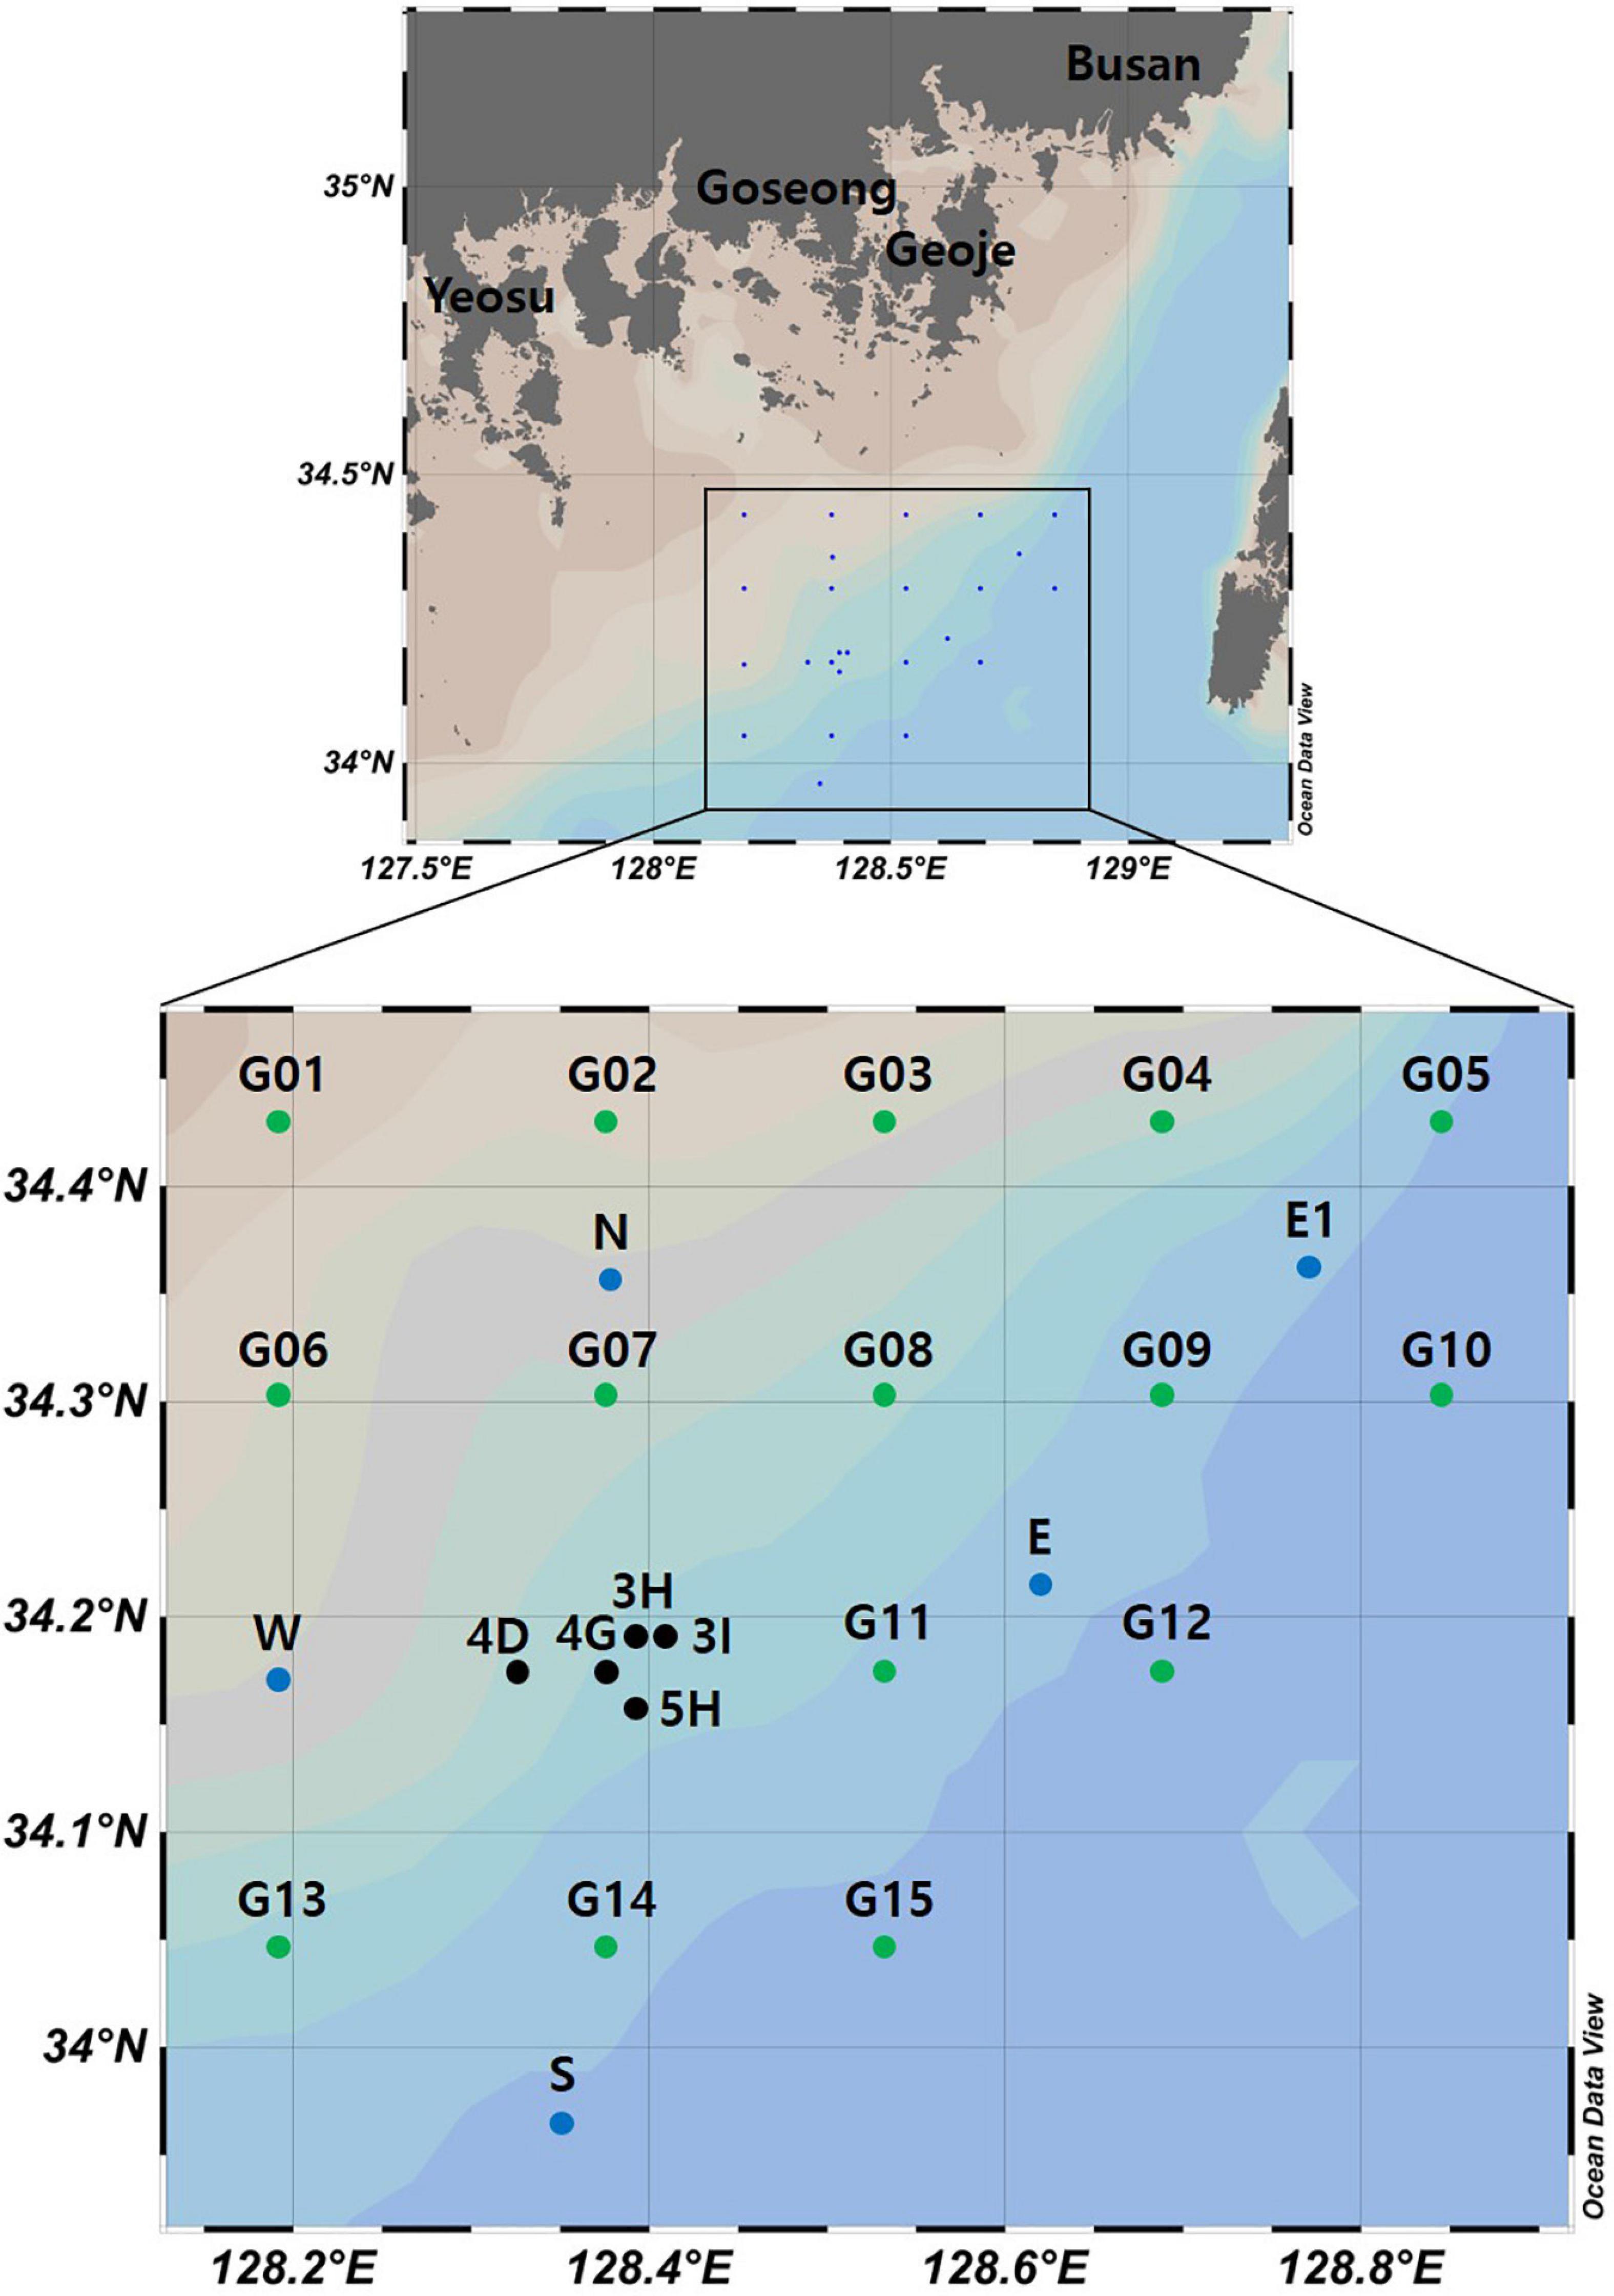
Figure 1. Seawater sample collection sites for the metabarcoding analyses of fish assemblages and phytoplankton community structure from southern coastal waters of Korea (black dots represent aggregate mining sites, blue and green dots represent control sites in September and February, respectively).
Metabarcoding Analysis of Fish and Phytoplankton Taxa From the Seawater Samples
Environmental DNA (eDNA) was extracted with genomic DNA using DNeasy® Plant Mini Kit (QIAGEN, Hilden, Germany), in accordance with a slightly modified version of the manufacturer’s protocol (Yoon et al., 2016; Kang et al., 2018). The membrane was initially put into lysis buffer containing 1/4” ceramic spheres (MP Biomedicals, Santa Ana, United States) and homogenized by FastPrep-2 (MP Biomedicals). Extracted genomic DNA was quantified using a NanoDrop ND-1000 spectrophotometer (Thermo Fisher Scientific, Waltham, United States), aliquoted, and stored at −70°C until used for further analysis.
The libraries for metabarcoding analysis of fish and phytoplankton taxa were constructed for the Illumina MiSeq system, including negative controls for eDNA extraction and PCR reaction mixture. MiFish and plastid 23S (p23S) rRNA universal primer sets were used for analyzing the fish assemblages and phytoplankton community structure, respectively (Miya et al., 2015; Kang et al., 2018). Primary PCR was conducted with each corresponding universal primer set overhanging the adapter sequences (Table 1). PCR conditions for library preparation of MiFish and p23S followed those used in previous studies (Miya et al., 2015; Kang et al., 2018). The quantity and quality of the amplicon libraries were measured using a Quantus Fluorometer (Promega, Madison, United States) and BioAnalyzer 2100 (Agilent Technologies, Santa Clara, United States). Sequencing of the constructed library was carried out using the Illumina MiSeq system.
Bioinformatic Data Analysis
Raw reads (QV > 20) trimmed adapter and index sequences were paired using Python 27 (v2.7.16). The paired reads were further analyzed through the DADA2 package (v.1.22.0) in R (Callahan et al., 2016) to correct sequencing error and to obtain amplicon sequence variants (ASVs). Paired-end reads were denoised with adjusted parameters of truncLen = c(150, 140), trimLeft = c(21, 27), maxEE = c(1, 1) for Mifish and truncLen = c(230, 200), trimLeft = c(21, 19), maxEE = c(2, 2) for p23S. Filtered reads were then merged and chimeric merged reads were eliminated by default settings. To remove erroneous ASVs generated by DADA2, post-clustering curation algorithm was further applied with adjusted minimum match parameter (95) by LULU (v.0.1.0) (Frøslev et al., 2017). The taxonomic assignment to curated ASVs was carried out using BLASTn (v.2.10.0) based on the NCBI nt database. The fish ASVs were assigned to species level with a cut-off sequence identity of 99% and those with less than 99% sequence identity were excluded from further analyses. The phytoplankton ASVs with higher than 98% sequence identity to the database were assigned to the species name, and those with between 90 and 97% sequence identity were assigned to the top-hit genus name. If the sequence identity was less than 90%, the ASVs were classified as “unknown.” Further analyses of phytoplankton community structure were carried out with ASVs assigned descriptions at the phylum level. The datasets are the closest BLAST matches, not validated species observation in this study.
A phylogenetic tree of representative fish ASVs identified in Korean coastal waters was constructed with the maximum likelihood algorithm using MEGA 11.0 (Tamura et al., 2021). The sample-size-based rarefaction and extrapolation curves were generated with associated 95% confidence intervals using the iNEXT package (v.2.0.20) in R (Chao et al., 2014; Hsieh et al., 2016). The diversity indices including fish species richness (d) and evenness (J’) were calculated with the read numbers normalized by subsampling to the lowest number of reads using Mothur software (v.1.46.1). Further statistical analysis was performed by the two-sample t-test for alpha diversity between aggregate mining and distantly located areas. The representative fish assemblages were constructed based on the ranks of abundance score of each species in the aggregate mining and control areas. Beta diversity of phytoplankton community structures was estimated with square-root transformed data. Similarity analyses of fish assemblages and phytoplankton communities were conducted based on Bray–Curtis dissimilarity using PRIMER 7 (v.7.0.13) (Clarke and Gorley, 2015). Heatmap plots of fish assemblages and phytoplankton communities were constructed to determine significantly abundant species in each sample collection site using XLSTAT software (v.2020.5.1)1.
Results
Environmental Parameters
Water temperature and salinity were measured at each sample collection site (Supplementary Table 1). The mean surface water temperature in September was 23.84°C, ranging from 23.09°C to 25.07°C, which was 0.44°C lower than that at a depth of 50 m (Supplementary Table 1). In February, surface temperatures ranged from 13.03°C to 16.76°C, with an average of 14.81°C, 0.58°C higher than the value at a depth of 50 m (Supplementary Table 1). There were no significant differences in mean water temperature between the aggregate mining and control sites in both September and February. Salinity of the surface water in September ranged from 31.57 psu to 32.84 psu, while that at a depth of 50 m ranged from 32.51 psu to 33.53 psu, with an average of 32.96 psu, which was 0.76 psu higher than that of surface water (Supplementary Table 1). On the other hand, the mean salinity of surface water in February was 34.34 psu, ranging from 34.13 psu to 34.52 psu, which was 0.09 psu higher than the value at a depth of 50 m, ranging from 34.02 psu to 34.50 psu (Supplementary Table 1). As with water temperature, no significant differences in mean salinity were identified between the aggregate mining and control sites in both September and February. Taking these findings together, we failed to identify any difference in either water temperature or salinity between the mining sites and their surroundings.
Fish Assemblages by Metabarcoding Analysis
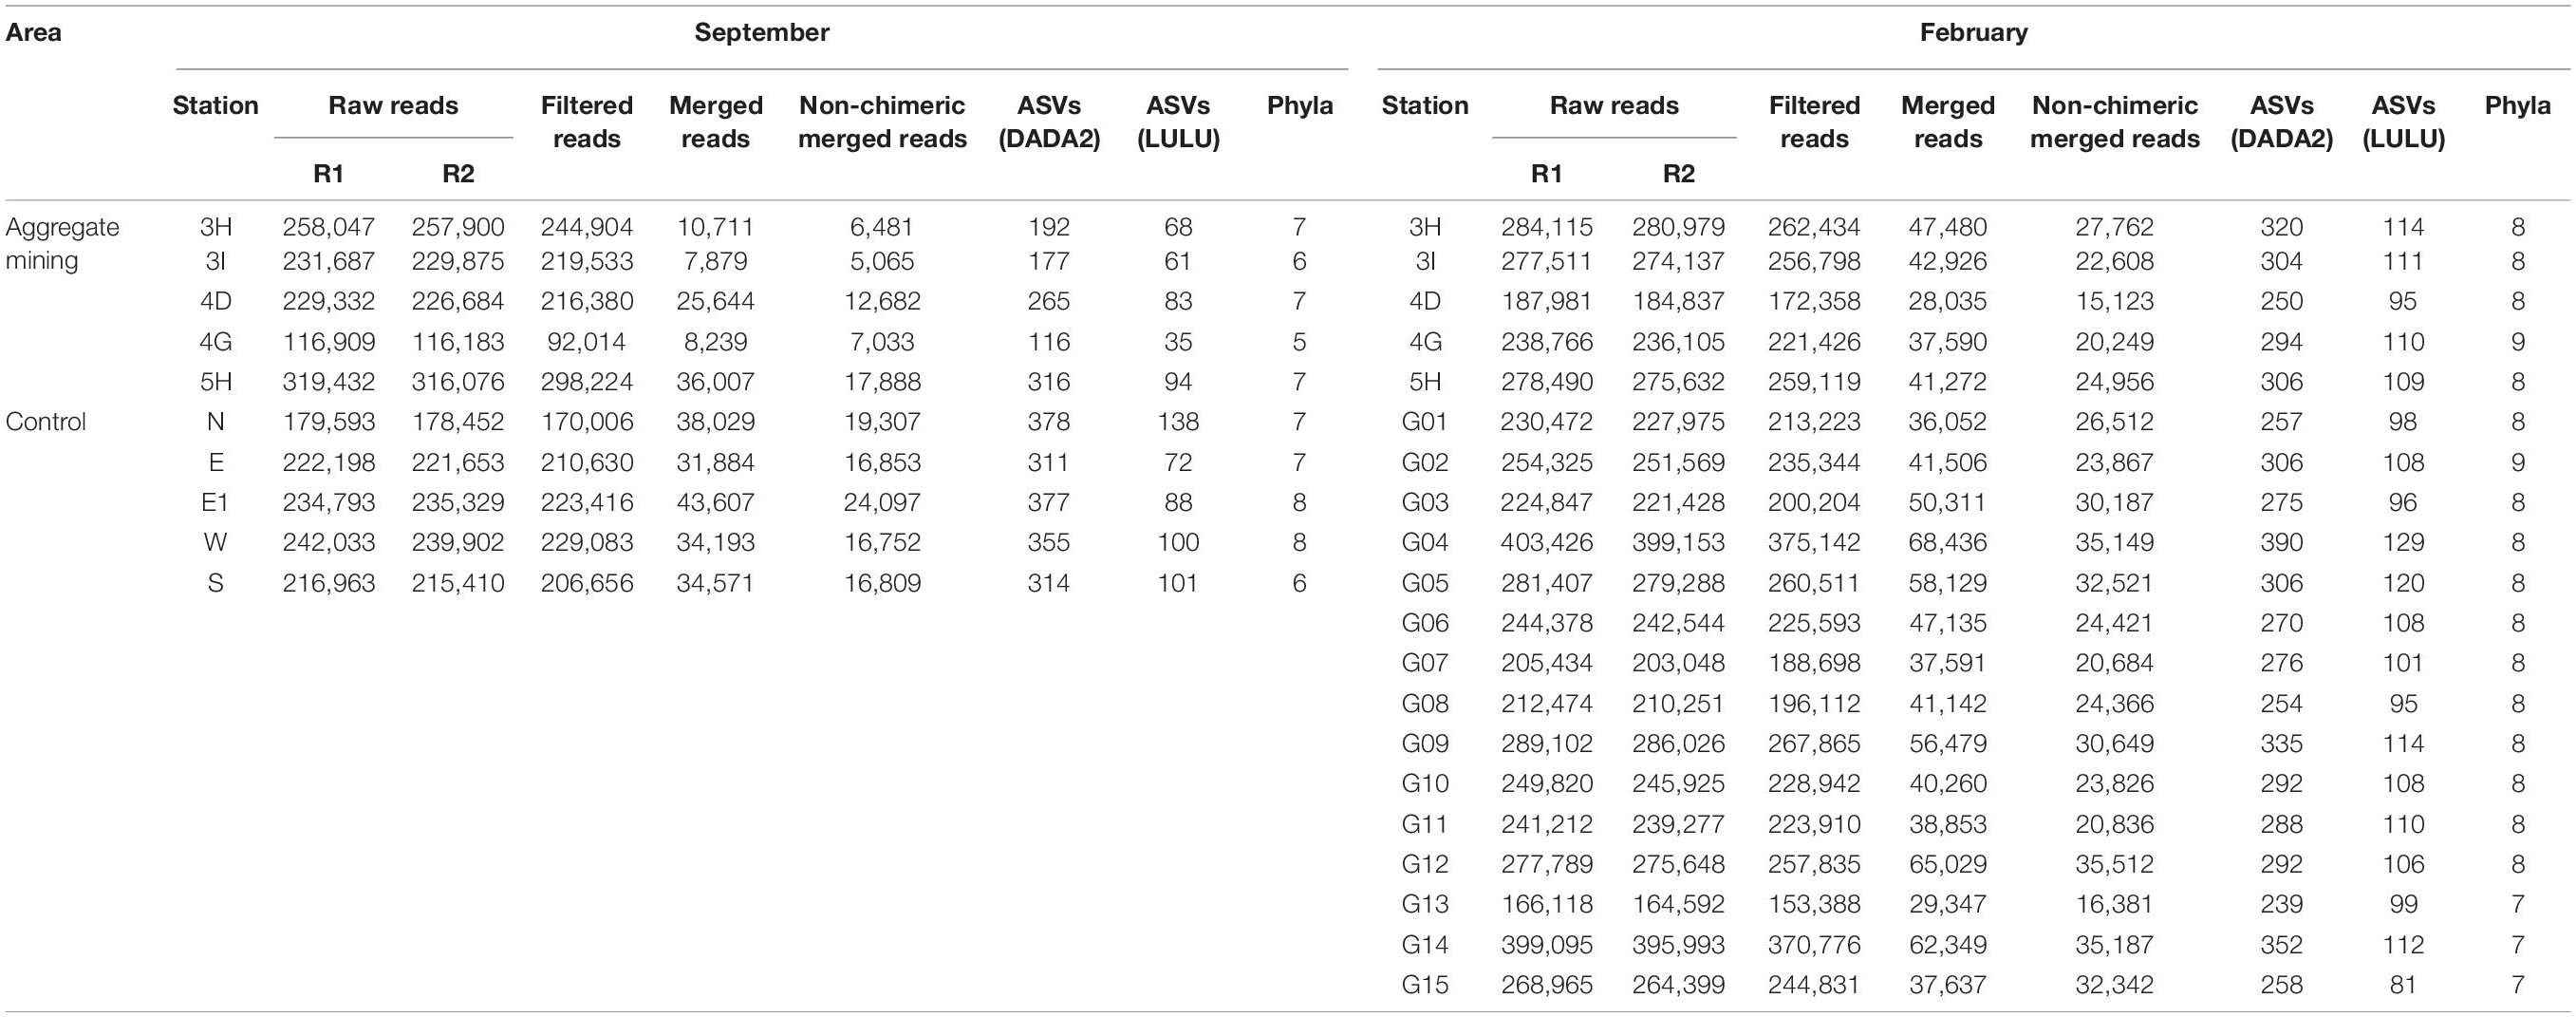
To determine whether there were any differences in fish assemblages between the mining sites and their surroundings, metabarcoding analysis was conducted using environmental DNA (eDNA) extracted from seawater samples. The eDNA metabarcoding analysis from 30 seawater samples (10 sites in September and 20 sites in February) revealed a total of 5,553,597 raw reads (Table 2). After denoising the raw reads with the DADA2 pipeline, 4,660,579 non-chimeric merged reads were finally obtained (3,353,540 in September and 1,307,039 in February), which accounted for 83.92% of the total raw reads, indicating the high quality of the reads. Among the 4,660,579 merged reads, 4,331,149 of them (92.93%) with high sequence identity to the reference database (≥99%) were used for further analyses (Table 2). A total of 152 ASVs (88 in September and 118 in February) were finally generated from the 4,331,149 reads after post-clustering curation by LULU, which were assigned to 29 orders, 62 families, 104 genera, and 114 species (73 in September and 89 in February) (Table 2 and Figure 2). Among them, the highest species number was identified in the order Perciformes (20 species), followed by Pleuronectiformes (10 species), Clupeiformes (10 species), Eupercaria incertae sedis (9 species), and Anguilliformes (9 species).
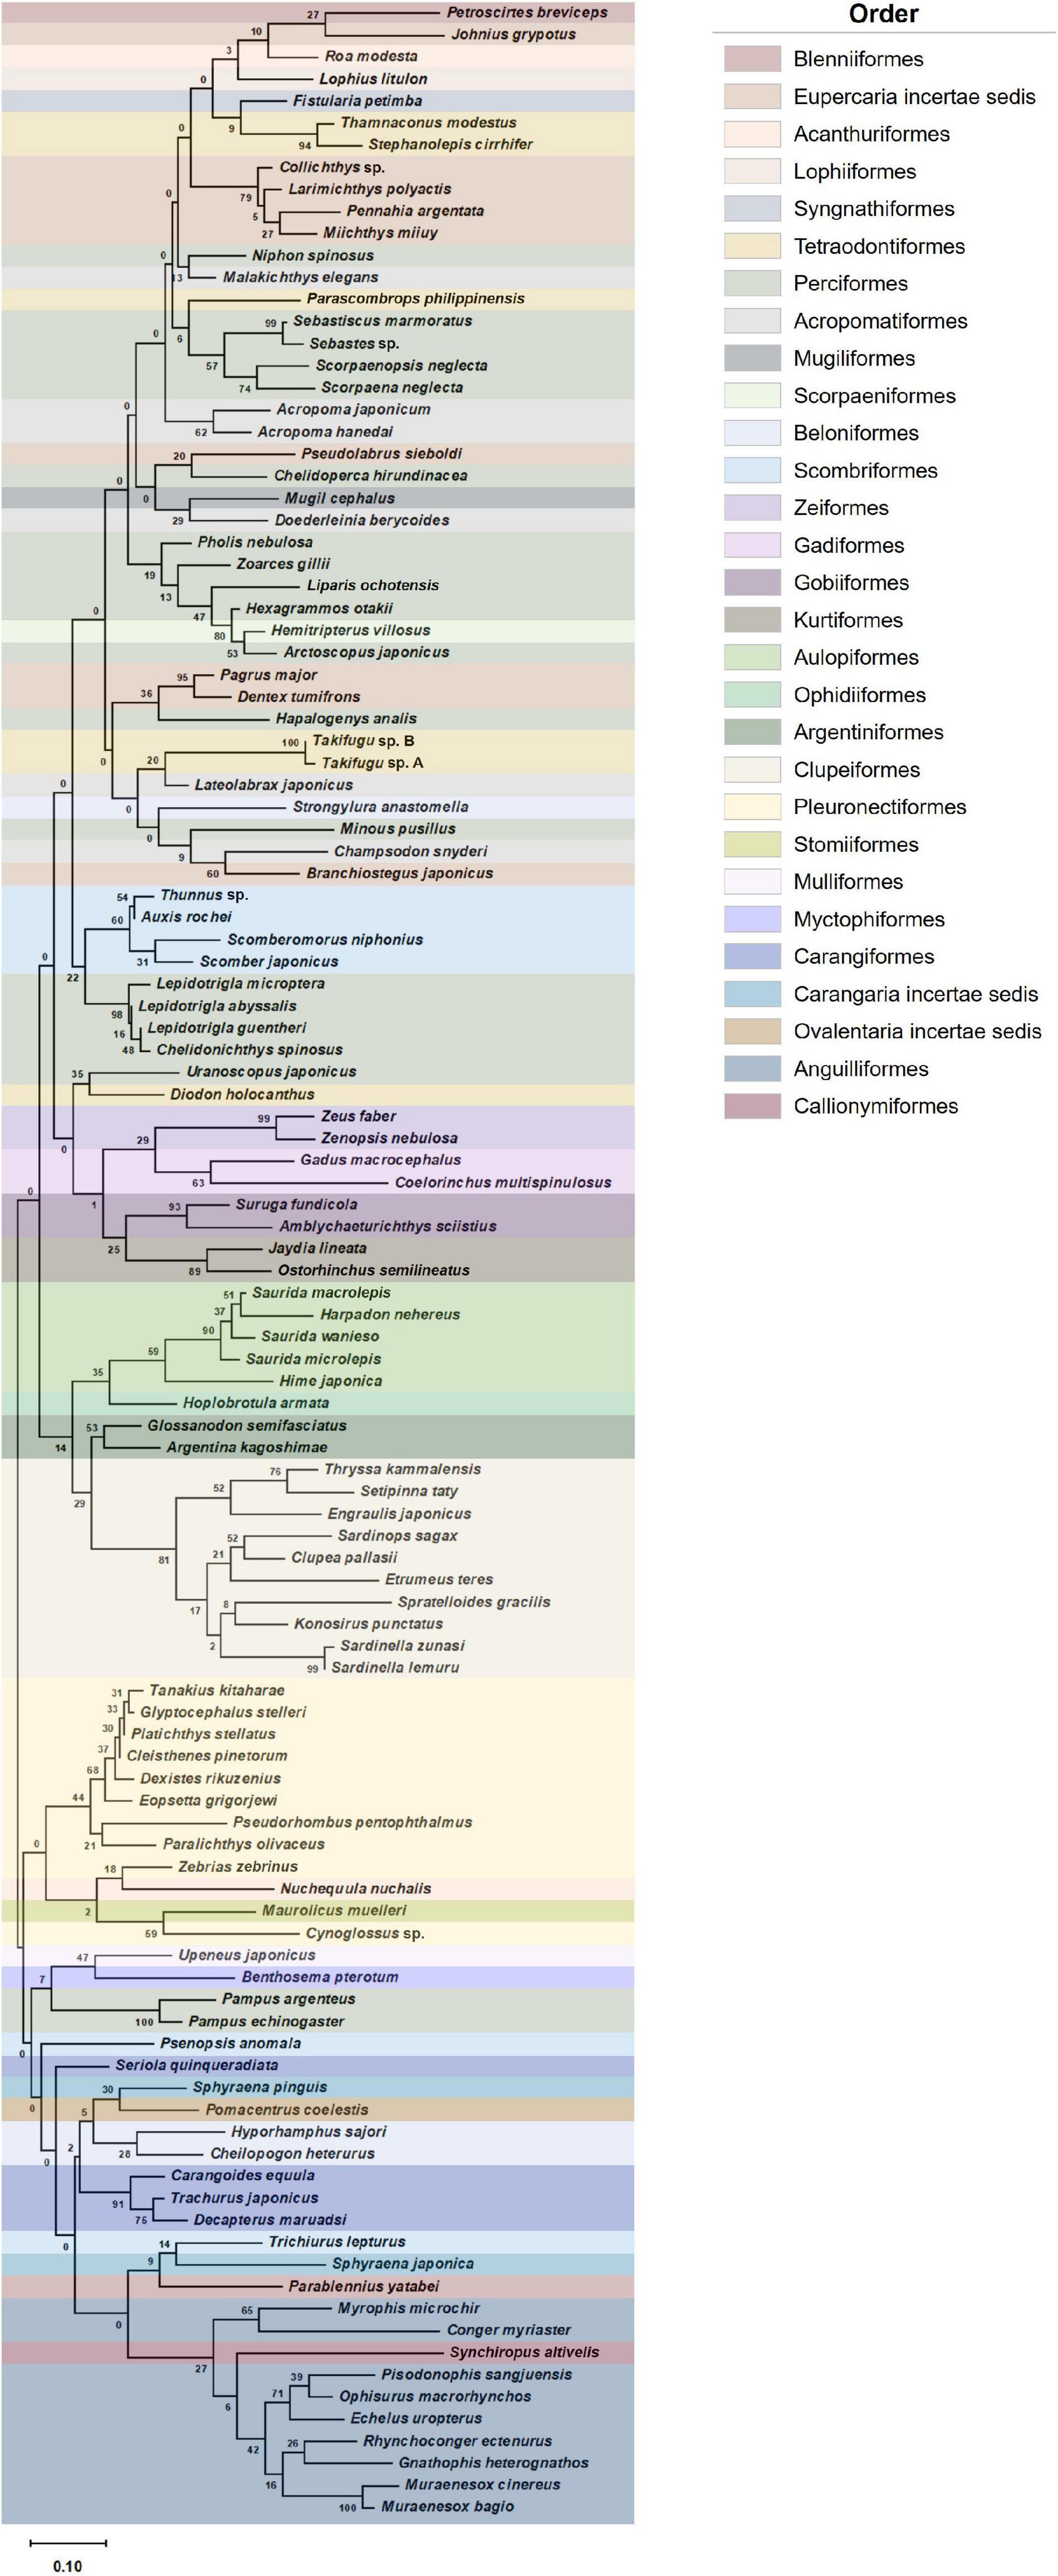
Figure 2. Phylogenetic analysis of representative fish ASVs identified in Korean coastal waters (phylogenetic tree was constructed by maximum likelihood algorithm (MEGA 11.0) under 1,000 replication bootstraps).
Amplicon sequence variants accumulation curves showed that all the samples reached to saturation points, indicating sufficient sampling effort and sequencing depth (Supplementary Figure 1). Species richness (d) and evenness (J’) were compared between the mining sites and their surroundings (Table 3). In September, site 3H at the extraction site (3.64) and site E1 (1.48) showed the highest and lowest species richness, respectively, while 3I within the extraction area (4.93) and G11 (1.28) were among the sites with the highest and lowest species richness sites in February (Table 3). The mean species richness was highest in the aggregate mining sites in February (3.49), followed by those in September (3.17). Although relatively low values of mean species richness were obtained in the surrounding regions in both September (2.50) and February (2.54), a significant difference was identified only in those in February (p < 0.05) under the two-sample t-test (Table 3). Species evenness ranged from 0.24 at 5H in September to 0.73 at G10 in February (Table 3). The highest mean species evenness was identified in the aggregate mining sites in February (0.62), followed by the surrounding areas in both September (0.52), and February (0.48) (Table 3). The aggregate mining area in September showed the lowest mean species evenness (0.34), which was significantly lower than that of the control region in September (p < 0.05) and the extraction region in February (p = 0.001) (Table 3). Taking these findings together, there was no consistent pattern of fish assemblages in terms of either species richness or evenness between the aggregate mining areas and their surroundings.
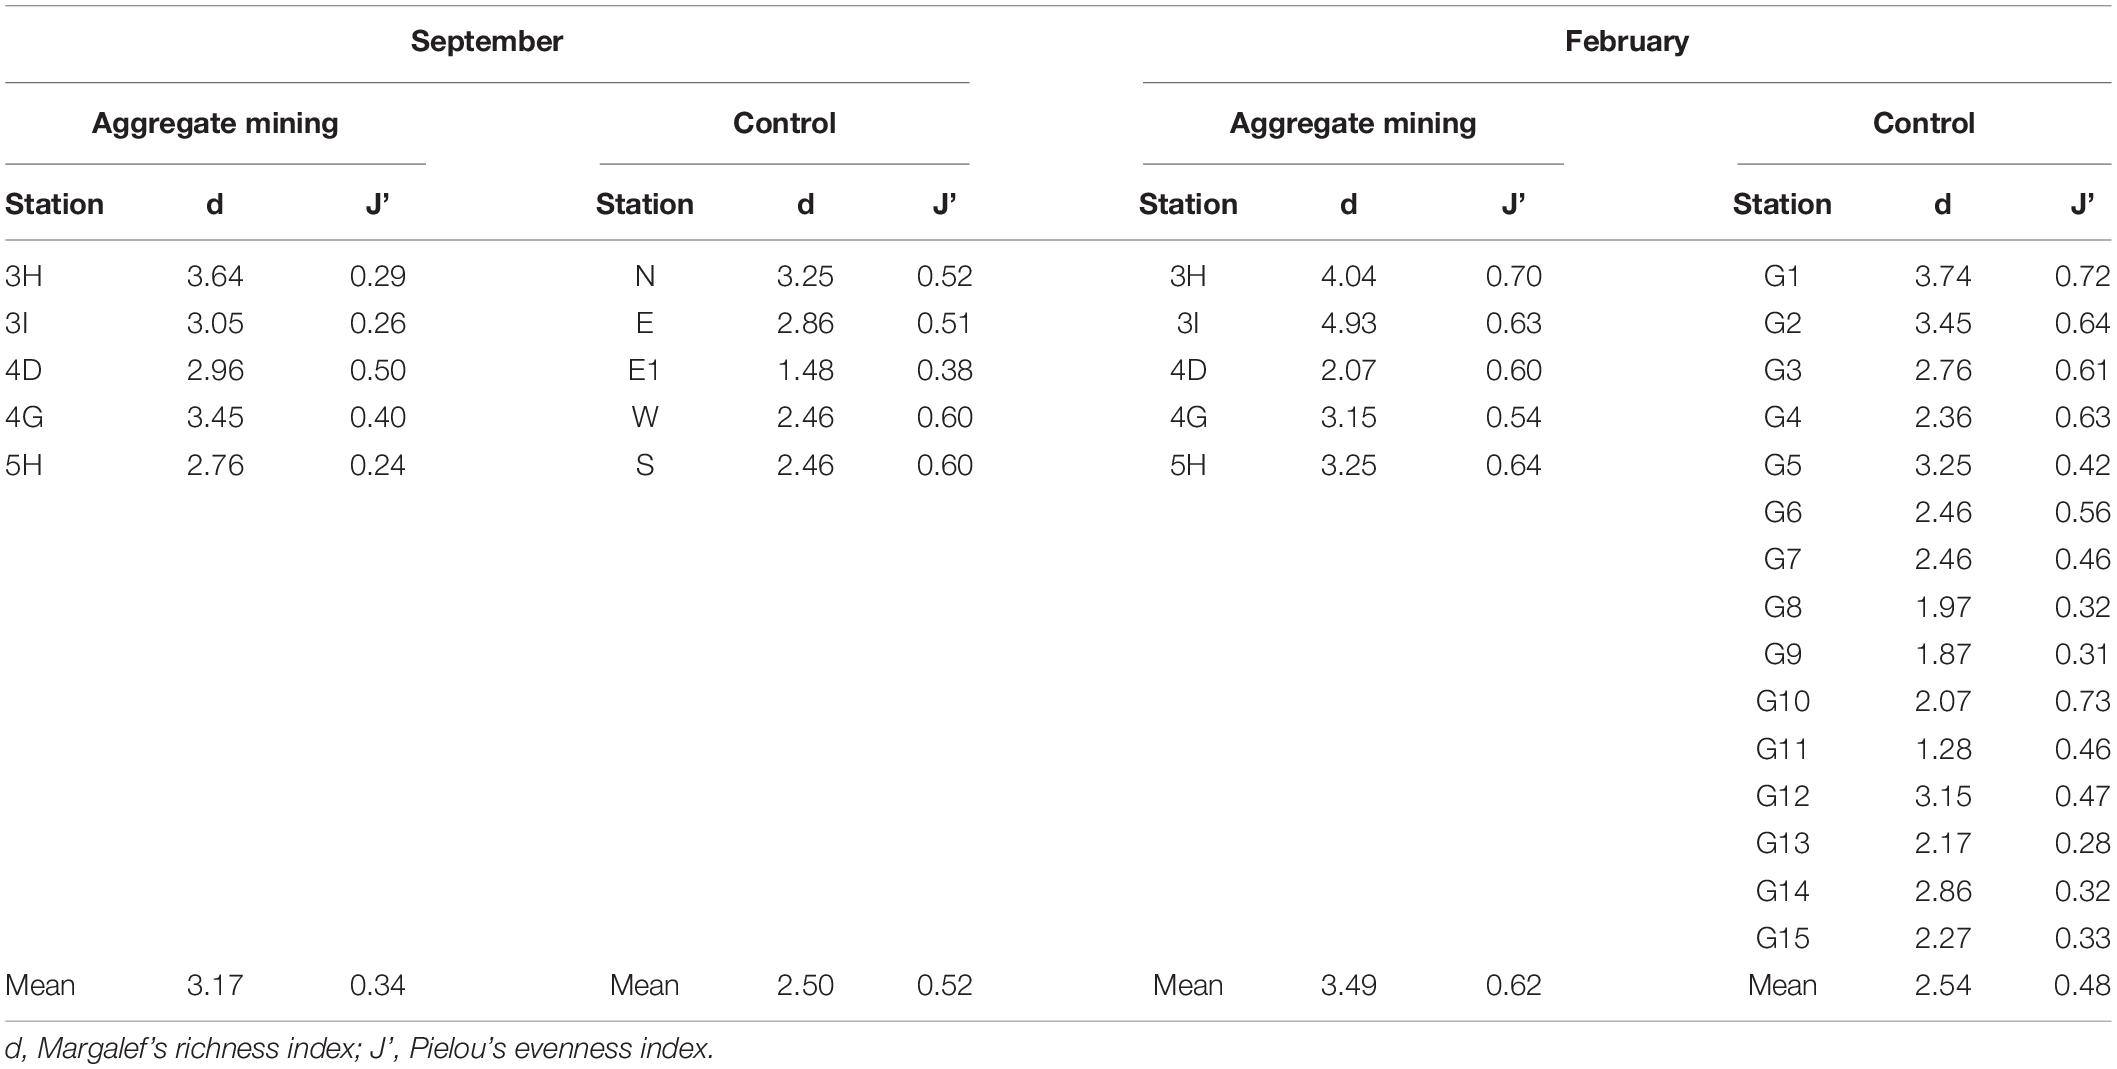
Table 3. Diversity indices at each sample collection site for the fish assemblages in Korean coastal waters by eDNA metabarcoding analysis.
Comparative Analysis of Fish Assemblages Between the Aggregate Mining Areas and Distantly Located Areas
Species compositions were compared between the mining area and its surroundings (Figure 3). Seventeen fish species were commonly identified in both aggregate mining and control areas during the surveys (Figure 3 and Supplementary Table 2). Most of those fishes were among the most abundantly found in the southern coastal waters off the Korean peninsula. The proportions of commonly identified fish species ranged from 0.002 to 81.48% in each site, with an average of 5.79% (Supplementary Table 3). Among them, Trachurus japonicus was the most abundant, with an incidence ranging from 1.60 to 78.81%, followed by Pagrus major (from 0.009 to 81.48%), Scomber japonicus (from 0.03 to 57.48%), Psenopsis anomala (from 0.02 to 29.56%), and Engraulis japonicus (from 0.03 to 30.57%) (Supplementary Table 3). Twenty-five and 41 species were exclusively identified in September and February, respectively, indicating a large seasonal change in the fish assemblages in the area (Figure 3). However, the proportions of exclusively identified fish species ranged from 0.001 to 30.52% in September and 0.005 to 25.12% in February, which were much lower than those of the commonly identified species (Supplementary Table 3).
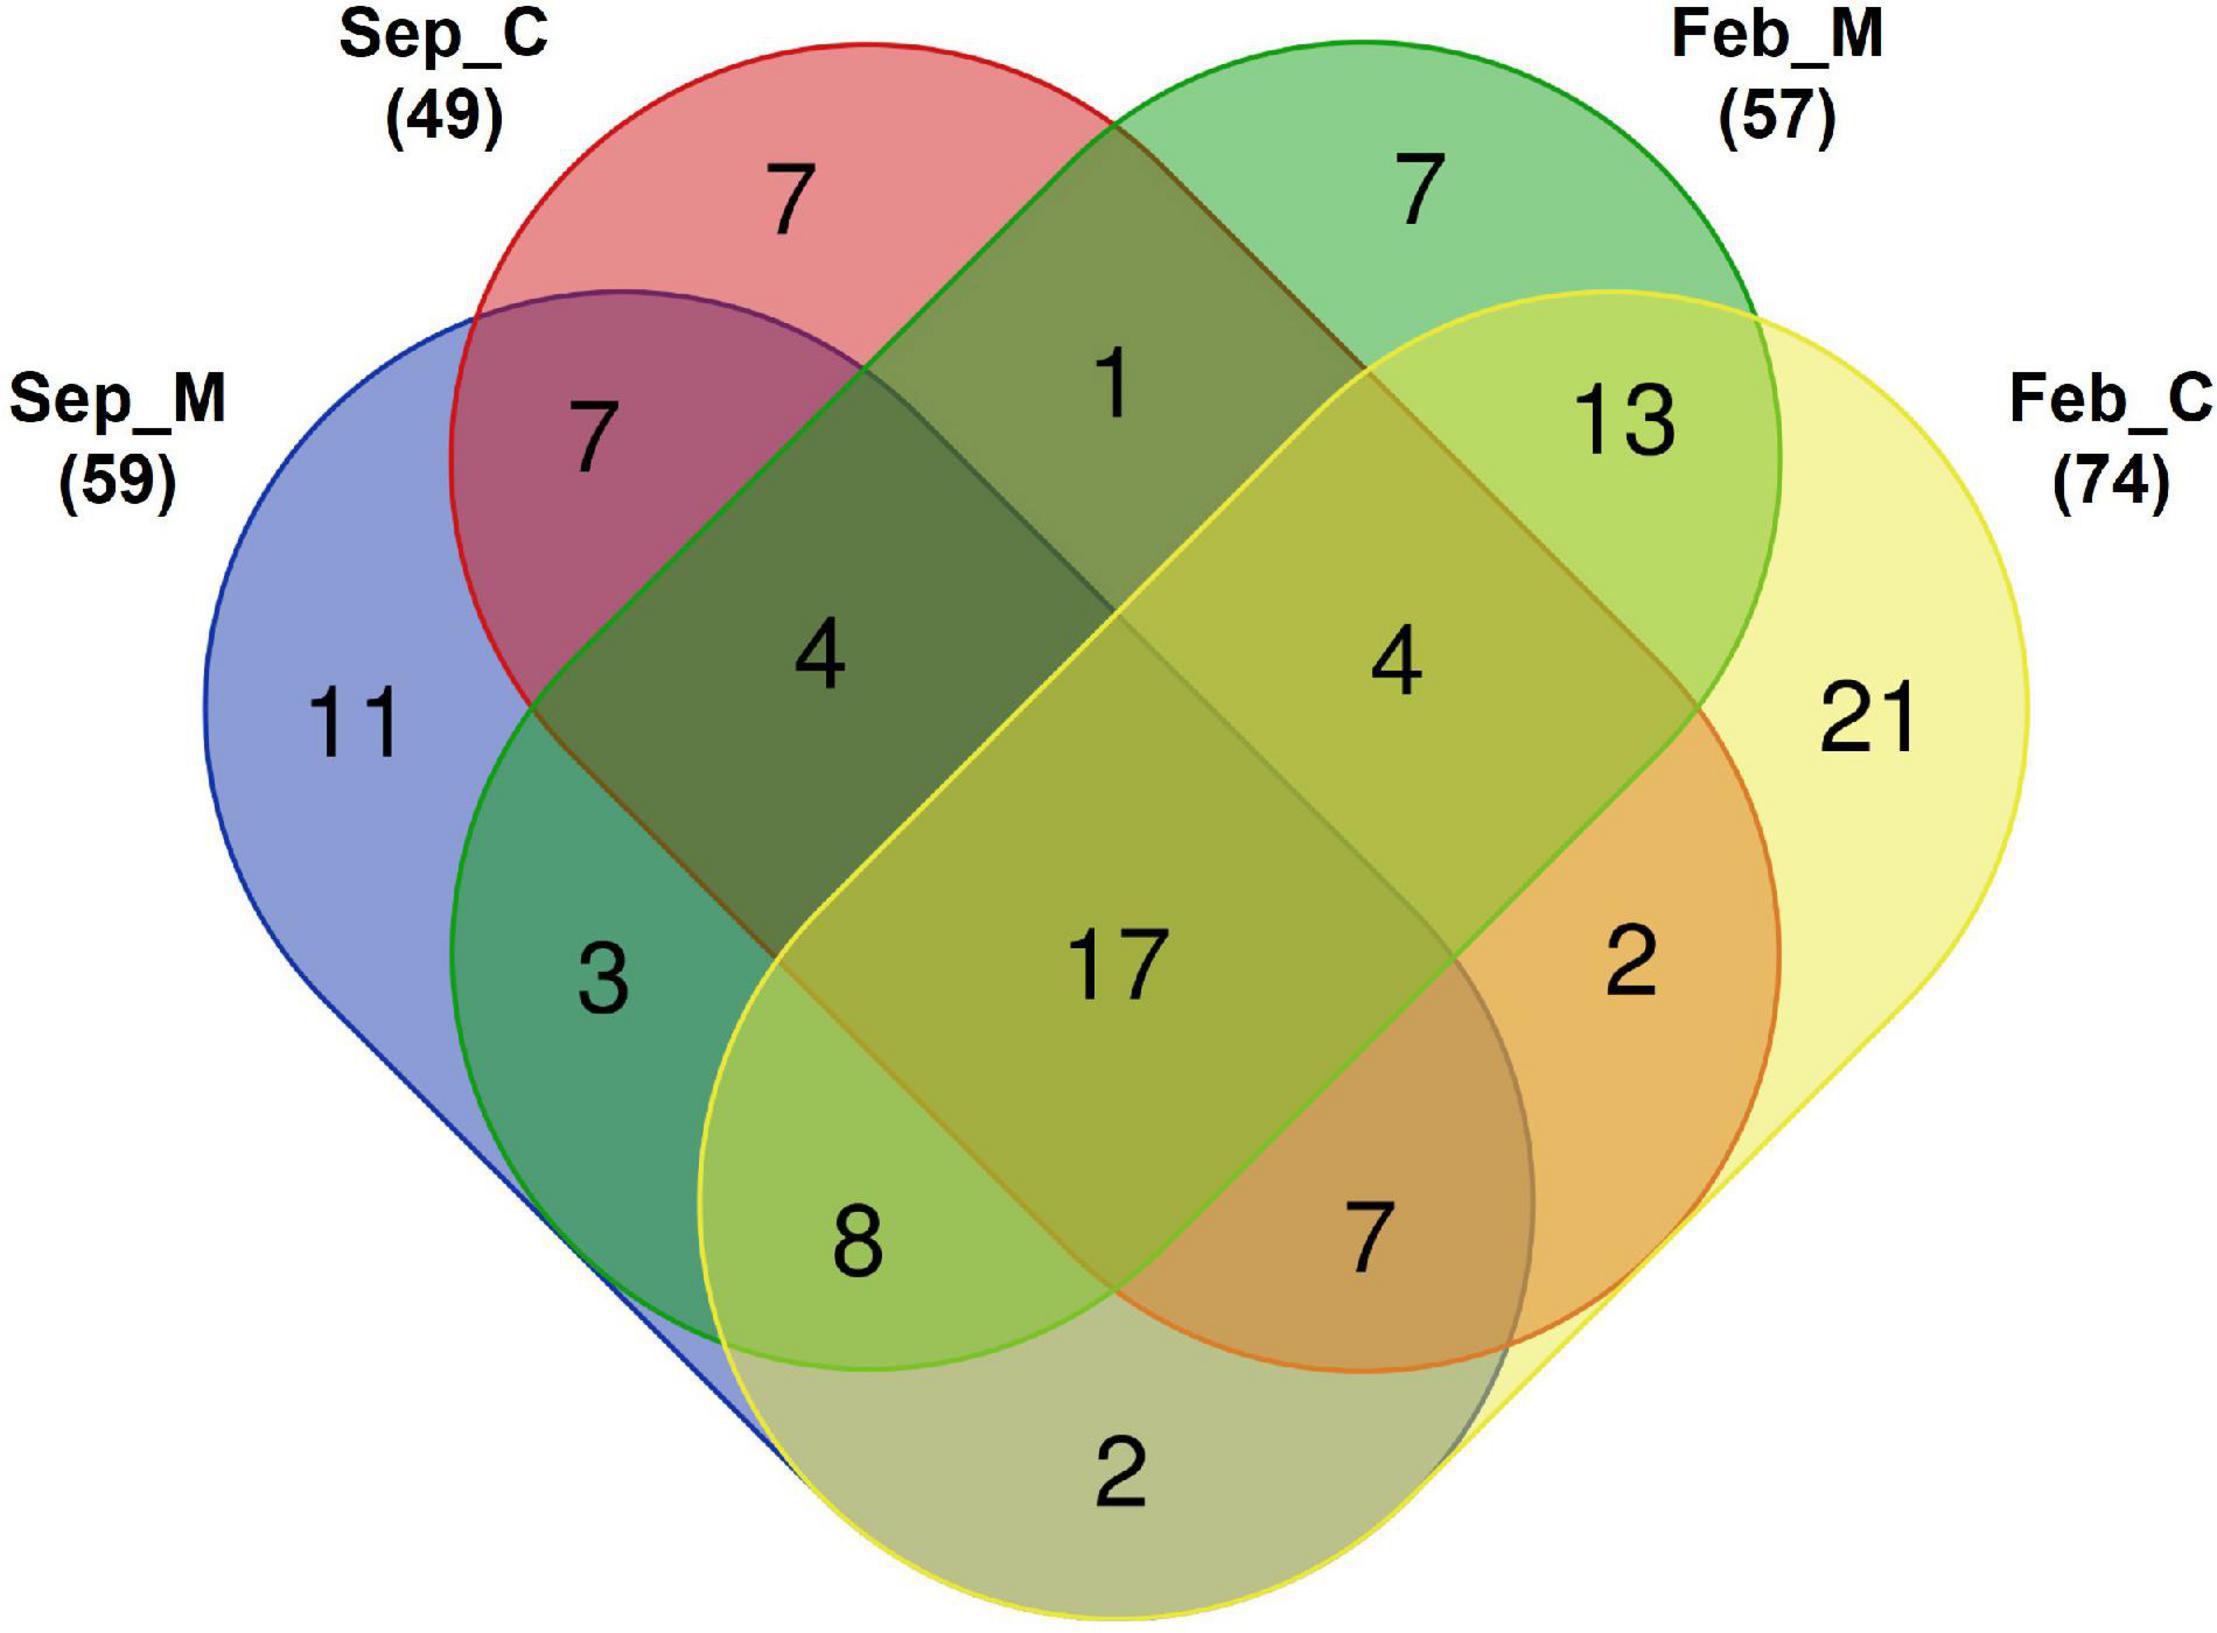
Figure 3. Venn diagram of detected fish species in Korean coastal waters by eDNA metabarcoding analysis [M, aggregate mining; C, control; numbers in parentheses represent total number of identified fish species in each area. Venn diagram was constructed with an online program (http://bioinformatics.psb.ugent.be/webtools/Venn)].
The most abundant fish species were compared between the aggregate mining area (3H, 3I, 4D, 4G, and 5H) and its surroundings (N, E, E1, W, and S in September and G01 to G15 in February) (Table 4). The aggregate mining area in September was dominated by T. japonicus, P. major and P. anomala, S. japonicus, and Lophius litulon, whereas the surrounding area distantly located from the aggregate mining was dominated in order by S. japonicus, P. anomala, T. japonicus, Nuchequula nuchalis, and E. japonicus (Table 4). In February, Lateolabrax japonicus was the most abundant fish species in the aggregate mining area, followed by T. japonicus, P. major, Zeus faber, and Sphyraena pinguis, Acropoma japonicum (Table 4). In contrast, T. japonicus, Thamnaconus modestus, S. pinguis, L. japonicus, and A. japonicum were dominant in the control area (Table 4).
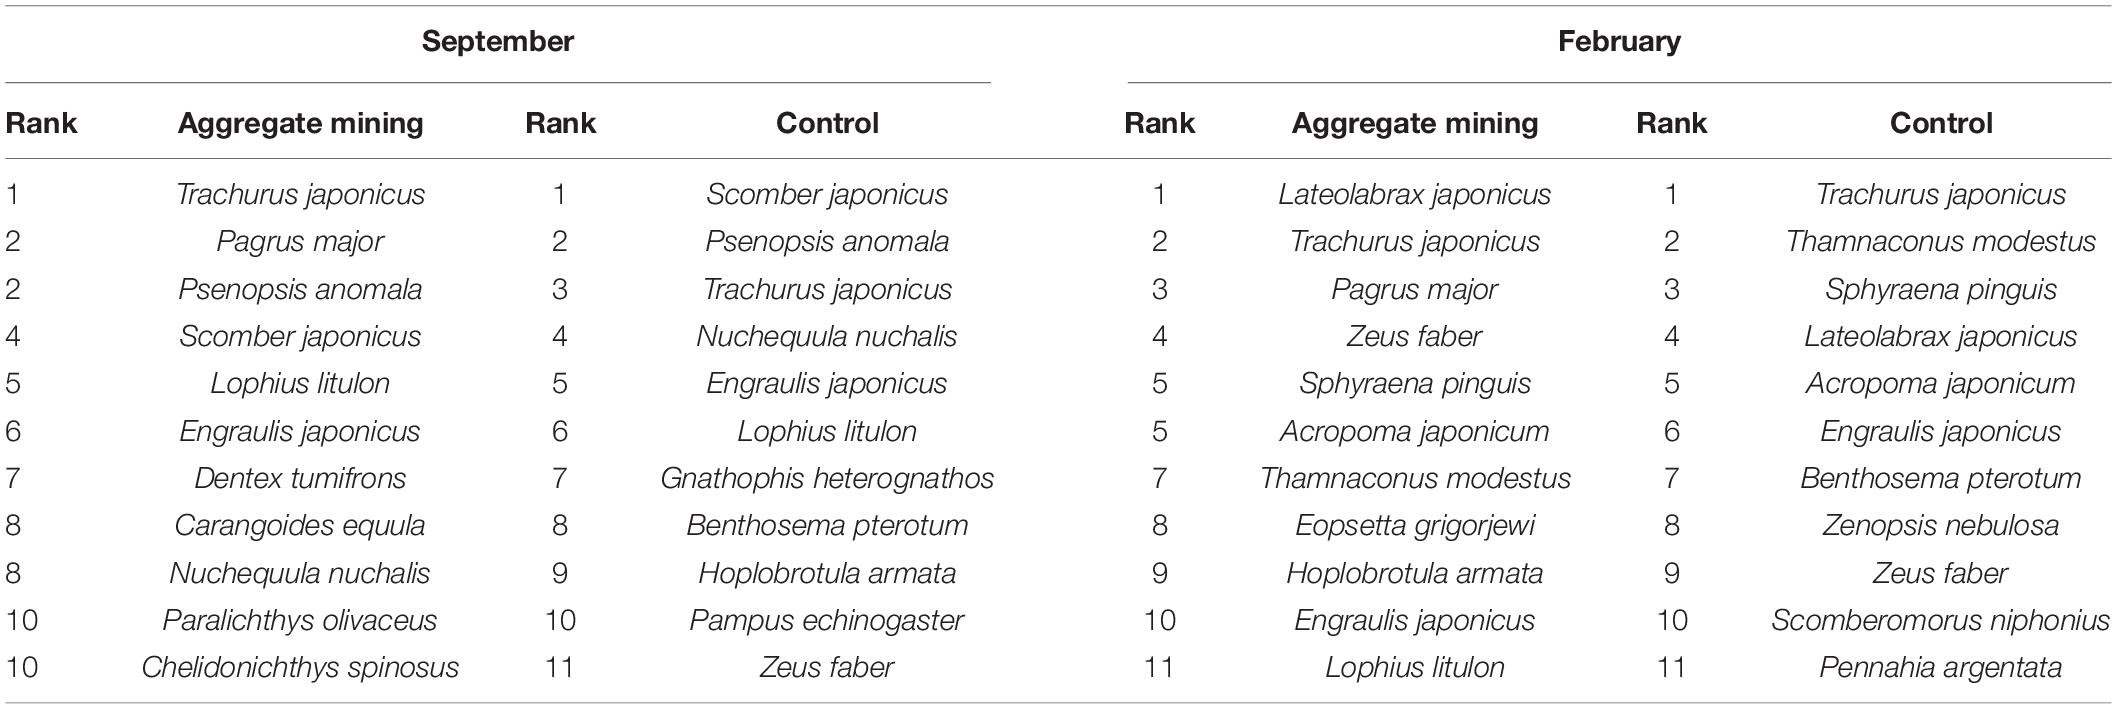
Table 4. List of the most abundant fish species by sample collection areas in EEZ, the southern sea of Korea.
To determine whether there was any difference in fish assemblages between the mining sites and their surroundings, hierarchical clustering and non-metric multidimensional scaling (NMDS) analysis were performed using the Bray–Curtis dissimilarity method (Figure 4). In September, the fish assemblages at the 10 sample collection sites were clustered into two major clades (Figure 4A). One clade included two main aggregate mining sites (3H and 3I) and a site nearby (5H), while the other included one nearby site (4D) and five distantly located sites from the extraction (N, E, E1, W, and S) (Figure 4A). Despite its proximity to the aggregate mining sites (approximately 6.41 km and 7.89 km from 3H and 3I, respectively), the fish assemblage of 4D was closely related to that at S site with high similarity (86.48%) (Figures 4A,B). The 4G site nearby the mining in September formed a separate clade with three control sites (G06, G09, and G13) in February, with an average of 63.91% similarity (Figures 4A,B). On the other hand, fish assemblages in February were clearly clustered according to the mining activities (Figure 4A). The aggregate mining site (4G) and its nearby sites (3H, 3I, 4D, and 5H) showed high similarity from 43.53 to 72.39%, and 15 distantly located sites clustered into two major clades at the 40% similarity cut-off (Figures 4A,B).
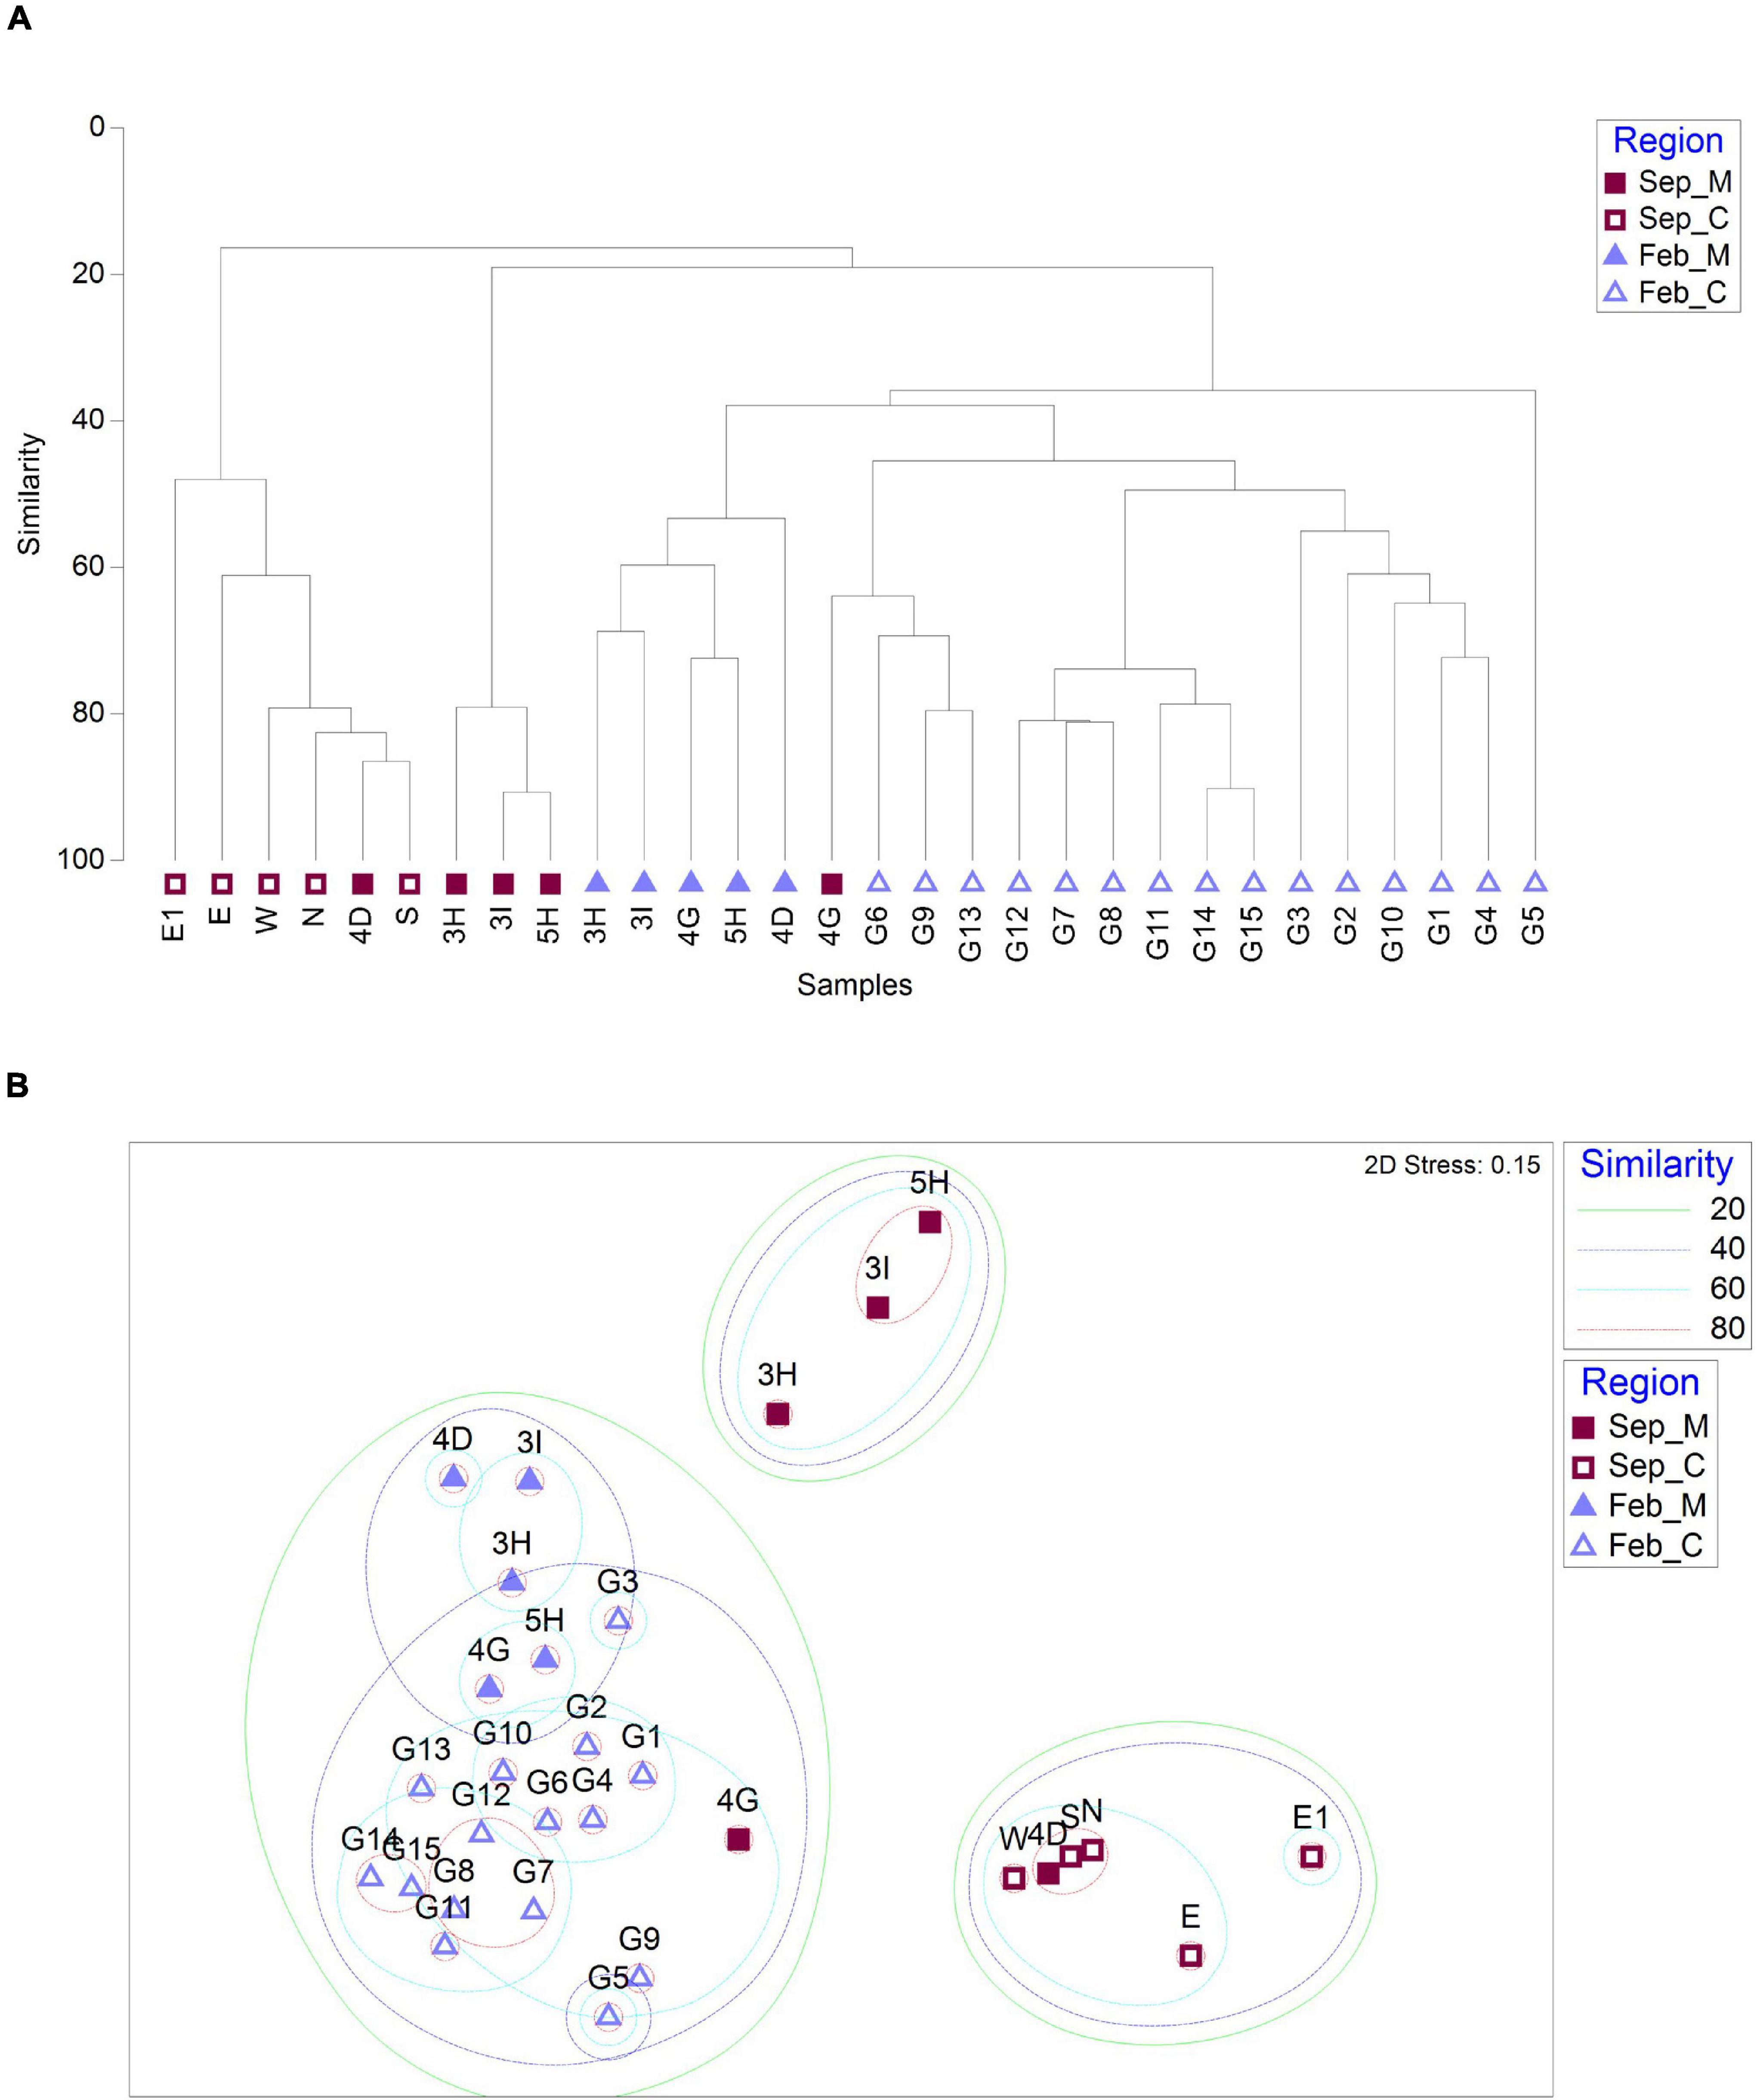
Figure 4. Similarity analysis of fish assemblages between sample collection sites based on Bray–Curtis dissimilarity [(A) dendrogram; (B) non-metric multidimensional scaling (NMDS) plot; and M and C in the legend represent aggregate mining and control regions, respectively].
The heatmap analysis showed that the fish assemblages were further clustered into five major clades (Figure 5A). Clade II contained all of the surrounding areas (N, E, E1, W, S) in September, in which S. japonicus and P. anomala constituted significant differences from other assemblage groups (Figure 5A). The mining sites (4D) in September were also included in clade II. Clades I and IV included the sites within the mining areas in February (3H, 3I, 4D, 4G, and 5H) and in September (3H, 3I, and 5H), respectively. L. japonicus, Z. faber, and Eopsetta grigorjewi in clade I and P. major in clade IV were identified as significantly abundant fish species from other sites (Figure 5A). The fish assemblages of surrounding areas in February were clustered into two clades, clade III and clade V (Figure 5A). Benthosema pterotum, Zenopsis nebulosa, Decapterus maruadsi, and Scomberomorus niphonius were significantly abundant species in clade III, whereas T. modestus and T. japonicus were abundant in clade V (Figure 5). Heatmap analysis for the same collection time showed more clear clades. In September, P. major and N. nuchalis, S. japonicus were detected as significantly abundant in the mining sites and its surroundings (Figure 5B). Additionally, P. anomala and E. japonicus were also detected as significantly different fish species in the surrounding area in September (Figure 5B). In February, besides L. japonicus and Z. faber, P. major and E. grigorjewi were also identified as significantly abundant fish species in the mining area from its surroundings (Figure 5C).
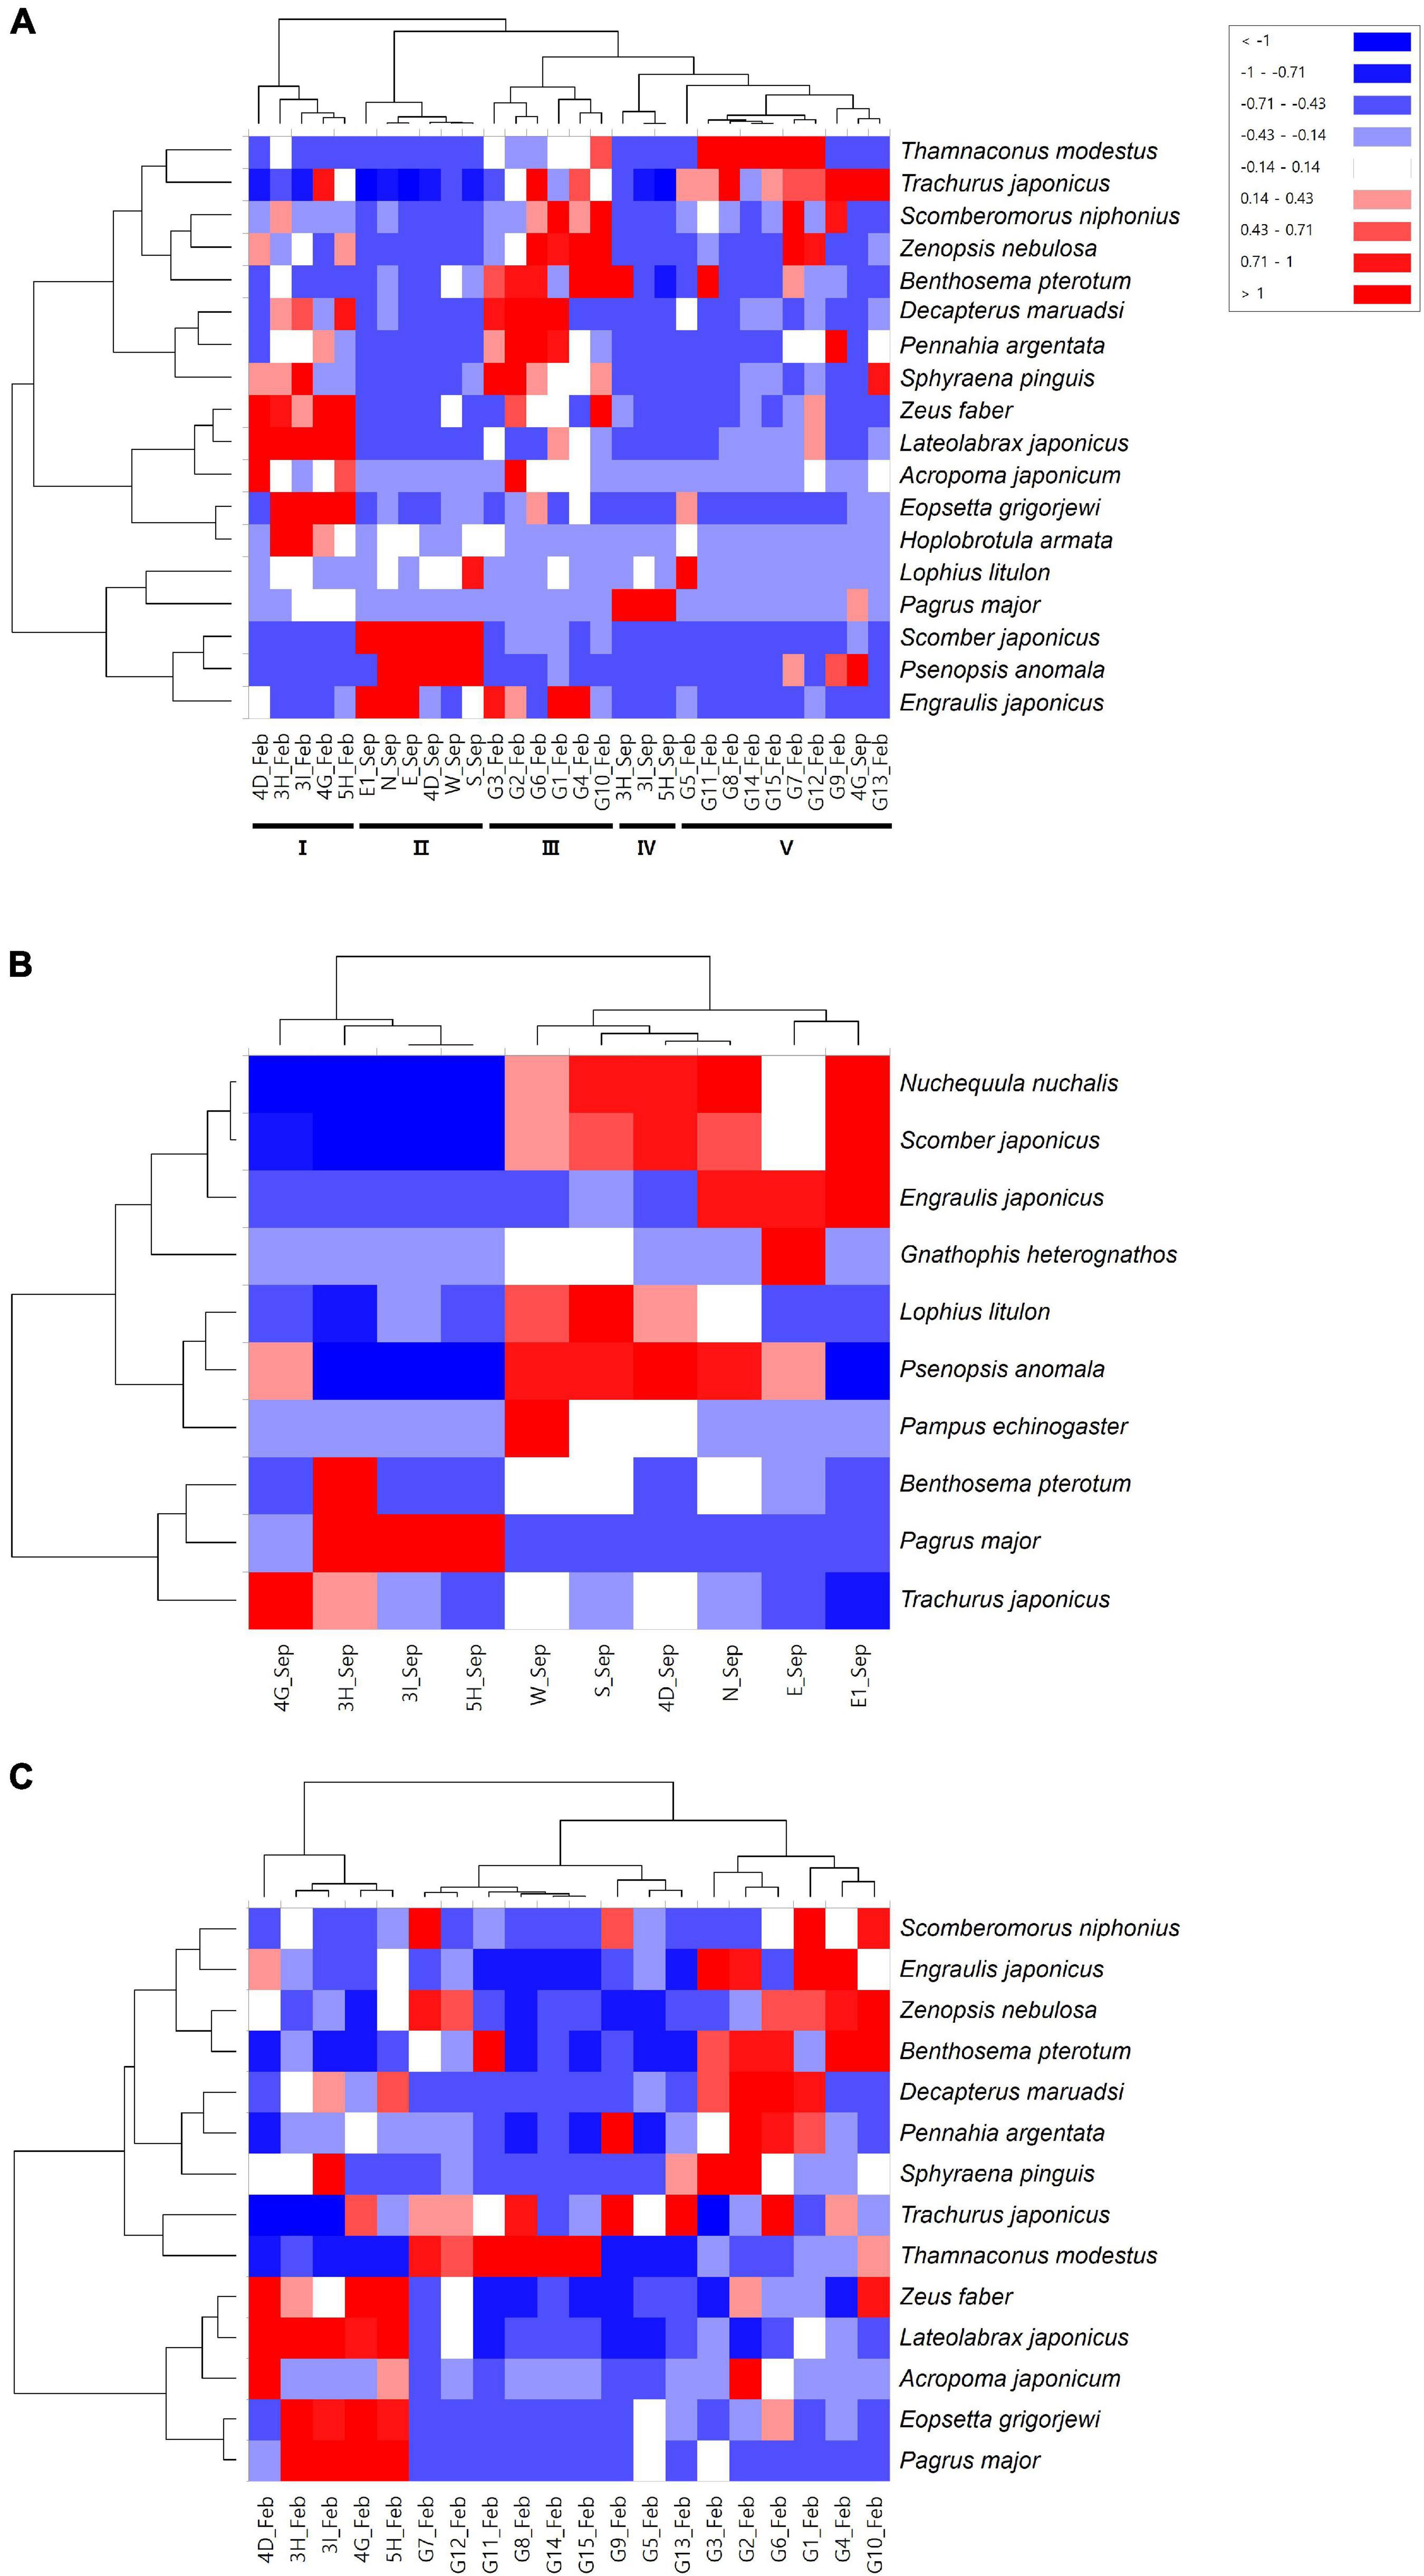
Figure 5. Heatmap analysis for fish species identified at each sample collection site [(A) Merge; (B) September; and (C) February; clades are shown in Roman numerals].
Comparative Analysis of Phytoplankton Communities Between the Mining and Control Areas
The phytoplankton community structures were also compared between the mining area and its surroundings. After denoising 7,466,714 raw reads through the DADA2, 666,105 non-chimeric merged reads were obtained (142,967 in September and 523,138 in February) (Table 5). A total of 634 ASVs (310 in September and 430 in February) were finally generated from 666,053 merged reads as a result of curation by LULU, which was further assigned to 9 phyla (Table 5). Haptophyta was the most abundant in both surveys (3.30 to 80.86% in September and 46.76 to 60.38% in February) (Supplementary Table 4). Cyanobacteria (10.72 to 90.72%) and Chlorophyta (1.16 to 16.02%) in September and Chlorophyta (29.61 to 42.05%) and Cryptophyta (1.99 to 10.53%) in February were among the second and third most abundant phyla, respectively (Supplementary Table 4). The highest phylum numbers (n = 9) were identified at the aggregate mining site (4G) and its distantly located site (G02) in February, while its lowest numbers (n = 5) were identified in its nearby site (4G) in September (Table 5). There was no significant difference in diversity between the mining area and its surroundings in both surveys.
Phytoplankton community structures were compared between mining sites and their surroundings using hierarchical clustering and NMDS analysis by Bray–Curtis dissimilarity (Figure 6). Phytoplankton communities were clustered into three main clades (Figure 6A). One clade included the mining areas in September (3H, 3I, and 4G). Two sites in the mining area (4D and 5H) and its surroundings (N, E, E1, W, and S) in September formed the second clade with 80% similarity cut-off (Figure 6B). In February, phytoplankton communities in all 20 sample collection sites showed high similarities ranging from 85.39 to 98.88%, which formed a third clade (Figure 6). Heatmap plots were constructed to determine the phytoplankton taxa that were significantly different in each clade (Figure 7). Cyanobacteria in September and Chlorophyta in February were the phyla that discriminated the two surveys, indicating the seasonal difference between the two surveys (Figure 7A). To remove the effects of seasonal difference in phytoplankton communities, heatmap analysis was conducted only with those in the same surveys (Figures 7B,C). One clade including three aggregate mining sites (3H, 3I, and 4G) in September showed significantly abundant Cyanobacteria, while Haptophyta was abundant at the sites in surrounding areas (Figure 7B). Although two clades were identified in February, containing Chlorophyta and Haptophyta, we failed to identify any distinguishable regional difference among these two phyla (Figure 7C). However, sites at the mining area showed a significantly high level of Chlorophyta and a low level of Haptophyta (Figure 7C).
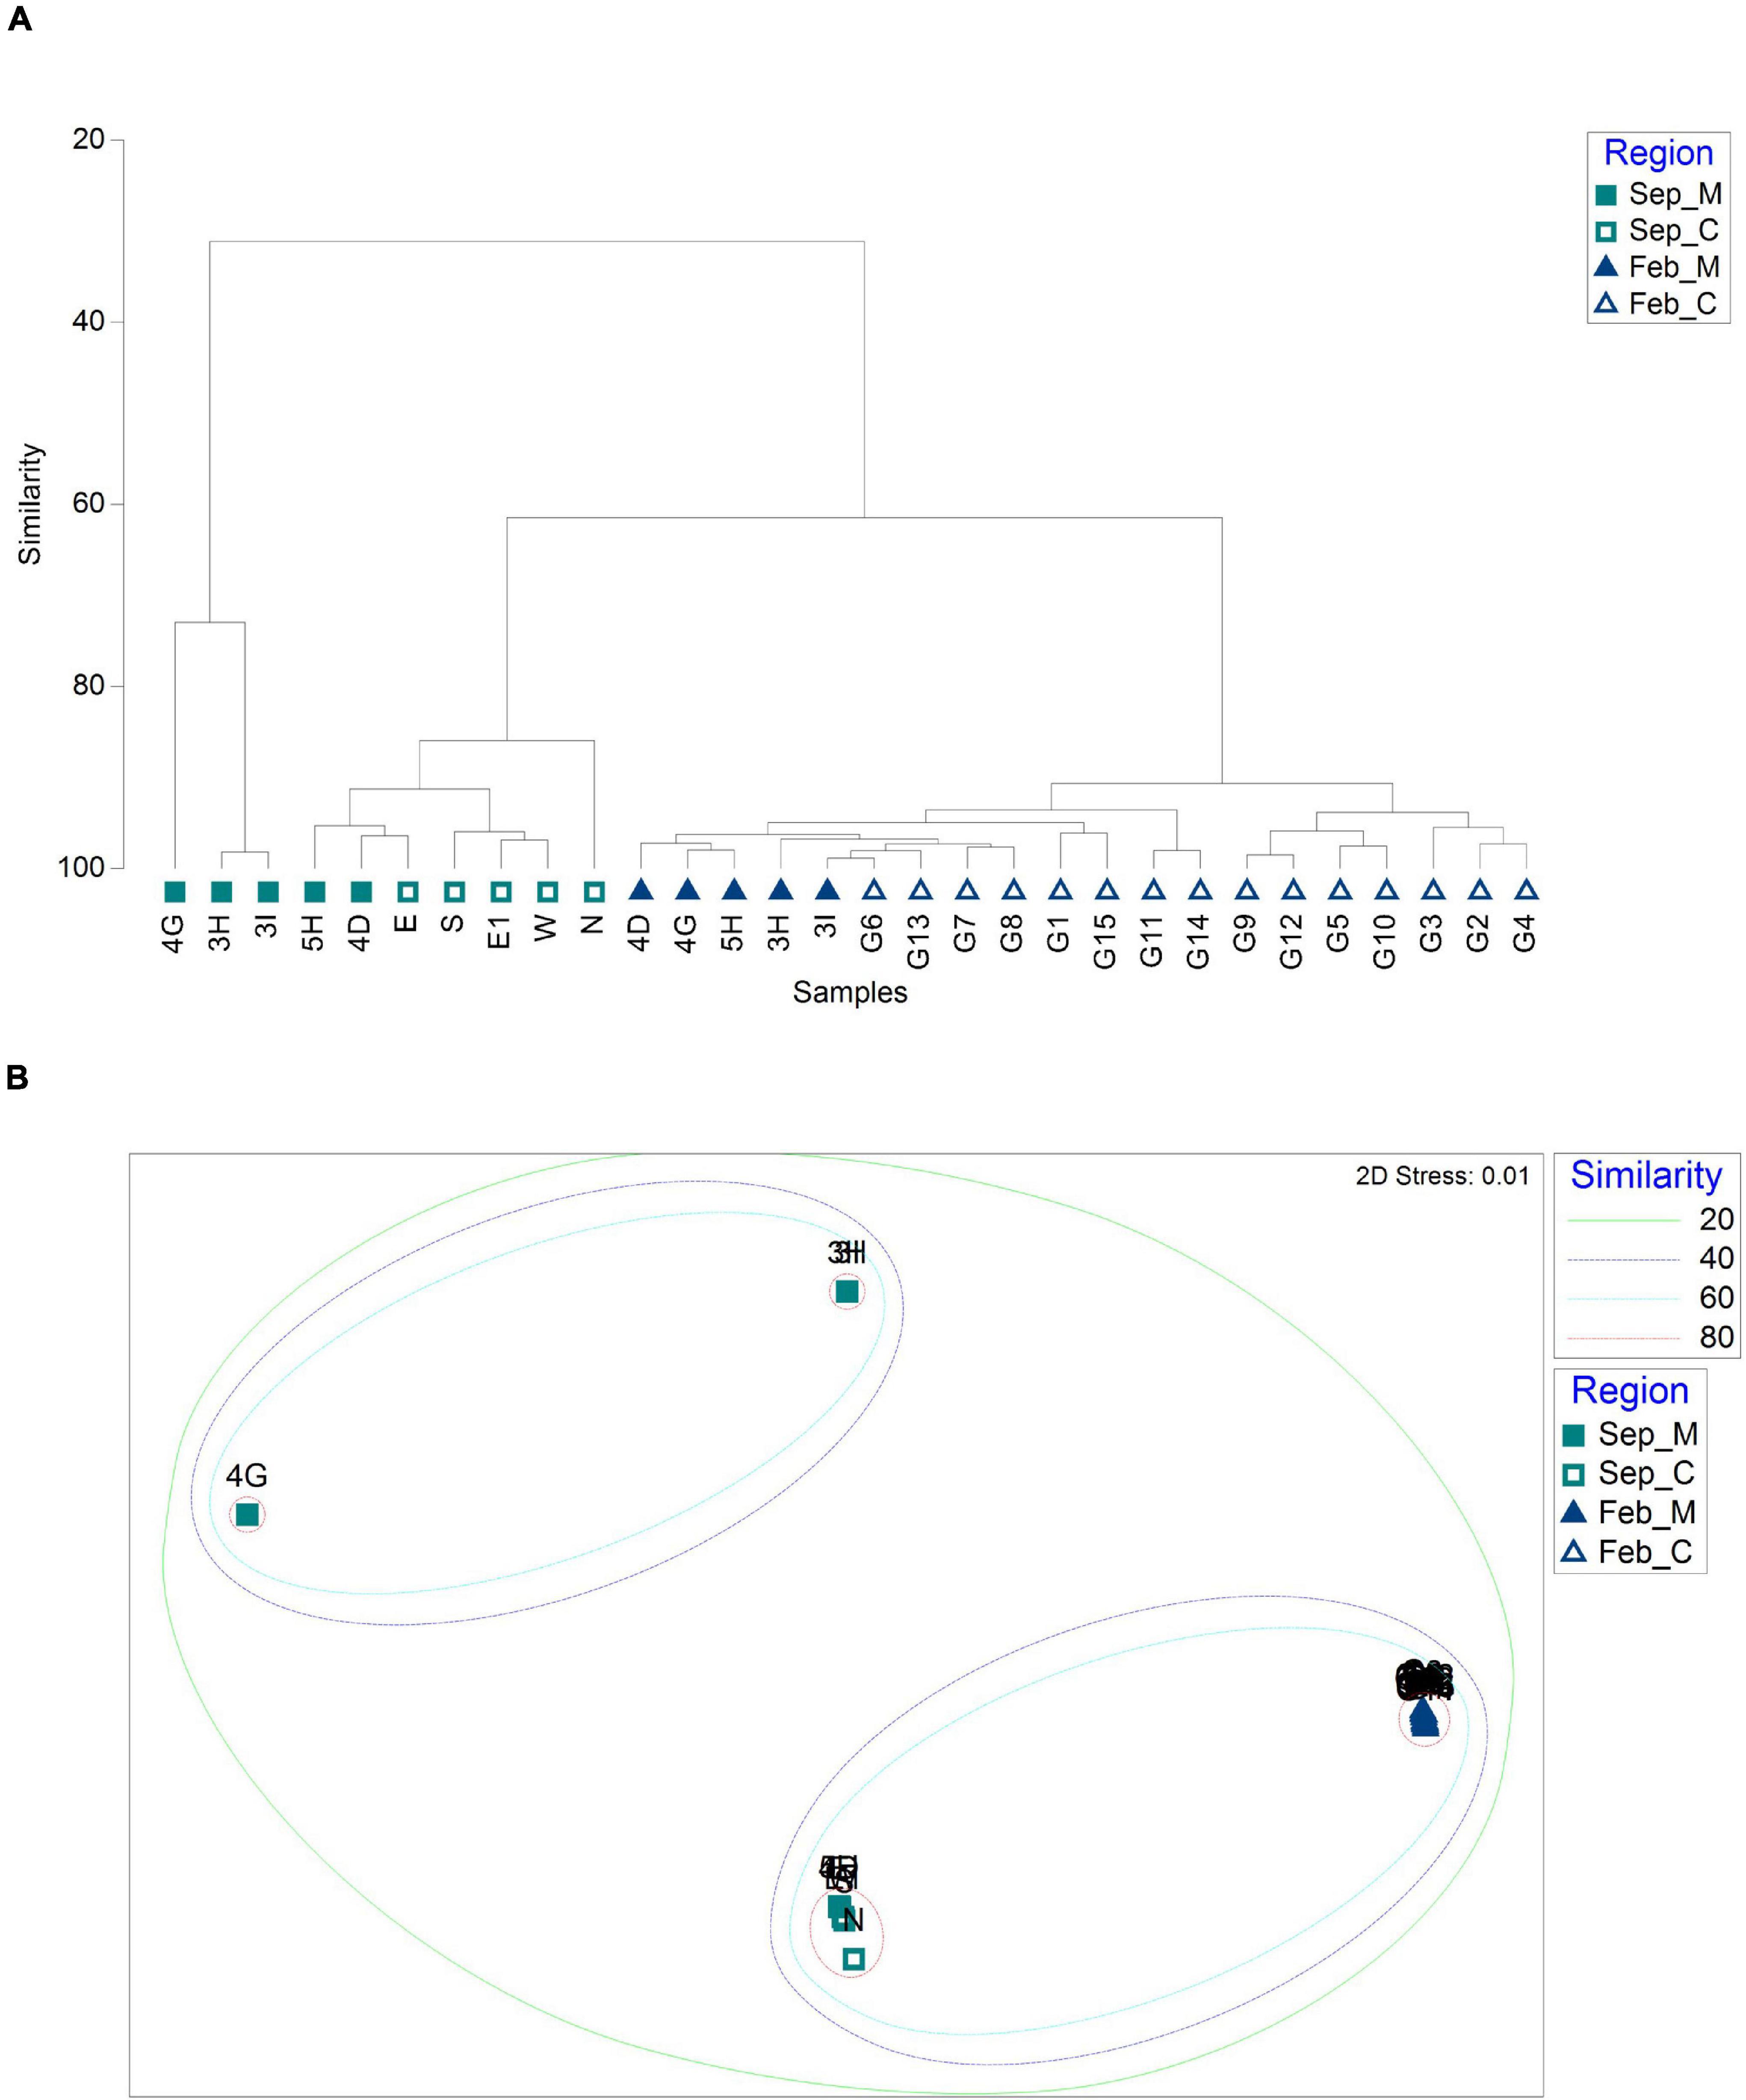
Figure 6. Similarity analysis of phytoplankton communities between sample collection sites based on Bray–Curtis dissimilarity [(A) dendrogram; (B) non-metric multidimensional scaling (NMDS) plot; and M and C in the legend represent aggregate mining and control regions, respectively].
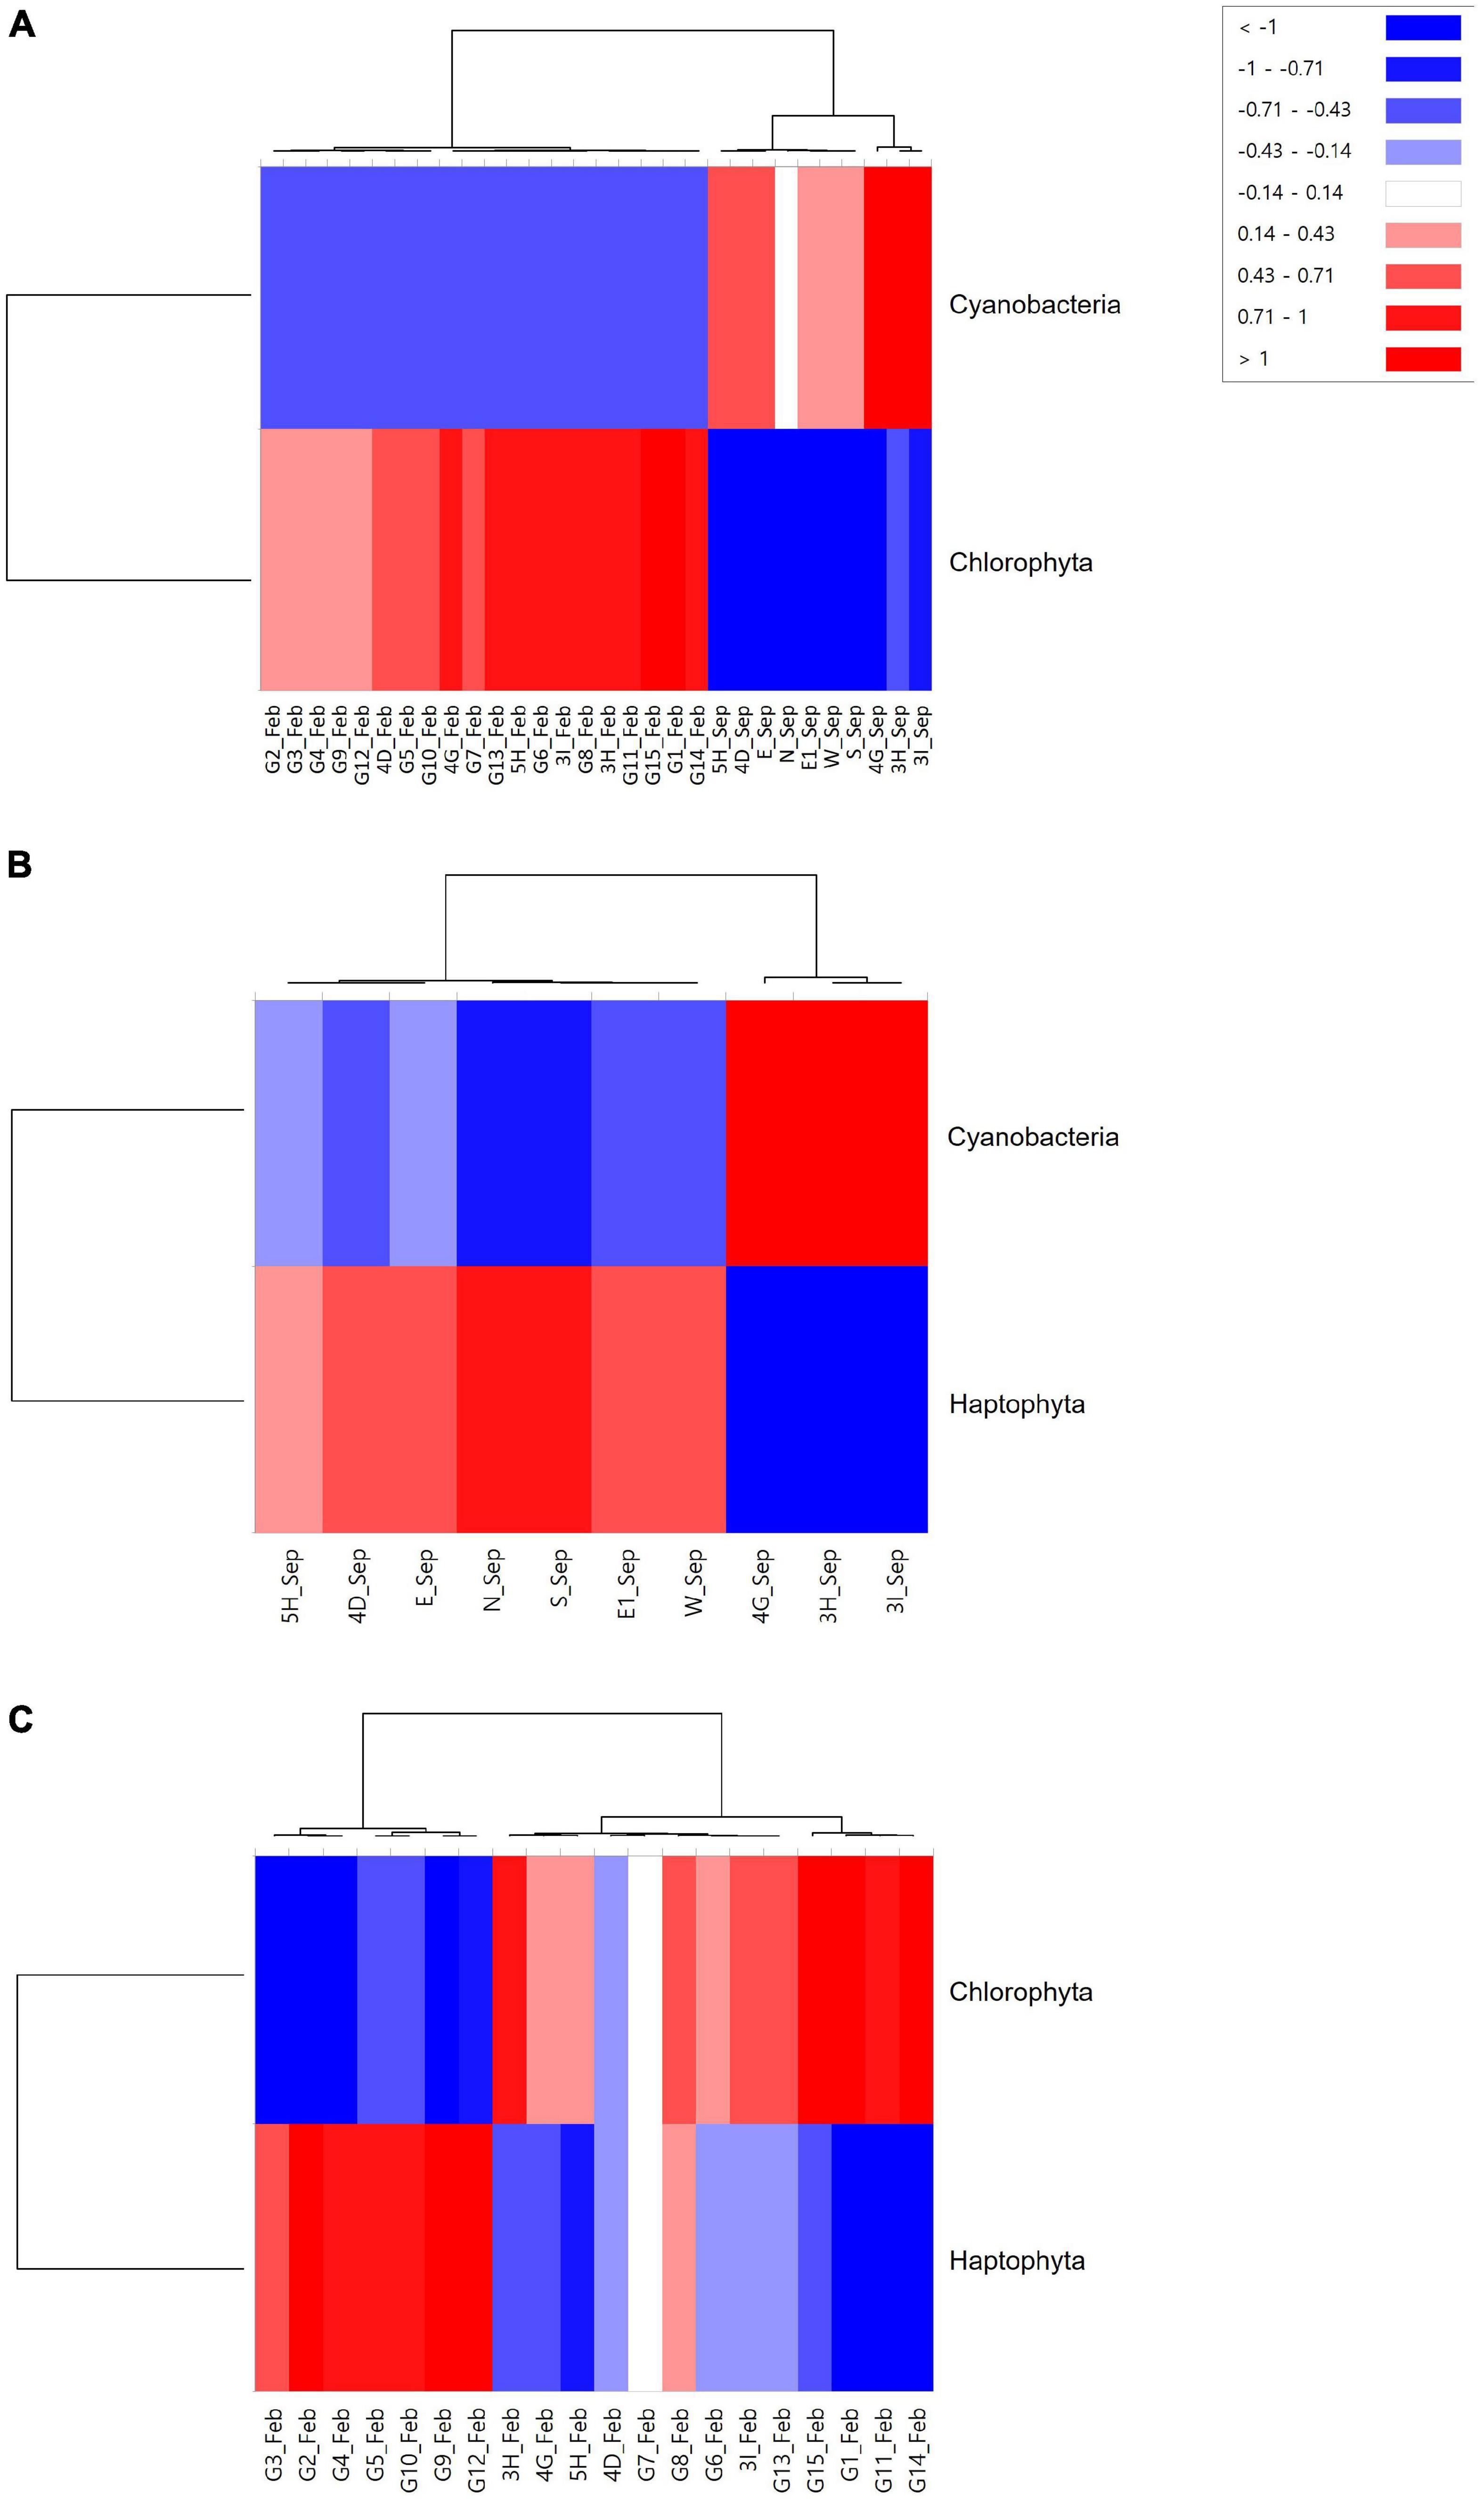
Figure 7. Heatmap analysis for phytoplankton at the phylum level identified at each sample collection site [(A) Merge; (B) September; and (C) February].
Discussion
Environmental DNA metabarcoding is a widely used method to characterize fish assemblages as a new alternative to traditional surveys. In this study, a total of 114 fish species were identified by eDNA metabarcoding simply from two surveys. Upon comparison with the results obtained by traditional methods, the identified numbers of species are impressive. For instance, 44 and 25 species were observed by five repeats of bottom trawls and two uses of a gill net, respectively, in similar locations (Jeong et al., 2005; Oh et al., 2014). The number of species detected in this study was almost one-third of that by 3-year-long surveys (356 species), conducted in the southern sea of Korea using multiple traditional methods, including diving, various nets and trawls, and fish market surveys (Moon et al., 2015). Besides high species numbers, 32 fish species were newly identified in this study compared with those recorded by Moon et al. (2015). Among them, Hapalogenys analis (Richardson, 1845) and Myrophis microchir (Bleeker, 1864) were identified in the southern sea of Korea for the first time. These results corresponded to previous studies showing that eDNA metabarcoding is superior to traditional methods in terms of the numbers of recovered species and the taxonomic resolution (Thomsen et al., 2012; Elbrecht et al., 2017). Therefore, eDNA metabarcoding would be a useful alternative tool for analyzing fish assemblages in Korean waters given its numerous merits, including low cost, little impact on the ecosystem, high sensitivity, reliability, and a short analysis time (Mardis, 2011; Shaw et al., 2016; Hansen et al., 2018).
We here also identified that eDNA metabarcoding is sensitive for detecting differences in fish assemblages even between sites within the vicinity of each other. The distance among the five sites at or near the location of aggregate mining (3H, 3I, 4D, 4G, and 5H) ranged from 1.53 to 7.89 km. A previous study in Maizuru Bay suggested that the distance between sites that can distinguish fish assemblages was approximately 800 m (Yamamoto et al., 2017). Those results, along with the current study, clearly demonstrated the high resolution of eDNA metabarcoding, supporting its reliability to explain any difference in fish assemblages influenced by various ecological events. Several previous studies also identified the usefulness of eDNA metabarcoding to assess the effects of various anthropogenic ecological disturbances such as invasive species, oil spill, gas drilling, and mercury pollution (Takahara et al., 2013; Frontalini et al., 2018; Laroche et al., 2018; Xie et al., 2018). As the number of samples increases through routine and automatic sampling, the results generated by eDNA metabarcoding would become more reliable and sensitive, providing high accuracy and relatively low budget and labor requirements compared with those obtained by traditional ecological surveys.
According to the current study, the fish assemblages clearly differed between the mining area and its surroundings (Figures 4, 5). As a result of heatmap analysis, four species, namely, Pagrus major (Temminck and Schlegel, 1843), Lateolabrax japonicus (Cuvier, 1828), Zeus faber (Linnaeus, 1758), and Eopsetta grigorjewi (Herzenstein, 1890), were significantly abundant at the mining areas (Figure 5). It is notable that all of these fish belonged to demersal species, suggesting a relationship to the physical changes of the seabed associated with aggregate mining activities. Changes in seabed topography caused by mining activities can create deep complex seabed ridges affecting the hydrodynamics (e.g., flow velocity, tides, and waves), which changes the assemblage structure of marine organisms (Diaz et al., 2004; Kim et al., 2005). These physical changes in the seabed may have provided certain demersal fish species with a new environment featuring conditions favorable for survival or reproduction. The rocky seabed generated by the mining activities may also have provided a beneficial environment for demersal fish species, attracting them from the sandy surroundings. Besides the physical conditions, the rocky seabed generated by the aggregate mining activity may have provided an environment for a variety of rock dwellers, attracting fish that prey on them from the surroundings. According to previous studies, the main dietary components of those demersal fish species, P. major and L. japonicus, are various benthic invertebrates, Anomura, Amphipoda, Brachyura, Caridea, Macrura, Polychaeta, and Echinodermata (Huh et al., 2006, 2009). The deep rocky seabed may also provide a spawning place for some demersal fish species. Except for P. major, the other three species differentially detected at the mining area were identified only in February. Interestingly, regarding the spawning season for three fish species, namely, L. japonicus, Z. faber, and E. grigorjewi, they are known to spawn in rocky reefs during winter to early spring (Sadovy and Cornish, 2000; Islam et al., 2006; Oh et al., 2011; Ismen et al., 2013). Although we here identified that aggregate mining may attract demersal fish species from the surroundings, the effects of the demersal fish brought to the mining areas on the ecosystem remain largely unknown. In fact, many fishermen often make use of the area to catch those fish threatening those resources in the ecosystem. Therefore, there is a strong need for careful long-term monitoring to obtain a better understanding of the impacts of the mining activity on the marine ecosystem.
We here identified that the mean levels of species richness in the aggregate mining sites were higher than those in their surrounding sites, regardless of the sample collection time (Table 3). This result may conflict with several previous studies, which reported significant decreases in biomass, abundance, and species richness of fish in the aggregate mining areas (Son and Han, 2007; Bilkovic, 2011; Hwang et al., 2014). The high species richness values in the mining areas appear to be related to the rocky seabed ridges with complex hydrodynamics, which can provide a habitat for demersal fish species, in contrast to the areas with a flat sandy seabed. It is well known that biodiversity is strongly related to complex environmental parameters (D’Odorico et al., 2008; Goetze et al., 2009). In fact, the fish species that were significantly abundant in the surrounding areas were pelagic and oceanodromous, which included Scomber japonicus (Houttuyn, 1782) and Nuchequula nuchalis (Temminck and Schlegel, 1845) in September and Trachurus japonicus (Temminck and Schlegel, 1844) and Thamnaconus modestus (Günther, 1877) in February (Table 4 and Figure 5). Those highly mobile fish species can easily leave their habitat for areas with less environmental disturbance, such as the aggregate mining site (Diaz et al., 2004; Son and Han, 2007). However, this result does not support the idea that the aggregate mining activity can provide favorable conditions by increasing diversity in fish assemblages. By contrast to the species richness result, the aggregate mining area showed lower mean species evenness than its surroundings in September (Table 3). Therefore, it is not possible to draw a definitive conclusion on this issue simply via the two performed surveys. Further long-term studies should be conducted to obtain a better understanding of the impact of aggregate mining on the diversity and biomass of fish species inhabiting the area.
Besides fish assemblages, phytoplankton communities were also compared in this study. We were able to detect differences in the phytoplankton communities between the mining and its surroundings in September (Figure 6). By contrast, little difference was identified between them in February. These results may have arisen from the different water temperatures between the two surveys. The mean surface water temperature in February was approximately 9.03°C lower than in September (Supplementary Table 1). The much lower water temperature in February appeared to be unfavorable for the proliferation of phytoplankton (Trombetta et al., 2019). The significantly higher numbers of Cyanobacteria in the aggregate mining area in September may have been associated with the impacts of suspended sediment (SS) generated by the mining activities. It is well known that high-nutrient SS from the seabed generated during aggregate mining activity moves along with the flow of seawater as a plume promoting the enrichment of microorganisms (Phua et al., 2002; Yang et al., 2008; Nogales et al., 2011). High temperature and nutrients from the suspended sediment in September may have provided conditions for the fast-growing small Cyanobacteria rather than the large Haptophyta. Although this difference was much lower than in September, we also identified a higher level of small Chlorophyta rather than large Haptophyta among the mining sites in February. Therefore, it is suggested that phytoplankton communities are impacted by mining activities that provide conditions for fast-growing phytoplankton taxa including Cyanobacteria or Chlorophyta, but the degree of this may also vary depending on seasonal differences in the water temperature in Korea. Increases in cyanobacterial numbers often cause blooms, which have various adverse effects on the marine ecosystem by either producing toxins or depleting the oxygen level (Paerl, 2008). However, we failed to detect any adverse impact on fish assemblages of the increased proportions of Cyanobacteria at the mining area, at least in terms of its diversity. Additional long-term surveys may be needed to obtain a comprehensive understanding of the impacts of mining activities on phytoplankton communities, measuring different parameters such as biomass, community structure changes, or impacts on food webs, considering different seasonal physicochemical factors.
The difference in phytoplankton communities between the mining area and its surroundings in September provided a hint for estimating the range of area impacted by the mining activity. The distance that suspended sediment is transported is affected by various factors, ranging from the current’s velocity and turbulence to the types of suspended sediment (e.g., size and adhesion) (Harris and Wiberg, 2001, 2002; Davies et al., 2002). Therefore, the ranges over which the suspended sediment is transported vary markedly, from less than 50 m to over 20 km (Hitchcock and Drucker, 1996; Kim and Lim, 2009). Based on the map, the distances between the mining sites (3H, 3I, and 4G) and the proximal sites (N and E) in September were 18.47 km to 22.93 km, suggesting that the affected area would be within 20 km from the mining sites, which is much smaller than the current survey area. Since the EKWC flows from southwest to northeast (Figure 1), two sites located west of the five mining sites, 4D and 4G, showed little difference in both fish assemblages and phytoplankton community, indicating that the region northeast of the mining sites may have suffered a greater impact than that to the southwest. However, the precise direction and velocity of EKWC also showed seasonal changes, so additional long-term studies should be conducted to obtain better information about the size of the area affected by the aggregate mining in EEZ, the southern sea of Korea.
Conclusion
We analyzed the impacts of aggregate mining on the fish assemblages and phytoplankton communities in EEZ, the southern sea of Korea, using eDNA metabarcoding analysis. Statistical analyses showed a clear difference in fish assemblages between the mining sites and the surrounding area. Presumably, the physical changes on the seabed may provide environmental conditions that attract demersal fish species for shelter, prey, or reproduction. However, the long-term effects of this remain unknown, so further study should be conducted. We also identified that phytoplankton communities also reflected the increased suspended sediment levels with high proportions of Cyanobacteria in the mining area in September. By contrast, no significant difference was identified in February, suggesting that phytoplankton communities may not be as sensitive as fish assemblages. Taking the obtained findings together, eDNA metabarcoding analysis was shown to be useful for assessing the impact of aggregate mining activity on the marine ecosystem, exhibiting high sensitivity and statistical reliability. However, the results obtained by surveys from only two timepoints were still limited and fragmented, reducing our ability to draw definitive conclusions. Further long-term studies should thus be conducted to assess the biological impacts of anthropogenic activities on marine ecosystems for the scientific management and conservation of marine resources.
Data Availability Statement
The datasets presented in this study can be found in online repositories. The names of the repository/repositories and accession number(s) can be found below: https://www.ncbi.nlm.nih.gov/, PRJNA766799.
Author Contributions
E-BK and HS designed the experiments, performed the experiments, analyzed the data, prepared figures and tables, and wrote the manuscript. J-HL and GK analyzed data and prepared figures and tables. D-HK and YK conceived and designed the experiments, contributed reagents, materials, and analysis tools. H-WK conceived and designed the experiments, analyzed the data, prepared figures and tables, contributed reagents, materials, analysis tools, authored and reviewed drafts of the manuscript, and approved the final draft. All authors contributed to the article and approved the submitted version.
Funding
This study was supported by a grant from the National Institute of Fisheries Science (R2022074).
Conflict of Interest
The authors declare that the research was conducted in the absence of any commercial or financial relationships that could be construed as a potential conflict of interest.
Publisher’s Note
All claims expressed in this article are solely those of the authors and do not necessarily represent those of their affiliated organizations, or those of the publisher, the editors and the reviewers. Any product that may be evaluated in this article, or claim that may be made by its manufacturer, is not guaranteed or endorsed by the publisher.
Supplementary Material
The Supplementary Material for this article can be found online at: https://www.frontiersin.org/articles/10.3389/fmars.2022.788380/full#supplementary-material
Footnotes
References
Bilkovic, D. M. (2011). Response of tidal creek fish communities to dredging and coastal development pressures in a shallow-water estuary. Estuaries Coasts 34, 129–147. doi: 10.1007/s12237-010-9334-x
Birklund, J., and Wijsman, J. (2005). Aggregate extraction: a review on the effect of ecological functions. Sand pit report WL Z3297. Delft: Deltares.
Bohmann, K., Evans, A., Gilbert, M. T. P., Carvalho, G. R., Creer, S., Knapp, M., et al. (2014). Environmental DNA for wildlife biology and biodiversity monitoring. Trends Ecol. Evol. 29, 358–367. doi: 10.1016/j.tree.2014.04.003
Byrnes, M. R., Hammer, R. M., Thibaut, T. D., and Snyder, D. B. (2004). Effects of sand mining on physical processes and biological communities offshore New Jersey, USA. J. Coast. Res. 20, 25–43. doi: 10.2112/1551-5036(2004)20[25:EOSMOP]2.0.CO;2
Callahan, B. J., McMurdie, P. J., Rosen, M. J., Han, A. W., Johnson, A. J. A., and Holmes, S. P. (2016). DADA2: high-resolution sample inference from Illumina amplicon data. Nat. Methods 13, 581–583. doi: 10.1038/nmeth.3869
Chao, A., Gotelli, N. J., Hsieh, T., Sander, E. L., Ma, K., Colwell, R. K., et al. (2014). Rarefaction and extrapolation with Hill numbers: a framework for sampling and estimation in species diversity studies. Ecol. Monogr. 84, 45–67. doi: 10.1890/13-0133.1
Clarke, K., and Gorley, R. (2015). Getting started with PRIMER v7. Auckland, New Zealand: Plymouth Marine Laboratory, 20.
Davies, A., Van Rijn, L., Damgaard, J., Van de Graaff, J., and Ribberink, J. (2002). Intercomparison of research and practical sand transport models. Coast. Eng. 46, 1–23. doi: 10.1016/S0378-3839(02)00042-X
Desprez, M. (2000). Physical and biological impact of marine aggregate extraction along the French coast of the Eastern English Channel: short-and long-term post-dredging restoration. ICES J. Mar. Sci. 57, 1428–1438. doi: 10.1006/jmsc.2000.0926
Diaz, R., Cutter, G. Jr., and Hobbs, C. III. (2004). Potential impacts of sand mining offshore of Maryland and Delaware: part 2—biological considerations. J. Coast. Res. 20, 61–69. doi: 10.2112/1551-5036(2004)20[61:PIOSMO]2.0.CO;2
Djurhuus, A., Pitz, K., Sawaya, N. A., Rojas-Márquez, J., Michaud, B., Montes, E., et al. (2018). Evaluation of marine zooplankton community structure through environmental DNA metabarcoding. Limnol. Oceanogr. Methods 16, 209–221. doi: 10.1002/lom3.10237
D’Odorico, P., Laio, F., Ridolfi, L., and Lerdau, M. T. (2008). Biodiversity enhancement induced by environmental noise. J. Theor. Biol. 255, 332–337. doi: 10.1016/j.jtbi.2008.09.007
Elbrecht, V., Vamos, E. E., Meissner, K., Aroviita, J., and Leese, F. (2017). Assessing strengths and weaknesses of DNA metabarcoding-based macroinvertebrate identification for routine stream monitoring. Methods Ecol. Evol. 8, 1265–1275. doi: 10.1111/2041-210X.12789
Ficetola, G. F., Miaud, C., Pompanon, F., and Taberlet, P. (2008). Species detection using environmental DNA from water samples. Biol. Lett. 4, 423–425. doi: 10.1098/rsbl.2008.0118
Frontalini, F., Greco, M., Di Bella, L., Lejzerowicz, F., Reo, E., Caruso, A., et al. (2018). Assessing the effect of mercury pollution on cultured benthic foraminifera community using morphological and eDNA metabarcoding approaches. Mar. Pollut. Bull. 129, 512–524. doi: 10.1016/j.marpolbul.2017.10.022
Frøslev, T. G., Kjøller, R., Bruun, H. H., Ejrnæs, R., Brunbjerg, A. K., Pietroni, C., et al. (2017). Algorithm for post-clustering curation of DNA amplicon data yields reliable biodiversity estimates. Nat. Commun. 8, 1–11. doi: 10.1038/s41467-017-01312-x
Goetze, D., Karlowski, U., Porembski, S., Tockner, K., Watve, A., and Riede, K. (2009). “Spatial and temporal dimensions of biodiversity dynamics,” in Biodiversity: structure and Function, eds W. Barthlott, K. E. Linsenmair, and S. Porembski (Oxford: UNESCO), 166–208.
Hansen, B. K., Bekkevold, D., Clausen, L. W., and Nielsen, E. E. (2018). The sceptical optimist: challenges and perspectives for the application of environmental DNA in marine fisheries. Fish Fish. 19, 751–768. doi: 10.1111/faf.12286
Harris, C. K., and Wiberg, P. (2002). Across-shelf sediment transport: interactions between suspended sediment and bed sediment. J. Geophys. Res. Oceans 107, 8-1–8-12. doi: 10.1029/2000JC000634
Harris, C. K., and Wiberg, P. L. (2001). A two-dimensional, time-dependent model of suspended sediment transport and bed reworking for continental shelves. Comput. Geosci. 27, 675–690. doi: 10.1016/S0098-3004(00)00122-9
Harvey, J. B., Johnson, S. B., Fisher, J. L., Peterson, W. T., and Vrijenhoek, R. C. (2017). Comparison of morphological and next generation DNA sequencing methods for assessing zooplankton assemblages. J. Exp. Mar. Biol. Ecol. 487, 113–126. doi: 10.1016/j.jembe.2016.12.002
Hitchcock, D., and Drucker, B. (1996). Investigation of benthic and surface plumes associated with marine aggregates mining in the United Kingdom. Glob. Ocean Oper. Oceanogr. 2, 221–284.
Hsieh, T., Ma, K., and Chao, A. (2016). iNEXT: an R package for rarefaction and extrapolation of species diversity (H ill numbers). Methods Ecol. Evol. 7, 1451–1456. doi: 10.1111/2041-210x.12613
Huh, S. H., Kim, H. W., and Baeck, G. W. (2006). Feeding Habits of Red Sea Bream, Pagrus major in the Coastal Waters off Busan, Korea. Korean J. Ichthyol. 18, 216–222.
Huh, S.-H., Park, J. M., Park, S. C., Jeong, D., Park, C. I., and Baeck, G. W. (2009). Feeding Habits of Lateolabrax japonicus in the Coastal Waters off Dolsan-do, Yeosu. Korean J. Ichthyol. 21, 23–27.
Hwang, S. W., Lee, H. G., Choi, K. H., Kim, C. K., and Lee, T. W. (2014). Impact of sand extraction on fish assemblages in Gyeonggi Bay, Korea. J. Coast. Res. 30, 1251–1259. doi: 10.2112/jcoastres-d-12-00145.1
Islam, M., Hibino, M., and Tanaka, M. (2006). Distribution and dietary relationships of the Japanese temperate bass Lateolabrax japonicus juveniles with two contrasting copepod assemblages in estuarine nursery grounds in the Ariake Sea, Japan. J. Fish Biol. 68, 569–593. doi: 10.1111/j.0022-1112.2006.00943.x
Ismen, A., Arslan, M., Yigin, C. C., and Bozbay, N. A. (2013). Age, growth, reproduction and feeding of John Dory, Zeus faber (Pisces: zeidae), in the Saros Bay (North Aegean Sea). J. Appl. Ichthyol. 29, 125–131. doi: 10.1111/jai.12005
Jeong, S.-B., Hwang, D.-J., Kim, Y.-J., Shin, H.-H., and Son, Y.-U. (2005). Species composition of the catches collected by a bottom trawl in the southern waters of Korea in summer, 2004. J. Korean Soc. Fish. Ocean Technol. 41, 35–45. doi: 10.3796/ksft.2005.41.1.035
Jones, R., Bessell-Browne, P., Fisher, R., Klonowski, W., and Slivkoff, M. (2016). Assessing the impacts of sediments from dredging on corals. Mar. Pollut. Bull. 102, 9–29. doi: 10.1016/j.marpolbul.2015.10.049
Kang, H.-E., Yoon, T.-H., Yoon, S., Kim, H. J., Park, H., Kang, C.-K., et al. (2018). Genomic analysis of red-tide water bloomed with Heterosigma akashiwo in Geoje. PeerJ 6:e4854. doi: 10.7717/peerj.4854
Kim, B.-O., Lee, S.-H., and Yang, J.-S. (2005). Bathymetric change of a sand mining site within EEZ, West Sea of Korea. J. Korean Earth Sci. Soc. 26, 836–843.
Kim, C. S., and Lim, H.-S. (2009). Sediment dispersal and deposition due to sand mining in the coastal waters of Korea. Cont. Shelf Res. 29, 194–204. doi: 10.1016/j.csr.2008.01.017
Kim, T.-G., and Grigalunas, T. (2009). Simulating direct and indirect damages to commercial fisheries from marine sand mining: a case study in Korea. Environ. Manag. 44, 566–578. doi: 10.1007/s00267-009-9339-z
Laroche, O., Wood, S. A., Tremblay, L. A., Ellis, J. I., Lear, G., and Pochon, X. (2018). A cross-taxa study using environmental DNA/RNA metabarcoding to measure biological impacts of offshore oil and gas drilling and production operations. Mar. Pollut. Bull. 127, 97–107. doi: 10.1016/j.marpolbul.2017.11.042
Mardis, E. R. (2011). A decade’s perspective on DNA sequencing technology. Nature 470, 198–203. doi: 10.1038/nature09796
Mensah, J. V. (1997). Causes and effects of coastal sand mining in Ghana. Singap. J. Trop. Geogr. 18, 69–88. doi: 10.1111/1467-9493.00005
Miya, M., Sato, Y., Fukunaga, T., Sado, T., Poulsen, J. Y., Sato, K., et al. (2015). MiFish, a set of universal PCR primers for metabarcoding environmental DNA from fishes: detection of more than 230 subtropical marine species. R. Soc. Open Sci. 2:150088. doi: 10.1098/rsos.150088
Moon, D. Y., Jeong, H. G., Myoung, J.-G., Choi, J. H., Kwun, H. J., Back, J. W., et al. (2015). Fish Species Collected by the Fish Collection Project from the Southern Sea of Korea during 2010-2012. Korean J. Fish. Aquat. Sci. 48, 507–528. doi: 10.5657/KFAS.2015.0507
Newell, R., Seiderer, L., Simpson, N., and Robinson, J. (2004). Impacts of marine aggregate dredging on benthic macrofauna off the south coast of the United Kingdom. J. Coast. Res. 20, 115–125. doi: 10.2112/1551-5036(2004)20[115:IOMADO]2.0.CO;2
Nogales, B., Lanfranconi, M. P., Piña-Villalonga, J. M., and Bosch, R. (2011). Anthropogenic perturbations in marine microbial communities. FEMS Microbiol. Rev. 35, 275–298. doi: 10.1111/j.1574-6976.2010.00248.x
Oh, S.-J., Han, K.-H., Koh, S.-J., Lee, S.-H., and Shin, L.-S. (2014). Fluctuations in abundance and species composition of fishes collected by gill net fisheries in coastal water of Yeosu, Korea. J. Korean Soc. Fish. Ocean Technol. 50, 633–642. doi: 10.3796/ksft.2014.50.4.633
Oh, T., Choi, J., Cha, H., Kang, S., and Seo, Y.-I. (2011). Reproduction of the Shotted halibut in the southern Korean waters. Bull. Korean Soc. Fish. Technol. 47, 194–202. doi: 10.3796/ksft.2011.47.3.194
Paerl, H. (2008). “Nutrient and other environmental controls of harmful cyanobacterial blooms along the freshwater–marine continuum,” in Cyanobacterial harmful algal blooms: state of the science and research needs, ed. H. K. Hudnell (New York, NY: Springer), 217–237. doi: 10.1007/978-0-387-75865-7_10
Phua, C., Van den Akker, S., Baretta, M., and Van Dalfsen, J. (2002). Ecological effects of sand extraction in the North Sea. Utrecht: Stichting De Noordzee.
Sadovy, Y., and Cornish, A. S. (2000). Reef fishes of Hong Kong. Hong Kong: Hong Kong University Press.
Shaw, J. L., Clarke, L. J., Wedderburn, S. D., Barnes, T. C., Weyrich, L. S., and Cooper, A. (2016). Comparison of environmental DNA metabarcoding and conventional fish survey methods in a river system. Biol. Conserv. 197, 131–138. doi: 10.1016/j.biocon.2016.03.010
Son, K.-H., and Han, K.-N. (2007). The fluctuation of biological communities as an effect of marine sand mining in the Gyeonggi Bay. Ocean Polar Res. 29, 205–216. doi: 10.4217/opr.2007.29.3.205
Stat, M., Huggett, M. J., Bernasconi, R., DiBattista, J. D., Berry, T. E., Newman, S. J., et al. (2017). Ecosystem biomonitoring with eDNA: metabarcoding across the tree of life in a tropical marine environment. Sci. Rep. 7, 1–11. doi: 10.1038/s41598-017-12501-5
Stoeckle, M. Y., Soboleva, L., and Charlop-Powers, Z. (2017). Aquatic environmental DNA detects seasonal fish abundance and habitat preference in an urban estuary. PLoS One 12:e0175186. doi: 10.1371/journal.pone.0175186
Taberlet, P., Coissac, E., Hajibabaei, M., and Rieseberg, L. H. (2012). Environmental DNA. Mol. Ecol. 21, 1789–1793. doi: 10.1111/j.1365-294X.2012.05542.x
Takahara, T., Minamoto, T., and Doi, H. (2013). Using environmental DNA to estimate the distribution of an invasive fish species in ponds. PLoS One 8:e56584. doi: 10.1371/journal.pone.0056584
Tamura, K., Stecher, G., and Kumar, S. (2021). MEGA11: molecular evolutionary genetics analysis version 11. Mol. Biol. Evol. 38, 3022–3027. doi: 10.1093/molbev/msab120
Thomsen, P. F., Kielgast, J., Iversen, L. L., Møller, P. R., Rasmussen, M., and Willerslev, E. (2012). Detection of a diverse marine fish fauna using environmental DNA from seawater samples. PLoS One 7:e41732. doi: 10.1371/journal.pone.0041732
Trombetta, T., Vidussi, F., Mas, S., Parin, D., Simier, M., and Mostajir, B. (2019). Water temperature drives phytoplankton blooms in coastal waters. PLoS One 14:e0214933. doi: 10.1371/journal.pone.0214933
Won, N.-I., Kim, K.-H., Kang, J. H., Park, S. R., and Lee, H. J. (2017). Exploring the impacts of anthropogenic disturbance on seawater and sediment microbial communities in Korean coastal waters using metagenomics analysis. Int. J. Environ. Res. Public Health 14:130. doi: 10.3390/ijerph14020130
Xie, Y., Zhang, X., Yang, J., Kim, S., Hong, S., Giesy, J. P., et al. (2018). eDNA-based bioassessment of coastal sediments impacted by an oil spill. Environ. Pollut. 238, 739–748. doi: 10.1016/j.envpol.2018.02.081
Yamamoto, S., Masuda, R., Sato, Y., Sado, T., Araki, H., Kondoh, M., et al. (2017). Environmental DNA metabarcoding reveals local fish communities in a species-rich coastal sea. Sci. Rep. 7, 1–12. doi: 10.1038/srep40368
Yang, J.-S., Jeong, Y.-H., and Ji, K.-H. (2008). Changes in the sensitive chemical parameters of the seawater in EEZ, Yellow Sea during and after the sand mining operation. Sea 13, 1–14.
Keywords: aggregate mining, eDNA, fish assemblage, Korea, metabarcoding
Citation: Kim E-B, Sagong H, Lee J-H, Kim G, Kwon D-H, Kim Y and Kim H-W (2022) Environmental DNA Metabarcoding Analysis of Fish Assemblages and Phytoplankton Communities in a Furrowed Seabed Area Caused by Aggregate Mining. Front. Mar. Sci. 9:788380. doi: 10.3389/fmars.2022.788380
Received: 02 October 2021; Accepted: 18 February 2022;
Published: 11 March 2022.
Edited by:
Ylenia Carotenuto, Stazione Zoologica Anton Dohrn, ItalyReviewed by:
David Stanković, Department of Organisms and Ecosystems Research, National Instiitute of Biology, SloveniaSandi Orlic, Rudjer Boskovic Institute (RBI), Croatia
Copyright © 2022 Kim, Sagong, Lee, Kim, Kwon, Kim and Kim. This is an open-access article distributed under the terms of the Creative Commons Attribution License (CC BY). The use, distribution or reproduction in other forums is permitted, provided the original author(s) and the copyright owner(s) are credited and that the original publication in this journal is cited, in accordance with accepted academic practice. No use, distribution or reproduction is permitted which does not comply with these terms.
*Correspondence: Hyun-Woo Kim, a2ltaHdAcGtudS5hYy5rcg==
†These authors have contributed equally to this work
 Eun-Bi Kim
 Hyun Sagong
 Ji-Hyun Lee
 Gyungryul Kim2
 Dae-Hyeon Kwon
 Hyun-Woo Kim

