
94% of researchers rate our articles as excellent or good
Learn more about the work of our research integrity team to safeguard the quality of each article we publish.
Find out more
ORIGINAL RESEARCH article
Front. Mar. Sci., 20 September 2022
Sec. Marine Conservation and Sustainability
Volume 9 - 2022 | https://doi.org/10.3389/fmars.2022.771547
 Rebecca Whitlock1,2*
 Robert J. Schallert2
 Michael J. W. Stokesbury3Michael Castleton4
 Barbara A. Block2,4
Sustainable management of exploited marine fish and wildlife populations requires knowledge about their productivity. Survival from natural causes of mortality is a key component of population productivity, but is notoriously difficult to estimate. We evaluate the potential for acoustic telemetry as a long-term monitoring tool to estimate rates of natural mortality. We present a Bayesian multistate mark-recapture model for telemetry data collected over a decade from 188 Atlantic bluefin tuna (Thunnus thynnus) and apply it to estimate the rate of natural mortality using only acoustic tag detections for all animals, or using acoustic tag detections for 96 single-tagged tuna plus acoustic tag detections combined with estimated positions from pop-up satellite archival tags for 92 double-tagged animals. We support the model for bluefin tuna with a simulation study to quantify bias in estimates of population dynamics parameters and investigate the effect of auxiliary information from satellite tagging on mortality rate estimates for different acoustic tag detection probability scenarios.
We obtained posterior estimates of the instantaneous annual natural mortality (survival) rate across a decade of tagging for Atlantic bluefin tuna of 0.17 yr-1 (0.84 yr-1) both using only acoustic tagging data, and using a combination of acoustic and satellite tagging data. Use of a prior implying a higher rate of fishing mortality yielded an instantaneous annual natural mortality (survival) estimate of 0.10 yr-1 (0.90 yr-1), with combined acoustic and satellite tag data. Results from the simulation study indicate that the use of satellite tags can improve the precision and accuracy of estimates of detection probabilities, area-specific movement probabilities and mortality rates, where the extent of the improvement depends on true underlying acoustic tag detection probabilities. Our work demonstrates that long-term acoustic tagging data sets have strong potential for monitoring of highly migratory marine fish and wildlife populations, providing information on a number of key parameters, including survival and movement rates. However, improved information on tag reporting rates or fishing mortality is needed to better separate natural and fisheries mortality for Atlantic bluefin tuna.
The sustainable management of exploited populations relies on knowledge of fundamental biological and ecological processes such as population growth rate and movement. Population productivity is of primary interest to ecologists and managers since it determines the total number of individuals or biomass that can be removed in a sustainable manner. The rate of natural mortality is an important driver of productivity (Clark, 1999; Williams, 2002), but is notoriously difficult to estimate (Brodziak et al., 2011). Mark–recapture analyses of conventional tagging data, i.e. using tags that simply identify individuals such as T-bar anchor tags and spaghetti tags, can yield estimates of movement rates (Sibert et al., 1999) and rates of fishing (F) and natural (M) mortality (Brownie et al., 1985; Hoenig et al., 1998) where estimates of the tag reporting rate are available. Telemetry (the remote observation of animals using electronic tags and receivers) is an increasingly popular method for monitoring the dynamics of marine animal populations (Hussey et al., 2015; Lennox et al., 2017; Harcourt et al., 2019: Whoriskey et al., 2019). In the marine environment, acoustic telemetry that uses hydrophone receivers to detect signals transmitted by electronic tags is gaining in spatial coverage and coordination. This has been facilitated by both decreasing cost of tags and the proliferation of fixed receiver grids or arrays that allow for continuous long-term monitoring of tagged animals (e.g. Ocean Tracking Network, OTN; O’Dor and Stokesbury, 2009; Cooke et al., 2012). Acoustic telemetry has greatly enhanced our understanding of the spatial ecology of marine animals (Villegas-Ríos et al., 2020), but highly migratory fishes can present additional challenges for reliable estimation of demographic parameters, owing to the fact that receiver coverage is likely to be low over parts of their range. In such cases, positional information from other telemetry technologies (for example, pop-up satellite or PSAT tags that archive data while attached to an animal until a pre-programmed release data when they detach, float to the surface, and transmit data to a satellite), should be a useful aid to interpretation of data from acoustic tagging experiments. Telemetry studies can yield more precise estimates of component mortality rates (i.e. fishing and natural mortality rates) and movement, compared with conventional tagging studies, by facilitating multiple observations on the same individual through time that are independent of fisheries (Dudgeon et al., 2015; Byrne et al., 2017; Hightower and Harris, 2017; Block et al., 2019). At smaller spatial scales (lakes, streams etc.) with concentrated detection effort, direct observations of natural mortality may be possible, e.g. when a fish is located at the same site on repeated searches or sampling occasions (Hightower et al., 2001; Pollock et al., 2004; Bacheler et al., 2009). At larger spatial scales and for long-lived species, models for telemetry data need to utilise other available information to disentangle natural mortalities from other fates where transmissions from tags attached to the animal cease.
Multistate mark–recapture models (Arnason, 1973; Schwarz et al., 1993) extend traditional mark-recapture models to allow individuals to move between a finite set of categorical states between occasions (Lebreton and Cefe, 2002; Pradel, 2005; Gimenez et al., 2007). These states can be either geographical sites or categorical variables like reproductive status or size class (Lebreton and Cefe, 2002; Arnason and Cam, 2004) Multistate models permit estimation of state-specific survival rates, transition probabilities and observation probabilities (for example, it might only be possible to observe animals at a certain site or in their breeding state). State-space models are hierarchical models with two components; a process model that describes the natural stochasticity in ecological processes, and an observation model that describes the error associated with sampling or observing animals, given their current state (de Valpine and Hastings, 2002; Auger Méthe et al., 2021; Newman et al., 2022). In a state-space framework, multistate mark–recapture models allow for probabilistic transition of individuals between a set of latent states (Gimenez et al., 2007; Kéry and Schaub, 2012). Separation of demographic parameters from nuisance parameters such as detection probabilities through the use of separate state and observation equations permits fitting of complex models in this framework (Clark, 2005; Pradel, 2005; Pedersen and Weng, 2013; Auger-Méthé et al., 2021). To date, examples of fitting of spatially explicit multistate mark-recapture models in a state-space framework can predominantly be found in the terrestrial ecology literature (e.g. Gimenez et al., 2007; Royle, 2008), but both such approaches have been recommended for analysis of telemetry data in aquatic environments (Whoriskey et al., 2019), and aquatic applications are increasing in number (e.g. Raabe et al., 2014; Lecomte et al., 2020).
Atlantic bluefin tuna Thunnus thynnus, is a highly migratory and long-lived species that is distributed throughout the North Atlantic Ocean and exploited by fisheries throughout its range. It is currently managed as two stocks (western and eastern, separated by the 45° meridian) by the International Commission for the Conservation of Atlantic Tunas (ICCAT), with both populations considered to be in a rebuilding phase (ICCAT, 2017; Porch et al., 2019) following earlier overfished designations (ICCAT, 2008; ICCAT, 2010). Data from electronic tagging have provided a wealth of information on the biology and ecology of bluefin tunas, including rates of movement, population mixing and mortality (see Block et al., 2019 and references therein). Improved knowledge about population-specific productivity and movements is key to rebuilding bluefin tuna stocks.For highly migratory marine species such as bluefin tuna, detection effort with acoustic systems is likely to take the form of fixed receiver arrays that provide only sparse coverage over much of the species’ range. This creates additional challenges for the interpretation of acoustic telemetry data, since natural mortalities cannot easily be observed or inferred. Below, we present a state-space Bayesian implementation of the multistate mark-recapture model for acoustic and satellite tag telemetered Atlantic bluefin tuna (ABT). The model extends the Bayesian multistate model for acoustic tagged ABT in Block et al. (2019), by adding data from satellite tags to estimate survival rates and spatial movement patterns, and extending the spatial structure from two to four geographical areas. Our model builds on earlier studies (e.g. Hightower and Harris, 2017; Scheffel et al., 2019) by combining spatial structure with increased accounting for uncertainty through including a greater number of fates for tagged fish (non-negligible probabilities of transmitter failure, tagging-related mortality and non-reporting of recaptured tags). We evaluate two models for ABT; using all the available information, with double tagging (acoustic and satellite tags) for 92 out of 188 fish plus single tagging (acoustic tag only) for 96 out of 188 fish, or using acoustic tag information only for all 188 fish. To support interpretation of results from these two models, we quantify the expected gains in precision in estimates of population dynamics parameters when using auxiliary data from PSAT tags using simulated data.
We used data from 188 tagged ABT (184 released in the Gulf of St. Lawrence, Canada and four released in the waters off North Carolina, USA). Data collection was initiated in 2009 in Canada and detections from fish tagged up to and including autumn 2018 are analysed in this study (last acoustic detection in November 2020). Releases from autumn 2019 onwards were omitted from the final model, owing to truncation of the acoustic detection data for these releases (it takes several years to accumulate time series of detections that would be informative about mortality rates). A total of 96 Atlantic bluefin tuna were electronically tagged and released with single V16-4H or V16-6H Vemco acoustic tags, while 92 ABT were tagged and released with both acoustic and satellite tags simultaneously (several generations of pop-up satellite archival tags or PAT tags were used, primarily the Mk10 PAT weighing 77 g and the newer and smaller MiniPAT weighing 67g, both from Wildlife Computers Inc.). Tagging data are summarized in Table S1, and details of tagging protocols can be found in the Supporting Information.
Acoustic detections were obtained across a wide array of receivers along the North American coastline however the majority of tag detections for ABT tagged in this study occurred on VR4 UWM acoustic receiver lines that were deployed and maintained by the Ocean Tracking Network (OTN). The Cabot Strait Line receiver array enclosing the Gulf of St. Lawrence (GSL) was partially deployed in 2009 and completed in late 2011. It provides an electronic “gate” that the Atlantic bluefin tuna must swim past on entering or exiting the GSL foraging grounds (Figure 1A). The completion of the OTN lines enabled monitoring of long-term movements of bluefin tuna acoustically tagged on their GSL foraging grounds (Block et al., 2019). In addition, the Halifax Line, completed in 2007, provides a line of complete coverage across the Scotian Shelf (Figure 1A). Additional deployments of receivers along the eastern seaboard of North America from Newfoundland to the Gulf of Mexico, Bahamas and in the Strait of Gibraltar provided opportunistic detections (Figure 1B) and many of these receivers were seasonally, annually or occasionally removed during the course of the study. Data from receivers in North America was collected via individual exchange of data from receiver downloads that were obtained with the help of Vemco/InnovaSea and various networks. For satellite tags, we use posterior median estimates of daily position (latitude and longitude) from a Bayesian state-space geolocation model (see Block et al., 2011; Winship et al., 2012 and Wilson et al., 2015 for details).
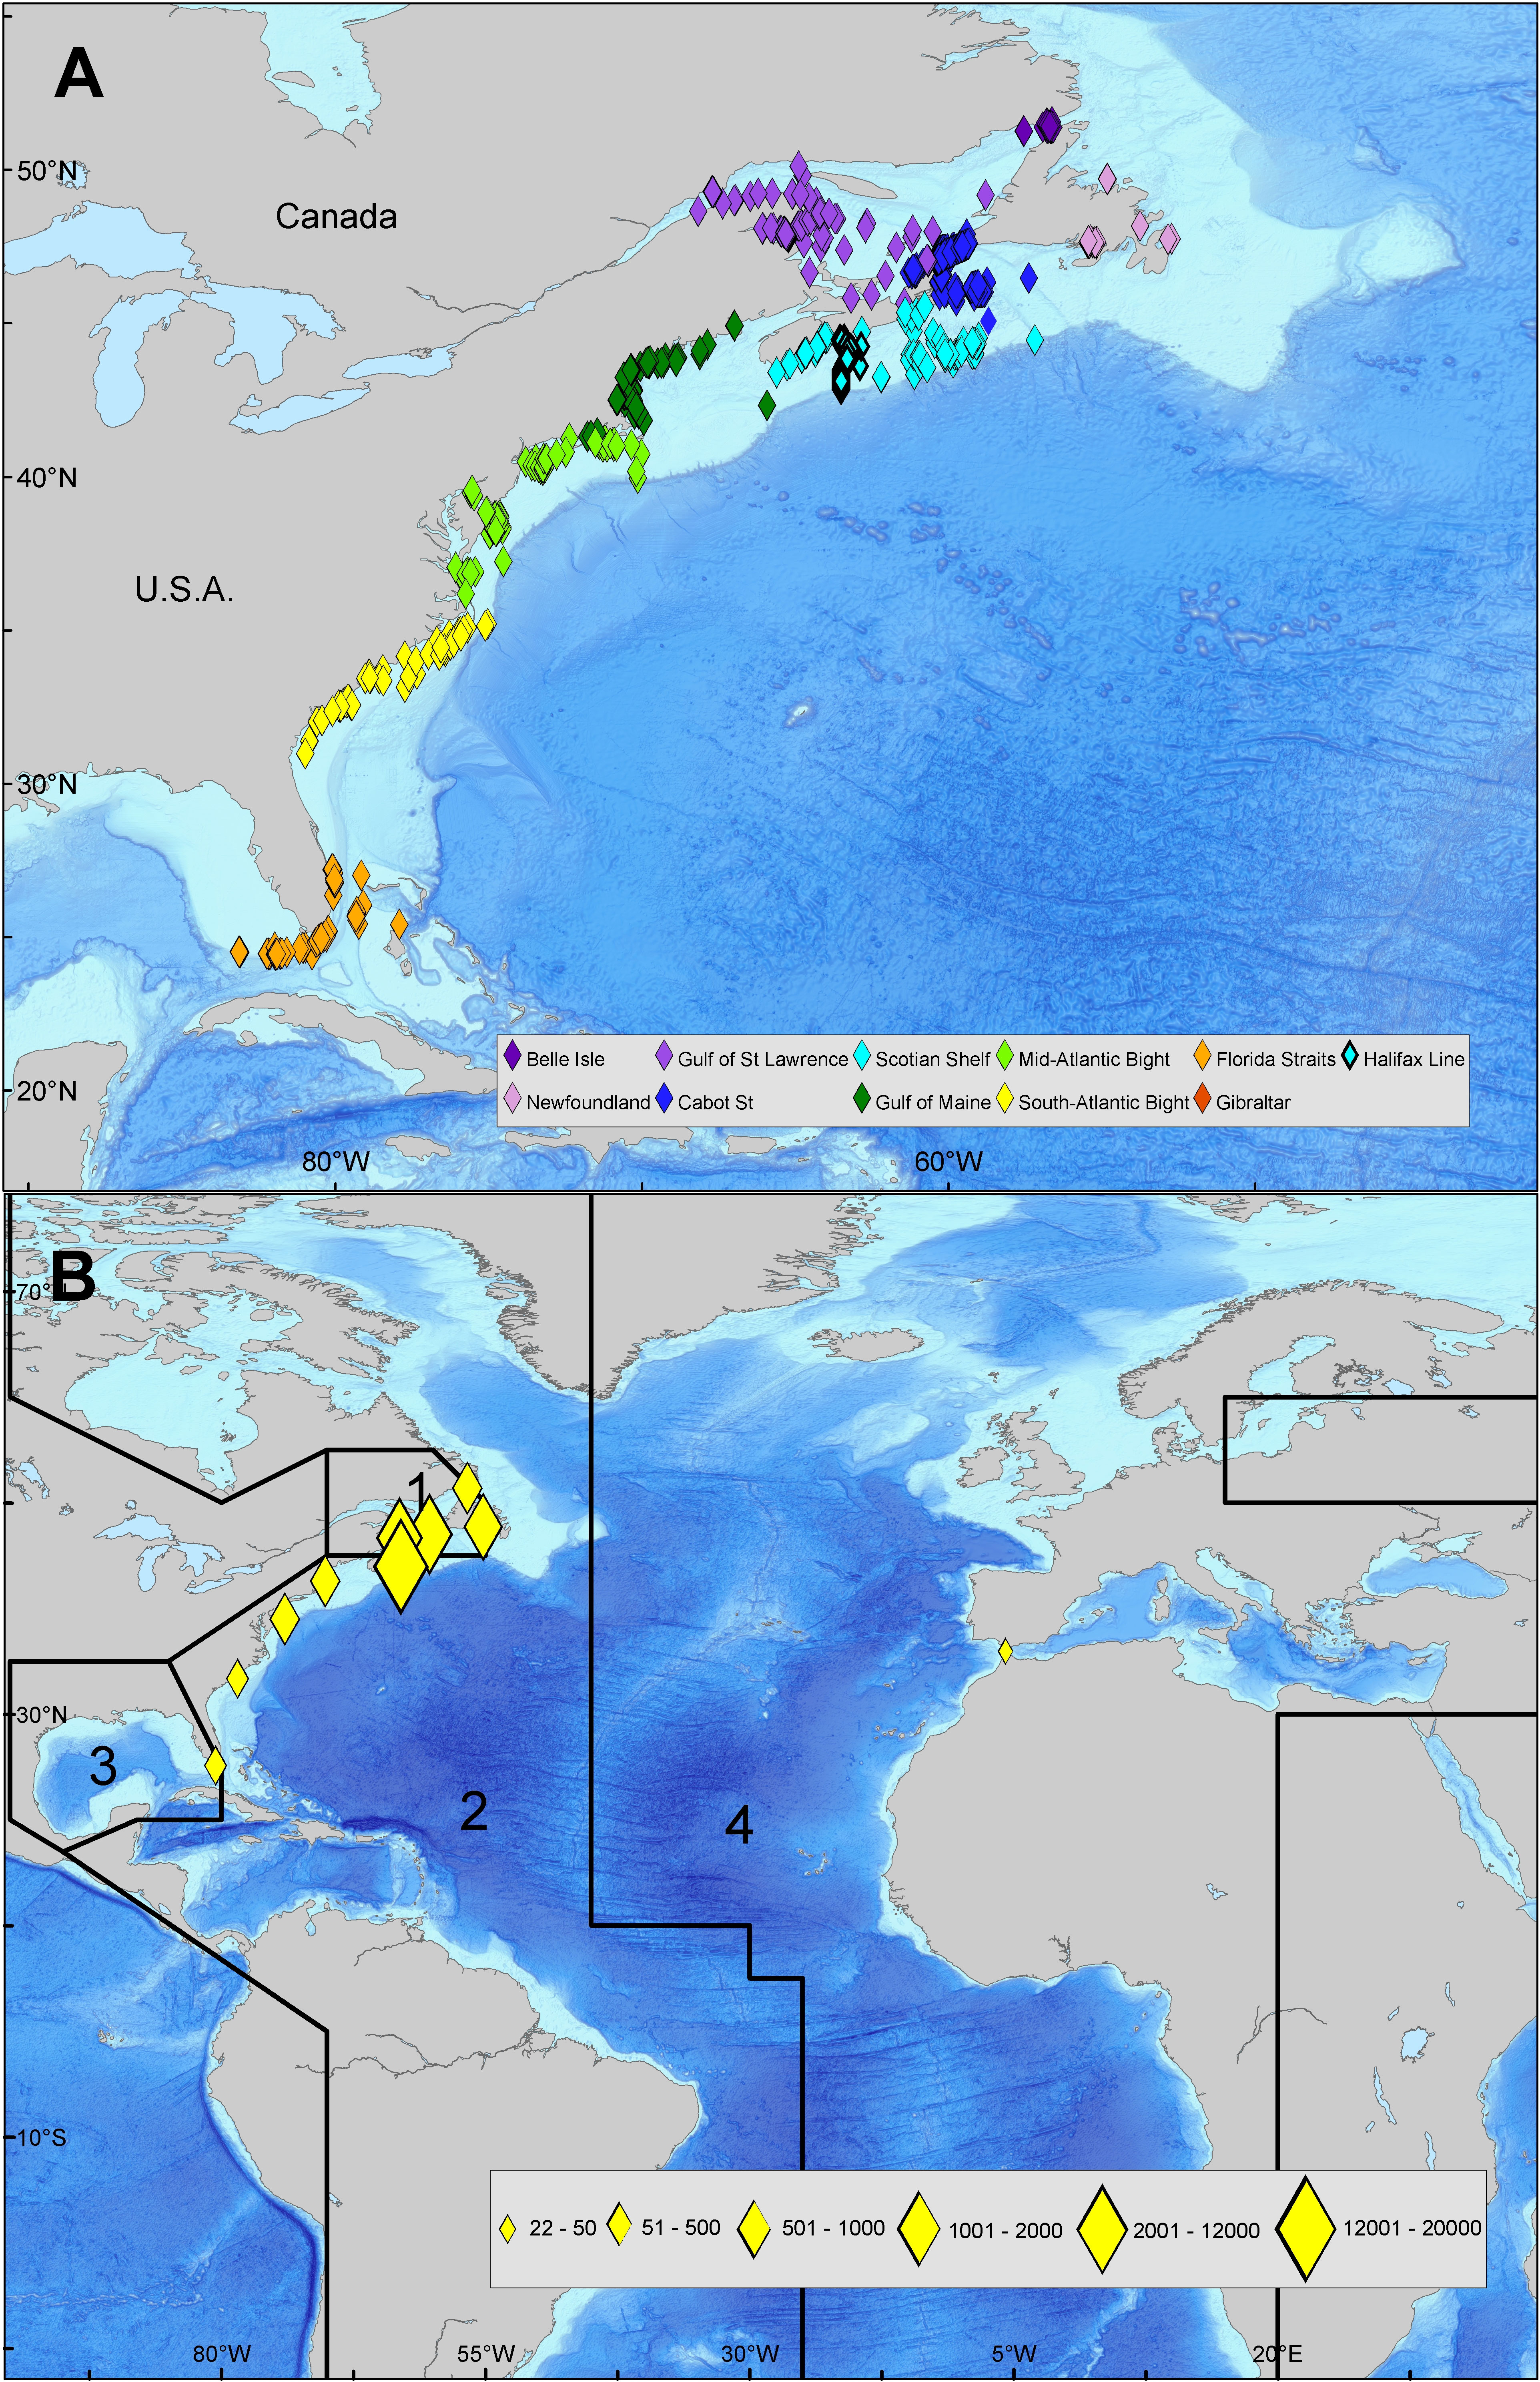
Figure 1 (A) Locations of acoustic detections in Canadian and North American waters (B) Spatial areas for the 4-area multistate mark-recapture model. Area 1, Gulf of St. Lawrence; area 2, western Atlantic; area 3, Gulf of Mexico; area 4, eastern Atlantic and Mediterranean. The acoustic detection count by region is indicated by the graduated symbols. This map was generated in ESRI ArcMap software (Version:10.3.1 & http://desktop.arcgis.com/en/arcmap/10.3/main/get-started/whats-new-in-arcgis-1031.htm).
In addition to acoustic tag detections and daily positions from satellite tags, we use fisheries recaptures of tagged fish where available, including information on the date and location of recapture.
States in the spatially-structured mark-recapture models correspond to an animal’s survival status (dead or alive), spatial area and the status of tags. In this study, we chose to model the main reason for tag detections to cease for fish that are still alive for each tag type. This slightly reduces the complexity of the model for double-tagged animals (accounting for states where the acoustic tag is shed and including information on which tags are attached at recapture would mean an additional twelve states in our framework). Furthermore, information on the number of tags still attached at recapture was not available in all cases. For ABT, we thus consider whether acoustic tags are still transmitting or have exceeded their battery life, and for satellite tags whether they remain attached or have popped-up from the animal. The assumptions made in this study are similar to those applied elsewhere in applications of multistate models to telemetry data (e.g. Hightower et al., 2001; Hightower and Harris, 2017). These are as follows: 1) mortality rates and detection probabilities are equal for all tagged individuals (in the case of acoustic tag detection probabilities, this means that they are equal within an area and time stratum); 2) the fates of tagged fish are independent, and 3) long-term (type-II) shedding of acoustic tags with two point attachments is negligible.
The models for ABT have a two-month time step with six “seasons” per year (January-February, March-April, May-June, etc.) for estimation of movement rates. Since each two-month time step comprised multiple position observations for both acoustic and satellite tag data, but only one area was specified per time step in the model, individuals were assigned to areas based on the greatest occupancy in terms of number of days spent in each area during that time step (see details under Observations models).Different state and observation vectors are needed to deal with ABT with only acoustic tags vs. ABT with both acoustic and satellite tags, to account for the different numbers of possible states (Tables 1, S2). Below, we present equations for double tagged ABT that apply to 92 tagged animals in the model with both tag types. Equations for single (acoustic) tagged fish that apply to the remaining 96 fish, and to all 188 tagged fish in the acoustic only model can be found in the Supporting Information. We estimate separate rates of fishing and natural mortality, although precise estimates of tag reporting rates were unavailable. In order to address uncertainty stemming from potential confounding of fishing and natural mortality rates, we therefore compared a base case fishing mortality prior (uninformative with a relatively low prior median of 0.08 yr-1), with an alternative prior based on estimates for the period 1990-2006 from an earlier study (Kurota et al., 2009), that implies a higher level of fishing mortality. Priors for model parameters can be found in Table 2.
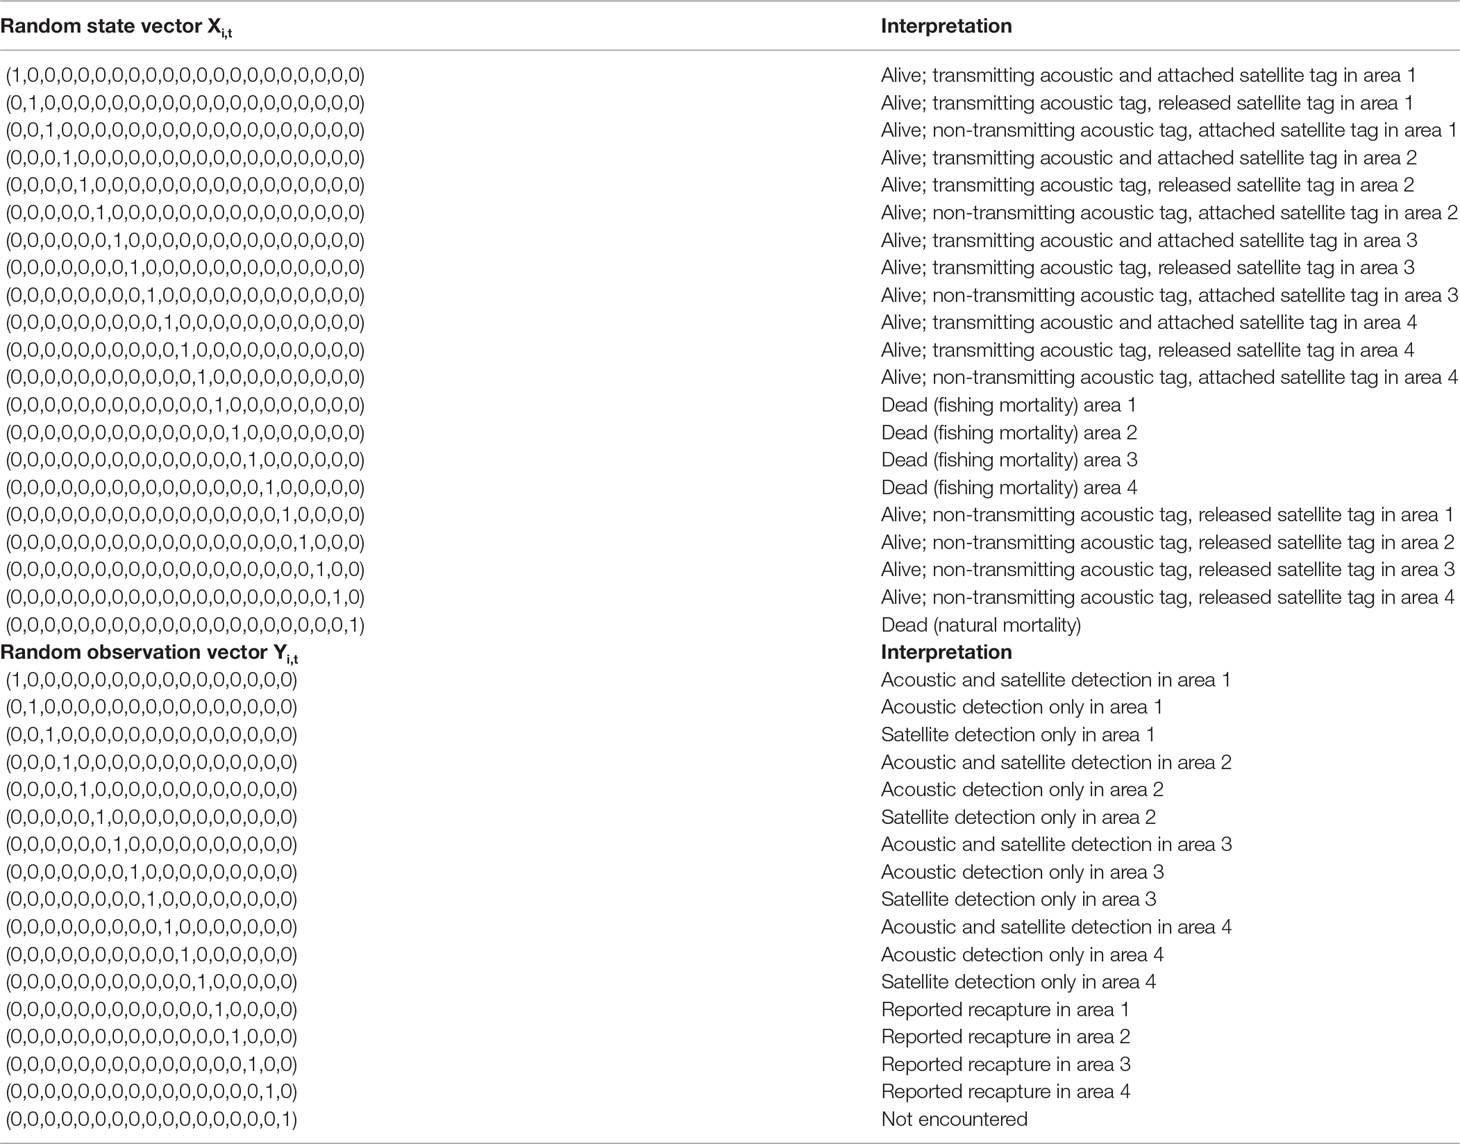
Table 1 State and observation vectors in the multistate mark–recapture model for acoustic and satellite tagged ABT.
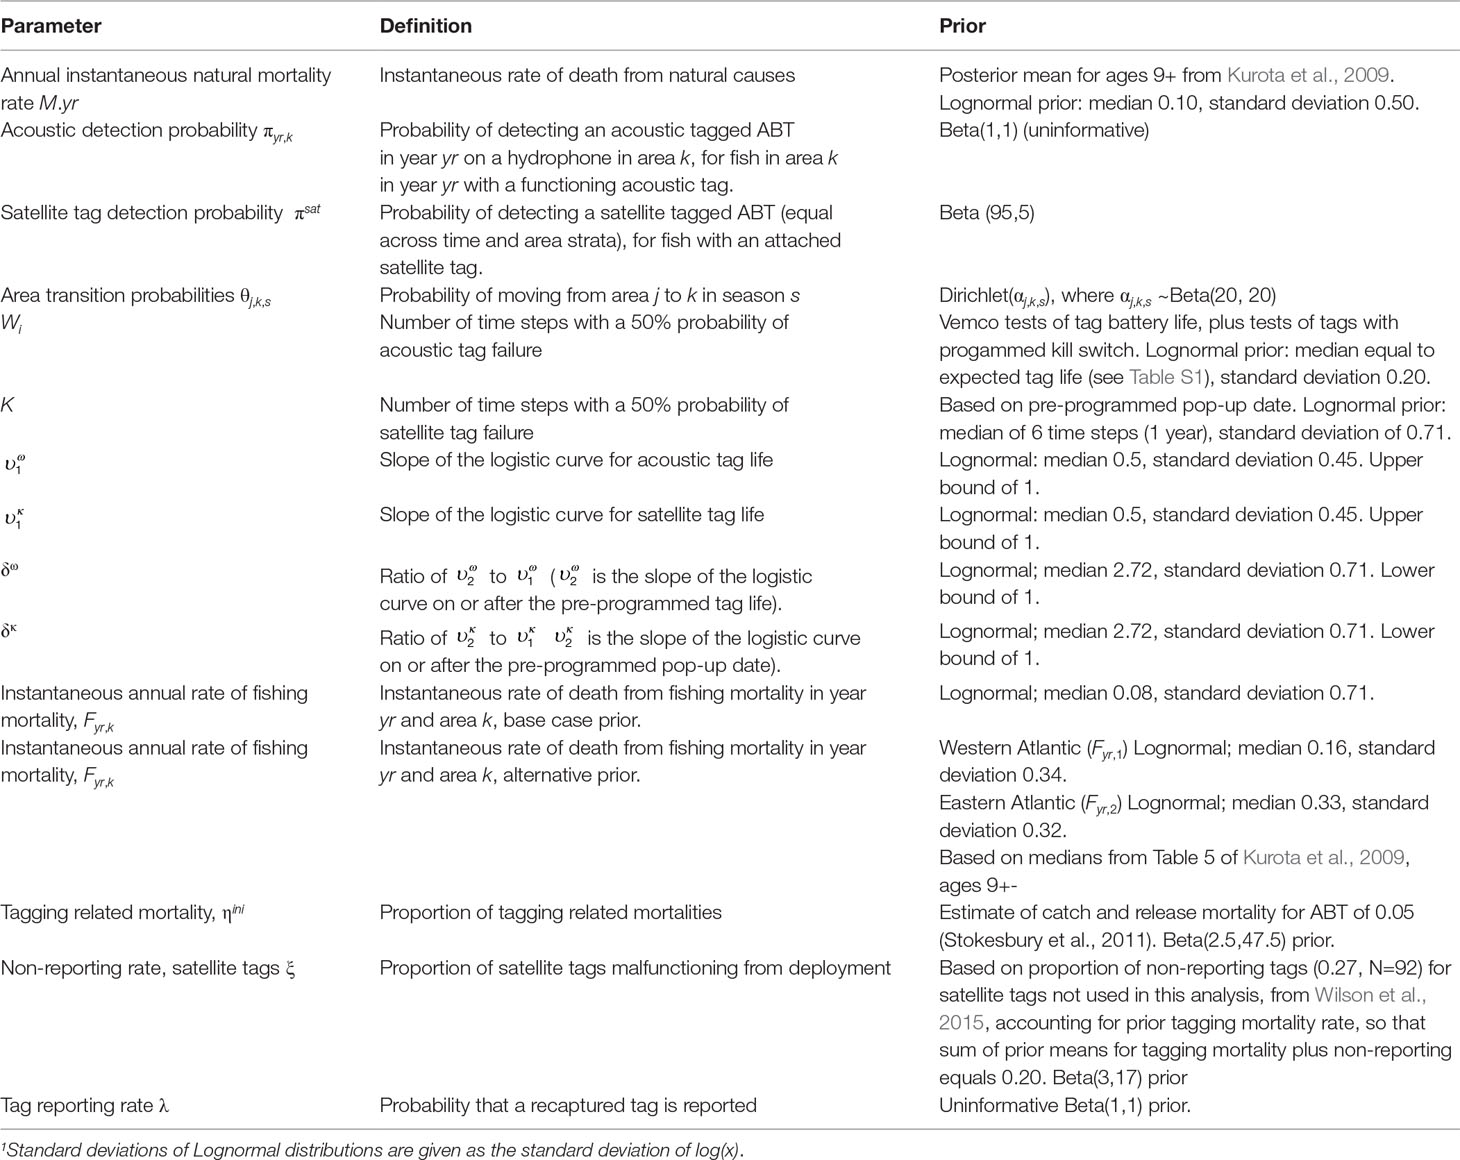
Table 2 Parameters estimated in the mark-recapture model for ABT and their priors.
Spatial areas in the state-space survival model are based on areas used by ICCAT for the assessment of Atlantic bluefin tuna stocks. Some of the spatial areas used by ICCAT were combined for purposes of this analysis. The areas are defined as: inside the Gulf of St. Lawrence (area 1), where acoustic detection effort is concentrated; western Atlantic (area 2), Gulf of Mexico (area 3), and eastern Atlantic and Mediterranean (area 4) (Figure 1B).
The state-space multistate mark-recapture model comprises a state transition equation that describes the probabilities for animals to move among states from time t to t+1, conditional on their current state, paired with an observation equation that describes the probability of the observed datum at time t, conditional on the animal’s state at time t. In the model for ABT, transition probabilities between different states are products of movement rates, survival rates, and parameters governing acoustic tag malfunction and satellite tag release. Movement is assumed to occur before fishing in each time step, and it is assumed that tagging related mortality takes place before fishing mortality, so that individuals dying from tagging related causes in the first time step are not available to the fishery. In the equations that follow, subscripts i and t denote individual and time step, respectively. ri denotes the time step of release for individual i, s(t) denotes the season of the year for time step t and y(t) denotes the year for time step t.
Survival probabilities (φt,k) for time step t and area k are obtained using area- and year-specific rates of fishing mortality together with natural mortality: φt,k=exp(−(M+Fy(t),k)), where Fy,k=F.yry,k/6 and M=M.yr/6. We constrained rates of fishing mortality within the Gulf of St. Lawrence, western Atlantic, and Gulf of Mexico to be equal within a given year. The rate of total instantaneous mortality Zy(t),k is defined as: Zy(t),k= M+Fy(t),k.Seasonal movement rates θj,k,s(t) denote the probability to move between areas j and k in season s. We use a two-month time step to capture intra-annual seasonal movement patterns that have been documented in other studies (Block et al., 2001; Walli et al., 2009).The probability that an acoustic tag will malfunction or cease to transmit t-ri time steps after release (ωi,t) is assumed to follow a logistic curve:
, t-ri <Wi
, t-ri ≥Wi
where Wi is the number of time steps at large at which the probability to stop transmitting equals 0.50 for individual i and and are slopes of the logistic curve for acoustic tag life, describing the variability in the time to cease transmitting. We assume that the logistic curve has higher steepness on the right hand side (after the pre-programmed tag life) controlled by , so that there is a non-zero probability of tag failure from release and up to the programmed date, but after this the probability increases steeply. Information about priors for Wi values (in days) can be found in Table 2.
Earlier studies (e.g. Wilson et al., 2015) have indicated that in deployments of satellite tags on ABT, a non-negligible proportion of tags do not report or malfunction and fail to transmit data. Since it may not be possible to distinguish these from tags attached to animals that died, and estimation of survival was an objective of our analysis, we chose to keep these tags in the model. The loss of satellite tags from the study is described by a term (κi,t), whose interpretation depends on the time step. In the time step of release i.e. t=ri, it represents the proportion of tags that will not report data during the study (e.g. as a result of tag malfunction): κi,t=ξ. In later time steps it denotes the probability that a satellite tag will pop-off from the fish t-ri time steps after release:
, t-ri < K,
, t-ri ≥ K,
where K is the number of time steps at which the probability of pop-up equals 0.50 and and are the slopes of the logistic curve for time to pre-programmed release date for satellite tags. It is common for pop-up satellite tags to release prior to their programmed release time. Reasons for early release include (but are not limited to) pin breakage, nose-cone failure, tether wearing and dart dislodging (Kurota et al., 2009). We assume that the probability of release is highest in the programmed time step with an asymmetry in the steepness of the logistic function, so that the probability of pop-up is higher in the time-steps immediately after the programmed date, compared with the time steps preceding it.
Tagging related mortality is assumed to act in the time step of release. This is implemented in the model by using term ρt to denote the proportion of fish that survives tag-related mortality (ρt<1 in the release time step only):
ρt=(1−ηini), t=ri,
ρt=1, t>ri,
where ηini is the proportion of fish that dies from tagging related causes. In this study, both acoustic and satellite tags were externally attached and in the absence of other information we assume that tagging related mortality is equivalent for fish tagged with single acoustic or both acoustic and satellite tags (i.e. the addition of a satellite tag does not lead to a higher probability of tagging related mortality).
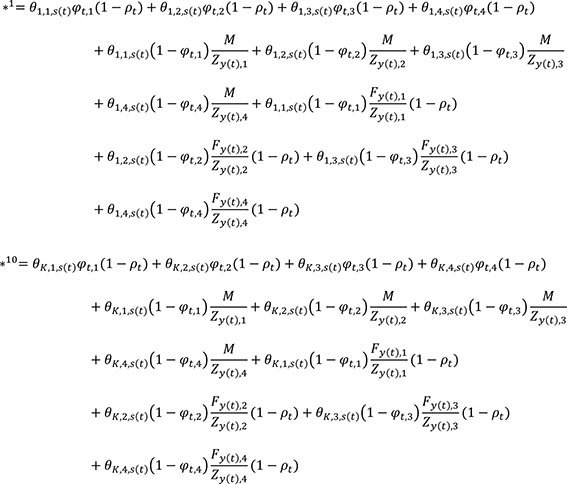
Transition probabilities between states for individual i at time t, Xi.t and time t+1, Xi.t+1 are summarized by the state transition equation. In this transition equation, rows represent “from” states, and columns “to” states; there are 21 rows and columns corresponding to different states in the model. States 1-12 correspond to fish that are alive with a transmitting acoustic tag and attached satellite tag, fish that are alive with a transmitting acoustic tag and detached satellite tag, and fish that are alive with a non-transmitting acoustic tag and attached satellite tag in each of areas 1-4, respectively. These are followed by fisheries recaptures in areas 1-4 (states 13-16), states corresponding to fish that are alive with a non-transmitting acoustic tag and detached satellite tag in areas 1-4 (states 17-20), and a catch-all state (21) for fish that died from natural or tagging-related mortality (Table 1). Below, transition probabilities to states 1 to 20 are shown only for k=1 and k=K for clarity of presentation. Columns 1 to 12 of the state equation (tagged fish that are alive in different areas with at least one functioning tag) are given by:
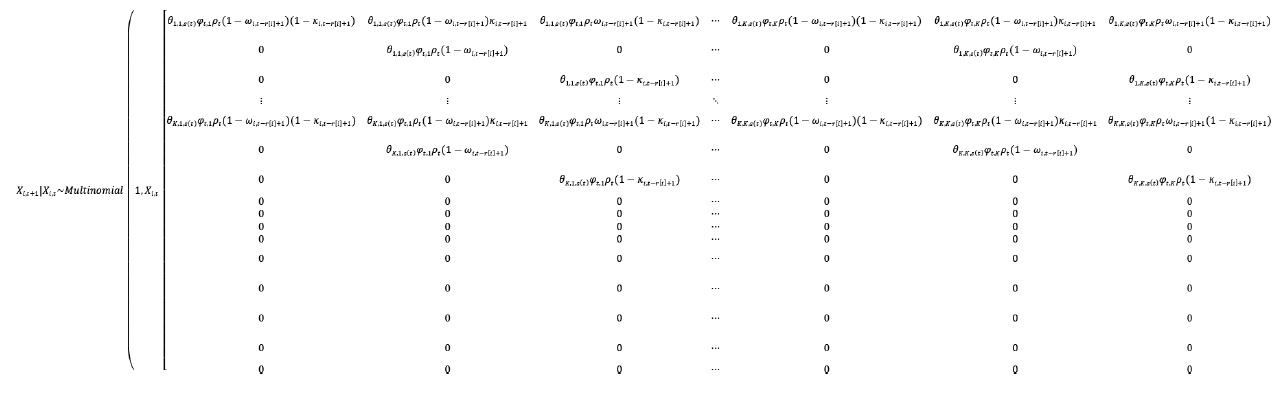
Columns 13 to 21 (fishery recaptures, fish with zero functioning tags, and natural and tagging-related mortalities) are given by:
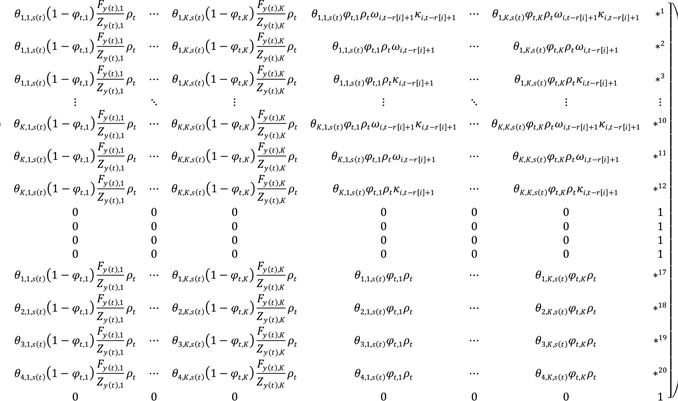
For example, the cell in the first row and first column θ1,1,s(t)φt,1ρt(1−ωi,t−r[i]+1)(1−κi,t−r[i]+1) gives the probability to remain in area 1 in time step t, survive fishing and natural mortality in area 1 during time step t, and survive tagging related mortality (applicable if t=ri), with an acoustic tag that keeps transmitting and satellite tag that remains attached. The term in the first row and twelfth column θ1,K,s(t)φt,Kρtωi,t−r[i]+1(1−κi,t−r[i]+1) gives the probability to move from area 1 to area K in time step t, survive fishing and natural mortality in area K during time step t, and survive tagging related mortality (applicable if t=ri), with an acoustic tag that stops transmitting and a satellite tag that remains attached. The term gives the probability to move from area 2 to area 1 in time step t, be killed by fishing in area 1 during time step t, and survive tagging related mortality (applicable if t=ri). An asterisk in the final column (superscripts indicate the row index) denotes terms that gather together fish that died from natural causes or tagging related mortality, e.g.:
For the 96 ABT tagged with both an acoustic transmitter and satellite tag, acoustic detection and satellite tag data were encoded as an observation vector with a “1” for the assigned observation type during that time step (Table 1). For time steps with only acoustic detections, fish were assigned as an acoustic detection in the area with the most detection days during that time step. Since multiple acoustic detections can occur in one day, a daily area was first selected as that with the highest number of detections for each day in the time step. Likewise, for fish with only satellite tag locations in a given time step, the observation state was assigned as a satellite tag detection in the area with the highest number of daily detections (as indicated by the tag track locations). Where the maximum number of daily detection was observed in more than one area (for single or double tagged animals), the area with the first observation in that time step was selected. For double tagged animals, daily observations for both tag types were first counted by area. If acoustic and satellite tags indicated different areas on a given day, the acoustic tag observation was given precedence because of the higher precision associated with this observation type. It was then determined whether the animal was detected via either the acoustic tag only, satellite tag only, or both tags in the area with the most daily observations in that time step, and state was assigned accordingly. Daily area observations differed approximately 30% of the time when both observation types were available. These differences occurred primarily for observations around the Cabot Strait Line that traverses the main entrance to the Gulf of St. Lawrence, and are presumably a result of geolocation error for satellite tag positions. Similarly, if a fish was recaptured, its observation state was assigned as a recapture in the reported area. A final observation type corresponds to no detections or recaptures of an individual at time t. The observed state for individual i at time t, Yi,t, is assumed to follow a Categorical (i.e. Multinomial with sample size = 1) distribution:
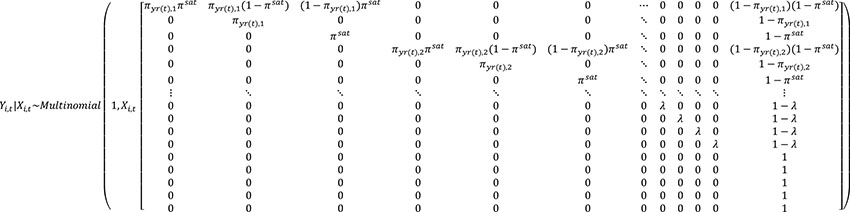
where πyr(t),k is the year- and area-specific acoustic tag detection probability; πsat is the detection probability for satellite tagged bluefin tuna and λ is the tag reporting rate for fisheries recaptures. In our study, detection probabilities are phenomenological parameters that combine the probability for a fish to encounter the receiver (i.e. to move within the receiver’s range of detection) with the probability to be detected, given that it is in range. We included an additional observation model for PAT tag pop-up, since this is an observation on the tag itself (in contrast to the main observation equation that describes observations of tagged animals). The observed pop-up event at time t for a satellite tag on individual i, Oi,t was assumed to follow a Bernoulli distribution: Oi,t~Bernoulli(κi,t), t=2,…N, where Oi,t was coded as a 0 prior to the time-step of PAT tag pop-up, 1 in the time-step of pop-up and NA thereafter.
Inference was performed using the R package Nimble (de Valpine et al., 2017), version 12.1. A burn-in period of 200,000 iterations was used, after which 100,000 more iterations were kept and thinned at an interval of 50 to yield a final sample of 2000 iterations. Two chains were run in parallel for all models; the Watanabe–Akaike information criterion (WAIC, Watanabe, 2010) was recorded to allow comparison of alternative model structures. Convergence was checked using the Gelman-Rubin diagnostic (Gelman and Rubin, 1992) that compares the variance within and between multiple parallel MCMC chains, and by visual inspection of trace plots. A threshold of 1.1 for Gelman-Rubin point estimates was used as a criterion for assessing convergence using Gelman-Rubin diagnostics. Model fit was assessed by monitoring posterior predictive distributions for individual animal states. See Supporting Information for details.
The precision and bias in parameter estimates were evaluated for data sets comprising only acoustic tags, or double tagging with acoustic and satellite tags, and for two different acoustic tag detection scenarios. Data were simulated from the observation equations described above, with a slightly simplified process model, where all satellite tags were assumed to transmit perfectly at release. The model used to simulate data has four spatial areas, with releases of tagged animals occurring in only one of the four areas (Table S3). We used 50 data sets for each of four simulation studies corresponding to acoustic tag detection probability and tag type scenarios. The first acoustic tag detection scenario was designed to loosely resemble the situation for ABT tagged in the Gulf of St Lawrence, with two areas having relatively high tag detection probabilities, and two with low probabilities. The second acoustic tag detection scenario had low tag detection probabilities in all areas (Table S4). Each simulated data set contained simulated observations for 100 tagged fish, where all had either an acoustic tag only, or both acoustic and satellite tags, depending on the tag type scenario. True parameter values used to generate simulated data sets can be found in Tables S4–S6. Priors used in estimation using simulated data sets were the same as those specified in Table 2. Estimation was performed using parallel computing with the runjags.study function in the runjags package in R (Denwood, 2016). runjags calls the autorun.jags function, which periodically assesses convergence (using the Gelman-Rubin statistic) and extends the simulation if necessary. For our application, it was necessary to modify the runjags.study function slightly to increase the maximum time argument used by autorun.jags, to ensure simulations were not terminated before convergence. The median relative error (MRE, %) plus 10th and 90th percentiles of relative error (%) were computed for posterior medians for different parameter groups (natural mortality, fishing mortality rates, movement rates etc.). The proportion of simulations in which the true parameter value was contained within the 95% posterior probability interval was also determined for different parameter groups.
The 188 acoustic tags used in this analysis acquired over 50,000 detections across 1225 receiver locations over the course of the study. Times from tagging until last acoustic detection ranged from 0 to 1812 days (Figure 2). Of the 188 tags, 7% were not detected after tagging, 91% were detected during the first year post release, and 65% were detected after the first year post release.
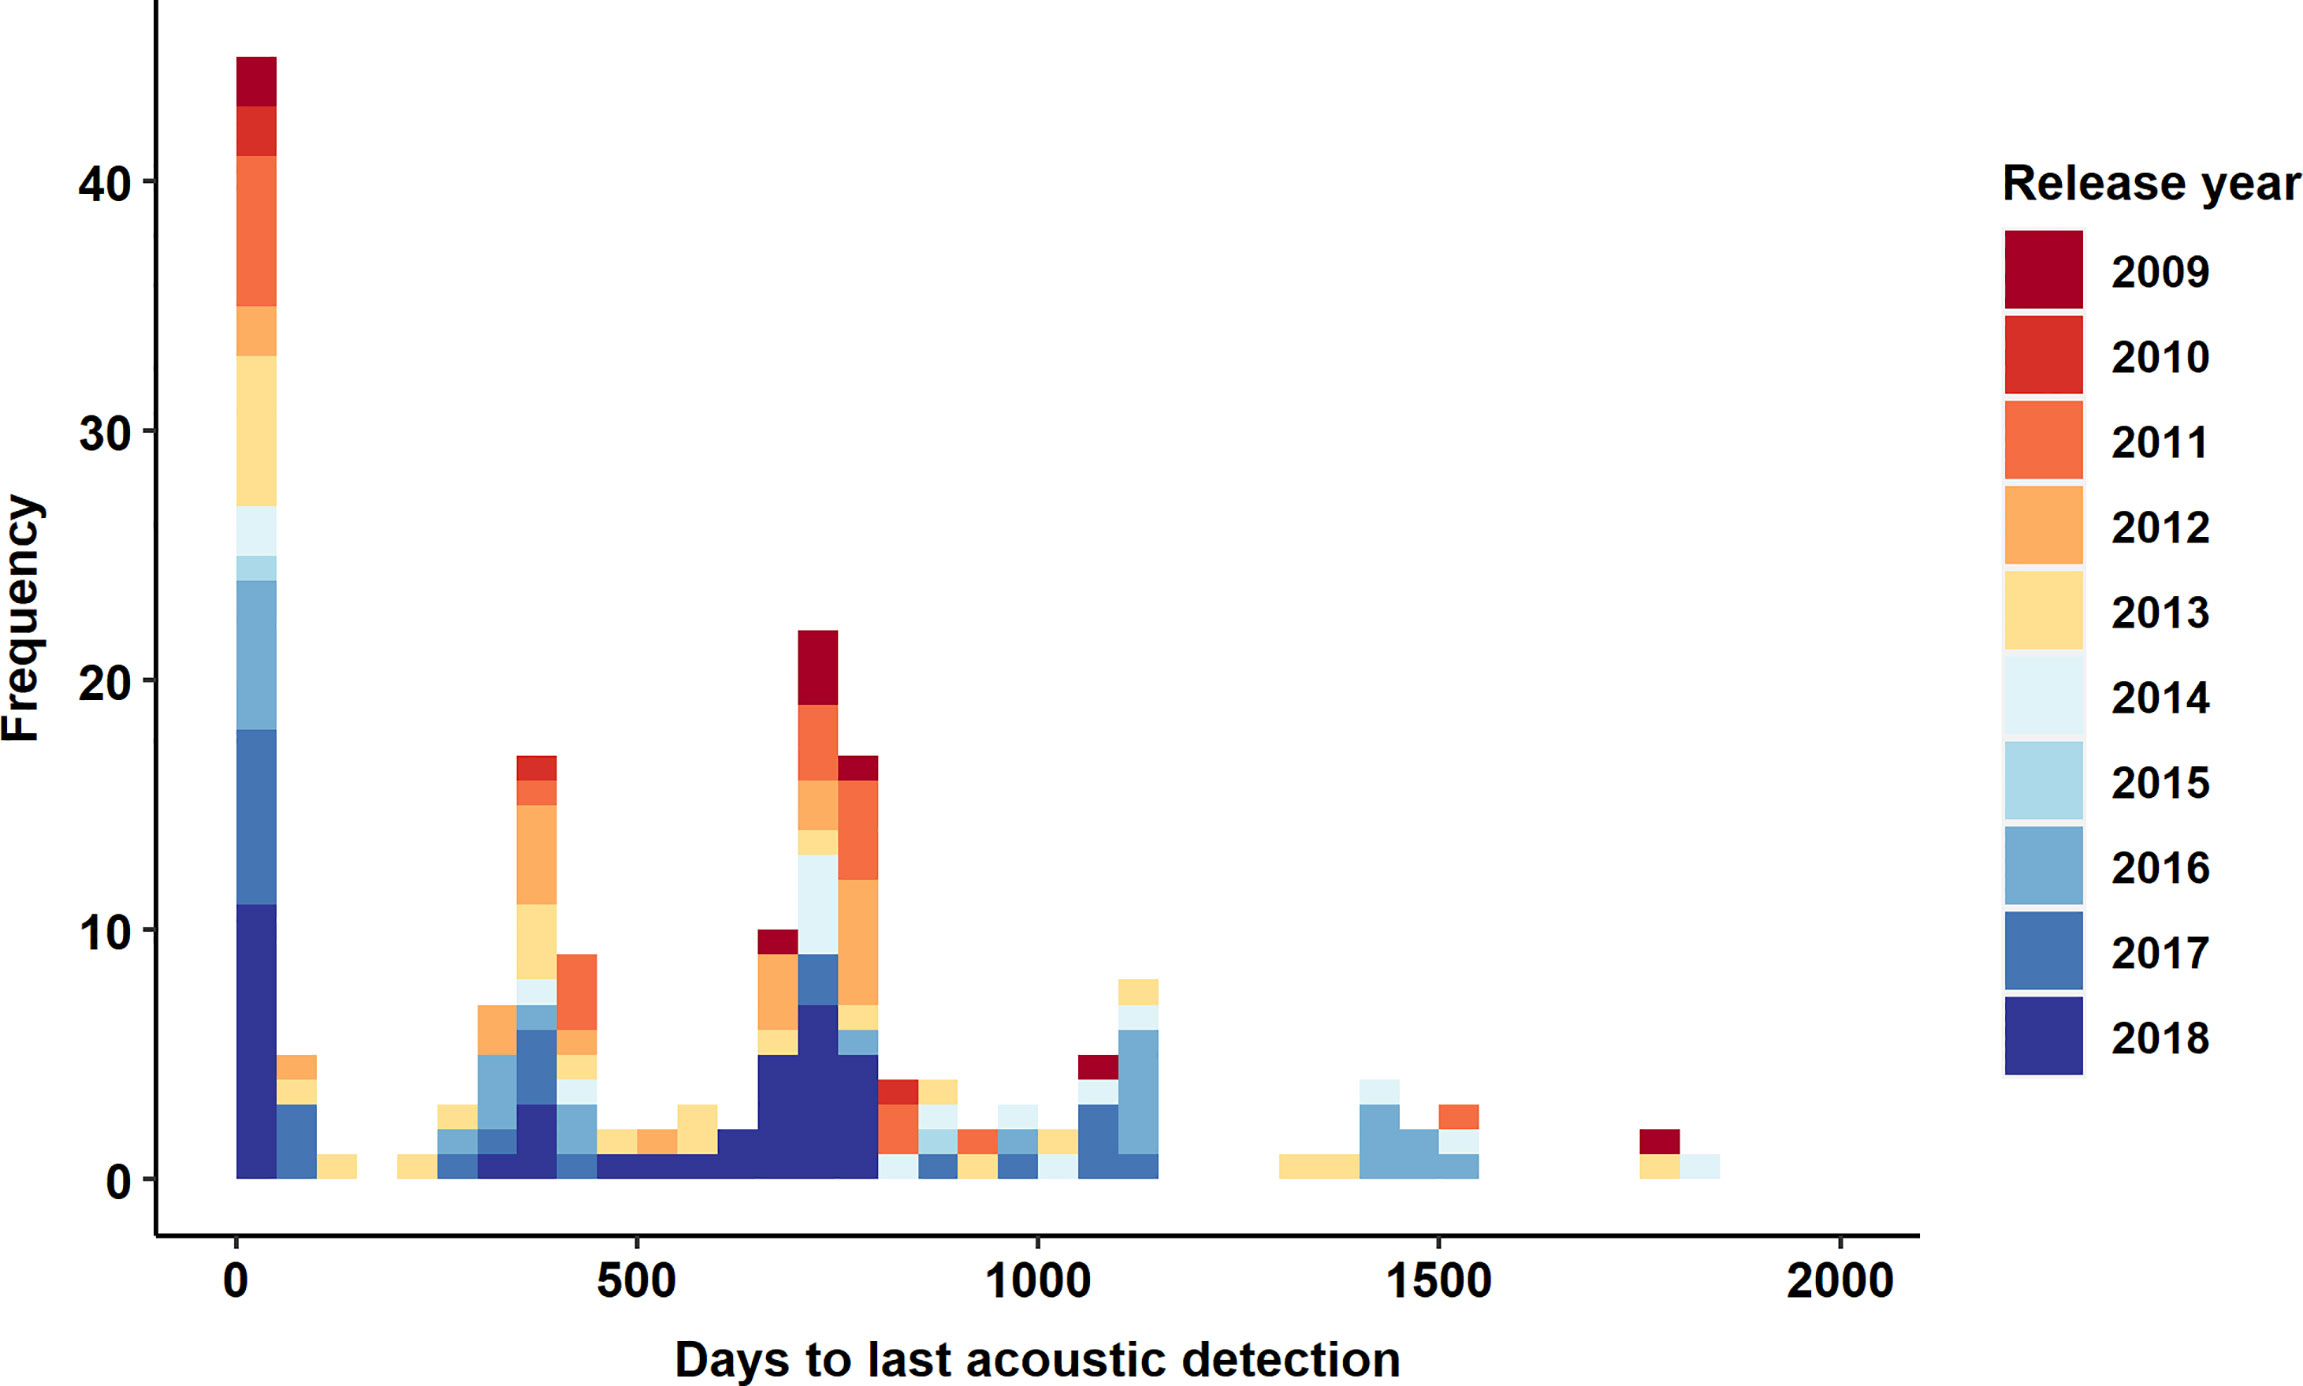
Figure 2 Times at larges (days from deployment to last acoustic detection) by deployment year for acoustic tagged ABT in this analysis (N=188). Note that the maximum possible times to last detection for tags released in 2017 and 2018 and approximately 1100 and 750 days, respectively.
All 361 monitored parameters in acoustic tag only models had Gelman-Rubin point estimates below 1.10, for both fishing mortality prior runs. All 367 monitored parameters in model runs with both acoustic and satellite tagging data also had Gelman-Rubin point estimates below 1.10, indicating convergence to the posterior distribution.Results below are for base case fishing mortality runs unless otherwise stated. Additional figures for the alternative F prior run are provided in the Supporting Information (Figures S2–S6). Combining acoustic and satellite tagging data yielded a posterior distribution for the instantaneous annual natural mortality rate with a median of 0.17 yr-1 and standard deviation of 0.22 (95% posterior probability interval 0.10 yr-1-0.25 yr-1), while under the alternative higher fishing mortality prior (Table 2), the prior distribution was updated to a posterior distribution with median 0.10 yr-1 and standard deviation of 0.30 (95% posterior probability interval 0.04 yr-1-0.16 yr-1). Using acoustic tagging data only, a posterior median of 0.17 yr-1 (standard deviation of 0.22, 95% posterior probability interval 0.10 yr-1-0.24 yr-1) was obtained using the base case fishing mortality prior (Figure 3). Using combined acoustic and satellite tag data, the base case fishing mortality model run had a WAIC value (average for both chains) of 2325.5, while the higher fishing mortality run had a WAIC value of 2328. Akaike weights (Burnham and Anderson, 2002) based on the difference in WAIC (analogous to model posterior probabilities conditional on future expected data, McElreath, 2020) were 0.78 for the base case F model and 0.22 for the higher F model. WAIC values should however be interpreted with caution since WAIC treats individual observations as independent (McElreath, 2020), which may not apply here given the likely temporal correlation of observations.Based on acoustic and satellite tagged ABT, seasonal estimates of the rate of movement into and out of the GSL showed the highest rates of departure from the GSL during autumn (Sep-Oct and Nov-Dec time steps, Figure 4), whilst residency was highest during the summer months. During September-October, tagged ABT were estimated to move predominantly into the western Atlantic area, but later into the year movements to the Gulf of Mexico and eastern Atlantic and Mediterranean became more prevalent (Figure 4). Tagged ABT in the western Atlantic showed net movement into the GSL (area 1) in late spring (May-June, Figure 5) consistent with observations at receivers at the Cabot, Canso and Belle Isle Straits. This was followed by increased residency during autumn. Movement rates to the Gulf of Mexico and eastern Atlantic and Mediterranean (areas 3 and 4) were highest during winter (January-February and November-December time steps), although movement rates to the eastern Atlantic area were low throughout the year. Estimated movement probabilities out of the GOM model area to the western Atlantic and GSL were highest during late spring (between April and May and July and to August), while movement rates to the eastern Atlantic and Mediterranean area were updated to low values during the whole year. Residency in the GOM area was highest during winter months (November to February, Figure 6). Estimated movement rates out of the eastern Atlantic and Mediterranean model area (area 4) were updated to a lesser extent than the other areas, owing to few tagged animals moving into this area. Movement rates to the GSL and western Atlantic areas were highest during May-June and July-August, while movement rates to the GOM area were updated to very low values in spring and summer but reflected the prior in autumn and winter. Residency in the eastern Atlantic and Mediterranean area was highest during January to April (Figure 7).
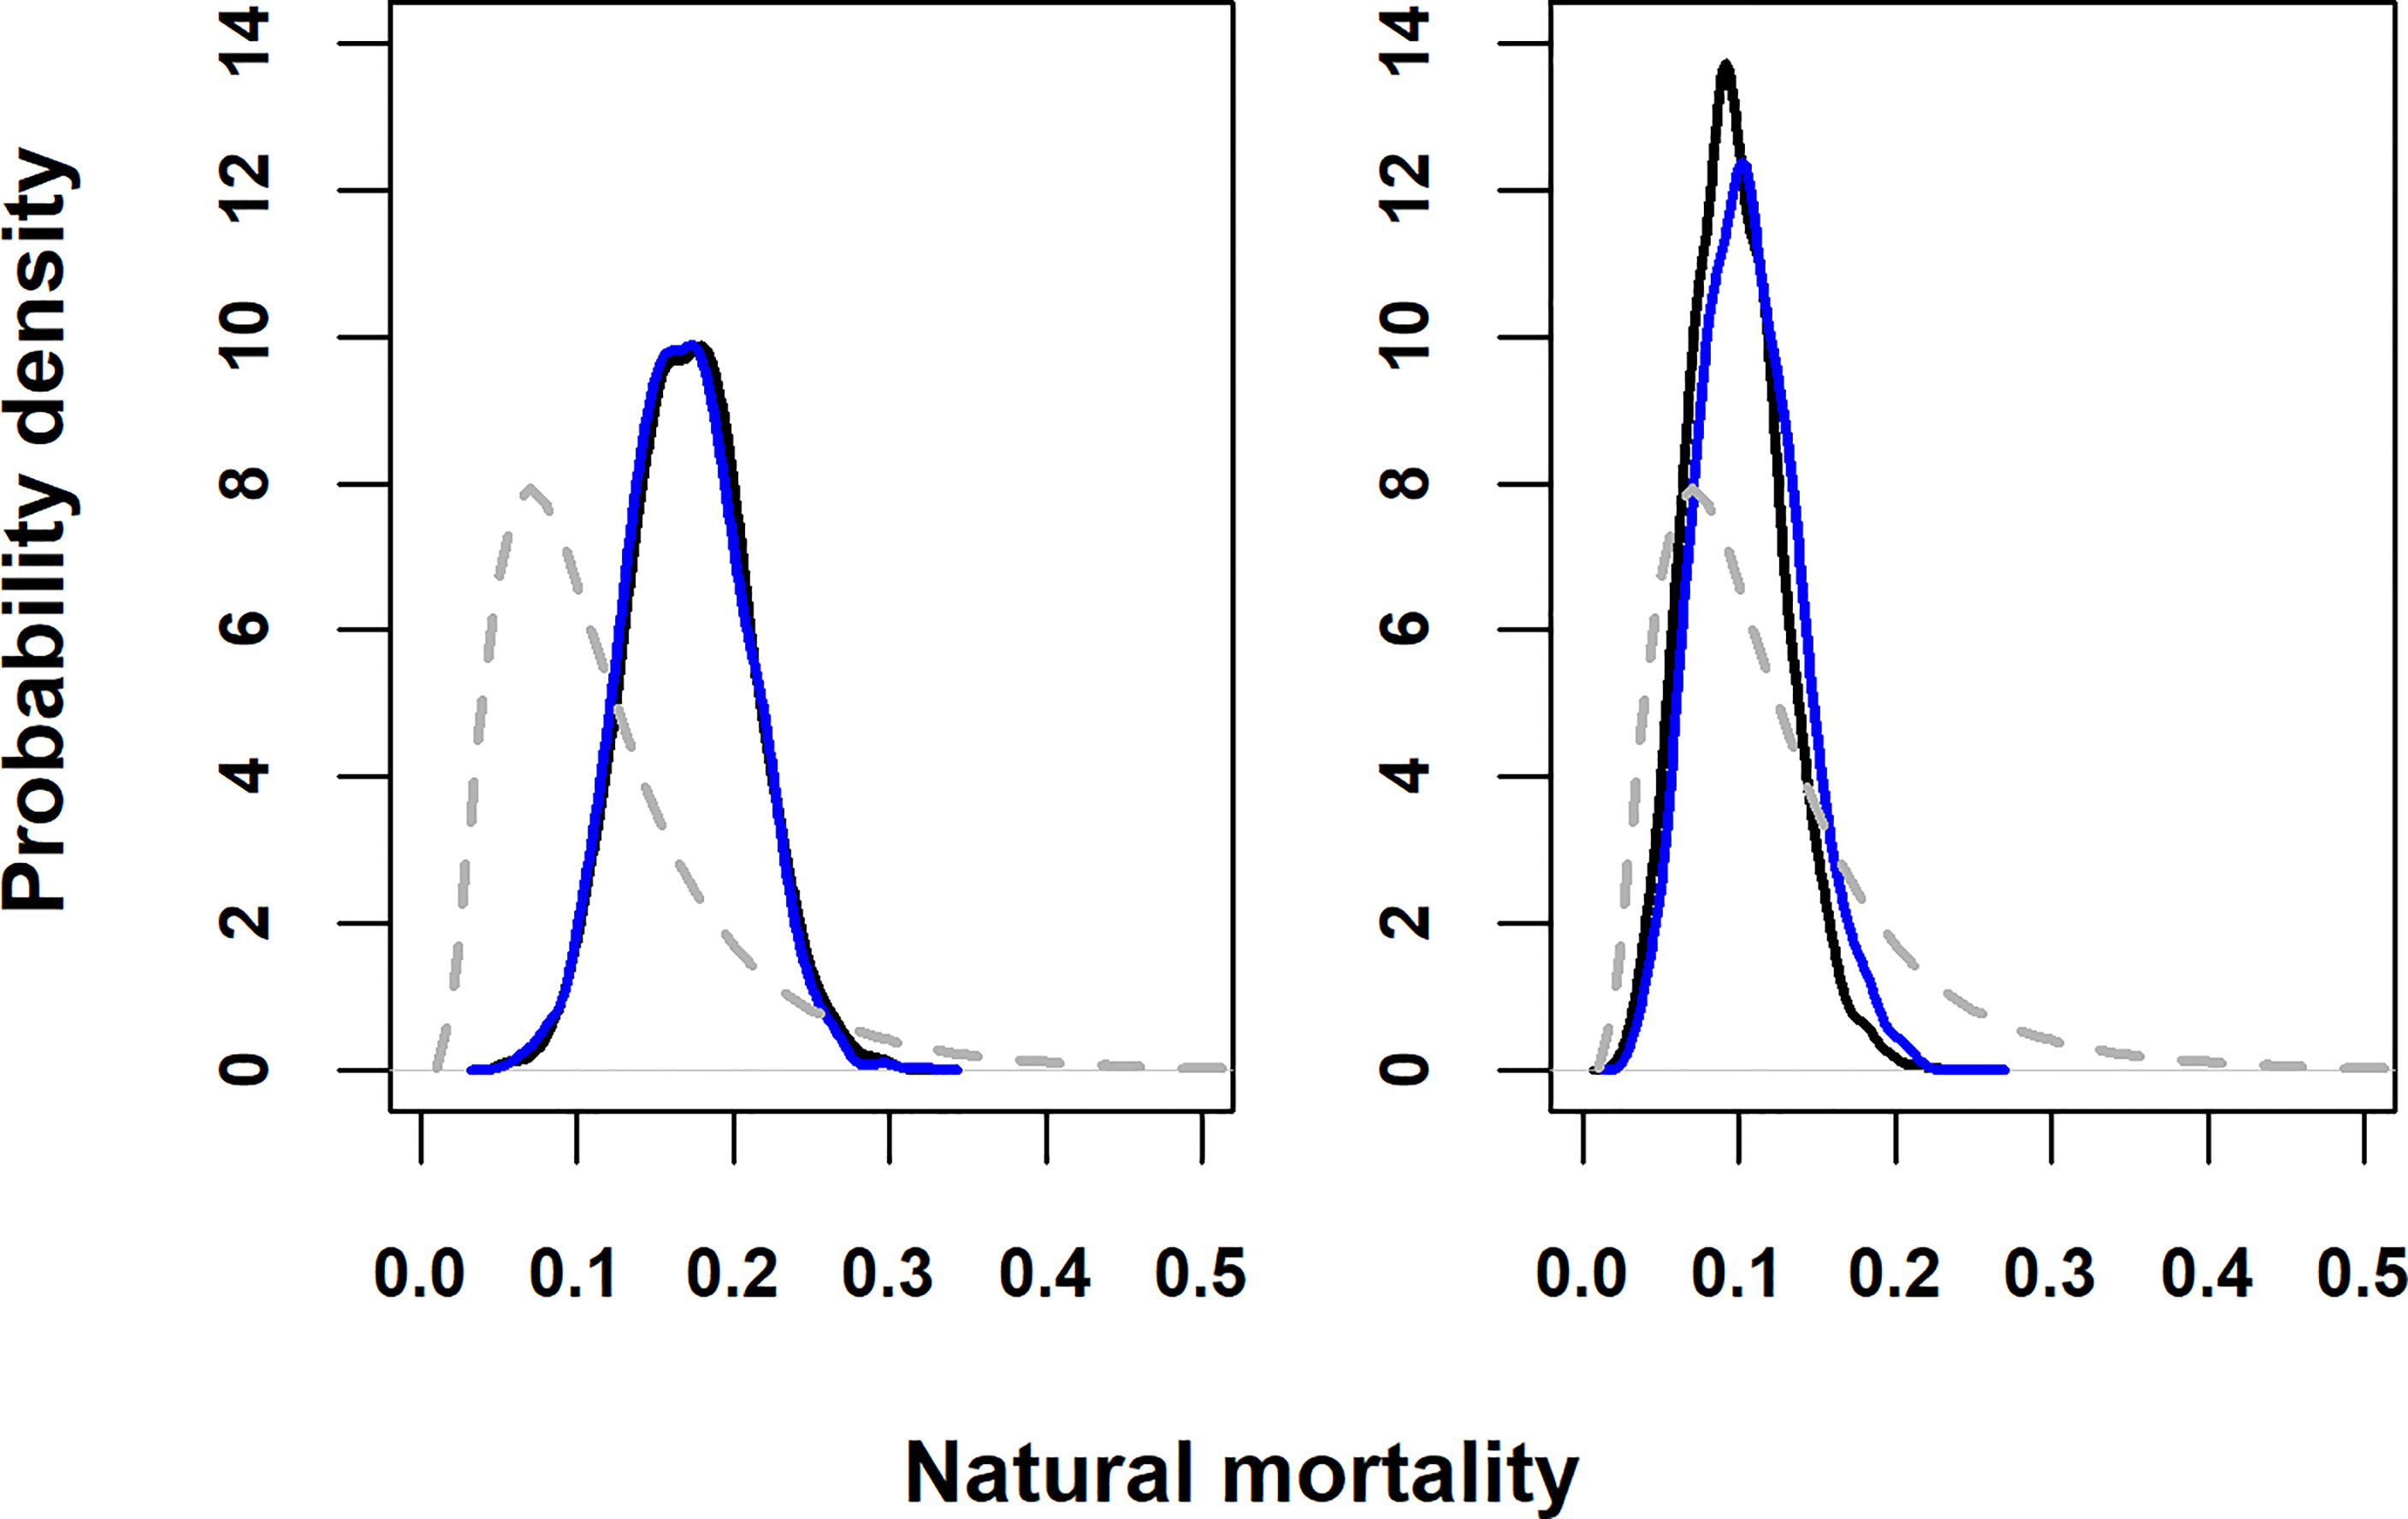
Figure 3 Prior (dashed grey line) and posterior pdfs for annual natural mortality. Solid black line, acoustic and satellite tagging data: solid blue line, acoustic tagging data only. (A) base case fishing mortality prior; (B) fishing mortality prior based on results from Kurota et al., 2009.
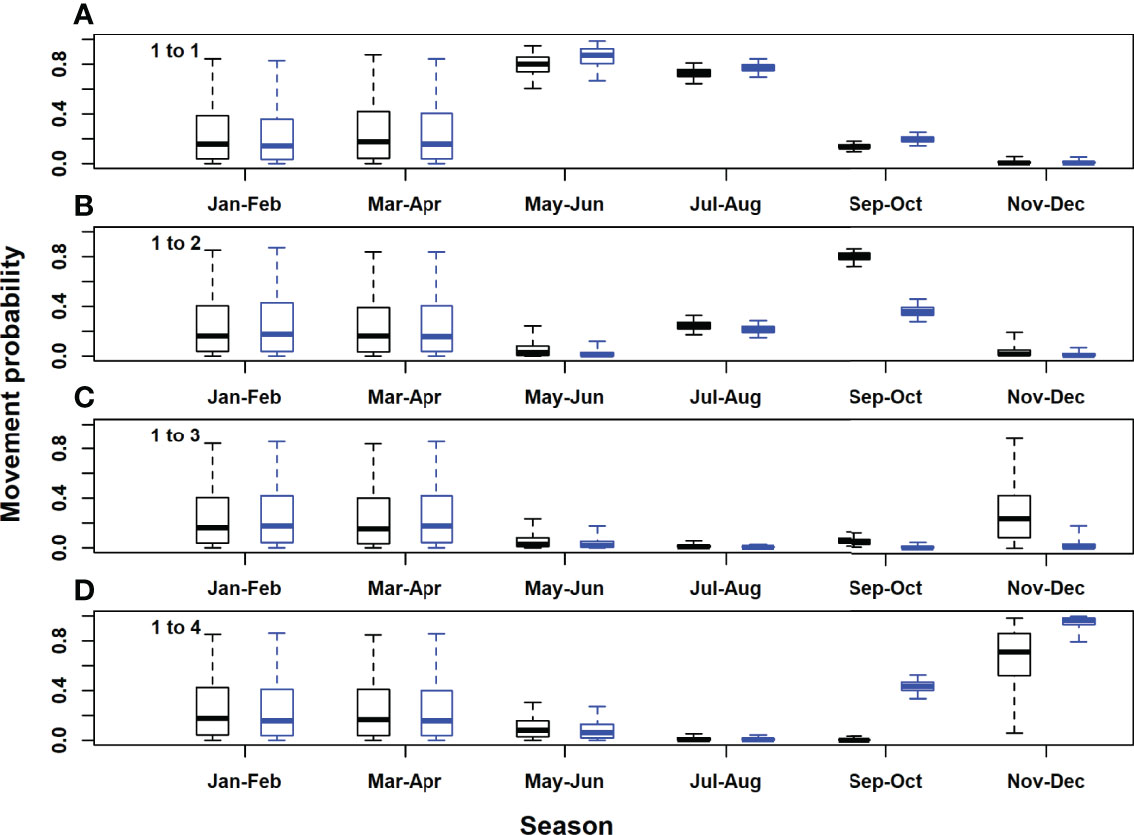
Figure 4 Figure 4 | Posterior distributions for movement rates out of the Gulf of St. Lawrence area (model area 1). Black, acoustic and satellite tagged Atlantic bluefin tuna; blue, acoustic only tagged Atlantic bluefin tuna. Horizontal lines inside each box denote medians, while the box ends denote the interquartile range. Whiskers extend to the 2.5th and 97.5th percentiles. (A), Gulf of St. Lawrence to Gulf of St. Lawrence; (B); Gulf of St. Lawrence to western Atlantic; (C), Gulf of St. Lawrence to Gulf of Mexico; (D), Gulf of St. Lawrence to eastern Atlantic and Mediterranean.
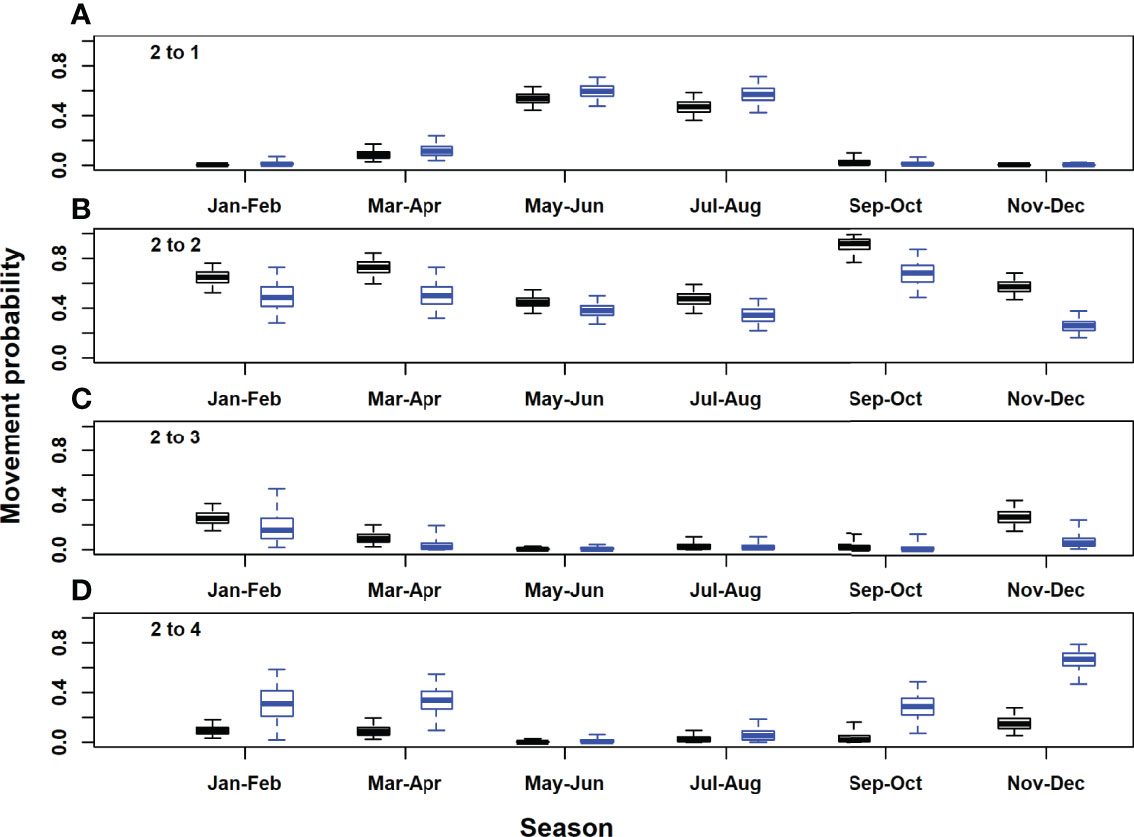
Figure 5 Posterior distributions for movement rates out of the western Atlantic area (model area 2). Black, acoustic and satellite tagged Atlantic bluefin tuna; blue, acoustic only tagged Atlantic bluefin tuna. Horizontal lines inside each box denote medians, while the box ends denote the interquartile range. Whiskers extend to the 2.5th and 97.5th percentiles. (A), western Atlantic to Gulf of St. Lawrence; (B), western Atlantic to western Atlantic; (C), western Atlantic to Gulf of Mexico; (D), western Atlantic to eastern Atlantic and Mediterranean.
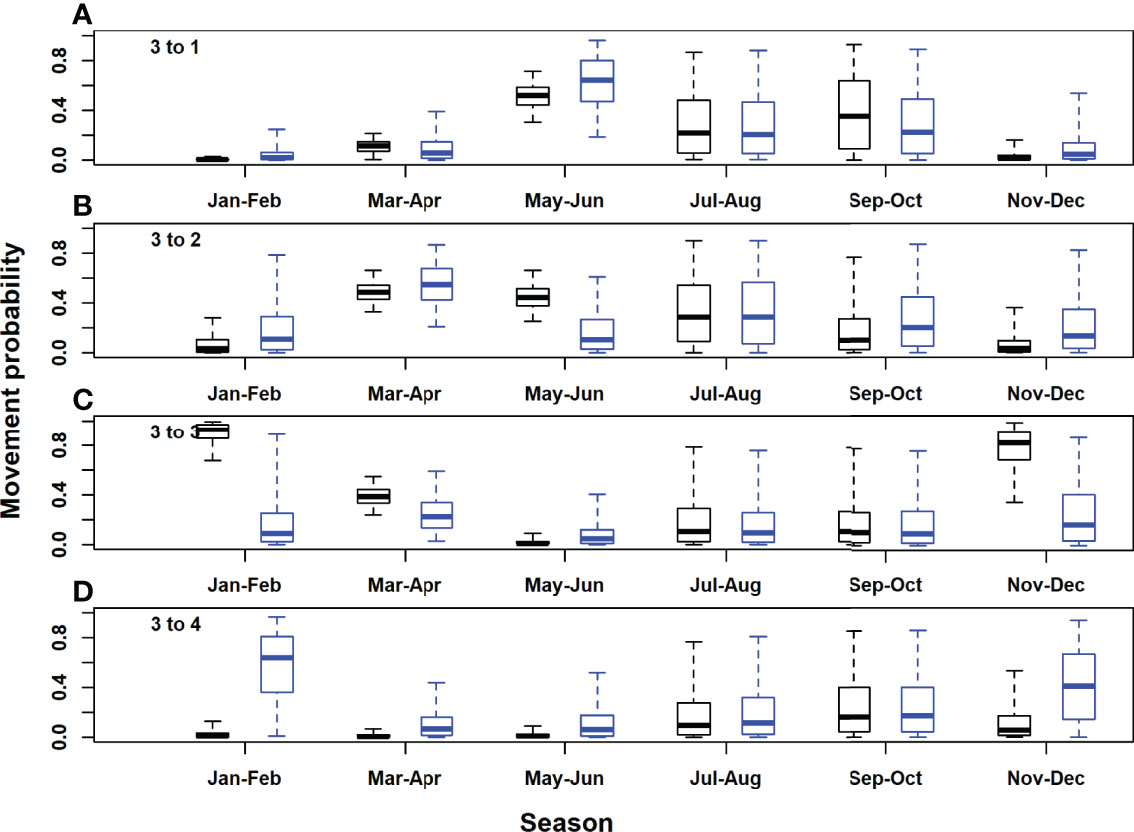
Figure 6 Posterior distributions for movement rates out of the Gulf of Mexico area (model area 3). Black, acoustic and satellite tagged Atlantic bluefin tuna; blue, acoustic only tagged Atlantic bluefin tuna. Horizontal lines inside each box denote medians, while the box ends denote the interquartile range. Whiskers extend to the 2.5th and 97.5th percentiles. (A), Gulf of Mexico to Gulf of St. Lawrence; (B), Gulf of Mexico to western Atlantic; (C), Gulf of Mexico to Gulf of Mexico; (D), Gulf of Mexico to eastern Atlantic and Mediterranean.
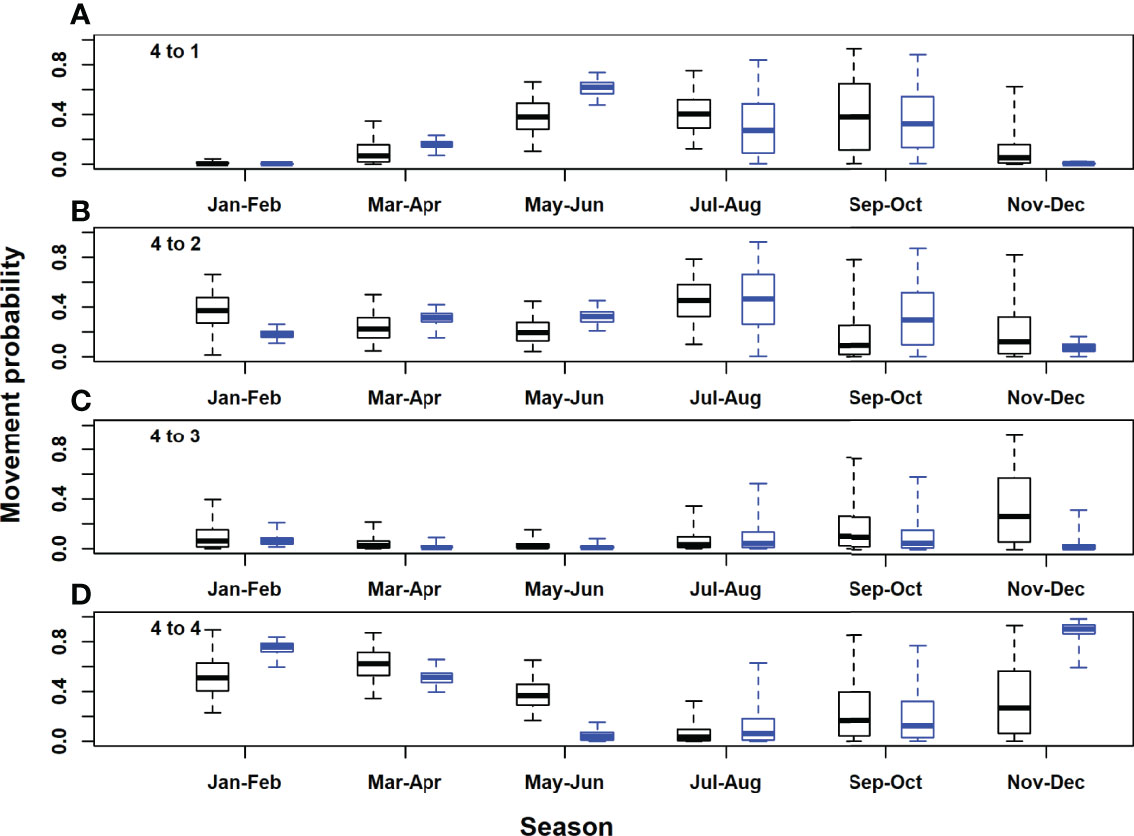
Figure 7 Posterior distributions for movement rates out of the eastern Atlantic and Mediterranean area (model area 4). Black, acoustic and satellite tagged Atlantic bluefin tuna; blue, acoustic only tagged Atlantic bluefin tuna. Horizontal lines inside each box denote medians, while the box ends denote the interquartile range. Whiskers extend to the 2.5th and 97.5th percentiles. (A), eastern Atlantic and Mediterranean to Gulf of St. Lawrence; (B), eastern Atlantic and Mediterranean to western Atlantic; (C), eastern Atlantic and Mediterranean to Gulf of Mexico; (D), eastern Atlantic and Mediterranean to eastern Atlantic and Mediterranean.
In the Gulf of St. Lawrence, the model area with the highest acoustic receiver coverage, estimates of seasonal movement rates from the model with acoustic tags only were very similar to those for both tag types combined, for most area and season combinations. However, there were some exceptions, for example, 95% posterior probability intervals did not overlap for movements to the western and eastern Atlantic in September-October (Figures 4B, D). Utilising both acoustic and satellite tagging data led to higher precision in movement rate estimates for movements originating in the western Atlantic and particularly for those originating in the Gulf of Mexico (Figures 5, 6). For movements originating in the eastern Atlantic and Mediterranean area, movement rate estimates with acoustic tagging data only generally showed higher precision during the first half of the year and in November-December, with much higher estimated residency in the eastern Atlantic area during winter (November-December).Estimated detection probabilities at acoustic receivers were much higher in the GSL box than outside (Figure 8), reflecting a higher density of receivers in this area, and the fact that tagged ABT must cross continuous receiver arrays/lines to enter and exit the GSL. Acoustic detection probabilities were estimated to have increased during the first years of the study in areas 1 and 2, reflecting increased placement of receivers in the OTN and other projects early on in the study. Estimated detection probabilities in the GSL were slightly lower from 2017 onwards. Using both acoustic and satellite tagging data, the estimated acoustic detection probabilities for the Gulf of Mexico reflected the prior in the first year of the study (2009), after which estimated posterior distributions were low for the duration of the study. In the eastern Atlantic and Mediterranean region they were updated strongly to low values between 2013 and 2020 for the model with both tag acoustic and satellite tag data, but reflected the prior to some extent at the beginning of the study. Adding satellite tagging observations to the model generally improved the precision of acoustic detection probability estimates, particularly for the Gulf of Mexico area (Figure 8). However, in the eastern Atlantic and Mediterranean area, posterior estimates from the model with acoustic tag data only were more precise than those using both data types (Figure 8).
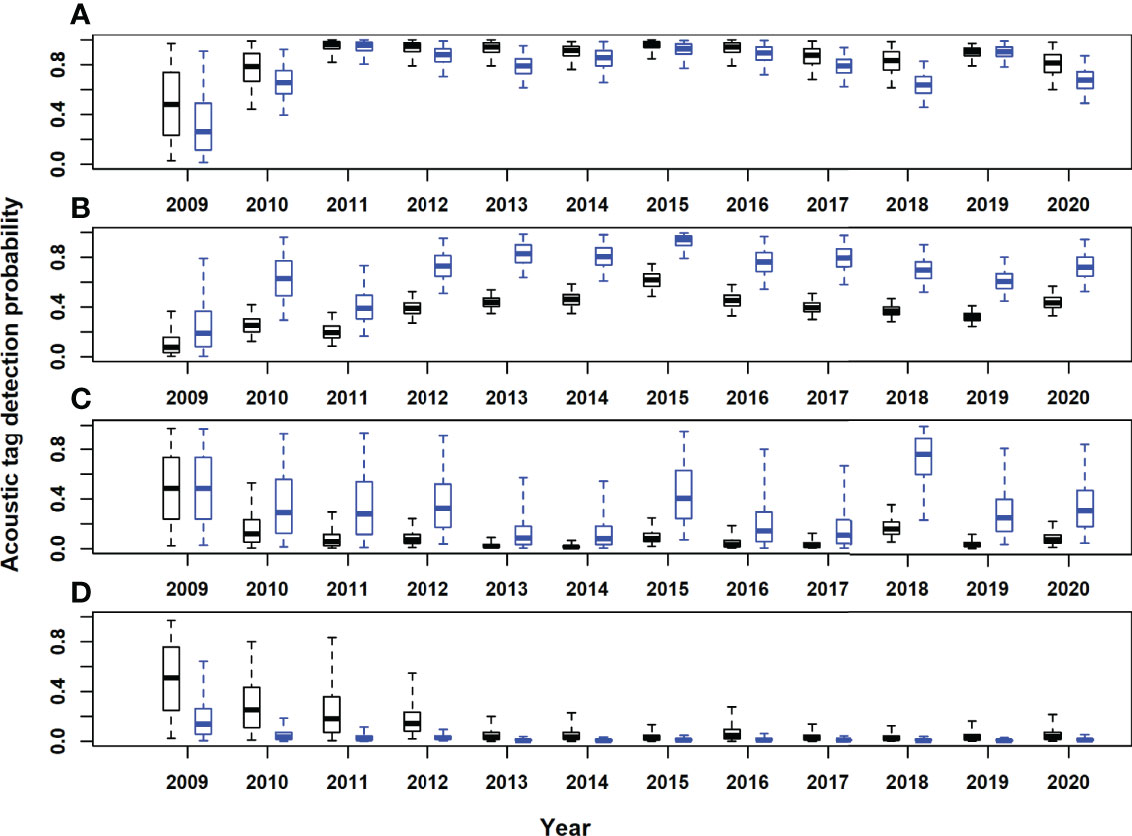
Figure 8 Posterior estimates of acoustic tag detection probabilities by year. (A)Gulf of St. Lawrence (model area 1); (B), western Atlantic (model area 2); (C), Gulf of Mexico (model area 3); (D) eastern Atlantic and Mediterranean (model area 4). Black boxes, acoustic and satellite tagging data. Blue boxes, acoustic tagging data only. Horizontal lines inside each box denote medians, while the box ends denote the interquartile range. Whiskers extend to the 2.5th and 97.5th percentile.
The estimated detection probability for satellite tags (not area-specific) was high (posterior median of 0.99, standard deviation of 0.01), reflecting the informative prior. The uninformative prior for the tag reporting rate was updated to a posterior distribution with median 0.35 and standard deviation 0.12.
In simulation studies with acoustic tags only, estimates of natural mortality were positively biased, although given the sample size of 100 tagged animals, the 95% posterior probability interval always contained the true value, regardless of the acoustic detection probability scenario (Tables 3, 4; Figures S7, S8). When acoustic detection probabilities in two of the areas were relatively high, acoustic tag detection probability estimates were on average slightly positively biased. However, this bias became very large when the acoustic tag detection probabilities were low in all areas (Table 4). Double-tagging with satellite tags reduced bias in estimates of natural mortality rates by nearly half (Tables 3, 4; Figures S7, S8). As with acoustic tags only, 95% posterior probability intervals for natural mortality from all simulations contained the true value (Tables 3, 4). Inclusion of satellite tagging data also reduced bias in estimates of acoustic tag detection probabilities, although to a lesser extent than for natural mortality and movement rates (Tables 3, 4; Figures S9, S10).
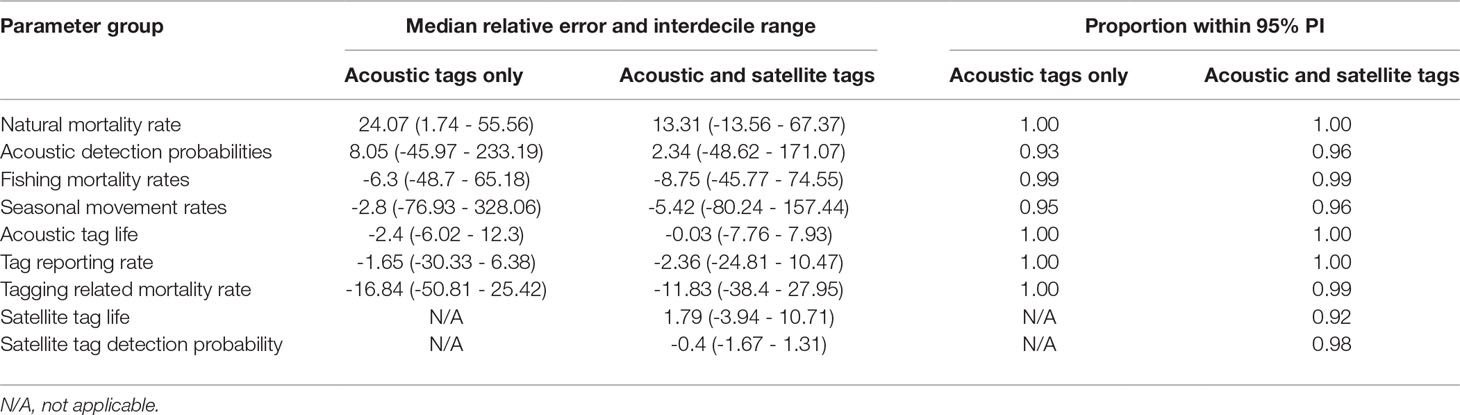
Table 3 Percent median relative error with interdecile range (inner 90th percentile) in parentheses and proportion of target parameter values with posterior 95% probability intervals, for simulated data sets with high acoustic tag detection probability in areas 1 and 2.
The median bias for fishing mortality rate was slightly negative for both tag detection scenarios. Seasonal movement rate parameter estimates showed a fairly large range of bias, with the largest biases corresponding to movements originating in area 4, as well as residency in area 3; these biases were greater in the scenario with lower acoustic tag detection probabilities (scenario 2) (Figures S1, S12). Biases in seasonal movement estimates were generally reduced by inclusion of satellite tagging data, particularly for the areas with low acoustic tag detection probabilities (Tables 3, 4; Figures S11, S12).
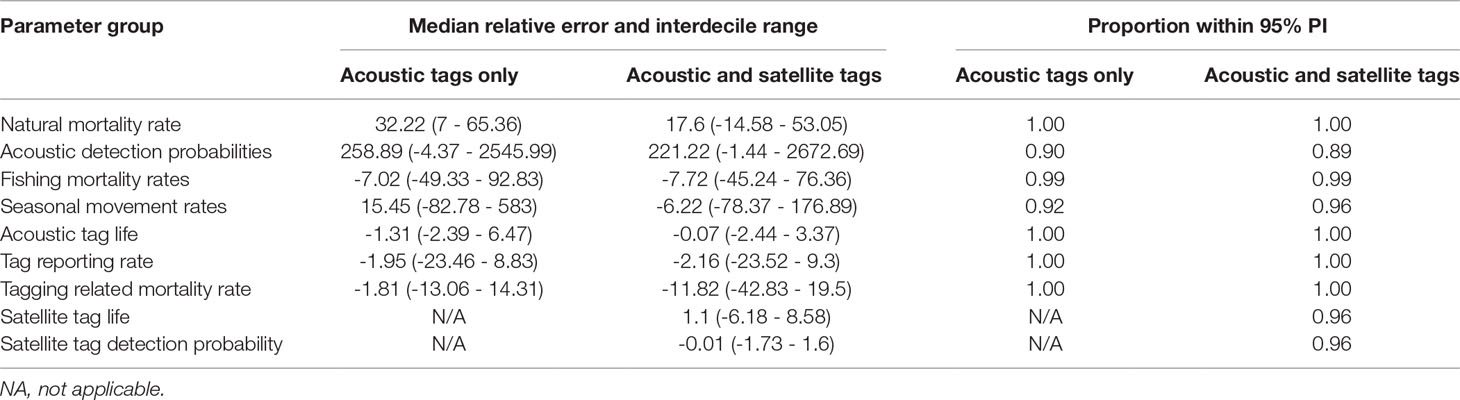
Table 4 Percent median relative error with interdecile range (inner 90th percentile) in parentheses and proportion of target parameter values with posterior 95% probability intervals, for simulated data sets with low acoustic tag detection probability in all areas.
Monitoring movements of highly migratory fish moving across large spatial scales has advanced as telemetry systems increase our capacity to study individually tagged fish. Deriving useful population dynamic model outputs from these large scale tag deployments is important for design and implementation of sustainable management regimes. In this experiment, we use two types of electronic tags to improve estimates of natural mortality on Atlantic Bluefin tuna foraging in the Gulf of St. Lawrence, Canada. Data collected in population dynamics studies such as tagging experiments often give rise to noisy output about the demographic process under investigation: in this context state-space models offer a flexible and integrated framework for model fitting. The multi-state Bayesian mark-recapture model presented above provides a robust foundation for estimating rates of survival and seasonal movement in electronically tagged ABT. Using a Bayesian approach allows incorporation of prior knowledge from other studies or sources that may be particularly advantageous in data-limited situations. For example, in this study, prior information from earlier published archival, conventional and satellite tag studies (e.g. Kurota et al., 2009; Wilson et al., 2015) was utilised for estimation of the natural mortality and tagging-related mortality rates.
Acoustic tagging methods utilized here appear to have good potential for estimation of survival rates, although for ABT, auxiliary information on tag reporting rates would help to separate fishing and natural mortality. Posterior median survival estimates (from natural causes) for Atlantic bluefin tuna (0.84 yr-1 and 0.91 yr-1 using data from both acoustic and satellite tags) suggest a relatively low rate of mortality from natural causes, consistent with the fact that two-thirds of individuals in this study had a curved fork length ≥ 250 cm at tagging (5th and 95th percentiles for length at tagging were 210cm and 293cm, respectively, corresponding approximately to age 10 years (5th percentile) and older (based on Richards growth parameters in Ailloud et al., 2017). For comparison, ICCAT uses a natural mortality rate of 0.10 yr-1 for eastern Atlantic bluefin aged 20 and older, and for western Atlantic bluefin aged 14 and over. Values used in the stock assessment are thus slightly lower than the natural mortality estimates obtained in this study under the base case F prior, and very similar for the alternative higher F prior, although rates are not directly comparable since our study includes a minority of fish younger than 14 years at tagging (~ 23% based on Richards growth parameters in Ailloud et al., 2017). The natural mortality rate estimate reported here under the base case F prior is also slightly higher than those obtained using a simpler model in Block et al., 2019. The increase in estimates of natural mortality could reflect recent influx of eastern (Mediterranean) origin fish to the study area that are then tagged but subsequently emigrate away from areas with good acoustic receiver coverage (e.g. the Gulf of St. Lawrence) for longer periods of time. Alternatively, they may reflect temporal changes in fishing mortality and/or tag reporting rates that are not picked up by the model: fishing quotas have been rising in the past few years in the regions studied and the tag reporting rate is assumed to be time invariant in our models. Finally, the model could be picking up a real decrease in underlying survival from natural causes in recent years (e.g increased predation, or an ageing population of tagged fish). Survival estimates from an age-structured model with both acoustic and satellite tagging data (results not shown) indicated higher levels of natural mortality for the oldest fish in our study (ages 21 years and older compared with ages below 20 years).Evaluation of the model with simulated data indicated that relatively unbiased estimates of survival can be obtained using both acoustic and satellite tags, and where acoustic tag detection rates are high in some model areas, as they are estimated to be in this study e.g. around the Halifax Line. This is in accordance with the findings of earlier studies demonstrating the utility of multistate mark–recapture models for generating unbiased estimates of fishing and natural mortality rates using simulated data (Hightower and Harris, 2017). In our study, the ability to obtain unbiased and precise parameter estimates was affected by the amount of data available, so that parameter estimates for areas 3 and 4 which took longer to “colonize” in the simulated data sets given releases in area 1 were both more uncertain and more biased as they reflected the prior to a larger degree. Results from the simulation study indicated that estimates of acoustic tag detection rates may be strongly biased when detection rates are very low in all modelled areas. This was associated with more (positively) biased estimates of natural mortality, although all 95% posterior probability intervals for natural mortality still contained the true value given the simulated sample size of 100 animals. The proportion of true values falling within the 95% posterior probability interval is a function of the amount of available data, although we did not evaluate at which sample size this proportion would fall below 0.95 using simulated data. For comparison, our estimates for ABT were based on 188 tagged animals.Adding simulated data from satellite tags decreased bias in estimates of acoustic tag detection rates when true detection rates were low, although not to the extent expected. This appeared to be because of confounding with other model parameters, particularly the parameters controlling the spread of the distribution for time until last tag transmission based on pre-programmed tag life. Even in the low acoustic tag detection scenario, biases when using acoustic tag data only were much higher for acoustic detection probabilities compared with other parameters, indicating potential for improving knowledge about parameters of interest using acoustic tagging data even under sub-optimal conditions. Overall, the results from the simulation study suggest that double tagging can yield improvements in the accuracy of survival rate estimates (from ~24% median relative error with single acoustic tags to ~13% when there is a high probability of acoustic tag detection in at least one model area). With uninformative priors for tag reporting rates and acoustic tag detection probabilities, we obtained positively biased estimates of natural mortality in all scenarios evaluated. It is likely that experiments to estimate electronic tag reporting rates could help to increase the accuracy of survival estimates in models such as ours by providing information that allows better separation of fishing and natural mortality.We chose to focus on what we believe to be the main reason for tag detections to cease for fish that are still alive for each tag type, namely, reaching the end of pre-programmed transmitter life for acoustic tags, and reaching the pre-programmed pop-up for satellite tags. Thus, we assume that shedding of acoustic tags with two dart attachments is negligible during the course of the experiment. Estimates of natural mortality presented above may therefore be conflated with tag shedding (acoustic tags). A single tag reporting rate is estimated for recaptures of tagged ABT (which can be thought of as corresponding mainly to the tag reporting rate for acoustic tags since a large proportion of satellite tags are expected to have released before recapture). Since tag shedding of acoustic tags is not accounted for, recaptured fish are assumed to have an acoustic tag (that may or may not be functioning). However, in reality, recaptured fish can have different combinations of tags attached, with different reporting rates for acoustic and satellite tags (e.g. depending on the reward available). These processes could be described in more detail by i) accounting for the shedding of acoustic tags in the model and ii) adding information on the number of tags still attached for recaptured fish. Although explicit modelling of the tag shedding process within the framework presented above (e.g. Block et al., 2019) could potentially improve survival estimates, it would significantly increase the state-space for the model for double tagged (acoustic and satellite tagged) ABT.The model presented in this manuscript represents one hypothesis out of many possibilities about the scales of temporal and spatial variation for model parameters. For example, we chose to estimate seasonal movement rates by two-month periods. Earlier studies using electronic tagging data have demonstrated that ABT follow predictable patterns of seasonal movement within each year (Block et al., 2001; Walli et al., 2009), and our choice aims to capture seasonal movement patterns in and out of the Gulf of St Lawrence, whilst avoiding over-parameterization. Likewise, acoustic tag detection rates are expected to differ among areas and over time (reflecting receiver placement and recruitment and loss of receivers in the study). Here, we chose to look at annual variations in acoustic detection probabilities, which seemed like an appropriate scale to capture changes in receiver deployment and avoid over-parameterization. Tag reporting rates were assumed to be time-invariant because of the relatively short study duration (12 years) and to facilitate estimation of fishing mortality rates (Kurota et al., 2009). We also assume that rates of fishing mortality vary by area, but rates of natural mortality do not (given the size of these fish, they have few predators and we do not anticipate appreciable differences in natural mortality among areas – we expect much larger spatial variations in fishing mortality than natural mortality). This is a fairly standard assumption in spatially-structured mark-recapture models (e.g. Michielsens et al., 2006; Kurota et al., 2009; Liljestrand et al., 2019). It would be desirable to evaluate a broader range of model structural hypotheses in future, but this was beyond the scope of this paper.An important future model development is to utilise newly available stock-of origin information, which could be incorporated in the model to investigate stock-specific patterns of mortality and seasonal movement as well as detection patterns (e.g. if fish from different stocks migrate along different routes and have differing probabilities to encounter acoustic receivers). Evaluating bias in parameter estimates when the assumption of equal capture probabilities using simulated data would present an interesting extension to the simulation study and would indicate whether development of a model with unequal acoustic detection probabilities for Atlantic bluefin is supported.Tracking large and highly migratory vertebrates in the oceans over long time-frames is challenging. We have demonstrated the capacity to monitor the population of a large commercially important fish species over the long-term by applying consistent techniques and maintenance of underwater receiver networks. Continuing studies as ours that provide information detailed information on spatial habitat use and ecology may become increasingly important in the light of climatic changes and potential distribution shifts (Perry et al., 2005; Poloczanska et al., 2016). Examining fine scale behavior within regions where receivers are present is also possible with additional efforts in modelling, and could provide important information on drivers of population dynamics in a changing ocean.
The data used in this article will be made available at the tagging of pelagic predators website (https://oceanview.pfeg.noaa.gov/topp/map). Codes to implement the analyses described in this article are available from the corresponding author on request.
The animal study was reviewed and approved by Stanford University Administrative Panel on Laboratory Animal Care (APLAC) (permit APLAC-10786).
BB and MS conceived and designed tagging experiments for ABT; RS and BB performed tagging of ABT; RW designed the statistical analyses with input from BB and MC. RW performed all analyses and drafted the manuscript. MC maintained databases for telemetry data and made all map figures in the manuscript. All authors contributed to editing the manuscript.
The authors declare that the research was conducted in the absence of any commercial or financial relationships that could be construed as a potential conflict of interest.
All claims expressed in this article are solely those of the authors and do not necessarily represent those of their affiliated organizations, or those of the publisher, the editors and the reviewers. Any product that may be evaluated in this article, or claim that may be made by its manufacturer, is not guaranteed or endorsed by the publisher.
Tagging of Atlantic bluefin tuna was supported by funding from Stanford University, TAG A Giant sponsors, grants from the NOAA Bluefin Tuna Research Program, and by NSERC Discovery Grant RGPIN-2017-04301 to MJWS. We thank Captains Dennis Cameron, Bernie Chisolm, Ken Chisolm, the late Steve McInnis, and all the crew and fishers for their tireless efforts catching and tagging bluefin tuna. We are grateful to Stanford University and Acadia University students, postdocs and technical staff who helped with preparation and deployment of electronic tags. We thank OTN, FACT, ACT, the US Navy, and others who maintain acoustic receivers on the eastern seaboard of North America, and graciously share detection data. We also thank the two reviewers whose comments and suggestions greatly improved the manuscript.
The Supplementary Material for this article can be found online at: https://www.frontiersin.org/articles/10.3389/fmars.2022.771547/full#supplementary-material
Ailloud L. E., Lauretta M. V., Hanke A. R., Golet W. J., Allman R. J., Siskey M. R., et al. (2017). Improving Growth Estimates for Western Atlantic Bluefin Tuna Using an Integrated Modeling Approach. Fisheries. Res. 191, 17–24. doi: 10.1016/j.fishres.2017.02.013
Arnason A. N. (1973). The Estimation of Population Size, Migration Rates and Survival in a Stratified Population. Res. Popul. Ecol. 15, 1–8. doi: 10.1007/BF02510705
Arnason A. N., Cam E. (2004). Multi–state Models: Metapopulation and Life History Analyses. Anim. biodiversity. Conserv. 27 (1), 93–95.
Auger-Méthé M., Newman K., Cole D., Empacher F., Gryba R., King A., et al. (2021). A Guide to State–Space Modeling of Ecological Time Series. Ecol. Monogr. 91 (4). doi: 10.1002/ecm.1470
Bacheler N. M., Buckel J. A., Hightower J. E., Paramore J. E., Pollock K. H. (2009). A 939 Combined Telemetry – Tag Return Approach to Estimate Fishing and Natural Mortality Rates 940 of an Estuarine Fish. Can. J. Fish. Aquat. Sci. 66 (8), 1230–1244. doi: 10.1139/F09-076
Block B. A., Dewar H., Blackwell S. B., Williams T. D., Prince E. D., Farwell C. J., et al. (2001). Migratory Movements, Depth Preferences, and Thermal Biology of Atlantic Bluefin Tuna. Science 293 (5533), 1310–1314. doi: 10.1126/science.1061197
Block B. A., Jonsen I. D., Jorgensen S. J., Winship A. J., Shaffer S. A., Bograd S. J., et al. (2011). Tracking Apex Marine Predator Movements in a Dynamic Ocean. Nature 475 (7354), 86–90. Brodiziak 2011: NMFS Scientific Publications Office (SPO) in Seattle, Washington McElreath 2020: CRC Press, Boca Raton, Florida. doi: 10.1038/nature10082
Block B. A., Whitlock R. E., Schallert R. J., Wilson S., Stokesbury M. J. W., Castleton M., et al. (2019). Estimating Natural Mortality of Atlantic Bluefin Tuna Using Acoustic Telemetry. Sci. Rep. 9, 4918. doi: 10.1038/s41598-019-40065-z
Brodziak J., Ianelli J., Lorenzen K., Methot R. D. Jr (2011). Estimating Natural Mortality in Stock Assessment Applications. U.S. Dep. Commer ( NOAA Tech. Memo), 38.
Brownie C., Anderson D. R., Burnham K. P., Robson D. S. (1985). “Statistical Inference From Band-Recovery Data — a Handbook,” in US Department of the Interior Fish and Wildlife Service, 2nd ed (Washington, D.C: Resource Publ), 156.
Burnham K. P., Anderson D. R. (2004). Multimodel Inference: Understanding AIC and BIC in Model Selection. Sociological. Methods Res. 33 (2), 261–304. doi: 10.1177/0049124104268644
Byrne M. E., Cortés E., Vaudo J. J., Harvey G. C. M., Sampson M., Wetherbee B. M., et al. (2017). Satellite Telemetry Reveals Higher Fishing Mortality Rates Than Previously Estimated, Suggesting Overfishing of an Apex Marine Predator. Proc. R. Soc B. 2841860, 20170658. doi: 10.1098/rspb.2017.0658
Clark W. G. (1999). Effects of an Erroneous Natural Mortality Rate on a Simple Age-Structured Stock Assessment. Can. J. Fish. Aquat. Sci. 56 (10), 1721–1731. doi: 10.1139/cjfas-56-10-1721
Clark J. S. (2005). Why Environmental Scientists are Becoming Bayesians. Ecol. Lett. 8, 2–14. doi: 10.1111/j.1461-0248.2004.00702.x
Cooke S. J., Hogan Z. S., Butcher P. A., Stokesbury M. J., Hinch S. G., Fisk A. T., et al. (2012). Ocean Tracking Network Canada: A Network Approach to Addressing Critical Issues in Fisheries and Resource Management With Implications for Ocean Governance. Fisheries 36, 583–592. doi: 10.1080/03632415.2011.633464
Denwood M. (2016). Runjags: An R Package Providing Interface Utilities, Model Templates, Parallel Computing Methods and Additional Distributions for MCMC Models in JAGS. J. Stat. software. 71 (1), 1–25. doi: 10.18637/jss.v071.i09
de Valpine P., Hastings A. (2002). Fitting Population Models Incorporating Process Noise and Observation Error. Ecol. Monogr. 72 (1), 57–76. doi: 10.1890/0012-9615(2002)072[0057:FPMIPN]2.0.CO;2
de Valpine P., Turek D., Paciorek C., Anderson-Bergman C., Temple Lang D., Bodik R. (2017). Programming With Models: Writing Statistical Algorithms for General Model Structures With NIMBLE. J. Comput. Graphical Stat 26, 403–413. doi: 10.1080/10618600.2016.1172487
Dudgeon C. L., Pollock K. H., Braccini J. M., Semmens J. M., Barnett A. (2015). Integrating Acoustic Telemetry Into Mark–Recapture Models to Improve the Precision of Apparent Survival and Abundance Estimates. Oecologia 178 (3), 761–772. doi: 10.1007/s00442-015-3280-z
Gelman A., Rubin D. B. (1992). Inference From Iterative Simulation Using Multiple Sequences. Stat. Sci. 7, 457–511. doi: 10.1214/ss/1177011136
Gimenez O., Rossi V., Choquet R., Dehais C., Doris B., Varella H., et al. (2007). State-Space Modelling of Data on Marked Individuals. Ecol. Model. 206, 431–438. doi: 10.1016/j.ecolmodel.2007.03.040
Harcourt R., Sequeira A. M., Zhang X., Roquet F., Komatsu K., Heupel M., et al. (2019). Animal-Borne Telemetry: An Integral Component of the Ocean Observing Toolkit. Front. Mar. Sci. 6, 326. doi: 10.3389/fmars.2019.00326
Hightower J. E., Harris J. E. (2017). Estimating Fish Mortality Rates Using Telemetry and Multistate Models. Fisheries 42 (4), 210–219. doi: 10.1080/03632415.2017.1276347
Hightower J. E., Jackson J. R., Pollock K. H. (2001). Use of Telemetry Methods to Estimate Natural and Fishing Mortality of Striped Bass in Lake Gaston, North Carolina. Trans. Am. Fish. Soc. 130 (4), 557–567. doi: 10.1577/1548-8659(2001)130<0557:UOTMTE>2.0.CO;2
Hoenig J. M., Barrowman N. J., Hearn W. S., Pollock K. H. (1998). Multiyear Tagging Studies Incorporating Fishing Effort Data. Can. J. Fish. Aquat. Sci. 55 (6), 1466–1476. doi: 10.1139/cjfas-55-6-1466
Hussey N. E., Kessel S. T., Aarestrup K., Cooke S. J., Cowley P. D., Fisk A. T., et al. (2015). Aquatic Animal Telemetry: A Panoramic Window Into the Underwater World. Science 348 (6240). doi: 10.1126/science.1255642
ICCAT (2008). Report of the 2008 Atlantic Bluefin Tuna Stock Assessment Session (Madrid: International Commission for the Conservation of Atlantic Tunas), 247 p.
ICCAT (2010). Report of the 2010 Atlantic Bluefin Tuna Stock Assessment Session (Madrid: International Commission for the Conservation of Atlantic Tunas), 132 p.
ICCAT (2017). Report of the 2017 ICCAT Bluefin Tuna Stock Assessment Meeting (Madrid: International Commission for the Conservation of Atlantic Tunas), 106 p.
Kéry M., Schaub M. (2012). Bayesian Population Analysis Using WinBUGS: A Hierarchical Perspective. (Waltham, MA: Academic Press) .
Kurota H., McAllister M. K., Lawson G. L., Nogueira J. I., Teo S. L., Block B. A. (2009). A Sequential Bayesian Methodology to Estimate Movement and Exploitation Rates Using Electronic and Conventional Tag Data: Application to Atlantic Bluefin Tuna (Thunnus Thynnus). Can. J. Fish. Aquat. Sci. 66, 321–342. doi: 10.1139/F08-197
Lebreton J. D., Cefe R. P. (2002). Multistate Recapture Models: Modelling Incomplete Individual Histories. J. Appl. Stat. 29 (1-4), 353–369. doi: 10.1080/02664760120108638
Lecomte J. B., Le Pape O., Baillif H., Nevoux M., Vermard Y., Savina M., et al. (2020). State-Space Modeling of Multidecadal Mark–Recapture Data Reveals Low Adult Dispersal in a Nursery-Dependent Fish Metapopulation. Can. J. Fisheries. Aquat. Sci. 77 (2), 342–354. doi: 10.1139/cjfas-2019-0037
Lennox R. J., Aarestrup K., Cooke S. J., Cowley P. D., Deng Z. D., Fisk A. T., et al. (2017). Envisioning the Future of Aquatic Animal Tracking: Technology, Science, and Application. BioScience 67 (10), 884–896. doi: 10.1093/biosci/bix098
Liljestrand E. M., Wilberg M. J., Schueller A. M. (2019). Estimation of Movement and Mortality of Atlantic Menhaden During 1966–1969 Using a Bayesian Multi-State Mark-Recovery Model. Fisheries. Res. 210, 204–213. doi: 10.1016/j.fishres.2018.10.015
McElreath R. (2020). Statistical Rethinking: A Bayesian Course With Examples in R and Stan ( Chapman and Hall/CRC).
Michielsens C. G., McAllister M. K., Kuikka S., Pakarinen T., Karlsson L., Romakkaniemi A., et al. (2006). A Bayesian State Space Mark Recapture Model to Estimate Exploitation Rates in Mixed-Stock Fisheries. Can. J. Fisheries. Aquat. Sci. 63 (2), 321–334. doi: 10.1139/f05-215
Newman K., King R., Elvira V., de Valpine P., McCrea R. S., Morgan B. J. (2022). State-Space Models for Ecological Time Series Data: Practical Model-Fitting. Methods Ecol. Evol. doi: 10.1111/2041-210X.13833
O’Dor R.K., Stokesbury M. J., (2009). The Ocean Tracking Network–adding marine animal movements to the global ocean observing system. In Tagging and tracking of marine animals with electronic devices (pp. 91–100). Springer, Dordrecht.
Pedersen M. W., Weng K. C. (2013). Estimating Individual Animal Movement From Observation Networks. Methods Ecol. Evol. 4 (10), 920–929. doi: 10.1111/2041-210X.12086
Perry A. L., Low P. J., Ellis J. R., Reynolds J. D. (2005). Climate Change and Distribution Shifts in Marine Fishes. Science 308 (5730), 1912–1915. doi: 10.1126/science.1111322
Pollock K. H. (1991). Modeling Capture, Recapture, and Removal Statistics for Estimation of Demographic Parameters for Fish and Wildlife Populations: Past, Present, and Future. J. Am. Stat. Assoc. 86 (413), 225–238.
Pollock K. H., Jiang H., Hightower J. E. (2004). Combining Telemetry and Fisheries Tagging Models to Estimate Fishing and Natural Mortality Rates. Trans. Am. Fish. Soc. 133 (3), 639–648. doi: 10.1577/T03-029.1
Poloczanska E. S., Burrows M. T., Brown C. J., García Molinos J., Halpern B. S., Hoegh-Guldberg O., et al. (2016). Responses of Marine Organisms to Climate Change Across Oceans. Front. Mar. Sci. 62. doi: 10.3389/fmars.2016.00062
Porch C. E. (2005). The Sustainability of Western Atlantic Bluefin Tuna: A Warm Blooded Fish in Hot-Blooded Fishery. Bull. Mar. Sci. 76, 363–384.
Porch C. E., Bonhommeau S., Diaz G. A., Arrizabalaga H., Melvin G. (2019). “The Journey From Overfishing to Sustainability for Atlantic Bluefin Tuna, Thunnus Thynnus,” in The Future of Bluefin Tunas: Ecology, Fisheries Management, and Conservation, 3-44. Ed. Block B. (Baltimore: John Hopkins University Press).
Pradel R. (2005). Multievent: An Extension of Multistate Capture–Recapture Models to Uncertain States. Biometrics 61 (2), 442–447. doi: 10.1111/j.1541-0420.2005.00318.x
Raabe J. K., Gardner B., Hightower J. E. (2014). A Spatial Capture–Recapture Model to Estimate Fish Survival and Location From Linear Continuous Monitoring Arrays. Can. J. Fisheries. Aquat. Sci. 71 (1), 120–130. doi: 10.1139/cjfas-2013-0198
Royle J. A. (2008). Modeling Individual Effects in the Cormack–Jolly–Seber Model: A State–Space Formulation. Biometrics 64 (2), 364–370. doi: 10.1111/j.1541-0420.2007.00891.x
Scheffel T. K., Hightower J. E., Buckel J. A., Krause J. R., Scharf F. S. (2019). Coupling Acoustic Tracking With Conventional Tag Returns to Estimate Mortality for a Coastal Flatfish With High Rates of Emigration. Can. J. Fish. Aquat. Sci. 77 (1), 1–22. doi: 10.1139/cjfas-2018-0174
Schwarz C. J., Schweigert J. F., Arnason A. N. (1993). Estimating Migration Rates Using Tag-Recovery Data. Biometrics 49, 177–193. doi: 10.2307/2532612
Sibert J. R., Hampton J., Fournier D. A., Bills P. J. (1999). An Advection–Diffusion–Reaction Model for the Estimation of Fish Movement Parameters From Tagging Data, With Application to Skipjack Tuna (Katsuwonus Pelamis). Can. J. Fish. Aquat. Sci. 56 (6), 925–938. doi: 10.1139/f99-017
Valpine P., McCrea R. S., Morgan B. J. T. (2022). Statespace Models for Ecological Time-Series Data: Practical Model-Fitting. Methods Ecol. Evol. 00, 1–17. doi: 10.1111/2041-210X.13833
Villegas-Ríos D., Freitas C., Moland E., Thorbjørnsen S. H., Olsen E. M. (2020). Inferring Individual Fate From Aquatic Acoustic Telemetry Data. Methods Ecol. Evol. 11 (10), 1186–1198. doi: 10.1111/2041-210X.13446
Walli A., Teo S. L., Boustany A., Farwell C. J., Williams T., Dewar H., et al. (2009). Seasonal Movements, Aggregations and Diving Behavior of Atlantic Bluefin Tuna (Thunnus Thynnus) Revealed With Archival Tags. PLos One 4 (7), e6151. doi: 10.1371/journal.pone.0006151
Watanabe S. (2010). Asymptotic Equivalence of Bayes Cross Validation and Widely Applicable Information Criterion in Singular Learning Theory. J. Mach. Learn. Res. 11, 3571–3594. doi: 10.48550/arXiv.1004.2316
Whoriskey K., Martins E. G., Auger-Méthé M., Gutowsky L. F., Lennox R. J., Cooke S. J., et al. (2019). Current and Emerging Statistical Techniques for Aquatic Telemetry Data: A Guide to Analysing Spatially Discrete Animal Detections. Methods Ecol. Evol. 10 (7), 935–948. doi: 10.1111/2041-210X.13188
Williams E. H. (2002). The Effects of Unaccounted Discards and Misspecified Natural Mortality on Harvest Policies Based on Estimates of Spawner Per Recruit. N. Am. J. Fish. Manage 22 (1), 311–325. doi: 10.1577/1548-8675(2002)022<0311:TEOUDA>2.0.CO;2
Wilson S. G., Jonsen I. D., Schallert R. J., Ganong J. E., Castleton M. R., Spares A. D., et al. (2015). Tracking the Fidelity of Atlantic Bluefin Tuna Released in Canadian Waters to the Gulf of Mexico Spawning Grounds. Can. J. Fisheries. Aquat. Sci. 72 (11), 1700–1717. doi: 10.1139/cjfas-2015-0110
Keywords: sustainable management, conservation, acoustic telemetry, mark-recapture, multistate models, Atlantic bluefin tuna, population monitoring
Citation: Whitlock R, Schallert RJ, Stokesbury MJW, Castleton M and Block BA (2022) Informing Management of Atlantic Bluefin Tuna Using Telemetry Data. Front. Mar. Sci. 9:771547. doi: 10.3389/fmars.2022.771547
Received: 06 September 2021; Accepted: 02 June 2022;
Published: 20 September 2022.
Edited by:
Vitor H. Paiva, University of Coimbra, PortugalReviewed by:
Christopher Holbrook, United States Geological Survey, United StatesCopyright © 2022 Whitlock, Schallert, Stokesbury, Castleton and Block. This is an open-access article distributed under the terms of the Creative Commons Attribution License (CC BY). The use, distribution or reproduction in other forums is permitted, provided the original author(s) and the copyright owner(s) are credited and that the original publication in this journal is cited, in accordance with accepted academic practice. No use, distribution or reproduction is permitted which does not comply with these terms.
*Correspondence: Rebecca Whitlock, cmViZWNjYS53aGl0bG9ja0BzbHUuc2U=
Disclaimer: All claims expressed in this article are solely those of the authors and do not necessarily represent those of their affiliated organizations, or those of the publisher, the editors and the reviewers. Any product that may be evaluated in this article or claim that may be made by its manufacturer is not guaranteed or endorsed by the publisher.
Research integrity at Frontiers
Learn more about the work of our research integrity team to safeguard the quality of each article we publish.