- 1State Key Laboratory of Estuarine and Coastal Research, East China Normal University, Shanghai, China
- 2School of Oceanography, Shanghai Jiao Tong University, Shanghai, China
- 3CAS Key Laboratory of Tropical Marine Bio-resources and Ecology, South China Sea Institute of Oceanology, Chinese Academy of Sciences, Guangzhou, China
- 4Hainan Key Laboratory of Tropical Marine Biotechnology, Tropical Marine Biological Research Station in Hainan, Chinese Academy of Sciences, Sanya, China
- 5South China Sea Marine Survey and Technology Center, Ministry of Natural Resources, Guangzhou, China
- 6University of Chinese Academy of Sciences, Beijing, China
Corals rely on a symbiotic relationship with algae (zooxanthellae), which reside in the host tissue and play a critical role for host metabolism through photosynthesis, respiration, carbon translocation, and calcification. These processes affect coral reefs on different scales from cellular to organismal and ecosystem levels. A process-based dynamic model was developed and coupled with a one-dimensional (1-D) biogeochemical model to describe coral photosynthesis, respiration, and carbon translocation at the cellular level, calcification and ion transport in different coral polyp components (i.e., coelenteron, calcifying fluid) at the organismal level; and the exchange of material between corals and the ambient seawater at the ecosystem level. Major processes controlling the carbon budget in internal symbiosis were identified. For the symbiont, photosynthesis is the primary carbon source and translocation to the host is the major sink. For the host, most of the carbon translocated from the symbiont is lost through mucus leakage. In the host dissolved inorganic carbon (DIC) pool, most of the carbon is obtained from the surrounding seawater through uptake; photosynthesis and calcification are the major sinks of DIC. Based on a series of scenario studies, the model produced increase of photosynthesis rate with decline of calcification rate under higher air pCO2 and associated carbonate chemistry variabilities in different polyp components. The model results support the hypothesis that elevated pCO2 stimulates photosynthesis, resulting in a reduced supply of DIC to calcification. Such coupled models allow the exploration of process-based mechanisms, complementing laboratory and field studies.
1 Introduction
Coral reefs are unique coastal ecosystems that are largely distributed in shallow tropical and sub-tropical seas. Coral reefs rival their terrestrial counterparts in both biodiversity and productivity, and have been described as the version of the ocean of a tropical rain forest (Morrison et al., 2013). The coral symbiosis system includes calcifying coral animals and their algal symbionts, which together are able to thrive in nutrient-deficient oceanic waters (Falkowski et al., 1984; Frankowiak et al., 2016). The main players in the symbiosis are the heterotrophic animal, scleractinian (“reef-building”) corals, and unicellular dinoflagellate algae of the genus Symbiodinium (“zooxanthellae”). Scleractinian corals from colonies of polyps are linked by a common gastrovascular system, with living tissues of a few millimeters in thickness calcified by calcium carbonate (CaCO3). This coral-zooxanthellae symbiosis involves nutrient recycling and allows algal photosynthesis, which provides organic carbon that fuels animal metabolism and growth, and as a result, leads to evolutionary success (Frankowiak et al., 2016).
Coral reef ecosystems are experiencing increasing pressure from various anthropogenic perturbations worldwide, namely, ocean warming and acidification (Hoegh–Guldberg et al., 2007). The increasing concentrations in air and seawater CO2, and a corresponding decrease in pH have lowered coral calcification rates (Andersson et al., 2015). The observed and projected decrease in corals can have a global influence by altering the oceanic and atmospheric CO2 processes (Eyre et al., 2018; Kline et al., 2019). Understanding the tightly coupled feedback between water column chemistry and benthic coral reef metabolic processes is one of the challenges for projecting coral reef responses to ocean acidification at the ecosystem level (Shaw et al., 2015).
Photosynthesis/respiration and calcification/calcium carbonate dissolution are the two main important biochemical processes that influence the carbon cycle in the coral reef ecosystem. Heterotrophy plays a significant role in coral skeletal growth by enhancing the calcification and supply of metabolic inorganic carbon (Furla et al., 2000). In reef waters, numerous symbiotic coral species can absorb dissolved organic carbon (DOC) (Hoegh–Guldberg and Williamson, 1999) released by benthic alga photosynthesis and decomposition of POC (Zlotnik and Dubinsky, 1989; Mueller et al., 2014). Additionally, healthy corals are typically net producers of DOC via the release of mucus and/or dissolved organic materials that account for losses of 5–45% of photosynthetically fixed C (Crossland et al., 1980). Among these metabolic processes experienced by coral, photosynthesis and respiration drive the internal inorganic and organic carbon fluxes between the symbiont and host coral animals at the cellular level. Meanwhile, ion transport among different coral polyp components, host animal feeding and coral calcification occurs at the organismal level. The ecosystem level processes include the exchange of material between the coral community and the ambient seawater and also air–sea CO2 interactions at the sea surface (Gattuso et al., 1999). Considering the different types and scales of metabolic processes in a coral reef community, it is essential to develop a better approach to quantify the associated energy fluxes, and assess their feedbacks to environment change.
Given that many different processes co-exist in coral reef ecosystems, numerical modeling is an effective way to investigate processes at each level of the ecosystem and to link these processes, allowing the simulation of coral reef systems under various environmental conditions. Earlier studies have attempted to quantify the symbiotic system mass and energy budgets using isotopic tracers with in situ measurements of carbon budget in photosynthesis, respiration, growth, and mucus and skeletal production (Falkowski et al., 1984; Muscatine, 1990; Falkowski et al., 1993; Pupier et al., 2019). Cunning et al. (2017) used a dynamic bioenergetic model for the coral-symbiont system and showed that the balance of autotrophic and heterotrophic nitrogen sources affects the steady state of the symbiotic system. Numerical models have also been used to understand the physiological processes leading to thermal coral bleaching by studying photoinhibition and oxidative stress in zooxanthellae at the cellular level (Gustafsson et al., 2013; Gustafsson et al., 2014). Baird et al. (2018) nested process-based coral-symbiont models within biogeochemical/ecosystem models that considered temperature-mediated light-driven oxidative stress with the mechanistic representation of environmental forcing. Nakamura et al. (2013) used a coral polyp model to study the response of coral photosynthesis, respiration, and calcification at the organismal level. This coral polyp model was then coupled with a three-dimensional (3-D) hydrodynamic model to evaluate reef-scale coral calcification responses to ocean acidification and sea-level rise (Nakamura et al., 2018). Calcification models based on the coral polyp model (organismal level) have been developed to describe ion transport through epithelial cells via the transcellular pathway and intercellular transport through the paracellular pathway (Hohn and Merico, 2012; Hohn and Merico, 2015). These models have been used to scrutinize the day–night CO2 system changes in the coral tissue, coelenteron, and calcifying fluid and have confirmed the importance of the different ion pathways under the scenario of ocean acidification. While many models have been developed, none have integrated the complexity across all scales in the coral reef system, which is essential to diagnose the stability of coral symbiosis.
The overarching goal of this research is to develop a model capable of simulating energy pathway at different scales in coral reef ecosystems (i.e., cellular, organismal, and ecosystem levels). We use this coupled model for the simulations of coral photosynthesis, respiration, calcification, heterotrophy feeding, mucus release, and associated carbon fluxes in symbiont cells and host cells. We also can check the carbonate chemistry (dissolved inorganic carbon (DIC), total alkalinity (TA), pH) statues in polyp components. The most important objective of this study is to evaluate the coral symbiotic system feedbacks for different atmospheric pCO2 scenarios. To meet these objectives, this study includes the following components:
1. Build a process-based cellular module that describes coral-symbiont metabolism activities at the cellular level,
2. Build a coral polyp module to calculate ion transfer in the polyp, calcification, and flux exchanges among different coral polyp components,
3. Couple the above modules into ocean biogeochemical model, where the environmental parameters (i.e., light, temperature, currents, air pCO2) and coral autotrophy and heterotrophy energy sources (i.e., DIC, DIN, and DOC) are provided. By doing so, we could examine the coral symbiosis feedback for different air pCO2 through sensitivity test runs.
2 Model Configuration
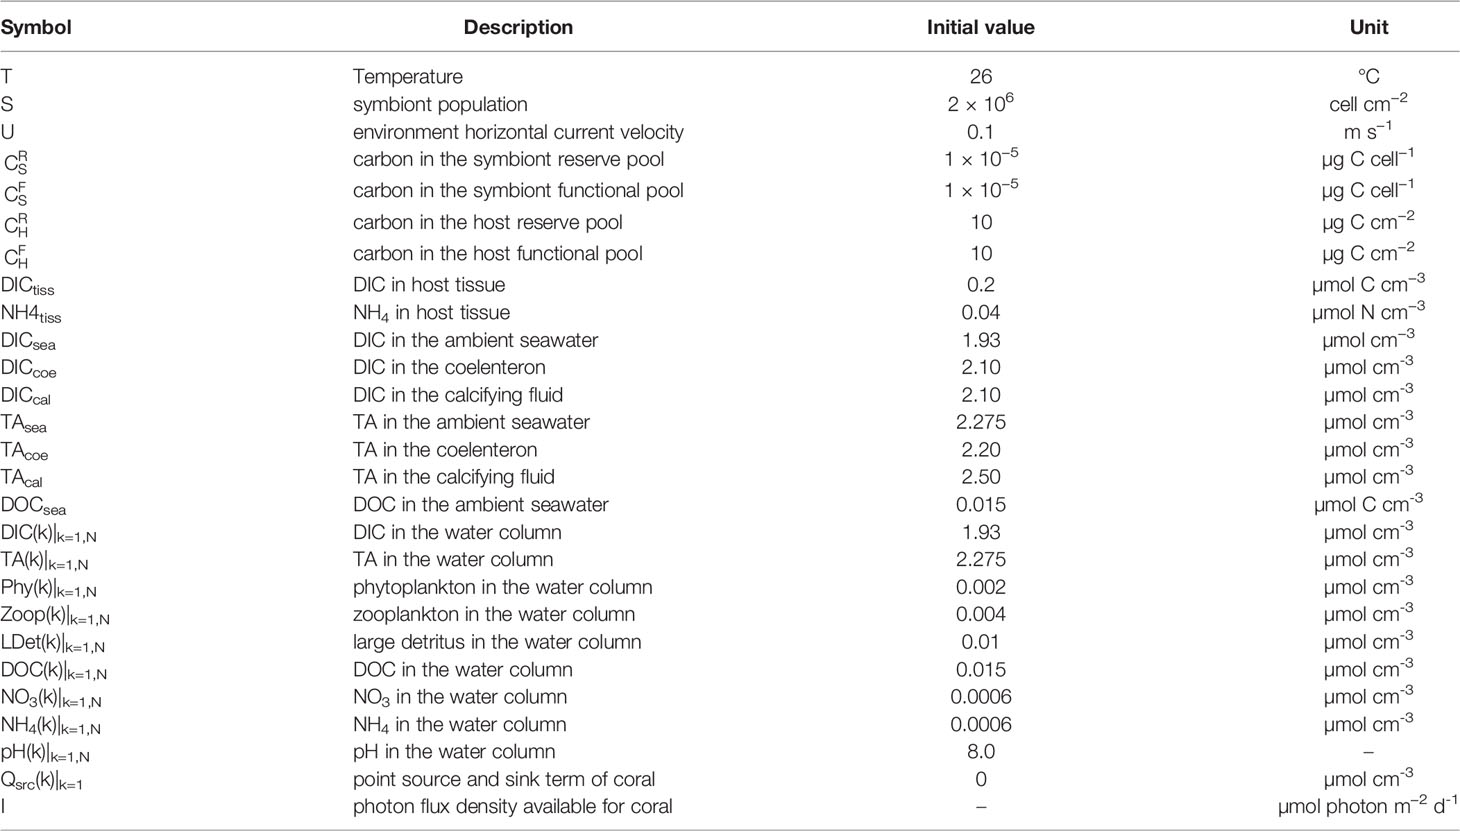
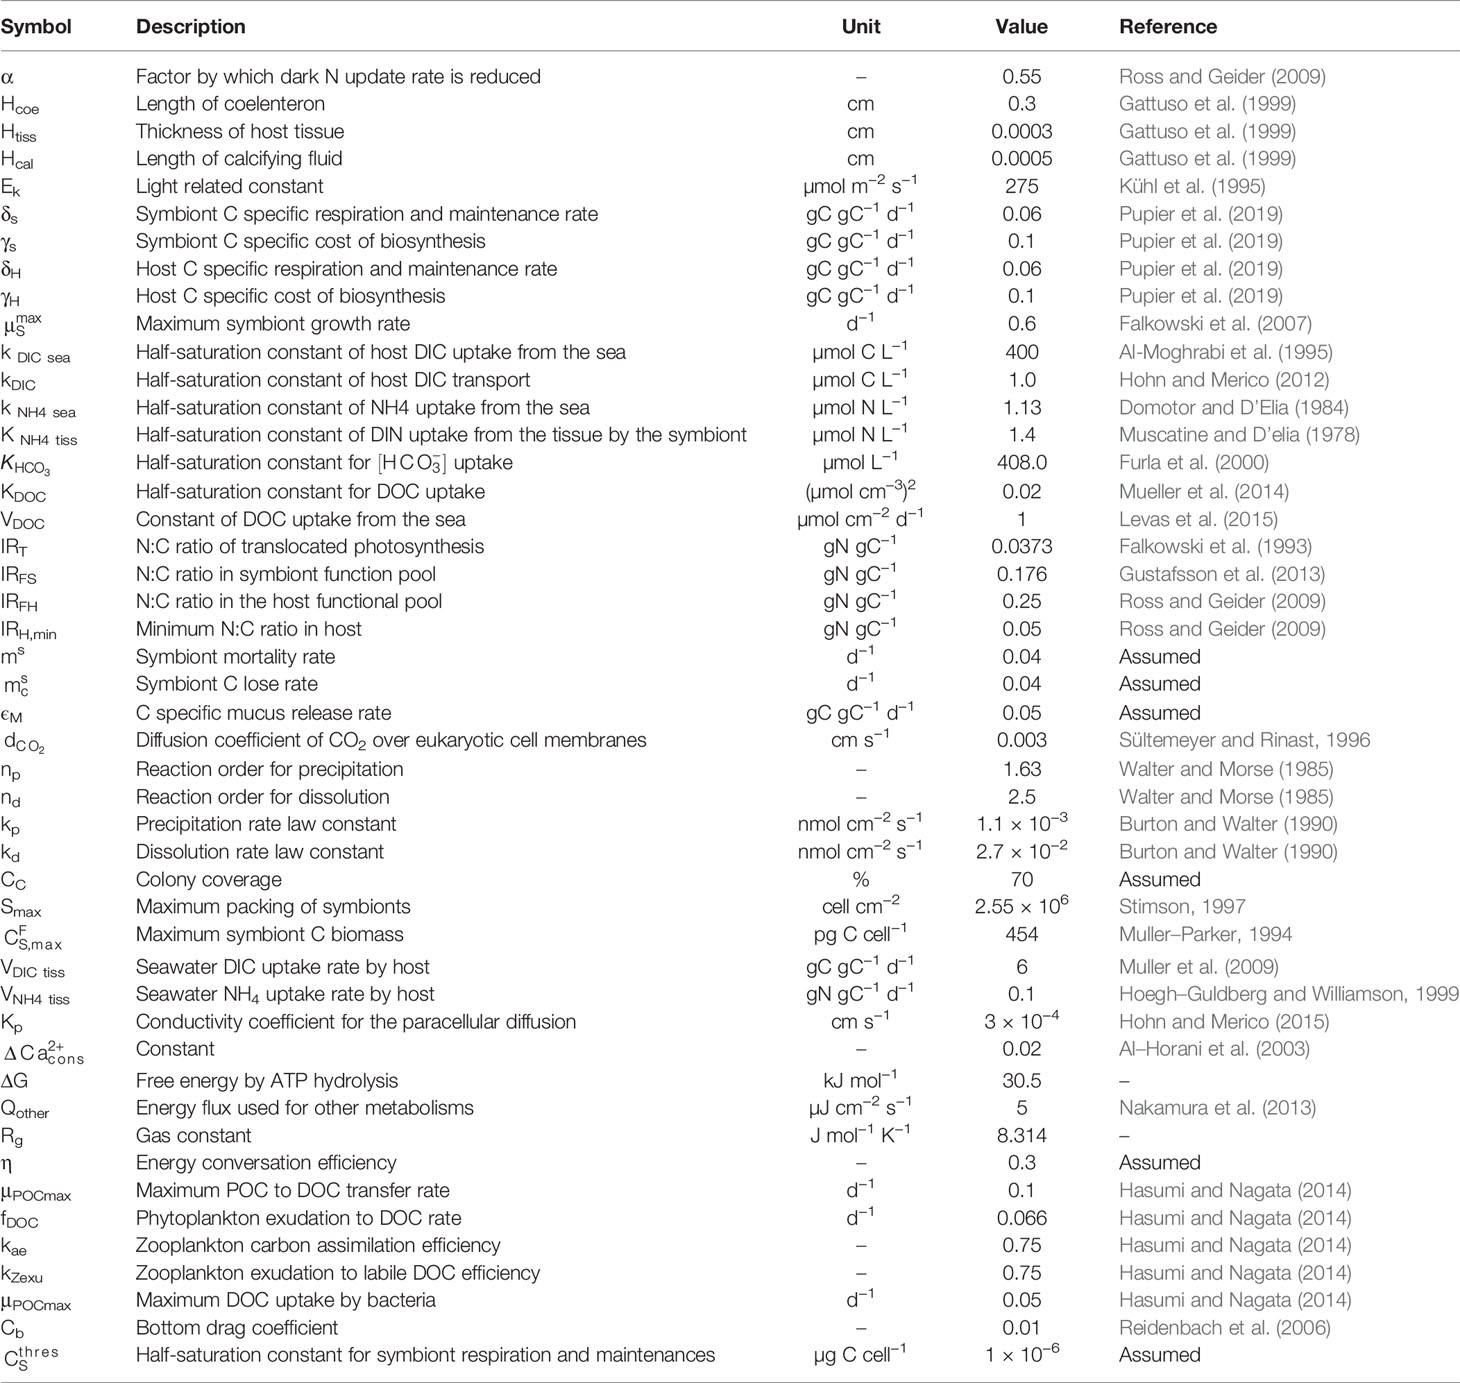
Figure 1 provides the basic framework of our model system which presents the cell-based coral symbiosis module (Section 2.1), coral polyp module (Section 2.2), and coupling with the ocean hydro-biogeochemical module (Section 2.3). Our modeling approach is based on coupling the three different scaled modules, each of which simulates a different component of the coral system. The detailed explanations of each module are provided below. The model state variable initial conditions are listed in Table 1, with set of parameter values listed in Table 2.
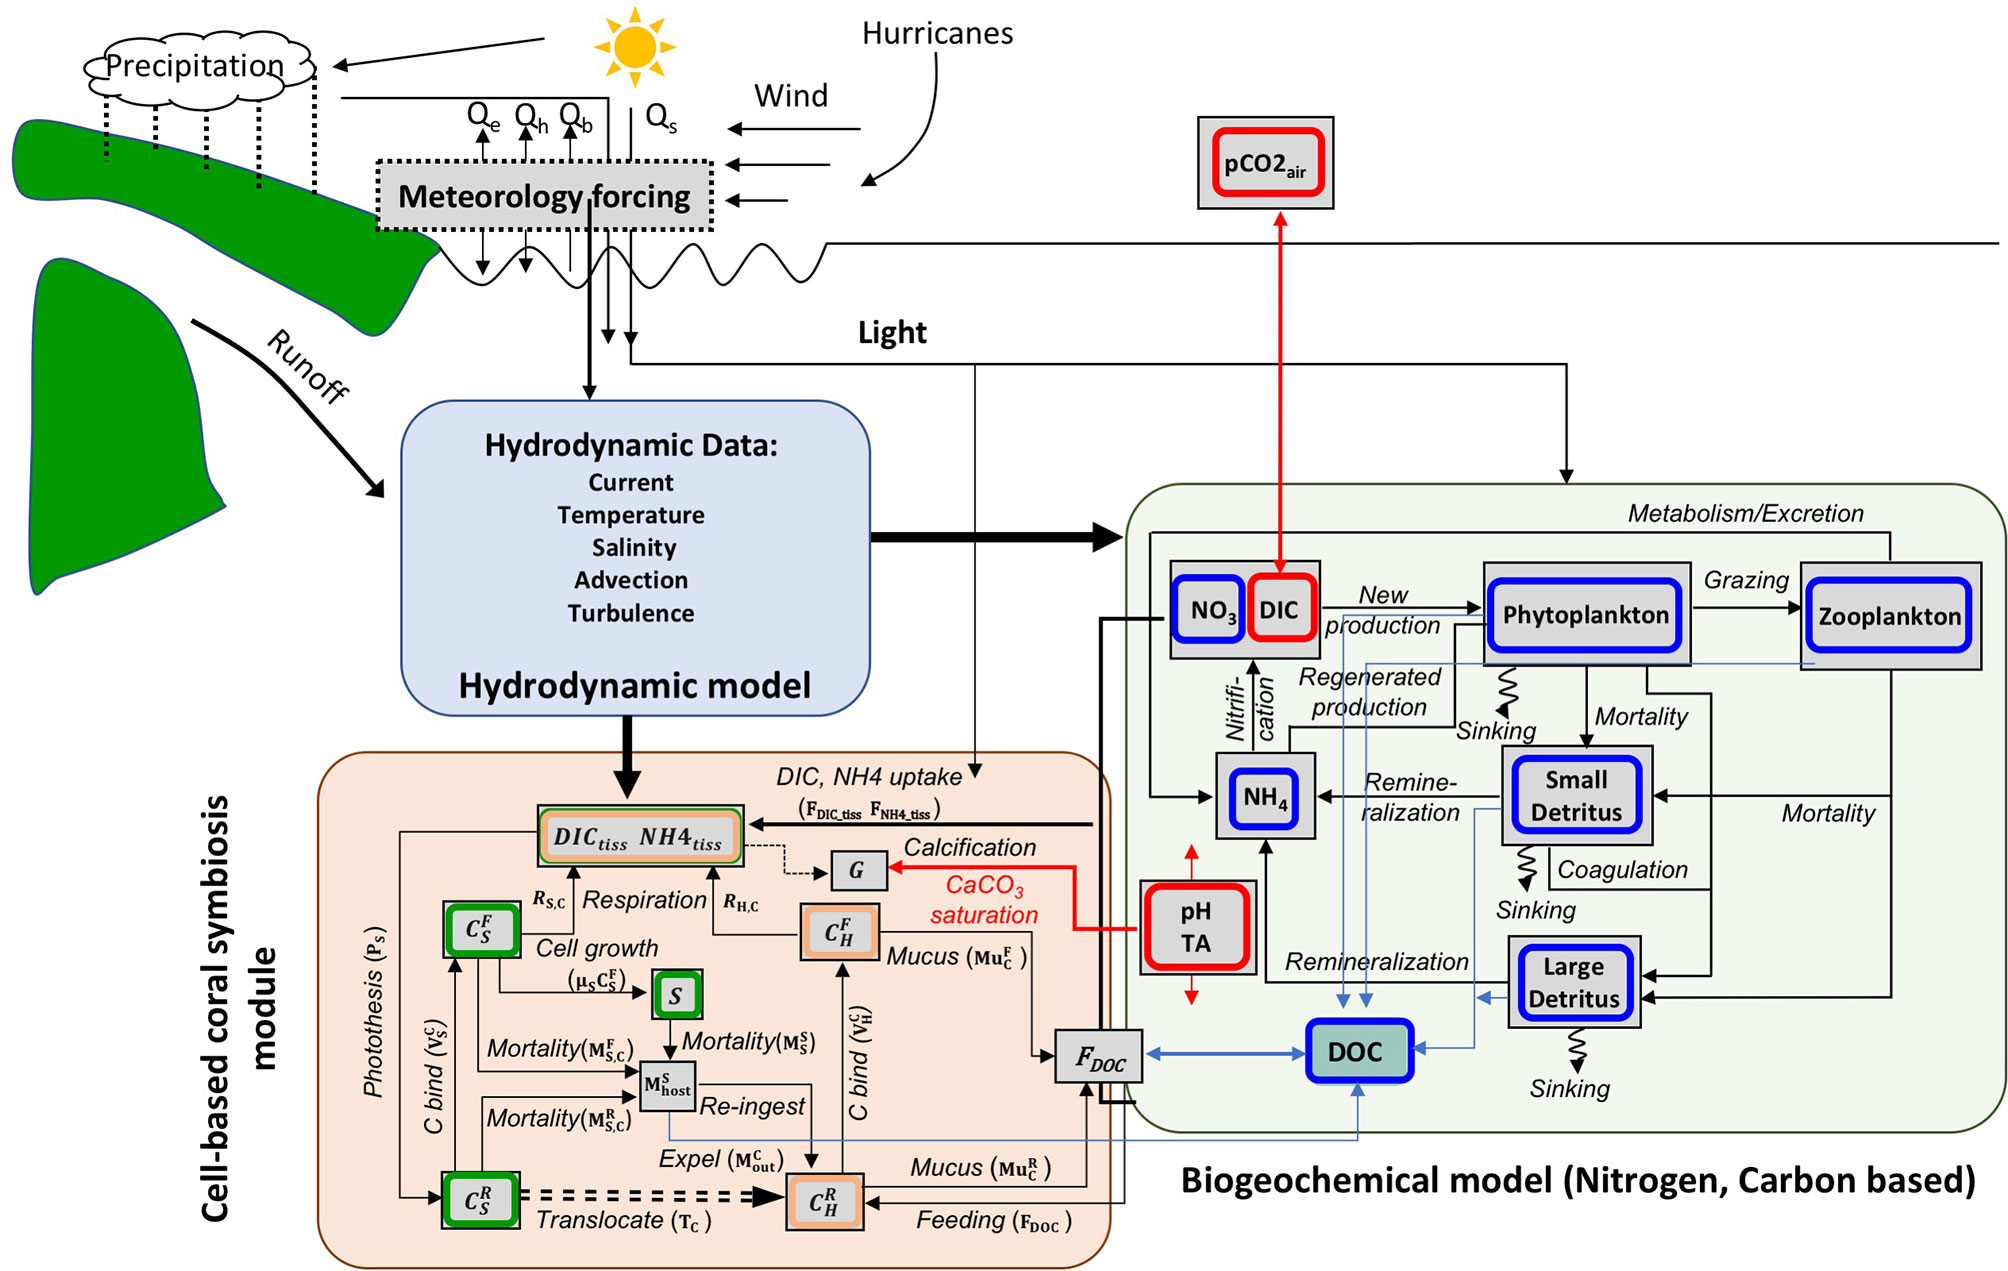
Figure 1 Schematic showing the fluxes of the coupled hydrodynamic, biogeochemical, and coral module. For the cell-base coral module, the symbols corresponding to these processes shown in Tables 3, 4 are listed for clarity.
2.1 Coral-Symbiont Module
In theoretical models for coral symbiosis, a coral host provides a protective environment for zooxanthellae within its tissues, and there are dynamic fluxes of carbon and nitrogen between zooxanthella, coral host, and the environment through autotrophic and heterotrophic processes (Figure 1). Of the total zooxanthellae photosynthetic carbon and bind nitrogen, some is used for algal respiration, some is used for maintenance, and some is used for algal cell growth; the rest are passed to the host for its carbon and energy needs, namely, respiration, growth, and production of mucus and skeletal material (Muscatine, 1990). In turn, the symbiont receives an influx of nutrient-rich compounds derived from the metabolic processes of the host (Falkowski et al., 1993). In addition to the internal cycle described above, there are other more important processes associated with energy sources for the coral host: heterotrophic feeding and obtaining DIC and DIN from the surrounding water via the advection from the coral polyp mouth or diffusion through the cell walls (Goiran et al., 1996; Tambutté et al., 1996).
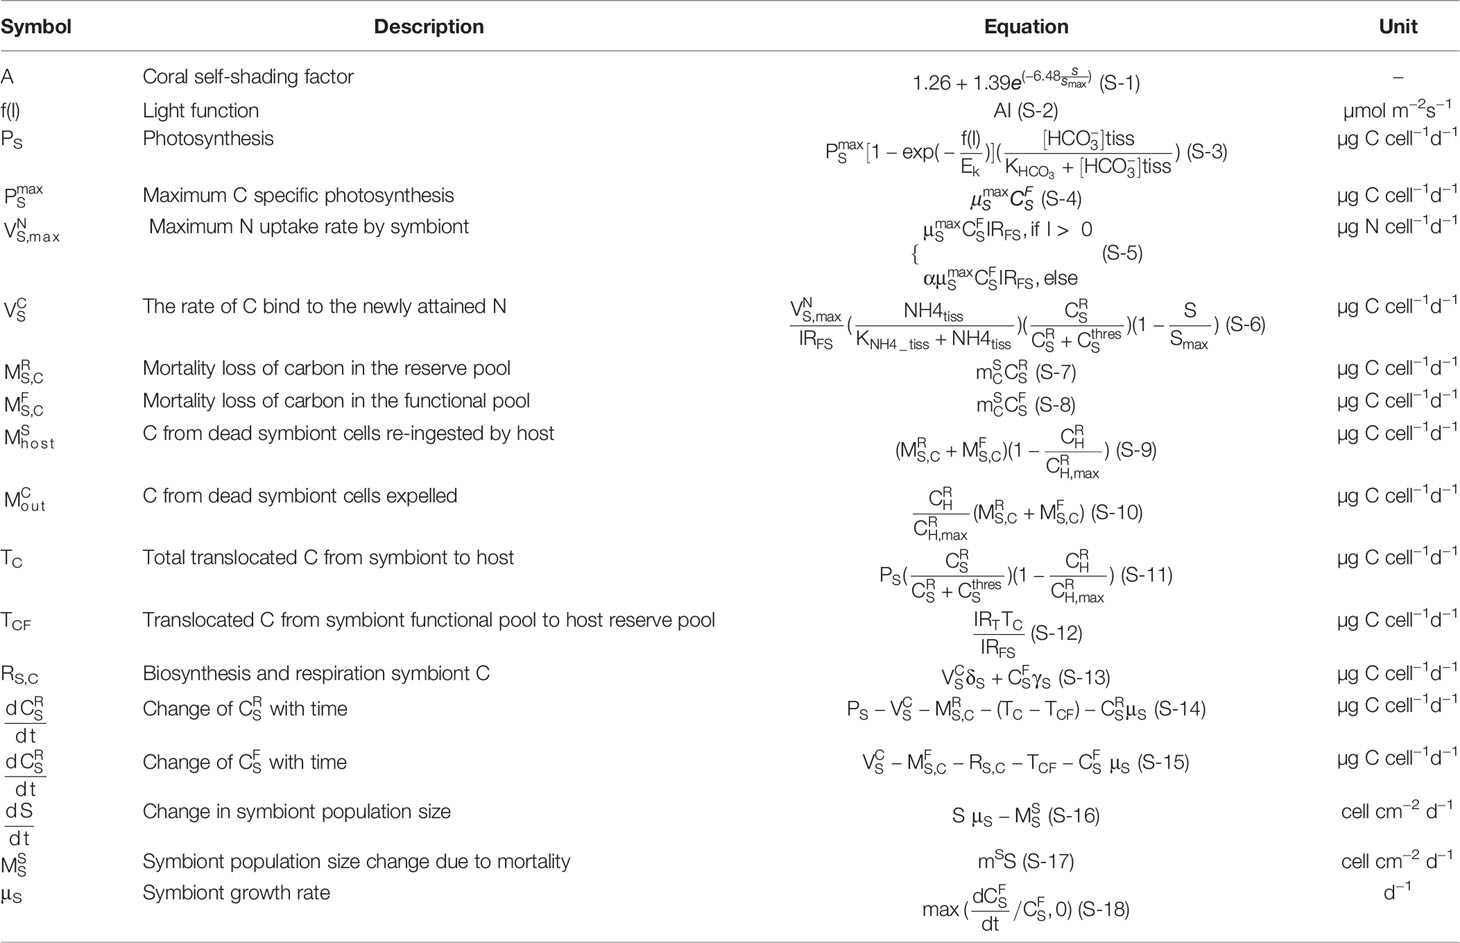
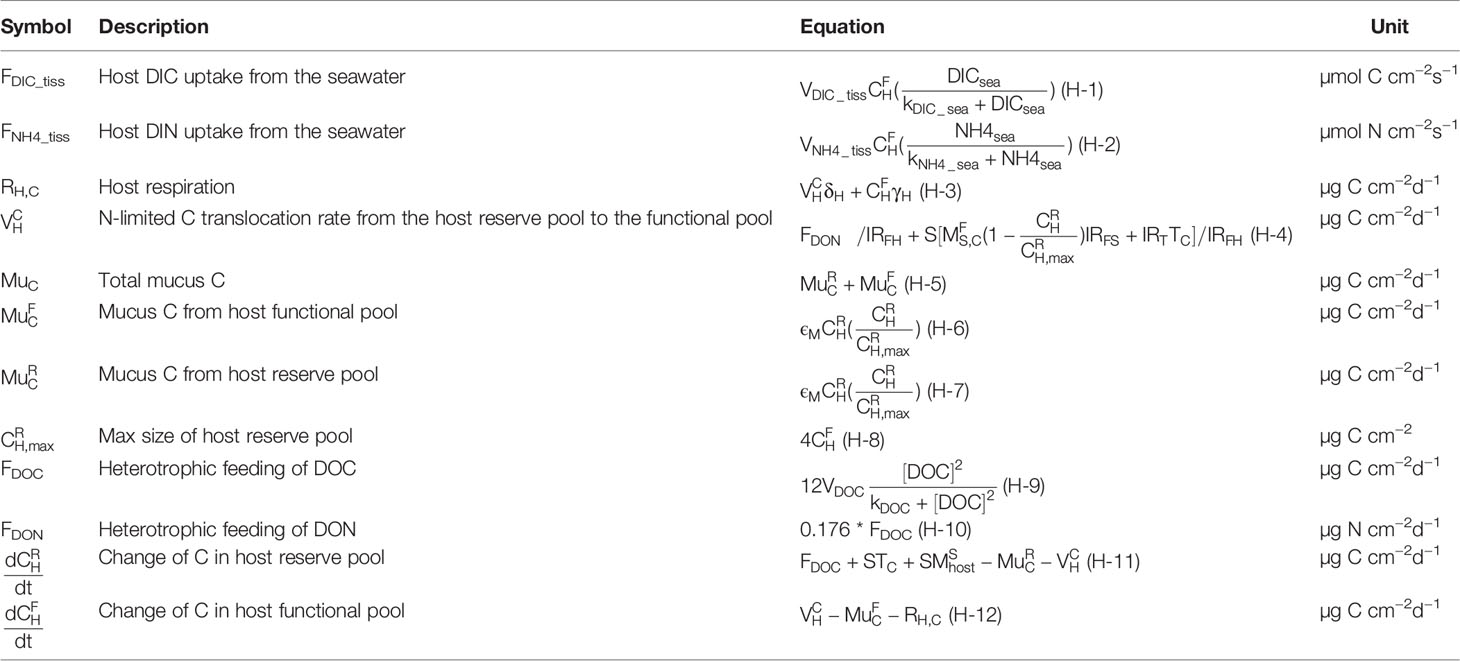
To describe the internal carbon cycle in the symbiosis, a basic cell-based framework of carbon and nitrogen fluxes in the symbiont system was adapted from Gustafsson et al. (2013). The coral-symbiont module constructed herein employs the cell as the basic unit and describes the carbon flows within and between the symbiont and host. It defines the specifications of carbon and nitrogen functions in energy reserve and functional pools for the symbiont and host respectively. The functional pool is defined as the minimum energy required for an organism to perform vital functions and structural maintenance. The energy reserve pool is determined as the energy required to perform metabolic processes and reserve organic carbon. In the model, and denote the carbon content of the functional pool, whereas and represented the reserve carbon pool. Corals regulate algal growth and activity by limiting their access to nitrogen (Falkowski et al., 1984). Therefore, in the model, nitrogen is assumed to be limited. Cellular N is contained only in the symbiont and host functional pools, the carbon content is assumed to bind to nitrogen at the stoichiometric ratios (IRFFS,IRFFH). We also imposed a fixed stoichiometry for translocated carbon and nitrogen (IRT). In this study, we focus on the discussions of carbon budget, the issues of nitrogen fluxes and budget will be addressed in a future paper. Equations for symbiosis model considering symbiont and coral host are listed in Tables 3 and 4 respectively.
2.1.1 Symbiont Cell
The symbiont produces fixed carbon through photosynthesis based on light and inorganic nutrient. The amount of light coming from the photosynthesis available radiation (PAR) at the sea surface is modified substantially relative to different kinds of scattering. One of the important factors is by the phytoplankton in the water column. The total photon flux density available for coral at the model bottom grid after phytoplankton attenuation is expressed as I, with the unit of µmol photon m−2 day−1. It is also attenuated by coral skeleton and self-shading by surrounding symbionts following an amplification factor A (Eq. S-1), which indicates the influence of symbiont density on the downwelling irradiance. We assumed that with the increase of symbiont population, there are limited spaces in the host tissue, and S/Smax is used as symbiont density function to specify the ability of packing symbionts in the host tissue. The total light available to symbiont is according to the photosynthesis–irradiance relationship (Eq. S-3), where is assumed to be the amount of C needed for symbiont maximum growth rate along with cell respiration (δs) and cost of biosynthesis (γs). is considered in our model as the source of inorganic carbon for the symbiont photosynthesis (Goiran et al., 1996).
The photosynthesis organic C enters the symbiont cell reserve pool first, where part of them will be used to bind to the newly attained N for cell functional need. The (Eq. S-5) denotes the maximum newly N uptake rate in the condition of the maximum growth rate of symbiont. There is considerable diel variability of maximal N assimilation based on the information from the literatures (Domotor and D’Elia, 1984; McAuley and Smith, 1995), thus is limited in dark condition by the factor α. The actual N uptake follows Michaelis–Menten style equation, and considers that there is enough amount of C bind to these N at the Redfield ratio (, Eq. S-6). Part of the C in the reserve pool will be lost due to mortality where a parameter ms is used to specify a natural mortality rate (, Eq. S-7). Symbiont cells lost through natural mortality were either re-absorbed by the host ( Eq. S-9), or expelled from the symbiosis system (, Eq. S-10). The excess of fixed carbon is used to produce new symbiont biomass (), and surplus, is translocated to the host reserve pool until reaches (Tc, Eq. S-11). For the translocation rate, the photosynthesis carbon translocated to the host is limited by the size of the host reserve pool () and the own respiration of the symbiont and maintains the carbon need (). The change in the size of the reserve pool (Eq. S-14) is given by the balance of all the above terms. The change in the size of the symbiont function pool (Eq. S-15) is under the balance of energy translocated from the symbiont reserve pool (), maintenance respiration and biosynthesis (RS,C, Eq. S-13), mortality (, Eq. S-8), translocates to the host (TCF, Eq. S-12), and forms new biosynthesis (). We use a constant to set up the half-saturation constant of respiration and cell maintenance, and describe that biosynthesis of proteins and nucleic acids is limited by the energy leftover in the functional pool.
In the model, the cell division is also considered. To achieve a change in the symbiont population, a new entry is assumed to occur only when there are enough N and C to support respiration and number of maintenance. When the structural biomass in a cell function pool reaches maximum size (), a cell starts to divide according to the growth rate, the population of symbiont cells increases (Eq. S-16). If there is not enough light or nutrients for symbiont photosynthesis, the cell population size decreases at the rate of natural mortality (Eq. S-17). The symbiont growth rate changes with carbon concentration in the function pool (Eq. S-18).
2.1.2 Host Cell
In this module we represent host heterotrophic feeding of DOC and DON by a Holling-type s-shaped curve with a maximum feeding rate and half-saturation constant kDOC (Eq. H-9). DOC concentration is calculated from the biogeochemical model in the ambient water. DOC is bounded with DON and depends on Redfield ratio mass ratio (). Under the N-limitation assumption, the N availability for synthesis of proteins and nucleic acids for functional host cell is bounded with certain amount of C. This amount of C comes from the host reserve pool. We used as the N-limited C translocation rate from the host reserve pool to the functional pool. The C sources in the host reserve pool include heterotrophic DOC, translocated carbon from the symbiont, and re-ingestion of dead symbiont cells (Eq. S-9). The C loss includes the C bind to N in host functional pool () and excrete outside of the polyp in the form of mucus to the ambient seawater (Eq. H-7). Carbon in the host functional pool is consumed for host biosynthesis and respiration (Eq. H-3), and part is excreted as mucus, which acts as DOC source to the environment water (Eq. H-6). (Eq. H-8) denotes the carbon size limitation in the host reserve pool. As approaches , the C re-ingestion and translocation from the symbiont to the host will subsided (Eqs. S-9 and S-11). is given as the maximum leftover C in the host functional pool after meeting the C bound for the host functional N (, denotes the maximum C bound to N). will change accordingly as changes.
2.2 Coral Polyp Module
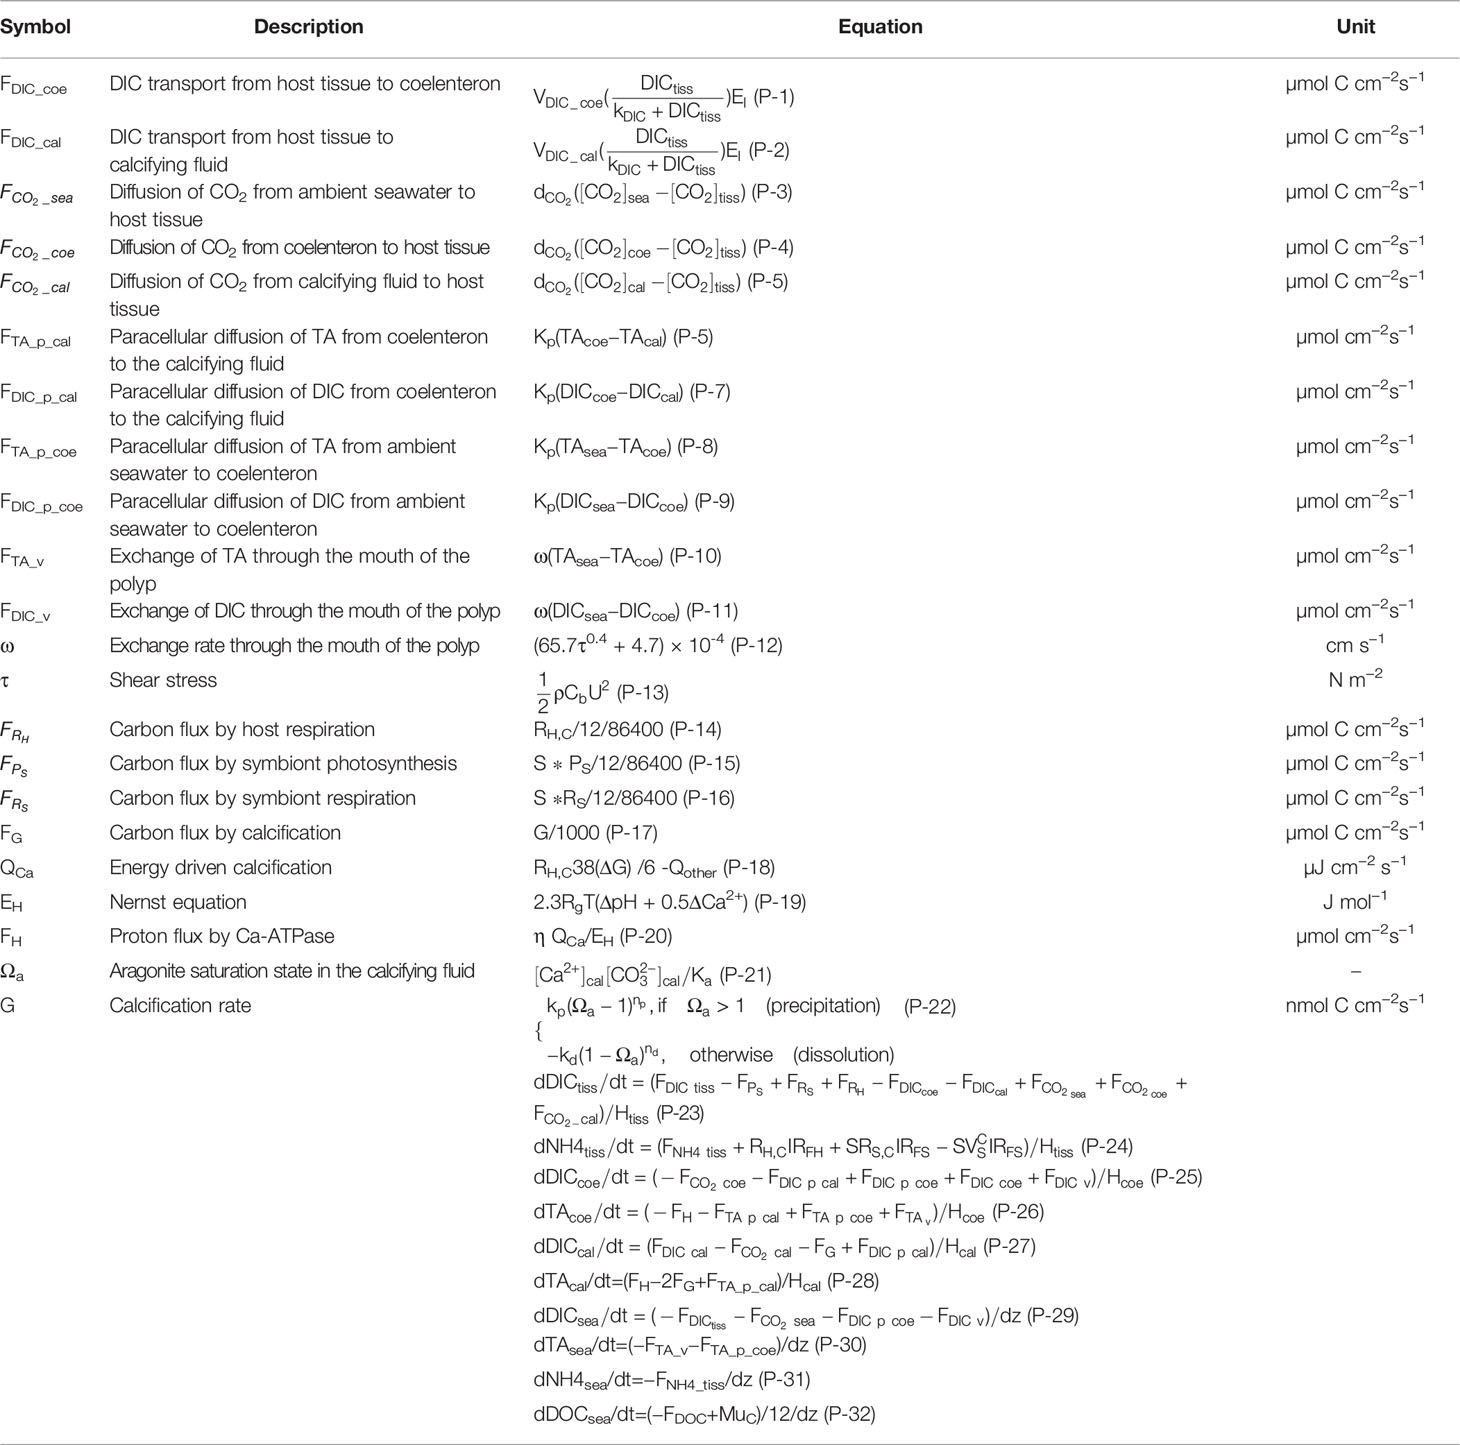
A coral polyp consists of a bag-like invagination that opens to the surrounding seawater at the mouth (Figure 2). The polyp module simplifies the coral polyp system into four components: ambient seawater, coral tissue, coelenteron, and calcifying fluid (Hohn and Merico, 2012; Nakamura et al., 2013). Fluxes across these boundary layers connect the four parts with different chemical components, driving the dynamics of the polyp model (Figure 2). The associated mass balance terms are listed in Table 5.
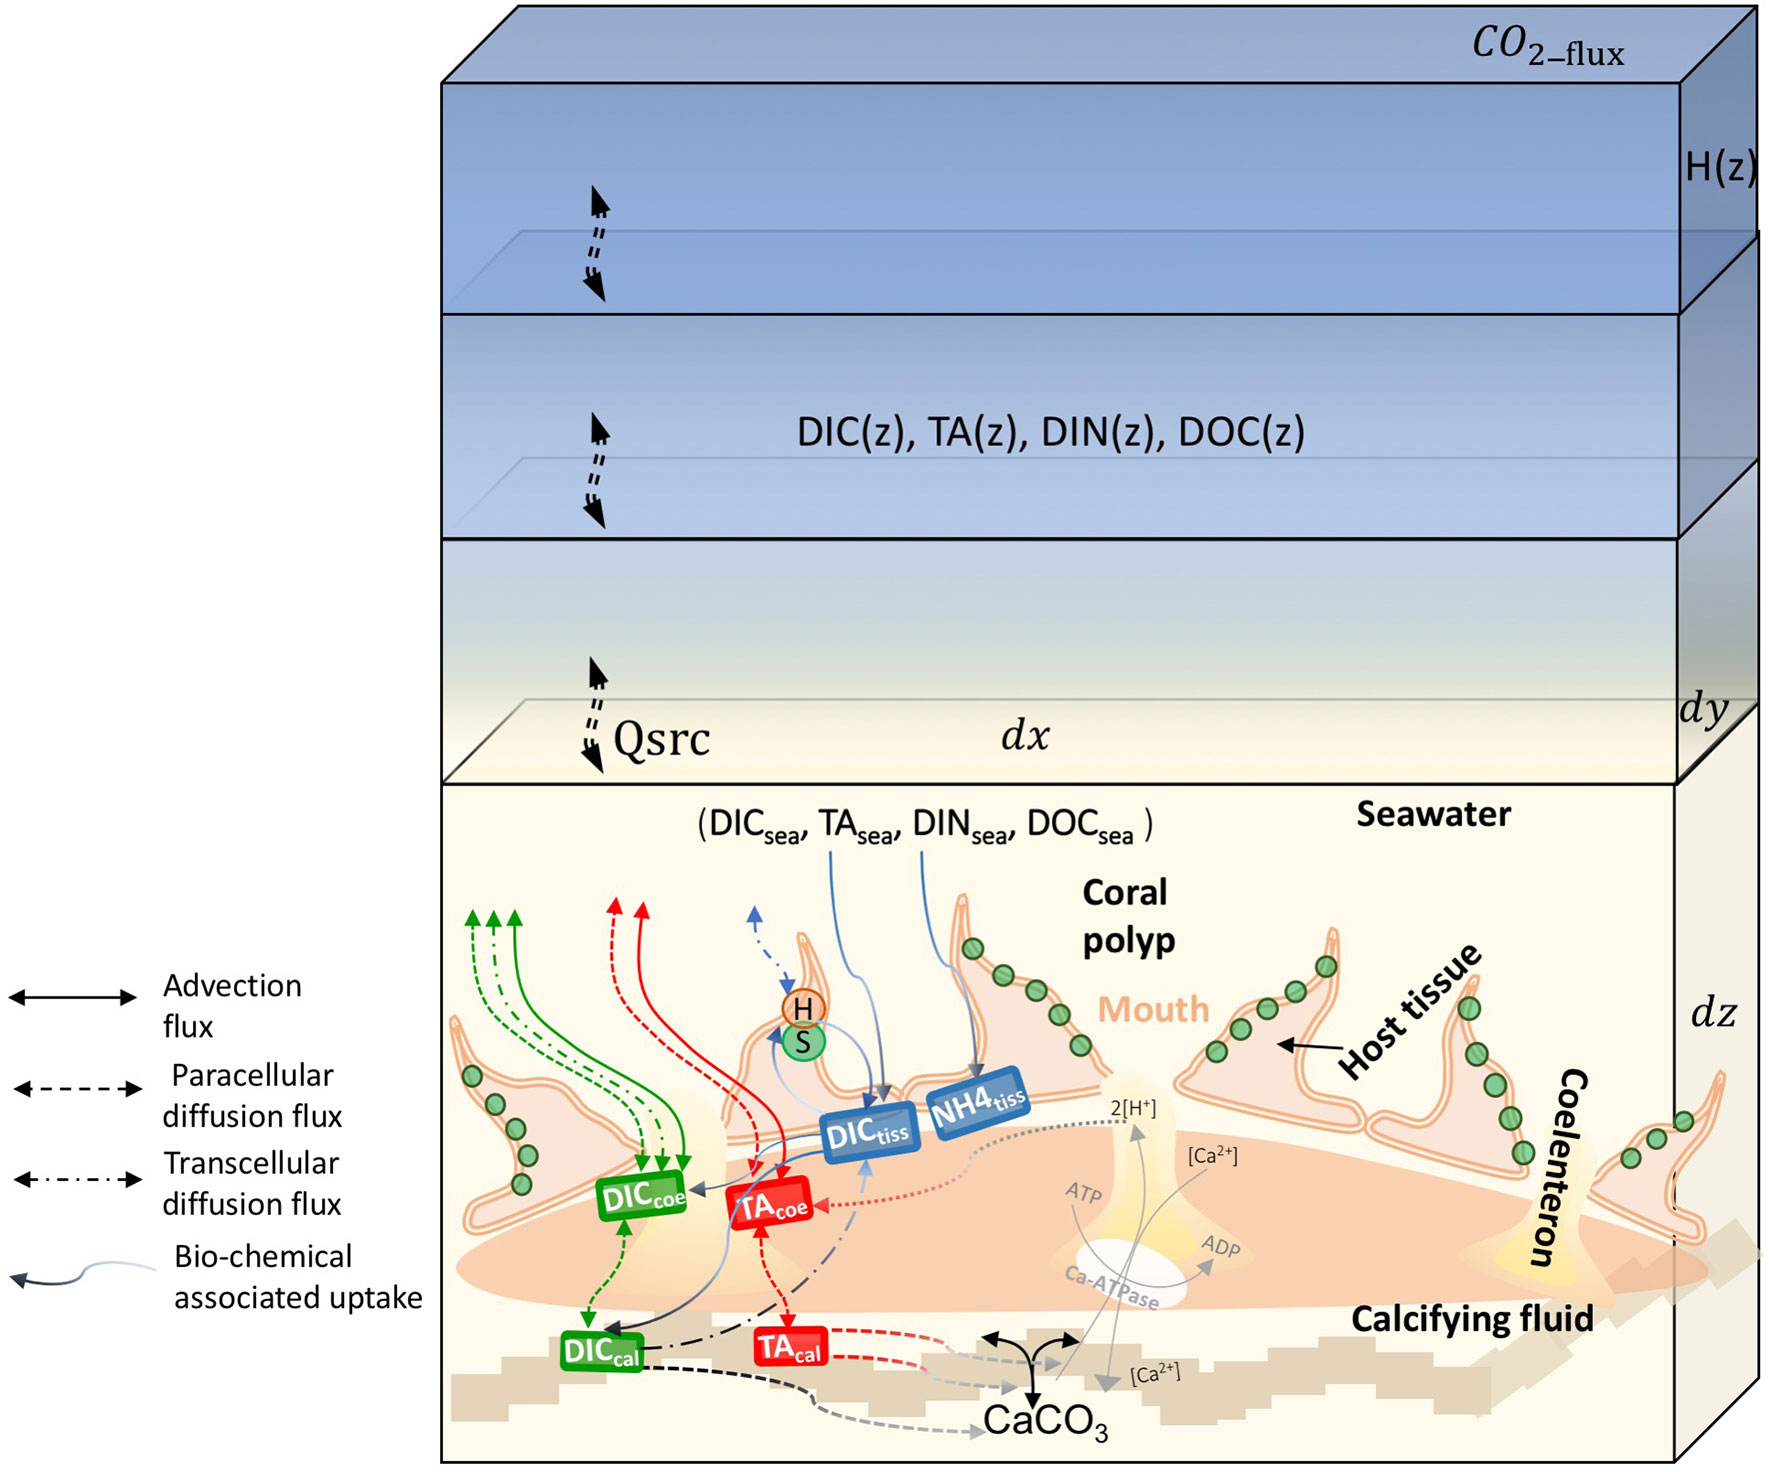
Figure 2 Schematic showing the coupling of the coral polyp model with the biogeochemical model grids. The coral lies on the bottom grid of the hydro-biogeochemical model. The green dots indicate symbiont (zooxanthellae) which live in coral polyp. The dx and dy refer to the biogeochemical model grid size along the x and y axes; H(z) is the height of a grid; DIC(z), TA(z), and DIN(z) indicate concentration in each grid; Qsrc indicates the point of source terms (DIC, DIN, TA, and DOC) in the biogeochemical model at the bottom grid; and CO2-flux is the flux that exits between the air and the ocean at the surface grid of the biogeochemical model. The four components of polyp model (seawater, host tissue, coelenteron, and calcifying fluid) are denoted. The arrow lines denote major fluxes between them as listed in Tables 4, 5.
2.2.1 Host Tissue
The host is assumed to be in direct contact with the external environment. We considered the exchange of inorganic form of C between the coral tissues and the ambient water. DIC supply is suggested as saturated at ambient water (Goiran et al., 1996), so DIC uptake from the seawater is parameterized with Michaelis–Menten kinetics, with a maximum uptake rate and a half-saturation constant (Eq. H-1). The DIC in the host tissue then can be used by symbiont photosynthesis (Eq. S-3). The maintenance respiration products from symbiont and host in the form of DIC go back to the host tissue DIC pool (Eq. H-3). So the balance of these source and sink terms determine the change of DIC in the host tissue and also the equilibration with DIC in ambient seawater. We assumed the leftover carbon in the host tissue DIC pool can be available to transport to the coelenteron and calcifying fluid through transcellular transport (Furla et al., 2000). It is assumed to be light limited, where EI was defined as the switch of light conditions in the simulation following Hohn and Merico (2012). When I >0, EI = 1, while when I = 0, EI = 0 (Eqs. P-1 and P-2). For other carbon pathways, CO2 was assumed to diffuse freely between the seawater and coral tissue (Eq.P-3, ), between the coral tissue and coelenteron through the oral endoderm (Eq.P-4, ), and between the host tissue and calcifying fluid through the aboral endoderm (Eq.P-5, ). So the mass balance of DIC in the host tissue (DICtiss) is determined by DIC uptake, the internal cycle of symbiosis metabolic processes (i.e., photosynthesis, respiration, and calcification), and the equilibria diffusion-associated removal or addition of DIC (Eq. P-23). DIN fluxes have the similar pathway as DIC, except they are not involved into calcification processes. About the DIC variance associated pH and TA, the coral tissue pH is known to be higher under light conditions than in the dark (Venn et al., 2009), implying that photosynthesis and calcification processes can regulate the coral host pH. However, considering the complexity of intracellular cell adjustments under environmental change, pH and TA in the host tissue were assumed to be constant with no flux equations specified.
We also calculated the fluxes influencing DIN in the host tissue. We assumed that the coral animal acquires DIN from the surrounding seawater represented as ammonium (Muscatine et al., 1984; Hoegh-Guldberg and Williamson, 1999). Ammonium diffuses into the host tissue pool and is taken up by symbiont are described by Michaelis–Menten style equation (Eq. H-2). The DIN in the host tissue (DICtiss) is under the balance of NH4 uptake from ambient seawater by the host, host respiration, symbiont respiration, and loss by the symbiont uptake (Eq. P-24).
2.2.2 Coelenteron
DIC and TA in the coelenteric fluid composition is controlled by the advective exchange of seawater through the mouth, transcellular diffusion with tissue, paracellular diffusion with seawater through the oral boundary layer, and calcifying fluid through the aboral endoderm layer. The paracellular diffusion fluxes between seawater and coelenteron were defined in Eqs. P-8 to P-9, where kp is the conductivity coefficient for the paracellular leakage process. The mouth of the polyp opens the coelenteron to the ambient seawater, the flux of advective exchange that will influence state variables between seawater and coelenteron was assumed to linearly depend on the concentration gradient between the two compartments with a constant exchange rate ω. The exchange rate ω is linearly proportional to the shear stress (τ) of the 0.4 root (Hearn et al., 2001) (Eq. P-12). In calculation of τ, we follow Eq. P-13 where ρ is water density, and Cb is bottom drag coefficient. The calculated values of τ is about 0.05 N m−2. The H+ transport by Ca-ATPase (FH) also influences TA in the coelenteron (Eqs. P-25 and P-26).
2.2.3 Calcifying Fluid
As for the calcifying fluid, several processes influence the concentration of DIC and TA, namely, the diffusion of CO2, DIC transport from the host tissue to the calcifying fluid, paracellular diffusion of DIC and TA, and calcification.
Calcification is an important process in the calcifying fluid and is regulated by the cellular supply of ions, such as Ca2+ and (Allemand et al., 2011). Corals also need energy to transport calcium, bicarbonate, and other ions to calcify their skeletons. Calcium ions are believed to be transported via a combination of calcium channels and an active calcium pump (Ca-ATPase) (Cohen and McConnaughey, 2003). The free energy from ATP hydrolysis is from host respiration. This is one of the ways the coral polyp model coupling with the coral-symbiont module, through the energy flux used for driven Ca-ATPase (Eq. P-18). In our model, the calcification formula was adapted from Nakamura et al. (2013). The Ca-ATPase transports 2 Ca2+ in exchange for 4 H+ at the expense of 1 ATP across the cell membrane, where ATP is produced during cellular respiration. ATP drives the Ca2+ pump (Ca-ATPase) and exchanges H+, while H+ is removed from the calcifying fluid and added to the coelenteron. The free energy from ATP hydrolysis is termed ΔG, where a unit of glucose (C6H12O6) was assumed to synthesize approximately 38 ATP molecules. Therefore, when 1 mol of CH2O (1/6 mol of C6H12O6) is consumed by respiration, 38(ΔG)/6 kJ of energy could be used for driving Ca-ATPcase. The energy required to maintain the pH gradient and exchange 1 mol of H+ is calculated using the Nernst equation (Eq. P-19), where and is simplified to be a constant (), based on the assumption that the Ca2+ difference is much smaller than the H+ difference. The transport rate of H+ through Ca-ATPase is estimated as the ratio of energy consumed by Ca-ATPase for 1 mol of H+, as per Eq. P-20. H+ exchange is thought to be a crucial step in the coral biomineralization process and influences pH and TA in the coelenteron and calcifying fluid. H+ in the calcifying fluid follows transcellular Ca2+/2H+ transport (Eqs. P-26 and P-28).
The precipitation of aragonite is described by the equation (Burton and Walter, 1990), where Ωa represents the concentration of Ca2+ and dissolved in the calcifying fluid until the equilibrium concentration is reached (Eq. P-21). For our calculations, a constant value of [Ca2+] = 10.4 mM is used (Nakamura et al., 2013). The ions involved in the calcification process are sourced from the calcifying fluid DIC pool. For our calculations, a constant value of [Ca2+] = 10.4 mM was used (Nakamura et al., 2013). The ions involved in the calcification process are sourced from the host DIC pool. The calcification rate (G) was calculated following Eq. P-22. When 1 mol of CaCO3 is produced (calcification), 1 mol of DICcal and 2 mol of TAcal are consumed. The mass balance equations are shown in Eqs. P-27 and P-28.
Based on these flux terms, we calculated DIC and TA as the state variables in each of the polyp components, and their change with time associated with fluxes is derived using differential equations. A forward difference scheme is used for these equations. The units of all fluxes on the right-hand side of each equation are µmol C cm−2 s−1, whereas divided by the thickness of each component (i.e., tissue thickness, coelenteron thickness, and bottom layer depth in the water column), and their units are consistent with the state variable on the left-hand side of the equation.
2.2.4 Ambient Seawater
The major processes connecting the ambient seawater with the coral polyp are the point sources and sinks at the bottom layer of the biogeochemical model through DIC uptake, advective flux between the coelenteron and seawater through the polyp mouth, and diffusion flux through the paracellular and transcellular pathways (Figure 2). The ambient water DICsea, TAsea, and DINsea are calculated following Eqs. P-29 to P-32.
2.3 Terms in the Marine Biogeochemical Model
The biological part of our model represents the basic functions and biogeochemical processes in the lower trophic levels. The model is modified from the biogeochemical model consisting of the nitrogen cycle with carbonate chemistry (Fennel et al., 2006; Fennel and Wilkin, 2009; Xu et al., 2013). There are seven state variables: phytoplankton, zooplankton, nitrate, ammonium, small and large detritus, and chlorophyll. The time rate change of phytoplankton is influenced by the growth rate of phytoplankton, grazing by zooplankton, mortality, aggregation of phytoplankton to small and large detritus, and vertical sinking of the aggregates. Zooplankton was assumed to assimilate ingested phytoplankton while the remaining fraction is being transferred to the small detritus pool. Other zooplankton loss terms are excretion to ammonium and mortality. Phytoplankton and small detritus aggregate to large detritus. The nitrogen cycle includes phytoplankton uptake, zooplankton grazing, and microbial loop processes. Detritus remineralization feeds into the ammonium pool, and ammonium is subsequently nitrified to produce nitrate. Variables of the carbonate system (DIC, pCO2, carbonate ion concentration, bicarbonate ion concentration, pH and TA) determines the remaining four, but only DIC and TA behave conservatively with respect to mixing and temperature and pressure changes (Zeebe and Wolf‐Gladrow, 2001). Thus, DIC and TA are included as active tracers (i.e., they were advected and diffused by the physical model). Local changes in DIC and TA occur due to primary production, respiratory processes, and gas exchange at the air–sea interface, whereas pCO2—the carbon variable relevant for the air–sea gas exchange of CO2—is calculated for the surface layer only. We also simulate DOC sources from phytoplankton excretion and decomposition of large detritus. The DOC sources include phytoplankton (EPhy), zooplankton excretion (EZ) and decomposition of large detritus (DLDet) and lost by bacterial uptake (UDOC). These processes were simplified from the work of Li et al., 2014), and are described in Table 6.
2.4 Model Run
First, we conducted a control run only for the coral symbiosis module and polyp module. In the control run, the environment variables were assumed consistent as listed in Table 1, only the light changes in day and night. There was no flux exchange between the coral system and the seawater. The model results in the control run were used to compare with observations collected in the laboratorial experiment, to make sure that our model is under reasonable assumption and parameterizations.
Based on the parameters set in the control run, we then designed a coupled run to integrate the coral modules with the hydro-biogeochemical model. Before coupling with the coral module, we did an idealized 1-D run for the hydro-biogeochemical model based on the Regional Ocean Modeling System (http://www.myroms.org, Haidvogel et al., 2008). This model was set up with 15 vertical layers and a maximum depth of 20 m, with timestep of 360 s. We assumed that there are no boundary inputs and horizontal advection in the 1-D simulation (Supplementary Figure 1). After reaching the steady state, the results were used as the initial input for the coupled model.
Coral reefs are typical benthic marine primary producers; therefore, to integrate the coral modules with the hydro-biogeochemical model, we assumed that two-way coupling took place at the bottom grid of the hydro-biogeochemical model (Figure 2). We set another idealized case with 15 vertical layers and grid size in both the x (dx) and y (dy) directions is 10,000 cm. Bottom grid height dz is set to 500 cm. The numerical simulation code was written in Fortran 90/95. The simulation was run with a time step of 0.001s. We used the temperature, salinity, light, velocity, nutrients, and diffusion coefficients from the output of the former idealized hydro-biogeochemical model run as the input for the coupled model. The hydrodynamic model was then forced only by the solar radiation with a diurnal cycle. The bulk formulae (Fairall et al., 2003) usually used to force the hydrofield in the ROMS system were closed in our experiment. So the temperature, salinity, and velocity were all constant over time. Vertical diffusion and advection exist between the upper water column and bottom benthic layer, where the coral reefs are located. We assumed the coral system as the point sources and sinks (Qsrc) at the bottom layer of the biogeochemical model for the tracer variable DOC, DIC, DIN, and TA following Eq. (1), where k = 1 indicates the bottom layer of the biogeochemical model, k = N indicates the surface layer, CC denotes the colony coverage, we assumed that there is 70% coverage in the mode grid. We use the variable DIC as an example here; the same formulas were applied to calculate DIN, TA, and DOC. The subscript “sea” denotes the DIC in the coral polyp model in the ambient seawater. The DOC, DIC, DIN, and TA are two-way coupled in the way that, when there are changes in DICsea, TAsea, DINsea, and DOCsea in the ambient water of the coral polyp model, these changes will influence the above biogeochemical model grids through vertical advection and diffusion.
In our model, pCO2 in the seawater (pCO2sw) could be influenced by gas exchange and DIC biological uptake, including both the phytoplankton and coral systems. The gas exchange on the sea surface is modeled to be transported downward by vertical advection and diffusion and to influence DIC in the water column. These designs help us apply the model scenario experiments under different air pCO2 of 340 and 800 ppm. The sea surface CO2 gas exchange (CO2_flux) was calculated as follows:
where kCO2 is the gas transfer velocity, CO2_sol is the solubility coefficient of CO2 calculated after Weiss, 1974), H is the depth of the water column. When air pCO2 changed, it will influence the DIC concentration in the water column, and also the uptake of DIC in the ambient water by coral.
3 Results
3.1 Control Run Results
In the control run, the environmental temperature is set as 26°C, and with salinity of 35 psu. The ambient water DICsea, TAsea, DINsea and DOCsea were set as the constants in Table 1, and there was no flux exchange between the coral system and the seawater, that means the right-hand side in Eqs. P-29–P-32 equal zero. The coral system variables ultimately reached a steady state after 500 days from the beginning of the model run. We only show a 24-h cycle for all the variables. The daily flux of photosynthetically fixed carbon in light- and shade-adapted measured by isotopic tracers in Muscatine et al. (1984) was used to compare with our modeled coral symbiosis carbon budget. We used the measurements in Al-Horani et al., 2003) to evaluate the modeled pH in different polyp components in the light and dark conditions. In addition, we also compared the measurements of DIC, TA, pH, in different coral polyp components, and Ωa value under natural light conditions (Cai et al., 2016).
3.1.1 Diurnal Variations in the Symbiosis
For the symbiont, the model simulated gross and net photosynthesis rate exhibited a diurnal variation with light intensity (Figures 3A, F). In the symbiont reserve pool, part of the carbon accumulated due to photosynthesis (Figure 3D) was transferred to the symbiont functional pool, thus the symbiont functional pool carbon displayed high concentration in light (Figure 3E). Some carbon in the functional pool are used for respiration, some are used for cell growth (Figure 4C), and some are removed by loss of mortality. The left-over carbon was transferred to the host reserve pool (Figure 3C). The symbiont respiration rate increased due to carbon increase in the symbiont functional pool, so it was higher during daytime (Figure 3E). As for the host, two major carbon sources contributed to the host reserve pool: one was from the translocated carbon from the symbiont, and the other was from heterotrophic feeding of DOC from the ambient water. The 24-hour carbon cycle in the host reserve pool presented a strong diurnal signal, which was higher during the daytime due to translocation (Figure 4A). The carbon in the host reserve pool was transferred to the host functional pool for the host respiration energy needs. Therefore, the carbon in the host functional pool accumulated during light (Figure 4B), and the host respiration rate also increased in light (Figure 4D). The respired carbon from the symbiont and host were recycled back to the DIC pool in the host. Part of DIC in the host DIC pool was reused by the symbiont for photosynthesis, and another part for calcification. The calcification rate increased with increasing aragonite saturation, which was associated with [ ] in the calcifying fluid (Figures 4E, F).
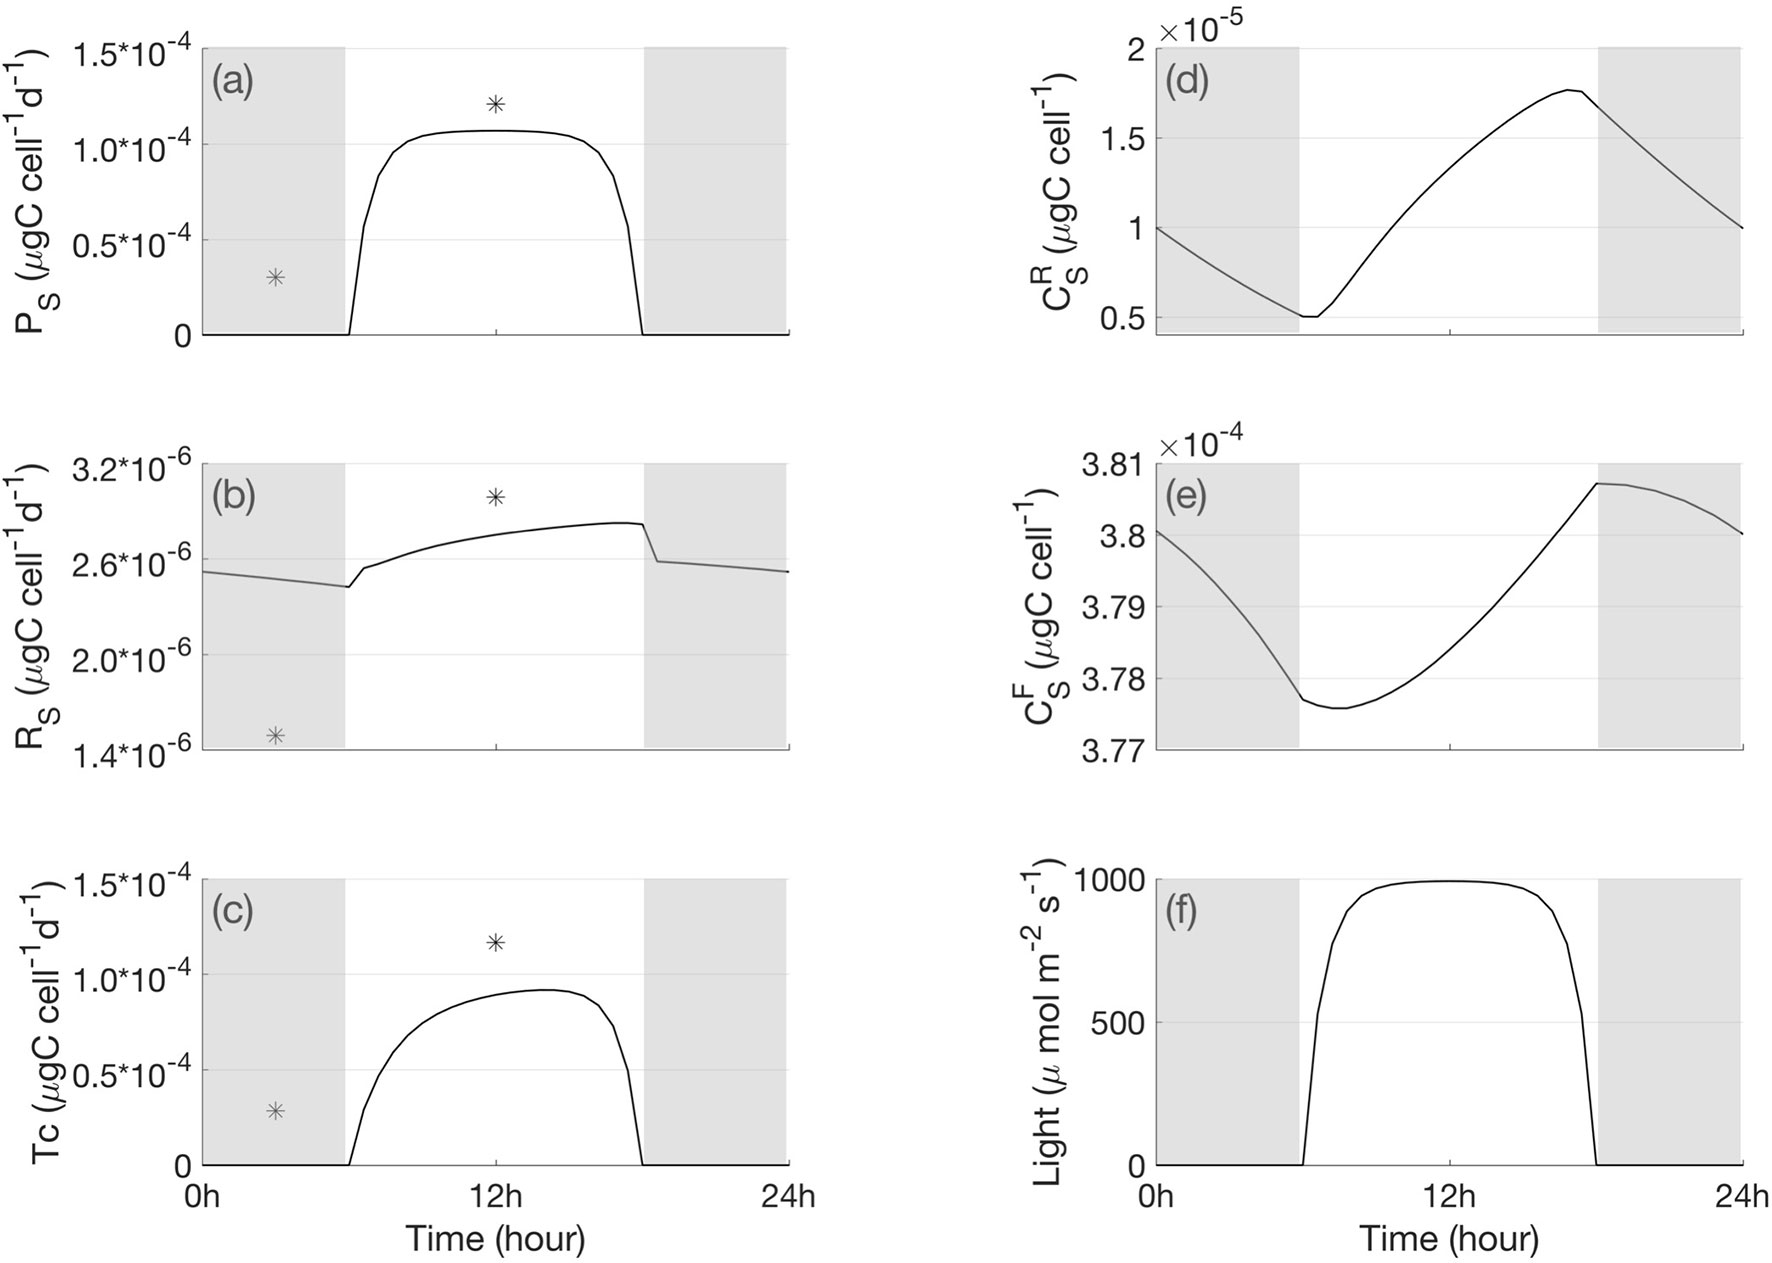
Figure 3 A 24-h cycle of the simulated metabolic processes and carbon content in the symbiont cell (A) gross and net photosynthesis, (B) respiration, (C) translocation, (D) carbon in the symbiont reserve pool, (E) carbon in the symbiont functional pool, and (F) light condition. The star signs indicate the measured daily carbon flux in light- and shade- adapted condition in Muscatine et al. (1984). The shaded bars indicate bark periods.
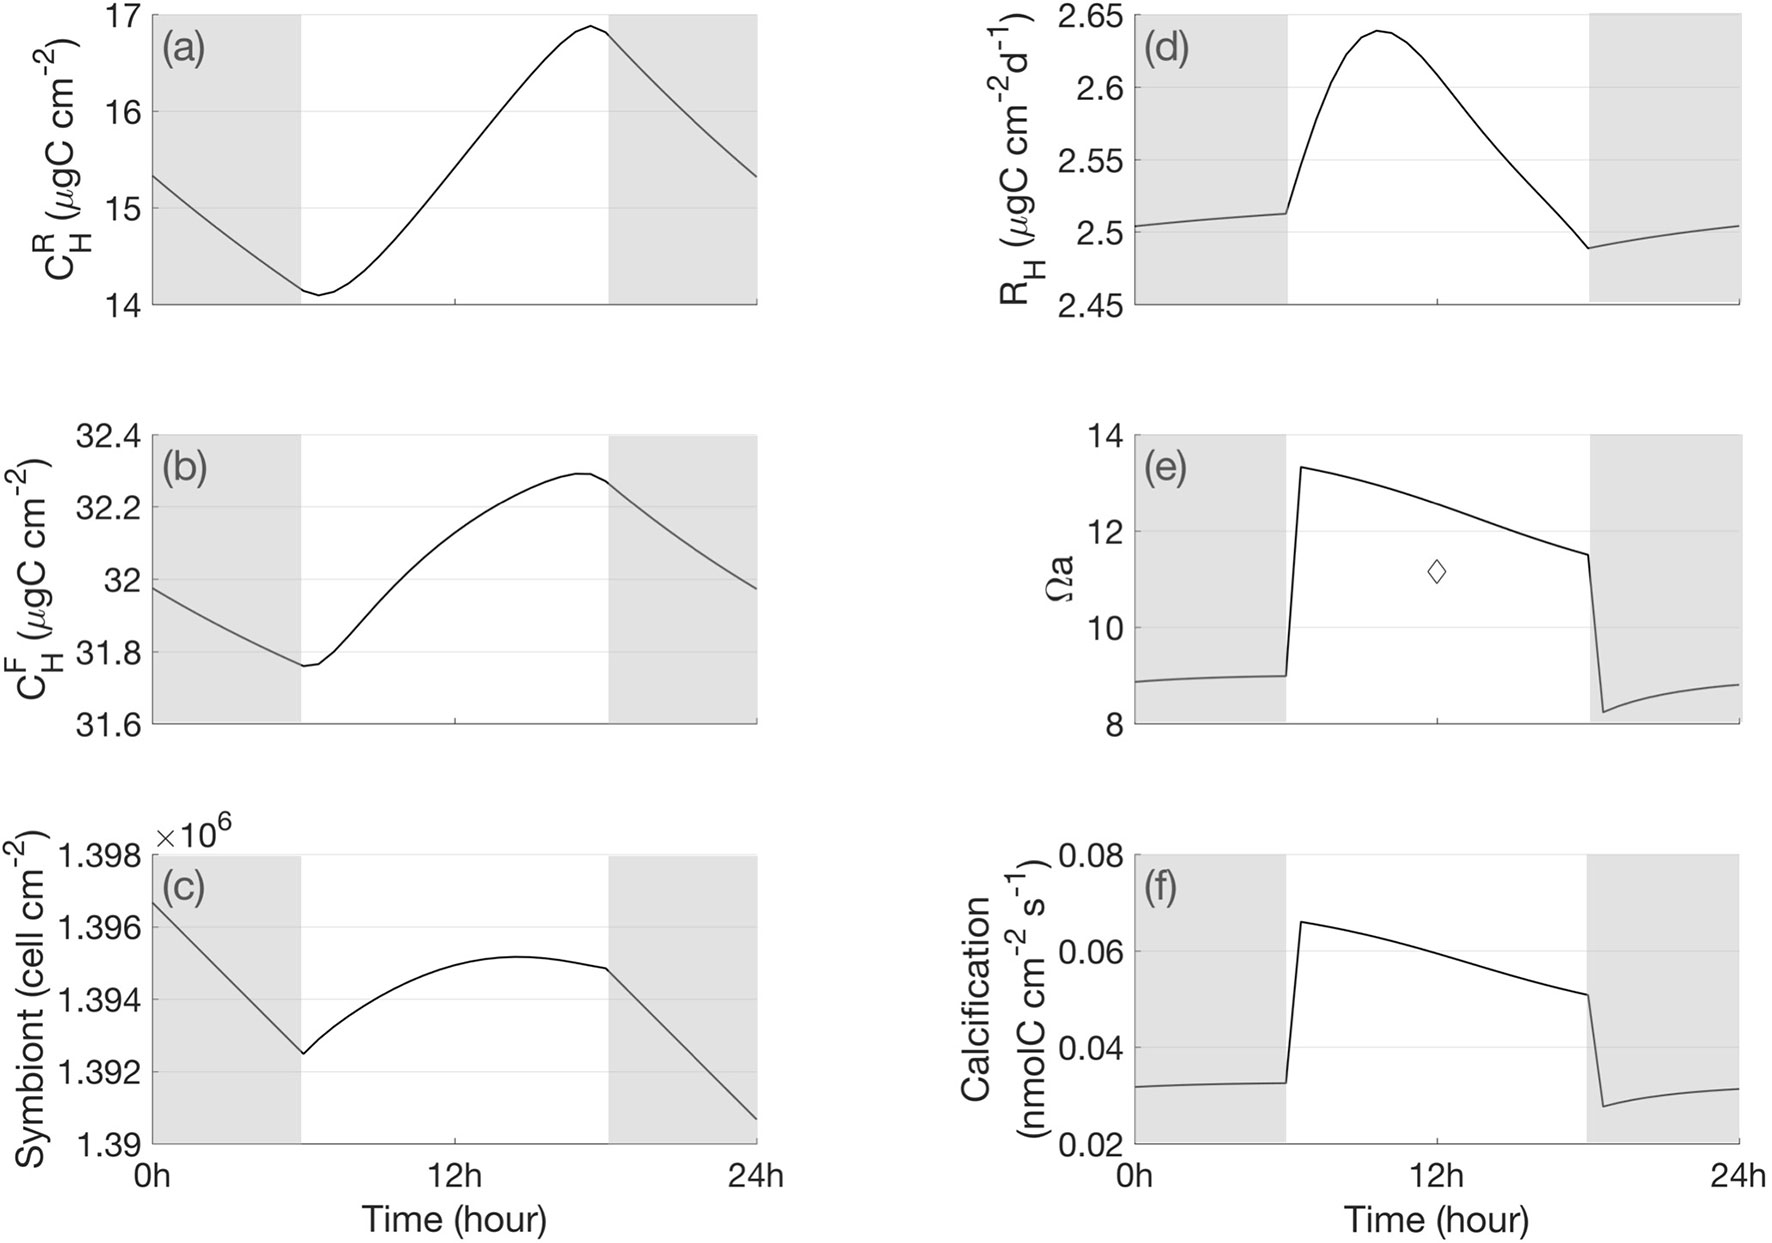
Figure 4 A 24-h cycle of the carbon content in the host. (A) carbon in the host reserve pool, (B) carbon in the host functional pool, (C) symbiont number, (D) respiration of host, (E) aragonite saturation state in the calcifying fluid, and (F) calcification rate. The diamond measured under light in Cai et al. (2016). The shaded bars indicate bark periods.
3.1.2 Carbon Budget in the Symbiosis
Quantifying how much carbon is fixed by symbiont, how much is made available to the animal by translocation and then recycled back to the symbiont is very important to evaluate the health of the symbiotic association. To illustrate the daily energy budget in the symbiont–host internal cycle, we compared each term that contributes to the carbon budget in the symbiont and host cellular carbon pool (, for details, please refer to Table 3, Eqs. S-13 and S-14) and also the inorganic carbon pool in the host tissue. The budget calculations were based on an integration over a diurnal cycle (24 h).
For the symbiont (Figure 5A), photosynthesis was the major source of reduced carbon (Figure 5A, black line), and translocation to host predominantly caused the loss of fixed carbon (Figure 5A, purple line). Respiration also contributed to carbon loss, although its rate was an order of magnitude less than that of photosynthesis and translocation (Figure 5A, red line). The photosynthesis rate is a function of irradiance. The gross photosynthesis rate is usually tens of times higher than the respiration rate in light conditions. The light respiration rate calculated herein was higher than the dark respiration rate. As for the daily carbon budget (Table 7), 21.50 µg C cm−2 of carbon was fixed through photosynthesis; approximately 30% (6.55 µg C cm−2) of this carbon was respired by the symbiont, 25% (5.23 µg C cm−2) was lost due to the symbiont mortality, 38% (8.23 µg C cm−2) was translocated to the coral reef host, and 6% (1.33 µg C cm−2) was used for the zooxanthellae growth.

Table 7 Daily carbon budget in the symbiont carbon pool, host carbon pool, and host tissue inorganic carbon pool.
Concerning the host, the translocated carbon (Figure 5B, black line) contributed up to 79% of the carbon source (Table 7), whereas re-ingested carbon from dead symbiont cells accounted for 17% of the carbon source. The heterotrophic feeding rate revealed a diurnal cycle under the assumption that the coral polyp feeds and digests only during the night (Agostini et al., 2012) (Figure 5B, red line) and accounted for 4% of the reduced carbon income for the coral reef host. Approximately 84% of carbon was shown to be lost with the death of the host in the form of mucus, and 15% was used for host respiration.
The host tissue DIC pool is the inorganic carbon source for symbiont photosynthesis and calcification (Figure 5C). As illustrated in Table 7, the DIC uptake by the coral host tissue from the surrounding seawater contributed up to 93% of the total DIC income in the host tissue. Carbon respired by the symbiont and host accounted for 5 and 2% of the DIC input, respectively. Calcification and photosynthesis were the major processes of consuming DIC and accounted for 24 and 18% of DIC, respectively. Other DIC losses in the host tissue DIC pool originated from the diffusion of CO2 to the calcifying fluid, seawater, and coelenteron, which were driven by the concentration gradient of CO2 between the components. The CO2 diffusion to the calcifying fluid contributed 4% of the DIC loss, whereas diffusion to the seawater and to the coelenteron contributed 2% of the DIC loss each.
3.1.3 Carbonate Chemistry in the Coral Polyp
The polyp model simulated the time series of the DIC and TA in the coelenteron and calcifying fluid of the polyp compartments. Calcification will directly influence carbonate chemistry in polyp component. It causes a carbon concentration gradient between the host tissue, coelenteron, and calcifying fluid, and drives the transcellular diffusion exchange, thereby affecting DIC and TA in the coelenteron and calcifying fluid. Calcification needs energy to transport Ca2+ to the skeleton in exchange for H+, where the energy flux originates from host respiration. The model results showed increased respiration under light conditions (Figures 3B, D), thus, more ATP was generated during respiration and led to an increase in calcification in light (Figure 4F). This suggests the coral biomineralization which has been identified by many coral scientists (Marshall, 1996; Gattuso et al., 1999). Due to calcification, DICcal significantly decreased in the daytime (Figure 6D). The enzyme Ca-ATPase removed protons from the calcifying fluid, thus TAcal and pHcal increased in the daytime (Figures 6E, F). Based on the mass balance term that influences changes in DICcal, calcification contributed most of the DIC loss in the calcifying fluid, the other carbon loss was CO2 diffusion through the eukaryotic cell membranes from the calcifying fluid to the host tissue (FCO2_cal). However, it was buffered by the paracellular transport of DIC from the coelenteron (FDIC_p_cal). During the daytime, photosynthesis consumed CO2 from the host tissue and created a CO2 gradient that draws CO2 from the calcifying fluid into the host tissue. In the dark, the photosynthesis rate reached zero, the ion transport became inactive, the calcification rate decreased, and DICcal increased then.
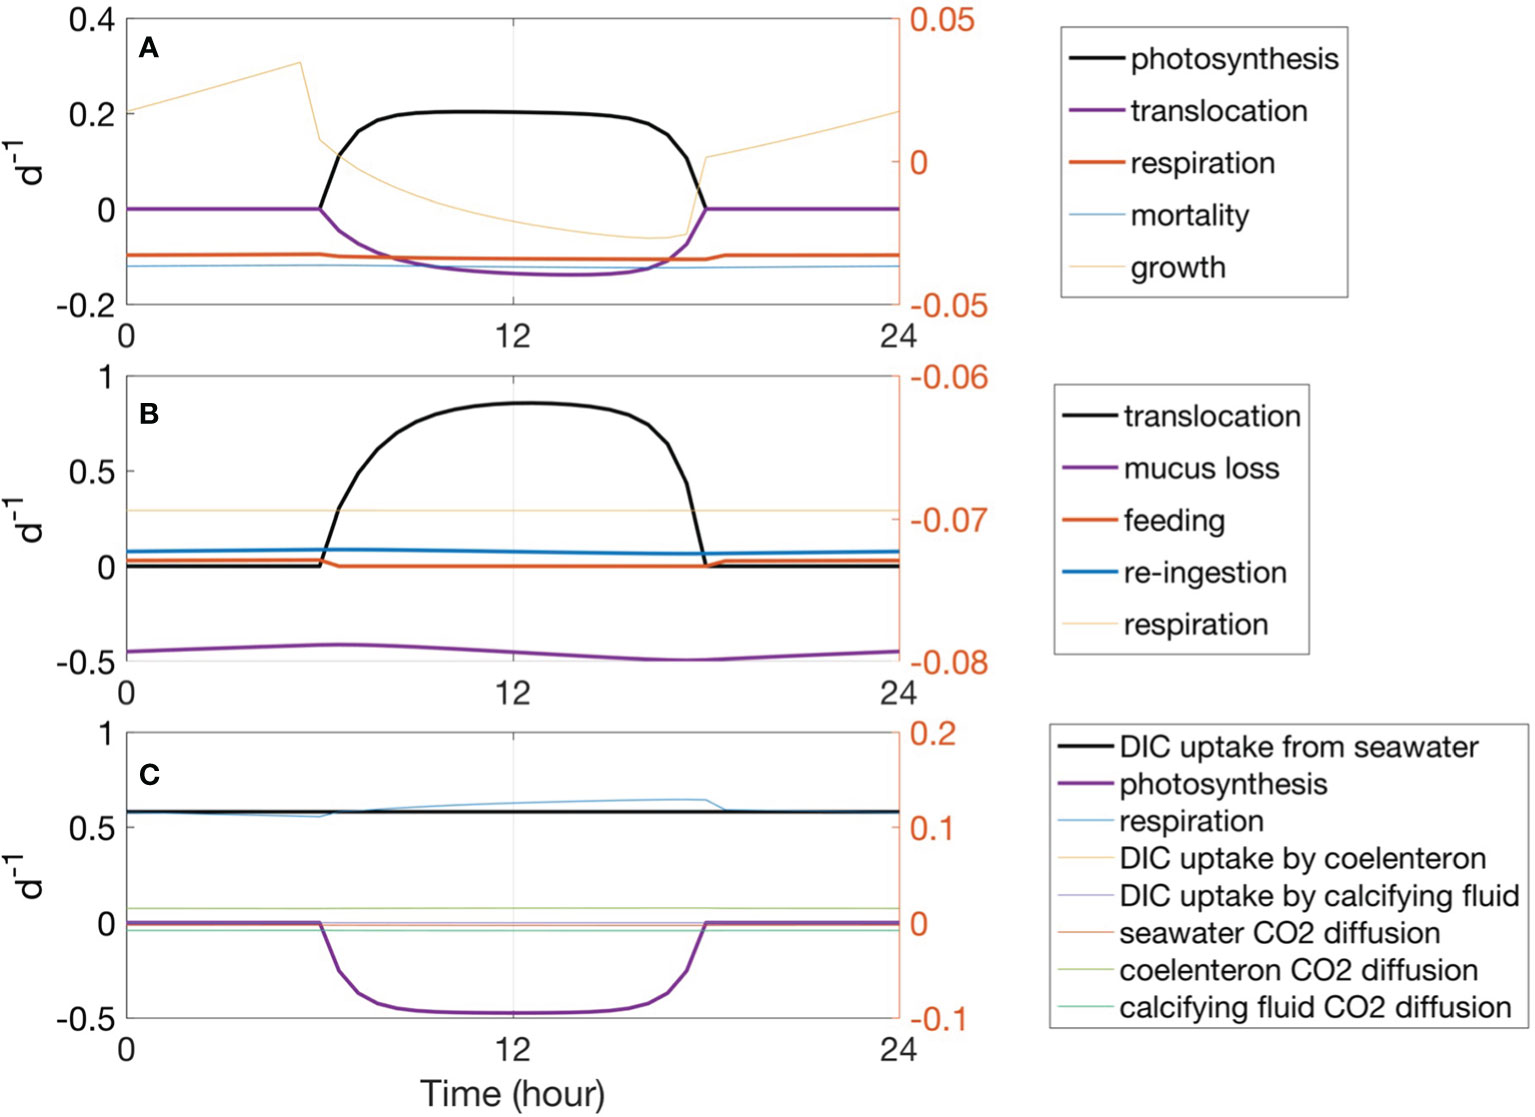
Figure 5 Fluxes influence carbon change in the symbiotic association as per the model simulation: (A) symbiont cellular carbon fluxes, (B) host carbon fluxes, and (C) host tissue DIC fluxes. As different processes experience different magnitudes of change, the major processes were plotted as bold lines with the corresponding values shown on the left axis to illustrate daily coral carbon variability. The minor processes were scaled on the right axis to demonstrate the diurnal cycle of these fluxes. Positive values indicate carbon input, negative values indicate carbon loss.
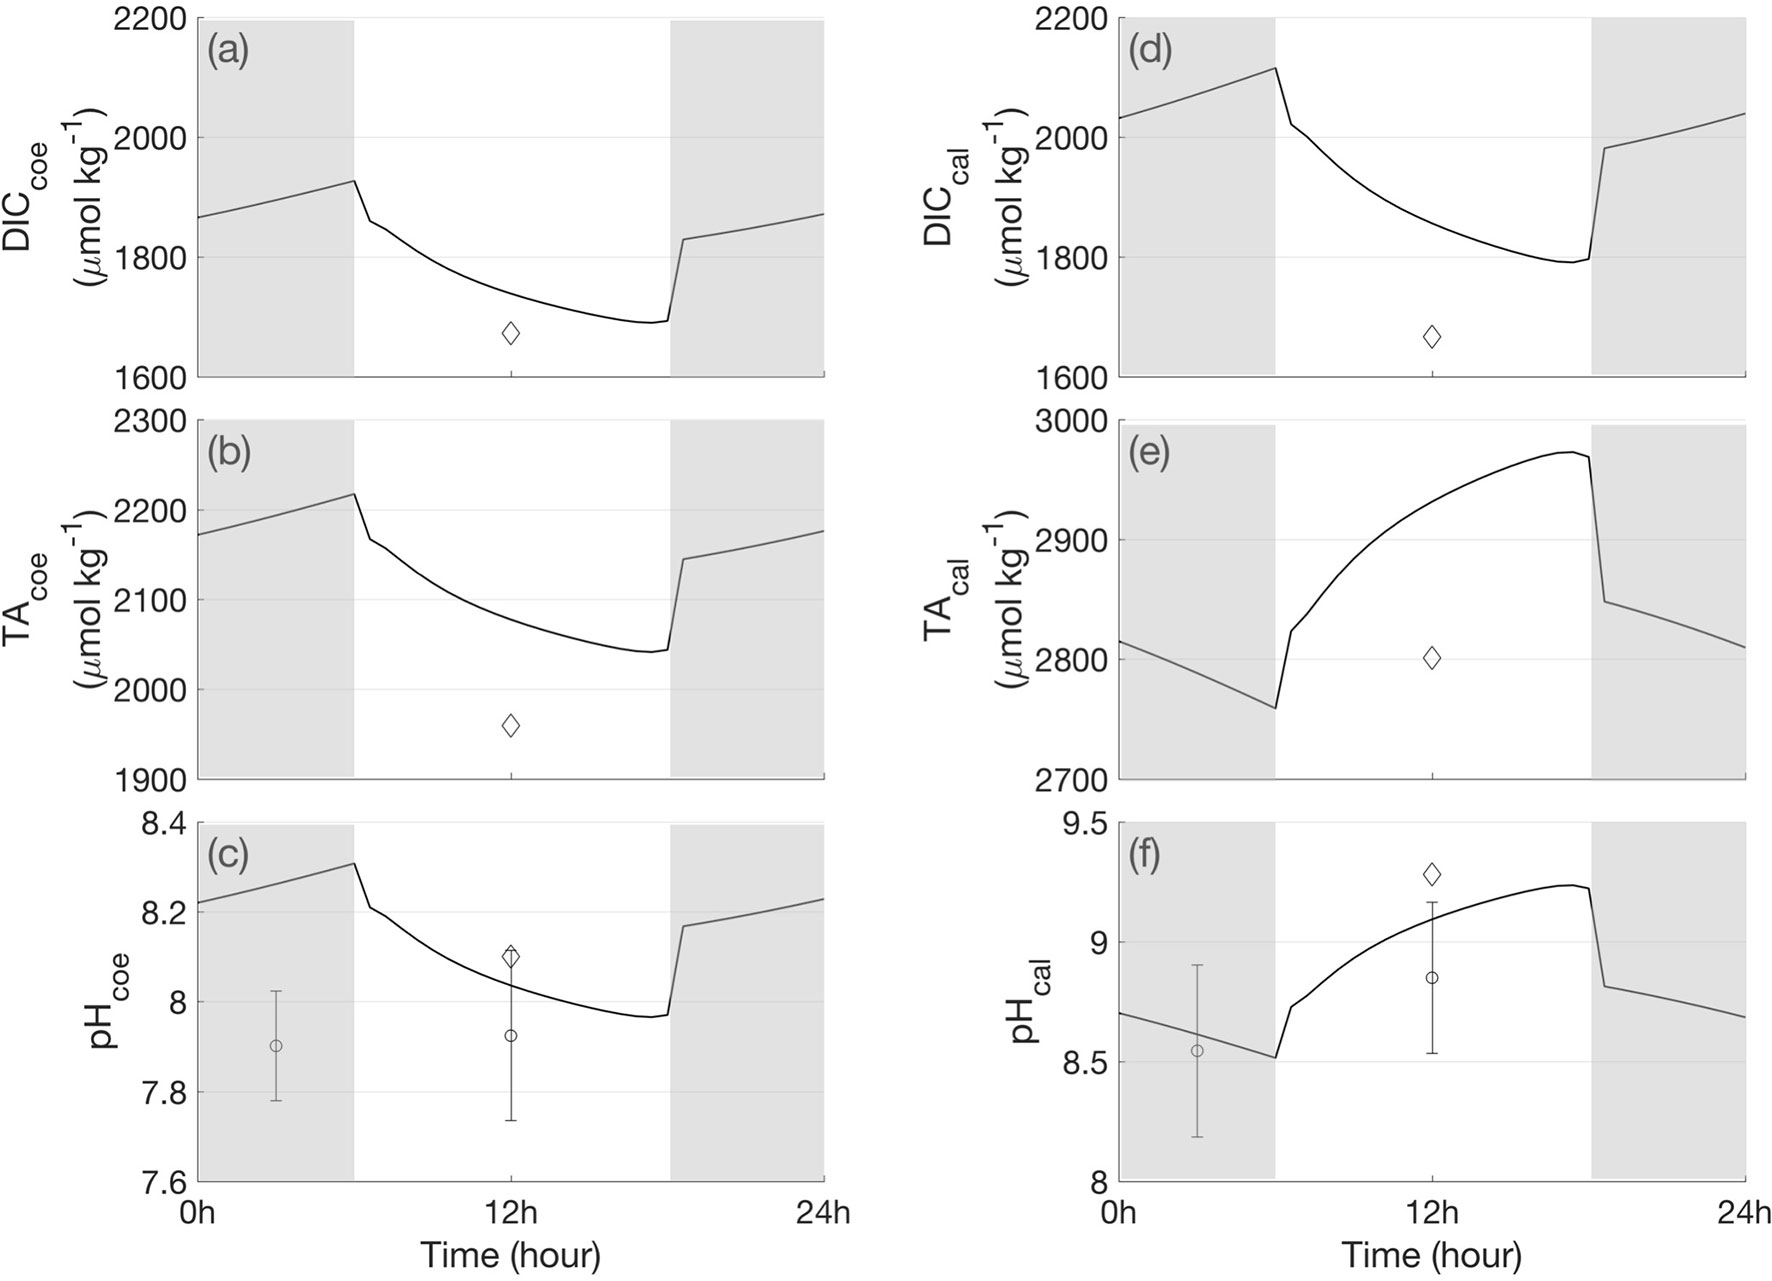
Figure 6 A 24-h cycle of the simulated DIC, TA and pH in the coelenteron and calcifying fluid. (A) DICcoe, (B) TAcoe, (C) pHcoe, (D) DICcal, (E) TAcal, (F) pHcal. The diamond sign indicates the measured DIC, TA, pH in different polyp component in under light in Cai et al. (2016). The dot with stand deviation bar denotes the pH measurements in Al–Horani et al., 2003. The shaded bars indicate bark periods.
In the coelenteron, DIC also displayed diurnal variations. DICcoe decreased in the daytime due to the paracellular diffusive transport caused by concentration gradients (Figure 6A). When DIC in the calcifying fluid decreases due to calcification, the DIC concentration gradient generated DIC efflux from the coelenteron to the calcifying fluid. Although this efflux was buffered by advective flux from the seawater through the mouth and paracellular diffusive efflux from the seawater, DIC in the coelenteron still decreased to mass balance all the fluxes. The pH and TA in the coelenteron decreased due to the removal of protons from the calcifying fluid and their addition to the coelenteron (Figures 6B, C), which corresponded to the increase of TA and pH in the calcifying fluid.
3.2 Coupled Run Results
In the coupled run, all conditions were the same as in the control run; however, the DIC, TA, NH4, and DOC values for the coral polyp model were no longer constant and followed Eqs. P-29–P-32. One of the coupled runs was under an air pCO2 of 370 ppm. To test the effect of change air pCO2, we also did a coupled run under an air pCO2 of 800 ppm. The change of air pCO2 will affect the DIC in the seawater (Eqs. (2)–(3)), thus influence the coral DIC uptake from the seawater (Table 4, Eq. H-1), and advection and/or diffusion exchanges of DIC with seawater (Table 4, Eq. H-2).
Our numerical experiments to test the influence of pCO2air on coral photosynthesis, calcification, and carbonate chemistry indicated higher photosynthesis rates and lower calcification rates when pCO2air equaled 800 ppm (Figure 7, dashed line). In our model, the saturation state of the surface ocean was controlled by pCO2air. With higher pCO2air, more CO2 was dissolved in seawater, and the excess formed carbonic acid, which disassociated to form H+ and , resulting in an increase in [ ] and a decrease in [ ]. As [ ] increased, the photosynthesis rate influenced by the concentration (Table 3, Eq. S-3) increased. This is consistent with the report that there are enhanced photosynthesis rates under higher pCO2air in some corals (Herfort et al., 2008; Marubini et al., 2008). As proposed by Furla et al. (2000), with rising pCO2air, more CO2 diffuses to the calcification site, [ ] increased and decreases the [ ], ultimately altering the overall calcification rate (Figure 7B).
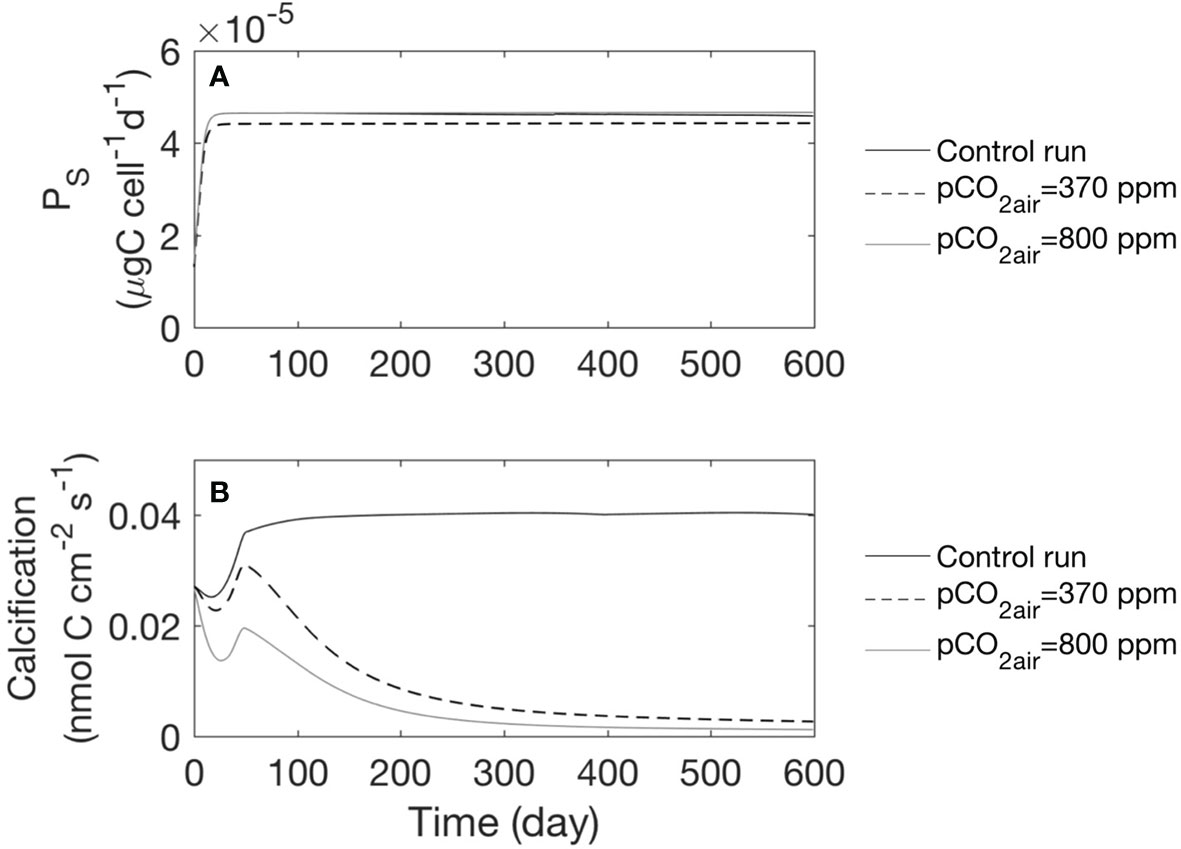
Figure 7 Model simulated photosynthesis rate and calcification rate under different air pCO2 conditions for the whole time series. We show the results for the mean of every 24 h. (A) Time series of photosynthesis rate, (B) Calcification rate.
In the coupled run under different pCO2air scenarios, the changes in DIC and TA in the polyp components are significant (Figure 8). DICcal and DICcoe reveal the same pattern, both are opposite with the change of calcification curve (Figures 8A, B), suggesting that calcification significantly contributes to the DIC variability in the calcifying fluid and then through the buffer fluxes due to the concentration gradient to influence the DIC concentration in coelenteron. The increase in DIC in the calcifying fluid under 800ppm pCO2air condition are associated with decrease in calcification rate (Figure 8A, black line). We associate the DIC increase in the coelenteron with the increase in diffusion/advection of DIC from the ambient seawater and calcifying fluid due to the concentration gradient.
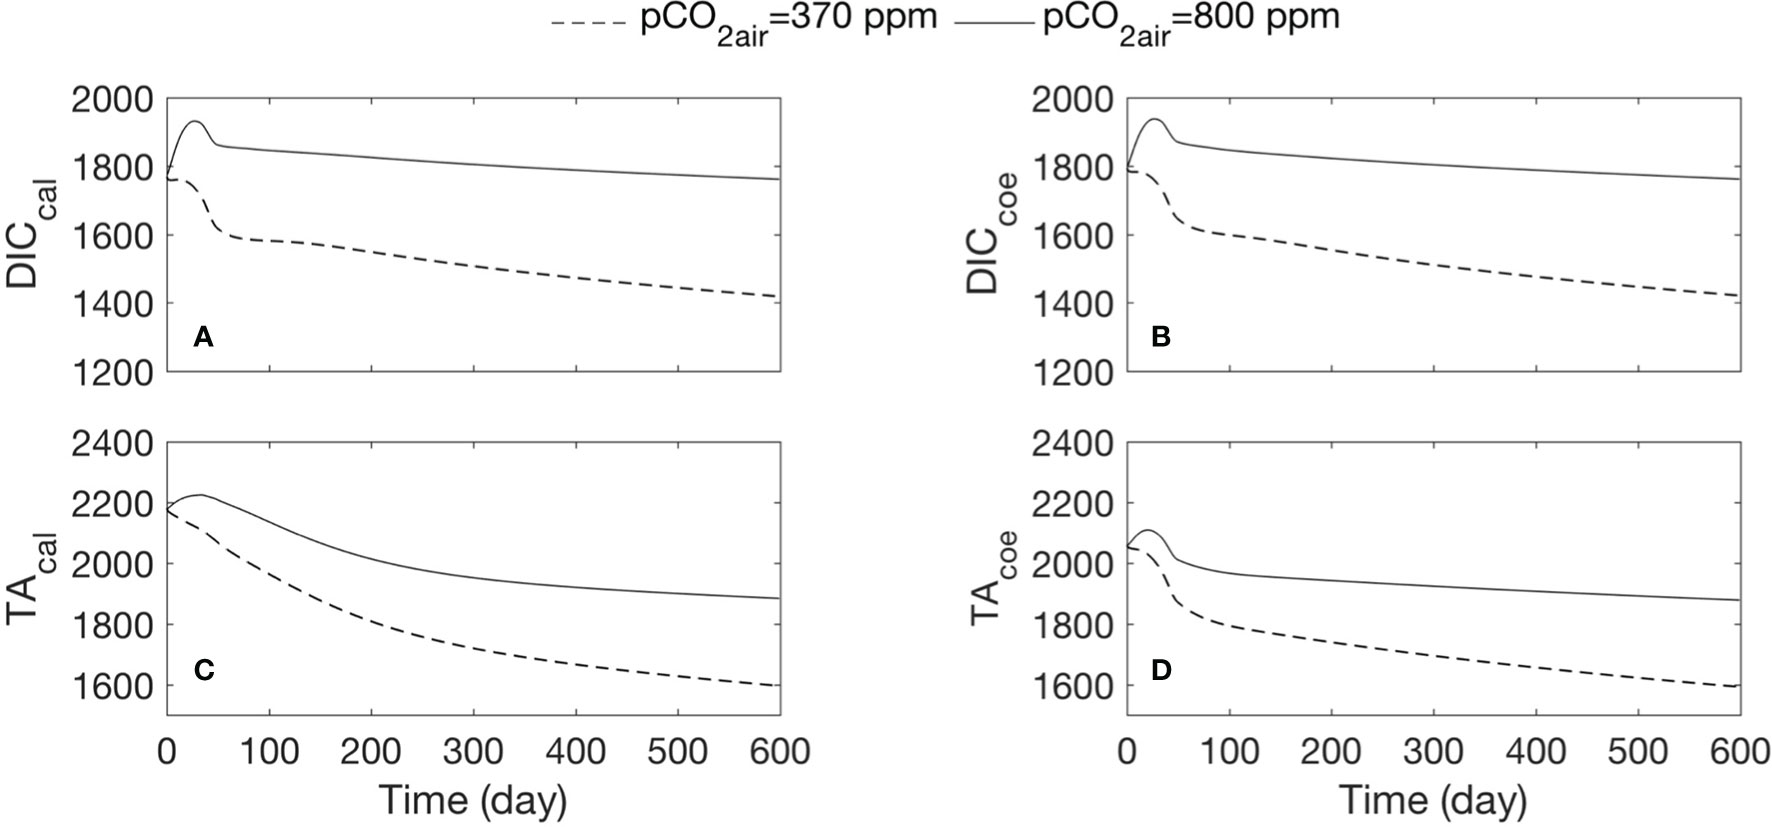
Figure 8 Comparison of DIC and TA change under different air pCO2 conditions. Dashed lines show the results of the coupled run with air pCO2 at 340 ppm; black lines demonstrate the results of the coupled run with air pCO2 at 800 ppm. We show the results for the mean of every 24 h. (A) Time series of DIC in the calcifying fluid, (B) DIC in the coelenteron, (C) TA in the calcifying fluid, (D) TA in the coelenteron.
TA in the calcifying fluid was under the balanced fluxes of calcification, proton transfer, and diffusion (Eq. P-28). The model shows higher magnitude of TA under 800 ppm pCO2air in the calcifying fluid (Figure 8C), likely associate with the decline in calcification rate and calcification-induced proton transfer out of the calcifying fluid site. The mode results suggest that calcification contributed more significantly to the TA variability in the calcifying fluid, since when 1 mol of CaCO3 is produced, 2 mol of TAcal will be consumed. In our simulation, TA in the coelenteron is also increased under 800 ppm pCO2air (Figure 8D, black line). Since TA in the coelenteron is under the balanced fluxes of proton transfer, advection, and diffusion, H+ transport by Ca-ATPase (FH) will directly influence TA in the coelenteron. The higher TA in the coelenteron could be associated with decrease in calcification due to ocean acidification and a resultantly decrease in TA consumption by calcification.
4 Discussion
In this paper, we presented a three-step approach to incorporate processes in the coral symbiont system on different scales (i.e., cellular, organismal, and ecosystem community) into a coupled model to explore different functions of coral symbiosis system in an integrative way. This process-based model specifically explained how the biological processes regulate the biomineralization mechanisms at the cellular level, the importance of ion transport for the calcification processes at the organismal level, and the influence of environmental changes (pCO2air) on the coral biochemical processes and carbonate chemistry. When compare with the lab-experiments (Muscatine et al., 1984; Falkowski et al., 1984), in the control run under the steady state, the model results indicate good representation of diurnal variations of the critical processes, e.g., photosynthesis, respiration, and carbon translocation in the coral symbiosis; the modeled ion concentration and diurnal variations in different polyp components are broadly consistent with the microelectrodes measurements and boron isotope systematics (Al–Horani et al., 2003; McCulloch et al., 2012; Cai et al., 2016), for example, pH in the calcifying fluid keeps higher than that in the coelenteron, and there are enhanced pHcal when photosynthesis and calcification are highest. This suggests that the model is based on reasonable assumptions and parameterizations.
The model-simulated carbon budget of symbiont photosynthesis (32.25 µg C cm−2) is lower than the values published earlier of 57.6 ± 23.1 µg C cm−2 by Houlbrèque et al., 2003) and 164.3 ± 17.3 µg C cm−2 for fed coral by Houlbrèque et al. (2004). We believe that the lower values in our model simulation are associated with the low DIN uptake rate with a maximum value of approximately 1.2 µg N cm−2d−1 and approximately 0.005 µg N cm−2 d−1 at the end of the model run. Our model showed about two times lower host respiration rate than the observed rate in Falkowski et al. (1984). One explanation could be the low heterotrophic feeding rate in our model (about 0.9 µg C cm−2 in a daily budget), which will result in less C in the host functional pool, thus lower metabolism demand. Mucus loss in our model simulation was 12.21 µg C cm−2 and was the same order of magnitude as a measured DOC release of 9.6 ± 0.72 µg C cm−2 for Acropora corals by Naumann et al. (2010). As denoted in Figure 6E, the modelled Ωa was close to the measurement in Cai et al. (2016). The modeled pH and Ωa in the calcifying fluid were close to the range of that measured using boron isotope systematics in McCulloch et al. (2012) which found that the coral shows species-dependent pH range of 8.4–8.7, and with Ωa of 15–25. In the simulation results, the calcification rate gradually decreases with the decrease of Ωa, this is consistent with the previous studies that there are both linear and nonlinear relationships between calcification rate and Ωa (Gattuso et al., 1999; Marubini et al., 2008).
In our model, we built a connection between photosynthesis and calcification under the assumption that photosynthesis and calcification shared a common DIC pool in the host cell. Therefore, our model could predict the change in photosynthesis, calcification rate, and polyp carbonate chemistry under different air pCO2 conditions. Elevated air pCO2 was shown to enhance the photosynthesis rate due to the increase in [ ] in the ambient seawater for the zooxanthellae uptake. This further implies that higher air pCO2 could stimulate higher rates of coral calcification due to increased energy produced by photosynthesis to drive Ca-ATPase. However, in our simulations, there was a decreased calcification rate under higher pCO2 (Figure 7), suggesting that photosynthesis and calcification compete for the internal supply of the host DIC pool. Photosynthesis decreases the internal DIC pool in the host cell and results in less available for calcification. These results support the hypothesis that elevated pCO2 stimulates photosynthesis, resulting in a reduced DIC supply to calcification (Hoegh–Guldberg and Smith, 1989; Marubini and Thake, 1999).
The model we developed is an idealized approach that only considered a 1-D idealized with constant wind stress, current speed, temperature, and salinity simulation. Through this study, we built a frame work by coupling the coral ecosystem with surrounding water column with phytoplankton biogeochemical processes, and can be used to test the feedback between two ecosystems using different air pCO2 scenarios. However, in the model presented herein, one of the weaknesses is we did not consider the stability of the symbiosis. In a stable corals symbiosis, the density of zooxanthellae and its symbiotic partner remain relatively constant under a given set of environmental conditions, either the growth rates of the zooxanthellae and the host cells are comparable, if different, excess the extra algae may be expelled. Although we have used S/Smax to specify the ability of packing symbionts in the host tissue, we did not consider the surface area of the host tissue increases with size, as well as coral colonies grow by depositing new skeleton and budding additional polyps. Thus, the and may be accumulated. Another weakness is the constant temperature set up in the current version. The temperature forcing function can be updated to investigate whether the model can reproduce the seasonally fluctuating symbiont density in host tissue (Fitt et al., 2000). In the model, we only considered the increased concentration of dissolved CO2, which resulted in a decreased carbonate concentration and therefore, a decreased saturation state. Heat is absorbed (endothermic) during the formation of CaCO3 precipitate, and solubility decreases with increasing temperature (Mucci, 1983). It is also necessary to incorporate the effects of ocean warming on rates of calcification into the model. The breakdown of symbiosis has been related with temperature (Lesser, 1997; Jones and Hoegh‐Guldberg, 2001). There is no simple explanation for the cause of bleaching as it is a complicated process where several different mechanisms are likely involved in any given coral, depending on its physiological state and environmental conditions, however, experiments conducted under stable environmental conditions are limited in representing actual coral reef system responses to environmental change. In order to understand and predict the responses of coral reefs to changing environment, improved models consider combined changes in environmental conditions such as light, temperature, and nutrition are necessary.
In this study, based on sophisticated parameterization, we developed a coral symbiosis model system and validated the model accuracy by comparing the results with laboratorial observations. Our model can reconstruct the diurnal cycle of coral metabolism, and give the right response of coral carbonate chemistry under different air pCO2 scenarios. Our validations are limited, since some of the parameters are based on experimental and observations of short-term changes in a single environmental condition, and it is a challenge to use such parameters to investigate the long-term response of corals to large-scale changes in environmental variables. Therefore, more processed based formulations need to be developed to overcome simplified assumptions of parameters in the future work.
Data Availability Statement
The original contributions presented in the study are included in the article/Supplementary Material. Further inquiries can be directed to the corresponding author.
Author Contributions
YX: Conceptualization, Methodology, Formal analysis, Investigation, Writing—Original Draft, Funding acquisition. JiZ: Supervision, Project administration, Reviewing and Editing. HH: Reviewing and Editing. XY: Discussion. JuZ: Discussion. JG: Discussion. All authors listed have made a substantial, direct, and intellectual contribution to the work and approved it for publication.
Funding
This work was supported by the National Natural Science Foundation of China (Grant Nos. 42090043, 41606025 and 41876074).
Conflict of Interest
The authors declare that the research was conducted in the absence of any commercial or financial relationships that could be construed as a potential conflict of interest.
Publisher’s Note
All claims expressed in this article are solely those of the authors and do not necessarily represent those of their affiliated organizations, or those of the publisher, the editors and the reviewers. Any product that may be evaluated in this article, or claim that may be made by its manufacturer, is not guaranteed or endorsed by the publisher.
Acknowledgments
We are grateful to the two anonymous reviewers for the constructive comments that improved the manuscript a lot. This work forms part of a research initiative of UNESCO/IOC-WESTPAC-Sub-Commission on “Coral Reefs under Climate and Anthropogenic Perturbations” (i.e. IOC/WESTPAC-CorReCAP Project). We thank Prof. Yeemin and Prof. Hong for their helpful comments.
Supplementary Material
The Supplementary Material for this article can be found online at: https://www.frontiersin.org/articles/10.3389/fmars.2022.749921/full#supplementary-material
References
Agostini S., Suzuki Y., Higuchi T., Casareto B. E., Yoshinaga K., Nakano Y., et al. (2012). Biological and Chemical Characteristics of the Coral Gastric Cavity. Coral Reefs 31 (1), 147–156. doi: 10.1007/s00338-011-0831-6
Al–Horani F. A., Al–Moghrabi S. M., De Beer D. (2003). The Mechanism of Calcification and its Relation to Photosynthesis and Respiration in the Scleractinian Coral Galaxea Fascicularis. Mar. Biol. 142 (3), 419–426. doi: 10.1007/s00227-002-0981-8
Allemand D., Tambutté É, Zoccola D., Tambutté S. (2011). “Coral Calcification, Cells to Reefs,” in In Coral Reefs: An Ecosystem in Transition (Dordrecht: Springer), 119–150.
Al-Moghrabi S., Allemand D., Couret J. M., Jaubert J. (1995). Fatty Acids of the Scleractinian Coral Galaxea Fascicularis: Effect of Light and Feeding. J. Comp. Physio.l B. 165, 183–19. doi: 10.1007/BF00260809
Andersson A. J., Kline D. I., Edmunds P. J., Archer S. D., Bednaršek N., Carpenter R. C., et al. (2015). Understanding Ocean Acidification Impacts on Organismal to Ecological Scales. Oceanography 28 (2), 16–27. doi: 10.5670/oceanog.2015.27
Baird M. E., Mongin M., Rizwi F., Bay L. K., Cantin N. E., Soja–Woźniak M., et al. (2018). A Mechanistic Model of Coral Bleaching Due to Temperature–Mediated Light–Driven Reactive Oxygen Build–Up in Zooxanthellae. Ecol. Modell. 386, 20–37. doi: 10.1016/j.ecolmodel.2018.07.013
Burton E. A., Walter L. M. (1990). The Role of pH in Phosphate Inhibition of Calcite and Aragonite Precipitation Rates in Seawater. Geochim Cosmochim Acta 54, 797–808.
Cai W. J., Ma Y., Hopkinson B., Grottoli A., Warner M., Ding Q., et al. (2016). Microelectrode Characterization of Coral Daytime Interior pH and Carbonate Chemistry. Nat. Commun. 7, 11144. doi: 10.1038/ncomms11144
Cohen A. L., McConnaughey T. A. (2003). Geochemical Perspectives on Coral Mineralization. Rev. Mineral. Geochem. 54 (1), 151–187. doi: 10.2113/0540151
Crossland C. J., Barnes D. J., Borowitzka M. A. (1980). Diurnal Lipid and Mucus Production in the Staghorn Coral Acropora Acuminata. Mar. Biol. 60 (2–3), 81–90. doi: 10.1007/BF00389151
Cunning R., Muller E. B., Gates R. D., Nisbet R. M. (2017). A Dynamic Bioenergetic Model for Coral–Symbiodinium Symbioses and Coral Bleaching as an Alternate Stable State. J. Theor. Biol. 431, 49–62. doi: 10.1016/j.jtbi.2017.08.003
Domotor S. L., D’Elia C. F. (1984). Nutrient Uptake Kinetics and Growth of Zooxanthellae Maintained in Laboratory Culture. Mar. Biol. 80 (1), 93–101. doi: 10.1007/BF00393132
Eyre B. D., Cyronak T., Drupp P., De Carlo E. H., Sachs J. P., Andersson A. J. (2018). Coral Reefs Will Transition to Net Dissolving Before End of Century. Science 359 (6378), 908–911. doi: 10.1126/science.aao1118
Fairall C. W., Bradley E. F., Hare J. E., Grachev A. A., Edson J. B. (2003). Bulk Parameterization of Air–Sea Fluxes: Updates and Verification for the COARE Algorithm. J. Climate 16 (4), 571–591. doi: 10.1175/1520-0442(2003)016<0571:BPOASF>2.0.CO;2
Falkowski P. G., Dubinsky Z., Muscatine L., McCloskey L. (1993). Population Control in Symbiotic Corals. Bioscience 43 (9), 606–611. doi: 10.2307/1312147
Falkowski P. G., Dubinsky Z., Muscatine L., Porter J. W. (1984). Light and the Bioenergetics of a Symbiotic Coral. Bioscience 34 (11), 705–709. doi: 10.2307/1309663
Fennel K., Wilkin J. (2009). Quantifying Biological Carbon Export for the Northwest North Atlantic Continental Shelves. Geophys. Res. Lett. 36 (18), L18605. doi: 10.1029/2009GL039818
Fennel K., Wilkin J., Levin J., Moisan J., O’Reilly J., Haidvogel D. (2006). Nitrogen Cycling in the Middle Atlantic Bight: Results From a Three-Dimensional Model and Implications for the North Atlantic Nitrogen Budget. Global Biogeochem. Cycles 20 (3). doi: 10.1029/2005GB002456
Fitt W. K., McFarland F. K., Warner M. E., Chilcoat G. C. (2000). Seasonal Patterns of Tissue Biomass and Densities of Symbiotic Dinoflagellates in Reef Corals and Relation to Coral Bleaching. Limnol. Oceanogr. 45, 677–685. doi: 10.4319/lo.2000.45.3.0677
Frankowiak K., Wang X. T., Sigman D. M., Gothmann A. M., Kitahara M. V., Mazur M., et al. (2016). Photosymbiosis and the Expansion of Shallow–Water Corals. Sci. Adv. 2 (11), e1601122–e1601122. doi: 10.1126/sciadv.1601122
Furla P., Galgani I., Durand I., Allemand D. (2000). Sources and Mechanisms of Inorganic Carbon Transport for Coral Calcification and Photosynthesis. J. Exp. Biol. 203 (22), 3445–3457. doi: 10.1242/jeb.203.22.3445
Gattuso J. P., Allemand D., Frankignoulle M. (1999). Photosynthesis and Calcification at Cellular, Organismal and Community Levels in Coral Reefs: A Review on Interactions and Control by Carbonate Chemistry. Am. Zool. 39 (1), 160–183. doi: 10.1093/icb/39.1.160
Goiran C., Al–Moghrabi S., Allemand D., Jaubert J. (1996). Inorganic Carbon Uptake for Photosynthesis by the Symbiotic Coral/Dinoflagellate Association I. Photosynthetic Performances of Symbionts and Dependence on Sea Water Bicarbonate. J. Exp. Mar. Biol. Ecol. 199 (2), 207–225. doi: 10.1016/0022-0981(95)00202-2
Gustafsson M. S., Baird M. E., Ralph P. J. (2013). The Interchangeability of Autotrophic and Heterotrophic Nitrogen Sources in Scleractinian Coral Symbiotic Relationships: A Numerical Study. Ecol. Modell. 250, 183–194. doi: 10.1016/j.ecolmodel.2012.11.003
Gustafsson M. S., Baird M. E., Ralph P. J. (2014). Modeling Photoinhibition-Driven Bleaching in Scleractinian Coral as a Function of Light, Temperature, and Heterotrophy. Limnol. Oceanogr. 59 (2), 603–622. doi: 10.4319/lo.2014.59.2.0603
Haidvogel D. B., Arango H., Budgell W. P., Cornuelle B. D., Curchitser E., Di Lorenzo E., et al. (2008). Ocean Forecasting in Terrain–Following Coordinates: Formulation and Skill Assessment of the Regional Ocean Modeling System. J. Comput. Phys. 227 (7), 3595–3624. doi: 10.1016/j.jcp.2007.06.016
Hasumi H., Nagata T. (2014). Modeling the Global Cycle of Marine Dissolved Organic Matter and Its Influence on Marine Productivity. Ecol. Model. 288, 9–24.
Hearn C., Atkinson M., Falter J. (2001). A Physical Derivation of Nutrient–Uptake Rates in Coral Reefs: Effects of Roughness and Waves. Coral Reefs 20 (4), 347–356. doi: 10.1007/s00338-001-0185-6
Herfort L., Thake B., Tauber I. (2008). Bicarbonate Stimulation of Calcification and Photosynthesis in Two Hermatypic Corals. J. Phycol. 44, 91–98. doi: 10.1111/j.1529-8817.2007.00445.x
Hoegh–Guldberg O., Mumby P. J., Hooten A. J., Steneck R. S., Greenfield P. (2007). Coral Reefs Under Rapid Climate Change and Ocean Acidification. Science 318, 1737. doi: 10.1126/science.1152509
Hoegh–Guldberg O., Smith G. J. (1989). Influence of the Population Density of Zooxanthellae and Supply of Ammonium on the Biomass and Metabolic Characteristics of the Reef Corals Seriatophora Hystrix and Stylophora Pistillata. Mar. Ecol. Prog. Ser. 57, 173–186. doi: 10.3354/meps057173
Hoegh–Guldberg O., Williamson J. (1999). Availability of Two Forms of Dissolved Nitrogen to the Coral Pocillopora Damicornis and its Symbiotic Zooxanthellae. Mar. Biol. 133 (3), 561–570. doi: 10.1007/s002270050496
Hohn S., Merico A. (2012). Modelling Coral Polyp Calcification in Relation to Ocean Acidification. Biogeosciences 9 (11), 4441–4454. doi: 10.5194/bg-9-4441-2012
Hohn S., Merico A. (2015). Quantifying the Relative Importance of Transcellular and Paracellular Ion Transports to Coral Polyp Calcification. Front. Earth Sci. 2, 37. doi: 10.3389/feart.2014.00037
Houlbrèque F., Tambutté E., Ferrier–Pagès C. (2003). Effect of Zooplankton Avail– Ability on the Rates of Photosynthesis, and Tissue and Skeletal Growth in the Scleractinian Coral Stylophora Pistillata. J. Exp. Mar. Biol. Ecol. 296, 145–166. doi: 10.1016/S0022-0981(03)00259-4
Houlbrèque F., Tambutte E., Allemand D., Ferrier–Pages C. (2004). Interactions Between Zooplankton Feeding, Photosynthesis and Skeletal Growth in the Scleractinian Coral Stylophora Pistillata. J. Exp. Biol. 207, 1461–1469. doi: 10.1242/jeb.00911
Jones R. J., Hoegh-Guldberg O. (2001). Diurnal Changes in the Photochemical Efficiency of the Symbiotic Dinoflagellates (Dinophyceae) of Corals: Photoprotection, Photoinactivation and the Relationship to Coral Bleaching. Plant Cell Environ. 24 (1), 89–99. doi: 10.1046/j.1365-3040.2001.00648.x
Kline D. I., Teneva L., Okamoto D. K., Schneider K., Caldeira K., Miard T., et al. (2019). Living Coral Tissue Slows Skeletal Dissolution Related to Ocean Acidification. Nat. Ecol. Evol. 3 (10), 1438–1444. doi: 10.1038/s41559-019-0988-x
Kühl M., Cohen Y., Dalsgaard T., Jørgensen B. B., Revsbech N. P. (1995). Microenvironment and Photosynthesis of Zooxanthellae in Scleractinian Corals Studied With Microsensors for O2, pH and Light. Mar. Ecol. Prog. Ser. 117, 159–172. doi: 10.3354/meps117159
Lesser M. P. (1997). Oxidative Stress Causes Coral Bleaching During Exposure to Elevated Temperatures. Coral Reefs 16 (3), 187–192. doi: 10.1007/s003380050073
Levas S., Grottoli A. G., Warner M. E., Cai W. J., Bauer J., Schoepf V., et al. (2015). Organic Carbon Fluxes Mediated by Corals at Elevated Pco2 and Temperature. Mar. Ecol. Prog. Ser. 519, 153–164. doi: 10.3354/meps11072
Li Y., Gal G., Makler-Pick V., Waite A. M., Bruce L. C., Hipsey M. R. (2014). Examination of the Role of the Microbial Loop in Regulating Lake Nutrient Stoichiometry and Phytoplankton Dynamics. Biogeosciences 11, 2939–2960. doi: 10.5194/bg-11-2939-2014
Marshall A. T. (1996). Calcification in Hermatypic and Ahermatypic Corals. Science 271, 637–639. doi: 10.1126/science.271.5249.637
Marubini F., Ferrier–Page`s C., Furla P., Allemand D. (2008). Coral Calcification Responds to Seawater Acidification: A Working Hypothesis Towards a Physiological Mechanism. Coral Reefs 27, 491–499. doi: 10.1007/s00338-008-0375-6
Marubini F., Thake B. (1999). Bicarbonate Addition Promotes Coral Growth. Limnol. Oceanogr. 44, 716–720. doi: 10.4319/lo.1999.44.3.0716
McAuley P. J., Smith V. J. (1995). Effect of Diel Photoperiod on Nitrogen Metabolism of Cultured and Symbiotic Zooxanthellae. Mar. Biol. 123 (1), 145–152. doi: 10.1007/BF00350333
McCulloch M. T., Trotter J. A., Falter J., Montagna P. (2012). Coral Resilience to Ocean Acidification and Global Warming Through pH Up–Regulation. Nat. Climate Change 2, 623–627. doi: 10.1038/nclimate1473
Morrison R. J., Denton G. R. W., Tamata U. B., Grignon J. (2013). Anthropogenic Biogeochemical Impacts on Coral Reefs in the Pacific Islands—An Overview. Deep Sea Res. Part II: Topical Stud. Oceanogr. 96, 5–12. doi: 10.1016/j.dsr2.2013.02.014
Mucci A. (1983). The Solubility of Calcite and Aragonite in Seawater at Various Salinities, Temperatures, and One Atmosphere Total Pressure. Am. J. Sci. 283 (7), 780–799. doi: 10.2475/ajs.283.7.780
Muller E. B., Kooijman S. A. L. M., Edmunds P. J., Doyle F. J., Nisbet R. M. (2009). Dynamic Energy Budgets in Syntrophic Symbiotic Relationships Between Heterotrophic Hosts and Photoautotrophic Symbionts. J. Theor. Biol. 259, 44–57.
Mueller B., de Goeij J. M., Vermeij M. J., Mulders Y., van der Ent E., Ribes M., et al. (2014). Natural Diet of Coral–Excavating Sponges Consists Mainly of Dissolved Organic Carbon (DOC). PloS One 9 (2), e90152. doi: 10.1371/journal.pone.0090152
Muller–Parker G., Cook C., D’Elia C. (1994). Elemental Composition of the Coral Pocil– Lopora Damicornis Exposed to Elevated Seawater Ammonium. Pac. Sci. 48, 234–246.
Muscatine L. (1990). The Role of Symbiotic Algae in Carbon and Energy Flux in Reef Corals. Coral Reefs 25, 1–29.
Muscatine L., D’elia C. (1978). The Uptake, Retention, and Release of Ammonium by Reef Corals. Limnol. Oceanogr. 23, 725–734. doi: 10.4319/lo.1978.23.4.0725
Muscatine L., Falkowski P., Porter P. J., Dubinsky Z. (1984). Fate of Photosynthetic Fixed Carbon in Light–and Shade–Adapted Colonies of the Symbiotic Coral Stylophora Pistillata. Proc. R. Soc. London Ser. B Biol. Sci., 1227. 181–202. doi: 10.1098/rspb.1984.0058
Nakamura T., Nadaoka K., Watanabe A. (2013). A Coral Polyp Model of Photosynthesis, Respiration and Calcification Incorporating a Transcellular Ion Transport Mechanism. Coral Reefs 32 (3), 779–794. doi: 10.1007/s00338-013-1032-2
Nakamura T., Nadaoka K., Watanabe A., Yamamoto T., Miyajima T., Blanco A. C. (2018). Reef–scale Modeling of Coral Calcification Responses to Ocean Acidification and Sea–Level Rise. Coral Reefs 37 (1), 37–53. doi: 10.1007/s00338-017-1632-3
Naumann M. S., Haas A., Struck U., Mayr C., el-Zibdah M., Wild C. (2010). Organic Matter Release by Dominant Hermatypic Corals of the Northern Red Sea. Coral Reefs 29, 649–659. doi: 10.1007/s00338-010-0612-7
Pupier C. A., Fine M., Bednarz V. N., Rottier C., Grover R., Ferrier–Pagès C. (2019). Productivity and Carbon Fluxes Depend on Species and Symbiont Density in Soft Coral Symbioses. Sci. Rep. 9 (1), 1–10. doi: 10.1038/s41598-019-54209-8
Reidenbach M. A., Monismith S. G., Koseff J. R., Yahel G., Genin A. (2006). Boundary Layer Turbulence and Flow Structure Over a Fringing Coral Reef. Limnol. Oceanogr. 51, 1956–1968.
Ross O., Geider R. (2009). New Cell-Based Model of Photosynthesis and Photo-Acclimation: Accumulation and Mobilisation of Energy Reserves in Phytoplankton. Mar. Ecol. Prog. Ser. 383, 53–71. doi: 10.3354/meps07961
Shaw E. C., Phinn S. R., Tilbrook B., Steven A. (2015). Natural in Situ Relationships Suggest Coral Reef Calcium Carbonate Production Will Decline With Ocean Acidification. Limnol. Oceanogr. 60 (3), 777–788. doi: 10.1002/lno.10048
Stimson J. (1997). The Annual Cycle of Density of Zooxanthellae in the Tissues of Field and Laboratory–Held Pocillopora Damicornis (Linnaeus). J. Exp. Mar. Biol. Ecol. 214, 35–48. doi: 10.1016/S0022-0981(96)02753-0
Sültemeyer D., Rinast K. (1996). The CO2 Permeability of the Plasma Membrane of Chlamydomonas Reinhardtii: Mass-Spectrometric 18O-Exchange Measurements From 13C 18O2 in Suspensions of Carbonic Anhydrase Loaded Plasma Membrane Vesicles. Planta 200, 358–368. doi: 10.1007/BF00200304
Tambutté É., Allemand D., Mueller E., Jaubert J. (1996). A Compartmental Approach to the Mechanism of Calcification in Hermatypic Xorals. J. Exp. Biol. 199, 1029–1041.
Venn A. A., Tambutté E., Lotto S., Zoccola D., Allemand D., Tambutté S. (2009). Imaging Intracellular pH in a Reef Coral and Symbiotic Anemone. Proc. Natl. Acad. Sci. U. S. A. 106, 16574–16579. doi: 10.1073/pnas.0902894106
Walter L. M., Morse J. W. (1985). The Dissolution Kinetics of Shallow Marine Carbonates in Seawater: A Laboratory Study. Geochim Cosmochim Acta 49, 1503–1513.
Weiss R. F. (1974). Carbon Dioxide in Water and Seawater: The Solubility of a Non–Ideal Gas. Mar. Chem. 2 (3), 203–215. doi: 10.1016/0304-4203(74)90015-2
Xu Y., Cahill B., Wilkin J., Schofield O. (2013). Role of Wind in Regulating Phytoplankton Blooms on the Mid–Atlantic Bight. Continental Shelf Res. 63, S26–S35. doi: 10.1016/j.csr.2012.09.011
Zeebe R. E., Wolf-Gladrow D. (2001). CO2 in Seawater: Equilibrium, Kinetics, Isotopes (No. 65) (Amsterdam: Gulf Professional Publishing).
Keywords: symbiosis, coral polyp, dynamic modeling, coupling, carbon budget
Citation: Xu Y, Zhang J, Huang H, Yuan X, Zhang J and Ge J (2022) Coral Symbiosis Carbon Flow: A Numerical Model Study Spanning Cellular to Ecosystem Levels. Front. Mar. Sci. 9:749921. doi: 10.3389/fmars.2022.749921
Received: 30 July 2021; Accepted: 07 March 2022;
Published: 26 April 2022.
Edited by:
Michael Kühl, University of Copenhagen, DenmarkReviewed by:
Ken Haste Andersen, Technical University of Denmark, DenmarkTakashi Nakamura, Tokyo Institute of Technology, Japan
Copyright © 2022 Xu, Zhang, Huang, Yuan, Zhang and Ge. This is an open-access article distributed under the terms of the Creative Commons Attribution License (CC BY). The use, distribution or reproduction in other forums is permitted, provided the original author(s) and the copyright owner(s) are credited and that the original publication in this journal is cited, in accordance with accepted academic practice. No use, distribution or reproduction is permitted which does not comply with these terms.
*Correspondence: Yi Xu, eHV5aUBza2xlYy5lY251LmVkdS5jbg==
 Yi Xu
Yi Xu Jing Zhang
 Hui Huang
 Xiangcheng Yuan
 Junxiao Zhang5,6
 Jianzhong Ge