 Reyhaneh Roohi1*
 Ragna Hoogenboom1
 Ronald Van Bommel2
 Marcel T. J. Van Der Meer2
 Furu Mienis1
 Sabine Gollner1
- 1Department of Ocean Systems, Royal Netherlands Institute for Sea Research (NIOZ), Texel, Netherlands
- 2Department of Marine Microbiology and Biogeochemistry, Royal Netherlands Institute for Sea Research (NIOZ), Texel, Netherlands
Hydrothermal vents have been recognised as isolated islands of productivity in the deep sea, but very little is known about the transport and export of chemoautotrophic produced organic carbon to vent surrounding habitats. Here, we investigate vent carbon export and its influence on benthic food webs in sediments at the Rainbow (RB) vent field at the Mid Atlantic Ridge in ~2200 m water depth. Two sites were considered along the dispersal direction of the RB vent plume for sample collection: the close vicinity at about ~30-100 m (“near-vent”); and at 4 km distance (“off-vent”) to the nearest venting area. At both sites, box corers were used to sample sediments and their fauna. A turbidity sensor mounted on a CTD/Rosette provided data on the presence of a vent fluid plume in the water column. Niskin bottles were used to sample suspended particulate organic matter (SPOM) from the plume, as well as from surface waters at 75 m depth. SPOM, sediments and fauna were analysed for nitrogen and carbon stable isotopes. Carbon derived from in situ chemoautotrophy, characterised by depleted δ13C, was taken up by infauna close to the venting area as the main nutrition source, while fauna at the off-vent site showed less depleted δ13C with a signature more typical for photosynthetic- derived material. Nematodes were the most abundant faunal taxon. Their abundance and biomass were variable and not different at the two studied sites. In situ derived organic matter was traced back in the food web in the close vicinity of the venting area. The connectivity of vent and non-vent habitats should be taken appropriately into account when designing future spatial management plans with regard to deep-seabed mining at hydrothermal vents.
1 Introduction
It has only recently been recognized that deep-sea vents are not isolated ecosystems, but also influence the surrounding areas (Levin et al., 2016). Deep-sea vent plumes transport vent larvae (Adams et al., 2012; Kim et al., 2015) and export nutrients and trace metals to the vent surroundings, influencing the microbial community composition in the water column (Haalboom et al., 2020). Faunal communities on hard substrates in the vent surroundings harbor a mix of typical “vent” meiofaunal species (e.g. Dirivultid copepods) and of species/genera known from coastal areas and deep-sea sediments (Gollner et al., 2010; Gollner et al., 2015; Gollner et al., 2020), and show increased functional diversity (Alfaro-Lucas et al., 2020). Benthic species composition in sediments surroundings Rainbow is different compared to control deep-sea sediments and highly influenced by the vent plume’s fall out (Klunder et al., 2020). Nematode community composition in sediments in the surroundings of Snake Pit and TAG vent fields on the Mid-Atlantic Ridge is hypothesized to be influenced by geochemical setting and food availability (Spedicato et al., 2020). A study in the northern West-Pacific, suggested that the effect of in situ derived organic matter as a food source near vents may be limited to at most several 100 m away from the venting area (Nomaki et al., 2019). Overall, very little is known about the role of vent in situ derived organic matter on food web and community composition in the vent surroundings.
The importance of understanding the interactions of vents with their surroundings is growing, as the potential for disturbances in the form of deep-seabed mining rises. Hydrothermal vent ecosystems are typically rich in seafloor massive sulfides and there is globally a growing interest to mine these minerals in the future (Dover, 2011; Boschen et al., 2013; Dover et al., 2018). Some countries have already tested mining or plan mining-tests in their national waters (Collins et al., 2013; Boschen et al., 2015), and to date, 7 exploration contracts for seafloor massive sulfide mining have been issued by the International Seabed Authority (ISA) in areas beyond national jurisdiction (www.isa.org.jm). Mining will have impacts on the environment, including for example removal of habitat or the creation of sediment plumes (Gollner et al., 2017). The ISA is currently working on the development of Regional Environmental Management Plans, which shall include mitigation actions, such as areas to be protected from seabed mining (ISA, 2019). Understanding the extent of vent influence and ecological connectivity to the surrounding environment are needed to ensure proper mitigation actions for human disturbances, and to border marine protected areas in the deep sea.
One form of determining the geographical size or “footprint” of an ecosystem includes the detection of trophic links within and between ecosystems. Food web studies can use stable isotopes of carbon and nitrogen to detect the sources of the production, and define the trophic level, by comparing the ratio of the heavier to lighter isotopes (Griffin and Valiela, 2001; Govenar, 2012). Analyzing nitrogen and carbon stable isotopes allows the establishment of trophic interactions between species (Pinnegar and Polunin, 2000). At hydrothermal vents, there are different potential food sources with different δ13C ratios including (1) photosynthetically derived organic matter from the sea surface (-24‰ to -22‰), (2) chemo-autotrophs that fix carbon through sulfide oxidation based on Calvin-Benson-Bassham (CBB) cycle (-36‰ to -30‰), (3) chemo-autotrophs that fix carbon through sulfide oxidation based on reductive tricarboxylic acid (rTCA) cycle (-15‰ to -10‰) and (4) methanotrophs (-19 ± 3.5‰ at Rainbow (RB) vent) (Portail et al., 2018 and references therein). Therefore, the δ13C signature can be used to identify which organic carbon sources (chemo- or photosynthetic) fauna in the vent surrounding rely on.
The RB vent produces one of the most persistent and strongest plumes on the Mid-Atlantic Ridge (MAR, German et al., 1996; Thurnherr and Richards, 2001), making it a good location to explore the extent of in situ produced organic matter export to vent surroundings. The RB vent field (36°149N, 33°549W, ~2250 m depth) was discovered in 1996 on the Azores triple junction (ATJ) along the MAR (German et al., 1996) (Figure 1A). It is located at a slow-spreading ridge with a spreading rate of approximately 21.5 mm yr-1 (Andreani et al., 2014). At least ten black smokers eject the plume that is rising up to 200 m above the vent field and is dispersed predominantly to the north and east of the source with an average current speed of 5-6 cms-1 (Thurnherr and Richards, 2001; Thurnherr et al., 2002; Edmonds and German, 2004). The vent fluid dispersal is controlled by the variation of vent emission and deep-sea current direction which is following the contours of the rift valley and can be detected up to 50 km away from the vent site (Khripounoff et al., 2001; Edmonds and German, 2004; Haalboom et al., 2020). The plume is enriched in trace metals in which the composition changes as it is aged and dispersed, it has very low concentrations of organic carbon and is characterized by the presence of chemoautotrophic microbial communities (Khripounoff et al., 2001; Edmonds and German, 2004; Haalboom et al., 2020).
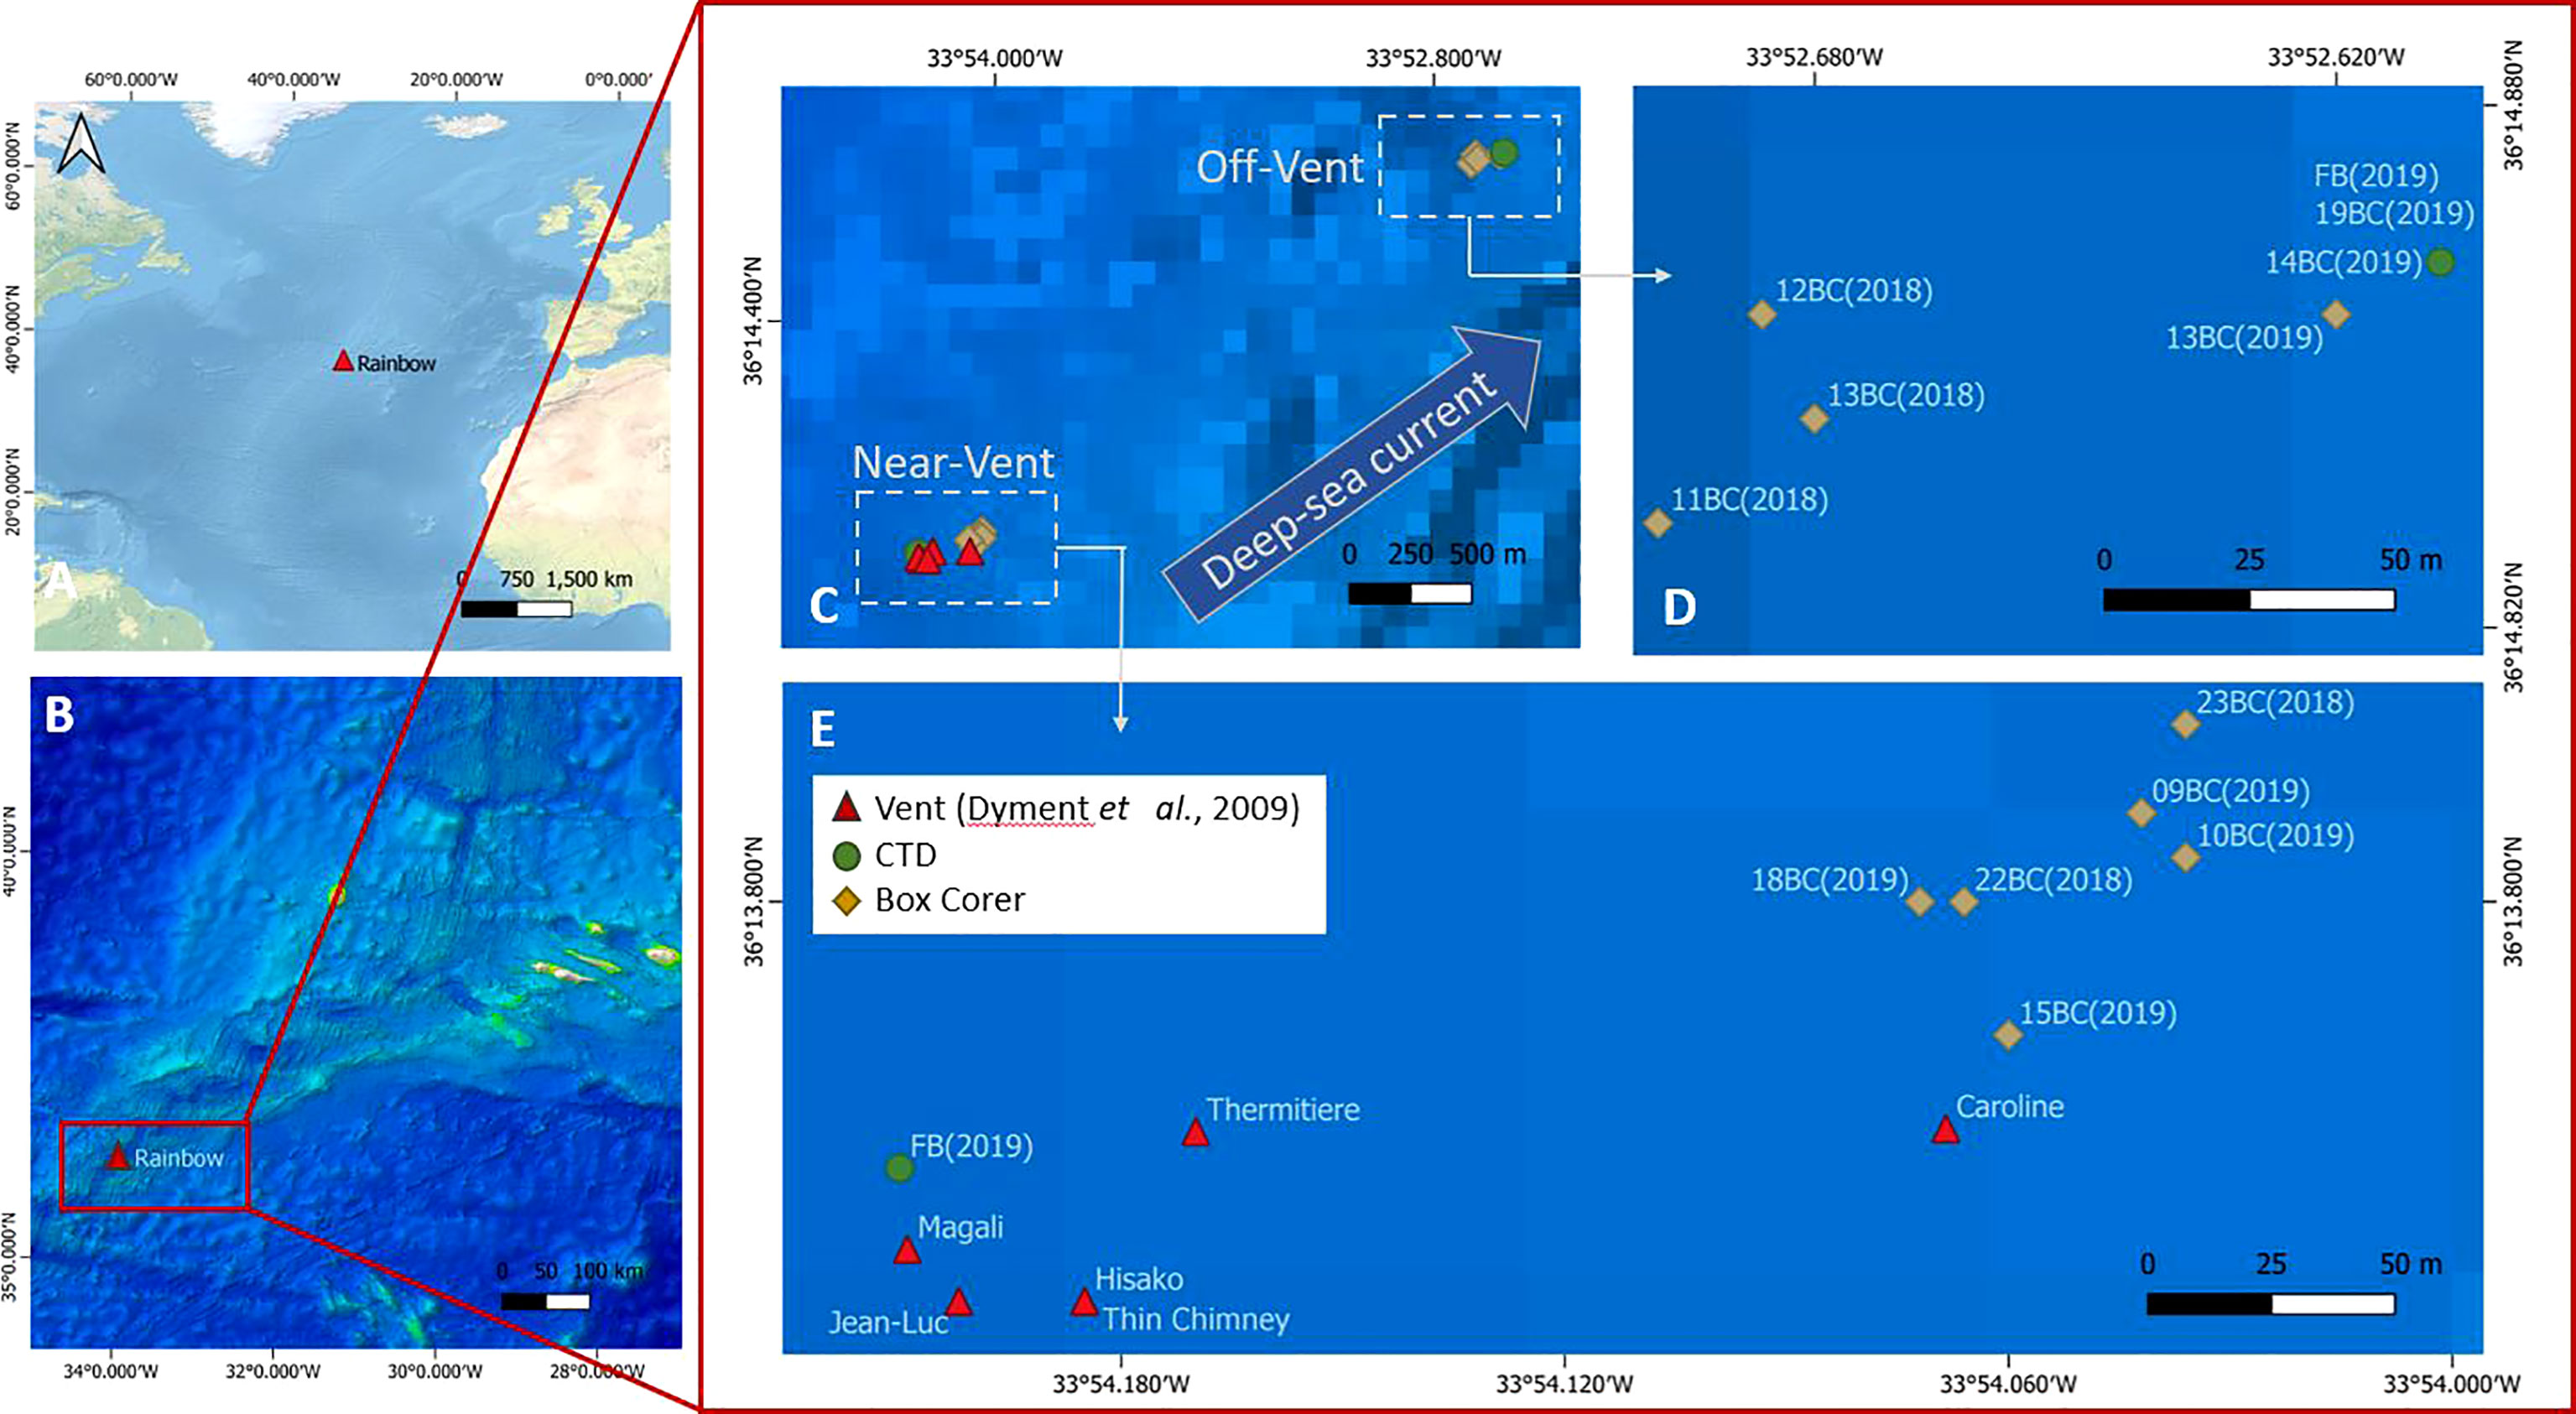
Figure 1 (A) The Mid-Atlantic Ridge and Rainbow vent field location, (B) Location of the Rainbow vent field on the Azores triple junction, (C–E) Locations of active black smokers (red triangles), and of sedimented near-vent and off-vent sites. Samples were taken at both sites. Sediment samples were taken with a video-guided box corer (yellow square), and water samples were taken by a CTD (green circles) during the RV Pelagia expeditions in 2018 (64PE441) and 2019 (64PE454). Red triangles: black smoker structures (coordinates and names as given in Dyment et al., 2009); yellow squares: Box Corer (BC) samples; green circles: CTD (FB) in which FB near-vent comprises samples 1,4,7,10 and 13 and FB off-vent samples 16,19,22,25and 28. Map with QGIS 3.18.
The fauna living on/very close to black smokers at the RB vent field is relatively well known and characterized by small mussel beds and shrimp swarms, with associated species such as Amathys lutzi or spionid polychaetes (Desbruyères et al., 2000; Desbruyères et al., 2001; Portail et al., 2018). Portail et al. (2018) studied the food web complexity at the RB vent. However, there is no knowledge of food webs in vent surrounding areas, and very limited knowledge on the taxonomic composition of sediment infauna, with metabarcoding revealing that their composition is influenced by the RB vent plume’s fall out (Klunder et al., 2020). Here, we investigate the ecological “footprint” of the RB vent field, i.e., the export of in situ produced organic carbon and its importance as a potential food source for faunal communities living in the sediments in the vent surrounding areas. Along the dispersal direction of the plume, water column and sediment samples were collected at two sites: near-vent (~30-100 m distance from RB black smokers) and off-vent (4 km away from RB). We analysed the organic matter content, carbon and nitrogen stable isotopes of suspended particulate organic matter (SPOM) in the water column, and of sediments and fauna living in the sediments. In addition, we analysed faunal abundance and biomass of nematodes, the dominant taxon in the sediments.
2 Material and Methods
2.1 Sampling
The sampling sites were chosen based on preliminary studies of plume dispersal by Haalboom et al. (2020), and based on exact coordinates of RB vent smokers by Dyment et al. (2009). Samples were obtained during two research expeditions with RV Pelagia during cruise 64PE441 (16th to 25th of June 2018) and 64PE454 (24th of June to 4th of July 2019). Sediment cores and water samples were collected at two sites downstream of the plume: very close to the vent at approximately 30-100 m distance from the nearest black smoker (near-vent) and at ~4 km distance from the vent (off-vent) (Figures 1B–E and Table S1). A NIOZ-designed video-guided stainless steel cylindrical box corer (inner diameter 50 cm and 55 cm height), a trip valve sealing the box, was used to obtain quantitative sediment samples. The camera was used to avoid sampling hard substrates. In practice, the box corer was (1) lowered towards the bottom until the bottom became visible, (2) the ship with the box corer was moved into position, (3) the box corer was lifted several meters upwards to gain enough speed, (4) the box corer was deployed, resulting in ~30 cm deep penetration into the sediment with ~10-20 cm of overlying bottom water in the box corer. After the box corer was on deck, it was inspected for sampling success (i.e. enough overlying bottom-water; no leaking due to underlying rocks in sediments that had caused deformation of the box corer or incomplete closure). Only successfully retrieved box corers were subsampled with push cores. For all meiofaunal analyses, push cores with a ~5 cm diameter (area of 19.63 cm2) were used. For higher taxon diversity and nematode biomass analyses, the top 10 cm of each push core was fixed in a 4% buffered formaldehyde solution. For faunal stable isotope analyses, the top 10 cm of the push cores were frozen at -20°C, but only the top 5 cm have been analysed. One retrieved box corer (23BC) contained only a 7 cm thick sediment layer due to the hard substrate below. In addition to 5 cm diameter push cores, plastic syringes with 3 cm diameter (area of 7.07 cm2) were pushed into the sediment and frozen at -20°C for bulk sediment stable isotope analyses back in the lab.
Water samples were collected with a CTD/Rosette, at the same locations as the sediment samples. 12-liter Niskin bottles were closed at approximately 2000 m water depth, with 4 samples collected at different depths in the maximum deep-water turbidity layer, indicative for the presence of the hydrothermal plume. In addition, one sample was collected in the chlorophyll maximum layer at 75 m water depth (Figure 2). For SPOM analyses, 2x10 L of water from each water depth were filtered over pre-weighed and pre-combusted GFF filters on board, rinsed with a minimum amount of MilliQ water to remove salt, and stored at -20°C (Table S1).
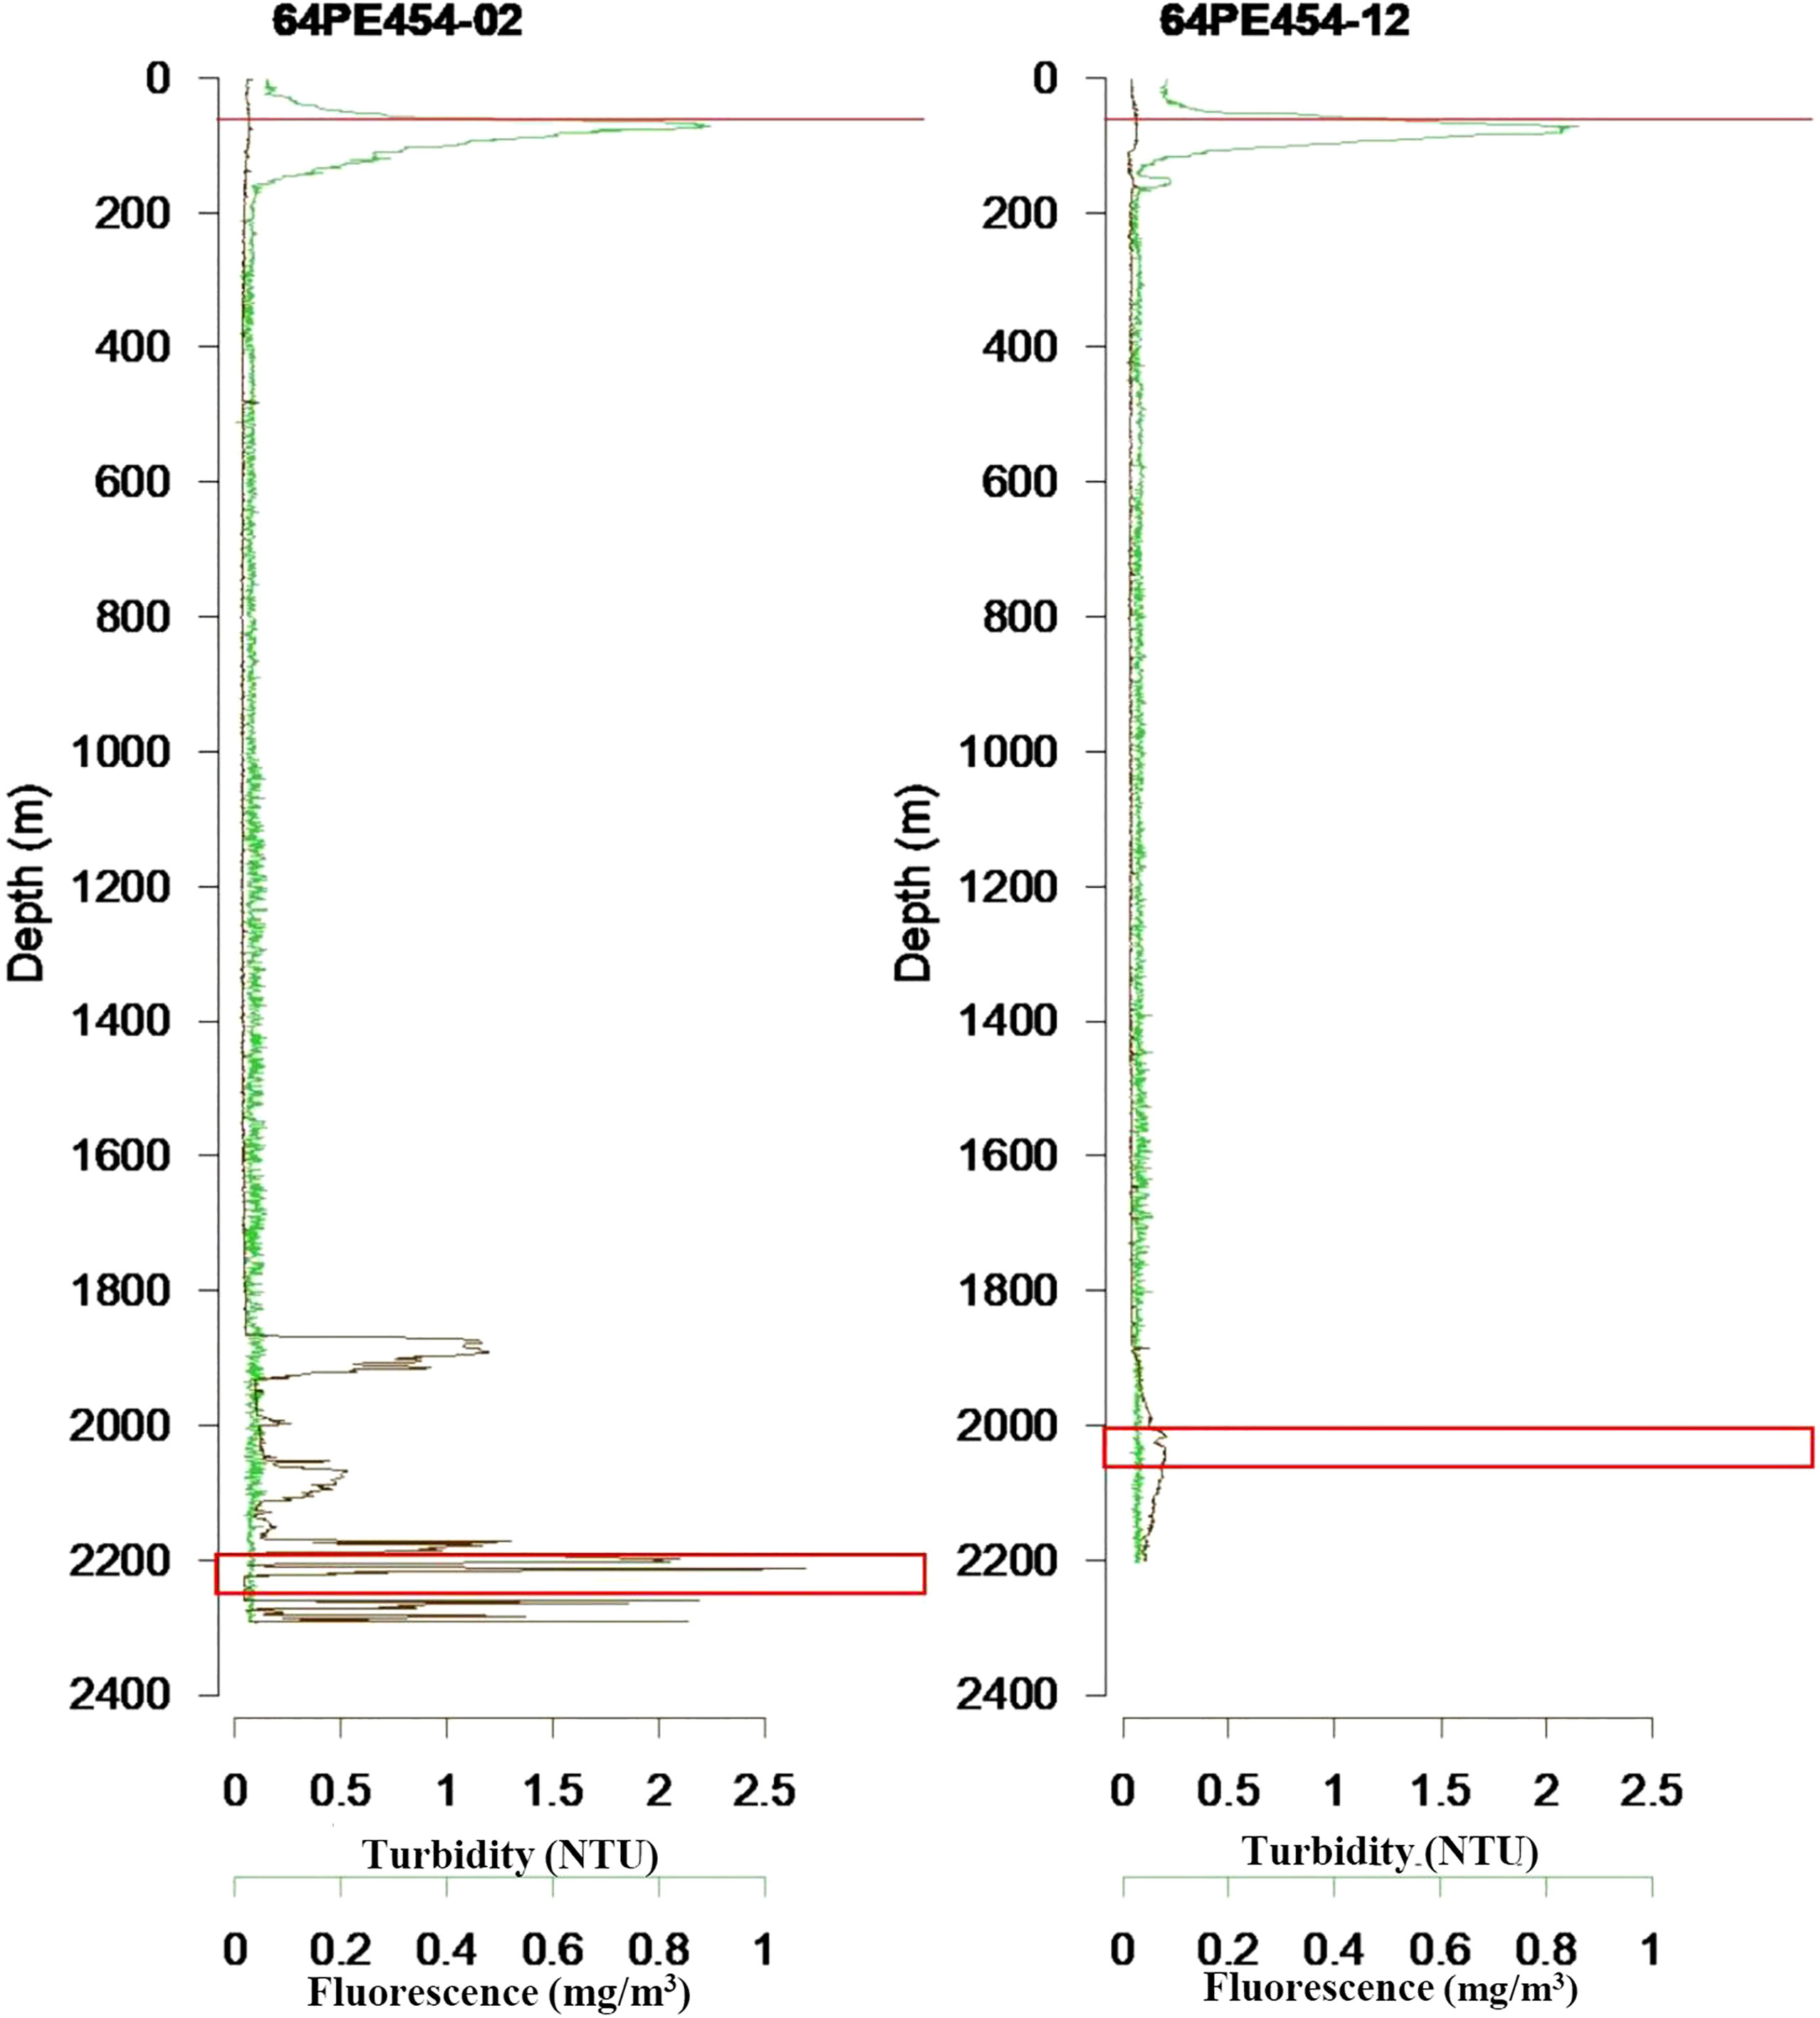
Figure 2 Turbidity and fluorescence profiles in near-vent site (64PE545-02) and off-vent site (64PE545-12) water column. The maximum turbidity in deep water represents the vent plume. The sampling depths are marked with a red line at 75 m water depth, and red squares around 2000 m water depth.
2.2 TOC, δ13C and δ15N Analyses of Water and Sediment Samples
The SPOM filters were decalcified before C and N stable isotope analyses. In total 10 SPOM filters were analysed; 5 from near-vent and 5 from off-vent. One sample (FB10) from the near-vent plume did not have enough material to measure the N stable isotope signature, even though the complete filter was analysed. The filters were moistened with some drops of double-distilled water (bidest) and were placed in a chamber filled with HCl gas overnight, followed by drying in an oven at 60°C. Each SPOM filter was manually folded and compacted in a tin capsule. The C and N isotope ratios for SPOM filters were measured in a single analytical run, and certified isotope standards acetanilide (0.3-0.6 mg), casein (0.2-0.5 mg) and urea (0.3-0.8 mg) were used as reference standards.
A total of 7 sediment cores, 4 from near-vent and 3 from off-vent, were analysed at 1 cm intervals until 5 cm core depth (Table S1). The sediment samples were freeze-dried and ground to a fine and homogeneous powder. This powder was used for δ15N and δ13C analyses. For δ13C analyses, the powder was decalcified to remove inorganic carbon. Sediments were decalcified in Borosilicate glass culture tubes with 2M HCL added in drops until no reaction (bubbling) was visible. The tubes with sediments were shaken for 500 minutes in a table shaker and were afterward centrifuged at 2000 RPM for 5 minutes. After centrifugation, to remove acid from the decalcified samples, the liquid above the sediment was carefully removed with a pipet, and 1 ml doubly distilled water (Bidest) was added to the sediments in the tubes and vortexed until the sediments were resuspended and mixed well with water; followed by adding approximately 10 ml Bidest water to fill up the tube. The centrifugation and removing liquid process were repeated until the pH of the remaining liquid above the sediment in tubes was higher than 5, after which the decalcified samples were freeze-dried. All sediment samples were weighed precisely in tin capsules to carry out stable isotope analysis (SIA). The capsules were crimped and manually compacted to minimize internal air space. Great care was made to avoid any contamination with solvents, fingers and dust. Certified standards comprised 0.05-0.12 mg Benzoic acid and Acetanilide to measure δ13C, and Acetanilide (0.5-0.8 mg), Casein (0.3-0.8 mg) and Urea (0.3-0.8 mg) to measure δ15N.
All values for stable isotope analyses are expressed in δ (‰) notation with respect to the PeeDee Belemnite (δ13C), and Air (δ15N) because of the constant average abundance of 15N (Kendall and Caldwell, 1998), in which δHX = [(RSAMPLE/RSTANDARD − 1)] ×103, where R is 13C/12C or 15N/14N (Fry, 2006). The stable isotope composition (δ13C and δ15N) of all samples was measured using a Flash 2000 (Organic Elemental Analyzer) MAS 200 autosampler that was connected via CONFIO IV to DELTA V ADVANTAGE (isotope ratio mass spectrometer (IRMS)) and ISODAT 3.0 Gas Ratio MS Software was used. The total organic carbon (TOC) was measured along with carbon and nitrogen stable isotope ratios and the TOC (%) calculation was based on the MS-signal. To test the relationships of TOC, δ13C and δ15N, biplots of linear regression were created and the Pearson’s correlation coefficient r and p-values calculated.
2.3 Stable Isotope Analyses of Meiofauna
We used 4 box cores (12 push cores) from near-vent and 3 box cores (9 push cores) from off-vent to measure stable C and N isotope values of meiofauna (Table S2). For meiofauna extraction, sediment samples were unthawed and rinsed with 32 µm-filtered tap water through 1 mm and 32 µm mesh sieves. The remaining sediments on the 32 µm sieve were put into centrifugation tubes. For centrifugation of sediments, colloidal silica polymer was used as the flotation medium (H.C. Stark, Levasil 200/40%, q = 1.17) and kaolin was used to hold back the heavier particles during decantation (Holme and McIntyre, 1971). Each sample was centrifuged 3 times for 6 minutes at 3500 rpm. The flotation medium with animals was passed through a 32 µm sieve, rinsed with Milli-Q water, and meiofauna transferred into petri dishes. A stereomicroscope was used to identify meiofauna to higher taxonomic levels (i.e. nematodes, copepods, polychaetes) based on Higgins and Thiel (1988) and Giere (2009). For reliable detection of C and N compositions, the minimum required weight for meiofauna is 0.1 mg (Portail et al., 2018) which is estimated around 300 copepods or nematodes (Lebreton et al., 2012). Meiofaunal individuals were hand-picked under a stereomicroscope and pooled per higher taxon directly into a tin capsule. The total number of individuals per taxon extracted from near-vent was 502 nematodes, 121 copepods, 12 polychaetes and 711 nematodes and 80 copepods for off-vent. No polychaetes were found at this site. Although meiofauna was completely sampled from the sediment samples, there was not enough material to reliably measure δ15N values of meiofauna and for the off-vent site, not even enough for a δ13C value for copepods. Tin capsules with animals were freeze-dried, weighed and measured on the Flash 2000 (Organic Elemental Analyzer; see above). Certified isotope standards acetanilide (0.01-0.1 mg), casein (0.015-0.12 mg) and urea (0.03-0.3 mg) were used as the reference standards for δ13C.
2.4 Abundance and Biomass Analyses of Nematodes
In addition to the higher meiofaunal taxa counts obtained whilst picking fauna for stable isotopes analyses (from 21 push cores; see Meiofauna Abundance, Biomass and Isotope Values), we analyzed higher meiofaunal taxa, and nematode biomass from additional 9 push cores (Table S2). In total, 30 push cores (from 12 box corers) were compared for meiofaunal abundance, 16 push cores from near-vent and 14 push cores from off-vent. Biomass data were based on 4 push cores from near-vent and 5 push cores from off-vent (see Table S2).
Biomass was only calculated using non-damaged individuals (81% of specimens near-vent and 79% of specimens off-vent) as required in the formula described by Andrassy (1956). The statistical analysis is based on standardized data for a 10 cm2 area. The difference in the abundance and biomass of meiofauna near-vent and off-vent was analyzed by applying Welch’s t-test (unequal variances t-test).
To extract meiofauna used for biomass analyses from the sediments, formaldehyde from sediment samples was removed, and sediments were centrifuged as described in 3.3. to extract fauna. A stereomicroscope was used to count and identify meiofauna to higher taxonomic levels (i.e. nematodes, copepods, polychaetes) based on Higgins and Thiel (1988) and Giere (2009). Nematodes were mounted on glass slides, by placing them first into a solution of water/ethanol/glycerol (61/35/4) followed by evaporation for 2 days in a 40°C oven. Afterwards, nematodes were placed into a drop of glycerin on a glass slide, covered with a glass slip and sealed with lacquer (Higgins and Thiel, 1988). The biomass of nematodes was calculated by measuring individual’s dimensions and according to WW (µg) = (L×W2)/Cf (Andrassy, 1956), where L (µm) is the nematode’s length, W (µm) is its width at the widest point and Cf is 1.6×10⁶ as the conversion factor.
3 Results
3.1 δ13C and δ15N of SPOM
The δ13C signature of SPOM collected in the plume was depleted and similar at the near-vent (-26.33 ± 1.12‰) and off-vent (-26.22 ± 0.31‰). δ13C signatures of SPOM from surface water samples (75 m water depth) at near-vent and off-vent were -23.14‰ and -22.60‰, respectively (Table 1 and Figure 6). Samples from the near-vent had a lower δ15N value (average 2.4‰), compared to the off-vent sample (average 6‰).
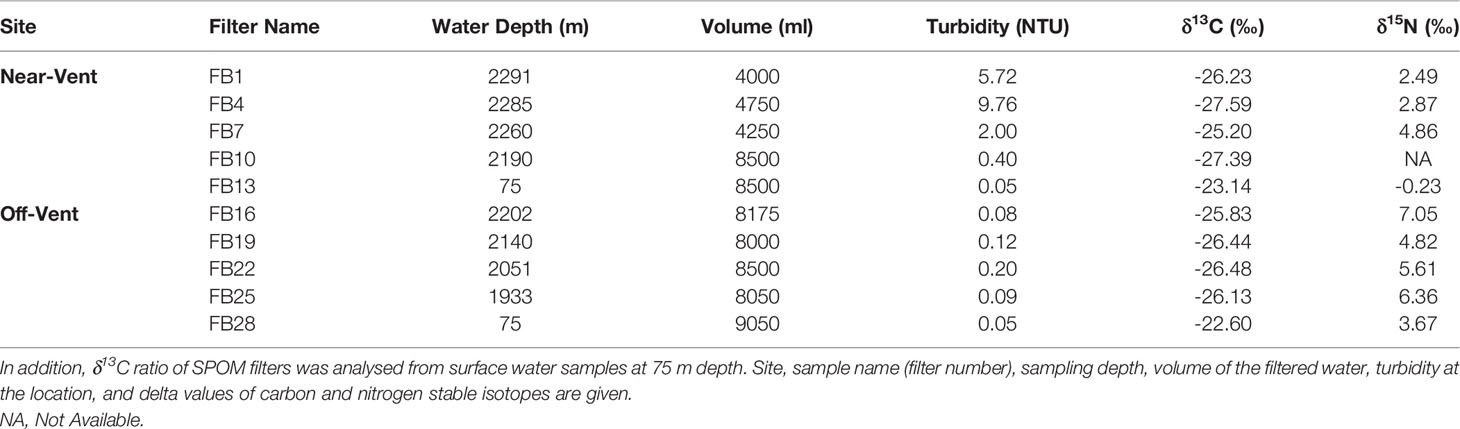
Table 1 The δ13C and δ15N of SPOM filters within the plume close to Rainbow vent (near-vent; between 2190 and 2291 m depth) and at 4 km distance to the vent (off-vent; between 1933 and 2202 m depth).
3.2 TOC, δ13C and δ15N in Sediment Samples
Surface sediment TOC concentrations of near-vent sediment samples (0.50% ± 0.16) were ~2.5 times higher than off-vent samples (0.16% ± 0.03). Figure 3 shows the vertical profile of TOC, δ13C and δ15N based on the mean and two standard deviations. Near-vent, the top 2 cm had an average TOC content of 0.50%, which was decreasing to 0.26% in 2 to 5 cm depth. Off-vent, no variation in TOC (average 0.16%) was observed with depth. The average δ13C value in the first cm in near-vent sediments (-24.6‰) was lower than for the first cm in off-vent sediments (-21.1‰). δ13C values in near-vent sediments increased with depth (-20.8‰ at 5 cm depth), but remained rather similar off-vent (-20.4‰ at 5 cm depth). A similar trend was observed for δ15N with values increasing with depth from 4 to 5.4 ‰ near-vent and rather similar δ15N values from 6.1 to 6.3‰ off-vent. In the sediment samples at the near-vent site, C and N isotopes showed a heterogeneous pattern: the δ13C varied between -26.7‰ to -20.2‰, and δ15N from 3.2‰ to 5.9‰, while there was little variation in the sediments from off-vent, for both δ13C value (-21.7‰ to -19.6‰) and δ15N (5.6‰ to 6.7‰) (Figures 3B, C, 4). However, a significant correlation was found between δ13C and TOC (r2 = 0.84, p<0.001), δ15N and TOC (r2 = 0.84, p<0.001) when considering all sediment samples (Figure 5).
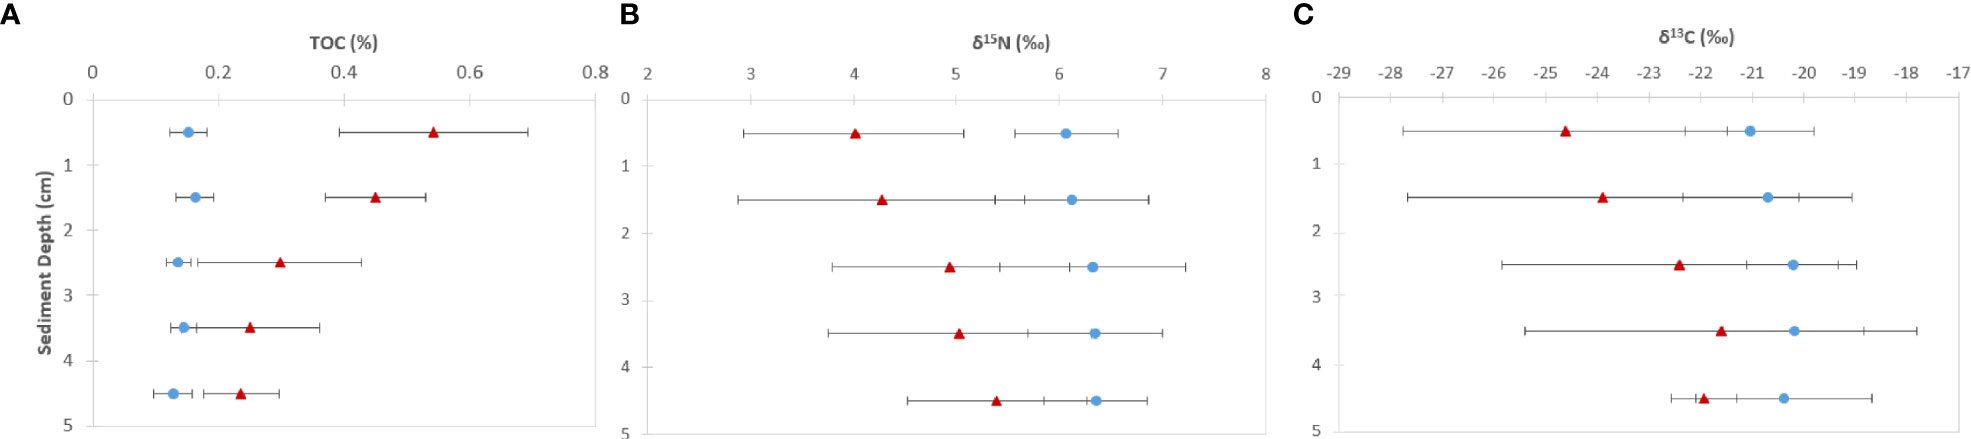
Figure 3 Vertical profiles of (A) total organic carbon (TOC) concentration, (B) δ15N and (C) δ13C (mean ± 2SD) of sediment samples (1 cm slices) from surface up to 5 cm core depth in sediments “near-vent” (~30-100 m distance to RB vent, red triangles) and “off-vent” (~4 km distance to RB vent; blue circles).
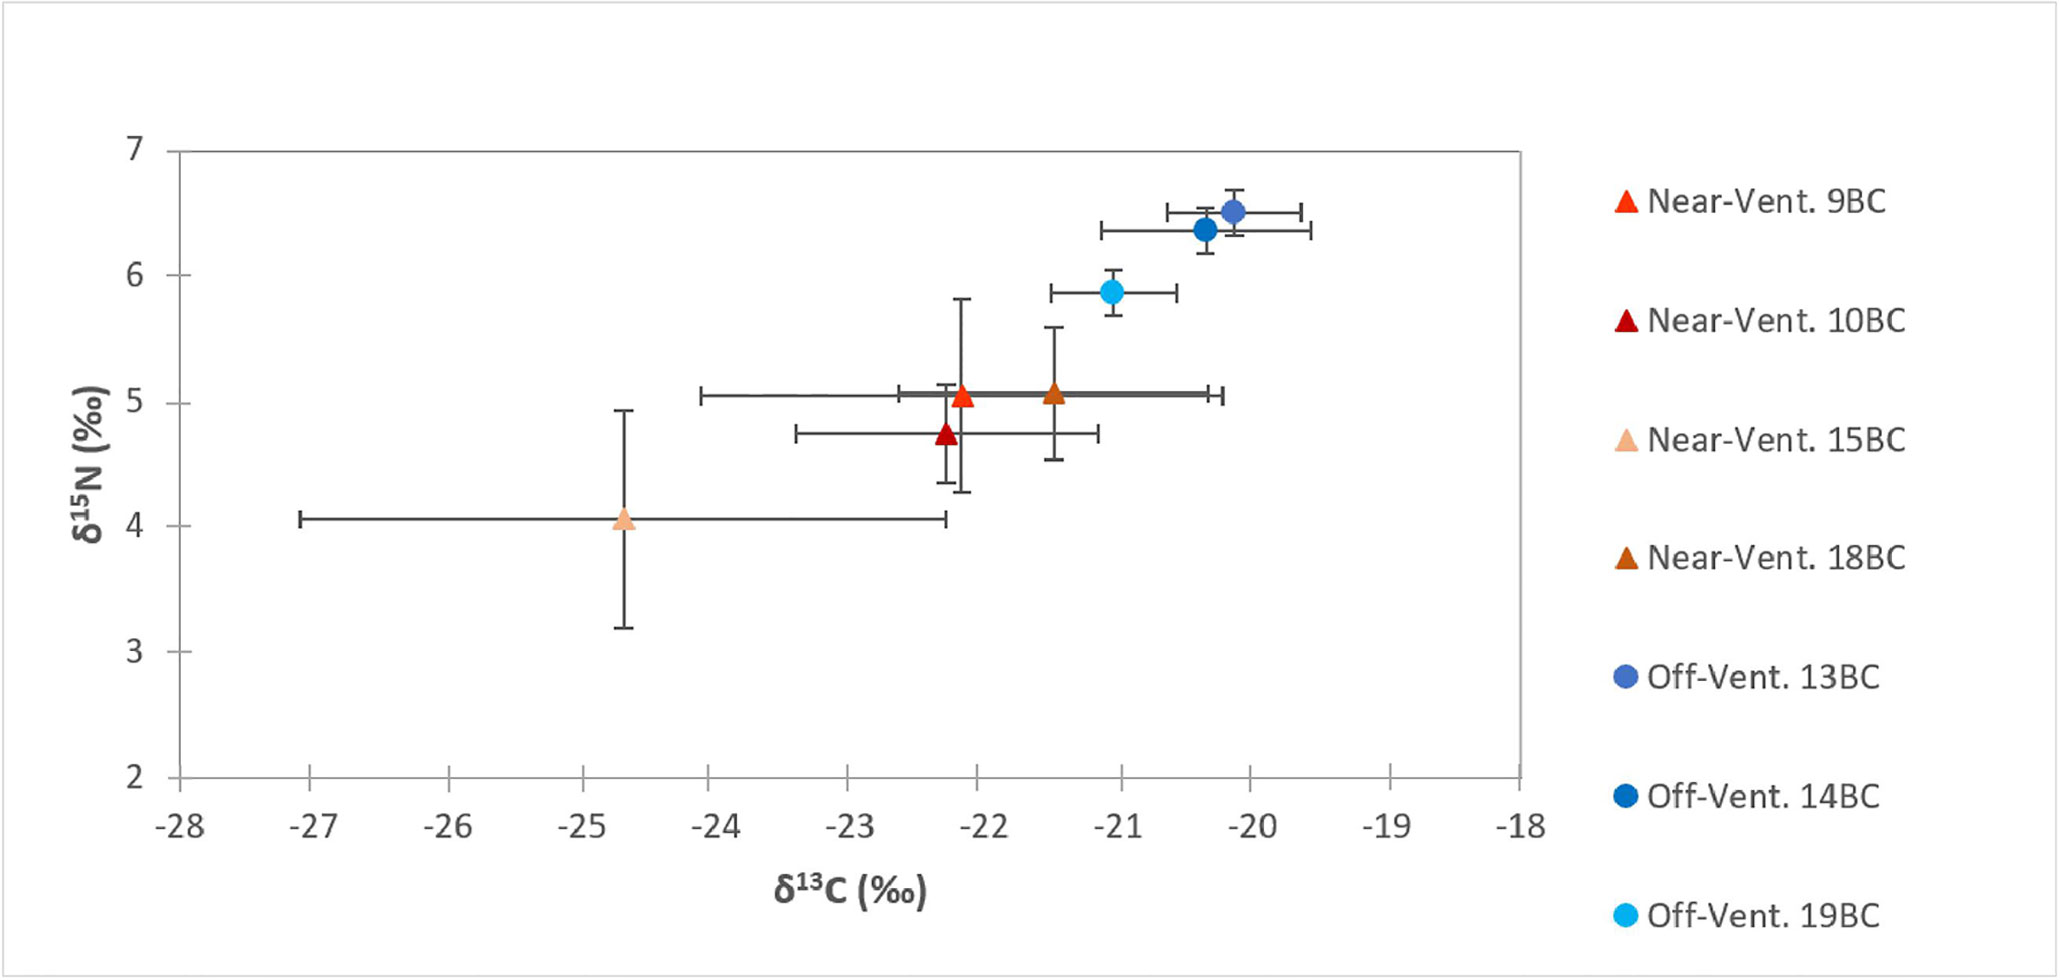
Figure 4 Carbon (δ13C) and nitrogen (δ15N) signatures (mean ± SD) in the first 5 cm of sediments at “near-vent”(~30-100 m distance to RB vent; red triangles) and “off-vent” (~4 km distance to RB vent, blue circles).
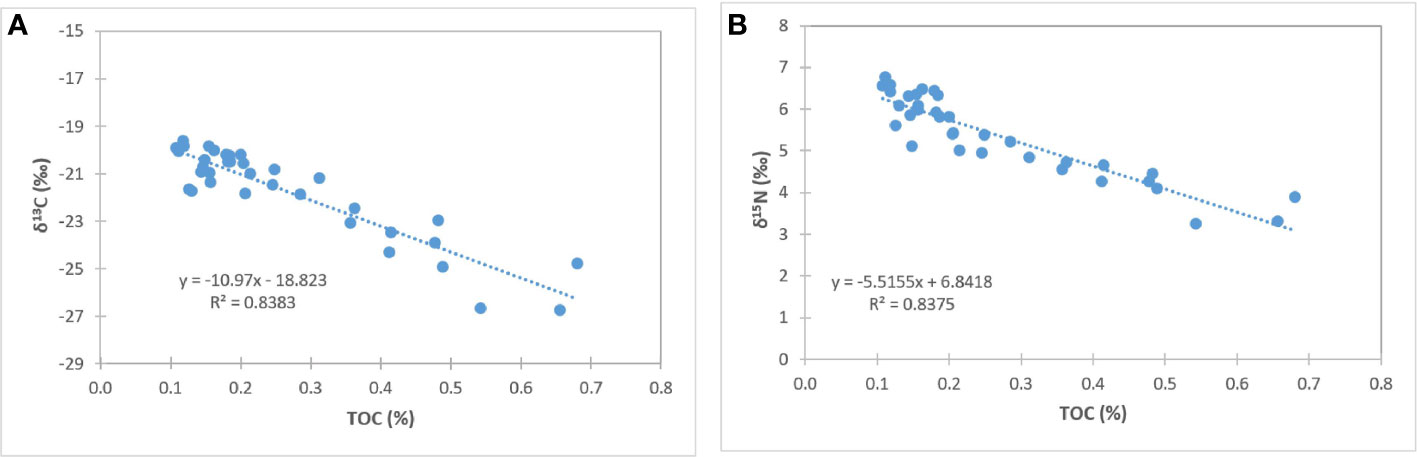
Figure 5 Correlation of δ13C and TOC (A), and δ15N and TOC (B) concentrations in sediments near-vent and off-vent.
3.3 Meiofauna Abundance, Biomass and Isotope Values
Meiofaunal abundance was similar near-vent (mean 35.69 ± 28.78 per 10 cm2) and off-vent (mean 33.20 ± 16.20 per 10 cm2) (p-value: 0.86). Nematodes dominated the communities with 13 to 83 ind. 10 cm-2 near-vent and with 14 to 51 ind. 10 cm-2 off-vent. Mean individual nematode biomass was very variable and no statistic difference was detected between “near-vent” (0.50 ± 3.93 µg) and off-vent (0.93 ± 4.35 µg) (p = 0.72) (Table 2). Mean biomass per 10 cm-2 was also variable (30.68 ± 25.81µg near-vent; 20.05 ± 16.31 µg off-vent; p = 0.22). The second most abundant taxon were copepods with <1 to 8 ind. 10 cm-2 near-vent, and 1 to 7 ind. 10 cm-2 off-vent. Polychaetes, the only macrofaunal taxon observed, were only detected near-vent (Table 3).
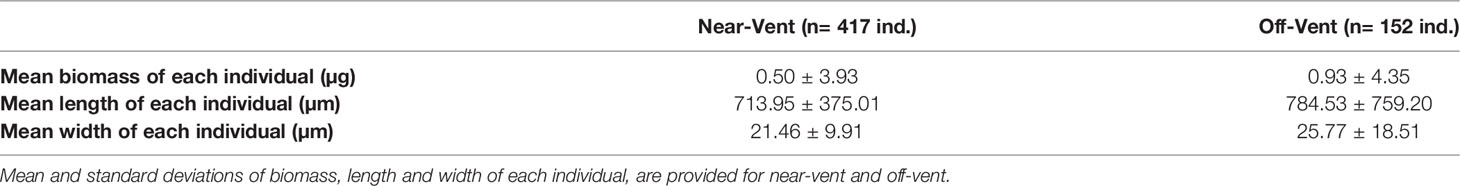
Table 2 Biomass of nematodes.
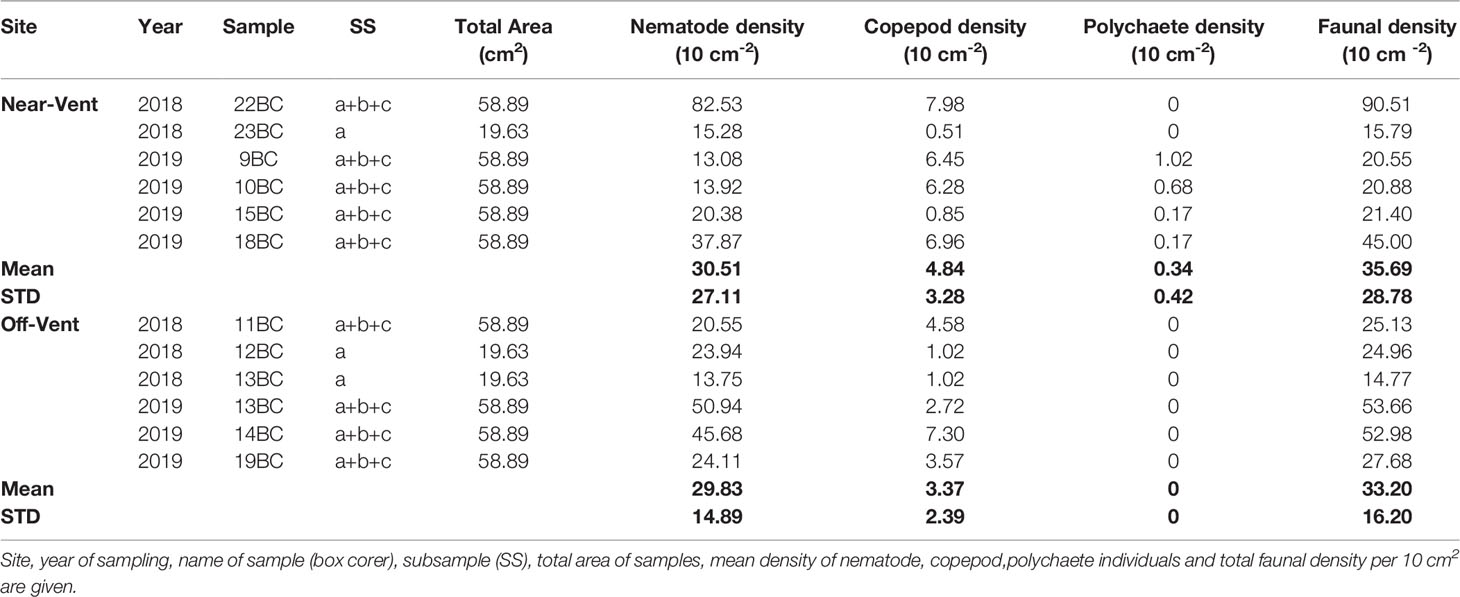
Table 3 Density of meiofauna from sediment samples.
Comparing the δ13C values of nematodes living in the near-vent (-28‰) and the off-vent (-22‰) sediments, depleted values were found in near-vent sites (Figure 6). Near the vent, different δ13C values were detected for nematodes (-28.2‰), copepods (-26.1‰) and polychaetes (-24.9‰). The δ13C values of meiofauna measured in our study and other studies are provided in Table 4.
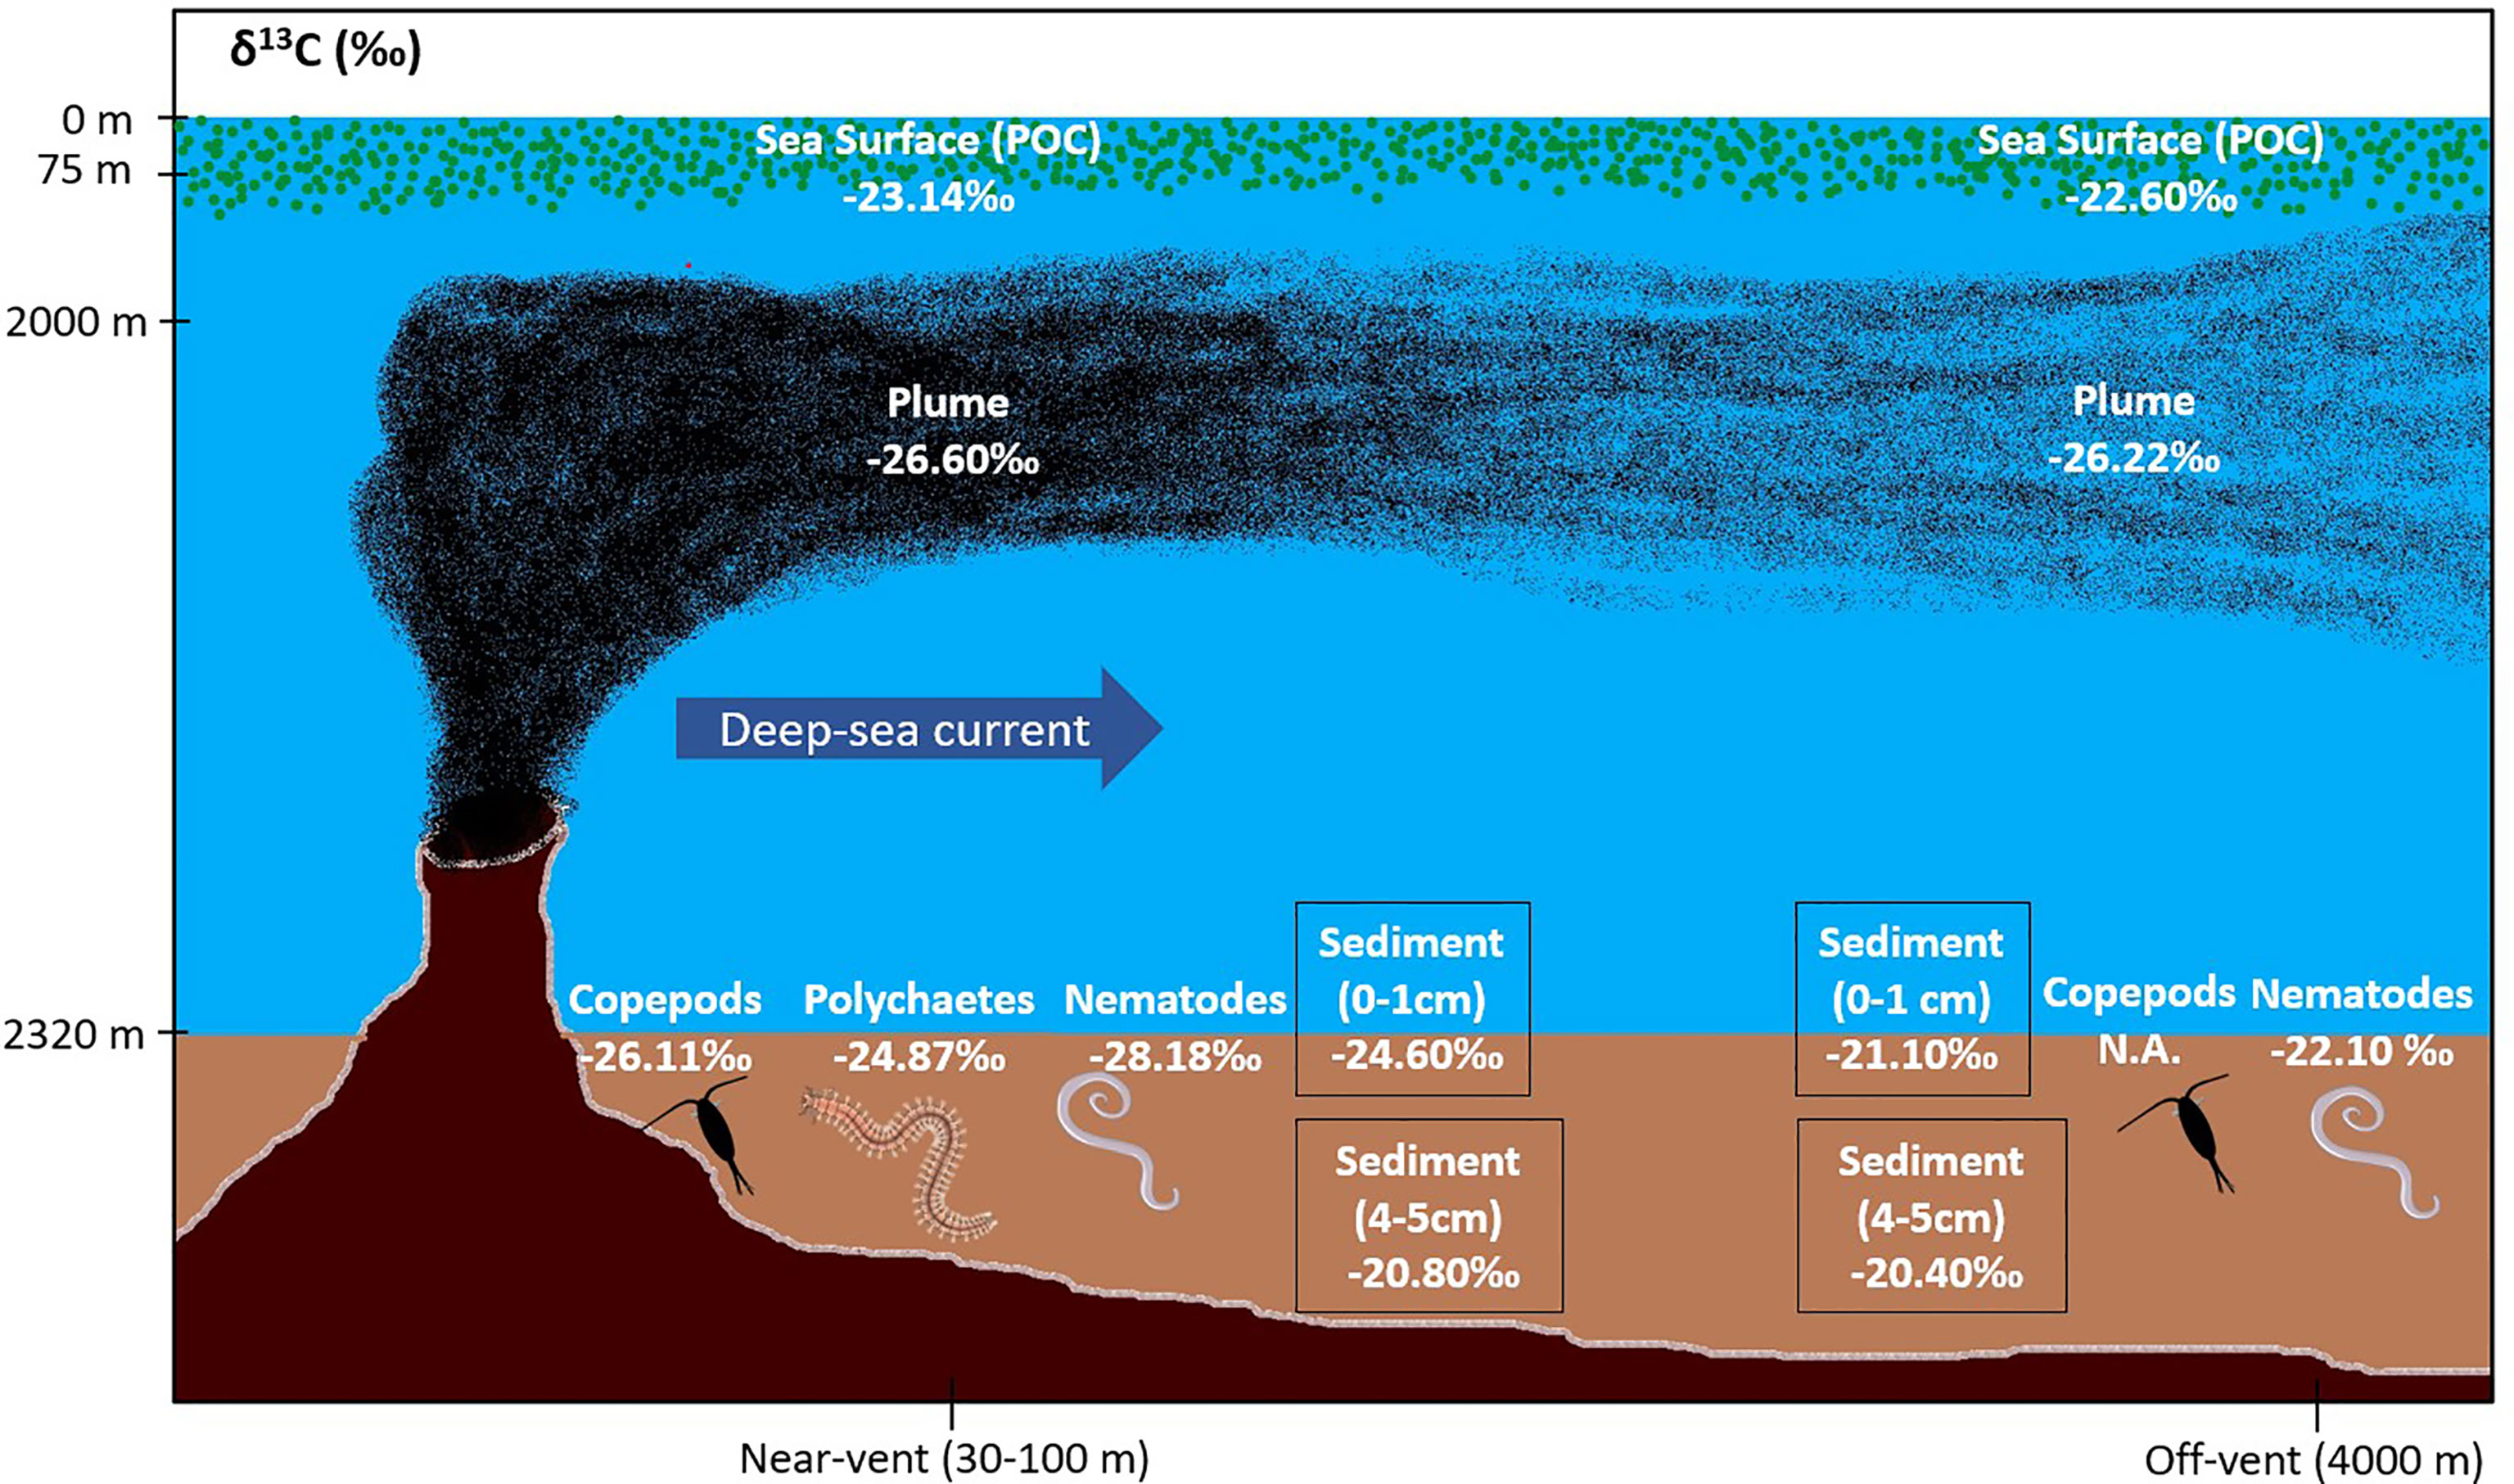
Figure 6 Schematic illustration showing mean δ13C of sea surface waters, vent plume, sediments and sediment infauna “near-vent” (~30-100 m distance to RB vent; illustrated by black smoker) and “off-vent” (~4 km distance to RB vent). Main plume direction was directly towards the selected off-vent site. Illustration not to scale. POC (Particulate Organic Carbon).
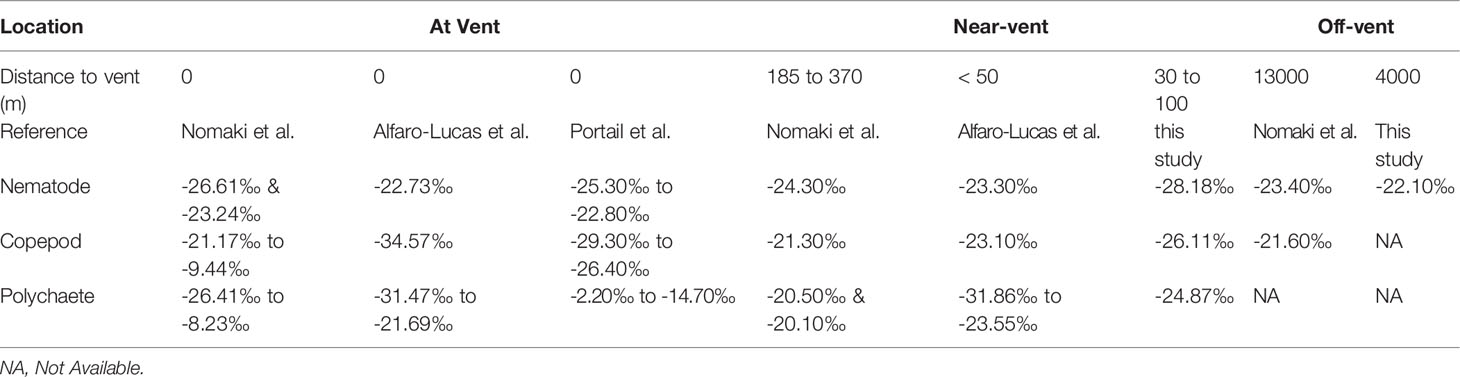
Table 4 δ13C values of meiofauna from near-vent and off-vent measured in this study in comparison with other studies at and around the Rainbow vent field (MAR).
4 Discussion
4.1 Vent Fluid Associated Organic Carbon Input to the Surrounding Sediments
The hydrothermal plume supplies a potential carbon source in addition to the photosynthetically derived organic matter in the vicinity of the RB vent, which is supported by depleted stable carbon isotope values of SPOM collected within the plume and in the surface sediments near the vent. Plumes are typically rich in free-living sulfur oxidizing and methanotrophic microbes and represent biogeochemical hotspots for carbon fixation in the dark ocean (Mattes et al., 2013). Concentrations of dissolved and particulate organic carbon are elevated in buoyant plume samples (Bennett et al., 2011), and the primary carbon production (chemosynthetic organic carbon) in hydrothermal plumes has been estimated to be at least 2.0 mg C l-1 at EPR 21° N vent fluid (McCollom, 2000). The high fluid fluxes and higher concentration of chemoautotrophic microbes within the plume in the direct vicinity of the vent and to a limited extent also further away may thus provide chemosynthetic TOC to the vent surrounding pelagic environment (Portail et al., 2018; Haalboom et al., 2020).
Total organic carbon in surface sediments was higher near-vent (0.49% ± 0.16) than off-vent (0.15% ± 0.03), suggesting that plume fall out and impact is higher in near-vent areas. Our results are in accordance with findings at vents near Japan located in the Izu-Ogasawara Arc of the western North Pacific, where TOC in sediments at the direct base of the chimney was higher compared to sediments further away from the vent (Nomaki et al., 2019). The reduction of TOC with distance to the RB vent may be closely linked to the observed reduction of plume intensity with distance as shown by a decrease in turbidity with increasing distance to the vent plume source, the chimneys (Haalboom et al., 2020) (Figure 2).
Near-vent, δ13C sediment values were very variable and more depleted (~-25‰) at the sediment surface (0-1 cm) and less depleted at 5 cm sediment depth (~-21‰), showing prominent input of chemosynthetically derived organic carbon from the plume (~26‰) to the surface sediments. The heterogeneity in δ13C values between samples may be related to vent plume dynamics which are variable in space and time (Haalboom et al., 2020). The high correlation of δ13C and relative TOC content in sediments (see Figure 5) suggests the input of fresh in situ derived organic carbon to the sediments near-vent and degradation with depth.
Off-vent, δ13C sediment values were ~21‰ at the surface and ~-20‰ at 5 cm core depth, pointing to a dominant input of photosynthetically derived OC from the surface ocean (~-22 to -23‰). The discrepancy between δ13C from surface waters and deep-sea sediments may be explained by a higher proportion of fresh, non-degraded algae, in the surface-waters. While sinking to 2000 m water depth, this algal material is reworked and mixed at the seabed with other carbon pools, which causes a positive shift in carbon isotopes. For instance, algal material being consumed by higher trophic levels would result in an increase of ~0.5 to 1‰ per trophic level (DeNiro and Epstein, 1981; Gearing, 1991).
The δ13C values and TOC percentage in sediments reflect a mixture of different carbon sources for consumer communities, including fresh chemosynthetically-derived OC and photosynthetically derived OC from the surface ocean. Our data indicate that there is approximately 0.15% TOC in the open ocean sediment with a carbon isotope value of roughly -20.5‰ which represents photosynthetically derived OC. Close to the venting area, in addition to the photosynthetically derived carbon source, fresh in situ chemosynthetically derived OC is present, which is reflected by higher TOC and more depleted δ13C values. Fauna close to vents uses this fresh organic matter as a food source. The contribution of chemosynthetic organic matter decreases with both sediment depth and distance from the vent (Figures 3, 4).
4.2 Chemosynthetic-Derived Organic Carbon as a Food Source for Fauna in Sediments
The δ13C values of fauna near-vent ranged from ~-25 to -28‰ and were similar to SPOM within the vent plume (-26‰; this study), suggesting selective feeding of (fresh) in situ derived organic carbon by near-vent fauna. The variability in stable isotope values may mirror the multiple chemosynthetic pathways of carbon production, such as methanotrophy versus autotrophy based on CBB or rTCA cycles according to the varying concentrations of reduced compounds (e.g. CH4, H2S) at vent systems (Portail et al., 2018), as well as differences in the relative contribution of photosynthetic and chemosynthetic material at different sampling locations. The isotopic signatures from vent copepods (-26‰ to -29‰) from Portail’s study were very similar to the isotopic signatures from copepods in this study living near-vent (-26‰), while the vent nematode signatures (-22‰ to -25‰) were less depleted than our near-vent nematodes (-28‰) (see Table 4).
The distinct δ13C values of meiofauna near-vent (nematodes, copepods and polychaetes) suggest that these taxa may have different feeding strategies these groups may harbour several different species with different feeding strategies as well and/or ecological niches and rely on different food sources. Copepods and nematodes in sediments near-vent may selectively feed on chemosynthetic-derived organic carbon, similar to what was observed for copepods in chimney-based sediments at vents near Japan (Nomaki et al., 2019). Less depleted polychaete δ13C signatures may point to a more mixed diet (photo- and chemosynthetically derived OC), a trophic increase, or a feeding niche in deeper sediment layers. However, Nomaki et al. (2019) detected no depletion in nematodes near-vent, indicating that only copepods may selectively feed on organic matter produced through chemoautotrophy at the studied vent near Japan. In the RB sediments, nematodes showed high depletion and thus ingestion of in situ produced organic carbon.
The δ13C values of fauna off-vent were relatively similar to SPOM from the sea surface waters, suggesting that off-vent nematodes may feed on phytodetritus (Figure 6). Our findings are similar to the study of Nomaki et al. (2019), showing that fauna outside of the caldera and at caldera non-vent sites was less depleted in δ13C relative to fauna at the base of the chimney (Table 4). A similar trend of decreasing depletion with distance from the active vents, although at a smaller scale (from at vent to 90 m to vent) was also observed for copepods at Lucky Strike (Alfaro-Lucas et al., 2020) (Table 4). Data thus suggest that the effect of in situ derived organic matter uptake by fauna may be limited to at most several 100 m (Nomaki et al., 2019). However, to precise the extent of influence of organic matter of chemosynthetic origin, future studies at RB vent field should consider samples between 100 and 4000 m distance from the vent.
4.3 Faunal Abundance and Biomass
The additional in situ derived food source (chemosynthetic OM) at near-vent did not result in enhanced overall abundance or biomass of nematodes, as similar abundance and biomass were observed near-vent and off-vent. Vanreusel et al. (2010) reviewed biomass data from nematodes living in chemosynthetic environments and showed that vent nematodes can be larger in comparison to reference sediments as an adaptation to low oxygen conditions (Vanreusel et al., 2010). In this study, nematodes’ biomass (off-vent: 20.05 μgC 10 cm-2, near-vent: 30.68 μg C 10 cm-2) ranged in between the biomass of nematodes from two abyssal sites in the NE Atlantic in which one is oligotroph (EUMELI, 8.52 μgC 10 cm-2) and the other characterized by a high input of organic matter (Porcupine Abyssal Plain, 54.16 μgC10 cm-2) (Vanreusel et al., 1995). Future studies should incorporate the abundance and biomass of all fauna in order to better understand the full impact of enhanced productivity on sediment communities near vents.
5 Conclusion
Our study shows that active vents are not isolated systems, but that in situ chemosynthetic-derived organic matter is traced back in the food web in near-vent areas. The degree of connection of active vent ecosystems to their non-vent surroundings may depend on the direction, composition and volume of the vent plume. Future studies may explore in greater detail the change of food web and community structures along vent plume gradients and geographical distance to the active vent. Determining the true footprint of active vent systems is necessary in order to be able to determine the geographical size of any future area-based management tool.
Data Availability Statement
The original contributions presented in the study are included in the article/Supplementary Material. Further inquiries can be directed to the corresponding author.
Author Contributions
RR performed the stable isotope analyses, counted and identified animals, analyzed the data, and wrote the manuscript. RH analyzed nematode biomass. RB performed isotope analyses. MvM and FM advised on isotope and data analyses. SG designed the project, collected samples, and helped with data analyses. MvM, FM, and SG contributed to the writing and discussion. All authors contributed to the article and approved the submitted version.
Funding
We acknowledge the funding of the Netherlands Organisation for Scientific Research NWO and Royal Netherlands Institute for Sea Research NIOZ in organizing the Netherlands Initiative Changing Oceans NICO expedition in 2018. The study was supported by the following funds: “Erasmus+ Traineeship scholarship program of the University of Milan-Bicocca (to RR)”, the Innovational Research Incentives Scheme of the Netherlands Organisation for Scientific Research (NWO) under grant agreement nos. 016.161.360 (to FM), the UU-NIOZ student work experience (to SG and Mei Nelissen), and the UU-NIOZ project “Protecting deep seabed hydrothermal vent fields through area-based management tools”.
Conflict of Interest
The authors declare that the research was conducted in the absence of any commercial or financial relationships that could be construed as a potential conflict of interest.
Publisher’s Note
All claims expressed in this article are solely those of the authors and do not necessarily represent those of their affiliated organizations, or those of the publisher, the editors and the reviewers. Any product that may be evaluated in this article, or claim that may be made by its manufacturer, is not guaranteed or endorsed by the publisher.
Acknowledgments
We thank the captain and crew of RV Pelagia for their great support during expeditions. We further thank Rianna Vlierboom, Eva Paulus, and Mei Nelissen for support during research expeditions, for sorting fauna and preparing slides for nematode analyses. We thank the reviewers and the editor for their very valuable comments to improve the quality of this manuscript.
Supplementary Material
The Supplementary Material for this article can be found online at: https://www.frontiersin.org/articles/10.3389/fmars.2022.732740/full#supplementary-material
References
Adams D. K., Arellano S. M., Govenar B. (2012). Larval Dispersal, Vent Life in the Water Column. Oceanography 25 (1), 255–685. doi: 10.5670/oceanog.2012.24
Alfaro-Lucas J. M., Pradillon F., Zeppilli D., Michel L. N., Martinez-Arbizu P., Tanaka H., et al (2020). High Environmental Stress and Productivity Increase Functional Diversity Along a Deep-Sea Hydrothermal Vent Gradient. Ecology 101 (11), 1–13. doi: 10.1002/ecy.3144
Andrassy I. (1956). Die Rauminhalts-Und Gewichtsbestimmung Der Fadenwürmer (Nematoden)”. Acta Zool. Hung. 2.1, 1–5.
Andreani M., Ildefonse B., Godard M., Escartin J. (2014). Tectonic Structure, Lithology, and Hydrothermal Signature of the Rainbow Massif (Mid-Atlantic Ridge 36°14′N). Geochem. Geophysi. Geosyst. 15 (9), 3543–3571. doi: 10.1002/2014GC005269.Received
Bennett S. A., Statham P. J., Green D. R.H., Le N., Mcdermott J. M., Prado F., et al (2011). Deep-Sea Research I Dissolved and Particulate Organic Carbon in Hydrothermal Plumes From the East Pacific Rise , 9 1 50 0 NB. Deep Sea Res. Part I 58 (9), 922–315. doi: 10.1016/j.dsr.2011.06.010
Boschen R. E., Rowden A. A., Clark M. R., Barton S. J., Pallentin A., Gardner J. P. A. (2015). Megabenthic Assemblage Structure on Three New Zealand Seamounts: Implications for Seafloor Massive Sulfide Mining. Mar. Ecol. Prog. Ser. 523, 1–14. doi: 10.3354/meps11239
Boschen R. E., Rowden A. A., Clark M. R., Gardner J. P. A. (2013). Mining of Deep-Sea Seafloor Massive Sulfides: A Review of the Deposits, Their Benthic Communities, Impacts From Mining, Regulatory Frameworks and Management Strategies. Ocean Coast. Manag. 84, 54–67. doi: 10.1016/j.ocecoaman.2013.07.005
Collins P. C., Croot P., Carlsson J., Colaço A., Grehan A., Hyeong K., et al. (2013). A Primer for the Environmental Impact Assessment of Mining at Seafloor Massive Sulfide Deposits. Mar. Policy 42, 198–209. doi: 10.1016/j.marpol.2013.01.020
DeNiro M. J., Epstein S. (1981). Influence of Diet on the Distribution of Nitrogen Isotopes in Animals. Geochim. Cosmochim. Acta 45 (3), 341–351. doi: 10.1016/0016-7037(81)90244-1
Desbruyères D., Caprais M. B. J., Colaçoc A., Comtetd T., Crassous P., Fouquet Y., et al (2001). Variations in Deep-Sea Hydrothermal Vent Communities on the Mid-Atlantic Ridge Near the Azores Plateau. Dev. Hydrobiol. 48, 1325–1346. doi: 10.1016/S0967-0637(00)00083-2
Desbruyères D., Sarradin P. M., Segonzac M. (2000). A Review of the Distribution of Hydrothermal Vent Communities Along the Northern Mid-Atlantic Ridge : Dispersal vs . Environmental Controls 201–216. doi: 10.1007/978-94-017-1982-7_19
Dover C. L. V. (2011). Mining Seafloor Massive Sulphides and Biodiversity: What Is at Risk? ICES J. Mar. Sci. 68 (2), 341–348. doi: 10.1093/icesjms/fsq086
Dover C.L.V., Arnaud-Haond S., Gianni M., Helmreich S., Huber J. A., Jaeckel A. L., et al (2018). Scientific Rationale and International Obligations for Protection of Active Hydrothermal Vent Ecosystems From Deep-Sea Mining. Mar. Policy 90, 20–28. doi: 10.1016/j.marpol.2018.01.020
Dyment J., Bissessur D., Bucas K., Cueff-Gauchard V., Durand L., Fouquet Y., et al (2009). Detailed Investigation of Hydrothermal Site Rainbow, Mid-Atlantic Ridge, 36°13n: Cruise MoMARDream. InterRidge News 19, 22–24.
Edmonds H. N., German C. G. (2004). Particle Geochemistry in the Rainbow Hydrothermal Plume, Mid-Atlantic Ridge. Geochim. Cosmochim. Acta 68 (4), 759–25. doi: 10.1016/S0016-7037(03)00498-8
Gearing J. N. (1991). “The Study of Diet and Trophic Relationships Through Natural Abundance 13c.” in Carbon Isotope Techniques, vol. 201.
German C. R., Klinkhammer G. P., Rudnicki M. D. (1996). The Rainbow Hydrothermal Plume, 36°15′N, MAR. Geophys. Res. Lett. 23 (21), 2979–2982. doi: 10.1029/96GL02883
Giere O. (2009). The Biotope: Factors and Study Methods,” in Meiobenthology Springer, Berlin, Heidelberg. doi: 10.1007/978-3-540-68661-3_2
Gollner S., Govenar B., Arbizu P. M., Mills S., Le Bris N., Weinbauer M., et al (2015). Differences in Recovery Between Deep-Sea Hydrothermal Vent and Vent-Proximate Communities After a Volcanic Eruption. Deep Sea Res. Part I Oceanogr. Res. Pap. 106, 167–182. doi: 10.1016/j.dsr.2015.10.008
Gollner S., Govenar B., Arbizu P. M., Mullineaux L. S., Mills S., Le Bris N., et al (2020). Animal Community Dynamics at Senescent and Active Vents at the 9°N East Pacific Rise After a Volcanic Eruption. Front. Mar. Sci. 6. doi: 10.3389/fmars.2019.00832
Gollner S., Kaiser S., Menzel L., Jones D. O. B., Brown A., Mestre N. C., et al (2017). Resilience of Benthic Deep-Sea Fauna to Mining Activities. Mar. Environ. Res. 129, 76–101. doi: 10.1016/j.marenvres.2017.04.010
Gollner S., Riemer B., Martínez Arbizu P., le Bris N., Bright M. (2010). Diversity of Meiofauna From the 9°50′N East Pacific Rise Across a Gradient of Hydrothermal Fluid Emissions. PloS One 5 (8), e12321. doi: 10.1371/journal.pone.0012321
Govenar B. (2012). Energy Transfer Through Food Webs at Hydrothermal Vents Linking the Lithosphere to the Biosphere. Oceanography 25 (1), 246–255. doi: 10.5670/oceanog.2012.23
Griffin M. P. A., Valiela I. (2001). Δ15n Isotope Studies of Life History and Trophic Position of Fundulus Heteroclitus and Menidia Menidia. Mar. Ecol. Prog. Ser. 214, 299–305. doi: 10.3354/meps214299
Haalboom S., Price D. M., Mienis F., Bleijswijk J. D.L.V., De Stigter H. C., Witte H. J., et al (2020). Patterns of (Trace) Metals and Microorganisms in the Rainbow Hydrothermal Vent Plume at the Mid-Atlantic Ridge. Biogeosciences 17 (9), 2499–25195. doi: 10.5194/bg-17-2499-2020
Higgins R. P., Thiel H. (1988). Introduction to the study of meiofauna. (Smithsonian Institution Press).
Holme N. A., McIntyre A. D. (1971). Methods for the Study of Marine Benthos. Blackwell Scientific Publications.
ISA (2019) “Guidance to Facilitate the Development of Regional Environmental Management Plans ( REMPs )”. Available at: https://www.isa.org.jm/files/files/documents/remp_guidance_.pdf.
Kendall C., Caldwell E. A. (1998). Fundamentals of Isotope Geochemistry. In Isotope tracers in catchment hydrology (pp. 51-86). Elsevier. doi: 10.1016/B978-0-444-81546-0.50009-4
Khripounoff A., Vangriesheim A., Crassous P., Crassous P., Segonzac M., Colaço A., et al (2001). Particle Flux in the Rainbow Hydrothermal Vent Field (Mid-Atlantic Ridge): Dynamics, Mineral and Biological Composition. J. Mar. Res. 59 (4), 633–656. doi: 10.1357/002224001762842217
Kim S. S. L., Mullineaux L. S., Helfrich K. R. (1994). Larval Dispersal via Entrainment Into Hydrothermal Plumes Larval Dispersal via Entrainment Into Hydrothermal Vent Plumes. J. Geophysical Res.: Oceans 99 (C6), pp.12655–12665. doi: 10.1029/94JC00644
Klunder L., de Stigter H., Lavaleye M. S. S., van Bleijswijk J. D. L., van der Veer H. W., Reichart G. J., et al (2020). A Molecular Approach to Explore the Background Benthic Fauna Around a Hydrothermal Vent and Their Larvae: Implications for Future Mining of Deep-Sea SMS Deposits. Front. Mar. Sci. 7. doi: 10.3389/fmars.2020.00134
Lebreton B., Richard P., Galois R., Radenac G., Brahmia A., Colli G., et al (2012). Food Sources Used by Sediment Meiofauna in an Intertidal Zostera Noltii Seagrass Bed: A Seasonal Stable Isotope Study. Mar. Biol. 159 (7), 1537–05. doi: 10.1007/s00227-012-1940-7
Levin L. A., Baco A. R., Bowden D. A., Colaco A., Cordes E. E., Cunha M. R., et al (2016). Hydrothermal Vents and Methane Seeps: Rethinking the Sphere of Influence. Front. Mar. Sci. 3. doi: 10.3389/fmars.2016.00072
Mattes T. E., Nunn B. L., Marshall K. T., Proskurowski G., Kelley D. S., Kawka O. E., et al (2013). Sulfur Oxidizers Dominate Carbon Fixation at a Biogeochemical Hot Spot in the Dark Ocean. ISME J. 7 (12) 2349–2360. doi: 10.1038/ismej.2013.113
McCollom T. M. (2000). Geochemical Constraints on Primary Productivity in Submarine Hydrothermal Vent Plumes. Deep Sea Res. Part I Oceanogr. Res. Pap. 47 (1), 85–101. doi: 10.1016/S0967-0637(99)00048-5
Nomaki H., Uejima Y., Ogawa N. O., Yamane M., Watanabe H. K., Senokuchi R., et al (2019). Nutritional Sources of Meio- And Macrofauna at Hydrothermal Vents and Adjacent Areas: Natural-Abundance Radiocarbon and Stable Isotope Analyses. Mar. Ecol. Prog. Ser. 622, 49–65. doi: 10.3354/meps13053
Pinnegar J. K., Polunin N. V. C. (2000). Contributions of Stable-Isotope Data to Elucidating Food Webs of Mediterranean Rocky Littoral Fishes. Oecologia 122 (3), 399–4095. doi: 10.1007/s004420050046
Portail M., Brandily C., Cathalot C., Colaço A., Gélinas Y., Husson B., et al (2018). Food-Web Complexity Across Hydrothermal Vents on the Azores Triple Junction. Deep Sea Res. Part I Oceanogr. Res. Pap. 131, 101–120. doi: 10.1016/j.dsr.2017.11.010
Spedicato A., Sánchez N., Pastor L., Menot L., Zeppilli D. (2020). Meiofauna Community in Soft Sediments at TAG and Snake Pit Hydrothermal Vent Fields. Front. Mar. Sci. 7. doi: 10.3389/fmars.2020.00200
Thurnherr A. M., Richards K. J. (2001). Hydrography and High-Temperature Heat Flux of the Rainbow Hydrothermal Site (36°14′N, Mid-Atlantic Ridge). J. Geophys. Res. Oceans 106 (C5), 9411–9426. doi: 10.1029/2000jc900164
Thurnherr A. M., Richards K. J., German C. R., Lane-Serff G. F., Speer K. G. (2002). Flow and Mixing in the Rift Valley of the Mid-Atlantic Ridge 1763–1778. doi: 10.1175/1520-0485(2002)032%3C1763:FAMITR%3E2.0.CO;2
Vanreusel A., De Groote A., Gollner S., Bright M. (2010). Ecology and Biogeography of Free-Living Nematodes Associated With Chemosynthetic Environments in the Deep Sea : A Review. PLoS One 5 (8), e12449. doi: 10.1371/journal.pone.0012449
Keywords: hydrothermal vent, deep-sea sediment, plume, connectivity, trophic interaction, isotopes, fauna, organic carbon
Citation: Roohi R, Hoogenboom R, Van Bommel R, Van Der Meer MTJ, Mienis F and Gollner S (2022) Influence of Chemoautotrophic Organic Carbon on Sediment and Its Infauna in the Vicinity of the Rainbow Vent Field. Front. Mar. Sci. 9:732740. doi: 10.3389/fmars.2022.732740
Received: 29 June 2021; Accepted: 13 May 2022;
Published: 13 June 2022.
Edited by:
Jozee Sarrazin, Institut Français de Recherche pour l’Exploitation de la Mer (IFREMER), FranceReviewed by:
Travis William Washburn, Geological Survey of Japan (AIST), JapanXikun Song, Xiamen University, China
Copyright © 2022 Roohi, Hoogenboom, Van Bommel, Van Der Meer, Mienis and Gollner. This is an open-access article distributed under the terms of the Creative Commons Attribution License (CC BY). The use, distribution or reproduction in other forums is permitted, provided the original author(s) and the copyright owner(s) are credited and that the original publication in this journal is cited, in accordance with accepted academic practice. No use, distribution or reproduction is permitted which does not comply with these terms.
*Correspondence: Reyhaneh Roohi, cmV5aGFuZS5yb29oaUBnbWFpbC5jb20=